Nine-month report 2018 ENGabout.hm.com/content/dam/hmgroup/groupsite/documents/master... ·...
19
Q3 H & M Hennes & Mauritz AB Nine-month report Nine months (1 December 2017 – 31 August 2018) • The H&M group’s sales including VAT increased by 3 percent to SEK 178,817 m (173,290) during the first nine months of the financial year. Sales excluding VAT amounted to SEK 153,986 m (149,597), an increase of 3 percent. In local currencies, sales including VAT increased by 1 percent. • Profit after financial items amounted to SEK 11,287 m (15,936). The group’s profit after tax amounted to SEK 9,109 m (12,191), corresponding to SEK 5.50 (7.37) per share. Third quarter (1 June 2018 — 31 August 2018) • The group’s sales including VAT increased by 9 percent to SEK 64,800 m (59,383) during the third quarter. Sales excluding VAT amounted to SEK 55,821 m (51,229), an increase of 9 percent. In local currencies, sales including VAT increased by 4 percent. The ongoing transition has contributed to gradually improved sales and increased market share in most markets. • The group’s online sales increased by 32 percent. • Gross profit amounted to SEK 28,091 m (26,350). This corresponds to a gross margin of 50.3 percent (51.4) • Profit after financial items amounted to SEK 4,012 m (5,016). The group’s profit after tax amounted to SEK 3,099 m (3,837), corresponding to SEK 1.87 (2.32) per share. • The problems that arose during the implementation of new logistics systems in the US, France, Italy and Belgium during the spring led to extraordinary costs of around SEK 400 m in the third quarter. Sales in these markets decreased by 8 percent overall, while overall sales for the other 66 markets increased by 8 percent in local currencies during the quarter. • Successful launch of the new brand, Afound, both in stores and online in Sweden. • H&M very well received in Ukraine. • Online and physical stores are being increasingly integrated, while in parallel the rollout of online to all existing store markets as well as to other markets continues at full speed. • COS to open online in China and on Tmall in autumn 2018. • Uruguay will become a new H&M store market in autumn 2018. SEK m Q3 2018 Q3 2017 Nine months 2018 Nine months 2017 Net sales 55,821 51,229 153,986 149,597 Gross profit 28,091 26,350 80,295 80,161 gross margin, % 50.3 51.4 52.1 53.6 Operating profit 3,976 4,939 11,191 15,748 operating margin, % 7.1 9.6 7.3 10.5 Net financial items 36 77 96 188 Profit after financial items 4,012 5,016 11,287 15,936 Tax -913 -1,179 -2,178 -3,745 Profit for the period 3,099 3,837 9,109 12,191 Earnings per share, SEK 1.87 2.32 5.50 7.37 Definitions on key figures, see annual report 2017. Nine months 2018 SEK 179 billion Sales incl VAT Morris & Co x H&M
Transcript of Nine-month report 2018 ENGabout.hm.com/content/dam/hmgroup/groupsite/documents/master... ·...

Q3
H & M Hennes & Mauritz AB Nine-month report
Nine months (1 December 2017 – 31 August 2018) • The H&M group’s sales including VAT increased by 3 percent to SEK 178,817 m (173,290) during the
first nine months of the financial year. Sales excluding VAT amounted to SEK 153,986 m (149,597), an increase of 3 percent. In local currencies, sales including VAT increased by 1 percent.
• Profit after financial items amounted to SEK 11,287 m (15,936). The group’s profit after tax amounted to SEK 9,109 m (12,191), corresponding to SEK 5.50 (7.37) per share.
Third quarter (1 June 2018 — 31 August 2018) • The group’s sales including VAT increased by 9 percent to SEK 64,800 m (59,383) during the third
quarter. Sales excluding VAT amounted to SEK 55,821 m (51,229), an increase of 9 percent. In local currencies, sales including VAT increased by 4 percent. The ongoing transition has contributed to gradually improved sales and increased market share in most markets.
• The group’s online sales increased by 32 percent.
• Gross profit amounted to SEK 28,091 m (26,350). This corresponds to a gross margin of 50.3 percent (51.4)
• Profit after financial items amounted to SEK 4,012 m (5,016). The group’s profit after tax amounted to SEK 3,099 m (3,837), corresponding to SEK 1.87 (2.32) per share.
• The problems that arose during the implementation of new logistics systems in the US, France, Italy and Belgium during the spring led to extraordinary costs of around SEK 400 m in the third quarter. Sales in these markets decreased by 8 percent overall, while overall sales for the other 66 markets increased by 8 percent in local currencies during the quarter.
• Successful launch of the new brand, Afound, both in stores and online in Sweden.
• H&M very well received in Ukraine.
• Online and physical stores are being increasingly integrated, while in parallel the rollout of online to all existing store markets as well as to other markets continues at full speed.
• COS to open online in China and on Tmall in autumn 2018.
• Uruguay will become a new H&M store market in autumn 2018.
SEK mQ3
2018Q3
2017Nine months
2018Nine months
2017Net sales 55,821 51,229 153,986 149,597Gross profit 28,091 26,350 80,295 80,161gross margin, % 50.3 51.4 52.1 53.6Operating profit 3,976 4,939 11,191 15,748operating margin, % 7.1 9.6 7.3 10.5Net financial items 36 77 96 188Profit after financial items 4,012 5,016 11,287 15,936Tax -913 -1,179 -2,178 -3,745Profit for the period 3,099 3,837 9,109 12,191
Earnings per share, SEK 1.87 2.32 5.50 7.37
Definitions on key figures, see annual report 2017.
Nine months 2018
SEK 179 billion Sales incl VAT
Morris & Co x H&M
Nine-month report 2018 (1 Dec 2017 – 31 Aug 2018)
2
Comments by Karl-Johan Persson, CEO “The rapid changes in the fashion industry are continuing and the H&M group is in an exciting transitional period. Our transformation work has contributed to a gradual improvement in sales development with increased market share in most markets during the third quarter, particularly in Germany, Sweden, Eastern Europe, Russia and China. In the US, France, Italy and Belgium, however, store sales were negatively impacted by the problems that arose when we introduced new logistics systems in these markets. Intensive work to correct the problems – which have now largely been resolved – resulted in extraordinary costs of around SEK 400 million in the quarter. The new logistics systems are an essential part of our work to make our supply chain faster, more flexible and more efficient, and to continue the integration of stores and online. The group’s online sales increased by more than 30 percent in the third quarter. Today H&M online is in 47 markets and we are continuing at full speed to roll out online globally to all our existing store markets as well as to other markets. The most important aspect of our improvement work is to develop the assortment in line with customers’ increased expectations and to offer the best combination of fashion, quality and price in a sustainable way. On top of that, we are also working to enhance the customer experience. We are getting a positive response from customers to the changes that we are making both online and in stores – including in those H&M stores, where we are trying out various adjustments to our assortment, product display and shop fittings. We are therefore now scaling up this to more stores and markets. Our improvement work is benefiting from our investments in advanced data analytics and AI in areas such as quantification, allocation, pricing and trend forecasting. We are continuing to optimise the store portfolio in order to accommodate customers’ changed shopping patterns in the ongoing shift online. In the year to date this has meant a lower net addition of new stores within the group. We are also seeing that the shift provides opportunities to achieve even better lease terms for both new and existing stores. As always, we have a long-term perspective. Our improvement work is continuing and although many challenges remain, there are more and more indications that we are on the right track. We are therefore positive towards the future and the opportunities that exist for the H&M group.”
H&M
Nine-month report 2018 (1 Dec 2017 – 31 Aug 2018)
3
Sales
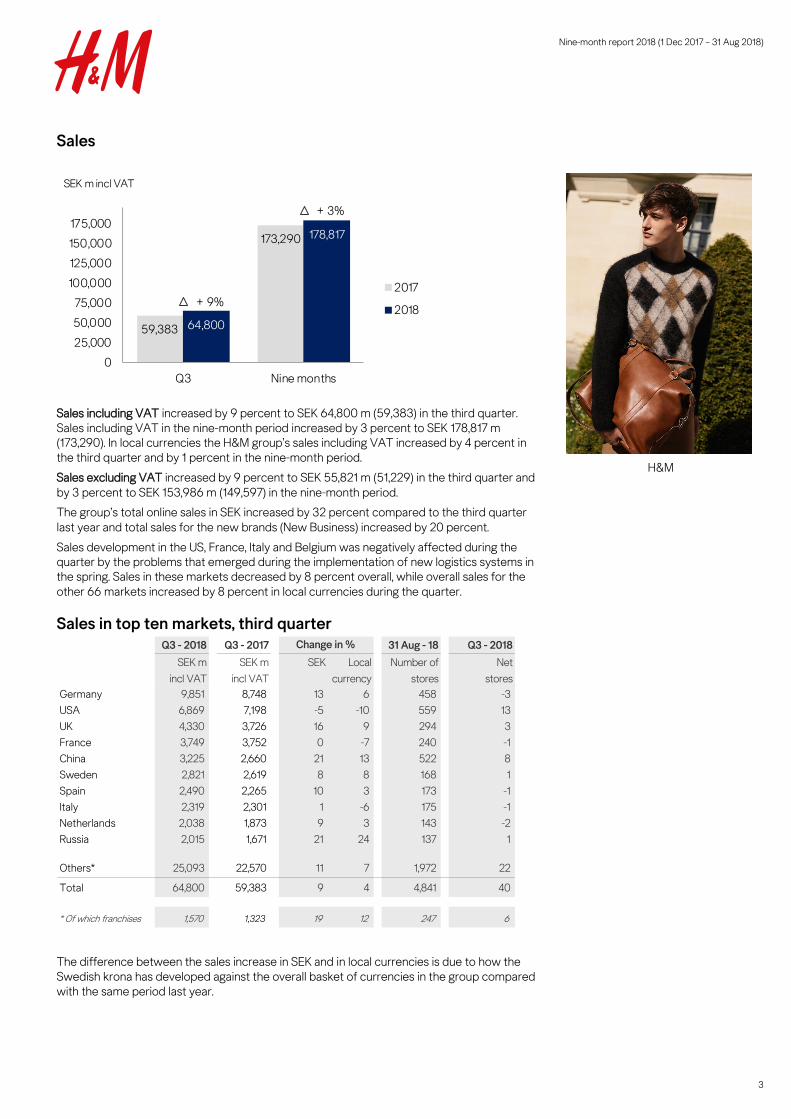
Sales including VAT increased by 9 percent to SEK 64,800 m (59,383) in the third quarter. Sales including VAT in the nine-month period increased by 3 percent to SEK 178,817 m (173,290). In local currencies the H&M group’s sales including VAT increased by 4 percent in the third quarter and by 1 percent in the nine-month period.
Sales excluding VAT increased by 9 percent to SEK 55,821 m (51,229) in the third quarter and by 3 percent to SEK 153,986 m (149,597) in the nine-month period. The group’s total online sales in SEK increased by 32 percent compared to the third quarter last year and total sales for the new brands (New Business) increased by 20 percent.
Sales development in the US, France, Italy and Belgium was negatively affected during the quarter by the problems that emerged during the implementation of new logistics systems in the spring. Sales in these markets decreased by 8 percent overall, while overall sales for the other 66 markets increased by 8 percent in local currencies during the quarter.
Sales in top ten markets, third quarter
The difference between the sales increase in SEK and in local currencies is due to how the Swedish krona has developed against the overall basket of currencies in the group compared with the same period last year.
59,383
173,290
64,800
178,817
+ 9%
+ 3%
0
25,000
50,000
75,000
100,000
125,000
150,000
175,000
Q3 Nine months
SEK m incl VAT
2017
2018
Q3 - 2018 Q3 - 2017 31 Aug - 18 Q3 - 2018SEK m
incl VAT SEK m
incl VAT SEK Local
currency Number of
stores Net
stores Germany 9,851 8,748 13 6 458 -3USA 6,869 7,198 -5 -10 559 13UK 4,330 3,726 16 9 294 3France 3,749 3,752 0 -7 240 -1China 3,225 2,660 21 13 522 8Sweden 2,821 2,619 8 8 168 1Spain 2,490 2,265 10 3 173 -1Italy 2,319 2,301 1 -6 175 -1Netherlands 2,038 1,873 9 3 143 -2Russia 2,015 1,671 21 24 137 1
Others* 25,093 22,570 11 7 1,972 22
Total 64,800 59,383 9 4 4,841 40
* Of which franchises 1,570 1,323 19 12 247 6
Change in %
H&M
Nine-month report 2018 (1 Dec 2017 – 31 Aug 2018)
4
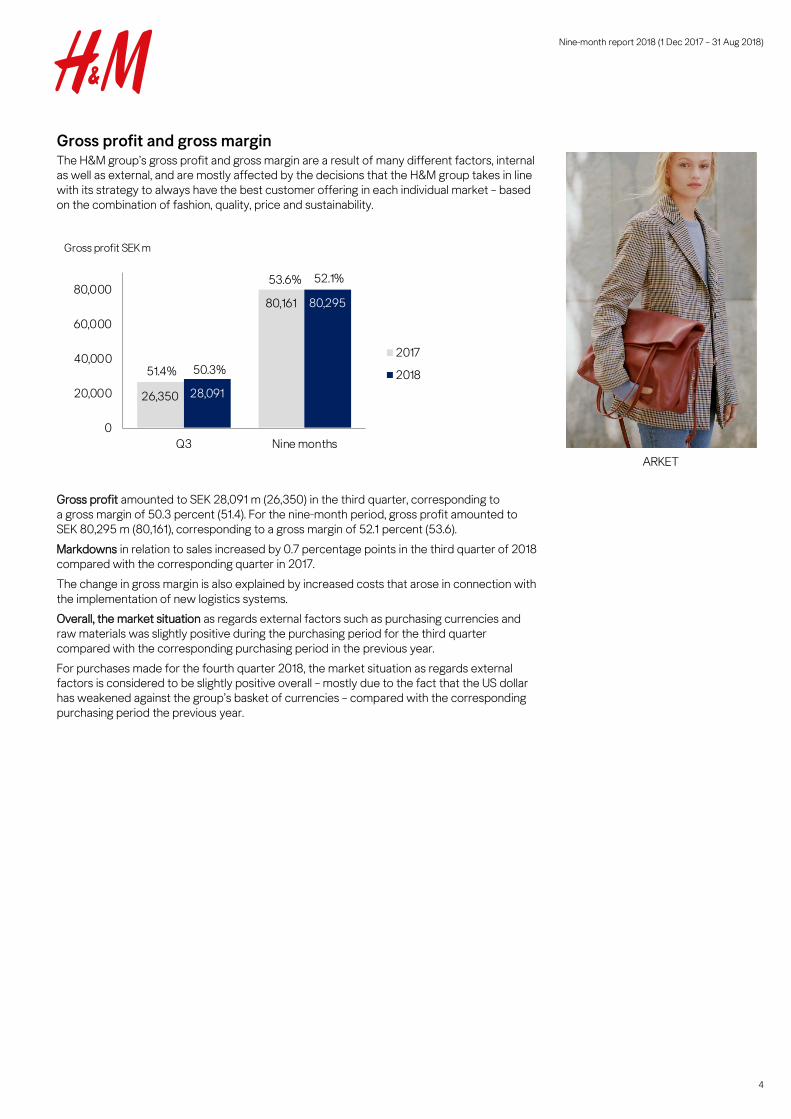
Gross profit and gross margin The H&M group’s gross profit and gross margin are a result of many different factors, internal as well as external, and are mostly affected by the decisions that the H&M group takes in line with its strategy to always have the best customer offering in each individual market – based on the combination of fashion, quality, price and sustainability.
Gross profit amounted to SEK 28,091 m (26,350) in the third quarter, corresponding to a gross margin of 50.3 percent (51.4). For the nine-month period, gross profit amounted to SEK 80,295 m (80,161), corresponding to a gross margin of 52.1 percent (53.6).
Markdowns in relation to sales increased by 0.7 percentage points in the third quarter of 2018 compared with the corresponding quarter in 2017.
The change in gross margin is also explained by increased costs that arose in connection with the implementation of new logistics systems. Overall, the market situation as regards external factors such as purchasing currencies and raw materials was slightly positive during the purchasing period for the third quarter compared with the corresponding purchasing period in the previous year.
For purchases made for the fourth quarter 2018, the market situation as regards external factors is considered to be slightly positive overall – mostly due to the fact that the US dollar has weakened against the group’s basket of currencies – compared with the corresponding purchasing period the previous year.
26,350
80,161
28,091
80,295
0
20,000
40,000
60,000
80,000
Q3 Nine months
Gross profit SEK m
2017
201851.4% 50.3%
53.6% 52.1%
ARKET

Nine-month report 2018 (1 Dec 2017 – 31 Aug 2018)
5
Selling and administrative expenses
In the third quarter of 2018, selling and administrative expenses increased by 13 percent in SEK and by 8 percent in local currencies compared with the corresponding period the previous year. The increase is mainly explained by store and online expansion, along with extraordinary costs in connection with the implementation of new logistics systems.
For the nine-month period, selling and administrative expenses increased by 7 percent in SEK and by 6 percent in local currencies compared with the corresponding period last year.
Profit after financial items
Profit after financial items amounted to SEK 4,012 m (5,016) in the third quarter. Profit after financial items in the nine-month period amounted to SEK 11,287 m (15,936).
Profit in the third quarter was affected, among other things, by the problems that emerged in connection with the implementation of new logistics systems, which led to lost revenue and extraordinary costs. These extraordinary costs are estimated to amount to approximately SEK 400 m in the third quarter.
21,411
64,413
24,115
69,104
+ 13%
+ 7%
0
10,000
20,000
30,000
40,000
50,000
60,000
70,000
Q3 Nine months
SEK m
2017
2018
5,016
15,936
4,012
11,287
- 20%
- 29%
0
5,000
10,000
15,000
20,000
Q3 Nine months
SEK m
2017
2018
H&M Home
Nine-month report 2018 (1 Dec 2017 – 31 Aug 2018)
6
Stock-in-trade
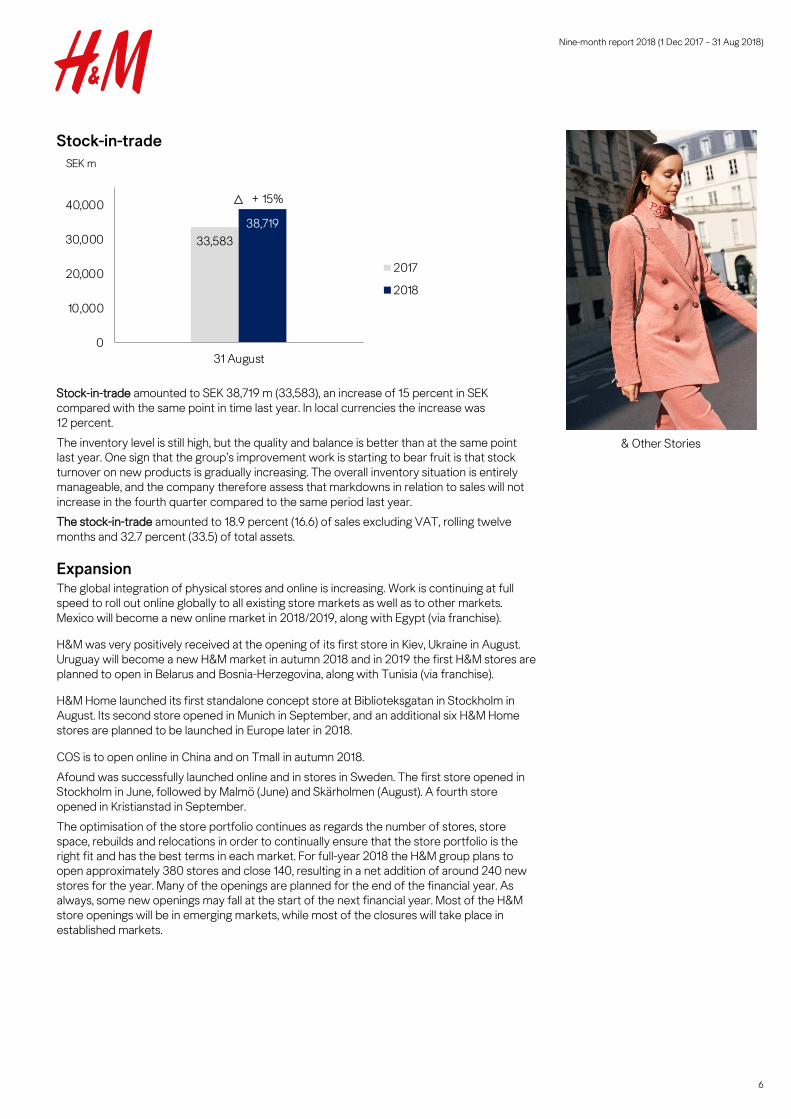
Stock-in-trade amounted to SEK 38,719 m (33,583), an increase of 15 percent in SEK compared with the same point in time last year. In local currencies the increase was 12 percent.
The inventory level is still high, but the quality and balance is better than at the same point last year. One sign that the group’s improvement work is starting to bear fruit is that stock turnover on new products is gradually increasing. The overall inventory situation is entirely manageable, and the company therefore assess that markdowns in relation to sales will not increase in the fourth quarter compared to the same period last year. The stock-in-trade amounted to 18.9 percent (16.6) of sales excluding VAT, rolling twelve months and 32.7 percent (33.5) of total assets.
Expansion The global integration of physical stores and online is increasing. Work is continuing at full speed to roll out online globally to all existing store markets as well as to other markets. Mexico will become a new online market in 2018/2019, along with Egypt (via franchise).
H&M was very positively received at the opening of its first store in Kiev, Ukraine in August. Uruguay will become a new H&M market in autumn 2018 and in 2019 the first H&M stores are planned to open in Belarus and Bosnia-Herzegovina, along with Tunisia (via franchise).
H&M Home launched its first standalone concept store at Biblioteksgatan in Stockholm in August. Its second store opened in Munich in September, and an additional six H&M Home stores are planned to be launched in Europe later in 2018.
COS is to open online in China and on Tmall in autumn 2018.
Afound was successfully launched online and in stores in Sweden. The first store opened in Stockholm in June, followed by Malmö (June) and Skärholmen (August). A fourth store opened in Kristianstad in September.
The optimisation of the store portfolio continues as regards the number of stores, store space, rebuilds and relocations in order to continually ensure that the store portfolio is the right fit and has the best terms in each market. For full-year 2018 the H&M group plans to open approximately 380 stores and close 140, resulting in a net addition of around 240 new stores for the year. Many of the openings are planned for the end of the financial year. As always, some new openings may fall at the start of the next financial year. Most of the H&M store openings will be in emerging markets, while most of the closures will take place in established markets.
33,58338,719
+ 15%
0
10,000
20,000
30,000
40,000
31 August
SEK m
2017
2018
& Other Stories

Nine-month report 2018 (1 Dec 2017 – 31 Aug 2018)
7
Store count by brand In the nine-month period, excluding franchise, the group opened 173 (247) stores and closed 99 (66) stores, i.e. a net increase of 74 (181) new stores. Via franchise partners 28 (22) stores were opened and 0 (1) stores were closed. The group had 4,841 (4,553) stores as of 31 August 2018, of which 247 (209) were operated by franchise partners.
Expansion2018
Brand Store Online New markets
H&M 70 47 Store: Uruguay, Ukraine*Online: India*, Kuwait (franchise)*, United Arab Emirates (franchise)*, Saudi Arabia (franchise)*
COS 40 20 Store: Thailand (franchise)*, Lebanon (franchise)*, Saudi Arabia (franchise)*, RussiaOnline: China
Monki 16 19 Store: Kuwait (franchise)*, Saudi Arabia (franchise)*
Weekday 9 18 Store: Finland**
& Other Stories 17 15 Store: Austria**, Kuwait (franchise)*
Cheap Monday 1 18
ARKET 6 18 Store: Netherlands*, Sweden*
Afound 1 1 Store: Sweden*Online: Sweden*
H&M HOME 48 40 Store: Ukraine*, Morocco (franchise)*, Chile, IcelandOnline: Kuwait (franchise)*, United Arab Emirates (franchise)*, Saudi Arabia (franchise)*
** Opened in September- 2018
No. of markets31 Aug - 2018
* Opened until 31 Aug - 2018
Brand Q3 Nine months 31 Aug - 2018 31 Aug - 2017
H&M 25 65 4,353 4,133
COS 8 24 255 215
Monki -1 0 119 115
Weekday 0 1 34 30
& Other Stories 1 3 63 56
Cheap Monday 0 -2 1 3
ARKET 3 7 12 1
Afound 3 3 3 0
H&M HOME* 1 1 1 0
Total 40 102 4,841 4,553
New Stores 2018 (net) Total No of stores
* Concept stores, H&M HOME is included with 345 shop-in-shop in H&M stores
H&M Conscious Exclusive
Nine-month report 2018 (1 Dec 2017 – 31 Aug 2018)
8
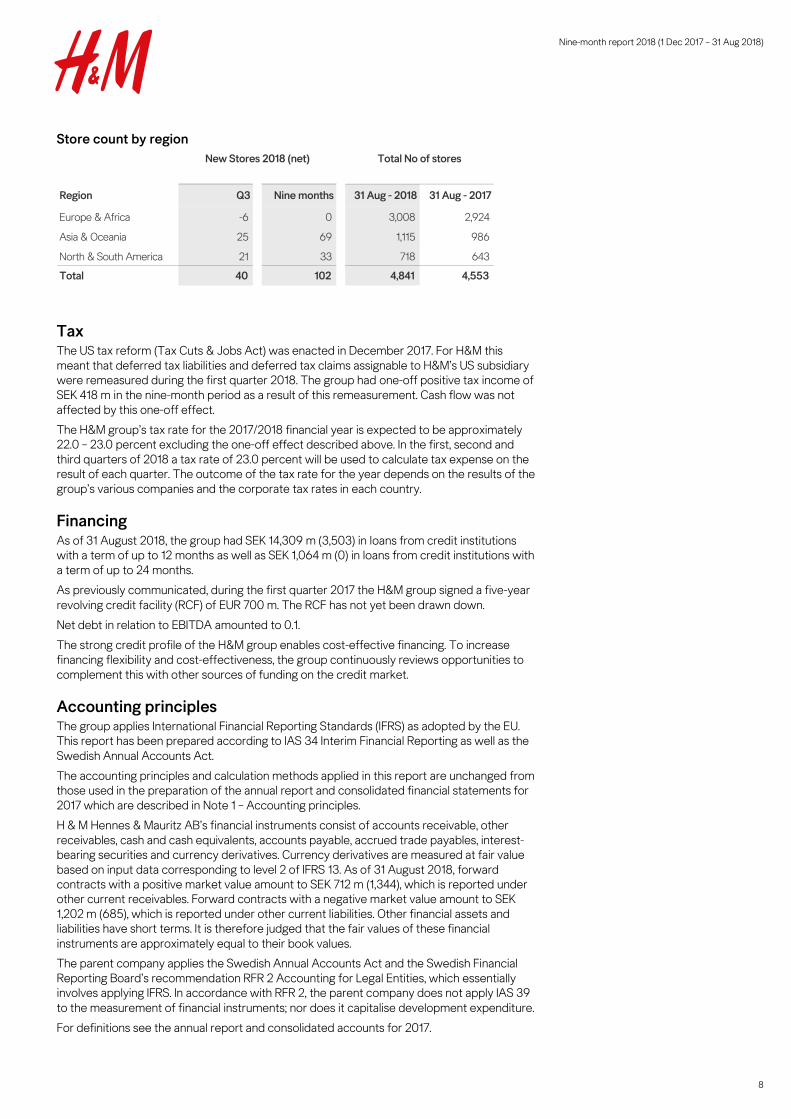
Store count by region
Tax The US tax reform (Tax Cuts & Jobs Act) was enacted in December 2017. For H&M this meant that deferred tax liabilities and deferred tax claims assignable to H&M’s US subsidiary were remeasured during the first quarter 2018. The group had one-off positive tax income of SEK 418 m in the nine-month period as a result of this remeasurement. Cash flow was not affected by this one-off effect.
The H&M group’s tax rate for the 2017/2018 financial year is expected to be approximately 22.0 – 23.0 percent excluding the one-off effect described above. In the first, second and third quarters of 2018 a tax rate of 23.0 percent will be used to calculate tax expense on the result of each quarter. The outcome of the tax rate for the year depends on the results of the group’s various companies and the corporate tax rates in each country.
Financing As of 31 August 2018, the group had SEK 14,309 m (3,503) in loans from credit institutions with a term of up to 12 months as well as SEK 1,064 m (0) in loans from credit institutions with a term of up to 24 months.
As previously communicated, during the first quarter 2017 the H&M group signed a five-year revolving credit facility (RCF) of EUR 700 m. The RCF has not yet been drawn down.
Net debt in relation to EBITDA amounted to 0.1.
The strong credit profile of the H&M group enables cost-effective financing. To increase financing flexibility and cost-effectiveness, the group continuously reviews opportunities to complement this with other sources of funding on the credit market.
Accounting principles The group applies International Financial Reporting Standards (IFRS) as adopted by the EU. This report has been prepared according to IAS 34 Interim Financial Reporting as well as the Swedish Annual Accounts Act.
The accounting principles and calculation methods applied in this report are unchanged from those used in the preparation of the annual report and consolidated financial statements for 2017 which are described in Note 1 – Accounting principles.
H & M Hennes & Mauritz AB’s financial instruments consist of accounts receivable, other receivables, cash and cash equivalents, accounts payable, accrued trade payables, interest-bearing securities and currency derivatives. Currency derivatives are measured at fair value based on input data corresponding to level 2 of IFRS 13. As of 31 August 2018, forward contracts with a positive market value amount to SEK 712 m (1,344), which is reported under other current receivables. Forward contracts with a negative market value amount to SEK 1,202 m (685), which is reported under other current liabilities. Other financial assets and liabilities have short terms. It is therefore judged that the fair values of these financial instruments are approximately equal to their book values. The parent company applies the Swedish Annual Accounts Act and the Swedish Financial Reporting Board’s recommendation RFR 2 Accounting for Legal Entities, which essentially involves applying IFRS. In accordance with RFR 2, the parent company does not apply IAS 39 to the measurement of financial instruments; nor does it capitalise development expenditure.
For definitions see the annual report and consolidated accounts for 2017.
Region Q3 Nine months 31 Aug - 2018 31 Aug - 2017
Europe & Africa -6 0 3,008 2,924
Asia & Oceania 25 69 1,115 986
North & South America 21 33 718 643
Total 40 102 4,841 4,553
New Stores 2018 (net) Total No of stores
Nine-month report 2018 (1 Dec 2017 – 31 Aug 2018)
9
Risks and uncertainties A number of factors may affect the H&M group’s result and business. Many of these can be dealt with through internal routines, while certain others are affected more by external influences. There are risks and uncertainties for the H&M group related to the major shift within the industry, fashion, weather conditions, macroeconomic and geopolitical changes, sustainability issues, foreign currency, cyber-attacks, tax and different regulations but also in connection with expansion into new markets, the launch of new concepts and how the brand is managed. For a more detailed description of risks and uncertainties, refer to the administration report and to note 2 in the annual report and consolidated accounts for 2017.
Calendar
17 December 2018 Sales development in fourth quarter, 1 Sep 2018 – 30 November 2018
31 January 2019 Full-year report, 1 Dec 2017 – 30 Nov 2018
15 March 2019 Sales development in first quarter, 1 Dec 2018 – 28 Feb 2019
29 March 2019 Three-month report, 1 Dec 2018 – 28 Feb 2019
7 May 2019 Annual general meeting
27 June 2019 Six-month report, 1 Dec 2018 – 31 May 2019
Stockholm, 26 September 2018 Board of Directors
Telephone conference in conjunction with the nine-month report The nine-month report, 1 December 2017 – 31 August 2018, will be published at 8:00 CET on 27 September 2018. A telephone conference for the financial market and media will be held in English the same day at 9:00 CET when CEO Karl-Johan Persson, CFO Jyrki Tervonen and Head of IR Nils Vinge will participate. Participants for the telephone conference are kindly asked to register at: http://emea.directeventreg.com/registration/9314879 For interview requests with CEO Karl-Johan Persson and Head of IR Nils Vinge in conjunction with the nine-month report please contact: Kristina Stenvinkel, Communications Director Phone +46 8 796 39 08 E-mail: [email protected]
Contact Nils Vinge, Head of IR +46 8 796 52 50 Karl-Johan Persson, CEO +46 8 796 55 00 (switchboard) Jyrki Tervonen, CFO +46 8 796 55 00 (switchboard)
H & M Hennes & Mauritz AB (publ) SE-106 38 Stockholm Phone: +46-8-796 55 00, fax: +46-8-24 80 78, e-mail: [email protected] Registered office: Stockholm, Reg. No. 556042-7220
Nine-month report 2018 (1 Dec 2017 – 31 Aug 2018)
10
Review report H & M Hennes & Mauritz AB (publ), corporate identity number 556042-7220
Introduction We have reviewed the interim report for H & M Hennes & Mauritz AB (publ) as of 31 August 2018 and for the nine-month period which ended on this date. It is the responsibility of the Board of Directors and the Chief Executive Officer to prepare and present this interim report in accordance with IAS 34 and the Swedish Annual Accounts Act. Our responsibility is to express an opinion on this interim report based on our review.
Focus and scope of review We conducted our review in accordance with the International Standard on Review Engagements (ISRE 2410), Review of Interim Financial Information Performed by the Independent Auditor of the Entity. A review consists of making inquiries, primarily of persons responsible for financial and accounting matters, and applying analytical and other review procedures. A review has a different focus and is substantially less in scope compared with the focus and scope of an audit conducted in accordance with the International Standards on Auditing and the generally accepted auditing practices.
The procedures performed in a review do not enable us to obtain a level of assurance that would make us aware of all significant matters that might be identified in an audit. Therefore, the opinion expressed based on a review does not provide the same level of assurance as an opinion expressed on the basis of an audit.
Conclusion On the basis of our review, nothing has come to our attention that causes us to believe that the interim report, in all material aspects, was not prepared in accordance with IAS 34 and the Swedish Annual Accounts Act in the case of the group and in accordance with the Annual Accounts Act in the case of the parent company.
Stockholm, 26 September 2018
Ernst & Young AB
Åsa Lundvall Authorised Public Accountant
Information in this interim report is that which H & M Hennes & Mauritz AB (publ) is required to disclose under the EU Market Abuse Regulation (596/2014/EU). The information was submitted for publication by the abovementioned persons at 08:00 (CET) on 27 September 2018. This interim report and other information about H&M, is available at about.hm.com.
H & M Hennes & Mauritz AB (publ) was founded in Sweden in 1947 and is quoted on Nasdaq Stockholm. H&M’s business idea is to offer fashion and quality at the best price in a sustainable way. In addition to H&M, the group includes the brands COS, Monki, Weekday, Cheap Monday, & Other Stories, H&M HOME and ARKET as well as Afound. The H&M group has 47 online markets and more than 4,800 stores in 70 markets including franchise markets. In 2017, sales including VAT were SEK 232 billion. The number of employees amounts to more than 171,000. For further information, visit about.hm.com.
Nine-month report 2018 (1 Dec 2017 – 31 Aug 2018)
11
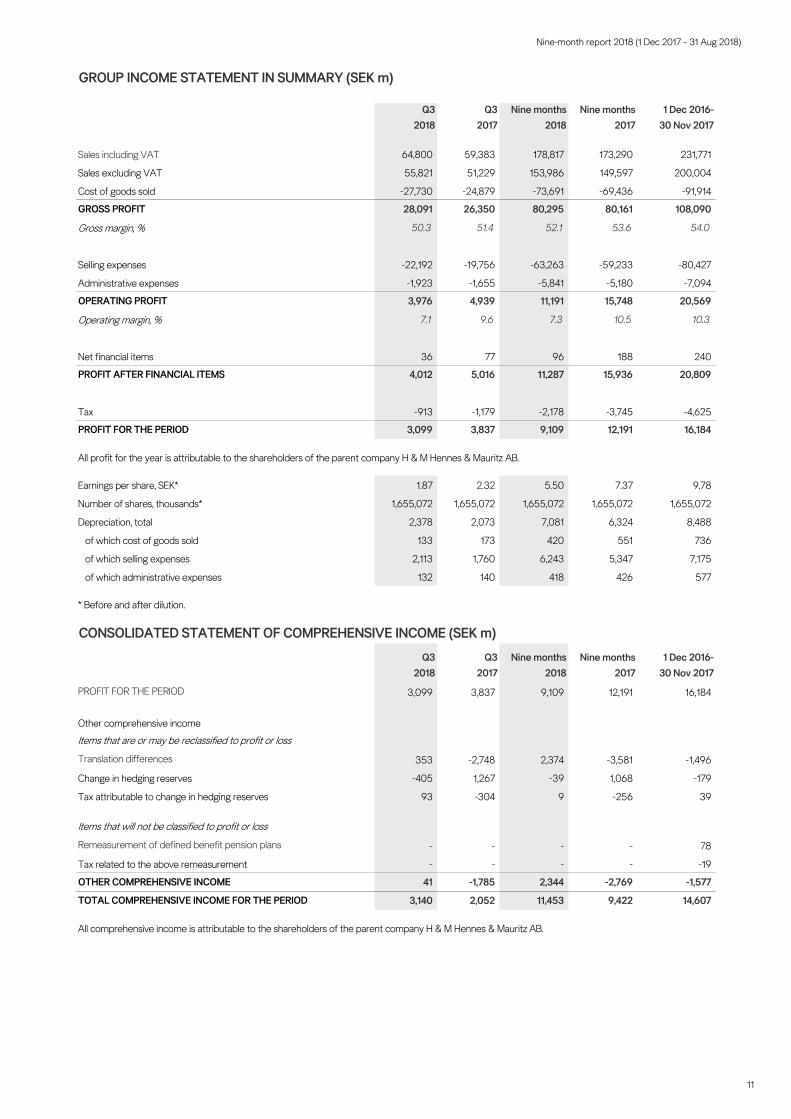
Q32018
Q32017
Nine months2018
Nine months2017
1 Dec 2016-30 Nov 2017
Sales including VAT 64,800 59,383 178,817 173,290 231,771
Sales excluding VAT 55,821 51,229 153,986 149,597 200,004
Cost of goods sold -27,730 -24,879 -73,691 -69,436 -91,914
GROSS PROFIT 28,091 26,350 80,295 80,161 108,090
Gross margin, % 50.3 51.4 52.1 53.6 54.0
Selling expenses -22,192 -19,756 -63,263 -59,233 -80,427
Administrative expenses -1,923 -1,655 -5,841 -5,180 -7,094
OPERATING PROFIT 3,976 4,939 11,191 15,748 20,569
Operating margin, % 7.1 9.6 7.3 10.5 10.3
Net financial items 36 77 96 188 240
PROFIT AFTER FINANCIAL ITEMS 4,012 5,016 11,287 15,936 20,809
Tax -913 -1,179 -2,178 -3,745 -4,625
PROFIT FOR THE PERIOD 3,099 3,837 9,109 12,191 16,184
All profit for the year is attributable to the shareholders of the parent company H & M Hennes & Mauritz AB.
Earnings per share, SEK* 1.87 2.32 5.50 7.37 9.78
Number of shares, thousands* 1,655,072 1,655,072 1,655,072 1,655,072 1,655,072
Depreciation, total 2,378 2,073 7,081 6,324 8,488
of which cost of goods sold 133 173 420 551 736
of which selling expenses 2,113 1,760 6,243 5,347 7,175
of which administrative expenses 132 140 418 426 577
* Before and after dilution.
CONSOLIDATED STATEMENT OF COMPREHENSIVE INCOME (SEK m)Q3
2018 Q3
2017 Nine months
2018 Nine months
2017 1 Dec 2016-
30 Nov 2017
PROFIT FOR THE PERIOD 3,099 3,837 9,109 12,191 16,184
Other comprehensive income
Items that are or may be reclassified to profit or loss
Translation differences 353 -2,748 2,374 -3,581 -1,496
Change in hedging reserves -405 1,267 -39 1,068 -179
Tax attributable to change in hedging reserves 93 -304 9 -256 39
Items that will not be classified to profit or loss
Remeasurement of defined benefit pension plans - - - - 78
Tax related to the above remeasurement - - - - -19
OTHER COMPREHENSIVE INCOME 41 -1,785 2,344 -2,769 -1,577
TOTAL COMPREHENSIVE INCOME FOR THE PERIOD 3,140 2,052 11,453 9,422 14,607
All comprehensive income is attributable to the shareholders of the parent company H & M Hennes & Mauritz AB.
GROUP INCOME STATEMENT IN SUMMARY (SEK m)
Nine-month report 2018 (1 Dec 2017 – 31 Aug 2018)
12
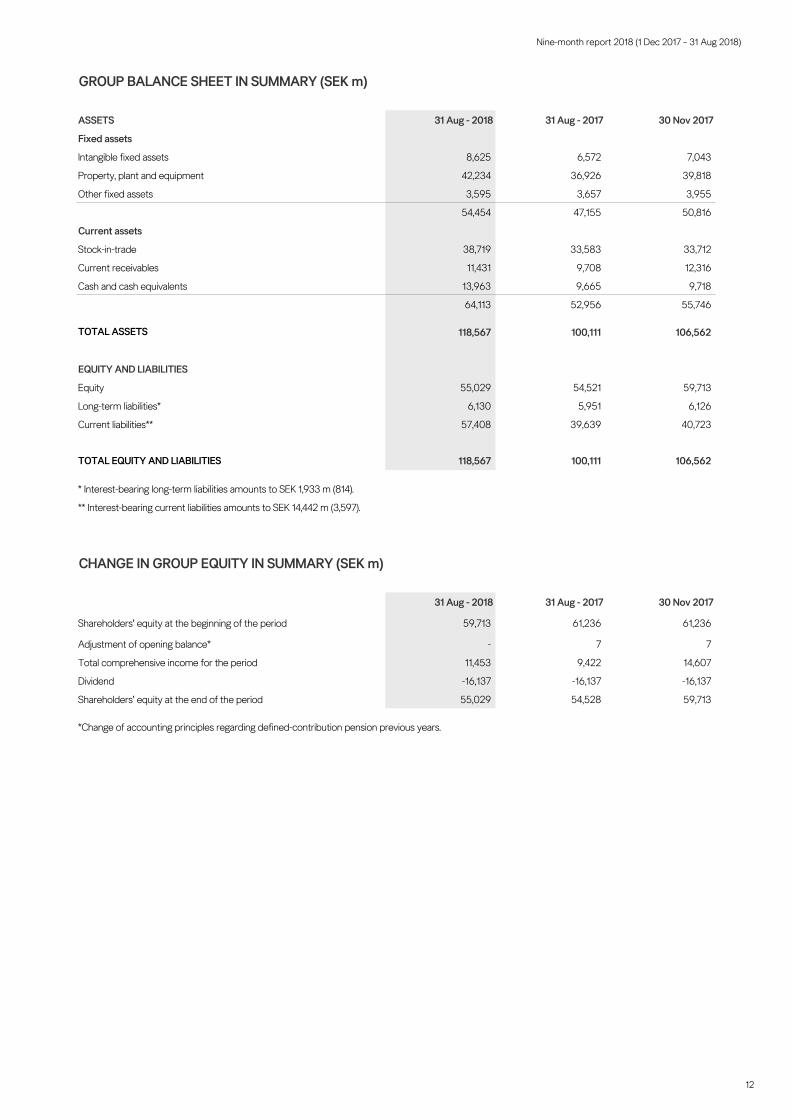
GROUP BALANCE SHEET IN SUMMARY (SEK m)
ASSETS 31 Aug - 2018 31 Aug - 2017 30 Nov 2017
Fixed assets
Intangible fixed assets 8,625 6,572 7,043
Property, plant and equipment 42,234 36,926 39,818
Other fixed assets 3,595 3,657 3,955
54,454 47,155 50,816
Current assets
Stock-in-trade 38,719 33,583 33,712
Current receivables 11,431 9,708 12,316
Cash and cash equivalents 13,963 9,665 9,718
64,113 52,956 55,746
TOTAL ASSETS 118,567 100,111 106,562
EQUITY AND LIABILITIES
Equity 55,029 54,521 59,713
Long-term liabilities* 6,130 5,951 6,126
Current liabilities** 57,408 39,639 40,723
TOTAL EQUITY AND LIABILITIES 118,567 100,111 106,562
* Interest-bearing long-term liabilities amounts to SEK 1,933 m (814).
CHANGE IN GROUP EQUITY IN SUMMARY (SEK m)
31 Aug - 2018 31 Aug - 2017 30 Nov 2017
Shareholders' equity at the beginning of the period 59,713 61,236 61,236
Adjustment of opening balance* - 7 7
Total comprehensive income for the period 11,453 9,422 14,607
Dividend -16,137 -16,137 -16,137
Shareholders' equity at the end of the period 55,029 54,528 59,713
*Change of accounting principles regarding defined-contribution pension previous years.
** Interest-bearing current liabilities amounts to SEK 14,442 m (3,597).
Nine-month report 2018 (1 Dec 2017 – 31 Aug 2018)
13
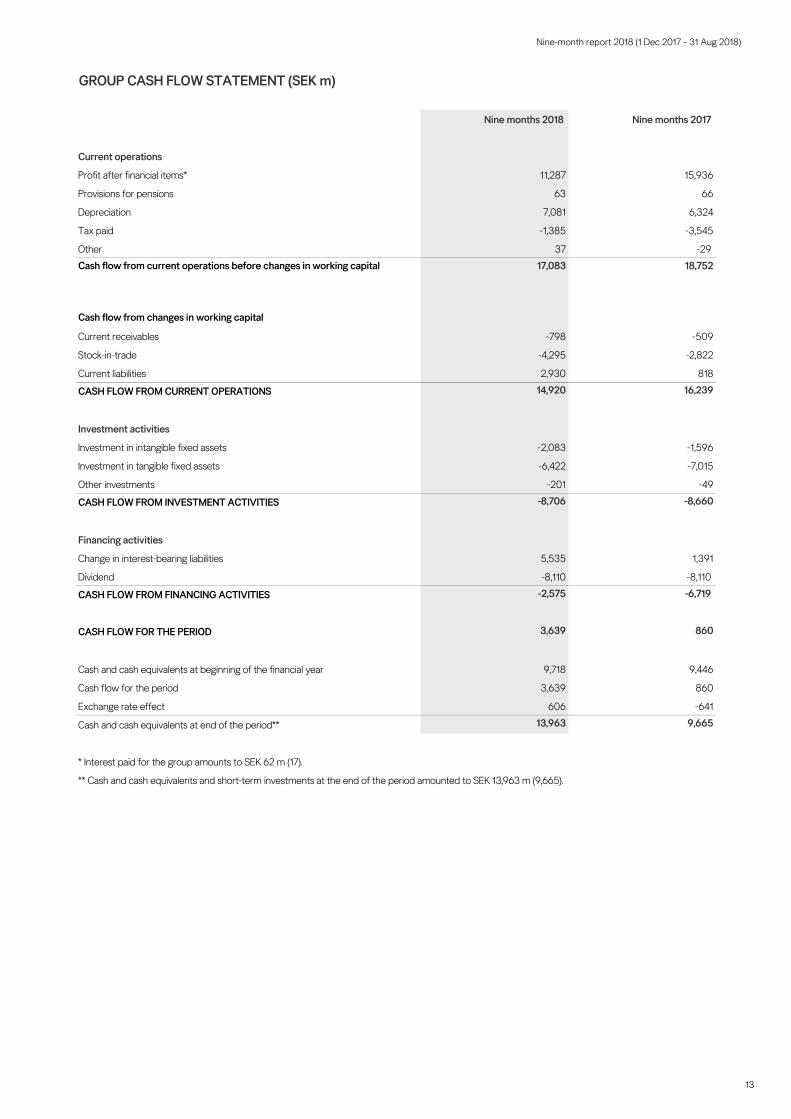
GROUP CASH FLOW STATEMENT (SEK m)
Nine months 2018 Nine months 2017
Current operations
Profit after financial items* 11,287 15,936
Provisions for pensions 63 66
Depreciation 7,081 6,324
Tax paid -1,385 -3,545
Other 37 -29Cash flow from current operations before changes in working capital 17,083 18,752
Cash flow from changes in working capital
Current receivables -798 -509
Stock-in-trade -4,295 -2,822
Current liabilities 2,930 818
CASH FLOW FROM CURRENT OPERATIONS 14,920 16,239
Investment activities
Investment in intangible fixed assets -2,083 -1,596
Investment in tangible fixed assets -6,422 -7,015
Other investments -201 -49
CASH FLOW FROM INVESTMENT ACTIVITIES -8,706 -8,660
Financing activities
Change in interest-bearing liabilities 5,535 1,391
Dividend -8,110 -8,110
CASH FLOW FROM FINANCING ACTIVITIES -2,575 -6,719
CASH FLOW FOR THE PERIOD 3,639 860
Cash and cash equivalents at beginning of the financial year 9,718 9,446
Cash flow for the period 3,639 860
Exchange rate effect 606 -641
Cash and cash equivalents at end of the period** 13,963 9,665
* Interest paid for the group amounts to SEK 62 m (17).
** Cash and cash equivalents and short-term investments at the end of the period amounted to SEK 13,963 m (9,665).

Nine-month report 2018 (1 Dec 2017 – 31 Aug 2018)
14
SALES INCLUDING VAT BY MARKET AND NUMBER OF STORES Q3, 1 June - 31 AugustMarket Q3 - 2018 Q3 - 2017 31 Aug - 18
SEK m SEK m SEK Local currency
No. of stores Newstores
Closedstores
Sweden 2,821 2,619 8 8 168 4 3
Norway 1,801 1,698 6 1 128
Denmark 1,632 1,414 15 8 106 2 5
UK 4,330 3,726 16 9 294 4 1
Switzerland 1,461 1,521 -4 -7 98 1
Germany 9,851 8,748 13 6 458 2 5
Netherlands 2,038 1,873 9 3 143 2 4
Belgium 1,231 1,181 4 -3 97 2
Austria 1,490 1,347 11 4 86
Luxembourg 120 120 0 -7 10
Finland 819 768 7 0 64
France 3,749 3,752 0 -7 240 1 2
USA 6,869 7,198 -5 -10 559 18 5
Spain 2,490 2,265 10 3 173 1
Poland 1,813 1,454 25 18 182
Czech Republic 503 424 19 9 52
Portugal 405 369 10 3 31 1
Italy 2,319 2,301 1 -6 175 1
Canada 1,462 1,336 9 6 93 2
Slovenia 166 145 14 7 12
Ireland 351 291 21 13 24
Hungary 530 460 15 13 46
Slovakia 229 190 21 12 24
Greece 552 525 5 -2 35
China 3,225 2,660 21 13 522 11 3
Hong Kong 363 386 -6 -12 28
Japan 1,218 1,133 8 2 87 3 1
Russia 2,015 1,671 21 24 137 1
South Korea 593 494 20 11 44
Turkey 851 923 -8 21 68
Romania 705 630 12 7 56
Croatia 229 225 2 -5 15
Singapore 216 239 -10 -16 11
Bulgaria 202 199 2 -4 20
Latvia 127 118 8 1 8
Malaysia 321 300 7 -5 46 2
Mexico 844 608 39 41 43 5
Chile 384 314 22 15 8
Lithuania 123 112 10 2 9
Serbia 123 109 13 3 13
Estonia 138 131 5 -1 11
Australia 652 637 2 1 37 2
Philippines 278 236 18 17 34 1
Taiwan 155 183 -15 -20 12
Peru 248 238 4 1 9 1
Macau 28 31 -10 -11 2
India 428 288 49 49 34 2
South Africa 230 206 12 9 19 1
Puerto Rico 28 27 4 -3 2
Cyprus 23 22 5 -1 1
New Zealand 70 34 106 104 4 1
Kazakhstan 66 77 -14 -8 3
Colombia 137 91 51 47 4
Iceland 60 13 362 343 2
Vietnam 69 4 1
Georgia 36 2
Ukraine 13 1 1
Franchise 1,570 1,323 19 12 247 6
Total 64,800 59,383 9 4 4,841 74 34
Change in % Q3 - 2018
Nine-month report 2018 (1 Dec 2017 – 31 Aug 2018)
15
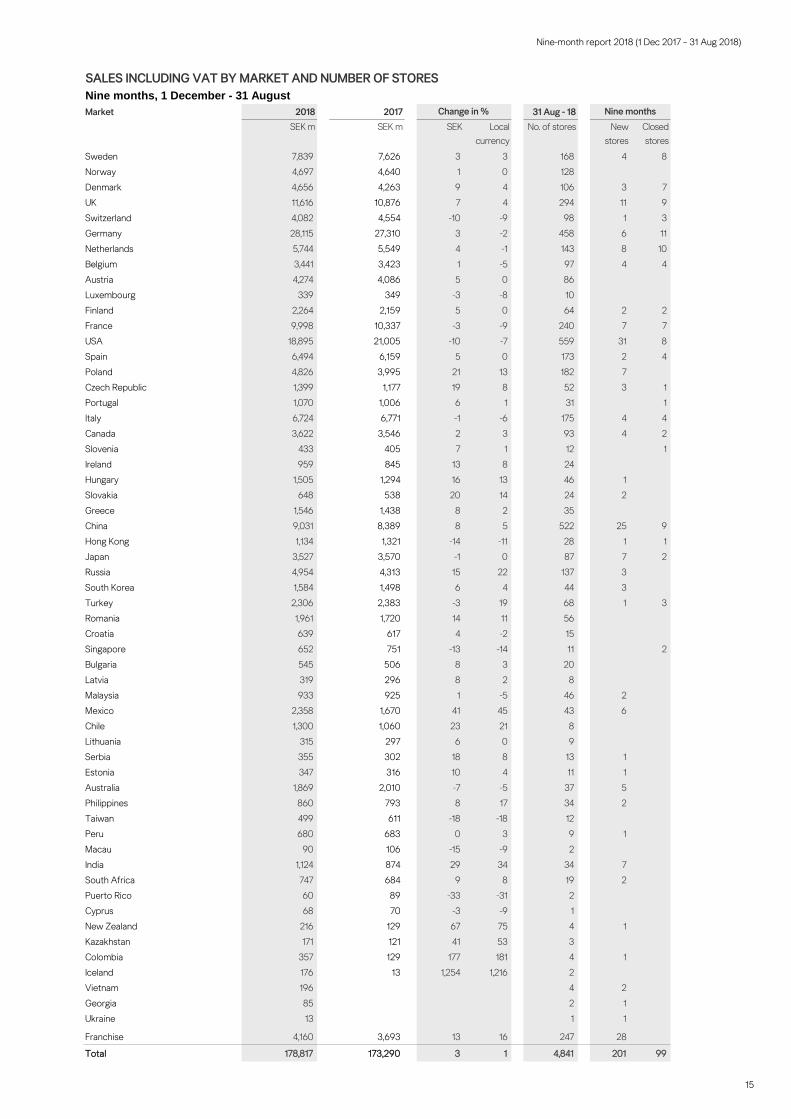
SALES INCLUDING VAT BY MARKET AND NUMBER OF STORES Nine months, 1 December - 31 AugustMarket 2018 2017 31 Aug - 18
SEK m SEK m SEK Local currency
No. of stores Newstores
Closedstores
Sweden 7,839 7,626 3 3 168 4 8
Norway 4,697 4,640 1 0 128
Denmark 4,656 4,263 9 4 106 3 7
UK 11,616 10,876 7 4 294 11 9
Switzerland 4,082 4,554 -10 -9 98 1 3
Germany 28,115 27,310 3 -2 458 6 11
Netherlands 5,744 5,549 4 -1 143 8 10
Belgium 3,441 3,423 1 -5 97 4 4
Austria 4,274 4,086 5 0 86
Luxembourg 339 349 -3 -8 10
Finland 2,264 2,159 5 0 64 2 2
France 9,998 10,337 -3 -9 240 7 7
USA 18,895 21,005 -10 -7 559 31 8
Spain 6,494 6,159 5 0 173 2 4
Poland 4,826 3,995 21 13 182 7
Czech Republic 1,399 1,177 19 8 52 3 1
Portugal 1,070 1,006 6 1 31 1
Italy 6,724 6,771 -1 -6 175 4 4
Canada 3,622 3,546 2 3 93 4 2
Slovenia 433 405 7 1 12 1
Ireland 959 845 13 8 24
Hungary 1,505 1,294 16 13 46 1
Slovakia 648 538 20 14 24 2
Greece 1,546 1,438 8 2 35
China 9,031 8,389 8 5 522 25 9
Hong Kong 1,134 1,321 -14 -11 28 1 1
Japan 3,527 3,570 -1 0 87 7 2
Russia 4,954 4,313 15 22 137 3
South Korea 1,584 1,498 6 4 44 3
Turkey 2,306 2,383 -3 19 68 1 3
Romania 1,961 1,720 14 11 56
Croatia 639 617 4 -2 15
Singapore 652 751 -13 -14 11 2
Bulgaria 545 506 8 3 20
Latvia 319 296 8 2 8
Malaysia 933 925 1 -5 46 2
Mexico 2,358 1,670 41 45 43 6
Chile 1,300 1,060 23 21 8
Lithuania 315 297 6 0 9
Serbia 355 302 18 8 13 1
Estonia 347 316 10 4 11 1
Australia 1,869 2,010 -7 -5 37 5
Philippines 860 793 8 17 34 2
Taiwan 499 611 -18 -18 12
Peru 680 683 0 3 9 1
Macau 90 106 -15 -9 2
India 1,124 874 29 34 34 7
South Africa 747 684 9 8 19 2
Puerto Rico 60 89 -33 -31 2
Cyprus 68 70 -3 -9 1
New Zealand 216 129 67 75 4 1
Kazakhstan 171 121 41 53 3
Colombia 357 129 177 181 4 1
Iceland 176 13 1,254 1,216 2
Vietnam 196 4 2
Georgia 85 2 1
Ukraine 13 1 1
Franchise 4,160 3,693 13 16 247 28
Total 178,817 173,290 3 1 4,841 201 99
Change in % Nine months

Nine-month report 2018 (1 Dec 2017 – 31 Aug 2018)
16
FIVE YEAR SUMMARYNine months, 1 December - 31 August
2014 2015 2016 2017 2018
Sales including VAT, SEK m 126,964 153,444 161,767 173,290 178,817
Sales excluding VAT, SEK m 108,775 132,167 139,547 149,597 153,986
Change sales excl. VAT from previous year in SEK, % 18 22 6 7 3
Change sales excl. VAT previous year in local currencies, % 15 12 8 4 1
Operating profit, SEK m 17,852 19,858 16,469 15,748 11,191
Operating margin, % 16.4 15.0 11.8 10.5 7.3
Depreciations for the period, SEK m 3,709 4,708 5,535 6,324 7,081
Profit after financial items, SEK m 18,096 20,094 16,630 15,936 11,287
Profit after tax, SEK m 13,754 15,372 12,722 12,191 9,109
Cash and cash equivalents and short-term investments, SEK m 13,451 10,963 8,680 9,665 13,963
Stock-in-trade, SEK m 17,940 25,205** 31,231** 33,583** 38,719**
Equity, SEK m 44,576 52,030 54,146 54,521 55,029
Number of shares, thousands* 1,655,072 1,655,072 1,655,072 1,655,072 1,655,072
Earnings per share, SEK* 8.31 9.29 7.69 7.37 5.50
Equity per share, SEK* 26.93 31.44 32.72 32.94 33.25
Cash flow from current operations
per share, SEK* 10.88 10.76 10.60 9.81 9.01
Share of risk-bearing capital, % 70.2 68.5 63.6 59.6 50.0
Equity/assets ratio, % 65.8 64.2 59.3 54.5 46.4
Total number of stores 3,341 3,675 4,135 4,553 4,841
Rolling twelve months
Earnings per share, SEK* 11.66 13.05 11.03 10.94 7.92
Return on equity, % 46.1 44.7 34.4 33.3 23.9
Return on capital employed, % 60.0 57.3 42.9 39.8 25.0
* Before and after dilution.
For definitions of key figures see the annual report
** The booked value of stock-in-trade for 2015-2018 is approximately 5 percent higher than previous years as a result of improved invoicing processes. Accounts payable have increased with the corresponding amount.
Nine-month report 2018 (1 Dec 2017 – 31 Aug 2018)
17
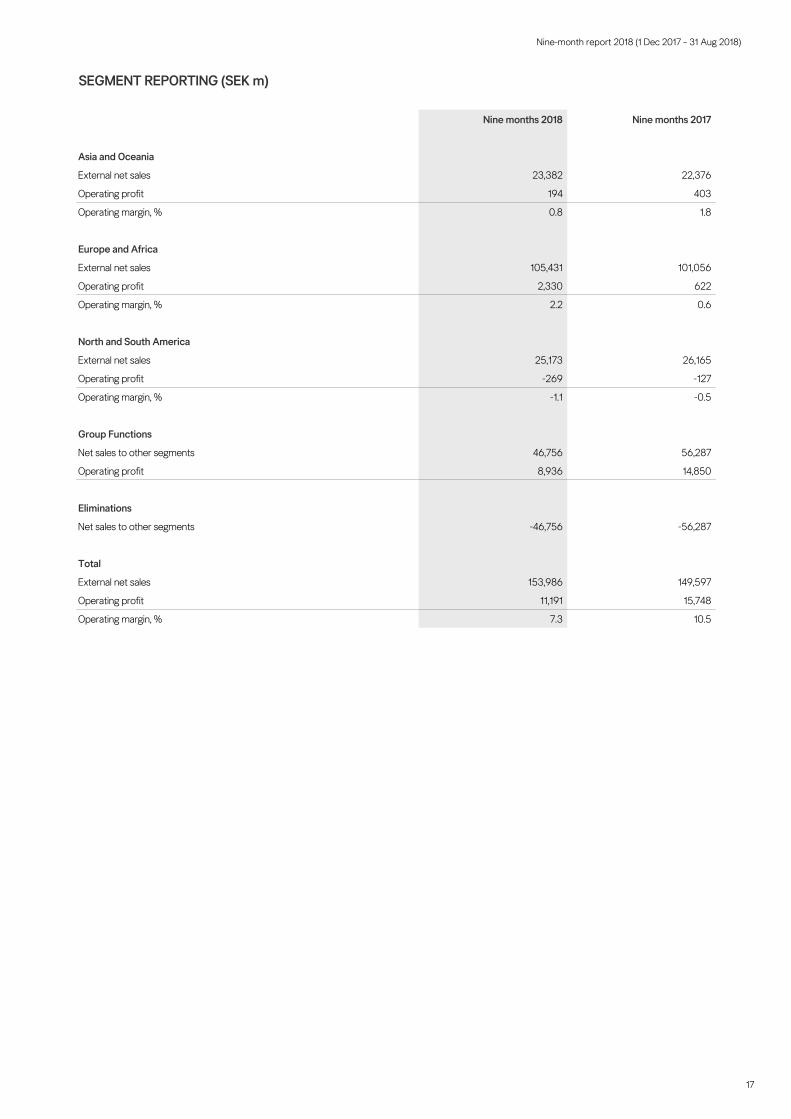
SEGMENT REPORTING (SEK m)
Nine months 2018 Nine months 2017
Asia and Oceania
External net sales 23,382 22,376
Operating profit 194 403
Operating margin, % 0.8 1.8
Europe and Africa
External net sales 105,431 101,056
Operating profit 2,330 622
Operating margin, % 2.2 0.6
North and South America
External net sales 25,173 26,165
Operating profit -269 -127
Operating margin, % -1.1 -0.5
Group Functions
Net sales to other segments 46,756 56,287
Operating profit 8,936 14,850
Eliminations
Net sales to other segments -46,756 -56,287
Total
External net sales 153,986 149,597
Operating profit 11,191 15,748
Operating margin, % 7.3 10.5

Nine-month report 2018 (1 Dec 2017 – 31 Aug 2018)
18
PARENT COMPANY INCOME STATEMENT IN SUMMARY (SEK m)
Q32018
Q32017
Nine months2018
Nine months2017
1 Dec 2016-30 Nov 2017
External sales excluding VAT 6 5 16 9 13
Internal sales excluding VAT* 1,070 961 3,085 3,005 4,069
GROSS PROFIT 1,076 966 3,101 3,014 4,082
Administrative expenses -35 -45 -124 -134 -158
OPERATING PROFIT 1,041 921 2,977 2,880 3,924
Net financial items** 1,494 327 3,807 2,946 12,931
PROFIT AFTER FINANCIAL ITEMS 2,535 1,248 6,784 5,826 16,855
Year-end appropriations - - - - -328
Tax -232 -185 -675 -609 -773
PROFIT FOR THE PERIOD 2,303 1,063 6,109 5,217 15,754
PARENT COMPANY STATEMENT OF COMPREHENSIVE INCOME (SEK m)
Q32018
Q32017
Nine months2018
Nine months2017
1 Dec 2016-30 Nov 2017
PROFIT FOR THE PERIOD 2,303 1,063 6,109 5,217 15,754
Other comprehensive income
Items that have not been and will not be reclassified to profit or loss
Remeasurement of defined benefit pension plans - - - - -1
Tax related to the above remeasurement - - - - 0
OTHER COMPREHENSIVE INCOME - - - - -1
TOTAL COMPREHENSIVE INCOME FOR THE PERIOD 2,303 1,063 6,109 5,217 15,753
* Internal sales in the quarter consists of royalty of SEK 1,066 m (959) and other SEK 4 m (2) received from group companies and for the nine-month period of royalty of SEK 3,076 m (2,932) and other SEK 8 m (73).** Dividend income from subsidiaries in the quarter consists of SEK 1,483 m (409) and in the nine-month period of SEK 3,717 m (3,059).

Nine-month report 2018 (1 Dec 2017 – 31 Aug 2018)
19
PARENT COMPANY BALANCE SHEET IN SUMMARY (SEK m)
31 Aug - 2018 31 Aug - 2017 30 Nov 2017
ASSETS
Fixed assets
Property, plant and equipment 307 388 367
Financial fixed assets 1,828 1,467 1,627
2,135 1,855 1,994
Current assets
Current receivables 23,548 13,348 19,312
Cash and cash equivalents 348 88 133
23,896 13,436 19,445
TOTAL ASSETS 26,031 15,291 21,439
EQUITY AND LIABILITIES
Equity 6,450 5,937 16,478
Untaxed reserves 417 429 417
Long-term liabilities* 182 191 182
Current liabilities** 18,982 8,734 4,362
TOTAL EQUITY AND LIABILITIES 26,031 15,291 21,439
* Relates to provisions for pensions.
** Interest-bearing current liabilities amounts to SEK 10,000 m (0). Dividend to be paid amounts to SEK 8,027 m (8,027).