Nina Omani, Raghavan Srinivasan, and Taesoo Lee · 2012. 8. 13. · model to two Texas estuaries in...
27
Nina Omani, Raghavan Srinivasan, and Taesoo Lee Spatial Sciences Laboratory, Texas A&M University
Transcript of Nina Omani, Raghavan Srinivasan, and Taesoo Lee · 2012. 8. 13. · model to two Texas estuaries in...

Nina Omani, Raghavan Srinivasan, and Taesoo Lee
Spatial Sciences Laboratory, Texas A&M University

This project was initiated to develop and apply the SWAT model to two Texas estuaries in order to estimate sediment and nutrient loads and to evaluate model performance when compared with TWDB reports. Freshwater inflow from ungauged and gaged watersheds to coastal bays was predicted using SWAT in the first phase(Lee et al., 2011). The sediment, total nitrogen and total phosphorus are predicted on an annual basis for both gauged and ungauged subbasins using a calibrated model setting for gauged subbasins.

• Estimation of water flow to Bays using a recent model
like SWAT over TXRR model (Lee et al., 2011)
• TXRR Model: Rainfall_runoff model using CN
• Estimation of sediment and nutrient load to Bays
• Pilot Study: Galveston Bay Watershed (Urbanized) and
Matagorda Bay Watershed (Rural)
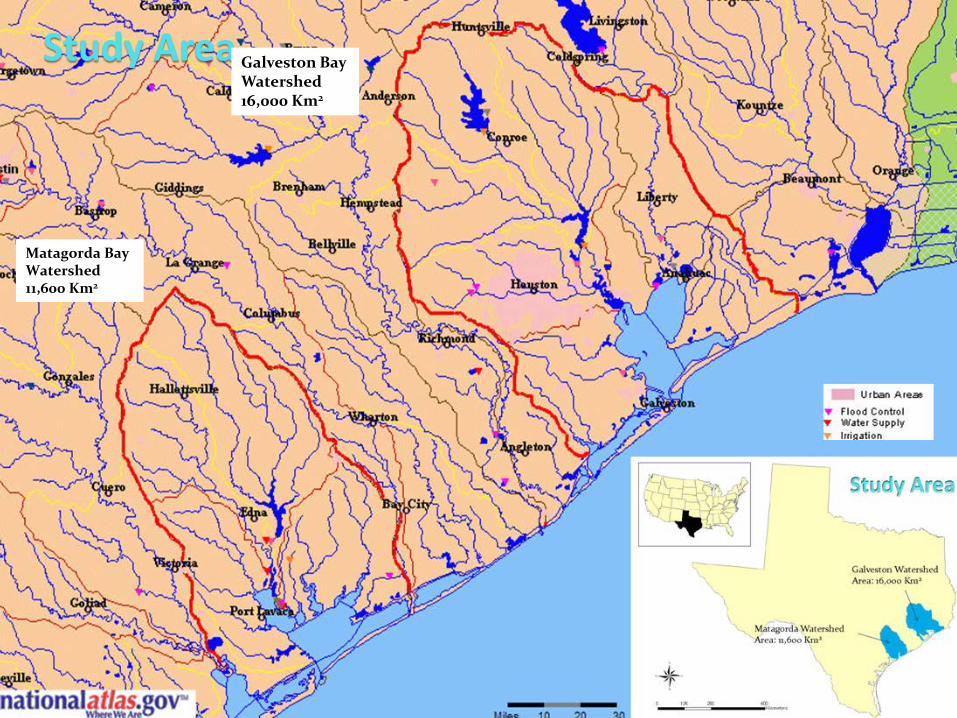
Study Area Galveston Bay Watershed 16,000 Km2
Matagorda Bay Watershed 11,600 Km2

Input Data
GIS Data: 30m DEM
Landuse: NLCD 2001
Soil: SSURGO
Landuse Type
Galveston Matagorda
Urban 23.8% 0.0%
Cultivated/Pasture 27.7% 70.1%
Other 48.5% 29.9%

Weather: NDCD (1975-1999) and NEXRAD (2000-2008) http://www.ncdc.noaa.gov/oa/climate/climatedata.html http://www.ncdc.noaa.gov/oa/radar/radardata.html
Flow: USGS Gage stations http://waterdata.usgs.gov/tx/nwis/sw
Weather stations used in this project

Sediment: USGS water quality samples http://waterdata.usgs.gov/tx/nwis/qw
Nutrients: USGS water quality samples http://waterdata.usgs.gov/tx/nwis/qw
Average annual sediment and nutrient data: TWDB Reports
Sampling and Monitoring Stations
TWDB and USGS gauging stations available in both watersheds

Calibration steps: Model calibration for average annual delivered sediment load based on
Lower Colorado River Authority (LCRA) 1997 report. In this report sediment and nutrient loading from freshwater sources was estimated for 1984 (dry years) and 1987 (wet years).
Model calibration using the monthly suspended sediment from Lavaca River Basin (Subbasin 7), total nitrogen, total phosphorus, organic nitrogen, organic phosphorus, NO3, and inorganic phosphorus from Lavaca River Basin (Subbasin 7) and Tres palacios River Basin (Subbasin 10).
Monthly calibration dataset was estimated using LOADEST program. Because of the lack of data the calibration periods for Subbasin 7 and 10 is
different.

Average annual sediment calibration and validation
USGS gauge station on the Lavaca River at Edna: Calibration: USGS: 49,000 SWAT: 49,230 Difference: 0.4% Validation: USGS: 126,600 SWAT: 123,700 Difference : 2.3%
Navidad at the outlet of Lake Texana: With 43% trapping (Blanton and Ferrari, 1992): 268,500 SWAT: 281,500 Difference: 4.8%
Unit: metric ton per year
Navidad above Lake Texana: (TWDB Lake survey report, 2011) Drainage area: 3636 km2 TWDB: 471,200 ton/year (1980-2010) SWAT: 488,000 (1980-2005) Difference: 3.5%

Average annual total nitrogen from freshwater calibration and validation
LCRA, 1997 report: Low flow-1984: 68 High flow-1987: 465 Average: 266.5 Calibration: 159.3 Difference: 40% Validation: 251.1 Difference: 5.7% Lavaca River at Edna:
Navidad at the outlet of the Lake Texana: Low flow-1984: 420 High flow-1987: Average: 720.5 Calibration: 554.4 Difference: 23% Validation: 568.7 Difference: 21%
Tres Palacios River at Midfield: Low flow-1984: 190 High flow-1987: 207 Average: 198.8 Calibration: 145.7 Difference: 27%
Gracitas Creek at Inez/Placedo Creek at Placedo: Low flow-1984: 28 High flow-1987: 137 Average: 82.5 Calibration: 90.1 Difference: 9% Validation: 120.8 Difference: 46%
Unit: metric ton per year

Average annual total phosphorus calibration and validation
Lavaca River at Edna: LCRA, 1997 report: Low flow-1984: 9.7 High flow-1987: 66.4 Average: 38 Calibration: 28.5 Difference: 25% Validation: 47.7 Difference: 25%
Navidad at the outlet of the Lake Texana: Low flow-1984: 60 High flow-1987: 145.8 Average: 103 Calibration: 103.8 Difference: 0.0% Validation: 104 ton/year Difference: 0.0%
Tres Palacios River at Midfield: Low flow-1984: 27 High flow-1987: 29.8 Average: 28.4 Calibration:24 Difference: 15.5%
Gracitas Creek at Inez/Placedo Creek at Placedo: LCRA, 1997 report: Low flow-1984: 4 High flow-1987: 19.6 Average: 11.8 Calibration: 10.9 Difference: 0.0% Validation: 13.6 Difference: 15%
Assuming N:P is 7:1
Unit: metric ton per year
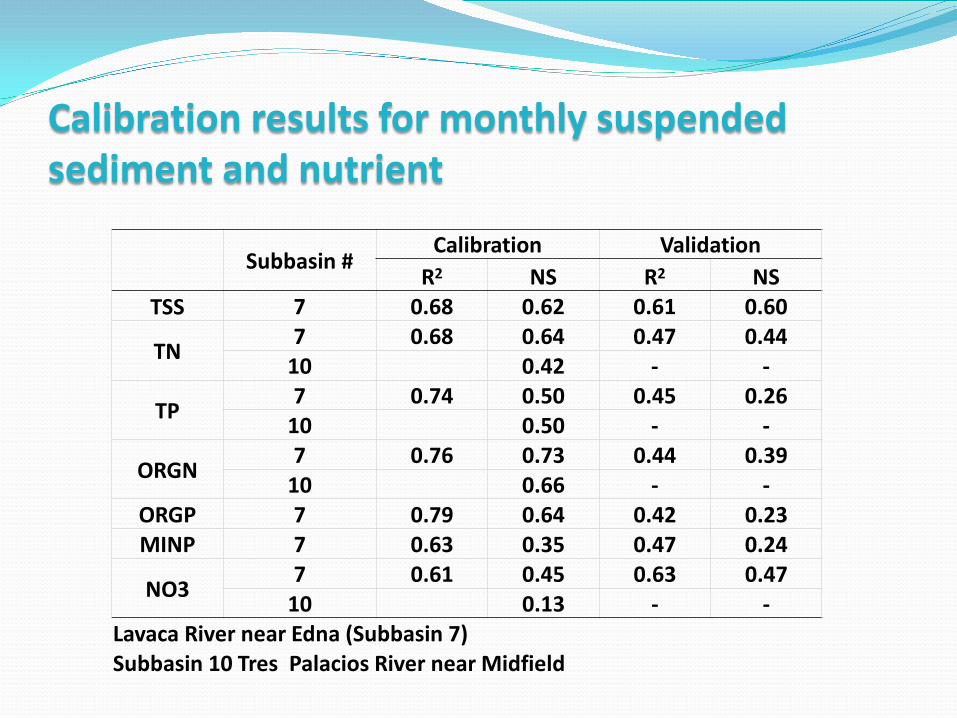
Calibration results for monthly suspended sediment and nutrient
Subbasin #
Calibration Validation R2 NS R2 NS
TSS 7 0.68 0.62 0.61 0.60
TN 7 0.68 0.64 0.47 0.44 10 0.42 - -
TP 7 0.74 0.50 0.45 0.26 10 0.50 - -
ORGN 7 0.76 0.73 0.44 0.39 10 0.66 - -
ORGP 7 0.79 0.64 0.42 0.23 MINP 7 0.63 0.35 0.47 0.24
NO3 7 0.61 0.45 0.63 0.47 10 0.13 - -
Lavaca River near Edna (Subbasin 7) Subbasin 10 Tres Palacios River near Midfield

Total phosphorus graphs for calibration period
7
10
05000
10000150002000025000300003500040000
Jan-
77
Apr-
77
Jul-7
7
Oct
-77
Jan-
78
Apr-
78
Jul-7
8
Oct
-78
Jan-
79
Apr-
79
Jul-7
9
Oct
-79
Jan-
80
Apr-
80
Jul-8
0
Oct
-80
Tota
l P (k
g/m
onth
) Total P, Subbasin 10 Estimated
Predicted
0
20000
40000
60000
80000
100000
Jan-
86
Jun-
86
Nov
-86
Apr-
87
Sep-
87
Feb-
88
Jul-8
8
Dec-
88
May
-89
Oct
-89
Mar
-90
Aug-
90
Jan-
91
Jun-
91
Nov
-91
Apr-
92
Sep-
92
Feb-
93
Jul-9
3
Dec-
93
Tota
l P (k
g/m
onth
) Total P, Subbasin 7 EstimatedPredicted

0
100000
200000
300000
400000
500000
600000
700000
Jan-
86
Jun-
86
Nov
-86
Apr-
87
Sep-
87
Feb-
88
Jul-8
8
Dec-
88
May
-…
Oct
-89
Mar
-90
Aug-
90
Jan-
91
Jun-
91
Nov
-91
Apr-
92
Sep-
92
Feb-
93
Jul-9
3
Dec-
93
Tota
l N (k
g/m
onth
) Total N, Subbasin 7 Estimated
Predicted
Total nitrogen graphs for calibration period
0
20000
40000
60000
80000
100000
120000
140000
Jan-
77
Apr-
77
Jul-7
7
Oct
-77
Jan-
78
Apr-
78
Jul-7
8
Oct
-78
Jan-
79
Apr-
79
Jul-7
9
Oct
-79
Jan-
80
Apr-
80
Jul-8
0
Oct
-80
Tota
l N, (
kg/h
a)
Total N, Subbasin 10 EstimatedPredicted

Input variables for calibration of sediment at gauged subbasins and average variables at ungauged subbasins
Variable Name Definition
Default
Value Gauged
Subbasins Ungauged Subbasins Units
CH_N2.rte Manning’s n value for the main channel 0.014 0.014-0.07 0.05-0.07 coefficient
CH_COV1.rte Channel cover factor Bagnold Equation 0.5-0.6 0.5 coefficient
CH_COV2.rte Channel erodibility factor Bagnold Equation 1 1 coefficient
SPCON.bsn Linear parameter for calculating the maximum amount of sediment 0.0001 0.004 coefficient
PRF.bsn Peak rate adjustment factor for sediment routing in the main channel
1 0.70 coefficient
SPEXP.bsn Exponent parameter for calculating sediment re-entrained 1 1 coefficient

Input variables for calibration of nitrogen at gauged subbasins and input variables at ungauged subbasins
Variable Name Definition Default value Gauged Subbasins
Ungauged Subbasins Units
BIOMIX.mgt Biological mixing efficiency 0.2 0.4 - 0.46 0.43 coefficient
ERORGN.hru Nitrogen enrichment ratio for loading with sediment Calculated
(Menzel 1980) 1 - 5 3 ratio
RS3.swq Benthic NH4 source rate coefficient 0.5 0.54 0.54 mg N/m2-day RS4.swq Organic N settling rate coefficient 0.05 0.07 0.07 day-1 BC1.swq Decay rate for NH4 to NO2 0.55 0.8 0.8 day-1 BC2.swq Decay rate for NO2 to NO3 1.1 1.54 1.54 day-1
BC3.swq Rate constant for hydrolysis of organic N to NH4 0.21 0.2 – 0.4 0.2-0.30 day-1
CH_ONCO Organic nitrogen concentration in the channel 0 0.0008-0.005 0.003-0.005 ppm
RCN.bsn Concentration of Nitrogen in rainfall 1 0.85 mg N/Liter
SDNCO.bsn Denitrification threshold water content 0.05 0.9 ratio
N_UPDIS.bsn Nitrogen uptake distribution 20 50 scaling constant NPERCO.bsn Nitrate percolation coefficient 0.2 0.32 coefficient RSDCO.bsn Residue decomposition coefficient 0.05 0.047 coefficient CDN.bsn* Denitrification exponential rate coefficient 1.4 1.76 ratio
CMN.bsn* Rate factor for humus mineralization of active organic
nutrients (N and P) 0.0003 0.001 ratio
*Basinwide parameters affect either nitrogen and phosphorus loading

SWAT input coefficients adjustments for calibration of Nitrogen at gauged and ungauged subbasins Variable
Name Description
Default value
Gauged Subbasins
Ungauged Subbasins
Units
ERORGP.hru Phosphorus enrichment ratio for
loading with sediment Calculated
(Menzel 1980) 1 - 3.5 2.25 ratio
RS2.swq Benthic P source rate coefficient 0.05 0.05 0.05 mg P/m2-day
RS5.swq Organic P settling rate coefficient 0.05 0.05 – 0.1* 0.05 day-1
BC4.swq Rate constant for hydrolysis of
organic P to mineral P 0.35 0.05 – 0.5 0.27 day-1
P_UPDIS.bsn Phosphorus uptake distribution 20 90 Scaling PPERCO.bsn Phosphorus percolation coefficient 10 11 coefficient
PHOSKD.bsn Phosphorus soil partitioning
coefficient 175 200 M3/Mg
PSP.bsn Phosphorus availability index 0.4 0.22 weighted constant
MUMAX.wwq** Maximum specific algal growth rate at 20˚ C 2 1.0 day-1
RHOQ.wwq** Algal respiration rate at 20˚ 0.3 0.3 day-1
*Organic phosphorus settling rate above Lake Texana **Basinwide parameters affect either nitrogen and phosphorus loading
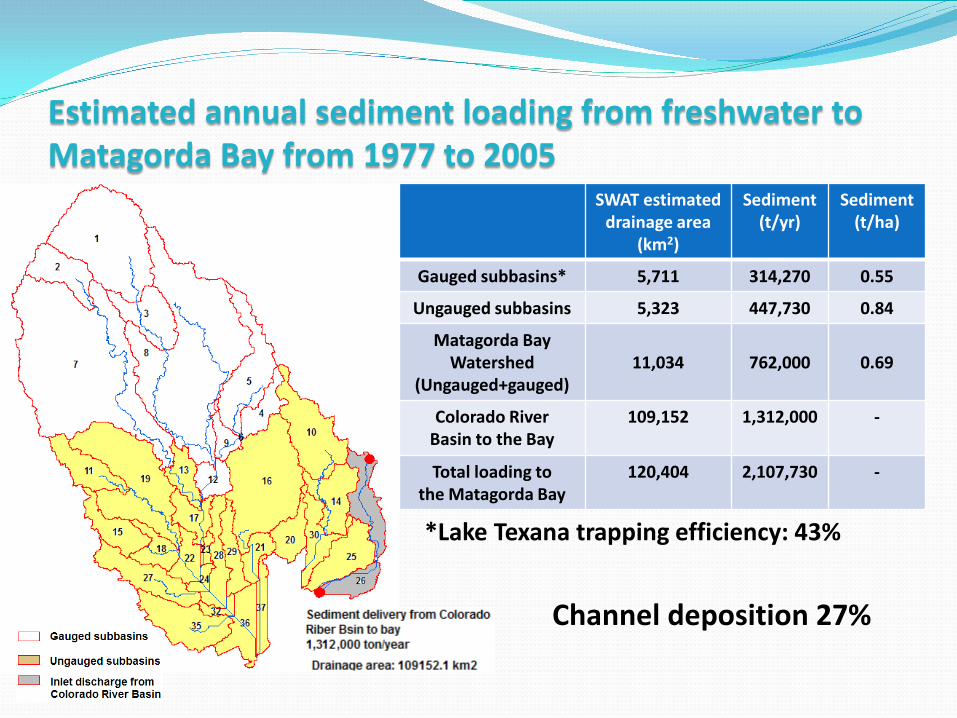
Estimated annual sediment loading from freshwater to Matagorda Bay from 1977 to 2005
SWAT estimated drainage area
(km2)
Sediment (t/yr)
Sediment (t/ha)
Gauged subbasins* 5,711 314,270 0.55
Ungauged subbasins 5,323 447,730 0.84
Matagorda Bay Watershed
(Ungauged+gauged)
11,034
762,000
0.69
Colorado River Basin to the Bay
109,152 1,312,000
-
Total loading to the Matagorda Bay
120,404 2,107,730 -
*Lake Texana trapping efficiency: 43%
Channel deposition 27%

SWAT estimated drainage area
(km2)
Nitrogen SWAT
(ton/yr)
LCRA, 1997 1984 and 1987
(Average)
Gorham-Test
(ton/yr)
Longley, 1994 Average annual from 1977-1987
(ton/yr)
Gauged subbasins 6,553.7 1403.9 706-1830 (1268)
1300 2130
Ungauged subbasins
4,480.3 1174 1290-1585 (1438)
1290 3950
Matagorda Bay Watershed
(Ungauged+gauged)
11,034
2578
1996-3415
(2706)
2590
6080
Estimated annual total nitrogen loading from feshwater to Matagorda Bay from 1977 to 2005
The estimated annual returned nitrogen load from wastewater does not include in the values

SWAT estimated drainage area
(km2)
Phosphorus SWAT
(ton/yr)
Longley, 1994 Average annual from 1977-1987
(ton/yr)
Ward and Armstrong
(ton/yr)
Gauged subbasins 6,553.7 254 - -
Ungauged subbasins 4,480.3 272 300 200
Matagorda Bay Watershed
(Ungauged+gauged)
11,034
526
-
-
Total loading to the Matagorda Bay
120,404 1034 820 1090
Estimated annual total phosphorus loading from feshwater to Matagorda Bay from 1977 to 2005
The estimated annual returned phosphorus load from wastewater does not include in the values
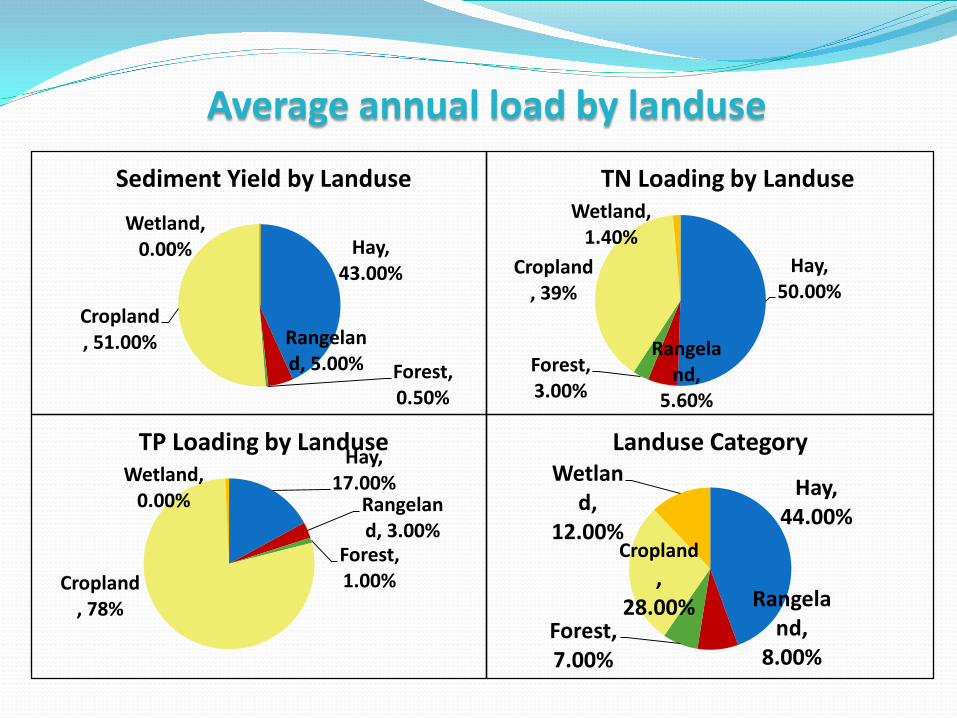
Average annual load by landuse
Hay, 50.00%
Rangeland,
5.60%
Forest, 3.00%
Cropland, 39%
Wetland, 1.40%
TN Loading by Landuse
Hay, 43.00%
Rangeland, 5.00% Forest,
0.50%
Cropland, 51.00%
Wetland, 0.00%
Sediment Yield by Landuse
Hay, 17.00%
Rangeland, 3.00%
Forest, 1.00% Cropland
, 78%
Wetland, 0.00%
TP Loading by Landuse
Hay, 44.00%
Rangeland,
8.00% Forest, 7.00%
Cropland,
28.00%
Wetland,
12.00%
Landuse Category
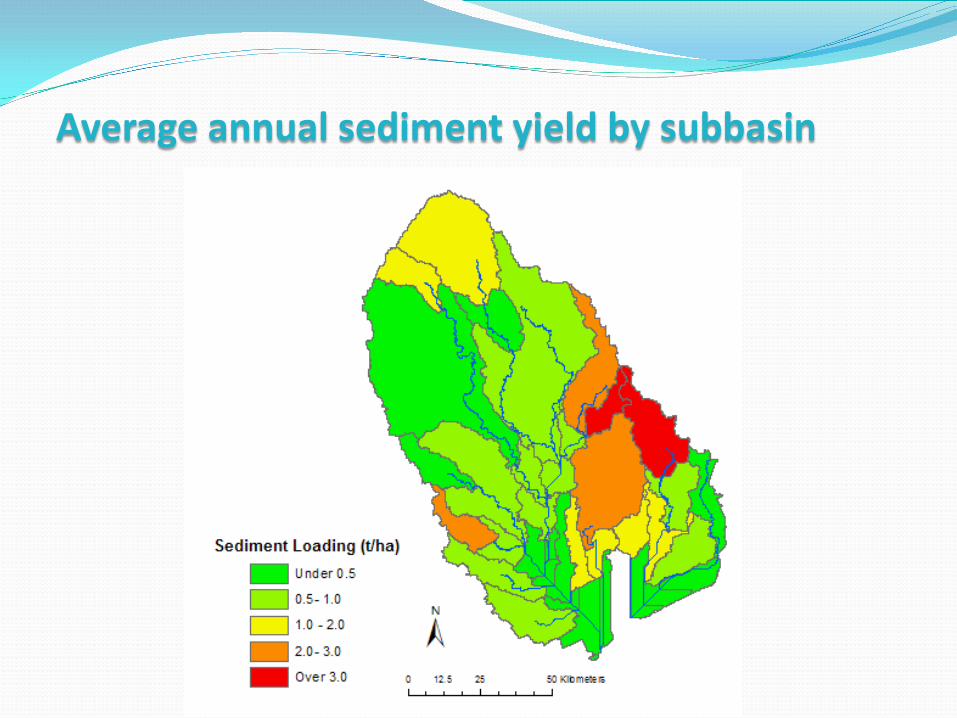
Average annual sediment yield by subbasin
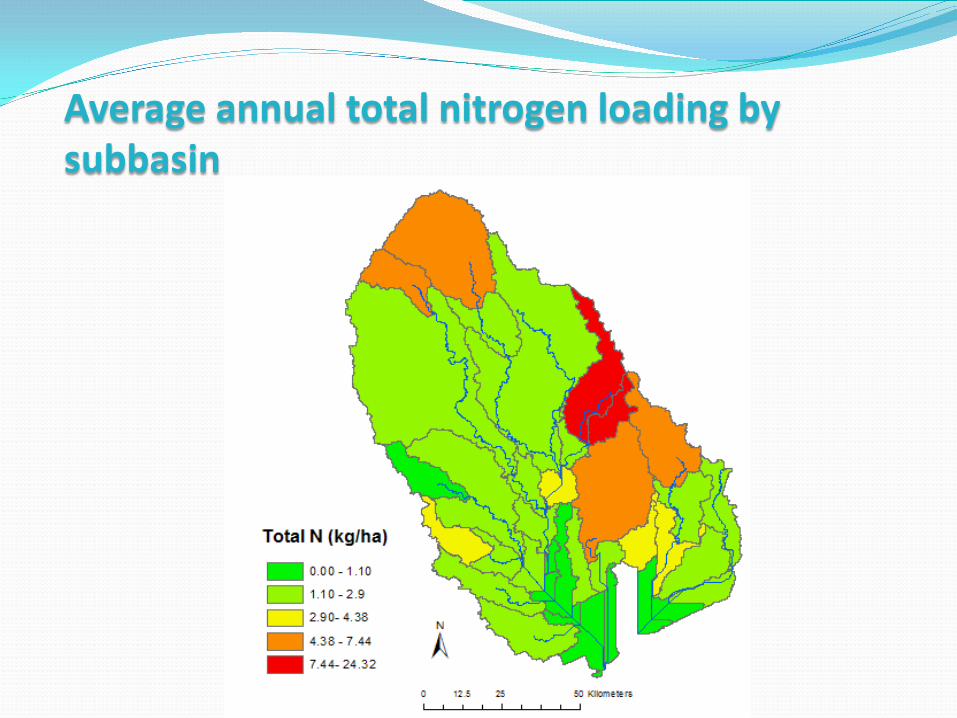
Average annual total nitrogen loading by subbasin
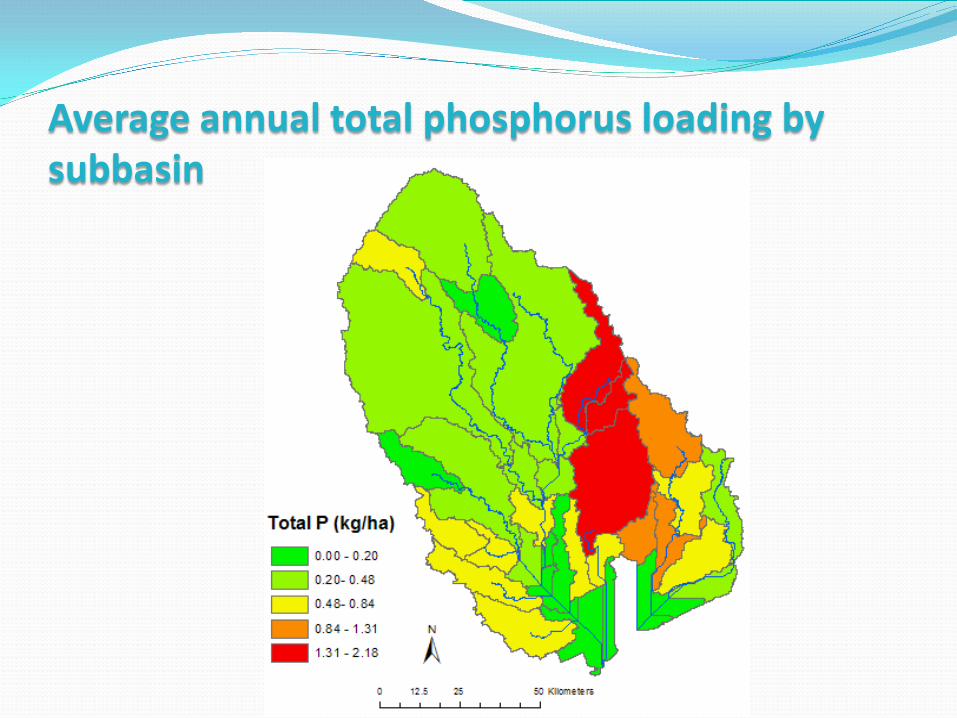
Average annual total phosphorus loading by subbasin
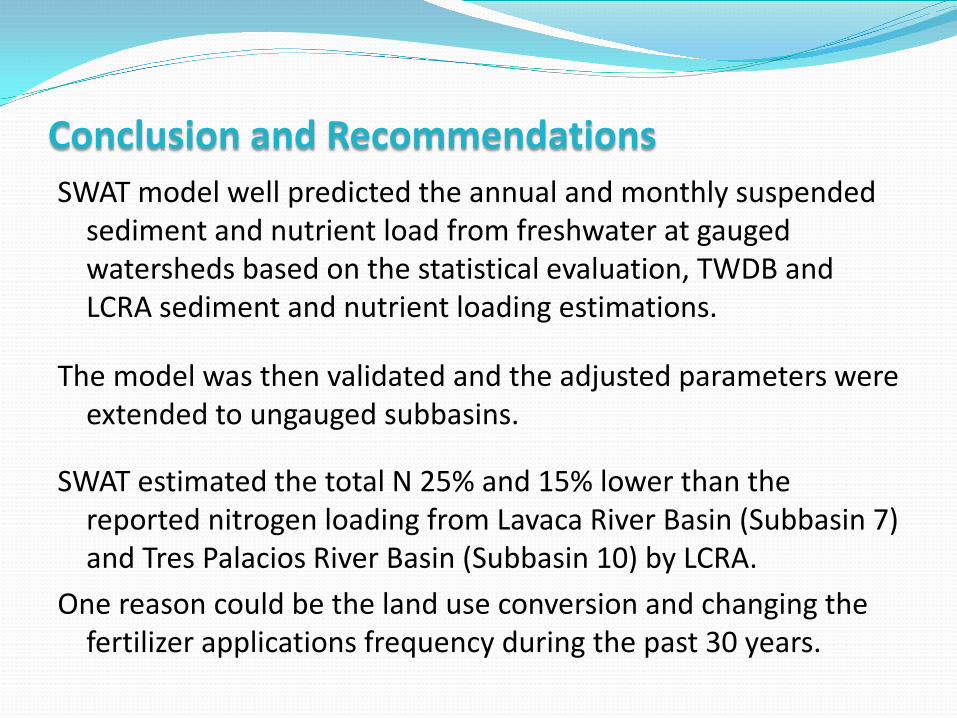
Conclusion and Recommendations SWAT model well predicted the annual and monthly suspended
sediment and nutrient load from freshwater at gauged watersheds based on the statistical evaluation, TWDB and LCRA sediment and nutrient loading estimations.
The model was then validated and the adjusted parameters were extended to ungauged subbasins.
SWAT estimated the total N 25% and 15% lower than the reported nitrogen loading from Lavaca River Basin (Subbasin 7) and Tres Palacios River Basin (Subbasin 10) by LCRA.
One reason could be the land use conversion and changing the fertilizer applications frequency during the past 30 years.

Conclusion and Recommendations The channel sediment deposition was estimated about 30%. Sediment deposition is highly sensitive to channel erosion
factors that should be selected based on literatures or field measurement.
Only about 52% of total N and 43% of total P from the
watershed reaches the bay. The high nutrient deposition could be due to the high sediment deposition in the channels. The literatures indicate that the SWAT needs further improvement to in-stream modeling routines.
Nitrogen loading from channels bedload has critical role in total N estimation. Channel bedload contributes high level of organic nitrogen within the croplands.

![TAESOO KIM[6] Seulbae Kim, Meng Xu, Sanidhya Kashyap, Jungyeon Yoon, Wen Xu, and Taesoo Kim. Finding Semantic Bugs in File Systems with an Extensible Fuzzing Framework. In Proceedings](https://static.fdocuments.in/doc/165x107/5e7a8f876e2c22260f530afd/taesoo-kim-6-seulbae-kim-meng-xu-sanidhya-kashyap-jungyeon-yoon-wen-xu-and.jpg)