NIMC 2012 National Audit Report - Safety and Quality · 4.4 Documentation of ... more detailed...
49
TRIM 85952 NIMC 2012 National Audit Report July 2013
Transcript of NIMC 2012 National Audit Report - Safety and Quality · 4.4 Documentation of ... more detailed...

TRIM 85952
NIMC 2012 National Audit Report
July 2013

© Commonwealth of Australia 2013 This work is copyright. It may be reproduced in whole or in part for study or training purposes subject to the inclusion of an acknowledgement of the source. Requests and inquiries concerning reproduction and rights for purposes other than those indicated above requires the written permission of the Australian Commission on Safety and Quality in Health Care, GPO Box 5480 Sydney NSW 2001 or [email protected] Suggested citation Australian Commission on Safety and Quality in Health Care 2013, National Inpatient Medication Chart 2012 National Audit Report, ACSQHC, Sydney. Acknowledgment Many individuals and organisations have freely given their time, expertise and documentation to support the development of this report. In particular, the Commission wishes to thank all participating hospitals and auditors for their significant contribution in gathering audit data. The involvement and willingness of all concerned to share their experience and expertise is greatly appreciated.
National Inpatient Medication Chart 2012 National Audit Report 2

Table of Contents Section Page 1 Executive summary 4 1.1 Overview 4 1.2 Background 5 1.3 Aims 5 1.4 Method 6 1.5 Summary of NIMC 2012 National Audit findings 6 1.6 Recommendations 9 1.7 Conclusion 9 2 Background to the NIMC 10 3 Method 11 4 Results 13 4.1 Demographics 14 4.1.1 Patients and medication charts 14 4.1.2 Medicine orders 15 4.2 Use of NIMC safety features 15 4.2.1 Patient identification, weight and adverse drug reaction
documentation 15
4.2.2 Medication history documentation 17 4.2.3 Warfarin prescribing and documentation, and VTE prophylaxis 20 4.2.4 Variable dose, duplicated orders, sustained release formulation and
intermittent medicines 22
4.3 Prescribing errors 23 4.3.1 Medicine name errors 23 4.3.2 Route errors 24 4.3.3 Dose errors 25 4.3.4 Frequency errors 27 4.3.5 Communication of prescribing decisions 28 4.4 Documentation of professional responsibility 31 4.4.1 Prescriber signature and identifier 31 4.4.2 Pharmacist annotation and pharmaceutical review 31 4.4.3 Recording of medicine doses administered 32 5 Summary 33 5.1 Prescription documentation 36 5.2 Documentation by health profession 37 5.3 Compliance with NIMC safety features 38 5.4 Limitations of audit methodology and data 41 6 Conclusion 43 Appendices 44 Appendix 1: National Inpatient Medication Chart 44 Appendix 2: National Inpatient Medication Chart Audit Tool/Form 46 References 49
National Inpatient Medication Chart 2012 National Audit Report 3
1. Executive summary
1.1 Overview
This report describes the results of a national audit of the National Inpatient Medication Chart (NIMC) undertaken during 2012 and is based on data submitted to the Australian Commission for Safety and Quality in Health Care (the Commission).
The NIMC is a nationally standard inpatient medication chart that was introduced to reduce medicine errors and adverse medicine events. The importance of continuing efforts to reduce medicine errors is emphasised by the fact that medicine incidents remain the second most common type of incident reported in Australian hospitals, and medicine error studies in Australian hospitals report that 2–5% of medication charts contain prescribing errors, and 5–18% of medicines administered are incorrect. 1
NIMC auditing is a component of an ongoing local and national quality improvement process. It enables participating hospitals to gain a longitudinal perspective of compliance with the NIMC safety features. It also enables them to evaluate the effect of the NIMC safety features, identify areas for improvement and more detailed analysis, and to conduct internal benchmarking when repeated participation in auditing has occurred. Sites may consider using the audit results as a guide to investigating correlation with local medicine incident reports and trends, and in other quality improvement initiatives.
The NIMC audit provides the Commission with a national overview of NIMC use and compliance with its safety features, as well as an opportunity to identify potential improvements that might be required to the structure and content of the NIMC and related support materials. Gaps in practice that are evident from the results can be used to guide more detailed examination of factors limiting improvement or barriers that can be addressed.
Participation in the NIMC national audit, and review of the results, provides hospitals with evidence to assist verifying their services against accreditation requirements in the National Safety and Quality Health Service (NSQHS) Standard 4 Medication Safety. 2 For example:
• Criterion 4.2.1: The medication management system is regularly assessed
• Criterion 4.5.2: Quality improvement activities are undertaken to reduce the risk of patient harm and increase the quality and effectiveness of medicines use
• Criterion 4.7.1: Known medication allergies and adverse medicine reactions are documented in the patient clinical record.
Audit data from public and private hospitals in eight jurisdictions are included in the overall aggregate analysis for 2012. Comparisons of the 2012 audit results are made with the post-implementation audit of the NIMC pilot chart in 2006 and the national audits undertaken in 2009, 2010 and 2011. The findings in this report are described for specific sections of the NIMC as they relate to the safety features of the chart.
In 2012, a three-fold increase in the number of hospitals participating and the volume of charts audited, compared to 2011, has provided an improved level of strength to the audit, and enables more confident interpretation of the results.
It should be noted that the hospitals in each of the audits are not matched, and many of the audit criteria have changed since the NIMC pilot in 2006. Also the audit process is not designed to take into account any clinical interpretation of the medicine orders, nor does it examine patient outcomes.
A supplementary report will identify areas for improvements in NIMC use and make recommendations in relation to future national audits for consideration by the Commission’s Health Services Medication Expert Advisory Group.
National Inpatient Medication Chart 2012 National Audit Report 4

1.2 Background
In recent years, hospital staff have seen increases in inpatient activity, shorter lengths of stay, and the emergence of new medicines that have specific additional requirements for prescribing and administration to ensure safe and effective use. Medical care has become more complex and specialised, and the population is ageing. All of these factors can contribute to increasing the risk of medicine errors.
In 2004, Australian Health Ministers agreed to implement a standard inpatient medication chart in all Australian public hospitals to reduce harm to patients from medicine errors. An initial pilot in 31 sites, and analysis of 22 matched sites data, showed a significant reduction in prescribing errors and reduced risks of subsequent adverse medicine events (AMEs). 3 The NIMC was subsequently implemented across public hospitals in all jurisdictions and many private hospitals during 2006 and 2007.
The Commission is charged with maintaining national version control of the NIMC and is advised on this responsibility by an expert, representative group, the Health Services Medication Expert Advisory Group (formerly the NIMC Oversight Committee). National audits of the NIMC have been conducted annually since 2009.
1.3 Aims
The purpose of the NIMC 2012 National Audit was to:
• evaluate if NIMC safety features are continuing to be of benefit to patient care
• identify if there are specific aspects of the NIMC or the audit process that might require modification
• determine if prescribing and medicines administration behaviour could be improved.
The aims of the ongoing NIMC quality improvement process, including national auditing, are to:
1. Evaluate use of the NIMC and compliance with its safety features.
2. Recommend changes to ensure the NIMC continues to assist in reducing the risk of harm to patients from medicine errors and preventable adverse medicine events.
3. Provide information that will guide ongoing improvements in the safety of prescribing and administration of medicines.
4. Identify gaps in practice and areas for improvement in prescribing and administration of medicines that may guide targeted education programs and other evidence-based interventions.
5. Provide individual sites with the opportunity to identify areas for improvement and more detailed analysis, conduct internal benchmarking when repeated participation in auditing has occurred, and to assess their performance against peer group/state/national results.
National Inpatient Medication Chart 2012 National Audit Report 5

1.4 Method
The methodology for the NIMC 2012 National Audit replicates the process used in previous audits, to provide a prospective snapshot of NIMC use and compliance with each of its safety features.
The director-general, or equivalent, in each state and territory provided written approval for public hospitals to provide NIMC hospital-level audit data to the Commission.
Audits of inpatient medicine orders were undertaken during the two month period 1 August to 30 September 2012 in public and private hospitals in all jurisdictions. Participation in the audits was voluntary and dependent, in part, on the availability of hospital staff to undertake the data collection. A sampling method was used for the number and type of current medication charts to audit where it was not feasible to audit every chart.
All participants used the web-based NIMC Audit System for data submission and reporting. Hospitals also collected data using the paper-based NIMC Audit Form4 and/or NIMC Audit Tool Spreadsheet 5 and uploaded their data into the NIMC Audit System which generated reports on local audit results and aggregated state, national and peer group data of all participating hospitals.
Where relevant, the 2012 data has been compared with 2011, 2010, 2009 audits and the post-implementation pilot audit of 2006. The limitations of the audit methodology and data are discussed in detail, including changes to audit criteria definitions and the extent to which results of successive audits can be interpreted and compared, as the participating sites are unmatched across the audits.
1.5 Summary of NIMC 2012 National Audit findings
The report presents national aggregate data from the NIMC 2012 National Audit in relation to individual NIMC safety features, The NIMC 2012 National Audit demonstrated ongoing high levels of compliance with important NIMC safety features which reduces the opportunity for error and improves patient safety. However, and as in previous audits, the report also highlights areas of poor performance where there is scope for further improvement.
Three hundred and twelve hospitals from all states and territories participated in the NIMC 2012 National Audit (241 public hospitals, 71 private hospitals), representing approximately thirty percent of hospitals nationally (excluding private free-standing day hospitals). 8 The results are compared with those of 2006 post-pilot NIMC, 2009, 2010 and 2011 national audits.
A total of 13,881 patients’ charts were audited and 110,690 medicine orders reviewed. This is a three-fold increase in data available for analysis compared to 2011, and provides a broader, more representative national perspective. Demographics of the aggregated data are described in Tables 2, 3 and 4 and Figure 1.
Overall, the 2012 audit results can be summarised as follows:
Sustained high levels of compliance (>85%) are noted for:
• dose specified and correct
• route specified, clear and correct route
• correct dose calculations for paediatric medicine orders
• prescribing frequency matched to times of administration
• medicines of a similar class not prescribed (duplicated orders)
• orders signed by prescriber.
National Inpatient Medication Chart 2012 National Audit Report 6

Safety features of the NIMC where compliance is similar to or improved on previous audits include:
• clear medicine name, use of generic medicine name
• PRN maximum dose documented
• paediatric dose calculation documented
• intermittent dosing blocked/crossed out
• ADR history details documented
• warfarin indication documented.
Features of the NIMC where an obvious reduction in compliance or continuing poor compliance, and scope for further significant improvement have been found are:
• complete patient identification
• documentation of weight
• warfarin prescribing in warfarin section
• documentation of target INR for warfarin orders and patient warfarin education
• documentation of PRN maximum 24 hour dose
• documentation of indication
• sustained release dosage forms of medicine identified
• use of error-prone abbreviations
• documentation of dose administration
• orders ceased correctly.
Limitations of the audit methodology and data that need to be taken into account when interpreting and using the results are discussed in section 5.4. These include:
• variability of data, hospital and patient demographics between each audit, and between jurisdictions
• ability to extrapolate results based on sampling method
• small numbers reported for some medicine order types (variable dose, warfarin)
• timing of audit and influence of local changes and strategies introduced between audits
• revision of audit definitions over time
• consistency in interpretation of audit criteria by auditors, and differences in local policies and procedures between hospitals and jurisdictions.
The 2012 audit data for individual NIMC safety features shows the NIMC continues to have a variable effect on some aspects of prescribing and administration safety since its introduction in 2006-07, with improvements in the use of some safety features, and continuing poor performance in others and an associated ongoing risk of medicine errors and adverse medicine events.
Variances may, in part, be due to:
• local and state-wide initiatives implemented to improve the quality of prescribing
• the extent of education and training provided on NIMC rationale and use
• use of non-conforming medication charts limiting the rate of NIMC incorporation into health professional curricula
• the stage of the hospital in the NIMC quality improvement cycle – in 2012 many hospitals participated in the national audit for the first time, so are establishing baseline results on which to initiate improvements
National Inpatient Medication Chart 2012 National Audit Report 7

• inconsistency between auditors.
The results for each audit criterion are discussed in detail in the report, with explanation of potential factors contributing to compliance and consequences of poor compliance. Some examples of trends in performance for use of the features of the NIMC are presented in Executive Summary Table 1.
Executive Summary Table 1: Trends in audit results for prescribing errors and compliance with documentation
Audit results (% of medicine orders)
Criteria for prescribing errors 2006 N=15,416
orders
2009 N=9,047 orders
2010 N=30,005
orders
2011 N=39,271
orders
2012 N=110,690
orders
Unclear orders for medicine name, route, dose and frequency 74.0# 49.4 37.8 24 37.6
Unclear medicine names prescribed 3.0 7.6 4.0 3.3 3.6
Route errors (missing, unclear, incorrect) 6.5 13.3 10.3 8.5 11
Dose errors (missing, unclear, incorrect) 4.3 18.4 14.2 9.7 11.8
Sustained release dosage form identified 37.7 46.4 61.3 54 57.6
Frequency errors (missing, unclear, incorrect) 15.5 20.0 19.6 10.9 13.3
Error prone abbreviations used n/a 22.6 24.6 16.9 19.7
PRN orders with max dose documented n/a n/a 42.5 26.8 35.5
Indication documented 22.8 14.5 20.2 11.3 17.8
Orders ceased correctly n/a 24.1 49.5 35.3 36.0 #Medicine orders
Audit results (%) Criteria for compliance with documentation requirements 2006 2009 2010 2011 2012
Patients with complete patient identification 19.8 31.3 32.8 47.6 45.6
Patients with weight recorded on NIMC 19.1 23.1 24.4 24.0 24.4
Patients with ADR history documented 29.4 62.7 77.3 77.9 78.5
Patients with medication history documented on NIMC or MMP n/a 13.1 33.8 27.0 31.6
% warfarin orders prescribed in warfarin section n/a 79.3 63.1 34.7 48.7
% warfarin orders with indication documented 34.3 60.9 70.0 43.2 58.4
% warfarin orders in warfarin section with target INR documented 34.3 70.0 96.0 n/a 70.2
Patients prescribed warfarin who have provision of education recorded
11.0 10.0 12.6 15.0 15.0
National Inpatient Medication Chart 2012 National Audit Report 8
Audit results (%) Criteria for compliance with documentation requirements 2006 2009 2010 2011 2012
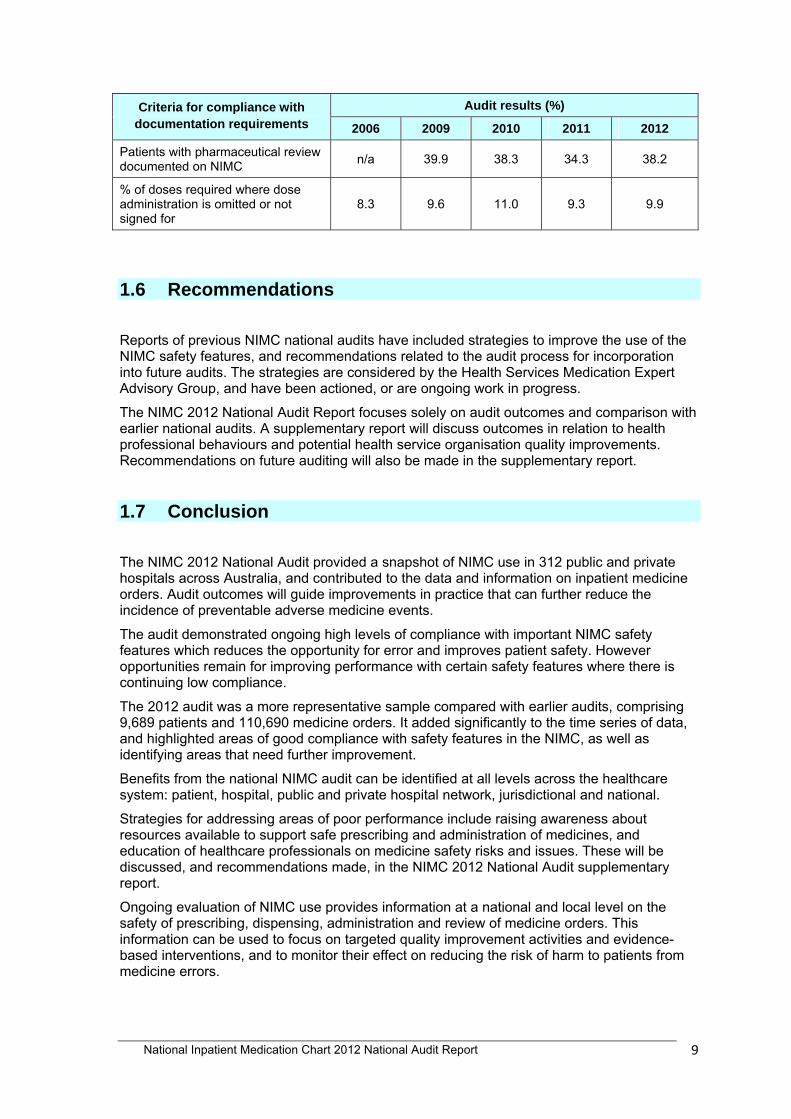
Patients with pharmaceutical review documented on NIMC n/a 39.9 38.3 34.3 38.2
% of doses required where dose administration is omitted or not signed for
8.3 9.6 11.0 9.3 9.9
1.6 Recommendations Reports of previous NIMC national audits have included strategies to improve the use of the NIMC safety features, and recommendations related to the audit process for incorporation into future audits. The strategies are considered by the Health Services Medication Expert Advisory Group, and have been actioned, or are ongoing work in progress.
The NIMC 2012 National Audit Report focuses solely on audit outcomes and comparison with earlier national audits. A supplementary report will discuss outcomes in relation to health professional behaviours and potential health service organisation quality improvements. Recommendations on future auditing will also be made in the supplementary report.
1.7 Conclusion The NIMC 2012 National Audit provided a snapshot of NIMC use in 312 public and private hospitals across Australia, and contributed to the data and information on inpatient medicine orders. Audit outcomes will guide improvements in practice that can further reduce the incidence of preventable adverse medicine events.
The audit demonstrated ongoing high levels of compliance with important NIMC safety features which reduces the opportunity for error and improves patient safety. However opportunities remain for improving performance with certain safety features where there is continuing low compliance.
The 2012 audit was a more representative sample compared with earlier audits, comprising 9,689 patients and 110,690 medicine orders. It added significantly to the time series of data, and highlighted areas of good compliance with safety features in the NIMC, as well as identifying areas that need further improvement.
Benefits from the national NIMC audit can be identified at all levels across the healthcare system: patient, hospital, public and private hospital network, jurisdictional and national.
Strategies for addressing areas of poor performance include raising awareness about resources available to support safe prescribing and administration of medicines, and education of healthcare professionals on medicine safety risks and issues. These will be discussed, and recommendations made, in the NIMC 2012 National Audit supplementary report.
Ongoing evaluation of NIMC use provides information at a national and local level on the safety of prescribing, dispensing, administration and review of medicine orders. This information can be used to focus on targeted quality improvement activities and evidence-based interventions, and to monitor their effect on reducing the risk of harm to patients from medicine errors.
National Inpatient Medication Chart 2012 National Audit Report 9

2. Background to the NIMC
In recent years, hospital staff have seen increases in inpatient activity, shorter lengths of stay, and the emergence of new medicines that have specific additional requirements for prescribing and administration to ensure safe and effective use. Medical care has become more complex and specialised, and the population is ageing. All of these factors can contribute to increasing the risk of medicine errors.
In 2004, Australian Health Ministers agreed to implement a standard inpatient medication chart in all Australian public hospitals to reduce harm to patients from medicine errors. An initial pilot in 31 sites, and analysis of 22 matched sites data, showed a significant reduction in prescribing errors and reduced risks of subsequent adverse medicine events (AMEs). 3 The pre and post-pilot data was published in 2011 by Coombes et al in the British Journal of Clinical Pharmacology 3.
The Commission is charged with maintaining national version control of the NIMC and is advised on this responsibility by an expert, representative group, the Health Services Medication Expert Advisory Group (formerly the NIMC Oversight Committee). An important part of ongoing NIMC maintenance is the use of quality improvement processes such as national auditing to evaluate use of the chart, monitor compliance with its safety features and the assess the potential effect on reducing medicine error risk. National audits of the NIMC have been conducted annually since 2009.
The NIMC (Appendix 1) was implemented across public hospitals in all jurisdictions and many private hospitals during 2006 and 2007. Use of the NIMC is a mandatory requirement for the purposes of National Safety and Quality Health Service Standard 4 Medication Safety.
The Commission’s Guide to Auditing the NIMC6 provides a detailed rationale of the NIMC safety features, and interpretation of the requirements for assessing compliance with each audit criterion.
NIMC 2012 National Audit aims included:
• evaluating if NIMC safety features continue to benefit patient care
• identifying if there are specific aspects of the NIMC or the audit process that might require modification
• identifying if there are prescribing and medicine administration behaviours that could be improved
• identifying other considerations for the Commission’s expert representative group, the Health Services Medication Expert Advisory Group.
National Inpatient Medication Chart 2012 National Audit Report 10

3. Method
This analysis is a snapshot prospective audit of in-hospital prescribing for admitted patients and use of the NIMC to evaluate the current level of compliance with NIMC safety features. The clinical appropriateness of medicine, route, dose and frequency and patient outcomes were not examined.
The study involved a prospective chart audit of prescribing and administering documentation and errors. The definitions and examples of types of prescribing errors are explained in detail in the NIMC Audit Form 4 (Appendix 2) and Guide to Auditing the NIMC 6.
Types of charts audited were:
• NIMC (acute) and private hospital version
• NIMC (long-stay)
• NIMC (paediatric)
• NIMC (paediatric long-stay).
Separate medication charts for anticoagulation, continuous infusions, insulin, chemotherapy, acute and chronic parenteral analgesia, clozapine and discharge, and electronically generated charts, were excluded from the audit.
All hospitals (public and private) were invited to participate in the audit through the Commission’s Health Service Medication Expert Advisory Group jurisdictional and private hospital contacts. Participation in the audit was voluntary. Sites were recruited on the basis that they used a conforming NIMC and were authorised to share their data. Directors-general, or equivalent, in each state and territory provided written approval for public hospitals to provide NIMC hospital-level data to the Commission.
All participating hospitals across states and territories, including private hospitals, undertook the audit from 1 August to 30 September 2012. The Guide to Auditing the NIMC 6 provided guidance for auditors. Data were entered electronically or submitted to the web-based NIMC Audit System upon completion of the audit.
The NIMC Audit System provided:
a) The electronic NIMC Audit Form which enabled patient audits to be entered directly into the NIMC Audit System
b) Data uploading function from the NIMC Audit Tool Excel spreadsheet into which hospitals collated and stored patient audits
c) A reporting function that generated an audit summary report of hospital audits along with reports comparing results with de-identified data from peer and all hospitals at state and national levels.
Hospitals were encouraged to audit all NIMC charts. If that was not feasible, a sampling method for the number and type of current medication charts to audit was recommended as outlined in the Guide to Auditing the NIMC 6 and reproduced below in Table 1.
Table 1: Suggested hospital audit sample size
Number of adult beds in hospital Sample size
150 or more 20% of current patients
30-149 30 current patients
Less than 30 All current patients
National Inpatient Medication Chart 2012 National Audit Report 11

All available NIMCs on the selected wards were audited to identify and document prescribing errors using established definitions in the NIMC User Guide 7 and the Guide to Auditing the NIMC6. All medicine orders on active NIMCs were reviewed, including those cancelled or previously changed.
Where sampling is used, the selection of clinical units within each hospital may introduce factors that can influence audit results, for example variance in the complexity and volume of prescribing. These factors are not taken into account in this report.
It was recommended that audit teams consist of a registered nurse and a pharmacist if available, otherwise a medical officer or another nurse. Inter-rater reliability was not determined, however both observers had to agree on errors. It was recommended that a third auditor be involved if any disagreement occurred.
Analysis of data Where appropriate, the 2012 data has been compared with data from 2006 (post-implementation pilot), 2009, 2010 and 2011 NIMC national audit results.
It must be noted that the sites in each of the five audits to date are unmatched. In addition, a number of audit definitions have been amended since the 2006 post-implementation pilot audit.
National Inpatient Medication Chart 2012 National Audit Report 12

4. Results of 2012 NIMC audit
National aggregate data from the 2012 NIMC audit is presented in relation to individual NIMC safety features, highlighting results that demonstrate improvement as well as areas where prior improvement has not been maintained. The results are compared with those of the 2006 post-pilot NIMC audit and the 2009, 2010 and 2011 national audits.
Three hundred and twelve hospitals from all states and territories participated in the NIMC 2012 National Audit. This represents approximately 30% of hospitals nationally (excluding private free-standing day hospitals)8.
The breakdown of hospital participation by peer grouping is provided in Table 2, and is based on the Australian Institute of Health and Welfare hospital classification9.
Table 2: Hospital participation by peer group
Number of hospitals (percentage of total)
Peer group
2010 2011 2012
Private 2 (2.89) 38 (26.38) 71 (22.75)
Small Regional and Remote Acute 18 (26.08) 34 (23.61) 84 (26.92)
Medium Group 10 (14.49) 16 (11.11) 37 (11.85)
Un-peered & Other 4 (5.79) 15 (10.41) 35 (11.21)
Principal Referral 14 (20.28) 12 (8.33) 40 (12.82)
Multi Purpose Services 10 (14.49) 11 (7.63) 23 (7.37)
Large Major Cities 3 (4.34) 5 (3.47) 9 (2.88)
Specialist Women’s & Children 3 (4.34) 5 (3.47) 4 (1.28)
Large Regional & Remote 3 (4.34) 5 (3.47) 3 (0.96)
Psychiatric 1 (1.44) 2 (1.38) 4 (1.28)
Rehabilitation 1 (1.44) 1 (0.69) 2 (0.64)
TOTAL 69 144 312
Data used for aggregate analysis A summary of data on number of patients, medication charts and orders is provided in Table 3 below. The NIMC Audit System does not currently permit reporting on the different types of charts audited (NIMC, paediatric and long stay).
National Inpatient Medication Chart 2012 National Audit Report 13

Table 3: Number of hospitals, patients, medication charts and orders per audit
Audit year 2009 No. (%)
2010 No. (%)
2011 No. (%)
2012 No. (%)
Jurisdictions participating
5 7 7 8
Public hospitals n/a 67 (97.10) 106 (73.61) 241 (77.24)
Private hospitals n/a 2 (2.89) 38 (26.38) 71 (22.75)
Total hospitals 25 69 144 312
Patients 864 2,591 Public 2,531 (97.68) Private 60 (2.31)
3,760 Public 2,593 (68.96) Private 1,167 (31.03)
9,689 Public 7,455 (76.94) Private 2,234 (23.05)
Medication charts
1,138 3,720 5,195 13,881
Medicine orders 9,047 30,005 39,271 110,690
Regular orders 5,539 (61.30) 18,252 (60.82) 24,328 61.94%) 67,918 (61.30%)
PRN orders 2,049 (22.64) 6,298 (20.98) 8,908 (22.68%) 24,272 (21.92%)
Stat Only orders 1,391 (15.37) 5,194 (17.31) 5,684 (14.47%) 17,403 (15.72%)
Warfarin orders 30 (0.33) 140 (0.46) 183 (0.46%) 557 (0.50%)
Variable dose orders
38 (0.42) 121 (0.40) 168 (0.42%) 540 (0.48%)
v
4.1 Demographics
4.1.1 Patients and medication charts The 2012 audit reported data for 9,689 patients, including paediatric patients. A total of 13,881 medication charts and 110,690 medicine orders were reviewed, with an average of 7.0 regular medicine orders per patient (Table 4), comparable to 2011 (6.5).
Table 4: 2012 audit demographics Patients Charts Charts per
patient Medicine orders
Regular medicine orders
Regular medicine orders per patient
Public hospitals 7,455 10,806 1.45 86,103 53,501 7.17
Private hospitals 2,234 3,075 1.38 24,587 14,417 6.45
All hospitals 9,689 13,881 1.43 110,690 67,918 7.0
National Inpatient Medication Chart 2012 National Audit Report 14

4.1.2 Medicine orders Prescription of regular medicine accounts for 61.4% of orders reviewed, with PRN orders being the next most frequently prescribed type (21.9%). Variable dose and warfarin orders each accounted for less than 1% of all orders (Figure 1). The relative proportion of each medicine order type is similar between public and private hospitals, and is consistent when compared to 2011 audit. The proportion of all medicine orders between public and private hospitals is 77.8% and 22.2% respectively.
Figure 1: Type of medicine order
4.2 Use of NIMC safety features
4.2.1 Patient identification, weight and adverse drug reaction (ADR) documentation
Audit requirements for complete patient identification are unique record number (URN), patient name, patient address and date of birth on pages 3 and 4 of the NIMC.
Weight is to be recorded on at least one medication chart for NIMC (acute) and NIMC (long-stay) and on each chart for NIMC (paediatric) and NIMC (paediatric long-stay).
Complete ADR documentation requires nil known, unknown or ADR with medicine name(s) and reaction documented, and a clinician’s signature.
Results for these parameters are similar to the 2011 audit – there is minimal change noted to indicate either improvement or reduction in performance related to documentation (Figure 2.1). Results for private hospitals demonstrate a greater degree of the required documentation for patient identification and weight (Figure 2.2). However there remains significant potential to achieve a higher level of compliance for these features of the NIMC across both the private and public sectors.
National Inpatient Medication Chart 2012 National Audit Report 15

Figure 2.1: Patient identification and adverse drug reaction documentation
Figure 2.2: Patient identification and ADR documentation by hospital sector
National Inpatient Medication Chart 2012 National Audit Report 16

Patient identification While many charts have an identifier, either a printed label or written by hand, the patient’s name must be hand written by the first prescriber in order to comply with the NIMC audit criteria. In 54% of charts audited, patient identification was incomplete. In private facilities, 64% of patients had complete identification on all charts compared with 40% in public hospitals. Although this is an improvement compared with 80% incomplete in 2006, patient identification is an important safety issue that should be targeted for improvement.
Patient weight Documentation of patient weight has remained unchanged and is still well below an optimum level.
One quarter (24.4%) of patients had a weight recorded on the NIMC. Weight may have been recorded in other parts of the patient record, however this was not considered compliant for the purpose of this audit as weight is essential information for dosing many medicines correctly, and is critical for safe prescribing in paediatrics.
While the results for paediatric charts with a weight documented could not be analysed separately in this audit, the aggregate data of the four participating specialist women’s and children’s hospitals showed a higher proportion of patients (64.7%, n=221), including paediatric patients, had weight recorded on the NIMC.
A change in audit definition for this criterion has been agreed for future audits to include recognition of weight recorded on a patient’s general observations chart. However, recording of weight on paediatric medication charts will remain mandatory.
Adverse drug reaction (ADR) documentation
Over three-quarters (78.5%) of all patients had a complete ADR history documented, similar to that in 2010 and 2011 audits. The rate of patients being prescribed a similar class of medicine to which they had previously experienced an ADR (11.2%) was also consistent with prior audits, with public hospitals reporting more occasions of re-prescribing than private facilities (13% and 5.5% respectively), a reversal of the 2011 results (9.3% vs 12.7%).
The criteria used for assessing completeness of ADR documentation may influence the results, as the ADR documentation could be assessed as incomplete, for example, when the medicine and/or a reaction were recorded on the chart, but the date of the medicine reaction was missing. In some hospitals, separate allergy alert forms are used to document ADR history. However this does not negate the need for ADR history information to be recorded on the NIMC.
The audit results positively reflect use of the NIMC safety feature and the importance for prescribers, pharmacists and administrators having information about the patient’s ADR history when prescribing, dispensing and administering medicines.
4.2.2 Medication history documentation Audit requirements are that patient medication prior to admission is recorded on at least one medication chart that is currently in use, or on a Medication Management Plan (MMP) form or equivalent and that is cross-referenced on the NIMC.
Results for medication history documentation are summarised in Table 5 below.
National Inpatient Medication Chart 2012 National Audit Report 17

Table 5: Medication history documentation
Criterion 2009 2010 2011 2012 Comment
Patients for whom clinicians can access medication history either on NIMC or Medication Management Plan (MMP). Note that the MMP was made available nationally in 2010. Medication history, including “nil regular medicines”, on current medication chart
13.1%
33.8%
27% Public: 25.2% Private: 30.9%
31.6% Public: 34.4% Private: 22.1%
Level of compliance in the recording of patient medication history or cross referencing the location of medication history separate form/MMP show an increase. 15% patients had a medication history documented on the NIMC (unchanged from 2011), 16.6% on the MMP. 12.75% of patients had a medication history cross referenced on current chart to a previous chart or MMP, increased from 2011 (8.9%).
Patients with a medication history documented on MMP form
9.8% 18.8% 11.0% Public: 12.80% Private: 7.00%
16.6% Public: 20.58% Private: 3.22%
Some improvement is noted in public hospitals.
MMP forms with complete ADR documentation
56.0% 87.1% 87.9% 87.05% Public: 87.2% Private: 84.7%
Sustained high compliance with recording of ADR details on MMP form.
Medicines on the MMP form with Dr's Plan on Admission documented
69.3% 63.1% 56.9% 53.6% Public: 51.9% Private: 85.9%
Trend of gradual decline noted in the rate of completion of this information.
Medicines documented on the MMP form with Reconcile column ticked
67.1% 56.1% 65.9% 62.55% Public: 64.8% Private: 20.6%
Minimal variance in result across all audits.
Documentation of a complete and accurate list of a patient’s current medicines upon admission, and reconciliation of this information with the medical officer’s plan on admission, transfer and/or discharge orders, have been shown to reduce medicine errors and adverse events at transitions of care. An increased level of awareness of the importance of medication reconciliation is being promoted through the World Health Organization’s High 5s Medication Reconciliation Project10 involving twelve Australian hospitals, and for which the Commission is the lead technical agency for Australia’s involvement.
The use of a standardised MMP form allows for a more comprehensive record of medication history and identification of problems for complex patients with multiple medicines, whereas documentation on the NIMC may be adequate for short-stay, medically stable patients with minimal medicine requirements.
National Inpatient Medication Chart 2012 National Audit Report 18

The audit found that medication history is infrequently documented on the medication chart. In sites that have introduced a Medication Management Plan (MMP), or an equivalent form, the history could be accessed on the NIMC or MMP for 31.6% of patients, consistent with the 2011 audit (27%).
Approximately 16.6% of patients had a medication history recorded on the MMP form or equivalent. The use of the MMP form demonstrated higher compliance with recording of ADR details (87%) than the NIMC, and a moderate level of documentation of Dr’s Plan on Admission (53.6%). Documentation that medication reconciliation had been undertaken was found for 62.6% of patients with a MMP, however this translates overall to only 10% of patients recorded as having medication reconciliation completed.
The results for medication history documentation vary between public (34.4%) and private (22%) patients. However the use of an MMP appears to be more common in public hospitals, with 20.6% of patients with an MMP form in the end of bed folder, compared to 3.22% for private hospital patients, possibly due to availability and awareness of the form. However, within the public hospital sector, there is also a wide variation between jurisdictions in the use of an MMP (0-40% of patients).
Medication reconciliation is an action item (4.8) in the National Safety and Quality Health Services (NSQHS) Standard 4 Medication Safety and will be a continuing focus for health service organisations verifying their services against the new accreditation requirements.
National Inpatient Medication Chart 2012 National Audit Report 19

4.2.3 Warfarin prescribing and documentation, and venous
thromboembolism prophylaxis The audit assessed use of the NIMC warfarin section that contains four elements for safe prescribing of this high risk medicine, and the occurrence of warfarin prescribing in the regular medicine orders section of the chart. Total warfarin orders equates to warfarin orders prescribed in the warfarin and regular sections of the NIMC.
Overall, the 2012 audit results show improvements in warfarin prescribing for both public and private sectors compared to 2011, but not over earlier audits (Figure 3.1 and 3.2).
Figure 3.1: Warfarin prescribing
Figure 3.2: Warfarin prescribing by hospital sector
National Inpatient Medication Chart 2012 National Audit Report 20

There was an increase in warfarin orders prescribed in the warfarin section of the medication chart, and a similar increase in the documentation of warfarin indication, but performance in these criteria remains lower than the 2010 audit results.
Marked differences between the results for public and private facilities are noted for these two criteria: Public Private
Prescribing in warfarin section 2011: 39.5% 2012: 52.5%
2011: 26.6% 2012: 37.7%
Warfarin indication documented 2011: 53.9% 2012: 64.2%
2011: 17.0% 2012: 34.6%
Documentation of warfarin indication is a NIMC safety feature and serves as a reminder of target INR. Clinical audit of patient outcomes and achievement of target INR, with additional staff education, could be considered as strategies to improve understanding of the benefits of this section of the NIMC, and achieve a higher degree of compliance.
An indicator of the benefits of using the warfarin section of the NIMC is also noted with the results for documentation of target INR at 70.2%, compared to 16.4% where warfarin was prescribed in the regular medicine section of the chart. The result may be further improved with increased documentation of indication which informs the target INR and subsequent dosing decisions, and reduces the risk of under or over-anticoagulation.
The availability of warfarin guidelines at the end of the patient’s bed or with the NIMC occurred for 35.7% of patients prescribed warfarin. Increased compliance with this criterion might be expected to assist with improving use of the warfarin section of the NIMC, due to prompts and information being more readily available at the point of prescribing.
The documentation of patient warfarin education remains at levels similar to previous audits. It is possible that the continued low rates of patient education about warfarin may reflect the focus of education being on patients who are initiated on warfarin therapy in the inpatient setting, as many long term warfarin patients may not need, or may decline, further education. The results highlight an opportunity for pharmacists to review the provision of warfarin education, and its documentation, and for future audits to differentiate between inpatients commenced on warfarin and those whose anticoagulation is stable and are well informed about warfarin therapy.
Venous thromboembolism (VTE) prophylaxis The NIMC version that includes a specific VTE prophylaxis section was developed in 2010 as a result of acknowledged gaps between clinical evidence and current practice, with evidence suggesting that point of prescribing prompts increase the rate VTE risk assessment and prophylaxis prescribing.
During 2012, eighteen health services participated in a second phase of pilot implementation and evaluation of an NIMC with a pre-printed VTE prophylaxis section. The version of the NIMC is also in use in Queensland public hospitals.
The number of hospitals that submitted audit data for VTE prophylaxis is not reported, consequently only a small amount of data is available, and meaningful interpretation is limited:
• 5% of all patients had a documented VTE risk assessment documented on any medication chart
• 1,795 charts (18.5% patients) contained medicine orders for VTE prophylaxis
• 56.4% of VTE prophylaxis orders were documented in the designated VTE prophylaxis section.
National Inpatient Medication Chart 2012 National Audit Report 21

4.2.4 Variable dose, duplicated orders, sustained release formulation and intermittent medicine orders
Audit results for variable dose, duplicated orders, sustained release and intermittent orders are similar to 2011 (Figure 4).
Figure 4: Variable dose, duplicated orders, sustained release formulations and intermittent dosing orders
Duplicated orders Duplicated orders refer to once only (stat), telephone, regular (including variable dose and warfarin), and PRN medicine orders that are repeated for the same medicine or class of medicine. It is acknowledged that in some circumstances this may be clinically appropriate, for example prescribing of both regular and PRN orders for analgesia. This judgment has been acknowledged in the recording of audit data by defining ‘duplicate’ as whether the patient would have received unintentional additional doses of medicine with potential to harm, for example two different ACE inhibitors. Duplicate orders (or similar class of medicines) prescribed, which may have the potential to cause overdosing errors, showed an increase to 1.4% (1.1% in 2011).
Sustained release dosage forms Sustained release medicines are prescribed in the regular medicine order sections of the chart and indicated by ticking a sustained release box. The rate of compliance with the sustained release formulation box ticked (57.6%) remained consistent with previous audits. It is an area requiring substantial improvement to minimise the risk of permanent patient harm that can result when the same dose, using standard release dose forms, is given instead of sustained release preparations.
National Inpatient Medication Chart 2012 National Audit Report 22
Intermittent dosing orders When medicines are prescribed for intermittent administration, for example once weekly, the administration boxes on days when the medicine is not to be administered are required to be blocked or crossed out. This is to reduce the risk of the medicine being given on days it is not ordered.
A clear indication of intermittent dosing frequency (dose administration section “boxed and crossed” to show dose regime) increased slightly to 77.2% from 71.6% in 2011, and is similar to 2010 (78.2%). Intermittent orders without the administration boxes blocked correctly present a risk to patients who may receive daily doses of potentially toxic medicines that are intended to be dosed once weekly, for example methotrexate for rheumatoid arthritis and weekly dosing of bisphosphonates. Qualitative information on which types of medicines were involved has not been collected through the audit, but could be a consideration for future analysis to assess the quality of prescribing and potential patient risk.
4.3 Prescribing errors The following results relate to data measuring the effect of NIMC features that are designed to improve the completeness and clarity of prescribing instructions, and therefore improve the quality of prescribing. Errors in medicine orders (prescribing errors), are defined as unclear (including use of error-prone abbreviations), illegible or missing, when assessing the prescribing elements of medicine name, route of administration, dose and frequency. The data comparing prescribing errors between paediatric and adult chart types have not been analysed separately.
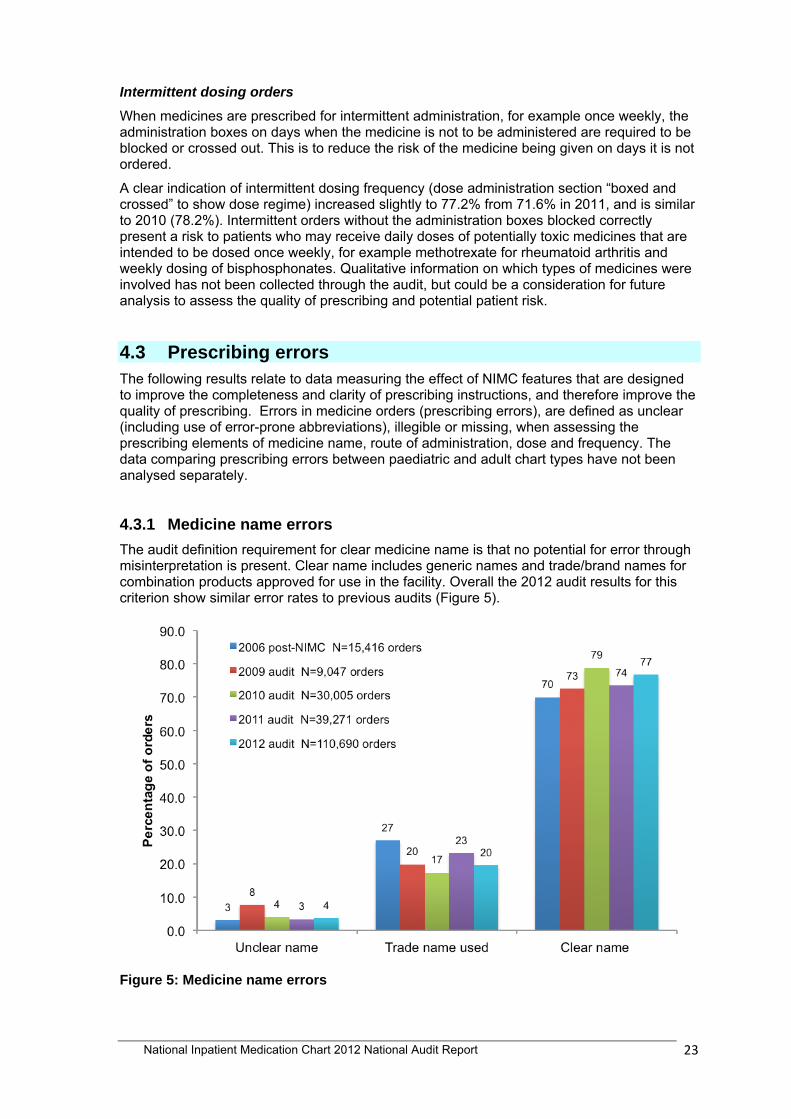
4.3.1 Medicine name errors The audit definition requirement for clear medicine name is that no potential for error through misinterpretation is present. Clear name includes generic names and trade/brand names for combination products approved for use in the facility. Overall the 2012 audit results for this criterion show similar error rates to previous audits (Figure 5).
Figure 5: Medicine name errors
National Inpatient Medication Chart 2012 National Audit Report 23
Less than five percent of medicine names were unclear as they were illegible and could be misinterpreted as another medicine, or were abbreviated inappropriately e.g. EPO for epoetin and KCl for potassium chloride.
Prescribing by generic medicine name increased slightly to 80.5% (2011: 76.8%). Prescribing using unacceptable trade names other than for combination products occurred for 19.5% of orders. Use of unclear names, particularly for combination products, may differ widely across the participating jurisdictions and private facilities, as it is considered that the use of an approved list of accepted trade names within in each hospital is not yet a widespread practice. Hospitals that do not have an endorsed list of trade names are encouraged to develop one or adapt an existing version in use at other sites.
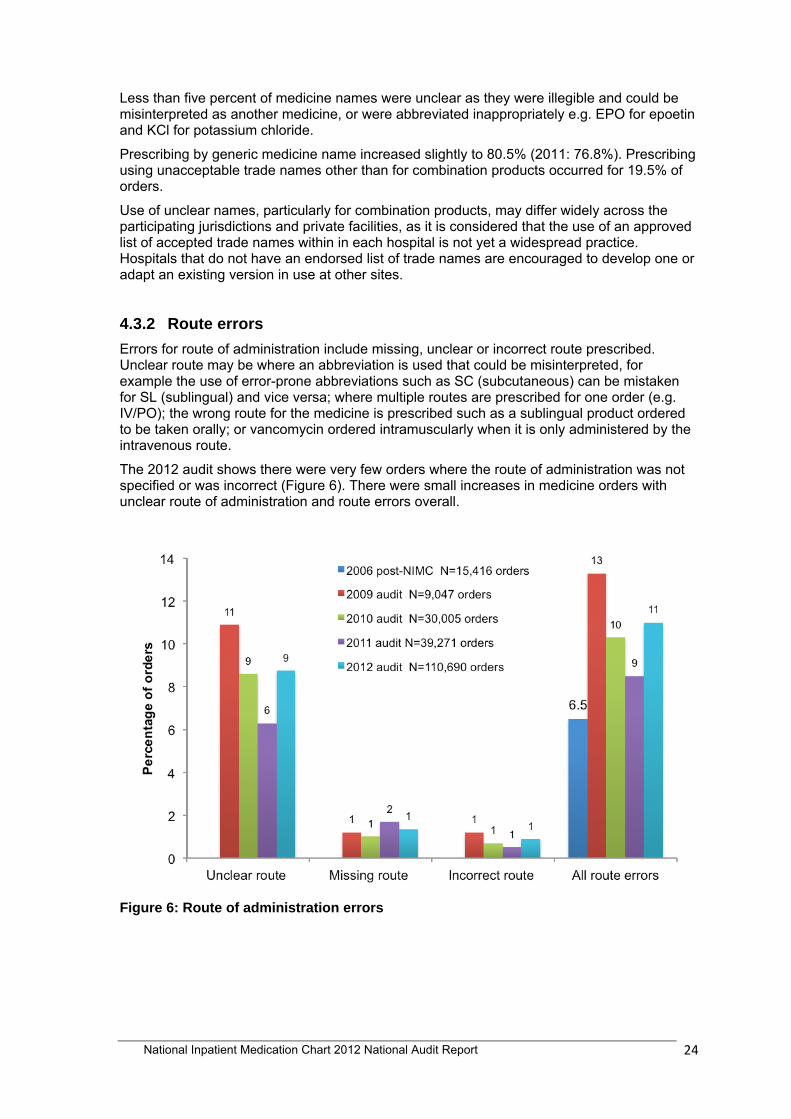
4.3.2 Route errors Errors for route of administration include missing, unclear or incorrect route prescribed. Unclear route may be where an abbreviation is used that could be misinterpreted, for example the use of error-prone abbreviations such as SC (subcutaneous) can be mistaken for SL (sublingual) and vice versa; where multiple routes are prescribed for one order (e.g. IV/PO); the wrong route for the medicine is prescribed such as a sublingual product ordered to be taken orally; or vancomycin ordered intramuscularly when it is only administered by the intravenous route.
The 2012 audit shows there were very few orders where the route of administration was not specified or was incorrect (Figure 6). There were small increases in medicine orders with unclear route of administration and route errors overall.
Figure 6: Route of administration errors
National Inpatient Medication Chart 2012 National Audit Report 24

Dose errors
Dose is assessed as unclear when metric and Arabic systems are not used, or error-prone abbreviations are used e.g.. u for units, mcg for microgram, or dose is ordered as one tablet when multiple tablet strengths are available.
Incorrect dose for the medicine is recorded when an incorrect dose is prescribed e.g. heparin 50,000 units subcutaneously BD instead of 5,000 units.
A small increase in all dose errors has been observed in 2012, due to an increase in orders with unclear dose (Figure 7). Nearly 12% of dose orders had an error compared to 9.5% in 2011. Unclear doses account for 10.2% of dosing errors, however orders with missing or incorrect dose remained at a low level, each less than 1%.
Figure 7: Dose errors
National Inpatient Medication Chart 2012 National Audit Report 25
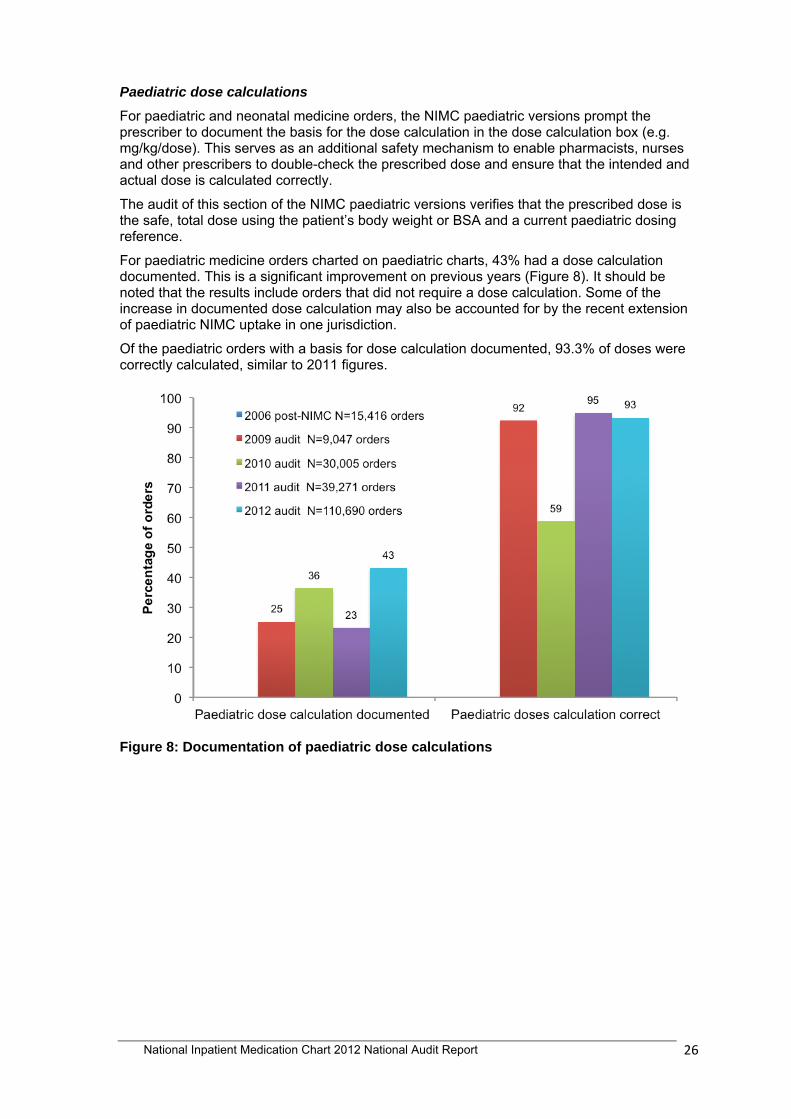
Paediatric dose calculations For paediatric and neonatal medicine orders, the NIMC paediatric versions prompt the prescriber to document the basis for the dose calculation in the dose calculation box (e.g. mg/kg/dose). This serves as an additional safety mechanism to enable pharmacists, nurses and other prescribers to double-check the prescribed dose and ensure that the intended and actual dose is calculated correctly.
The audit of this section of the NIMC paediatric versions verifies that the prescribed dose is the safe, total dose using the patient’s body weight or BSA and a current paediatric dosing reference.
For paediatric medicine orders charted on paediatric charts, 43% had a dose calculation documented. This is a significant improvement on previous years (Figure 8). It should be noted that the results include orders that did not require a dose calculation. Some of the increase in documented dose calculation may also be accounted for by the recent extension of paediatric NIMC uptake in one jurisdiction.
Of the paediatric orders with a basis for dose calculation documented, 93.3% of doses were correctly calculated, similar to 2011 figures.
Figure 8: Documentation of paediatric dose calculations
National Inpatient Medication Chart 2012 National Audit Report 26

4.3.3 Frequency errors Dosing frequency is unclear if illegible or error-prone abbreviations are used, or if a time interval in hours between doses is not specified. For example, Irbesartan 150mg qd is an unclear frequency as qd is an error-prone frequency abbreviation, easily confused with qid. Incorrect frequency is the wrong frequency for the medicine prescribed, for example Azithromycin 500mg IV BD as opposed to once daily.
There was an increase in all categories of dosing frequency errors compared to 2011, but fewer than in 2010 and 2009 (Figure 9). The majority of dosing frequency errors were reported as unclear and three percent did not specify any frequency for dose administration. Instructions for frequency of dosing were incorrect in less than one percent of orders.
Frequency errors were much higher for PRN orders (30%) than regular orders (7.3%). In nearly one third of PRN orders, frequency was not specified or was unclear or incorrect (e.g. no minimum hourly dose interval).
The audit report for 2011 noted that poor compliance related to prescribing frequency had occurred over two consecutive audits, and warranted investigation. Potentially an increased awareness of this requirement may have contributed to improvements in 2012. However, dosing frequency errors remain the most common type of prescribing error at 13.3%.
Figure 9: Frequency errors
National Inpatient Medication Chart 2012 National Audit Report 27

4.3.4 Communication of prescribing decisions To assess the overall clarity of prescribing decisions communication as documented on the NIMC, the audit results for the relevant critical elements of a medicine order are aggregated in Figure 10.1.
Figure 10.1: Communication of prescribing decisions
National Inpatient Medication Chart 2012 National Audit Report 28

There were fewer unclear orders in private facilities compared with public hospitals (Figure 10.2), but nevertheless an increase in both sectors.
Figure 10.2: Communication of prescribing decisions by hospital sector
The clarity of prescribing decision communication decreased in relation to unclear medicine name, route, dose and/or frequency, with unclear orders at 37.6%, and an increased use of error prone abbreviations compared with 2011. Documentation of indication remained low at <20%. Improvement is noted in the documentation of maximum 24 hour dose for PRN orders compared to 2011.
Unclear orders The error rate for unclear orders for medicine name, route, dose or frequency is higher than seen in 2011 but an improvement over the 2010 and 2009 audits. However, assessment of this measure is one of the more subjective of all the audit criteria, and the results need to be considered in the context of multiple auditors working across the 312 sites.
Documented administration times corresponding to prescribed frequency
Ninety-five percent of dosing administration times matched the prescribed frequency, a high level of compliance that has been maintained since the 2006 post-NIMC pilot. However, the clinical implications of five percent discrepancy in administration times (under or over-dosing) are not known, and this continues to represent a potential risk for adverse events.
Error-prone abbreviations The use of error-prone abbreviations increased in 2012 to 19.7% from 16.9% in 2011, and is higher in public hospitals compared to private facilities. However, the result remains lower than 2009 and 2010 and this may, in part, be attributed to increased awareness of the National terminology, abbreviations and symbols to be used in the prescribing and administration of medicines in Australian hospitals.12
There remains significant potential for misinterpretation of medicine orders with this level of error, and therefore scope for improvement.
National Inpatient Medication Chart 2012 National Audit Report 29

Documentation of indication The documentation of indication for prescribed medicines remains low at less than 20%. There was variability in compliance with the requirement between medicine order types: regular (12.7%), PRN (31.0%), variable (19.4%) and warfarin (58.4%). Indication was documented more commonly for medicine orders in public hospitals than in private facilities.
The importance of documenting indication on the NIMC from a patient safety perspective does not appear to be well recognised by prescribers and could be considered a future focus for practice change. Documented indication provides an additional safety element for subsequent prescribers, for pharmacists and nurses to check and ensure the correct medicine and appropriate dose has been ordered, and for educating the patient and preparing medicines lists.
PRN medicine orders When required or PRN medicine orders are prone to medicine errors due to the need for interpretation regarding dosing intervals and twenty-four hour maximum doses, as evidenced by prescribing error rates in 2012.
Although PRN frequency errors were halved between 2010 and 2011 (46.2% to 23.1%), an increased level of error has been measured in 2012.
Maximum daily dose to be given in twenty-four hours for PRN medicines continues to be poorly documented, with only approximately one-third of PRN orders complying with this requirement. It was more commonly documented in public facilities compared with private sites (39.6% vs. 23%) with both sectors demonstrating an improvement in 2012 over previous audits.
Ceased orders Of all ceased orders, only about one-third were ceased correctly in both the prescribing and administration sections of the chart, similar to 2011 and lower than 2010. Incorrectly ceased orders may cause unintentional harm to patients, and reducing this risk will require significant practice changes to meet the audit definition of correctly ceased orders.
National Inpatient Medication Chart 2012 National Audit Report 30

4.4 Documentation of professional responsibility 4.4.1 Prescriber signature and identifier Prescriber signature As prescriber signature is a legislative requirement for medicine orders, a high level of compliance with this feature of the NIMC is expected, and this has been confirmed in 2012 with 97% compliance achieved, and consistent results across public and private facilities (Table 6).
Prescriber identifier
Prescriber identification is assessed as clear if the prescriber has printed their name at least once on the medication chart. Moderately good compliance is achieved. Table 6: Orders signed by prescriber and with prescriber identification
Criterion
2006 post- NIMC pilot
2009 audit
2010 audit
2011 audit
2012 audit
% of medicine orders signed by prescriber
98.8% 97.2% 97.5%
95.7% Public = 96.3% Private = 94.3%
96.7% Public = 97.3% Private = 94.3%
Of the medicine orders with prescriber signature (each medicine order type), % where prescriber name is clear
78.3% 66.6% 79.5% 63.8% Public = 64.4% Private = 62.5%
69.1% Public = 71.1% Private = 62%
4.4.2 Pharmacist annotation and pharmaceutical review Pharmacist annotation An increase is evident for this audit criterion in 2012, although there is still an apparent gap in documentation of pharmacist annotation of medicine orders (Table 7). However, it is recognised that not all orders will require annotation, and this judgment is not factored in to the data collection.
The timing of NIMC auditing may also affect the results. For example, if auditing is done on a Monday, results will reflect the fact that patients admitted during a weekend may not yet have had their medicine orders reviewed by a clinical pharmacist if the hospital has limited pharmacy services, if any, over the weekends.
National Inpatient Medication Chart 2012 National Audit Report 31

Table 7: Pharmacist annotation and pharmaceutical review
Criterion 2006 post NIMC pilot
2009 2010 2011 2012
Medicine orders with pharmacist annotation
36.2% (≥1 order
annotated)
26.6% 33.5% 26.8% 34.03%
Patients with at least one pharmaceutical review documented in medication charts
N/A
39.9%
38.3%
34.3%
38.21%
Public = 39.7% Private = 33.3%
Pharmaceutical review The NIMC has provision for clinical pharmacists to record that medicine orders have been reviewed by initialling the pharmaceutical review box for each day on the chart. The audit measures the percentage of patients who have had at least one pharmaceutical review documented in the current NIMC.
The result for this criterion has remained at similar levels of 34-40% across all audits since 2009, and is slightly higher in public hospitals than private facilities (2012: 39.7%, 33.3% respectively).
4.4.3 Recording of medicine doses administered Documenting doses administered requires clinician initials for each dose given or use of the NIMC administration reason code when a dose could not be administered.
The audit measures doses that are recorded as administered as a percentage of doses that should have been documented as given.
The percentage of doses omitted or not initialled has not reduced over the audit period, and results are consistent across public and private facilities (Table 8). Although some improvement is noted in private hospitals for 2012, the overall error rate of 9.9% is considered a significant risk, and a reduction of this result is essential to minimise the potential for avoidable adverse medicine events from omitted or duplicated doses.
Table 8: Dose administration not initialled, or assumed omitted
Criteria 2006 post- NIMC pilot
audit 2009 2010
2011
2012
Of the doses required (regular, stat only, variable, warfarin), % of doses omitted or administration not signed
(excludes PRN orders)
8.3% 9.6% 11% 9.3% Public = 9.1% Private = 9.8%
9.9% Public = 10.3% Private = 8.5%
National Inpatient Medication Chart 2012 National Audit Report 32

5. Summary
The NIMC 2012 National Audit demonstrated ongoing high levels of compliance with important NIMC safety features which reduces the opportunity for error and improves patient safety. However, and as in previous audits, the report also highlights areas of poor performance where there is scope for further improvement.
Data for the audit were provided by 312 hospitals (241 public hospitals, 71 private hospitals) from all states and territories. A total of 13,881 patients’ charts were audited and 110,690 medicine orders reviewed. The three-fold increase in data available for analysis, compared to 2011, provides a broader, more representative national perspective than previous years.
Improvements in safe prescribing practices can be attributed to the chart design and layout, supported by educational strategies and tools that promote safe practice. For example, the introduction of the national Recommendations for Terminology, Abbreviations and Symbols used in the Prescribing and Administration of Medicines 12 in 2008 may have contributed to the decrease in some prescribing errors seen in the 2011 and 2012 audits.
Examples of sustained high levels of compliance (>85%) noted from the 2012 audit include:
• dose specified and correct • route specified, clear and correct route • correct dose calculations for paediatric medicine orders • prescribing frequency matched to times of administration • medicines of a similar class not prescribed (duplicated orders) • orders signed by prescriber.
Examples of similar or improved compliance with the safety features of the NIMC are:
• clear medicine name, use of generic medicine name • PRN maximum dose documented • paediatric dose calculation documented • intermittent dosing blocked/crossed out • ADR history details documented • warfarin indication documented.
Features of the NIMC where an obvious reduction in compliance or continuing poor compliance, and scope for further significant improvement have been found are:
• complete patient identification • documentation of weight • warfarin prescribing in warfarin section • documentation of target INR for warfarin orders • documentation of patient warfarin education • documentation of PRN maximum 24 hour dose • documentation of indication • sustained release dosage forms of medicines identified • use of error-prone abbreviations • documentation of dose administration • orders ceased correctly.
Table 10 summarises some of the key results to demonstrate trends for specific NIMC features.
National Inpatient Medication Chart 2012 National Audit Report 33

Table 9: Examples of trends in compliance with the safety features of the NIMC
Rate of compliance (%) Criteria for safe prescribing 2006
N= 1,234* 2009
N=864* 2010
N=2,591* 2011
N=3,760* 2012
N=9,689*
Improved compliance
Warfarin orders with indication documented 34.3 60.9 70.0 43.2 58.4
Orders with medicine prescribed by generic name 73.0 80.2 78.8 73.5 80.5
Intermittent medicine orders with administration correctly blocked n/a 59.5 78.2 71.6 77.2
Scope for significant improvement
Patients with identification completed (all patients) 19.8 31.3 32.8 47.6 45.6
Patients’ weight documented 19.1 23.1 24.4 24.0 24.4
Patients with medication history documented on NIMC or Medication Management Plan
9.0 13.1 33.8 27.0 31.6
Warfarin education documented for patients prescribed warfarin 11.0 10.0 12.6 15.0 15.0
Orders with indication documented 22.8 14.5 20.2 11.3 17.8
Orders with error prone abbreviations used n/a 22.6 24.6 16.9 19.7
Orders ceased correctly n/a 24.0 50.0 35.3 36.0
Dose administration not documented 8.3 9.6 11.0 9.3 9.9
Decreased compliance in 2012
Unclear orders for medicine name, route, dose or frequency n/a 49.0 38.0 24.0 37.6
Warfarin orders prescribed in warfarin section with target INR range documented
34.3 69.6 95.7 n/a 70.2
PRN orders frequency errors n/a 36.0 46.0 23.0 30.0
Sustained release medicine orders that have SR form identified
37.7 46.4 61.3 54.0 57.6
*N = number of patients, ** n/a =data not available The increasing use of the NPS MedicineWise-hosted NIMC online learning tool by universities and hospitals may be contributing to improvements in the quality of prescribing. Table 9 shows the continuing increase in uptake of the online training modules.
National Inpatient Medication Chart 2012 National Audit Report 34

Table 10: NIMC online training data (at April 2013)
Course completion 01/11/2006 to
01/11/2010 (4 years)
01/12/2010* to 30/06/2011 (7 months)
01/07/2011 to 30/06/2012
(12 months)
01/07/2012 to 31/03/2013 (9 months)
Commenced course 6,841 2,093 7,328 9,395
Completed all 6 core modules 4,652 1,639 6,472 7,874
Completed all modules plus paediatrics module n/a 1,255 5,117 4,845
*course completely revised and re-written in 2010; new course introduced from December 2010 Source: NPS MedicineWise 2013
The 2012 audit data for individual NIMC safety features shows the NIMC continues to have a variable effect on some aspects of prescribing and administration safety since its introduction in 2006-07, with improvements in the use of some safety features, and continuing poor performance in others and an associated ongoing risk of medicine errors and adverse medicine events.
Variances may in part be due to:
• local and state-wide initiatives implemented to improve the quality of prescribing
• the extent of education and training provided on NIMC rationale and use
• use of non-conforming medication charts limiting the rate of NIMC incorporation into health professional curricula
• the stage of the hospital in the NIMC quality improvement cycle – in 2012 many hospitals participated in the national audit for the first time, so are establishing baseline results on which to initiate improvements
• inconsistency between auditors.
National Inpatient Medication Chart 2012 National Audit Report 35

5.1 Prescription documentation
The 2012 audit data shows an increase in prescribing error rates compared to 2011 for a number of the audit criteria (Table 11) but is similar to, or better than, 2010. Opportunities for medicine errors and possible adverse medicine events remain as a result of incomplete or unclear communication of prescribing decisions.
Table 11: Examples of prescribing error rates
Audit results (% of medicine orders) Criteria for missing, incorrect or unclear medicine orders
2006 N = 15,416
orders
2009 N = 9,047
orders
2010 N =
30,005 orders
2011 N =
39,271 orders
2012 N = 110,690
orders
Unclear orders for medicine name, route, dose and frequency
74.0# 49.4 37.8 24 37.6 Public: 39.7 Private: 30.4
Unclear medicine names prescribed 3.0 7.6 4.0 3.3 3.6
Route errors (missing, unclear, incorrect) 6.5 13.3 10.3 8.5 11.0
Dose errors (missing, unclear, incorrect) Dose unclear only
4.3 n/a
18.4 16.4
14.2 13.1
9.7 8.2
11.8 10.2
Frequency errors (missing, unclear, incorrect) PRN frequency errors only
15.5
32.2
20.0
35.6
19.6
46.2
10.9
23.1
13.3
30.0
Error prone abbreviations used n/a 22.6 24.6 16.9 19.7
PRN orders with max dose documented
n/a n/a 42.5 26.8 35.5
Orders ceased correctly n/a 24.1 49.5 35.3 36.0 #Medicine orders
The communication of prescribing decisions is similar in error rates to previous audits in relation to medicine name, dose, route and frequency. Total error rates (missing, unclear, incorrect) for route, dose and frequency were slightly higher than in the 2009-2011 audits.
Dosing frequency errors for PRN orders increased compared to 2011 but remains lower than other audit years.
Fewer medicine orders were reported unclear in private facilities compared with public hospitals.
National Inpatient Medication Chart 2012 National Audit Report 36

5.2 Documentation by health profession
Prescriber signature and identifier
Medicine orders containing the prescriber’s signature continue to at a high compliance level of 96.7%. However only 69.1% of orders included a printed prescriber name and/or contact details.
Providing prescriber contact information on the medication chart enables other healthcare staff to contact the prescriber for clarification or confirmation of orders. It is a mechanism for timely resolution of problems and can avert unnecessary delays to treatment or errors related to misinterpretation of orders.
Pharmacist annotation and pharmaceutical review Pharmacist annotation is observed as low, at 34% of orders with pharmacist clarification documented. While the low rate may indicate a resourcing issue with pharmacists not available to review charts on the wards (i.e. the number or frequency of chart reviews), or poor documentation by pharmacists, or the timing of the audit data collection in relation to pharmacist ward rounds, this criterion needs to be interpreted in the context that not every medicine order would require an annotation. Review of this indicator to measure the rate of pharmacist annotation for orders requiring clarification may need to be considered (i.e. as a percentage of unclear orders rather than total orders).
Similar reasoning could also apply to the level of pharmaceutical review documentation, with 38.2% of patients’ charts recording at least once that a pharmaceutical review has occurred, an increase from 2011 (34%). Data for public hospitals for 2012 shows a variation between jurisdictions ranging from 21.7 to 46.6%.
Additional considerations may relate to health professional understanding of the purpose of signing for pharmaceutical review, when individual medicine orders are also signed by the pharmacist. Concerns related to the implications of signing for pharmaceutical review, and when orders may subsequently be altered, may need to be addressed through education on what is intended by noting that pharmaceutical review has occurred and to improve understanding of this aspect of the chart.
Recording of medicine doses administered
Almost ten percent of medicine doses were missing initials for administration by staff, a similar rate to 2009, 2010 and 2011. Note that this figure excludes doses that have a “reason for not administering” code documented.
Omitting to sign for doses administered remains at a high level of non-compliance, and increases the risk of omitted doses, double dosing and adverse patient outcomes. Documenting that medicine has been administered according to prescriber orders requires improvement. Education strategies and work practice changes should target the need for further improvement in this practice area.
National Inpatient Medication Chart 2012 National Audit Report 37

5.3 Compliance with NIMC safety features
The design of the NIMC includes a range of safety features that were derived from an analysis of common medicine errors. Compliance with the NIMC safety features is variable, and although there have been improvements over several years in the use of most features, the benefits of these may only be fully realised through the use of electronic prescribing systems that contain forcing functions for mandatory completion of these fields. Table 12 summarises the level of compliance with these features determined from the 2012 audit results. Several of these features align with the National Safety and Quality Health Service Standards. Table 12: Compliance with NIMC safety features indicating that further improvement is needed
Medicine error Safety feature Alignment with NSQHS Standards
Areas requiring improvement in performance related to compliance with NIMC safety features
Patient wrongly identified and receives unintended medicine
Prompt for complete patient identification (ID) on top of page 3 and back page Prompt for prescriber to print name below computer generated ID label The requirement for complete patient ID aligns with National Safety and Quality Health Service (NSQHS) Standard 5 – Patient ID and procedure matching Item 5.1
<50% patients have complete ID documented
Dosing error due to lack of patient weight to inform decision
Prompt for patient weight <25% of all patients had weight documented on the NIMC
Re-exposure of patients to a similar class of medicine previously causing an ADR
Prompt for details of medicines and description of ADR This safety feature aligns with NSQHS Standard 4 Medication Safety. Item 4.7
21.5% of charts had no documentation of previous ADR (medicine name and reaction or nil known) 11.2% of patients with at least one or more previous ADRs were re-prescribed a similar class of medicine
Discontinuity of appropriate therapy, or inappropriate recommencement of previously ceased medicine
Addition of medication history section Medication history documentation aligns with NSQHS Standard 4 Medication Safety. Item 4.6
Recording of patient medication history on MMP or equivalent remained low (31.6%) Medication history documented on MMP form - 16.6% of patients
Warfarin dose and duration errors
Designated section of chart prompts for indication and target INR. INR can be documented in dosing section This aligns with NSQHS Standard 4.13 and 4.15 and Safety Outcome 1.15 in Australian Safety and Quality Goals for Health Care.
51.3% of warfarin orders were not prescribed in warfarin section. Low compliance in using the warfarin section of the NIMC may be influenced by prescribing practice in private facilities (37.7% of patients versus 52.5% of public patients on warfarin). <60% of all warfarin prescriptions had an indication recorded - private
National Inpatient Medication Chart 2012 National Audit Report 38

Medicine error Safety feature Areas requiring improvement in performance related to Alignment with NSQHS compliance with NIMC safety Standards features facilities (34.6%) compared to public hospitals (64.2%). 30% of warfarin orders were missing a documented target INR. 85% of patients prescribed warfarin had no record of receiving warfarin education.
Ambiguous trade names
Prompt for generic names 19.5% of medicines were prescribed using trade names. There was a slight decrease in the use of trade names compared with 23.2% in 2011. The result should be interpreted with caution as the list of approved combination and trade names may differ between facilities and hospital sector.
Non-sustained release form administered or SR form inadvertently crushed
Prompt for tick if slow release medicine Explanation in centre of chart for nurses not to crush SR forms of medicines
42% of orders for sustained release products did not have the SR box completed
Lack of, or unclear, dosing instructions
Designated dose and frequency section. Prompt for prescriber to enter dosing times as well as frequency for regular medicines Recommended administration times included on medication chart
37.6% of orders were unclear for medicine name, route, dose or frequency 22.8% of orders for intermittent dosing administration were not blocked correctly 20% of orders used error-prone abbreviations 73% of orders not ceased correctly or clearly 43.1% of paediatric doses had the calculation documented on the chart. (Note that some paediatric medicines do not require a dose calculation) Of the paediatric orders with dose calculation 93.3% of doses were correctly calculated
PRN medicine dosing errors
Forcing function to enter minimum number of hours between doses (hourly frequency) and maximum dose within 24 hours
30% of PRN orders had a missing, incorrect and/or unclear dose frequency 64.5% of PRN orders did not have a maximum dose in 24 hours recorded
Medicine or dose prescribed, dispensed or administered inconsistent with indication
Prompt for medicine indication added to regular and PRN orders
<18% of medicine orders (excluding stat only) had the indication documented
National Inpatient Medication Chart 2012 National Audit Report 39

Medicine error Safety feature Areas requiring improvement in performance related to Alignment with NSQHS compliance with NIMC safety Standards features
Inability to clarify error with prescriber
Prompt for prescriber to print name and enter contact details
Prescriber name was unclear in 30.9% of orders
Omission of dosing or duplicate dosing
Recommended administration times included on medication chart Designated area to sign when each dose is administered
10% of doses assumed omitted or administration not signed
National Inpatient Medication Chart 2012 National Audit Report 40
5.4 Limitations of audit methodology and data
The principal aim of the audit, from the perspective of participating hospitals, is to provide data that can support internal quality improvement strategies. Repeated involvement in audits enables hospitals to measure trends in performance that will identify gaps in practice, and areas for improvement in prescribing and administration of medicines that may guide targeted education programs and other evidence-based interventions.
The audit includes several assumptions that need to be made in assessing the data:
• that all participating hospitals used a conforming NIMC, and audited active charts across different types of wards as described in the audit criteria, and have used the recommended sampling method
• that, based on established evidence, the safety features of the NIMC when used correctly are effective in preventing medicine errors and associated adverse events.
Limitations associated with the audit are described here, and need to be taken into account when interpreting and using the audit results.
Aggregated data, hospital and patient demographics All participating hospitals undertake the NIMC national audit on a voluntary basis as a quality improvement initiative. As a result, the hospitals in the 2006 pilot and those in the 2009 to 2012 audits are unmatched.
Private hospital participation in NIMC national auditing was 2.89% of participating hospitals in 2010 (and 2.31% of patients audited) and increased in the 2011 national audit to 26.38% of participating hospitals (and 31.03% of patients audited). Private hospital participation in the 2012 national audit was 22.75% of participating hospitals (and 23.05% of patients audited).
The 2012 audit data were provided by 241 public hospitals and 17 private facilities. Given that 23% of the patients and 22% of medicine orders in 2012 reflect practices in private facilities, the aggregated results may not be a true representation across all jurisdictions for both the public and private hospital sectors. However, at a national level the three-fold increase in data available for analysis has provided a more representative pool of data to analyse.
There was a low participation rate by specialist women’s and children’s hospitals, large regional and remote facilities, and rehabilitation hospitals contributing to the 2012 data, which limits separate evaluation of the safety features of the NIMC in these settings and the ability to detect variation according to sub-category. Limitation: Ability to compare individual hospital results against the national aggregated data is limited as the patient and hospital demographics vary considerably between each audit, and between jurisdictions.
Sampling method
Ideally, all active patient medication charts should be reviewed at the time of auditing. However, due to resource and time constraints, a representative sample size based on occupied bed numbers can be audited by each participating hospital. Where sampling is used, the selection of clinical units within each hospital may introduce factors that can influence audit results, for example, variance in the complexity and volume of prescribing. These factors are not taken into account in this report. Also, the audit does not require data to be collected at a site level in relation to the total number of medicine orders/charts/patients in hospital at the time of the audit.
Limitation: True incidence of prescribing errors and the incidence of medicine errors as a proportion of all medicine orders cannot be extrapolated from the audit data.
National Inpatient Medication Chart 2012 National Audit Report 41

Medicine orders The data on medicine orders was predominantly from regular (61.4%) and PRN (21.9%) orders, with considerably less information on warfarin and variable dose orders due to a lower frequency of use of this type of order.
Limitation: Level of compliance with some NIMC safety features of warfarin, VTE prophylaxis and variable dose orders is based on small numbers, and this limits the ability to generalise the interpretation of results to widespread prescribing practice.
Audit timing The audit is a snapshot of medicine orders at a single point in time, and results can be influenced by a number of extrinsic factors such as medical staff rosters and term rotations, errors that have been addressed immediately prior to the audit e.g. through clinical pharmacist intervention, and the impact of local and/or national strategies that may have been implemented since the previous audit. For example, the introduction of the national Recommendations for Terminology, Abbreviations and Symbols used in the Prescribing and Administration of Medicines12 in 2008 may have contributed to a reduction in the incidence of unclear orders for medicine name, route, dose and frequency that included error-prone abbreviations.
Limitation: Extent of influence of changes that may have been introduced locally or nationally between each audit is not captured through the audit process, but needs to be borne in mind by individual sites when interpreting audit results.
Audit definitions As part of the ongoing quality improvement processes associated with auditing, changes to audit definitions are made with successive audits based on lessons learned, in order to better capture data or to control for variability, and to increase the degree of rigour for subsequent audits.
Limitation: Revision of many audit definitions, and increased rigour in the audit terminology over the six years since the NIMC pilot, may affect comparability of audit results.
Interpretation of audit criteria
Some of the audit criteria require subjective judgement and interpretation by the auditors, for example in determining unclear orders and/or assessing completeness of documentation (e.g. patient identification complete on all pages of each NIMC, complete ADR documentation on all charts). Also, the audit does not seek to measure the clinical significance of the medicine errors measured nor the effect in terms of patient outcomes.
Limitation: Lack of consistency in interpretation of audit criteria by the auditors, and differences in local policy/procedures between hospitals and jurisdictions (e.g. presence of warfarin guidelines at end of patient’s bed or with medication chart) may limit the consistency and comparability of audit results.
National Inpatient Medication Chart 2012 National Audit Report 42

5.5 Recommendations
Reports of previous NIMC national audits have included strategies to improve the use of the NIMC safety features, and recommendations related to the audit process for incorporation into future audits. The strategies are considered by the Health Services Medication Expert Advisory Group, and have been actioned, or are ongoing work in progress.
The NIMC 2012 National Audit Report focuses solely on audit outcomes and comparison with earlier national audits. A supplementary report will discuss outcomes in relation to health professional behaviours and potential health service organisation quality improvements. Recommendations on future auditing will also be made in the supplementary report.
National Inpatient Medication Chart 2012 National Audit Report 43

National Inpatient Medication Chart 2012 National Audit Report 44
6. Conclusion
The NIMC 2012 National Audit provides a snapshot of NIMC use in 312 public and private hospitals across Australia. It contributes data and information on inpatient medicine orders which will guide improvements in practice and that can further reduce the incidence of preventable adverse medicine events.
The audit demonstrated ongoing high levels of compliance with important NIMC safety features which reduces the opportunity for error and improves patient safety. However opportunities remain for improving performance with certain safety features where there is continuing low compliance.
The 2012 audit is a more representative sample compared with earlier audits, comprising 9,689 patients and 110,690 medicine orders. It has added significantly to the time series of data, and highlighted areas of good compliance with NIMC safety features, as well as identifying areas that need further improvement.
Benefits from the national NIMC audit can be identified at all levels across the healthcare system: patient, hospital, jurisdictional and national.
Strategies for addressing areas of poor performance include raising awareness about resources available to support safe prescribing and administration of medicines, and education of healthcare professionals on medicine safety risks and issues. These will be discussed, and recommendations made, in the NIMC 2012 National Audit supplementary report.
Ongoing evaluation of the use of the NIMC provides information at a national and local level on the safety of prescribing, dispensing, administration and review of medicine orders. This information can be used effectively to focus on targeted quality improvement activities and evidence-based interventions, and to monitor their effect on reducing the risk of harm to patients from medicine errors.

National Inpatient Medication Chart Appendix 1
National Inpatient Medication Chart 2012 National Audit Report 45

National Inpatient Medication Chart 2012 National Audit Report 46

Appendix 2
National Inpatient Medication Chart 2012 National Audit Report 47 47 National Inpatient Medication Chart 2012 National Audit Report

48 National Inpatient Medication Chart 2012 National Audit Report

References 1. Australian Council for Safety and Quality in Health Care. Second national report on
patient safety: improving medication safety. Canberra: Commonwealth of Australia; 2002.
2. Australian Commission on Safety and Quality in Health Care. Safety and Quality
Improvement Guide Standard 4: Medication Safety (October 2012). Sydney. ACSQHC, 2012.
3. Coombes I, Reid C, McDougall D, Stowasser D, Duguid M, Mitchell C. Pilot of a national
inpatient medication chart in Australia: improving prescribing safety and enabling prescribing training. British Journal of Clinical Pharmacology 2011;72(2):338-49.
4. Australian Commission on Safety and Quality in Health Care (2012). National Inpatient
Medication Chart Audit Tool. 2009 (NIMC_v7_Dec10_National) 5. Australian Commission on Safety and Quality in Health Care (2012). National Inpatient
Medication Chart Audit Spreadsheet. 6. Australian Commission on Safety and Quality in Health Care (2012). Guide to Auditing
the National Inpatient Medication Chart. 2009 (updated 2012). 7. Australian Commission on Safety and Quality in Health Care (2009). The National
Inpatient Medication Chart User Guide - January 2012. 8. Australian Institute of Health and Welfare 2012. Australia’s hospitals 2010–11, at a
glance. Health services series no. 44. Cat. no. HSE 118. Canberra: AIHW 9. Australian Institute of Health and Welfare 2012. Australian hospital statistics 2010–11.
Appendix 2: Technical Appendix. Health services series no. 43. Cat. no. HSE 117. Canberra: AIHW
10. World Health Organisation’s High 5s Medication Reconciliation Project – assuring
medication accuracy at transitions in care 2006. https://www.high5s.org/bin/view/Main/WebHome
11. Australian Commission on Safety and Quality in Health Care. National terminology,
abbreviations and symbols to be used in the prescribing and administering of medicines in Australian hospitals. 2008 (updated January 2011).
12. Australian Commission on Safety and Quality in Health Care 2012. National Inpatient
Medication Chart 2011 National Audit Report, ACSQHC, Sydney.
National Inpatient Medication Chart 2012 National Audit Report 49