NIKE, INC. COMPANY REPORT - run.unl.pt · Nike’s overall command of the U.S. shoe market is...
31
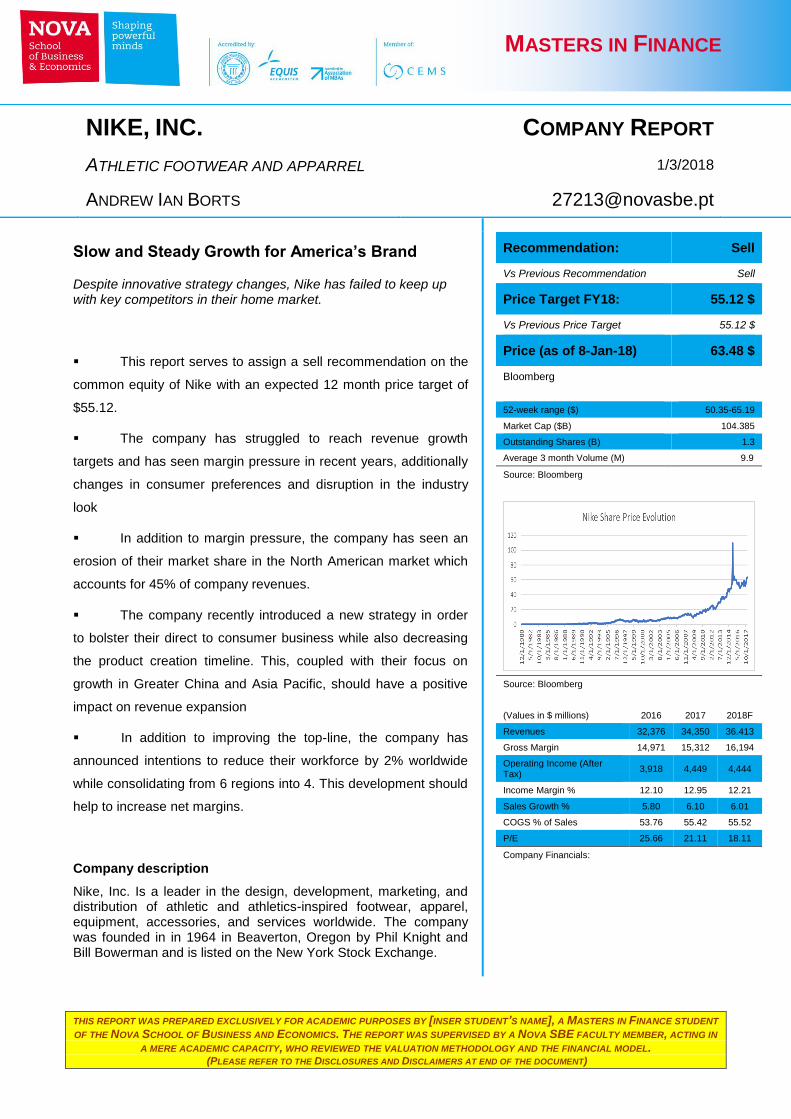
THIS REPORT WAS PREPARED EXCLUSIVELY FOR ACADEMIC PURPOSES BY [INSER STUDENT’S NAME], A MASTERS IN FINANCE STUDENT OF THE NOVA SCHOOL OF BUSINESS AND ECONOMICS. THE REPORT WAS SUPERVISED BY A NOVA SBE FACULTY MEMBER, ACTING IN A MERE ACADEMIC CAPACITY, WHO REVIEWED THE VALUATION METHODOLOGY AND THE FINANCIAL MODEL. (PLEASE REFER TO THE DISCLOSURES AND DISCLAIMERS AT END OF THE DOCUMENT) MASTERS IN FINANCE ▪ This report serves to assign a sell recommendation on the common equity of Nike with an expected 12 month price target of $55.12. ▪ The company has struggled to reach revenue growth targets and has seen margin pressure in recent years, additionally changes in consumer preferences and disruption in the industry look ▪ In addition to margin pressure, the company has seen an erosion of their market share in the North American market which accounts for 45% of company revenues. ▪ The company recently introduced a new strategy in order to bolster their direct to consumer business while also decreasing the product creation timeline. This, coupled with their focus on growth in Greater China and Asia Pacific, should have a positive impact on revenue expansion ▪ In addition to improving the top-line, the company has announced intentions to reduce their workforce by 2% worldwide while consolidating from 6 regions into 4. This development should help to increase net margins. Company description Nike, Inc. Is a leader in the design, development, marketing, and distribution of athletic and athletics-inspired footwear, apparel, equipment, accessories, and services worldwide. The company was founded in in 1964 in Beaverton, Oregon by Phil Knight and Bill Bowerman and is listed on the New York Stock Exchange. NIKE, INC. COMPANY REPORT ATHLETIC FOOTWEAR AND APPARREL 1/3/2018 ANDREW IAN BORTS [email protected] Slow and Steady Growth for America’s Brand Despite innovative strategy changes, Nike has failed to keep up with key competitors in their home market. Recommendation: Sell Vs Previous Recommendation Sell Price Target FY18: 55.12 $ Vs Previous Price Target 55.12 $ Price (as of 8-Jan-18) 63.48 $ Bloomberg 52-week range ($) 50.35-65.19 Market Cap ($B) 104.385 Outstanding Shares (B) 1.3 Average 3 month Volume (M) 9.9 Source: Bloomberg Source: Bloomberg (Values in $ millions) 2016 2017 2018F Revenues 32,376 34,350 36.413 Gross Margin 14,971 15,312 16,194 Operating Income (After Tax) 3,918 4,449 4,444 Income Margin % 12.10 12.95 12.21 Sales Growth % 5.80 6.10 6.01 COGS % of Sales 53.76 55.42 55.52 P/E 25.66 21.11 18.11 Company Financials:
Transcript of NIKE, INC. COMPANY REPORT - run.unl.pt · Nike’s overall command of the U.S. shoe market is...
THIS REPORT WAS PREPARED EXCLUSIVELY FOR ACADEMIC PURPOSES BY [INSER STUDENT’S NAME], A MASTERS IN FINANCE STUDENT
OF THE NOVA SCHOOL OF BUSINESS AND ECONOMICS. THE REPORT WAS SUPERVISED BY A NOVA SBE FACULTY MEMBER, ACTING IN
A MERE ACADEMIC CAPACITY, WHO REVIEWED THE VALUATION METHODOLOGY AND THE FINANCIAL MODEL. (PLEASE REFER TO THE DISCLOSURES AND DISCLAIMERS AT END OF THE DOCUMENT)
MASTERS IN FINANCE
▪ This report serves to assign a sell recommendation on the
common equity of Nike with an expected 12 month price target of
$55.12.
▪ The company has struggled to reach revenue growth
targets and has seen margin pressure in recent years, additionally
changes in consumer preferences and disruption in the industry
look
▪ In addition to margin pressure, the company has seen an
erosion of their market share in the North American market which
accounts for 45% of company revenues.
▪ The company recently introduced a new strategy in order
to bolster their direct to consumer business while also decreasing
the product creation timeline. This, coupled with their focus on
growth in Greater China and Asia Pacific, should have a positive
impact on revenue expansion
▪ In addition to improving the top-line, the company has
announced intentions to reduce their workforce by 2% worldwide
while consolidating from 6 regions into 4. This development should
help to increase net margins.
Company description
Nike, Inc. Is a leader in the design, development, marketing, and distribution of athletic and athletics-inspired footwear, apparel, equipment, accessories, and services worldwide. The company was founded in in 1964 in Beaverton, Oregon by Phil Knight and Bill Bowerman and is listed on the New York Stock Exchange.
NIKE, INC. COMPANY REPORT
ATHLETIC FOOTWEAR AND APPARREL 1/3/2018
ANDREW IAN BORTS [email protected]
Slow and Steady Growth for America’s Brand
Despite innovative strategy changes, Nike has failed to keep up with key competitors in their home market.
Recommendation: Sell
Vs Previous Recommendation Sell
Price Target FY18: 55.12 $
Vs Previous Price Target 55.12 $
Price (as of 8-Jan-18) 63.48 $
Bloomberg
52-week range ($) 50.35-65.19
Market Cap ($B) 104.385
Outstanding Shares (B) 1.3
Average 3 month Volume (M) 9.9
Source: Bloomberg
Source: Bloomberg
(Values in $ millions) 2016 2017 2018F
Revenues 32,376 34,350 36.413
Gross Margin 14,971 15,312 16,194
Operating Income (After Tax)
3,918 4,449 4,444
Income Margin % 12.10 12.95 12.21
Sales Growth % 5.80 6.10 6.01
COGS % of Sales 53.76 55.42 55.52
P/E 25.66 21.11 18.11
Company Financials:
NIKE, INC. COMPANY REPORT
PAGE 2/31
Table of Contents
Executive Summary……………………………………………..………………………1
Valuation………………………………………………………………………………….3
Company Overview……………………………………………………………………..5
Shareholder Structure………………………………………………………………....12
Sector/Macro Analysis………………………………………………….……………..13
Risk Analysis……………………………………………………………………...……20
Strategy Commentary………………………………………………………..………..24
Liquidity and Solvency Analysis………………………………………………..…….26
Exhibits………………………………………………………………………………….27
Disclosures……………………………………………………………………………..29

NIKE, INC. COMPANY REPORT
PAGE 3/31
Valuation
In valuing the equity of Nike, a two-prong approach was taken. First a Discounted
Cash Flow model was constructed in order to value the company based on
projections of internal metrics. Secondly, a relative multiples analysis was
conducted in order to value the company relative to its peers based on key
performance and operating metrics.
DCF:
The discounted cash flow model took into account company and analyst
projections for growth as well as an overall analysis over the macroeconomic
environment and its potential impacts on the industry and company. A detailed
breakdown of the assumptions used in the model can be found in the appendix.
Model Results:
The DCF Model determined that the fair value of the company’s equity was
approximately $55.12. This gives reason for a sell rating on the common equity of
Nike. While there are several scenarios under which the findings of the DCF
model could have returned a different value, the most common scenario is that
growth would actually not live up to company forecasts and thus free cash flow
would not grow significantly beyond current estimates.
Sensitivity:
As a sensitivity analysis, top-line growth was reduced in key markets such as
Greater China and APAC to represent the potential for growth in these areas that
does not live up to expectations. Additionally, Cost of Goods Sold was increased
to represent the potential for additional trade tariffs or an increase in friction in
international trade. Under both of these scenarios, the value of Nike’s equity
decreased and reinforced our sell recommendation.

NIKE, INC. COMPANY REPORT
PAGE 4/31
Multiples Valuation:
Overvalued. Based on a selection of fourteen industry peers, the relative multiples
valuation indicates the Nike’s common equity is currently overvalued. Nike’s Price
to Earnings ratio, indicates that it is currently trading at a significant premium vs its
peer companies. Additionally, at 26.0851, Nike is also trading at a premium to the
wider S&P 500 index (25.49). When considering this and other multiples, and
acknowledging that Nike has exhibted weak top-line growth and margin pressure
in recent years, the multiples valuation clearly indicates that Nike is currently
trading at a level which is unsubstantiated by fundamentals.
Price to Earnings Ratio: Nike has a P/E ratio significantly higher than the peer
average, suggesting that Nike’s equity is currently trading at a level which is not
supported by earnings. Nike’s P/E ratio has retreated a bit since reaching a high
during 2015, however, it still sits significantly above the peer average.
Price to Cash Flow: Similarly to P/E, Nike’s P/CF ratio is currently at a premium
to that of it’s peers.
EV to EBITDA: Nike’s EV/EBITDA of 15.87 is nearly 50% greater than the
industry average. The company has exhibited EBITDA growth that lags behind
their closest peers.
Price to Sales: Nike’s Price to sales ratio is also currently nearly twice that of the
industry average.
Sales Growth %: One of the greatest causes for concern is Nike’s stagnant sales
growth. As seen in the exhibit Nike’s sales growth falls significantly behind that of
their closest peers.
Profit Margin: The indicator which Nike performs most favorably in is their profit
margin, 10.47%, which is currently above the industry average. Despite currently
being above the industry average, they have faced some margin pressure and
have had difficulty expanding their margins in recent years.
Mean Nike
P/E Ratio 20.87 26.09
Sales Growth 2.06% 0.10%
P/CF Ratio 14.35 28.96
EV/EBITDA 10.77 15.87
P/S Ratio 1.59 2.94
Profit Margin 10.60 10.47
Operating Margin 14.12 12.19
NIKE, INC. COMPANY REPORT
PAGE 5/31
Company Overview
Nike, Inc. Is a leader in the design, development, marketing, and distribution of
athletic and athletics-inspired footwear, apparel, equipment, accessories, and
services worldwide. The company’s wide-array of products can be generally
broken down into nine categories: running, NIKE basketball, the Jordan brand,
football, men’s training, women’s training, action sports, sportswear, and golf. In
addition to these core areas, the company markets products designed specifically
for kids as well as sports specific products including but not limited to cricket,
lacrosse, tennis, volleyball, wrestling, walking, and outdoor activities. One of the
company’s major strengths lies in its partnerships and licensing deals with various
collegiate and professional athletic programs. Outside of the apparel space, the
company also sells various performance equipment items including bags, socks,
gloves, protective equipment, and other equipment for sports activities.
In addition to the core businesses previously mentioned, the company’s wholly-
owned subsidiaries including Converse Inc., which designs, markets, and
distributes athletic and casual footwear, apparel and accessories, and Hurley
International LLC, which designs markets and distributes action sports and youth
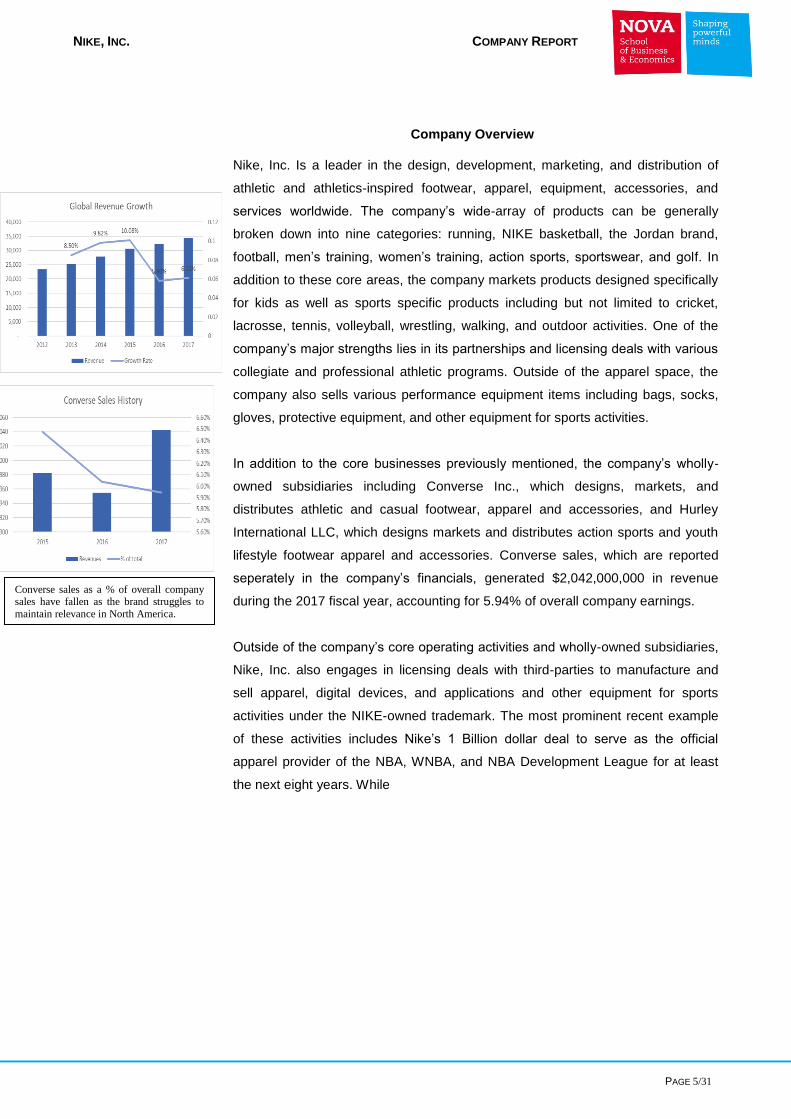
lifestyle footwear apparel and accessories. Converse sales, which are reported
seperately in the company’s financials, generated $2,042,000,000 in revenue
during the 2017 fiscal year, accounting for 5.94% of overall company earnings.
Outside of the company’s core operating activities and wholly-owned subsidiaries,
Nike, Inc. also engages in licensing deals with third-parties to manufacture and
sell apparel, digital devices, and applications and other equipment for sports
activities under the NIKE-owned trademark. The most prominent recent example
of these activities includes Nike’s 1 Billion dollar deal to serve as the official
apparel provider of the NBA, WNBA, and NBA Development League for at least
the next eight years. While
Converse sales as a % of overall company sales have fallen as the brand struggles to
maintain relevance in North America.
NIKE, INC. COMPANY REPORT
PAGE 6/31
Company Overview (Continued)
While accuracutely quantifying the revenue generated as a direct result of the deal
is impossible without internal company data, the deal is seen as a marketing play.
Quantifying the expense associated with these deals is more simple, as the
contracts are regularly reported in the news media. Adidas previously paid a
reported 400M for the rights to the NBA for a ten year period, while Nike’s new
deal will cost the company 1 Billion dollars for the next eight years. Adidas has
shifted their strategy towards increasing the number of players they sponsor within
the league, as they believe this will allow them more direct reach to potential
consumers. Nike currently controls 95% of the American Basketball Shoe
business and continues to be the most dominant player in the space despite
recent attempted inroads by competitors such as Adidas and Under Armour.
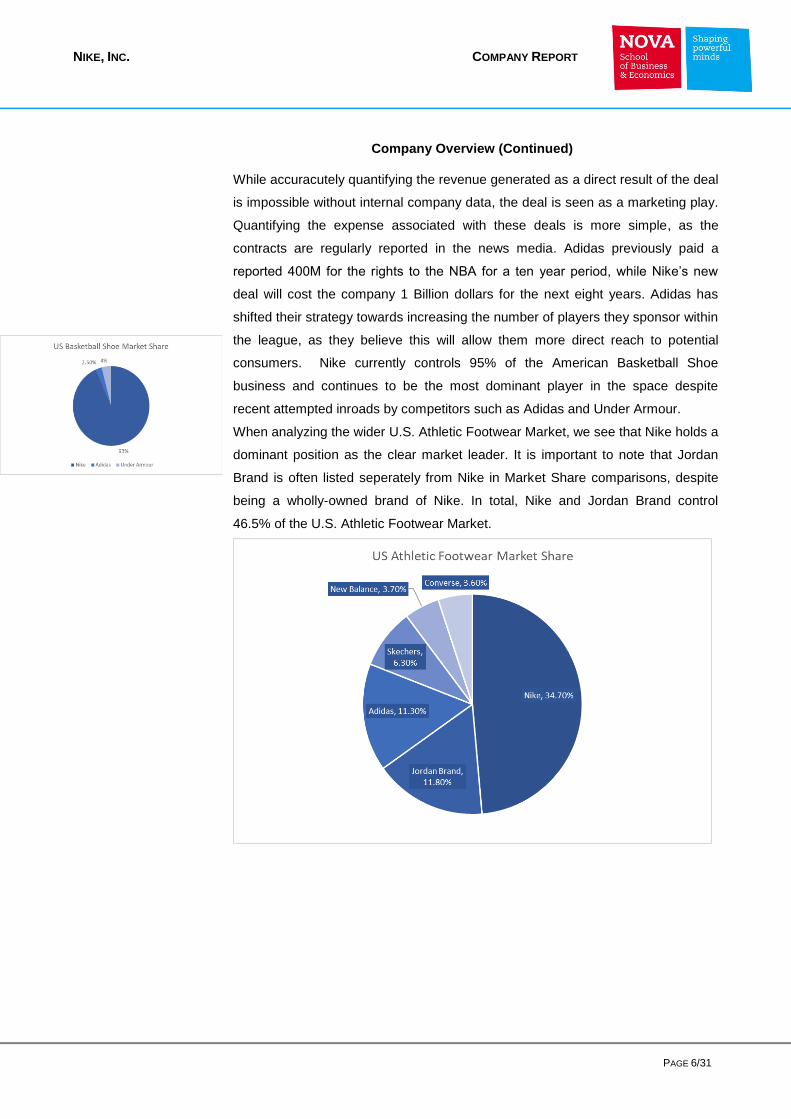
When analyzing the wider U.S. Athletic Footwear Market, we see that Nike holds a
dominant position as the clear market leader. It is important to note that Jordan
Brand is often listed seperately from Nike in Market Share comparisons, despite
being a wholly-owned brand of Nike. In total, Nike and Jordan Brand control
46.5% of the U.S. Athletic Footwear Market.

NIKE, INC. COMPANY REPORT
PAGE 7/31
Company Overview (Continued)
Nike’s overall command of the U.S. shoe market is encouraging, however, there
are signs that this commanding position is being diminished as Adidas has made
significant inroads into the space. According to data from NDP, Adidas nearly
doubled it’s share of the U.S. sneaker market in the first nine months of 2017,
while Nike’s core brand saw it’s share fall from 39% to 37%. Given Nike’s stated
focus on international markets, the company may be succeptible to market share
losses in their home market, which accounted for 45% of 2017 revenues.
Nike hopes to replicate the success they have seen through their sponsorship of
the National Football League. Despite paying what was seen as an exhorbtent
amount for the rights ($220 Million per year) , the company has been able to
increase both revenue and brand outreach. Though data is not available to
showcase the exact revenue generated through the NFL contract, the comapany
recently chose to extend the contract in a signal of overall satisfaction with the
results.

NIKE, INC. COMPANY REPORT
PAGE 8/31
Company Overview (Continued)
The company distributes its products through three major channels:
Wholesale Distributors: The company sells 67% of its products through
wholesale distributors such as footwear distributors, athletics stores, department
stores, and sport-specific stores.
Direct to Consumer: A focus of the company’s triple-double initiative, the
company currently sales 27% of its products directly to consumers through Nike-
owned retail stores and internet websites, mobile applications, and independent
distributors and licenses. Additionally, as of June 2017, the company has begun
selling on Amazon in an effort to crack down on third party sellers who previously
profited from the company’s absence.
Other Sales: The third distribution channel accounts for Converse sales, as well
as sales to global brand divisions and makes up 6% of overall firm revenues.
There has been some recent evolution in the overall share of sales derived from
direct to consumer activities as the company has increased focus on this channel.
Direct to consumer sales now account for 27% of overall company sales vs.
21.68% in 2015. This shift is a deliberate attempt by company management to
increase interactions with consumers in order to create a premium shopping
experience while building brand loyalty. As a part of their Key cities initiative, the
company hopes to transform flagship stores into shopping destinations in order to
increase appeal and decrease the need for discounting which deteriorates
margins.
Key Cities
• New York
• London
• Shanghai
• Beijing
• Los Angeles
• Tokyo
• Paris
• Berlin
• Mexico City
• Barcelona
• Seoul
• Milan

NIKE, INC. COMPANY REPORT
PAGE 9/31
Company Overview (Continued)
Geographic segment breakdown
The company has long been the leader in the American Sports apparel landscape
and maintains this position today despite increased competition from Adidas and
Under Armour, among others. The company has focused recently on expansion in
Greater China and other Emerging Markets. Currently the company has a
geographical revenue breakdown as follows: North America (45%), Europe,
Middle East & Africa (23%), Asia Pacific & Latin America (14%), Greater China
(12%), and Other including Global Brand Divisions (6%).
A pilllar of the company’s revenue strategy, Greater China grew at a significant
clip in 2017 both in gross terms, and relative to the rest of the business. During the
2017 fiscal year, sales in Greater China generated 4,237 Million USD,
representing an 11.94% increase from 2016. The company is betting heavily on
continued double digit growth in this region in order to make up for less impressive
growth in North America of 3.06%
NIKE, INC. COMPANY REPORT
PAGE 10/31
Company Overview (Continued)
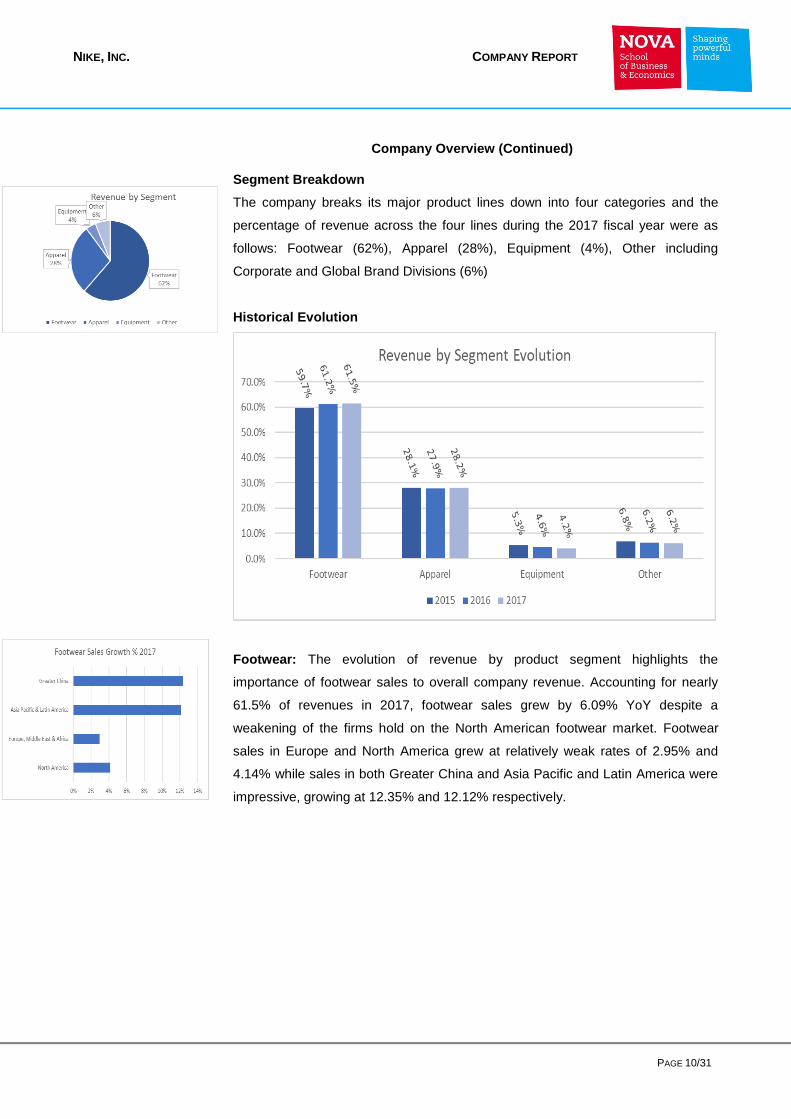
Segment Breakdown
The company breaks its major product lines down into four categories and the
percentage of revenue across the four lines during the 2017 fiscal year were as
follows: Footwear (62%), Apparel (28%), Equipment (4%), Other including
Corporate and Global Brand Divisions (6%)
Historical Evolution
Footwear: The evolution of revenue by product segment highlights the
importance of footwear sales to overall company revenue. Accounting for nearly
61.5% of revenues in 2017, footwear sales grew by 6.09% YoY despite a
weakening of the firms hold on the North American footwear market. Footwear
sales in Europe and North America grew at relatively weak rates of 2.95% and
4.14% while sales in both Greater China and Asia Pacific and Latin America were
impressive, growing at 12.35% and 12.12% respectively.

NIKE, INC. COMPANY REPORT
PAGE 11/31
Company Overview (Continued)
Apparel: Apparel remains an important piece of Nike’s overall revenue generation
strategy. With significant resources going towards marketing and partnerships with
Professional and Collegiate teams and athletes, the company relies heavily on
branded apparel sales. The company has seen significant growth in Greater China
and Europe the Middle East and Africa with 12.61% and 11.45% growth
respectively in 2017. Growth in Asia Pacific and Latin America was in-line with
overall revenue growth at 6.09% while North American growth lagged, gaining just
2.95% during the year. Given the increased marketing expense associated with
taking over the rights to the NBA, the company expects future growth in North
American Apparel to increase as fans purchase Nike Branded basketball apparel.
Equipment: Accounting for only 4% of company revenue, the equipment
business is largely focused in North America. Negative Sales growth for the
segment in the region is a cause for slight concern, though given the relatively
small contribution to overall company success it does not signal a stronger
downward trend.
Shareholder Structure
Nike began trading publicly on December 2nd 1980 at a price of $0.18 per share.
In total, the company has a free-float of approximately 1.28 Billion with 1.89% of
this amount held by insiders including the Knight family.
Nike, Inc. Is widely held by institutional investors, with 81.38% of shares
outstanding being held by institutional investors, and the remaining 16.73% being
held by other investors. Institutional holding of the equity is very concentrated,
including 28.80% being held by just seven institutions including Vanguard Group
and BlackRock Inc.

NIKE, INC. COMPANY REPORT
PAGE 12/31
Shareholder Structure (Continued)
Nike’s Share price has enjoyed stable growth even during global recessionary
periods. The chart above, does not account for a 2-for-1 stock split during 2015.

NIKE, INC. COMPANY REPORT
PAGE 13/31
Sector Analysis
The Consumer Goods sector and the Apparel Footwear & Accessories Industry in
particular is undergoing significant changes both in distribution channels and in
customer preferences. Nike has long been the leader in their peer group from a
total sales perspective, however, these changes in consumer trends have
presented unique opportunities and risks industry wide.
Disruption: Changes in consumer preferences, encouraged by the increasing
convenience and penetration of online shopping has had and will continue to have
major consequences on the industry. For the first time in history, Online sales are
set to be larger than in-store sales during the holiday shopping season in 2017 in
the United states. On a global basis, Singles day, Alibaba’s version of cyber
Monday, generated sales of $25.3B in China, while Cyber Monday sales reached
$6.59B. The writing on the wall is clear, Online shopping is here to stay and will
likely continue to grow as a percentage of overall consumer expenditure; The
ability of Nike and it’s peers to adapt to this trend will largely dictate their success
going forward.
To this end Nike, reluctantly, began selling through Amazon in June, 2017. The
company stated that the move was largely driven by their desire to crackdown on
third-party sellers who were previously profiting from their absence on the
platform, rather than an effort to increase overall volume. While it is too soon to
assess the overall top-line impact of the decision to
sell on Amazon, there are early signs that the company has been able to cut-down
on third party sellers.
According to Data collected by eMarketer, 55% of consumers reported using
Amazon and other third-party online retailers to purchase clothing and apparel,
making the industry the third most impacted by this shift in shopping preferences
behindonly Electronics and Books at 70% and 67% respectively. It is important to
note that these two product segments were the original target market of Amazon,
and therefore many consumers have grown accustomed to ordering them online.

NIKE, INC. COMPANY REPORT
PAGE 14/31
Sector Analysis (Continued)
Marketing & Partnership Expenses:
A major theme within the industry which is still being shaken out is the future of
large-scale, expensive marketing partnerships with leagues, teams, and athletes.
In the past, Nike, Adidas, and Under Armour have spent significant marketing
dollars on aligning themselves with big names in sports in order to drive demand.
This year, Nike will replace Adidas as the primary sponsor of the NBA, while
Adidas has shifted towards partnerships with Pop-Icons such as Kanye West and
Pharrell Williams.
NIKE, INC. COMPANY REPORT
PAGE 15/31
Sector Analysis (Continued)
Despite holding some of the largest partnership deals in world sports, Nike does
not spend as much as Adidas or Puma on partnerships as a percentage of overall
revenue. Nike’s expenditures on partnerships have remained relatively stable in
this regard as their strategy has remain largely unchanged. Adidas has seen a
slight uptick in this category as they have worked towards forming partnerships
with pop-culture icons such as Kanye West in a largely succesful bid to increase
their media presence. After spending a significant amount on partnerships and
marketing in the early part of the decade, Under Armour has looked to decrease
their expendtirues. Puma spends a high percentage of revenues on partnerships,
largely due to their relatively low overall revenue when compared with the other
three category competitors.
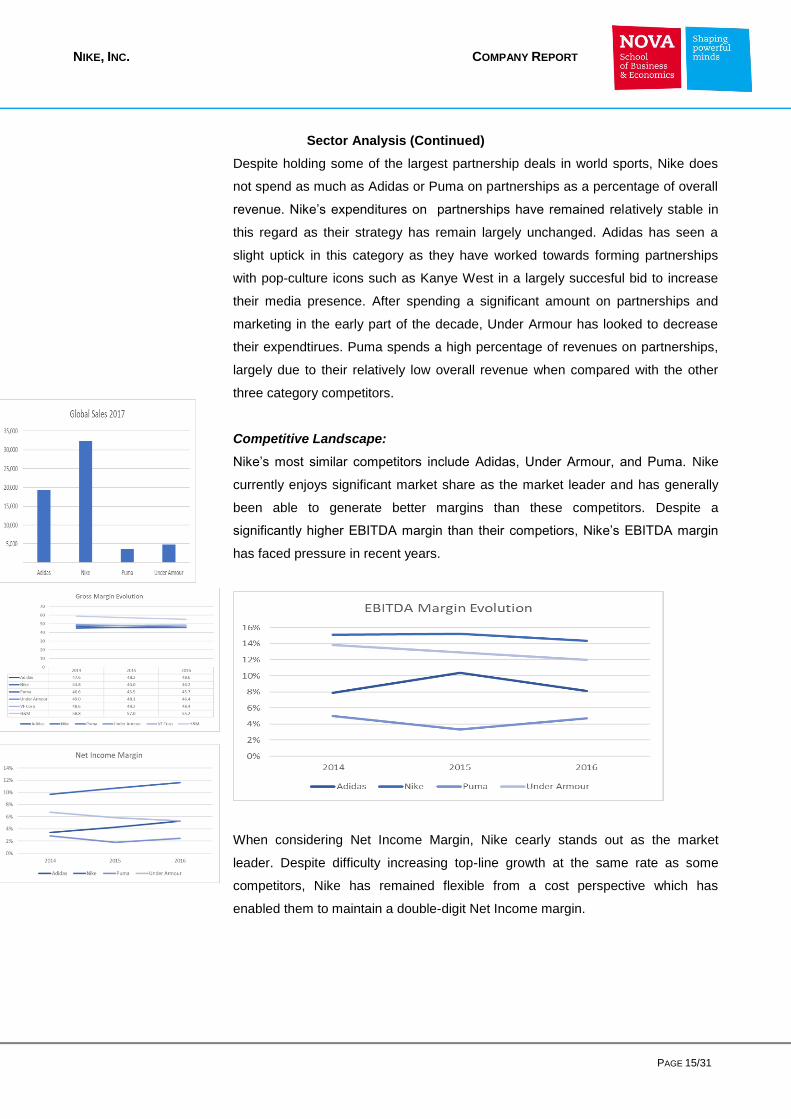
Competitive Landscape:
Nike’s most similar competitors include Adidas, Under Armour, and Puma. Nike
currently enjoys significant market share as the market leader and has generally
been able to generate better margins than these competitors. Despite a
significantly higher EBITDA margin than their competiors, Nike’s EBITDA margin
has faced pressure in recent years.
When considering Net Income Margin, Nike cearly stands out as the market
leader. Despite difficulty increasing top-line growth at the same rate as some
competitors, Nike has remained flexible from a cost perspective which has
enabled them to maintain a double-digit Net Income margin.
NIKE, INC. COMPANY REPORT
PAGE 16/31
Sector Analysis (Continued)
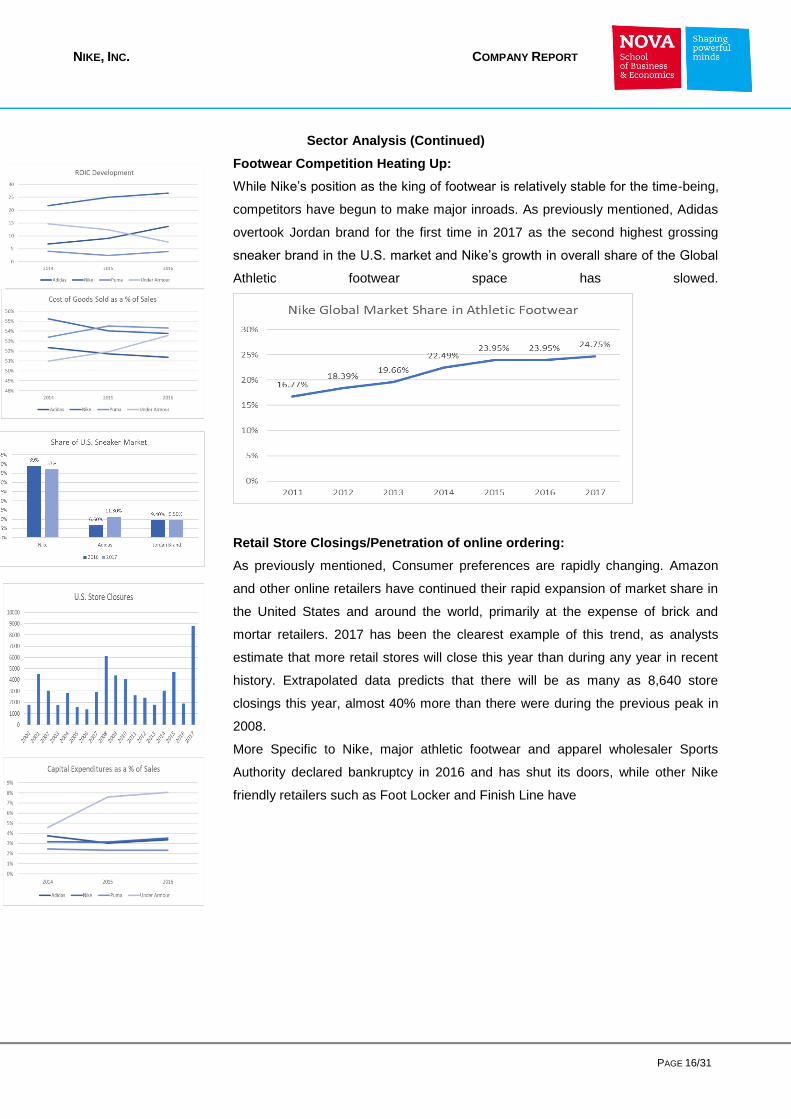
Footwear Competition Heating Up:
While Nike’s position as the king of footwear is relatively stable for the time-being,
competitors have begun to make major inroads. As previously mentioned, Adidas
overtook Jordan brand for the first time in 2017 as the second highest grossing
sneaker brand in the U.S. market and Nike’s growth in overall share of the Global
Athletic footwear space has slowed.
Retail Store Closings/Penetration of online ordering:
As previously mentioned, Consumer preferences are rapidly changing. Amazon
and other online retailers have continued their rapid expansion of market share in
the United States and around the world, primarily at the expense of brick and
mortar retailers. 2017 has been the clearest example of this trend, as analysts
estimate that more retail stores will close this year than during any year in recent
history. Extrapolated data predicts that there will be as many as 8,640 store
closings this year, almost 40% more than there were during the previous peak in
2008.
More Specific to Nike, major athletic footwear and apparel wholesaler Sports
Authority declared bankruptcy in 2016 and has shut its doors, while other Nike
friendly retailers such as Foot Locker and Finish Line have

NIKE, INC. COMPANY REPORT
PAGE 17/31
Sector Analysis (Continued)
struggled greatly due to the rise in online shopping and direct to consumer sales.
Both chains have announced significant store closures which will continue to
weaken Nike’s wholesale reach.
Important shifts in the way consumers are spending their money:
An important shift is underway as consumers seek out the most convenient ways
of spending their hard-earned dollars, and companies who are able to adapt have
the opportunity to capitalize on soaring consumer confidence as well as
unemployment rates not seen in recent history. Consumers are increasingly
shopping using cellular phones, as mobile applications become easier to use and
more secure.
New and Diverse Competitors:
While direct and increased competition from industry regulars such as Adidas and
Under Armour has been given much of the attention, brands who are less
associated with the athletic footwear and apparel segment have also begun
stealing market share. Aasic recently announced a pivot from being solely a shoe
company to a full-scale health and wellness brand. LuluLemon has captured a
largely female audience through its yoga-inspired line of athletic apparel and has
proven to be a formidable competitor for market share. The traditional players
such as Nike and Adidas will likely be forced to choose which areas they would
like to compete in, as customer acquisition expense will continue to be a key
driver of operating margins.
As of 2016 approximately 80% of lululemon revenue came from women, though
international expansion where the brand is less assocaited with women is helping
the company to diversify this with a goal of 40% of sales from mens clothing in the
short to mid term.
In addition to lululemon, Asics has announced intentions to diversify product
offerings and saw their Net Income increase by 52.07% in 2016 from 2015.
Additionally, Amazon recently announced that Asics Men’s sneakers were the top
selling fashion item in all categories during the 2017 holiday season.

NIKE, INC. COMPANY REPORT
PAGE 18/31
Macroeconomic Environment
Global Growth Trends
Globally, 2017 was a solid year for growth with world-wide GDP likely to have
grown as much as 3.8% vs. 3.1% in 2016 according to UBS. According to IMF
estimates, the number looks to have been closer to 3.6% Diving a bit deeper into
the 3.8% global growth number, it is particularly encouraging that every single
G20 country experienced growth, a feat accomplished just six other times in the
past 30 years. Looking forward to 2018, many of the positive economic trends are
likely to continue. The United States, and Japan will continue to benefit from
strong labour markets, corporate earnings growth, and relatively low interest rates.
In Europe, growth may face headwinds as a strong euro and Brexit negotiations
weigh on consumer sentiment and purchasing power. China may also face
headwinds, as growth normalizes in the country, while emerging markets such as
Brazil and India look poised to continue the strong growth exhibited in 2017.
Overall, growth should remain relatively stable in the near-term with emerging
market economies outpacing developed markets.
Risks to Growth:
While global growth is largely expected to continue at the same encouraging clip
in 2018, there are specific and significant risk factors which could way on global
growth.

NIKE, INC. COMPANY REPORT
PAGE 19/31
Macroeconomic Environment (Continued)
Central Bank Actions:
As the US Federal Reserve looks poised to continue on it’s path of increasing the
federal funds rate while beginning its goal of decreasing the size of the balance
sheet, and the European Central Bank begins to decrease its open-market
purchases of debt from 60B each month to 30B between January and September,
questions remain regarding stubbornly low levels of Inflation and the overall ability
of markets to withstand the withdrawal of Central Bank support. In Asia, the BoJ is
set to continue providing monetary stimulus, while the People’s Bank of China will
continue interest rate and exchange rate reform while aiming to keep the yuan
basically stable.
While these central bank moves have been clearly forecasted and are largely
priced into markets, risks remain. A major risk would be any event which causes
central banks to tighten monetary policy more quickly than previously forecasted.
For example, a rapid increase in the price of oil and thus the pace of inflation due
to disagreement or war in the middle east and/or other OPEC members, would
likely cause major central banks to increase the pace at which they increase rates
– it is unclear whether global financial markets are healthy enough to handle a
shock of this type.
Additionally, history shows us that changes in monetary policy are highly
correlated with the market moves that follow. Every US downturn in the last 45
years has been preceded by an aggressive Fed Rate hike cycle, and while there
are questions as to whether or not these policy changes were the cause of any of
the downturns, it will be important for the federal reserve to keep this fact in mind
while determining the path of interest rates.
Geopolitical Tensions:
Geopolitical tensions seem to be increasing on a daily basis, however, global
financial markets have shown extreme resilience and appear to be discounting the
actual impact of these tensions. The ongoing spat between the United States and
North Korea, could pose a major risk to the region and financial markets should it
turn into an armed confrontation. Additionally, tensions have continued to rise in
the Middle East, and any large-scale confrontation in the region could threaten
world oil supplies.
Impact on the Sector and Nike in Particular:
With consumer sentiment at all-time highs, historically low unemployment, and
interest rates still hovering near zero, there are many incentives for consumers to
spend money. Additionally, as tax reform has become a reality, there is the
NIKE, INC. COMPANY REPORT
PAGE 20/31
Macroeconomic Environment (Continued)
potential for many consumers to be encouraged to spend more than in previous
years, especially during the holiday period. Nike and other retailers will look to
capitalize on these strong factors in an effort to not rely as heavily on discounting
products in order to drive demand as they have in previous years.
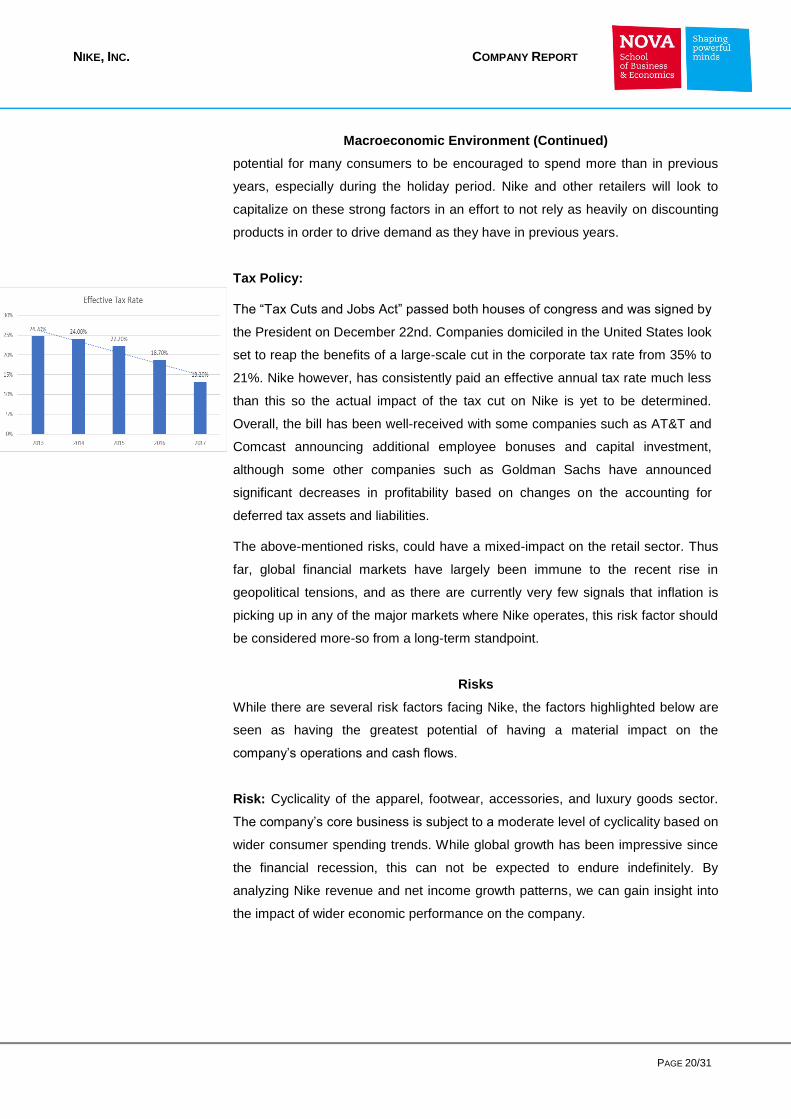
Tax Policy:
The “Tax Cuts and Jobs Act” passed both houses of congress and was signed by
the President on December 22nd. Companies domiciled in the United States look
set to reap the benefits of a large-scale cut in the corporate tax rate from 35% to
21%. Nike however, has consistently paid an effective annual tax rate much less
than this so the actual impact of the tax cut on Nike is yet to be determined.
Overall, the bill has been well-received with some companies such as AT&T and
Comcast announcing additional employee bonuses and capital investment,
although some other companies such as Goldman Sachs have announced
significant decreases in profitability based on changes on the accounting for
deferred tax assets and liabilities.
The above-mentioned risks, could have a mixed-impact on the retail sector. Thus
far, global financial markets have largely been immune to the recent rise in
geopolitical tensions, and as there are currently very few signals that inflation is
picking up in any of the major markets where Nike operates, this risk factor should
be considered more-so from a long-term standpoint.
Risks
While there are several risk factors facing Nike, the factors highlighted below are
seen as having the greatest potential of having a material impact on the
company’s operations and cash flows.
Risk: Cyclicality of the apparel, footwear, accessories, and luxury goods sector.
The company’s core business is subject to a moderate level of cyclicality based on
wider consumer spending trends. While global growth has been impressive since
the financial recession, this can not be expected to endure indefinitely. By
analyzing Nike revenue and net income growth patterns, we can gain insight into
the impact of wider economic performance on the company.

NIKE, INC. COMPANY REPORT
PAGE 21/31
Risks (Continued)
By and large, the company has had a steady growth trend since the early 1980s.
Despite their position as a premium retailer within the athletic footwear and
apparel space, Nike’s international and product diversification has allowed them to
escape major economic downturns largely unscathed. During the 1990’s, the
company had three years with negative earnings growth (1994, 1998, and 1999),
neither of which directly correspond with the economic down turns seen during
this decade. During the 2000’s the company has followed a similar path, with only
2003, and 2009 having negative growth from a net income perspective. The
negative net income growth during 2009 and negative revenue growth in 2009 and
2010 can be partially attributed to the sub-prime mortgage crisis and resulting
worldwide recession.
Mitigant: In order to reduce their exposure to economic downturns Nike has
continued to diversify their geographic exposure. While being the dominant player
in the North American market has been the driver of much of their historical
success, greater security can theoretically be gained by diversifying cash flows to
different regions. Additionally, entering any business lines which are seen as being
less cyclical would benefit Nike’s business. The consumer nondurables segment is
seen as being less cyclical than the luxury, more discretionary segment, and
therefore should be a focus of the company. The company believes that by
developing their direct to consumer channel they will have a greater ability to sell
through to consumers regardles of the wider macroeconomic environment.
1994: EMEA sales slump, currency charges 1998: Restructuring charges
1999: U.S. apparel sales lag – industry wide
2003: Global pressure, Accounting changes
2009: Restructuring, economic recession
2010: Global economic recession
1994 -3.6% -18.1%
1998 4.0% -49.8%
1999 -8.1% 13.0%
2003 8.1% -28.5%
2009 -0.5% -21.1%
2010 -4.4% 27.8%
Negative Years
NIKE, INC. COMPANY REPORT
PAGE 22/31
Risks (Continued)
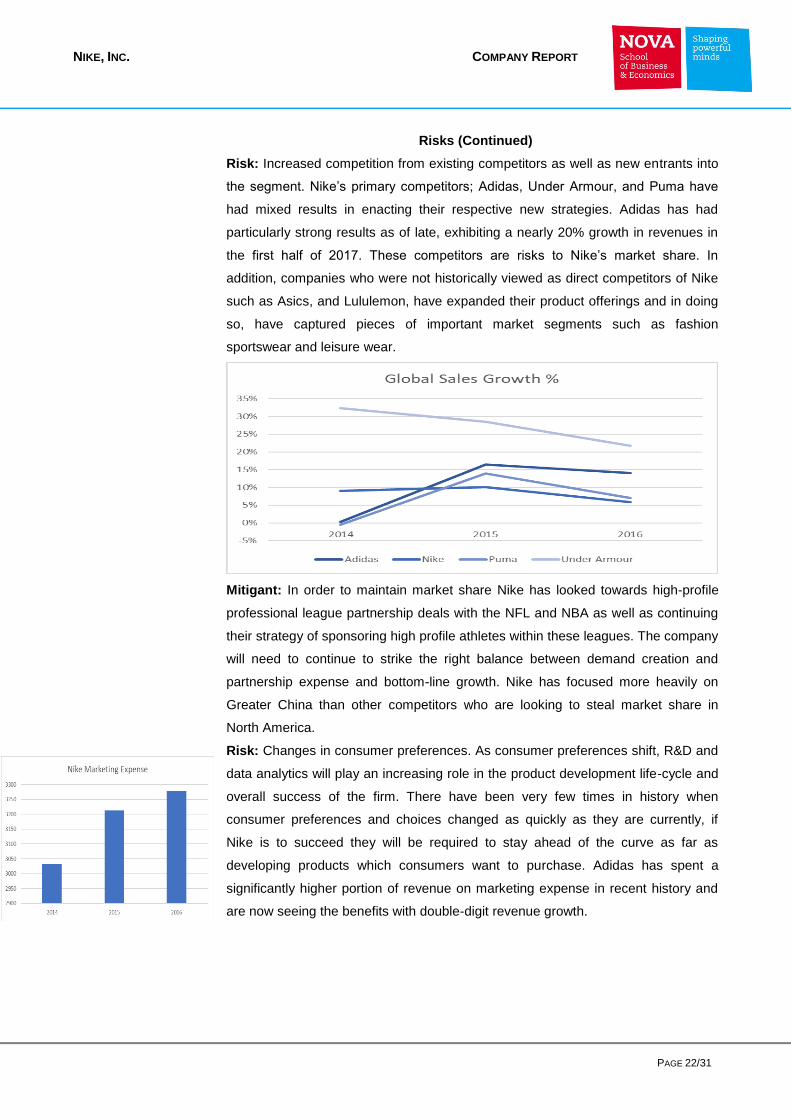
Risk: Increased competition from existing competitors as well as new entrants into
the segment. Nike’s primary competitors; Adidas, Under Armour, and Puma have
had mixed results in enacting their respective new strategies. Adidas has had
particularly strong results as of late, exhibiting a nearly 20% growth in revenues in
the first half of 2017. These competitors are risks to Nike’s market share. In
addition, companies who were not historically viewed as direct competitors of Nike
such as Asics, and Lululemon, have expanded their product offerings and in doing
so, have captured pieces of important market segments such as fashion
sportswear and leisure wear.
Mitigant: In order to maintain market share Nike has looked towards high-profile
professional league partnership deals with the NFL and NBA as well as continuing
their strategy of sponsoring high profile athletes within these leagues. The company
will need to continue to strike the right balance between demand creation and
partnership expense and bottom-line growth. Nike has focused more heavily on
Greater China than other competitors who are looking to steal market share in
North America.
Risk: Changes in consumer preferences. As consumer preferences shift, R&D and
data analytics will play an increasing role in the product development life-cycle and
overall success of the firm. There have been very few times in history when
consumer preferences and choices changed as quickly as they are currently, if
Nike is to succeed they will be required to stay ahead of the curve as far as
developing products which consumers want to purchase. Adidas has spent a
significantly higher portion of revenue on marketing expense in recent history and
are now seeing the benefits with double-digit revenue growth.

NIKE, INC. COMPANY REPORT
PAGE 23/31
Risks (Continued)
Mitigant: Nike has agreed to an extension of their deal with the NFL and also takes
over as principal sponsor of the NBA this year. With these two deals as well as
ongoing and new contracts with professional, and collegiate teams and athletes, it
is possible that overall marketing expense may increase.
Risk: Industry Disruption. The retail industry as a whole has been one of the most
targeted from a disruption standpoint. 2017 has seen a sharp increase in brick and
mortar retail store closings, and companies offering innovative shopping such as
Amazon and Alibaba have prospered. The risk to Nike’s business stems from the
closure of stores operated by their wholesale partners. Closures of Sports
Authority, Foot Locker, and Finish Line stores has directly impacted Nike’s retail
reach.
Mitigant: The company must diversify their distribution channels in order to
mitigate this risk. The move towards selling on Amazon, coupled with the firm’s
“triple-double” approach which promotes direct to consumer sales are crucial
towards the goal of distribution channel diversification.
Risk: Reputation/Brand Image. As we see a sharp increase in the number of
investors looking to both earn a return and positively impact society with their
investments, Nike should pay special attention to the value of their brand and
reputation. In 2015 Enviromental Social and Governance funds saw inflows of 2.6
Billion, a record at the time since eclipsed by the 4.9 Billion in 2016. The company
has had isolated issues in the past regarding working standards at factories
producing their goods, and does not have nearly as high of a reputational standing
as their primary competitor Adidas (6th most reputable brand)

NIKE, INC. COMPANY REPORT
PAGE 24/31
Risks (Continued)
Mitigant: For the first time, in August of this year Nike agreed to a deal with the
Workers Rights Consortium which will look to improve conditions for workers at the
companies factories in Asia. The company will conduct inspections on factories
producing certain Nike goods. Much of the impetus for this agreement came from
protests on college campuses surrounding the working standards for factory
workers who produced university branded apparel.
Risk: Changes in Tax/Trade policy – Being a global brand and company, Nike has
significant exposure to international trade law and foreign exchange rates. We have
recently seen the United States Administration take a harder stance on
international trade which would threaten any business which operates in multiple
regions. In addition to trade policy, changes in tax policy have the potential to
greatly impact Nike’s cash flows. While the final impact of the tax bill is still being
analyzed, it is important to note that Nike has already paid an effective annual rate
much lower than the new proposed corporate tax rate in recent years.
Mitigant: Nike has had a long-standing hedging policy in order to protect
themselves from international currency exchange issues. This policy has been
largely succesful.
Nike Strategy Commentary:
In June, 2017 Nike announced a new consumer direct focused strategy aimed at
increasing the speed at which they serve consumers. The three key pillars of the
strategy are: accelerating innovation and product creation, moving closer to the
consumer through key cities, and deepening one-to-one connection and Nike’s
CEO, Mark Parker was quoted as saying “The future of sport will be decided by the
company that obsesses the needs of the evolving consumer – through the
Consumer Direct Offense, we’re getting even more aggressive in the digital
marketplace, targeting key markets, and delivering product faster than ever.”
Accelerating Innovation: In order to accelerate innovation the company has made
personnel changes and created the President of Categories and Product role. The
aim here is to integrate multiple groups within the company in order to realize
synergies and ultimately increase the speed at which new products are designed,
marketed, and sold.
Key Cities: The company has chosen to focus on 12 key cities: New York, London,
Shanghai, Beijing, Los Angeles, Tokyo, Paris, Berlin, Mexico City, Barcelona,
Seoul, and Milan. The company has projected that nearly 80% of growth will come
from these key cities through 2020.
NIKE, INC. COMPANY REPORT
PAGE 25/31
Nike Strategy Commentary (Continued)
Deepening one-to-one connections: In deepening connections with consumers, the
company hopes to increase the feeling of membership with consumers. The
company plans to increase offerings via mobile applications, while also giving
existing customers and members advanced notice of new product offerings.
Impacts on top-line growth: The ultimate effectiveness of this strategy is yet to be
seen, however it does seem like a step in the right direction. As consumer
preferences shift rapidly, it is vital that the company has the ability to shorten the
time between idea generation and eventual sale of the product. Additionally,
through their key cities program the company will be able to create premium
shopping experiences at Nike stores in these cities. Adidas has deployed a similar
strategy, opening a new global flagship store in New York City that has been
received with raving reviews. Consumer perception is tantamount to success in this
industry, and Nike will have to ensure that they continue to be seen as a brand of
choice.
Geographic diversification strategy: Nike has invested aggressively in less
traditional markets such as Greater China, Central & Eastern Europe and Emerging
markets and has seen their revenue grow in these areas both in gross terms and
as a percentage of their overall revenue. This strategy, coupled with differing
strategies by competitors has led to a decrease in Nike’s market share in North
America, which remains their most important market.
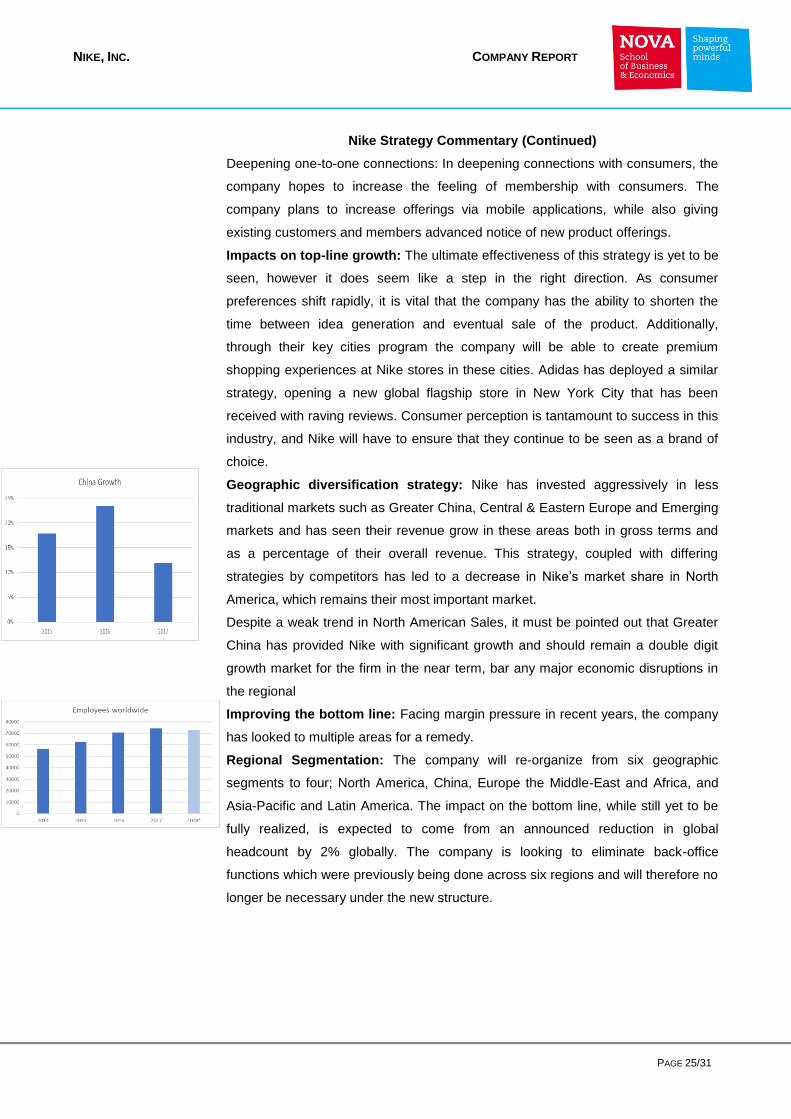
Despite a weak trend in North American Sales, it must be pointed out that Greater
China has provided Nike with significant growth and should remain a double digit
growth market for the firm in the near term, bar any major economic disruptions in
the regional
Improving the bottom line: Facing margin pressure in recent years, the company
has looked to multiple areas for a remedy.
Regional Segmentation: The company will re-organize from six geographic
segments to four; North America, China, Europe the Middle-East and Africa, and
Asia-Pacific and Latin America. The impact on the bottom line, while still yet to be
fully realized, is expected to come from an announced reduction in global
headcount by 2% globally. The company is looking to eliminate back-office
functions which were previously being done across six regions and will therefore no
longer be necessary under the new structure.
NIKE, INC. COMPANY REPORT
PAGE 26/31
Nike Strategy Commentary (Continued)
Acceleration of Product Pipeline: the company is counting on their strategy to
increase the speed of product development in order to help them remain relevant
in consumers minds while also increasing their ability to sell products at full-price
and rely less on discounting and promotions – this should have an impact on
margins.
The Future of the Sector:
Changes in Consumer Preferences: Consumer preferences will likely continue
to shift in the direction of online shopping as penetration of mobile devices grows.
Nike has invested heavily in increasing the quality of their web and mobile
platforms and should be able to keep up with this trend in the short-term.
Renting vs. Buying: A potential long-term trend in apparel and fashion is that of
renting vs. Owning. While still a relatively new and unproven phenomenon, Rent
the Runway saw a 125% increase in business over the last 12-months and have
added dozens of new brands. The company predicts an era where women no
longer use closets to store their clothing. This trend is harder to predict as it is so
new, and therefore is not foreseen to have any short-term impact on company
performance.
Direct to Consumer:
Nike and their closest competitors are looking to cut out the middle man in the
sale of their products. When selling through wholesalers, companies are forced to
heavily discount prices and therefore decrease margins. Nike and Adidas have
focused on building out new stores in an effort to attract new and existing
customers. Nike has targeted 12 cities and should be able to positively impact
revenues as well as net income. Capital Expenditures will likely increase slightly
as these stores are built out and transformed.
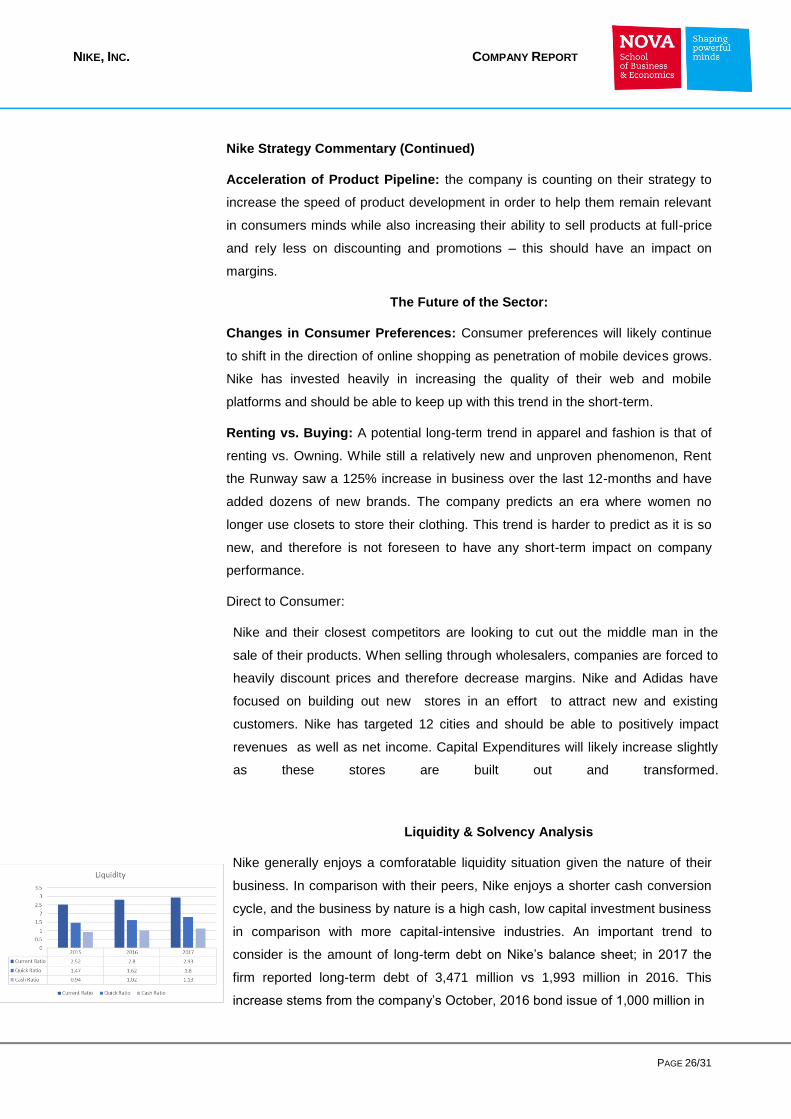
Liquidity & Solvency Analysis
Nike generally enjoys a comforatable liquidity situation given the nature of their
business. In comparison with their peers, Nike enjoys a shorter cash conversion
cycle, and the business by nature is a high cash, low capital investment business
in comparison with more capital-intensive industries. An important trend to
consider is the amount of long-term debt on Nike’s balance sheet; in 2017 the
firm reported long-term debt of 3,471 million vs 1,993 million in 2016. This
increase stems from the company’s October, 2016 bond issue of 1,000 million in
NIKE, INC. COMPANY REPORT
PAGE 27/31
Liquidity & Solvency Analysis (Continued
the United States with a maturity of 2026. The company was able to issue the
bonds at an extremely attractive rate of 2.38% paid semiannually, which is only
slightly higher than the US 10 year yield at the time. At the same time, cash on
hand increased by greater than 21% which has helped Nike to maintain a strong
short-term liquidity situation.
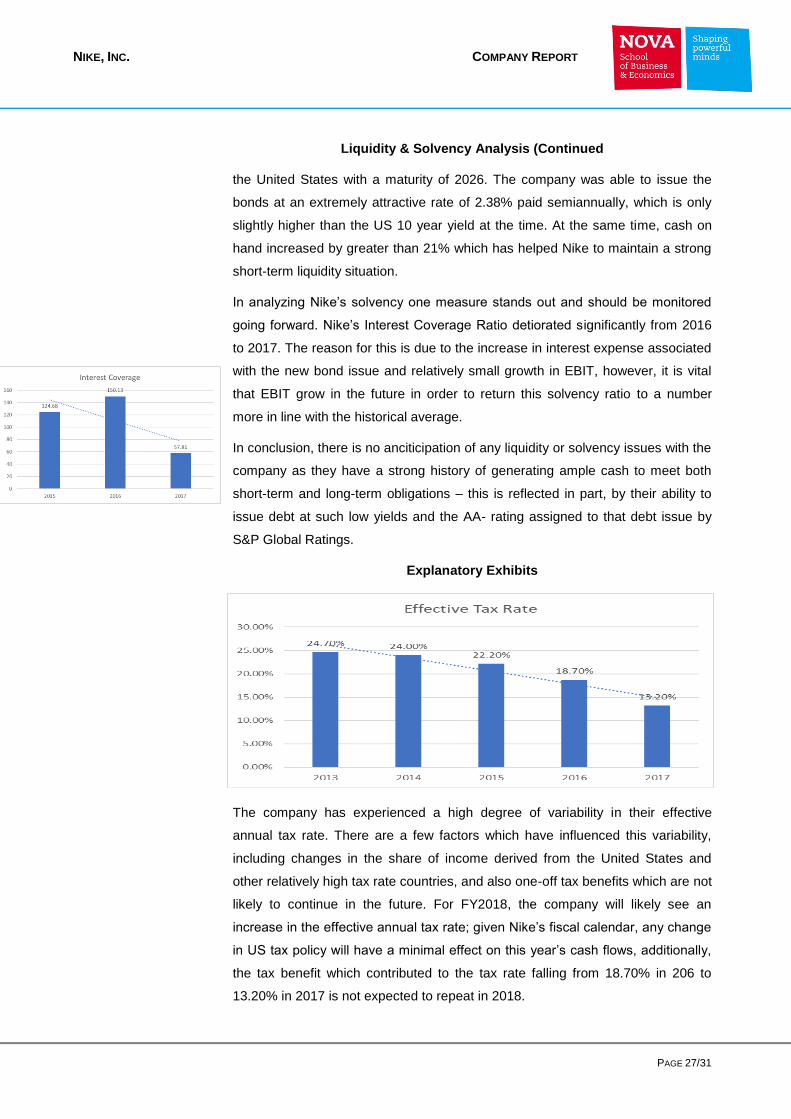
In analyzing Nike’s solvency one measure stands out and should be monitored
going forward. Nike’s Interest Coverage Ratio detiorated significantly from 2016
to 2017. The reason for this is due to the increase in interest expense associated
with the new bond issue and relatively small growth in EBIT, however, it is vital
that EBIT grow in the future in order to return this solvency ratio to a number
more in line with the historical average.
In conclusion, there is no anciticipation of any liquidity or solvency issues with the
company as they have a strong history of generating ample cash to meet both
short-term and long-term obligations – this is reflected in part, by their ability to
issue debt at such low yields and the AA- rating assigned to that debt issue by
S&P Global Ratings.
Explanatory Exhibits
The company has experienced a high degree of variability in their effective
annual tax rate. There are a few factors which have influenced this variability,
including changes in the share of income derived from the United States and
other relatively high tax rate countries, and also one-off tax benefits which are not
likely to continue in the future. For FY2018, the company will likely see an
increase in the effective annual tax rate; given Nike’s fiscal calendar, any change
in US tax policy will have a minimal effect on this year’s cash flows, additionally,
the tax benefit which contributed to the tax rate falling from 18.70% in 206 to
13.20% in 2017 is not expected to repeat in 2018.
NIKE, INC. COMPANY REPORT
PAGE 28/31
Explanatory Exhibits (Continued)
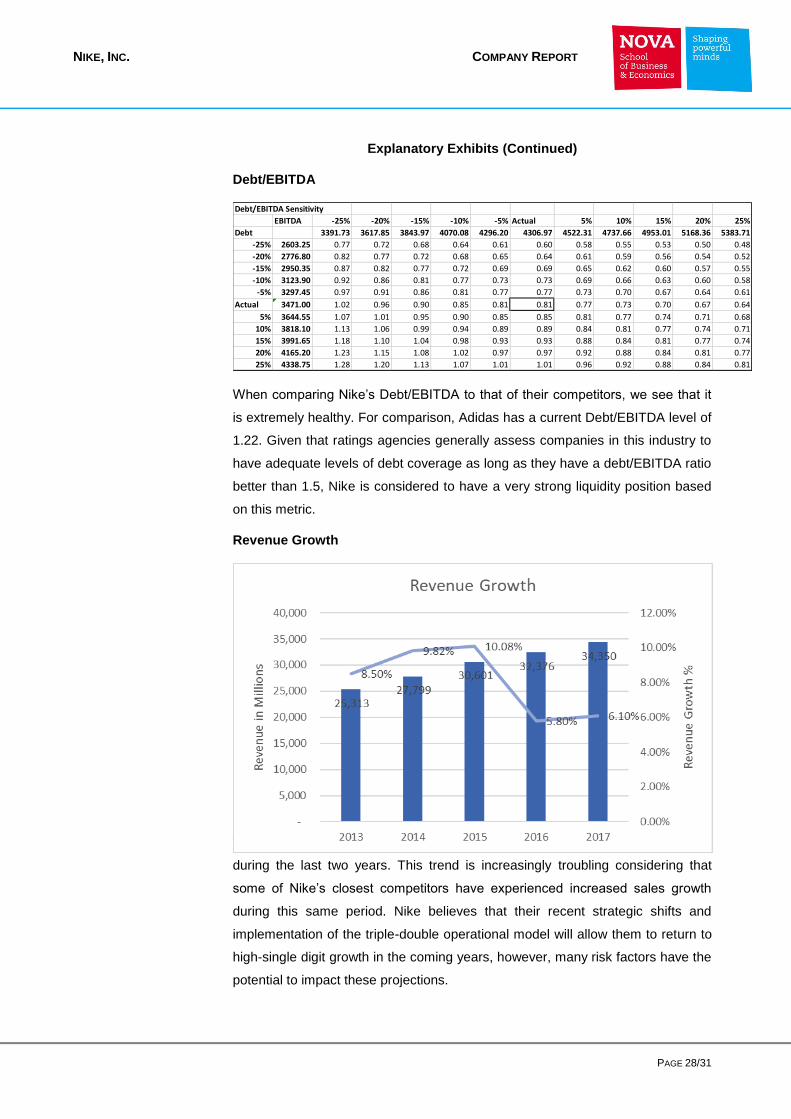
Debt/EBITDA
Debt/EBITDA Sensitivity
EBITDA -25% -20% -15% -10% -5% Actual 5% 10% 15% 20% 25%
Debt 3391.73 3617.85 3843.97 4070.08 4296.20 4306.97 4522.31 4737.66 4953.01 5168.36 5383.71
-25% 2603.25 0.77 0.72 0.68 0.64 0.61 0.60 0.58 0.55 0.53 0.50 0.48
-20% 2776.80 0.82 0.77 0.72 0.68 0.65 0.64 0.61 0.59 0.56 0.54 0.52
-15% 2950.35 0.87 0.82 0.77 0.72 0.69 0.69 0.65 0.62 0.60 0.57 0.55
-10% 3123.90 0.92 0.86 0.81 0.77 0.73 0.73 0.69 0.66 0.63 0.60 0.58
-5% 3297.45 0.97 0.91 0.86 0.81 0.77 0.77 0.73 0.70 0.67 0.64 0.61
Actual 3471.00 1.02 0.96 0.90 0.85 0.81 0.81 0.77 0.73 0.70 0.67 0.64
5% 3644.55 1.07 1.01 0.95 0.90 0.85 0.85 0.81 0.77 0.74 0.71 0.68
10% 3818.10 1.13 1.06 0.99 0.94 0.89 0.89 0.84 0.81 0.77 0.74 0.71
15% 3991.65 1.18 1.10 1.04 0.98 0.93 0.93 0.88 0.84 0.81 0.77 0.74
20% 4165.20 1.23 1.15 1.08 1.02 0.97 0.97 0.92 0.88 0.84 0.81 0.77
25% 4338.75 1.28 1.20 1.13 1.07 1.01 1.01 0.96 0.92 0.88 0.84 0.81
When comparing Nike’s Debt/EBITDA to that of their competitors, we see that it
is extremely healthy. For comparison, Adidas has a current Debt/EBITDA level of
1.22. Given that ratings agencies generally assess companies in this industry to
have adequate levels of debt coverage as long as they have a debt/EBITDA ratio
better than 1.5, Nike is considered to have a very strong liquidity position based
on this metric.
Revenue Growth
While Revenue has grown each year, the rate of growth has slowed significantly
during the last two years. This trend is increasingly troubling considering that
some of Nike’s closest competitors have experienced increased sales growth
during this same period. Nike believes that their recent strategic shifts and
implementation of the triple-double operational model will allow them to return to
high-single digit growth in the coming years, however, many risk factors have the
potential to impact these projections.

NIKE, INC. COMPANY REPORT
PAGE 29/31
Financial Statements

NIKE, INC. COMPANY REPORT
PAGE 30/31
Bibliography
Market Realist, marketrealist.com/2014/12/nikes-economic-moat-strong/. ABC News, ABC News Network, abcnews.go.com/GMA/video/amazon-reveals-biggest-holiday-sellers-52007032. “Nike: employees worldwide 2017.” Statista, www.statista.com/statistics/243199/number-of-employees-of-nike-worldwide/. “Adidas has nearly doubled its US sneaker market share - at Nike's expense.” Yahoo! Finance, Yahoo!, 23 June 2017, finance.yahoo.com/news/adidas-nearly-doubled-us-sneaker-market-share-
nikes-expense-153106743.html?_fsig=XQ0UtY._hdumpUQhKi0Log--. Andrews, Wilson, and Alicia Parlapiano. “What’s in the Final Republican Tax Bill.” The New York Times, The New York Times, 15 Dec. 2017,
www.nytimes.com/interactive/2017/12/15/us/politics/final-republican-tax-bill-cuts.html. Banks, Alec. “Is Nike's Billion-Dollar NBA Deal a Knockout Punch to the Industry?” Highsnobiety, Highsnobiety, 5 Jan. 2018, www.highsnobiety.com/2015/06/17/nike-nba-deal-op-ed/. Brautigan, Bailey. “Here's How Every NBA Team Makes Its Money, Visualized.” Forbes, Forbes Magazine, 21 Mar. 2016, www.forbes.com/sites/baileybrautigan/2016/03/21/where-all-that-money-
comes-from-nba-team-valuations-visualized/#5da8bded444f. “Can Kanye West Save Adidas?” Fortune, fortune.com/2015/05/20/can-kanye-west-save-adidas/. Chavez, Chris. “Adidas outruns Jordan brand as 2nd favorite sneaker.” SI.com, www.si.com/nba/2017/09/19/adidas-jordan-brand-nike-market-share. “Crude Oil Prices: West Texas Intermediate (WTI) - Cushing, Oklahoma.” FRED, 4 Jan. 2018, fred.stlouisfed.org/series/DCOILWTICO. “Did Nike overpay for its NBA apparel contract?” Fortune, fortune.com/2015/06/12/did-nike-overpay-for-the-nba-apparel-contract/. Group, The NPD. “U.S. Athletic Footwear Industry Grows 3 Percent to $17.5 Billion in 2016, Despite Turbulence in Q4, NPD Group Reports.” NPD Group, The NPD Group, 30 Jan. 2017,
www.npd.com/wps/portal/npd/us/news/press-releases/2017/u-s--athletic-footwear-industry-grows-3-percent-to--17-5-billion-in-2016--despite-turbulence-in-q4--npd-group-reports/. aabha-rathee. “How Much Will Nike Add From NFL Sales? (NYSE:NKE, NASDAQ:MSFT).” The Cheat Sheet, 3 Apr. 2012, www.cheatsheet.com/stocks/how-much-will-nike-add-from-nfl-sales.html/. Kenwell, Bret. “This Is How Much Ground Nike (NKE) Is Losing to Adidas.” InvestorPlace, 26 Sept. 2017, investorplace.com/2017/09/nike-losing-market-share-adidas/#.WkvzgExFxu0. Kim, Tae. “Nike shares get downgraded due to basketball shoe ‘inventory glut’.” CNBC, CNBC, 19 Sept. 2017, www.cnbc.com/2017/09/19/nike-shares-get-downgraded-due-to-basketball-shoe-
inventory-glut.html. Matt Moore Jun 10, 2015 • 1 min read. “Nike signs reported 8-Year, $1 billion deal with NBA for licensing rights.” CBSSports.com, 6 Apr. 2017, www.cbssports.com/nba/news/nike-signs-reported-
8-year-1-billion-deal-with-nba-for-licensing-rights/. News, Bloomberg. “Nike makes the most of its NFL gear with sales to fans.” OregonLive.com, 18 Dec. 2015, www.oregonlive.com/playbooks-profits/index.ssf/2015/12/post_87.html. Taylor, Kate. “One statistic shows how much Amazon could dominate the future of retail.” Business Insider, Business Insider, 1 Nov. 2017, www.businessinsider.com/retail-apocalypse-amazon-
accounts-for-half-of-all-retail-growth-2017-11. Thomas, Lauren. “Rent the Runway's latest bet: A woman's closet is becoming obsolete.” CNBC, CNBC, 16 Oct. 2017, www.cnbc.com/2017/10/16/rent-the-runway-is-expanding-its-fashion-
subscription-service.html. Weir, Editing by Georgina Prodhan/Keith. “Adidas U.S. push keeps up pressure on Nike, Under Armour.” Reuters, Thomson Reuters, 8 Mar. 2017, www.reuters.com/article/us-adidas-
results/adidas-u-s-push-keeps-up-pressure-on-nike-under-armour-idUSKBN16F0L1.
Disclosures and Disclaimers
Report Recommendations
Buy Expected total return (including expected capital gains and expected dividend yield) of more than 10% over a 12-month
period.
Hold Hold Expected total return (including expected capital gains and expected dividend yield) between 0% and 10% over a 12-
month period.
Sell Expected negative total return (including expected capital gains and expected dividend yield) over a 12-month period.
This report was prepared by [insert student’s name], a Master in Finance’s student of Nova School of Business & Economics (“Nova SBE”), within the
context of the Field Lab – Equity Research.
This report is issued and published exclusively for academic purposes, namely for academic evaluation and masters graduation purposes, within the context
of said Field Lab – Equity Research. It is not to be construed as an offer or a solicitation of an offer to buy or sell any security or financial instrument.
This report was supervised by a Nova SBE faculty member, acting merely in an academic capacity, who revised the valuation methodology and the financial
model.
Given the exclusive academic purpose of the reports produced by Nova SBE students, it is Nova SBE understanding that Nova SBE, the author, the present
report and its publishing, are excluded from the persons and activities requiring previous registration from local regulatory authorities. As such, Nova SBE, its
faculty and the author of this report have not sought or obtained registration with or certification as financial analyst by any local regulator, in any jurisdiction.
In Portugal, the author of this report is not registered with or qualified under COMISSÃO DO MERCADO DE VALORES MOBILIÁRIOS (“CMVM”, the Portuguese
Securities Market Authority) as a financial analyst. Rosário André - as the academic supervisor of the author - is registered as a financial analyst with CMVM.
No approval for publication or distribution of this report was required and/or obtained from any local authority, given the exclusive academic nature of the
report.
The additional disclaimers also apply:
USA: Pursuant to Section 202 (a) (11) of the Investment Advisers Act of 1940, neither Nova SBE nor the author of this report are to be qualified as an
investment adviser and, thus, registration with the Securities and Exchange Commission (“SEC”, United States of America’s securities market authority) is
not necessary. Neither the Author nor Nova SBE receive any compensation of any kind for the preparation of the Reports.
NIKE, INC. COMPANY REPORT
PAGE 31/31
Germany: Pursuant to §34c of the WpHG (Wertpapierhandelsgesetz, i.e., the German Securities Trading Act), this entity is not required to register with or
otherwise notify the Bundesanstalt für Finanzdienstleistungsaufsicht (“BaFin”, the German Federal Financial Supervisory Authority). It should be noted that
Nova SBE is a fully-owned state university and there is no relation between the student’s equity reports and any fund raising programme.
UK: Pursuant to section 22 of the Financial Services and Markets Act 2000 (the “FSMA”), for an activity to be a regulated activity, it must be carried on “by
way of business”. All regulated activities are subject to prior authorization by the Financial Conduct Authority (“FCA”). However, this Report serves an
exclusively academic purpose and, as such, was not prepared by way of business.The author - a Masters’ student - is the sole and exclusive responsible
for the information, estimates and forecasts contained herein, and for the opinions expressed, which exclusively reflect his/her own judgment at the date of
the report. Nova SBE and its faculty have no single and formal position in relation to the most appropriate valuation method, estimates or projections used in
the report and may not be held liable by the author’s choice of the latter.
The information contained in this report was compiled by students from public sources believed to be reliable, but Nova SBE, its faculty, or the students
make no representation that it is accurate or complete, and accept no liability whatsoever for any direct or indirect loss resulting from the use of this report or
of its content.
Students are free to choose the target companies of the reports. Therefore, Nova SBE may start covering and/or suspend the coverage of any listed
company, at any time, without prior notice. The students or Nova SBE are not responsible for updating this report, and the opinions and recommendations
expressed herein may change without further notice.
The target company or security of this report may be simultaneously covered by more than one student. Because each student is free to choose the
valuation method, and make his/her own assumptions and estimates, the resulting projections, price target and recommendations may differ widely, even
when referring to the same security. Moreover, changing market conditions and/or changing subjective opinions may lead to significantly different valuation
results. Other students’ opinions, estimates and recommendations, as well as the advisor and other faculty members’ opinions may be inconsistent with the
views expressed in this report. Any recipient of this report should understand that statements regarding future prospects and performance are, by nature,
subjective, and may be fallible.
This report does not necessarily mention and/or analyze all possible risks arising from the investment in the target company and/or security, namely the
possible exchange rate risk resulting from the security being denominated in a currency either than the investor’s currency, among many other risks.
The purpose of publishing this report is merely academic and it is not intended for distribution among private investors. The information and opinions
expressed in this report are not intended to be available to any person other than Portuguese natural or legal persons or persons domiciled in Portugal.
While preparing this report, students did not have in consideration the specific investment objectives, financial situation or
particular needs of any specific person. Investors should seek financial advice regarding the appropriateness of investing in any security, namely in the
security covered by this report.
The author hereby certifies that the views expressed in this report accurately reflect his/her personal opinion about the target company and its securities. He/
She has not received or been promised any direct or indirect compensation for expressing the opinions or recommendation included in this report.
[If applicable, it shall be added: “While preparing the report, the author may have performed an internship (remunerated or not) in [insert the Company’s
name]. This Company may have or have had an interest in the covered company or security” and/ or “A draft of the reports have been shown to the covered
company’s officials (Investors Relations Officer or other), mainly for the purpose of correcting inaccuracies, and later modified, prior to its publication.”]
The content of each report have been shown or made public to restricted parties prior to its publication in Nova SBE’s website or in Bloomberg Professional,
for academic purposes such as its distribution among faculty members for students’ academic evaluation.
Nova SBE is a state-owned university, mainly financed by state subsidies, students tuition fees and companies, through donations, or indirectly by hiring
educational programs, among other possibilities. Thus, Nova SBE may have received compensation from the target company during the last 12 months,
related to its fund raising programs, or indirectly through the sale of educational, consulting or research services. Nevertheless, no compensation eventually
received by Nova SBE is in any way related to or dependent on the opinions expressed in this report. The Nova School of Business & Economics does not
deal for or otherwise offer any investment or intermediation services to market counterparties, private or intermediate customers.
This report may not be reproduced, distributed or published, in whole or in part, without the explicit previous consent of its author, unless when used by Nova
SBE for academic purposes only. At any time, Nova SBE may decide to suspend this report reproduction or distribution without further notice. Neither this
document nor any copy of it may be taken, transmitted or distributed, directly or indirectly, in any country either than Portugal or to any resident outside this
country. The dissemination of this document other than in Portugal or to Portuguese citizens is therefore prohibited and unlawful.