Nigerian Journal of Rural Sociology Vol. 18, No. 2, 2018
104
Nigerian Journal of Rural Sociology Vol. 18, No. 2, 2018 1
Transcript of Nigerian Journal of Rural Sociology Vol. 18, No. 2, 2018

Nigerian Journal of Rural Sociology Vol. 18, No. 2, 2018
1

Nigerian Journal of Rural Sociology Vol. 18, No. 2, 2018
2
ISSN 0189 - 7543
NIGERIAN
JOURNAL OF
RURAL SOCIOLOGY
Vol. 18 No. 2 DECEMBER, 2018
Published by:
The Nigerian Rural Sociological Association

Nigerian Journal of Rural Sociology Vol. 18, No. 2, 2018
3
THE EDITORIAL BOARD
Editor-in-Chief
Kolawole Adebayo Federal University of Agriculture, Abeokuta, Nigeria Associate Editors
O. A. Adeokun Olabisi Onabanjo University, College of Agricultural Sciences (Yewa Campus), Ayetoro, Ogun State, Nigeria Grace Adebo Department of Agricultural Economics and Extension, University of Ado-Ekiti, Nigeria A. J. Farinde Department of Agricultural Extension and Rural Sociology, Obafemi Awolowo University, Ile-lfe, Nigeria L. A. Akinbile Department of Agricultural Extension and Rural Development, University of Ibadan, Ibadan, Nigeria Editorial Advisers
Barnabas M. Dlamini Faculty of Agriculture, University of Swaziland, Luyengo Campus, Swaziland
A. A. Jibowo Department of Agriculture Education, University of Swaziland, Luyengo, Swaziland Janice E. Olawoye Department of Agricultural Extension and Rural Development, University of Ibadan, Ibadan, Nigeria J. A. Kwarteng Faculty of Agriculture, University of Cape Coast, Cape Coast, Ghana Managing Editor
O. T. Yekinni Department of Agricultural Extension and Rural Development, University of Ibadan, Ibadan, Nigeria
Editorial Policy
The purpose of the Journal is to provide an avenue for fostering creativity, scholarship and scientific information in Rural Sociology, Agricultural Extension, Agricultural Economics, Human Ecology and other related disciplines. Attention is focused on agricultural and rural development. Priority will therefore be given to articles on rural society. The Journal will also accept methodological, theoretical, research or applied contributions in these areas. Opportunity is open to scientists and development experts within and outside the country to submit relevant papers for publication. The journal basically follows a peer reviewed process in its assessment of manuscripts.
INSTRUCTIONS TO CONTRIBUTORS
Manuscripts
Manuscripts submitted are not supposed to have been published or being considered for publication elsewhere. Papers should be between 3,000 and 5,000 words. Only electronic copy should be submitted; with 12 font size and Times New Roman font type and double line spaced. The TITLE of the paper should be followed by the names, initials and address(es) of the author(s). An ABSTRACT

Nigerian Journal of Rural Sociology Vol. 18, No. 2, 2018
4
of about 150 words which reports the research problem, purpose, method, results and conclusion should be provided. Keywords consisting of four to five words should be provided after the abstract. Articles should be written in English only. Research papers, review articles, case studies, postgraduate projects are welcome. Submit to the Editor-in-Chief through the journal’s website http://www.journal.rusan.org.ng
TABLES, FIGURES and Other illustrations should be numbered consecutively and located appropriately within texts after the point of first mention. However, authors should ensure that table does not spill over to the next page. REFERENCE AND LEGENDS TO ILLUSTRATIONS should be placed appropriately within the body of the paper and authors should ensure that they are in camera ready form. Guidelines on illustrations should follow the American Psychological Association [APA] Publication Style Manual. FOOTNOTES should be avoided as much as possible. Acknowledgements should appear after Conclusion before the reference list. REFERENCES should be cited within the text as follows: Abiodun (2009) found that ................... On the other hand, after stating the findings, the author's name and year of publication can be inserted; for example, income was positively correlated with educational attainment (Abiodun, 2009). The references should then appear in alphabetical order of the names of first authors in the list of references. For the reference list, the APA Publication Style Manual should be adopted. E.g. Abiodun, J. R. (2009) for single authored paper and Abiodun J. R. and Alabi, O. E. (2009) for double authored. Reprints: These will be provided on request from authors.

Nigerian Journal of Rural Sociology Vol. 18, No. 2, 2018
5
TABLE OF CONTENT
SN Author(s) Title Pages
1 Usman, I. S., Ndaghu, A. A.,
Waziri, U. M. and Olabanji,
A.
Adoption of improved farming
practices by fluted pumpkin farmers in
selected ADP zones, Adamawa state,
Nigeria
7 – 13
2 Abdullahi, A., Salihu, I. T.,
Umar, I. S. and Hassan, S.
Adoption of organic farming practices
among rural maize farmers in Niger
state, Nigeria
14 – 19
3 Akintunde, M. A. O. and Thetsane, N.
Identifying intermediary role of opinion leaders in Roma valley, Lesotho
20 – 25
4 Owolabi, K. E., Ajayi, F. O.
and Oyeyemi, S. K.
Analysis of agro-biofortified cassava
information needs of cassava farmers
in Akinyele local government area of
Oyo state, Nigeria
26 – 33
5 Ogunjimi, S. I, Ajala, A. O. and Alabi, O. O.
Analysis of the outcomes of waste scavenging as a means of livelihood coping strategy among scavengers in Southwestern Nigeria
34 – 39
6 Ani, N. A., Olajide, B. R.
and Onyebuchi, S. I.
Coverage of agricultural related
corrupt practices in the Nigerian
newspapers
40 – 45
7 Anozie, O., Koyenikan, M. J.
and Obar, E. E.
Contribution of leafy vegetable
farming to the livelihood of women in
Ikorodu local government area, Lagos
state Nigeria
46 – 56
8 Atiku, J. A. Impact of community based
agriculture and rural development
project on participants output in
Kaduna state
57 – 61
9 Adeloye, K. A., Aladekomo,
F., Adepoju, A. G. and
Filusi, J.
Participation of rural dwellers in
community-based natural resources
management programme in Ondo
state, Nigeria
62 – 68
10 Aromolaran, A. K., Alarima,
C. I., Abiona, B. G.,
Adekola, O. A. and Amole,
Attitude of rural households to
community development projects in
69 – 76

Nigerian Journal of Rural Sociology Vol. 18, No. 2, 2018
6
SN Author(s) Title Pages
A. B. Ogun state, Nigeria
11 Adejuwon, O. T. and
Oyesola, O. B.
Benefits derived from Millennium
Development Goals facilitated
boreholes in rural areas of Ondo state,
Nigeria
77 – 82
12 Oladimeji, Y. U. and Edun,
A. J.
Determinants of child labour among
rural farming households in Kwara
state, Nigeria
83 – 89
13 Tijani, S. A. Sustainability of the youth agriculture
empowerment programmes in Osun
and Oyo states
90 – 99
14 Badiru, I. O., Akanbi F. S.
and Obar, E. E.
Reportage of forestry-related issues in
selected Nigerian newspapers
100 – 104

Nigerian Journal of Rural Sociology Vol. 18, No. 2, 2018
7
ADOPTION OF IMPROVED FARMING PRACTICES BY FLUTED PUMPKIN FARMERS IN
SELECTED ADP ZONES, ADAMAWA STATE, NIGERIA
Usman, I. S., Ndaghu, A. A., Waziri, U. M. and Olabanji, A. Department of Agricultural Economics and Extension, Modibbo Adama University of Technology, Yola,
Nigeria Correspondence e-mail address: [email protected]
ABSTRACT The study analyzed the adoption of improved recommended practices of fluted pumpkin by farmers in selected ADP Zones, Adamawa State, Nigeria. Six blocks (Three from Zones III and IV) were purposively selected based on their high involvement in fluted pumpkin farming with; 192 commercial fluted pumpkins farmers selected through snowball technique. Data for the study were collected using questionnaire which were analyzed using descriptive and inferential statistics. Results showed that most (85.4%) of the respondents were male with mean age of 37 years, educated (78.1%) and cultivated average of 1.6 hectares. The majority (80.2%) of the respondents sourced their information through friends and neighbours. Staking (99%), seed selection (95.8%), irrigation (100%) and harvesting (100%) were the recommended practices mainly adopted by the farmers. The study also revealed that poor provision of extension services (99%), high cost of inputs (85.4%) and poor road network (68.8%) were the major constraints faced by the respondents. Multiple regression analysis gave R2 of 0.57 indicating that 57% of the relationships were as a result of dependent variables in the model. It also revealed that, the coefficients of educational status (2.295), household size (1.901), Experience (2.407) and income (2.502) were positive and significant at 5% level. It was concluded that fluted pumpkin farming were mostly undertaken by male farmers that are in their active age and attended formal education. They cultivated an average farm size of 1.6 hectares with average household size of 7 people and were constrained by inadequate fund but had formal education which enables them to adopt and utilised recommended improved technologies. The study recommended that farmers growing fluted pumpkin should be sensitized on how to form agricultural cooperatives association for collective bargaining in acquiring loans. Keywords: Adoption, Fluted Pumpkin, Practices. INTRODUCTION Fluted pumpkin (Telfairia occidentalis) is a tropical vine, grown in West Africa as a leaf vegetable and for its edible seeds (fluted guard). It is one of the most important vegetable in Nigeria belonging to cucurbitaceae family (Opajobi, Esume, Osasuyi and Okehie, 2011). Fluted pumpkin comes first in the indigenous vegetable crops priority rating of south-eastern Nigeria and is believed to have originated there (Badifu and Ogunsina, 1991). The leaf is rich in minerals (Iron, `Potassium, Sodium, Phosphorus, Calcium and Magnesium), antioxidants, vitamins (thiamine, riboflavin, nicotinamide and ascorbic acids) and phyto-chemicals such as phenols (Fasuyi, 2006). The amino acid profile of Fluted pumpkin has also been shown to be very rich and includes alanine, aspartate, glycine, glutamine, histamine, lysine, methionine, tryptophan, cysteine, leucine, arginine, serine, threonine, phenylalanine, valine, tyrosine and isoleucine (Fasuyi, 2006). The fruit case and pulp of Fluted pumpkin which constitute 64% of whole fresh fruit weight can be used as feedstuff for livestock (Essien, Ebang and Udo, 1992; Egbekan, Nda-Sulaiman and Akinteye, 1998). The vegetable provides an appreciable cash income to small farm families (Akoroda, 1990). The seeds are eaten roasted, boiled or ground to paste as soup thickener (Eleke, 2004). Fluted pumpkin production and consumption has gained popularity in many other parts of Nigeria because of its medicinal, economic and
nutritive value (Ugwu, 2001). The crop forms one of the major components of human diet in many parts of Nigeria (Achinewhu and Isichei, 1990). Medicinally, the leaves and juice are recommended for pregnant women, lactating mothers and for the prevention of anaemia (Umeha, 2002). It also helps to solve gynaecological problems. These justify the apparent increase in its production in Nigeria. Food and Agriculture Organisation (FAO, 2002) noted that a non-wood crops are essentially part of the local subsistence economies but has not received the required attention. This is attributable to lack of awareness, poor production and marketing strategies, provision of technical advice on important issues which will help to reposition farmers to address the challenges of production and efficient marketing of the crops (Chah, Abugu, Nwobode, Asadu, and Igbokwe, 2013). It is widely acknowledged that efficient utilisation of production inputs and adherence to recommended production practices is the heart of successful agricultural production. This is because; the scope of agricultural production can be expanded and sustained by farmers through efficient utilisation of recommended production practices (Ali, 1996; Udoh, 2005). According to Francisca and Eyzayuirre (2006) increase in vegetable production could improve food security and offered employment opportunities to many unemployed people in Nigeria. One of the major vegetable crops produced in Adamawa State is fluted pumpkins which represent

Nigerian Journal of Rural Sociology Vol. 18, No. 2, 2018
8
an essential part of the agricultural products in the state. Producers now see its production as a viable business and produce it all year round. However, the crop has not been given much attention in research nor promoted as a viable enterprise particularly in the State (Ogusi, Begho and Ewolor, 2014). This necessitated the study of adoption of improved farming practices in order to inform the development of appropriate policy interventions for improved pumpkin production. The main objective of the study was to analyze the adoption of improved fluted pumpkin practices among farmers in selected ADP Zones in Adamawa State, Nigeria. The specific objectives of the study were to: i. describe the socioeconomic characteristics of
respondents in the study area; ii. assess respondents’ were awareness and
adoption of the recommended practices and iii. identify the constraints faced by the
respondents in adopting the recommended practices in the study area.
The hypothesis of the study: There are no relationships between the socioeconomic characteristics of the respondents and adoption of the recommended practices. METHODOLOGY
Adamawa State is located in North –eastern part of Nigeria. It lies between latitudes 70 and 110 N of the equator and longitudes 110 and 140 E of the Greenwich meridian (Adebayo and Tukur, 1999). It occupies a land area of about 42,159 square kilometres and has an altitude of about 185.9m above sea level. The study was conducted in ADP Zone III and IV, Adamawa State, Nigeria. Three Local Government Areas which were purposely selected were based on the concentration of commercial pumpkin farmers were involved in the study, Yola-North Local Government Area (ADP Zone III), Demsa and Numan Local Government Areas (ADP Zone IV). The study area lies between Latitude 9011’ and 9046’ North of the equator and between Longitudes 11000’ and12013’ East of the Greenwich Meridian. The Local government has a total land area of about 2,843 km2 with projected population of 411,227 people based on 2.9% yearly increment (NPC, 2017). The maximum temperature of the study area reaches 40oC, around April, while minimum temperature could be as low as 18.3oC between December and early January with a mean total rainfall of up to 919mm (Adebayo and Tukur, 1999). The major economic activities of the inhabitant include farming, civil service, trading, animal rearing and fishing. The vegetation of the study, availability and abundance of water (Rivers Benue and Gongola, and Lake Gerio) encourages irrigation farming (Adebayo and Tukur, 1999).
Primary data were used for this study. This was obtained by the used of questionnaire administered to the respondents. Data were obtained on socioeconomic characteristics of the respondents; adoption of the recommended practices and constraints faced by the respondents in the study area. Six cells (three from each zone) were purposively selected based on their involvement in commercial fluted pumpkin farming. The cells are those along the Bank of river Benue and Lake Gerio where there is water available for irrigation. One hundred and ninety two (192) commercial fluted pumpkins farmers were selected for the study using snowballing sampling technique. The analytical tools used for this study were descriptive and inferential statistics. Descriptive statistics involved frequency distribution, percentage and mean which were used to analyzed socioeconomic characteristics of the respondents, adoption of recommended practices and problems faced by the respondents (objectives i, ii, and iv). Inferential statistics (multiple regression) was used to analyze relationship between the socioeconomic characteristics of the respondents and the level of adoption of recommended practices (objective iii). The formula is given as: Y=f (X1, +X2, +X3, +X4 +, X5, + X6, µ) Where;
Y= level of adoption of the recommended practices by the respondents (percentage of recommended practices used by a respondent) X1= gender (dummy male 1, female 0) X2= age (years) X3= educational status (years of schooling) X4= household size (number) X5= farm size (in hectare) X6= farming experience (in years) X7= extension visit (number of visits/ year) µ= error terms
RESULT AND DISCUSSIONS
Result on Table 1 reveals that most (85.4%) of the respondents were male. This result shows that fluted pumpkin production in the study area was male dominated. This could be as a result of the responsibility on male being household head, they have to cater for the household members. The result corroborates the finding of Nizamuddin, Mohammed and Anisur (2009) who reported that fluted pumpkin are remunerative crops and that farmers, particularly men, turn towards it production as is known to generate quick income for sustenance. The age distribution of the respondents shows that majority 57.3% of the farmers were below 40 years of age, while the mean age of the farmers was 35 years. This implied that respondents were in their prime, therefore energetic and could put in their best in their
Nigerian Journal of Rural Sociology Vol. 18, No. 2, 2018
9
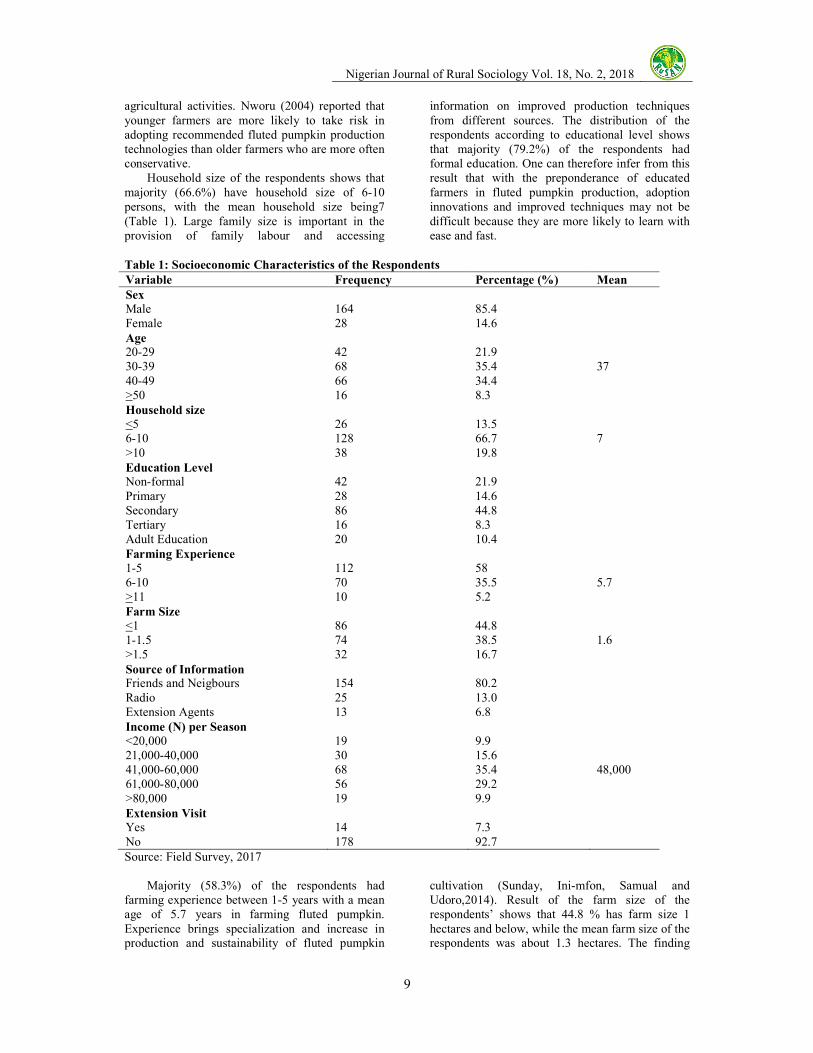
agricultural activities. Nworu (2004) reported that younger farmers are more likely to take risk in adopting recommended fluted pumpkin production technologies than older farmers who are more often conservative. Household size of the respondents shows that majority (66.6%) have household size of 6-10 persons, with the mean household size being7 (Table 1). Large family size is important in the provision of family labour and accessing
information on improved production techniques from different sources. The distribution of the respondents according to educational level shows that majority (79.2%) of the respondents had formal education. One can therefore infer from this result that with the preponderance of educated farmers in fluted pumpkin production, adoption innovations and improved techniques may not be difficult because they are more likely to learn with ease and fast.
Table 1: Socioeconomic Characteristics of the Respondents
Variable Frequency Percentage (%) Mean
Sex
Male 164 85.4 Female 28 14.6 Age 20-29 42 21.9 30-39 68 35.4 37 40-49 66 34.4 >50 16 8.3 Household size
<5 26 13.5 6-10 128 66.7 7 >10 38 19.8 Education Level Non-formal 42 21.9 Primary 28 14.6 Secondary 86 44.8 Tertiary 16 8.3 Adult Education 20 10.4 Farming Experience
1-5 112 58 6-10 70 35.5 5.7 >11 10 5.2 Farm Size
<1 86 44.8 1-1.5 74 38.5 1.6 >1.5 32 16.7 Source of Information Friends and Neigbours 154 80.2 Radio 25 13.0 Extension Agents 13 6.8 Income (N) per Season
<20,000 19 9.9 21,000-40,000 30 15.6 41,000-60,000 68 35.4 48,000 61,000-80,000 56 29.2 >80,000 19 9.9 Extension Visit Yes 14 7.3 No 178 92.7 Source: Field Survey, 2017
Majority (58.3%) of the respondents had farming experience between 1-5 years with a mean age of 5.7 years in farming fluted pumpkin. Experience brings specialization and increase in production and sustainability of fluted pumpkin
cultivation (Sunday, Ini-mfon, Samual and Udoro,2014). Result of the farm size of the respondents’ shows that 44.8 % has farm size 1 hectares and below, while the mean farm size of the respondents was about 1.3 hectares. The finding

Nigerian Journal of Rural Sociology Vol. 18, No. 2, 2018
10
reveals that fluted pumpkin farmers in the study area were mainly small scale farmers; thus fluted pumpkin production is at subsistence level. Ogusi et al. (2014) classified small scale farmers as those having 0.1 - 1.59 hectares farm size. Table 1 also reveals that80.2% of the respondents sourced their information on fluted pumpkin production from friends and neighbours, while 13.0% from Radio only 6.8% sourced their information from extension agents. This shows that there is inadequate extension coverage in the study area. About 35.4%of the respondents earned between N40, 000 to N60, 000 per season from fluted pumpkin production. This implies that pumpkin production is less profitable in the area, since this amount is hardly to carter for the needs of an average producer of the crop in a season. About 93% of the respondents had no extension visits. The result implies that there were inadequate extension services to the farmers. This may be due to low number of extension agents in the country. Chah, Abugu, Nwobode, Asadu and Igbokwe (2013) stated that, poor extension contact will often result in poor access to relevant information on how to improve agricultural production and this could be a discouraging factor for the farmers.
Awareness and adoption of recommended
practices Eleven recommended practices were made available to the farmers to identify their level of awareness and adoption. Result in Table 2 reveals that 99.0 % of the respondents indicated their awareness of selecting suitable site and land preparation for fluted pumpkin production with 93.2% adopting the practice. All the respondents (100%) were aware of the need for them to source their seed from accredited sources and 95.8% adopted such practice while 66.7% were aware of the need for seed treatment before planting but only 41.7 % adopted such a practice. Furthermore, 96.9% were aware of seed rate per hole to be
planted, while 87.5% adopted the practice. All (100%) of the respondents noted they were aware of the need for them to apply fertiliser, type and quantity of the fertiliser and they all (100%) adopted the practice. Fluted pumpkin needs irrigation especially during dry season (the time of irrigation and volume of water) all (100%) of the respondents were aware of this and adopted the practice. There is a need for staking of fluted pumpkin vine so as to encourage yield and to protect the crop from potential infections, 97.9% of the respondents were aware of this and 95.8% adopted the practice. Only 59.4% indicated they were aware on the importance and need for bio-control of pest, out of this figure 10.4 % adopted the practice. All (100%) the respondents were aware of the right time of pruning and harvesting of fluted pumpkin leaves so as to have fresh leaves and encourage sprouting and they all (100%) adopted the practice. Result in Table 2 shows that, awareness and adoption among the respondents of suitable site selection and land preparation, sourcing seed from accredited sources, seed rate, type and recommended quantity of fertiliser application, regular irrigation and staking were high. However, seed treatment and Bio-control of pest were low compared to other practices. The reason adduced by farmers in the study area for low adoption rate of Bio-control of pest and seed treatment was that farmers consider the two operations as extra expenses and time wasting. The low awareness and adoption of Bio-control of pest agrees with the findings of Richard (2009) on adoption of pumpkin production technologies adoption in East and Central Kenya. But contradict the findings of Kamai (2016) in a study he conducted on adoption of improved Okra production technologies by farmers in Maiduguri area which showed that seed dressing with chemical was the most adopted technology.
Table 2: Awareness and adoption of recommended practices
Variable Awareness Adoption Yes Yes
Site selection and land preparation 190 (99) 179 (93.2)
Seed selection 192 (100) 184 (95.8) Seed treatment 128 (66.7) 80 (41.7) Seed density 186 (96.9) 168 (87.5) Planting method 184 (95.8) 178 (92.7) Time of Weeding 192 (100) 171 (89.1) Fertiliser application 190 (99) 169 (88.0) Irrigation (Time and Volume) 192 (100) 192 (100) Staking 188 (97.9) 190 (99.0) Bio-control of pest 114 (59.4) 20 (10.4) Right time of Crop harvesting 192 (100) 192 (100) Source: Field Survey, 2017
Figures in Parenthesis indicates percentages

Nigerian Journal of Rural Sociology Vol. 18, No. 2, 2018
11
Relationship between socioeconomic
characteristics and level of adoption The result in Table 3 reveals that education (X3), Household size (X4), Farm size (X5), Experience (X6) and Income (X7) were positive and significantly related to the adoption of recommended fluted pumpkin production practices. The result also reveals a coefficient of multiple determination (R2) of 0.57. This is an indication that 57% of the variation in fluted pumpkin production practices adoption is explained by the explanatory variables of education, Household size, Farm size, Experience and Income. Education (X3) was positively related to the adoption of recommended practices at 5% of significant, which implied that as respondent’s level of education increases so also his level of adoption. This is because, education improves awareness by enabling farmers to comprehend the technicalities involved in modern methods of production. This argument was supported by Opara (2010) who asserted that, farmers with higher education are better equipped for making more informed decision for lives and for their communities as well as becoming active participants in economic, social, and cultural dimension of development. Coefficients of Household size (X4) and Experience (X5) were positively and significantly related to the level of adoption of recommended production technologies
at 5% level. This means, the higher the number of members of household of a respondent, the more the tendency of them using recommended production technologies of fluted pumpkin. This may be because members of the household may have the opportunities of getting new ideas from different sources as a result of interacting with different people and have family labour to practice the technologies. The positive and significance relationship of years of experience implies that, as the farmers experience increases, so also their use of the technologies and the ability to make use of the technologies correctly. Experience implies more familiarity, specialization and perfection with the practice of modern methods of fluted pumpkin farming, which could encourage their adherence to these practices. Farm size (X6) was significant at 1%and income (X7) at 5% to adoption of recommended practices. This shows that, the larger the farm owned by a farmer, the more the likelihood of the farmer using recommended practices of fluted pumpkin production. This could be because technologies brings easiness in carrying tasks, therefore, the larger a farm is, the more the tendency of the farmer adopting modern practices so as to ease his farm operations. Since a modern technology comes with financial implications, therefore, as the income of a farmer increases, his level of adoption will also increase.
Table 3: Socioeconomic Characteristics Influencing Adoption of Recommended Practices
Variable Coefficient Std. Error t- Statistics
Gender (X1) -4.94505 0.001623 -0.030 Age (X2) 0.015254 0.041975 0.363 Education (X3) 0.094559 0.041204 2.295** Household size (X4) 0.015844 0.008333 1.901281** Experience (X5) 0.043996 0.017834 2.467** Farm size (X6) 0.020853 0.004037 5.165* Income (X7) 0.110634 0.044222 2.502** Extension visit (X8) 0.055813 0.049884 1.119 Constant (C) 2.960255 0.112388 26.340* R2 0.57 Adjusted R2 0.54 F- Stat 23.017 *, ** Significant at 1 and 5% respectively Source: Field survey, 2017 Constraint faced by the respondents in fluted
pumpkin production Result of the constraints faced by respondents in the study area is presented in Table 4. It was revealed that 99.0% of respondents were constrained by inadequate extension services. Chah, Abugu, Nwobode, Asadu and Igbokwe (2013) stated that, poor extension contact will often result in poor access to relevant information on
how to improve agricultural production and this could be a discouraging factor for the farmers. High cost of inputs (85.4%) was the second constrained faced by respondents and 85.9% by poor access to irrigation facilities. About 69% of the respondents reported poor road network as a constraints. The state Government banned the use of motor cycle in the major towns of the state, which is the major means of transportation along the river bank since there is no road for vehicles.

Nigerian Journal of Rural Sociology Vol. 18, No. 2, 2018
12
Estolas (1996) reported that farmers experience a number of constraints in agricultural production; these includes inadequate fund, inadequate training
and extension support, inadequate irrigation facilities, high cost of farm inputs and road conditions among others.
Table 15: Constraints faced by the respondents
Constraints *Frequency Percentage Rank
Inadequate of extension service 190 99.0 1st High cost of inputs 164 85.4 2nd Poor road network 132 68.8 3rd Inadequate/ lack of funds 126 65.6 4th Inadequate irrigation facilities 78 40.6 5th *Multiple responses exists Source: Field Survey, 2017 CONCLUSION AND RECOMMENDATIONS
Based on the findings of the study, it was concluded that fluted pumpkin farming were mostly undertaken by male farmers that are in their active age and attended formal education. They cultivated an average farm size of 1.6 hectares with average household size of 7 people. The study also revealed that the socioeconomic variables (Education, Household size, Farm size, Experience and Income) of the respondents positively influenced the adoption of recommended practices. Generally, the awareness of the recommended practices by the respondents’ was high, but little discrimination existed in the adoption behaviour of the farmers with partial adoption among the farmers with respect to some recommended practices. In view of the findings of the study, the following recommendations are made: i. To increase fluted pumpkin production,
government and other non-government agencies should provide micro-credit to farmers.
ii. Farmers growing fluted pumpkin should form cooperative association which will help them to borrow from micro finance institutions.
iii. Extension services should be strengthened so that they can be making frequent visits to farmers.
iv. There is need for re-orientation of the existing innovations by the extension agents thereby making farmers to see the recommended practices as a package of solving problem which farmers should adopt all, not different units within a component from which to select and adopt only desired practices.
REFERENCES
Achinewhu, S. C. and Isichei, M. O. (1990). The nutritional evaluation of fermented fluted pumpkin (Telfairia occidentalis Hook F.) Discovery and Innovation 2: 62 – 65.
Adebayo, A. A. and Tukur, A. L. (1999). Adamawa State in Map, Publish by Department of Geography, Federal University of
Technology Yola, Adamawa State, Nigeria Pp. 1-35.
Akoroda, M. O. (1990). Ethnobotany of Telfairia
occidentalis (Cucurbitaceae) among Igbos of Nigeria. Economic. Botany. 44(1): 29-39.
Ali, K. (1996). “Positioning of fast-food outlets in two Region of North America: comparative study using correspondence Analysis,” with Kaynak, E. And Kechkemiroglu, O. Journal of
professional service marketing. 14(2): 99-119.
Badifu, G. I. O. and Ogunsina, A. O. (1991). Chemical composition of kernels from some Species of cucurbitaceous growth in Nigeria. Plant Food Human Nutrition.41: 35-44.
Chah, J. M., Abugu, R. O., Nwobode, C., Asadu, A. N. and Igbokwe, E. M. (2013). Agricultural extension needs of farmers in telfairia production and marketing in Enugu State, Nigeria. Journal of
agricultural Extension. 17(1): 49-60. Egbekan, M. K., Nda-Sulaiman, E. O. and
Akinteye, O. (1998). Utilisation of Fluted Pumpkin Fruit (Telfairia Occindentelis) in Marmalade Manufacturing. Plant Foods
for Human Nutrition.52(2): 171-176. Eleke, S. E. C. (2004). Vegetable for cash.
Saturday Daily Independent Newspapers.
October 30, pp. 88. Essien, A. L., Ebang, R. and Udo, H. B. (1992).
Chemical evaluation of pod and pulp of the fluted pumpkin (Telfairia
occindentalis) fruit. Food chemical. 45: 175-178.
Estolas, W. R. (1996). Extent of utilisation of farming technologies recommended by Benguet State University. MS Thesis. Benguet State University, La Trinidad, Benguet.
Fasuyi, A. O. (2006). Nutritional potentials of some tropical vegetable leaf meals: Chemical characterization and functional properties.

Nigerian Journal of Rural Sociology Vol. 18, No. 2, 2018
13
African Journal of Biotechnology.,5: 49-53.
Food and Agriculture Organisation (FAO), (2002). Report of the second consultation on agricultural information management. Rome, Italy. Available on http://www.fao.org/docrep/
Francisca, S. I. and Eyzayuirre, P. (2006). African leafy vegetables: Their role in the World Health Organisation’s Global Fruit and Vegetable Initiative.
Kamai, M. (2016). Study on Adoption of Improved Okra Production Technologies by Farmers in Maiduguri Area, Borno State, Nigeria. Agro-satellite Journal, 15(2):6-12
Nizamuddin, K., Mohammed, S., and Anisur, R. (2009). Vegetable revolution and rural sustainable development; a case study. Journal for Geography.4(1): 177- 188.
Nworu, J. C. (2004). “Rural Credit Markets and arable crop production in Imo State of Nigeria”, Ph. D. Dissertation, Department of Agricultural Economics, Michael Okpara University of Agriculture, Umudike, Nigeria
Richard, N. (2009). Socioeconomic Factors Influencing Smallholder Pumpkin Production, Consumption and Marketing in Eastern and Central Kenya Regions. Un-published MSc. thesis, School of Agriculture and Enterprise Development, Kenyatta University.
Sunday, B. A., Ini-mfon, V. P., Samual, J. U. and Udoro, J. U. (2014). Choice of soil
management technique as adaptation to climate change among fluted pumpkin farmers in Akwa-Ibom State, Nigeria. African Journal of Agricultural
Economics and Rural
Development.2(2):112-120. Udoh, E. J., and Akpan, S. B. (2011) Measuring
technical efficiency of water leaf (Talinum
triangulare) production in Akwa-Ibom State, Nigeria. American-Eurasian
Journal of Agriculture and Environmental
Science, 2(5), 518-522. Ogusi, O. D., Begho, T., and Ewolor, S. A. (2014).
Resource use efficiency and profitability of fluted pumpkin production in Ukwani Local Government Area of Delta State Nigeria. American Journal of Agriculture
and Forestry. 2(4): 129-134 Opajobi, A. O., Esume, C. O., Osasuyi, A. and
Okehie, C. C. (2011). Determination of the lead content of Pumpkin leaf Telfairia
Occindentalist in selected towns of Delta State, Nigeria. Journal of current world
Environment. 6(1): 39-44. Ugwu, F. J. (2001). Studies on the aetiology of the
wilt disease of fluted pumpkin in Nsukka Local Government Area of Enugu State. M.Sc. thesis submitted to Department of Botany, University of Nigeria, Nsukka.
Umeha, C. (2002). The imperatives of nutrition for pregnant mothers and growing children. The Guardian Newspapers p. 30

Nigerian Journal of Rural Sociology Vol. 18, No. 2, 2018
14
ADOPTION OF ORGANIC FARMING PRACTICES AMONG RURAL MAIZE FARMERS IN NIGER
STATE, NIGERIA
Abdullahi, A., Salihu, I. T., Umar, I. S. and Hassan, S. Department of Agricultural Economics and Extension Technology, Federal University of Technology, Minna,
Niger State, Nigeria
Correspondence e-mail address: [email protected]
ABSTRACT
The study investigated adoption of organic practices among rural maize farmers in Niger state, Nigeria, with
specific objectives of describing socioeconomic characteristics of the farmers, identifying farmers’ sources of
information on organic practices, examining adoption level of organic practices in maize production and
identifying constraints limiting adoption of organic practices by the farmers. A multi-stage sampling procedure
was used to select 222 maize farmers and data collected through structured questionnaire were analyzed using
frequency counts, means and percentages. Results obtained shows that farmers in the study area were males
(70.3%), mostly married (75.7%) with formal education (62.6%) at mean age and household size of 35.8 years
and six (6) persons respectively. Also, farmers regularly acquire information about organic practices through
extension agents (72.5%), relatives and neighbours (90.1%). Similarly, eight (8) out of the 15 practices
identified were adopted. These include crop rotation (59.9%), mixed cropping (79.7%), mixed farming (73.0%),
hoe/hand weeding (61.3%), slash and burn (54.1%), hoe/minimum tillage (66.2%), farm yard manure (53.2%)
and crop residue incorporation (83.8%). Total adoption by the farmers was restricted by constraints such as;
high costs of organic inputs (x̅=2.92), Difficulty in accessing loans for organic crop production (x̅=2.86) and
low supply of manure (x̅=2.86). To this end, adoption level of organic practices among rural maize farmers in
Niger State can be said to be moderate thus; it was recommended that change agents should enlighten farmers
on various organic methods of weed, pest and disease control through the major sources of information in the
area.
Keywords: Source of information, Organic Farming practices, Adoption
INTRODUCTION
The mainstay of the Nigerian economy prior to the oil boom era was agriculture and even with the discovery and subsequent exploration of oil. Agriculture still accounts for over 38 percent of the non-oil foreign exchange earnings and employs about 70% of the active labour force of the Nigerian population (Oyesola et al, 2011). However, attempt to meet the food demand of the continuously rising population of the country brought about expansion of farming area, as well as an increase in the use of agro-chemicals, the long-term effect of which leads to soil depletion and does not support sustainable crop production. Organic farming is a form of agriculture which excludes the use of synthetic fertilisers, pesticides and plant growth regulators. The system also seeks to maintain the fertility demands of various crops to avoid excessive depletion of soil nutrients (Adesope, Oguzor and Ugwuja, 2012). Organic scientists and farmers in Africa, therefore deliberately integrates the age-long traditional organic system of farming with contemporary farming techniques to enable a holistic development of crop production system that would make use of the locally available resources, drawing from the pragmatic experiential knowledge of the farmers thereby making it highly relevant and acceptable to the majority of Africa.
The horrendous side effects of non-decomposable chemical fertiliser and pesticide applied by most inorganic farming practices over the years is evident in the contaminated water sources, vegetable crops and other edible plants. The bigger picture that rarely makes news however is that millions of people are still underfed and whether they get enough to eat or not, the food they eat has the capability to killing them. Yet, the picture painted for the future by agro-chemical and seed companies and governments is rosy and bright. Surprisingly, despite these threats, Nigeria crop farmers are still very much in the system of producing crops inorganically. Nigeria appears to be ‘lagging’ in the adoption of organic farming practices, with very few farms or projects operating at an uncertified organic agricultural level (Oyesola et al., 2011). In view of the above, this research work seeks to assess the adoption level of organic technologies among rural maize farmers in Niger State, Nigeria. To this end, this study will attempt to achieve the following specific objectives: i. describe the socioeconomic characteristics of
maize farmers in the study area; ii. determine the sources of information on
organic practices in the area;

Nigerian Journal of Rural Sociology Vol. 18, No. 2, 2018
15
iii. examine the adoption level of organic practices in maize production;
iv. identify the constraints limiting the adoption of organic practices in maize production.
METHODOLOGY
This study was conducted in Lapai, Bosso and Kontagora Local Government Areas of Niger State, Nigeria. Niger State was created out of the former North Western State and became a fully autonomous State on 3rd February, 1976, with headquarter at Minna. Niger State is in the North-central part of Nigeria and lies in between longitude 30 301 and 70 201 East of the Greenwich Meridian and latitude 80 201 and 110 301 North of the equator. The State presently comprises of 25 Local Government Areas (LGAs) and it is made up of three major ethnic groups which are the Nupe, Gbagyi and Hausa. However the total inhabitants in the State are over 3,954,772 people (National Population Commission of Nigeria, 2016) from 2006 population census. But, going by the annual population growth rate of 2.5 percent in Nigeria (NPC, 2016), the population of Niger State was projected to be 5,556,200 (NPC, 2016) by the year 2016. Multistage sampling technique was adopted to select sample for this study. The first stage involved random selection of one Local Government Area from each of the three (3) agricultural zones in the area. Second stage involved random selection of three (3) villages from each of the selected LGA. The third stage involved the use of 10% of the sample frame thus, a total of 222 respondents were selected as sample size from the 2,222 registered maize farmers in the selected villages in the study area. Primary data were used for this study. Data collection was conducted through structured questionnaire complemented with an interview schedule and lasted between April and June, 2018. The data collected were analyzed using descriptive statistics involving mean, percentages and frequency distribution. In addition a 3-point Likert type of scale was used to measure the sources of information and constraints to adoption of organic farming practices among maize farmers thus, a reference mean of three (3) was derived (3+2+1=3) and used as decision rule: Regularly=(3), Occasionally =(2) and Never=(1) Severe Constraints (SC) =3, Not Severe Constraints (NSC) =2 and Not Constraint (NC) =1
RESULTS AND DISCUSSION
Socioeconomic characteristics of the farmers The results in Table 1 reveals that majority (84.2%) of the respondents were between the ages of 21-50 years with an average age of 35.82 years. This implies that the farmers are young and still in their productive age, thereby constituting readily
available labour force for organic maize production. This agrees with the findings of Adesope et al. (2012), who reported that young farmers are mostly cosmopolitan in nature and therefore tend to recognize and adopt farm innovation with little bottleneck. Similarly, majority (70.3%) of the respondents were male while (29.7%) were female. The more involvement of male in maize farming may probably be due to the cultural and religious belief of the rural people (especially in Northern Nigeria) which tends to restrict women to household domestic chores. In most rural community, women are not usually allowed to own land and where women own land; they usually delegate its responsibility to their senior male child, brother or husband (FAO, 2001). This implies that the high involvement of male in maize production is connected to the role of male gender as the household head. This finding agrees with that of Solomon (2008), who reported that male gender dominated the crop farming enterprise in Northern Nigeria. The result further reveals that majority (75.7%) of the respondents were married and this comes along with responsibilities to the family. Therefore, additional responsibilities attached to marriage especially provision of nutrition may have been the motivation for venturing into organic maize farming. This agrees with the findings of Oyesola et al. (2011) who observed that marital responsibility led farmers to expand their land cultivation so as to increase food security in the household. In the same vein, the result revealed that farmers had a fairly large household size with a mean value of six (6) members per household in the area. This has implication on the availability of family labour for farm work. The large number of household members in the study area may be due to the polygamous nature of the rural people who tend to recognize household population as a symbol of authority among farmers. Although, the larger the household size, the higher the demand for food by each person within the household. This result agrees with the findings of Marenya and Barrett (2007) who observed that as the household size increases, the likelihood of expanding cultivated farm land is expected to be high among rural crop farmers. Table 1 further reveals that majority (62.6%) of the respondents had formal type of education involving attending primary, secondary and tertiary institutions while 37.4% had non-formal type of education related to skills acquisition and training. Given this level of literacy, it is expected that information on organic practices may be disseminated with ease among farmers and this could influence their decision to adopt organic practices. This finding agrees with Yengoh (2010) who reported that personal characteristic especially,

Nigerian Journal of Rural Sociology Vol. 18, No. 2, 2018
16
education influences adoption of new technology among rural crop farmers in Nigeria.
Table 1: Socioeconomic characteristics of the farmers (n=222)
Variables Frequency Percentage (%) Mean
Age (years) ≤ 20 19 8.6 35.82 21-30 50 22.5 31-40 88 39.6 41-50 49 22.1 ≥ 51 16 7.2 Gender Male 156 70.3 Female 66 29.7 Marital status Married 168 75.7 Single 42 18.9 Divorce 8 3.6 Widow 4 1.8 Household size 5 and below 106 47.7 6.00 6-10people 91 41.0 11-15people 24 10.8 16 and above 1 0.5 Formal education Non formal 83 37.4 Primary 31 14.0 7 Secondary 60 27.0 Tertiary 48 21.6 Farming experience 10years and below 87 39.2 15 11-20years 83 37.4 21-30years 36 16.2 31years and above 16 7.2 Land ownership Self 154 69.4 Otherwise 68 30.6 Farm size (Ha) < 2 150 67.6 1.89 ≥ 2 72 32.4
Source: Field survey, 2018 Furthermore, the mean years of farming experience of the respondents is 15years as shown in Table 1. The number of years a farmer has spent in maize production is an indication of the practical knowledge acquired by the farmer in maize farming over the years. Therefore, the accumulated years of experience by the respondents may help them in accessing benefit of organic inputs and practices in maize production with relative ease. This agrees with the findings of Kassie et al. (2015) who stressed that farmers with long time farming experience easily access opportunities to quality agro-inputs. The result also shows that land tenure is not a problem in the area as majority (69.4%) of the respondents owned the land they use for maize farming however, the size of the farms are
relatively small considering that majority (67.6%) had farm sizes less than 2.0 hectares at a mean value of 1.89 hectares per farmer. This implies that the respondents are small scale farmers operating at subsistence level of maize production thus, investing on organic practices such as mixed farming, crop rotation and agro forestry may limit space for maize production. This finding is supported by Kassie et al. (2013) who revealed that land ownership and farm size motivate rural farmers to improved farming practices in maize production.
Sources of information on organic farming
practices Sources of information of the respondents on organic practices were presented in Table 2. It was

Nigerian Journal of Rural Sociology Vol. 18, No. 2, 2018
17
noted that most of the information sources provides farmers with useful information on organic farming but not on a regular basis; farmers in the area regularly receive information about organic farming practices through family and friends (��=2.81), as well as extension agents (��=2.59). The result shows that information spread faster via informal sources among the farmers compared to print media and other formal methods of communication. This result is also tied to the fact
that majority of the farmers had non formal type of education hence, farmers may only seek and accept innovations that has been tested and satisfied useful by friend, relatives and change agents. This finding is in agreement with Adesope et al. (2012) who stated that sources of information for farming activities among rural crop farmers is mostly through friends, relatives, neighbours and extension agents.
Table 2: Sources of Information on Organic Farming Practices
Sources of information Regularly Occasionally Never Mean Rank
Family and Friends 200(90.1) 2(0.9) 20(9.0) 2.81* 1st
Extension agent 161(72.5) 32(14.4) 29(13.1) 2.59* 2nd
Television 7(3.2) 66(29.7) 149(67.1) 1.36 6th
Radio 57(25.7) 71(32.0) 94(42.3) 1.83 3
rd
Cooperative society 46(20.7) 61(27.5) 115(51.8) 1.69 4th
Workshops and seminars 18(8.1) 45(20.3) 159(71.6) 1.36 6th
Print media 16(7.2) 62(27.9) 114(64.9) 1.42 5
th
*= Significant, Decision rule: ��>2= Regular source and ��< 2 = Occasional Source Source: Field survey, 2018
Levels of adoption of organic farming practices
among maize farmers The result in Table 3 indicated that about 83.8% and 79.7% of the farmers adopted the practice of crop residues incorporation and mix cropping as the major organic farming practices respectively. Other practices adopted by the farmers include mix farming (73.0%), hand weeding (66.2%), flame weeding (61.3%), crop rotation (59.9%) zero/hoe tillage (54.1%), and farm yard manure (53.2%). From the findings it is
obvious that farmers adopted eight (8) out of fifteen (15) listed organic farming practices, giving an adoption rate of 53.33%. This indicates that level of adoption of organic farming practices is relatively moderate. This finding is in contrast with the result of Adesope et al. (2012) who reported that adoption of organic farming practices is very low (35.7%) in Owerri, as farmers adopted five (5) out of the fourteen listed organic farming practices in the area.
Table 3: Levels of Adoption of Organic Farming Practices among Maize Farmers
Organic practices NA AW I E T A D Rank
Crop rotation 23(10.4) 48(21.6) 6(2.7) 2(9) 6(2.7) 133(59.9)* 4(1.8) 6th Mixed cropping 4(1.8) 17(7.7) 11(5.0) 0(0) 13(5.9) 177(79.7)* 0(0) 2nd Mixed farming 11(5.0) 22(9.9) 4(1.8) 18(8.1) 0(0) 162(73.0)* 5(2.3) 3rd Slash-burn/flame weeding 15(6.8) 20(9.0) 14(6.3) 3(1.4) 29(13.1) 136(61.3)* 5(2.3) 5th Zero/hoe Tillage 6(2.7) 47(21.2) 18(8.1) 11(5.0) 20(9.0) 120(54.1)* 0(0) 7th Green manure 70(31.5) 70(31.5) 41(18.5) 28(12.6) 14(6.3) 0(0) 0(0) 14th Composting 56(25.2) 74(33.3) 62(27.9) 18(8.1) 12(5.4) 0(0) 0(0) 15th Hand picking of insects 57(25.7) 69(31.1) 46(20.7) 8(3.6) 8(3.6) 29(13.1) 6(2.7) 12th Organic pesticide 27(12.2) 66(29.7) 25(11.3) 14(6.3) 46(20.7) 42(18.9) 0(0) 11th Bio pest control 95(42.8) 86(38.7) 11(5.0) 12(5.4) 8(3.6) 10(4.5) 0(0) 13th Hoeing/hand weeding 11(5.0) 22(9.9) 6(2.7) 14(6.3) 13(5.9) 147(66.2)* 9(4.1) 4th Use of organic fertiliser 5(2.3) 38(17.1) 23(10.4) 0(0) 45(20.3) 106(47.7) 5(2.3) 9th Farm Yard Manure 0(0) 35(15.8) 20(9.0) 6(2.7) 43(19.4) 118(53.2)* 5(2.3) 8th Planting trees/hedges 0(0) 18(8.1) 15(6.8) 19(8.6) 58(26.1) 81(36.5) 31(14) 10th Residues incorporation 9(4.1) 27(12.2) 0(0) 0(0) 0(0) 186(83.8)* 0(0) 1st NA= Not Aware, A=Awareness, I= interest, E= Evaluation, T= Trial, A=Adoption, D=Discontinuance, *=Adopted practices. Decision rule: Adoption scores>50%=High Adoption Source: Field Survey, 2018
Constraints to adoption of organic farming
practices among maize farmers
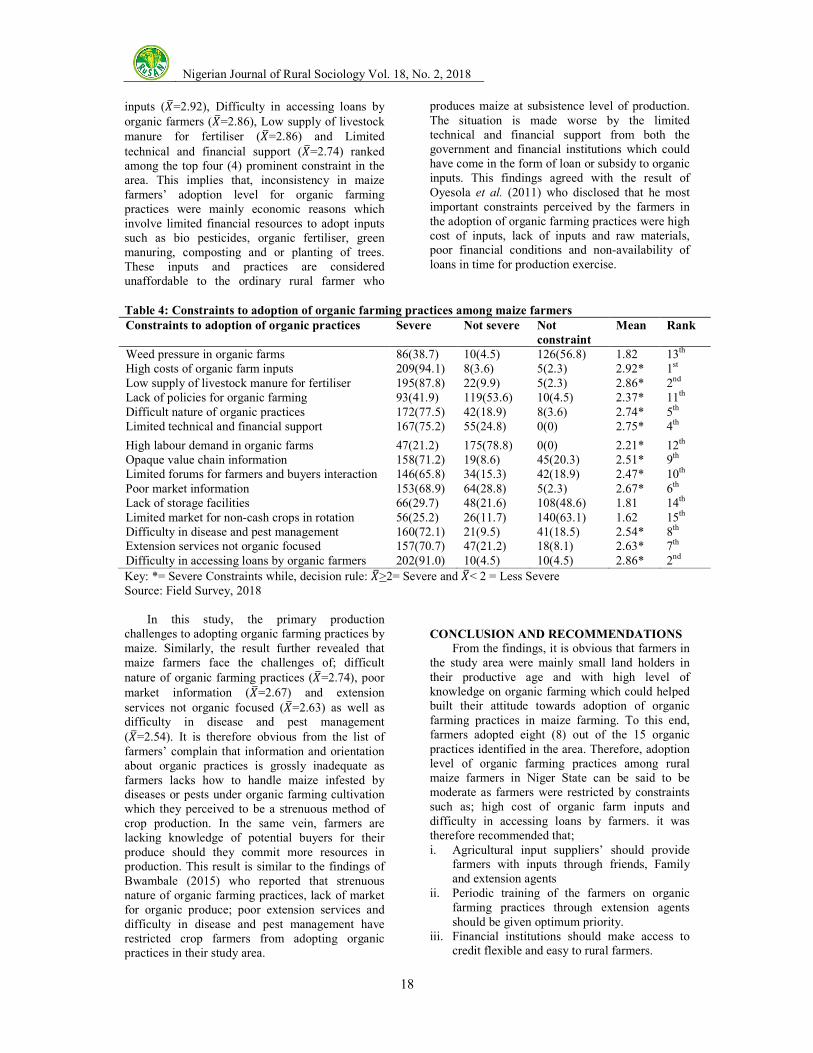
The result in Table 4 revealed that Farmers challenges to adoption of organic inputs in the study area included; High costs of organic farm
Nigerian Journal of Rural Sociology Vol. 18, No. 2, 2018
18
inputs (��=2.92), Difficulty in accessing loans by organic farmers (��=2.86), Low supply of livestock manure for fertiliser (��=2.86) and Limited
technical and financial support (��=2.74) ranked among the top four (4) prominent constraint in the area. This implies that, inconsistency in maize farmers’ adoption level for organic farming practices were mainly economic reasons which involve limited financial resources to adopt inputs such as bio pesticides, organic fertiliser, green manuring, composting and or planting of trees. These inputs and practices are considered unaffordable to the ordinary rural farmer who
produces maize at subsistence level of production. The situation is made worse by the limited technical and financial support from both the government and financial institutions which could have come in the form of loan or subsidy to organic inputs. This findings agreed with the result of Oyesola et al. (2011) who disclosed that he most important constraints perceived by the farmers in the adoption of organic farming practices were high cost of inputs, lack of inputs and raw materials, poor financial conditions and non-availability of loans in time for production exercise.
Table 4: Constraints to adoption of organic farming practices among maize farmers
Constraints to adoption of organic practices Severe Not severe Not
constraint
Mean Rank
Weed pressure in organic farms 86(38.7) 10(4.5) 126(56.8) 1.82 13th High costs of organic farm inputs 209(94.1) 8(3.6) 5(2.3) 2.92* 1st Low supply of livestock manure for fertiliser 195(87.8) 22(9.9) 5(2.3) 2.86* 2nd Lack of policies for organic farming 93(41.9) 119(53.6) 10(4.5) 2.37* 11th Difficult nature of organic practices 172(77.5) 42(18.9) 8(3.6) 2.74* 5th Limited technical and financial support 167(75.2) 55(24.8) 0(0) 2.75* 4th
High labour demand in organic farms 47(21.2) 175(78.8) 0(0) 2.21* 12th Opaque value chain information 158(71.2) 19(8.6) 45(20.3) 2.51* 9th Limited forums for farmers and buyers interaction 146(65.8) 34(15.3) 42(18.9) 2.47* 10th Poor market information 153(68.9) 64(28.8) 5(2.3) 2.67* 6th Lack of storage facilities 66(29.7) 48(21.6) 108(48.6) 1.81 14th Limited market for non-cash crops in rotation 56(25.2) 26(11.7) 140(63.1) 1.62 15th Difficulty in disease and pest management 160(72.1) 21(9.5) 41(18.5) 2.54* 8th Extension services not organic focused 157(70.7) 47(21.2) 18(8.1) 2.63* 7th Difficulty in accessing loans by organic farmers 202(91.0) 10(4.5) 10(4.5) 2.86* 2nd
Key: *= Severe Constraints while, decision rule: ��>2= Severe and ��< 2 = Less Severe Source: Field Survey, 2018 In this study, the primary production challenges to adopting organic farming practices by maize. Similarly, the result further revealed that maize farmers face the challenges of; difficult nature of organic farming practices (��=2.74), poor market information (��=2.67) and extension services not organic focused (��=2.63) as well as difficulty in disease and pest management (��=2.54). It is therefore obvious from the list of farmers’ complain that information and orientation about organic practices is grossly inadequate as farmers lacks how to handle maize infested by diseases or pests under organic farming cultivation which they perceived to be a strenuous method of crop production. In the same vein, farmers are lacking knowledge of potential buyers for their produce should they commit more resources in production. This result is similar to the findings of Bwambale (2015) who reported that strenuous nature of organic farming practices, lack of market for organic produce; poor extension services and difficulty in disease and pest management have restricted crop farmers from adopting organic practices in their study area.
CONCLUSION AND RECOMMENDATIONS
From the findings, it is obvious that farmers in the study area were mainly small land holders in their productive age and with high level of knowledge on organic farming which could helped built their attitude towards adoption of organic farming practices in maize farming. To this end, farmers adopted eight (8) out of the 15 organic practices identified in the area. Therefore, adoption level of organic farming practices among rural maize farmers in Niger State can be said to be moderate as farmers were restricted by constraints such as; high cost of organic farm inputs and difficulty in accessing loans by farmers. it was therefore recommended that; i. Agricultural input suppliers’ should provide
farmers with inputs through friends, Family and extension agents
ii. Periodic training of the farmers on organic farming practices through extension agents should be given optimum priority.
iii. Financial institutions should make access to credit flexible and easy to rural farmers.

Nigerian Journal of Rural Sociology Vol. 18, No. 2, 2018
19
REFERENCES
Adesope, O. M., Oguzor, N. S. and Ugwuja, V. C. (2012). Effect of socioeconomic characteristics of farmers on their adoption of organic farming practices. Crop production technologies, Peeyush Sharma (Ed.), In Tech, Retrieved on Feb 22 2018 from http://www.intechopen.com/books/crop-production-technologies/effect-of-socioeconomic-characteristics-offarmers-on-their-adoption-of-organic-farming-practices
Bwambale, N. (2015). Farmers’ knowledge, perceptions, and socioeconomic factors influencing decision making for integrated soil fertility management practices in Masaka and Rakai Districts, Central Uganda. Journal of Graduate and
Dissertations, Paper 15231,21pp
Food and Agriculture Organisation of the United Nations (FAO) and World Health Organisation (WHO) (2001). Guidelines for the production, processing, labeling and marketing of organically produced foods. FAO and WHO Codex AlimentariusCommission, Rome. CAC/GL 32 1999 Rev.1 2001. ftp://ftp.fao.org/codex/standard/booklets/Organics/gl01_32e.pdf. March 02, 2018
Kassie, M., Teklewold, H., Jaleta, M., Marenya, P., and Erenstein, O. (2015). Understanding the adoption of a portfolio of sustainable intensification practices in eastern and southern Africa. Land Use Policy, 42 (2015), 400–411
Marenya, P. P. and Barrett, C. B. (2007). Household-level determinants of adoption of improved natural resources management practices among smallholder farmers in Western Kenya. Journal of
Food Policy, 32(4), 515-536. National Population Commission of Nigeria
(NPCN) (2016). Available online: Retrieved fromhttps://www.citypopulation.de/php/nigeria-admin.php?adm1id=NGA027: 21 March, 2016.
Oyesola, O. and Obabire, I. E. (2011).Farmers perceptions of organic farming in selected Local Government Areas of Ekiti State, Nigeria. Journal of Organic Systems, 6(1), 20-26.
Solomon, O. (2008). Small scale oil palm farmers’ perception of organic agriculture in Imo State, Nigeria. Journal of Environmental
Extension, 7(1), 67-71. Yengoh, G. T., Armah, F. A., and Svensson, M. G.
(2010). Technology adoption in small-scale agriculture. Science, technology and
innovation studies, 5(2), 111–131

Nigerian Journal of Rural Sociology Vol. 18, No. 2, 2018
20
IDENTIFYING INTERMEDIARY ROLE OF OPINION LEADERS IN ROMA VALLEY, LESOTHO
Akintunde, M. A. O. and Thetsane, N. Department of Agricultural Economics and Extension, National University of Lesotho, Maseru, Lesotho
Correspondence e-mail address: [email protected] ABSTRACT The study was aimed at investigating intermediary roles of opinion leaders. Key objectives were to describe perception of farmers regarding personal attributes of farmers; agricultural information dissemination by opinion leaders; roles and identification of opinion leaders. The study was carried out in six villages in Roma Valley and quantitative research design was used. Systematic random sampling was used to come up with 60 respondents, and data were collected using structured questionnaire. Data were analysed using descriptive statistics. Findings reveal that opinion leaders are useful in delivery of information based on the perceptions of farmers in Roma Valley; they are identified by the traits they possess, interests of farmers and other factors. The study found that opinion leaders are young and mature adults; most of them are educated and have high socio-economic status compared to their followers. They are also able to access agricultural information from the internet which farmers were found not to be accessing. Keywords: Opinion leaders, personal attributes and agricultural information INTRODUCTION
Roma valley is a rural area in which the National University of Lesotho is located and most people practise agriculture; therefore they need information on innovations for improved production. Farmers in Lesotho depend mostly on radio, television and extension agents as information sources, but some families cannot access these sources. Opinion leaders can work as a helping hand to assist in disseminating agricultural information to farmers. Duncan and Peter (2007) stated that opinion leaders can act as intermediaries between mass media and the majority of society and the fact that they influence flow of information from the media to followers, in a two-step flow model. According to Ronald (1999), opinion leaders are more precisely, opinion brokers who carry information across social boundaries between groups. Valente and Pumpuang (2007) stated that opinion leaders are people who influence the opinions, attitudes, beliefs, motivations and behaviours of others. Opinion leaders are from within the villages and Thomas (1996) refers to them as early adopters who give information to late adopters. Leeuwis and Ban (2004) stated that different people can be opinion leaders on distinct matters and for different groups of people and that opinion leaders tend to be influential only in specific parts of the community. This can affect the diffusion of agricultural information because of this differential behaviour. As defined by Williams (2005), opinion leadership has the ability to informally influence the person’s attitude and behaviour in a desired way or a two-step flow of communication in which information passes through media first and reaches the opinion leaders, who then pass it to fellow farmers. Opinion leaders are risk takers, they are not reluctant to adopt innovation first, and are not afraid of failure. Opinion leaders work as middle men between the extension worker and the farmers. They get
information from the extension workers to disseminate to farmers and they do this effectively. According to Ronald (1999), opinion leader’s conversation makes the innovation contagious to the people with whom they talk. They are believed by farmers because they are part of the villagers who would want to do the best for the villagers, hence the success in adoption of innovations. Influential people are expected to have three important traits; they should be convincing, know a lot and have a large number of people (Iyengar et
al., 2009). Because the opinion leaders are influential, they have the same traits. Some may have had good education or are experts and have the desire to know about new innovations. Opinion leaders are influential, able to successfully convince farmers to adopt innovations and accelerate the rate of diffusion of information, and are willing and able to assist farmers with information they need. Leeuwis and Ban (2004) stated that opinion leaders are influential people in shaping opinions of various kinds. Duncan and Peter (2007) noted that the influence of opinion leaders is direct and derives from the informal status of individuals who are highly updated and respected. Williams (2005) stated that factors that are worth considering about opinion leaders being liked and respected by farmers are that they make wise decisions and have clear understanding of local needs. In developing countries, innovations are transferred to farmers in a top-down approach where farmers are told what to do without looking at their real needs. This is why the innovations fail because farmers are not interested. Reflecting on post-apartheid South Africa, Duvel (2008) stipulated that white communities have a greater percentage of opinion leaders and socio-economic status tends to be the important barrier to accessibility, while in black communities, distance or physical accessibility is a serious constraint with the result that about 80 per cent of the opinion leaders to be consulted live within a 2kilometre radius. Because of limited number of

Nigerian Journal of Rural Sociology Vol. 18, No. 2, 2018
21
the opinion leaders, farmers have to travel a long distance to reach one. This happens in places where the villages are far apart from one another. Duvel (2008) noted that, in developing countries, there is a shortage of extension workers to facilitate quick dissemination of agricultural messages. The opinion leaders can play a major role, especially, in developing countries in diffusion of agricultural information to close the gap of fewer extension agents to farmers. A small number of farmers are able to access agricultural information through different sources and a large number cannot access up to date information concerning agriculture, hence the study described the characteristics of opinion leaders as perceived by farmers to effectively pass information to farmers to bridge the existing gap between farmers and extension workers The purpose of the study was to investigate the perceptions of farmers in Roma valley regarding the characteristics of opinion leaders. The specific objectives are: i. To describe the perception of farmers
regarding personal attributes of opinion leader. ii. To describe the perceptions of farmers
regarding agricultural information dissemination by opinion leader.
iii. To determine the identification of opinion leaders in Roma Valley and how they can be used by extension agents.
METHODOLOGY The study was conducted in Roma valley. The quantitative design was used and was cross sectional. Data collected was transformed into numerical form. Quantitative research is used to quantify the problem by a way of generating numerical data or data that can be transformed into usable statistics. It quantifies attitude, opinions and behaviour (DeFranzo, 2011). Population of the study was farmers from following six villages in Roma Valley: Mafikeng with 123 population size, Thoteng (401), Liphehleng (126), Hatabutle (271), Ha Mafefooane (279) and Mahlanyeng (129). A sample was chosen proportionately from each village to come up with a total sample of 60 respondents. Simple random sampling was used in selecting the sample of the study from the villages. Questionnaire with both open ended and close ended questions was used in the study. Instrumentation was developed with the use of literature review and consultations with experts. To test for reliability, the instrument was administered on 15 farmers. Cronbach Alpha
Formula was used to test for reliability coefficient which was fond to be 0.77. Primary data was collected using interview schedule and executed through face to face interview with the farmers.Quantitative data were analysed using and was presented with frequencies and percentages.
RESULTS AND DISCUSSION
The demographic characteristics of opinion leaders that were collected from the farmers include gender, age, marital status, educational level source of income and socio-economic status. The findings relating to these characteristics are presented in Table 1. The results reveal that fifty three percent of respondents receive advice from females and 47% from males. This shows development of women in agriculture as it was known to be man’s activity. Majority (70.0%)of their advisers were young and mature adults, while 30.0% were elderly people. Young people are being engaged in the development of agriculture other than in the past when old people were the ones interested in agriculture. The majority (75.0%) were married, 23.0% were widowed while 2.0% were single. Forty-eight percent of advisers had formal education qualifications (Primary School Leaving Certificate and Junior Certificate), 38.0% had post-secondary school education qualifications (certificate, diploma and degree) and 14.0% had non-formal education. This results show that farmers use people that are educated and understand our second language in case farmers need interpretation, the can do that without the problem. The majority (73%) of respondents showed that their opinion leaders get income from farm produces, while 68% of them are employed. This may imply that farmers do not easily access the advisers who are employed because they spend most of their time at work other than the ones who are selling their products. Majority (70%) of the respondent had lower socio- economic status compared to that of their advisers, 24% of the respondents had the same socio-economic status as their advisers and minority (6%) had high socio-economic status to that of the adviser. These results implied that people prefer to get advices from people that are wealthier and consultations for advices may be difficult because those people might be too busy. These findings are similar to that of Duvel, 2008 who stated that farmers consult people with higher socio-economic status compared to theirs.

Nigerian Journal of Rural Sociology Vol. 18, No. 2, 2018
22
Table 1: Distribution of farmers by demographic characteristics of their opinion leaders
Demographic Characteristics Frequency Percentage
Sex Male 28 46.7
Female 32 53.3 Age 25-35 years 18 30.0
36-45 years 24 40.0 46-55 years 7 11.7 More than 55 years 11 18.3 Marital Status Married 45 75.0 45 75 Single 1 1.7
Widowed 14 23.3 Educational Level Primal School Leaving Certificate 3 5.0
Junior Certificate 26 43.3 Higher education 23 38.3 Non-formal education 8 13.3 Source of Income Employment 41* 68.3 Farm produce 44* 73.3
Socio-economic status Much higher than respondents 17 28.3
Higher than respondents 25 41.7 Same as respondents 14 23.6 Lower than respondents 4 6.7 Much lower than respondents 0 0 *Multiple responses Source: Field survey, (2017)
Personal attributes of opinion leaders
The respondents were asked to indicate their opinions on whether the selected traits are the traits that a good leader should possess. The findings reveal in Table 2 that the following were traits that need to be possessed by a good leader: reliability (100%), accessibility (100%) and communication skills (90%). Surprisingly, respondents did not consider honesty (2.0%) as one of the attributes of an opinion leader. The study found that accessibility is an important trait when 100% of the respondents indicated that indeed accessibility was one of the characteristics that the adviser should possess. The implication is that accessibility of an individual is considered when choosing the adviser. Accessibility of the adviser to the farmer can be determined by the socio-economic status of the adviser to that of farmers. The higher the socio economic status of the adviser to that of a famer the harder it becomes to consult for advices. According to Williams (2005), knowledge without
accessibility to other people in the social groups will prevent the knowledge from being available to others. All (100.0%) of the respondents opined that the adviser should be reliable. That is the adviser should have access to the latest information and can be trusted depending on whether an individual has helped people and they were able to overcome their problems after the assistance. Majority of the respondents (90%) chose communication skill as one of the good traits a leader should possess. A leader should have the ability to communicate with people and listen to the followers. This will make people understand what is been delivered to them and develop interest and this may lead to high adoption rate. Majority (98%) of the respondents regarded honesty as less important trait an adviser should possess. Honesty or dishonesty of the adviser does not have an impact on the farmers as long as they get the help they need.
Table 2: Distribution of farmers’ perception regarding personal attributes of opinion leaders
Personal attributes of opinion leader Yes (%) No (%)
Reliability 100.0 0.0 Accessibility 100.0 0.0 Communication skills 90.0 10.0 Honesty 2.0 98.0 Source: Field survey (2017)

Nigerian Journal of Rural Sociology Vol. 18, No. 2, 2018
23
Farmers’ perception of dissemination of
agricultural information by Opinion Leaders
and their roles This covers the way opinion leaders disseminate information to other farmers, how they influence farmers and the information sources used by both farmers and the opinion leaders. The importance of opinion leaders in extension is also included. The findings in Table 2 show that majority (98.3%) of the respondents said opinion leaders raise awareness as a way of influencing farmers, 76.7% indicated that their advisers persuade farmers. Most of the respondents (68.3%) did not agree that opinion leaders reinforce norms. Thomas (1996) refers to opinion leaders as early adopters who give information to late adopters and in the study 55.5% of respondents said opinion leaders are first adopters. Weimann et al. (2007) stated that opinion leaders influence the behaviour of their followers through raising awareness and persuasion.
Most (95.0%) of respondents said that opinion leaders play a role in extension delivery by diffusing information and 76.7% said they increase the rate of adoption. Majority (93.0%) of the respondents said they used radio to access information, 16.0% accessed information through extension workers, while 33.0% and 5.0% used television and newspapers, respectively. Fifty eight percent of the respondents indicated that their advisers get information from radio, 56% from extension workers, 52% from internet, 40% from television and 25% from the newspapers. Advisers get information from internet and extension workers as the different source from their followers and this implies that opinion leaders know much more than the farmers and are very important. High proportion (86.7%) said that opinion leaders were very useful, while 90.0% got information from their advisers by consulting and 10.0% through meetings in their groups.
Table 3: Distribution of respondents by dissemination of agricultural information by opinion leaders
Dissemination information by opinion leaders Yes (%) No (%)
How do opinion leaders influence farmers? Raise awareness 98.0 31.7
Persuade farmers 76.7 23.3 Reinforce norms 31.7 68.3 They are first adopters 55.0 45.0 How do opinion leaders help in extension? Diffuse information to the community 95.0 5.0
Increase the rate of adoption 76.7 23.3 Information sources accessed by opinion leaders Radio 58.3 41.7
Internet 51.7 48.3 Television 40.0 60.0 Extension officers 56.7 43.3 Newspapers 25.0 75.0 Information sources accessed by farmers Radio 93.3 6.7
Television 33.3 66.7 News paper 5.0 95.0 Extension agents 16.7 83.3 Is the information from other sources clear? 66.7 3.3 Are opinion leaders useful? 86.7 13.3
How is information disseminated to farmers by
opinion leaders?
Consultation by farmers 90.0 10.0
Through farmers groups 10.0 90.0
Source: Field survey, (2017)
Farmers’ perception of identification and
improvement of opinion leaders The respondents were requested to give their opinions regarding the procedure used in choosing the adviser and what can be done to improve their
knowledge. About 58.0% indicated that they identified opinion leaders by their social interpersonal relationship, while 36.7% look at the role a person plays. Only 5% identified opinion leaders by observing them.

Nigerian Journal of Rural Sociology Vol. 18, No. 2, 2018
24
Table 4: Distribution of respondents regarding identification and improvement of opinion leaders
Questions on opinion leaders Frequency Percentage
How is opinion leader identified? Observation 3 5.0 The role a person plays 22 36.7 Self-identification 0 0 Social interpersonal relationship 35 58.3 Do the whole community choose the person they get advice from? The community consult one person for advice. 46 76.7
Different groups have their own advisers. 11 18.3 Some people go to the people they feel comfortable to seek for help.
3 5.0
What procedure do you use in choosing the best opinion leader? Look at the way they communicate with other people. 7 11.7 Look at the number of people who nominate an individual and get help.
9
15
Look at the number of people who consult an individual and get help
9 15
Look for a person with experience and high production level. 22 36.7 Look for a person with skills and knowledge. 11 18.3 Look for a person with high education level. 2 3.3 Do the extension workers know of the existence of opinion
leaders?
YES 25 41.7
NO 35 58.3
How can skills and knowledge of opinion leaders be improved?
They can be taken to the workshops by extension works. 12 20.0 They can be given trainings. 34 56.7 The can work together with extension workers 7 11.7
They can be introduced to the extension workersas the representative of the community.
2 3.3
Do not have any idea 5 8.3 Source: Field Survey, (2017) CONCLUSION AND RECOMMENDATION It can be concluded that opinion leaders play a major role in updating farmers and helping them with their problems. Farmers get advice from people with higher socio-economic status than theirs. Opinion leaders disseminate information through farmers’ groups and consultations by farmers because these leaders are able to influence farmers’ behaviour. It is therefore recommended that extension workers should identify and recognise opinion leaders and make use of them in dissemination of agricultural information. This will greatly enhance the effectiveness of their job since the leaders are members of the community and already interacting with the farmers. REFERENCES DeFranzo, S.E. (2011). What’s the difference
between qualitative and quantitative research Snap Surveys Blog Feed. https://www.snapsurvey.com/blog/qualitative-vs-quantitative-research/09/11/2017.
Duncan, J. W. and Peter, S. D. (2007). Influential, networks and public opinion information.
Duvel, G.H. (2008). Culture variations regarding the nature and determinants of opinion leadership. S.Afr. J. Agric. Ext. 37
Iyengar, R., Thomas, V. and Bulte, C.V. (2009). Opinion leadership and social contagion in newProduct diffusion: Association for consumer research.
Leeuwis, C. and Ban, A. (2004). Communication for rural innovation. Black Science Ltd, Oxford. UK.
Ronald, B. (1999). Forthcoming in the annals of the American academy of political and social science: the social capital of opinion leaders
Thomas, W. V. (1996). Social network threshold in the diffusion of innovations. Pp. 69-89
Valente, T. W. and Pumpuang, P.(2007). Identifying Opinion Leaders to Promote Behaviour Change. Health Education
&Behaviour, Vol. 34 (6): 881-896. DOI: 10.1177/1090198106297855

Nigerian Journal of Rural Sociology Vol. 18, No. 2, 2018
25
Weimann, G., Tustin, D.H., Vuuren, D.V. and Jourber, J.P.R. (2007). Looking for the opinion leaders: traditional vs. modern measures in traditional society.
International journal of public opinion
research. 2:173-190. Williams, R.F. (2005). Nature and determinants of
opinion leadership in Lesotho. University of Pretoria, Pretoria.

Nigerian Journal of Rural Sociology Vol. 18, No. 2, 2018
26
ANALYSIS OF AGRO-BIOFORTIFIED CASSAVA INFORMATION NEEDS OF CASSAVA
FARMERS IN AKINYELE LOCAL GOVERNMENT AREA OF OYO STATE, NIGERIA 1Owolabi, K. E., 2Ajayi, F. O. and 1Oyeyemi, S. K.
1Department of Agricultural Extension and Communication Technology, Federal University of Technology Akure, Ondo state
2Department of Agricultural Economics and Extension, Osun State University, Osogbo, Osun state Correspondence e-mail address: [email protected]
ABSTRACT
The main objective of this study was to analyse the agro-biofortified information needs of cassava farmers in Oyo state, Nigeria. Data was collected from 80 respondents using a structured questionnaire to obtain information about their socioeconomic characteristics, awareness about bio-fortified cassava, source of information, information needs, challenges and perception about bio-fortified cassava. The data collected was analysed using descriptive statistics (frequency and percentage) and inferential statistics (Chi-square) to test the hypothesis. The study revealed that 87.5% of the respondents were male while only 12.5% were female and they have formal education. Majority (93.8%) of the respondents are aware of bio-fortified cassava. It shows also that the major source of the respondent’s information on bio-fortified cassava were from Extension agent and radio with 32.0% and 30.7% respectively. The study further revealed extension agents visited 90.0% of the respondents and that 87.5% of the visited respondents received information about bio-fortified cassava from the extension agents. Results show that all the respondents (100%) had the challenge of inadequate funds and 84.0% had challenge of inadequate processing facilities. The study further revealed that most of the respondents (84.0%) strongly agree that bio-fortified cassava had nutritional benefits compared with white cassava while only few (5.30%) agree that the processing is time consuming/stressful. The Chi square analysis shows that there is no significant relationship between respondent’s socio economic characteristics and their awareness of bio-fortified cassava. Hence, the study recommends that extension agents should continue to reach out to the farmers especially through the radio in disseminating information about bio-fortified cassava. Keywords: Biofortified, needs, information, cassava farmers INTRODUCTION According to United Nation Economic Commission for Africa (ECA, 2007), about 70% of Africans and roughly 80% of the continent’s poor live in rural areas and depends on agriculture for their livelihood. Cassava is the third-largest source of food carbohydrates in the tropics, after rice and maize (Fauquet and Fargette, 1990). It is one of the most drought-tolerant crops, capable of growing on marginal soils. Nigeria is the world's largest producer of cassava, while Thailand is the largest exporter of dried cassava. Cassava is classified as either sweet or bitter. Like other roots and tubers, both bitter and sweet varieties of cassava contain anti-nutritional factors and toxins, with the bitter varieties containing much larger amounts Food and Agriculture Organisation of the United Nations (FAO, 1990). Bio-fortified cassava have high yields and are resistant to many pests and diseases. Like ordinary cassava, it does not need nutrient rich soils or extensive land preparation and does not suffer during droughts (Consortium, 2012). Bio-fortified yellow cassava has great potential to alleviate vitamin A deficiency complementary to other interventions such as vitamin A supplementation and fortification (Bouis et al., 2011). Vitamin A deficiency prevails in sub-Saharan Africa despite national supplementation and food fortification programs, and 30% of preschool children in developing countries have vitamin A deficiency (United Nations System Standing Committee on
Nutrition (UNSSCN, 2010).Vitamin A supplementation in preschool children reduces all-cause mortality by 24% (Mayo-Wilson et al., 2011). Considering the high prevalence of vitamin A deficiency, even small increases in the supply of vitamin A through bio-fortified crops are likely to result in major public health gains. Crop production is an intricate enterprise that requires vast knowledge about the Agronomy, environmental interactions, and the application of available technology to achieve food production. Most of the food crop farmers lack information on the improved technologies hence stick to traditionally preferred methods which are not economically efficient but have prominent aromatic and palatability characteristics. Ozowa (1995), stated that the vital role played by scientific and technical information for agricultural and industrial development in developing countries is still neglected and accorded a lower status compared to other sectors. Ferris (2005), argues that in most African countries lack of accurate and relevant agricultural information by small- scale farmers is a major factor constraining efforts to improve the agriculture sector. Babu et al. (2011), had stated that a better understanding of farmers’ agricultural information needs and information sources could help guide extension and other agricultural programs to better target specific groups of farmers. Information is an important factor in the sustained development of any society because it reduces uncertainty and

Nigerian Journal of Rural Sociology Vol. 18, No. 2, 2018
27
broadens the scope of options to take in solving problems. There may be government programs, even availability of international aid but without information going round, people will not know about it. Information distribution is a key to eradicating poverty and hunger. The inability of the rural food crop farmers’ information needs to be met may result in poor production output, food insecurity, inability to feed the nation. In agriculture, the role of information in enhancing agricultural development cannot be over emphasised. There therefore a need to know the information needs of cassava framers in the study area about bio-fortified cassava. The general objective of the study is to assess the agro-biotechnological information needs of cassava farmers in Akinyele Local Government Area of Oyo state, Nigeria. The specific objectives were to; 1. determine the farmers’ level of awareness of
bio-fortified cassava; 2. determine extension agents’ roles about bio-
fortified cassava nad 3. examine the challenges faced growing bio-
fortified cassava and
METHODOLOGY This study was carried out in Akinyele local government area of Oyo state. Ọyọ, usually referred to as Oyo State to distinguish it from the city of Oyo, is an inland state in south-western Nigeria, with its capital at Ibadan. It is bounded in the north by Kwara State, in the east by Osun State, in the south by Ogun State and in the west partly by Ogun State and partly by the Republic of Benin. It was formed in 1976 from Western State, and included Ọsun State, which was split off in 1991. The climate in the state favours the cultivation of crops like maize, yam, cassava, millet, rice, plantains, cocoa, palm produce, cashew etc. There are a number of government farm settlements in Ipapo, Ilora, Eruwa, Ogbomosho, Iresaadu, Ijaiye, Akufo and Lalupon. There is abundance of clay, kaolin and aquamarine. There are also vast cattle ranches at Saki, Fasola and Ibadan, a dairy farm at Monatan in Ibadan and the state wide Oyo State Agricultural Development Programme with headquarters at Saki. A number of international and federal agricultural establishments are located in the state. A multistage random sampling technique was used to select the respondents for this study. The first stage involved a random selection of one Local Government Area in the state. The second stage was a random selection of four (4) villages from the local government area. The third stage was a random selection of twenty (20) respondents (Cassava farmers) from each of the selected
villages. Using this procedure, 80 respondents were selected and used for the study. A structured questionnaire was used to collect data from the respondents. The data collected were analysed using descriptive statistics (Frequency table, percentages, charts and mean) and inferential statistics (Chi square).
RESULTS AND DISCUSSION
Socioeconomic characteristics The study showed that more than half (58.8%) of the respondents were within the age bracket of 45-64years with the mean age of 55. About 87.5% of the farmers were male while 12.5% were female which implies that there are more males involved in cassava production than females. Though, cassava production is male dominated, Chris (2001) asserted that women and children play the central roles of harvesting, processing and marketing activities in cassava production in many parts of Africa. Many respondents (27.5%) in the study had attained primary education level. This was followed by those who had attained secondary education level (25.0%), then those who had not attained any formal education (17.5%) and those who had attained tertiary education (1.3%). This implies that majority of the cassava farmers had formal education. Their level of education affects information accessibility, comprehension and adoption of new agricultural innovations and practices (Aina and Dulle, 1999). Well educated farmers can easily access information from various sources, and can be able to create knowledge out of those sources. Majority (78.8%) of the respondents belong to a family of between 1-9 while 21.3% fall between the 10-18 family sizes. This implies that majority (78.8%) of the respondents have a household with about 1-9 members. The results of this study are in line with that of Ebewore et al., (2013) who reported that majority (70%) of his respondents had family size of between 6-10 persons. Large households provide ready sources of labour on the farm. About 43.8% of the farmers operate a small farm size, 50% operate a medium farm size while only 6.3% of the farmers operate a large farm size. This means that respondents were mainly medium and small-scale farmers. About 36.3% falls within the range of 5-24 years, 48.8% falls within the range of 25-44 years and 15.0% falls within the range of 45-60 years, this implies that majority of the respondents are more experienced in farming. The number of years a farmer spent in the farming business according to Nwaru (2004), could give an indication of the practical knowledge he or she had acquired on how he or she could overcome certain inherent problems.

Nigerian Journal of Rural Sociology Vol. 18, No. 2, 2018
28
Table1: Socioeconomic characteristics of respondents
Socio economic characteristics Frequency Percentage (%)
Age range 25-44 years 16 20.0 45-64 years 47 58.8 65-79 years 17 21.3 Total 80 100.0 Sex Male 70 87.5 Female 10 12.5 Total 80 100.0 Marital status Single 5 6.3 Married 72 90.0 Widowed 3 3.8 Total 80 100.0 Religion Christian 28 35.0 Islam 52 65.0 Total 80 100.0
Level of education No formal education 14 17.5 Primary school attempted 12 15.0 Primary school completed 22 27.5 Secondary school attempted 11 13.8 Secondary school completed 20 25.0 Tertiary education 1 1.3 Total 80 100.0 Household size 1-9 63 78.8 10-18 17 21.3 Total 80 100.0 Farm size Small farm size 35 43.8 Medium farm size 40 50 Large farm size 5 6.3 Total 80 100.0 Years of farm experience
5-24 29 36.3 25-44 39 48.8 45-60 12 15.0 Total 80 100.0
Source: Field Survey, 2017
Awareness about bio-fortified cassava
From Figure 1, the study shows that about 93.8% were aware of bio-fortified cassava while only 6.3% were not aware. This implies that most of the respondents in the study area were aware of
bio-fortified cassava which is in contrast with the finding of Opeyemi et.al (2017) which says that the low level of awareness about bio-fortified cassava in Oyo state might be the cause of its low adoption.
Figure 1: Awareness of respondents Source: Field Survey, 2017
YES
94%
No
6%

Nigerian Journal of Rural Sociology Vol. 18, No. 2, 2018
29
Source of information about bio-fortified
cassava Figure 2 shows that 32.0% of the respondents got information about bio-fortified cassava from extension agents, 30.7% get from listening to radio, 18.7% from research institute and only 8.0% from television. However, none of the respondents got information through internet and library in the study area. This implies that the respondents prefer interpersonal methods in receiving information, this probably because with interpersonal method farmers can easily share their experiences with
each other, hence improving their production. The finding of this study is in line with what have been reported previously by Mtega and Benard (2013); who has highlighted a few reasons why farmers are reluctant to use advance technology in accessing agricultural information such as internet, and among the reasons were that they do not know the benefits of the advance technology; do not have skills or expertise in using the advance technology; lack of time spent on ICT and difficulties in using ICT.
Figure 2: Sources of information about bio-fortified cassava
Source: Field Survey, 2017
Awareness about the characteristics of bio-
fortified cassava
Table 2 shows that majority of the respondents are very much aware that bio-fortified cassava produce garri without addition of oil and are least aware that it help reduces measles. Increase micronutrient content is the 2nd in rank of awareness, followed by resistance to cassava pest/disease and fast sales rate both in the 3rd position. Coming 4th in the rank is the awareness
about high sales rate, followed by easy to harvest, high yield, reduces night blindness, does not need nutrient rich soil or extensive land preparation, thrives in all weather condition on the 5th, 6th, 7th, 8th and 9th positions respectively. Reduces blindness, planting can be done at any season in the year and product have a longer shelf life are all in the 10th position while reduces child mortality ranked 11thwith awareness about low level of cyanide acid on the 12th position.
Awareness about the Characteristics of Bio-Fortified Cassava
Characteristics of bio-fortified cassava VMA
F (%)
A
F (%)
NA
F (%)
Mean
Rank
Produces yellow garri without addition of palm oil 73(97.3) 2(2.7) 2.97 1st Increase micronutrient content 62(82.7) 13(17.3) 2.83 2nd Resistance to cassava pest and disease 55(73.3) 19(25.3) 1(1.3) 2.72 3rd Has a sales rate/sells faster 52(69.3) 21(28.0) 2(2.7) 2.67 4th Easy to harvest 51(68.0) 22(29.3) 2(2.7) 2.65 5th High yield 50(66.7) 23(30.7) 2(2.7) 2.64 6th Reduces night blindness 49(65.3) 22(29.3) 4(5.3) 2.60 7th Does not need nutrient rich soil or extensive land preparation
48(64.0) 23(30.7) 4(5.3) 2.59 8th
Thrives in all weather condition 45(60.0) 25(33.3) 5(6.7) 2.53 9th Reduces blindness 42(56.0) 22(29.3) 11(14.7) 2.41 10th Planting can be done at any season in the year 38(50.7) 30(40.0) 7(9.3) 2.41 10th
8
30.7
2.75.3
32
18.7
2.70 0
0
5
10
15
20
25
30
35
Percentage
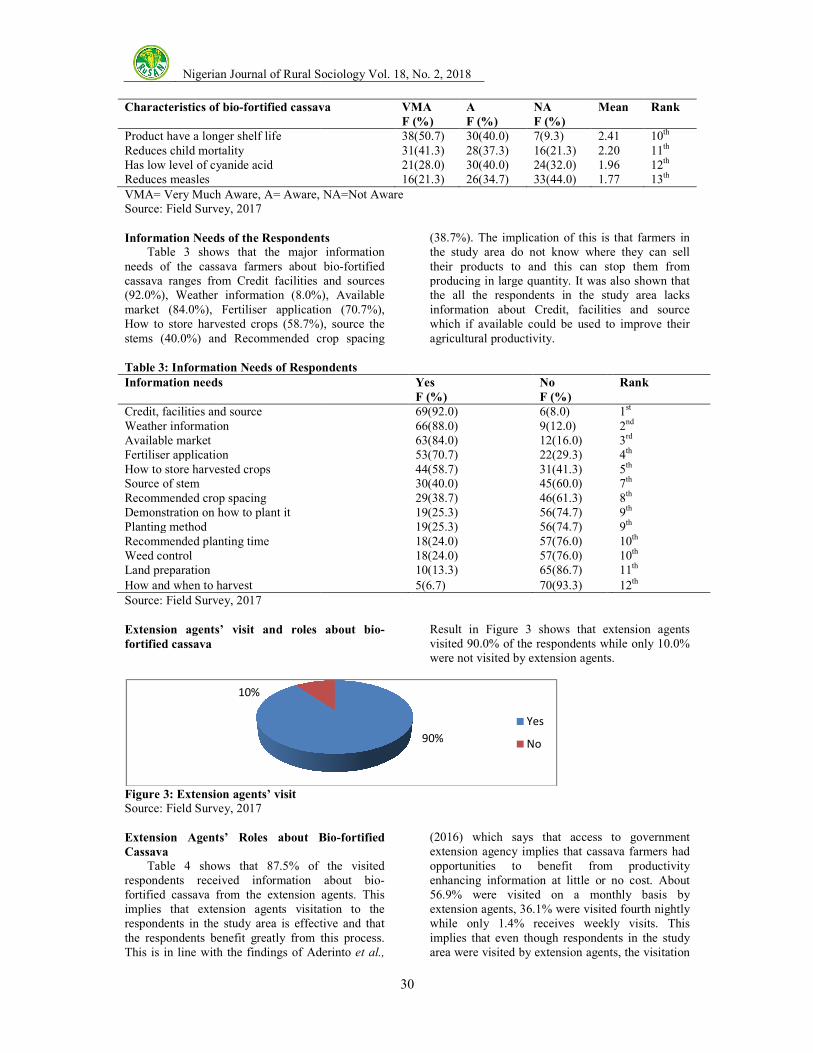
Nigerian Journal of Rural Sociology Vol. 1
Characteristics of bio-fortified cassava
Product have a longer shelf life Reduces child mortality Has low level of cyanide acid Reduces measles
VMA= Very Much Aware, A= Aware, NA=Not Aware Source: Field Survey, 2017
Information Needs of the Respondents Table 3 shows that the major information needs of the cassava farmers about biocassava ranges from Credit facilities and sources (92.0%), Weather information (8.0%), market (84.0%), Fertiliser application How to store harvested crops (58.7%), stems (40.0%) and Recommended crop spacing
Table 3: Information Needs of Respondents
Information needs
Credit, facilities and source Weather information Available market Fertiliser application How to store harvested crops Source of stem Recommended crop spacing Demonstration on how to plant it Planting method Recommended planting time Weed control Land preparation
How and when to harvest Source: Field Survey, 2017
Extension agents’ visit and roles about bio
fortified cassava
Figure 3: Extension agents’ visit
Source: Field Survey, 2017
Extension Agents’ Roles about Bio
Cassava Table 4 shows that 87.5% of the visited respondents received information about biofortified cassava from the extension agents. This implies that extension agents visitation to the respondents in the study area is effective and that the respondents benefit greatly from this process. This is in line with the findings of Aderinto
10%
Nigerian Journal of Rural Sociology Vol. 18, No. 2, 2018
30
fortified cassava VMA
F (%)
A
F (%)
NA
F (%)
Mean
38(50.7) 30(40.0) 7(9.3) 2.4131(41.3) 28(37.3) 16(21.3) 2.2021(28.0) 30(40.0) 24(32.0) 1.9616(21.3) 26(34.7) 33(44.0) 1.77
VMA= Very Much Aware, A= Aware, NA=Not Aware
Information Needs of the Respondents Table 3 shows that the major information
needs of the cassava farmers about bio-fortified Credit facilities and sources
(8.0%), Available er application (70.7%),
(58.7%), source the Recommended crop spacing
(38.7%). The implication of this is that farmers in the study area do not know where they can sell their products to and this can stop them from producing in large quantity. It was alsothe all the respondents in the study area lacks information about Credit, facilities and source which if available could be used to improve their agricultural productivity.
Table 3: Information Needs of Respondents
Yes
F (%)
No
F (%)
69(92.0) 6(8.0) 66(88.0) 9(12.0) 63(84.0) 12(16.0) 53(70.7) 22(29.3) 44(58.7) 31(41.3) 30(40.0) 45(60.0) 29(38.7) 46(61.3) 19(25.3) 56(74.7) 19(25.3) 56(74.7) 18(24.0) 57(76.0) 18(24.0) 57(76.0) 10(13.3) 65(86.7)
5(6.7) 70(93.3)
agents’ visit and roles about bio- Result in Figure 3 shows that extension agents visited 90.0% of the respondents while only 10.0% were not visited by extension agents.
Bio-fortified
Table 4 shows that 87.5% of the visited respondents received information about bio-fortified cassava from the extension agents. This implies that extension agents visitation to the respondents in the study area is effective and that the respondents benefit greatly from this process. This is in line with the findings of Aderinto et al.,
(2016) which says that access to government extension agency implies that cassava farmers had opportunities to benefit from productivity enhancing information at little or no cost. About 56.9% were visited on a monthly basis by extension agents, 36.1% were visited fourth nightly while only 1.4% receives weekly visits. This implies that even though respondents in the study area were visited by extension agents, the visitation
90%
Yes
No
Mean Rank
2.41 10th 2.20 11th 1.96 12th 1.77 13th
(38.7%). The implication of this is that farmers in the study area do not know where they can sell their products to and this can stop them from producing in large quantity. It was also shown that the all the respondents in the study area lacks
Credit, facilities and source which if available could be used to improve their
Rank
1st 2nd 3rd 4th 5th 7th 8th 9th 9th 10th 10th 11th
12th
Figure 3 shows that extension agents visited 90.0% of the respondents while only 10.0% were not visited by extension agents.
(2016) which says that access to government extension agency implies that cassava farmers had opportunities to benefit from productivity
rmation at little or no cost. About 56.9% were visited on a monthly basis by extension agents, 36.1% were visited fourth nightly while only 1.4% receives weekly visits. This implies that even though respondents in the study
gents, the visitation

Nigerian Journal of Rural Sociology Vol. 18, No. 2, 2018
31
were not frequently done as most of the respondents were visited on monthly basis. It also shows that 91.9% of the respondents received awareness about bio-fortified cassava from extension agents; field visitation was performed for 79.0% of the respondents, 77.4% of the respondents received solutions to reported problems encountered while Demonstration as well
as Exhibition and display about bio-fortified cassava and products were not made available to 54.8% and 77.4% of the respondents respectively. This implies that there is a poor performance in the area of demonstration, exhibition and display as services rendered by extension agents in the study area.
Table 4: Extension agents’ roles about bio-fortified cassava Extension Agents’ Roles Frequency Percentage (%)
Disseminate information about bio-fortified cassava 63 87.5 Frequency of extension agents visit Weekly 1 1.4 Fourth nightly 26 36.1 Monthly 41 56.9 Quarterly 4 5.6 Create awareness about bio-fortified cassava 57 91.9 Linking to source of supply 38 61.3 Organising group meeting 38 61.3 Field visitation 49 79.0 Demonstration 28 45.2 Lecture on value addition 24 38.7 Exhibition and display of bio-fortified cassava products 14 22.6 Provide solutions to reported problems encountered 48 77.4
Source: Field Survey, 2017
Challenges faced by respondents about bio-
fortified cassava Table 5 shows the challenges the respondents faced in growing bio-fortified cassava. It shows that all the respondents (100%) have the challenge of inadequate funds, 84.0% have challenge of inadequate processing facilities while 80.0% have
challenge of inadequate number of extension agents which is in line with what have been found by Aina (2006), which revealed that the ratio of agricultural extension workers to the population in Africa is low. 94.7% and 89.2% of the respondents do not have challenge with language barrier and weeding and disease/pest infestation respectively.
Table 5: Challenges Faced by Respondents about Bio-Fortified Cassava Challenges Yes
F (%)
No
F (%)
Mean
Score
Ranking
Inadequate funds 75(100.0) 1.00 1st Inadequate processing facilities 63(84.0) 12(16.0) 0.84 2nd Inadequate number of extension agents 60(80.0) 15(20.0) 0.80 3rd Inadequate planting materials (stems) 56(74.7) 19(25.3) 0.75 4th Non-availability of in-organic fertiliser 56(74.7) 19(25.3) 0.75 4th Inadequate storage facilities 45(60.0) 30(40.0) 0.60 5th Inadequate relevant materials about bio-fortified cassava in offices and libraries
14(32.0) 51(68.0) 0.32 6th
Small farm size 19(25.3) 56(74.7) 0.25 7th Poor market 19(25.3) 56(74.7) 0.25 7th Lack of information services 14(18.7) 61(81.3) 0.19 8th Poor extension contact 13(17.3) 62(82.7) 0.17 9th No market for product 10(13.3) 65(86.7) 0.13 10th Weeding and disease/ pest infestation 8(10.8) 66(89.2) 0.11 11th Lack of awareness of information sources 6(8.0) 69(92.0) 0.08 12th Language barrier 4(5.3) 71(94.7) 0.05 13th Information not current/too old 2(2.7) 73(97.3) 0.03 14th
Source: Field Survey, 2017

Nigerian Journal of Rural Sociology Vol. 18, No. 2, 2018
32
CONCLUSION AND RECOMMENDATIONS
Based on the findings of this study, it can be concluded that majority of cassava farmers in the study area are aware of bio-fortified cassava. However, they need information on credit facilities and sources as well as available market for their produce. Although the study revealed that there is effective performance of extension services by extension agents in the study area, there is also the problem of limited number of extension agents. There is a need for government and other institution responsible to make funds available to cassava farmers in the study area as this happens to be their major challenge as showed by this study. The study therefore recommends that: 1. due to the shortage of extension officers,
Private organisations should provide assistance in disseminating information about bio-fortified cassava to cassava farmers.
2. government should make funds available for cassava farmers so that they can produce bio-fortified on a large scale which will help deal with food insecurity as well as malnutrition among children.
3. extension agents should visit farmers more frequently and also give information about available market for bio-fortified cassava.
REFERENCES Aderinto, A. Agbelemoge, A., and Dada, O. M
(2016). Effectiveness of Extension Service Delivery and Productivity of Cassava Farmers in Southwestern Nigeria. The
Journal of Agricultural Sciences Vol. 12,
No. 1, January 2017. Pp 14-23 Aina, L.O. (2006). Information Provision to
Farmers in Africa: The Library- extension service linkage, World library and information congress, 72nd IFLA general conference and council 20-24 August 2006, Seoul, Korea.
Babu, S. C., Glendenning, C. J., Asenso-okyere, K. and Govindarajan, S. K. (2011). Farmers’ Information Needs and Search Behaviours: Case study in Tamil Nadu, India, Bouis H.E., Hotz C, McClafferty B, Meenakshi J.V., Pfeiffer WH (2011). Bio-fortification: a new tool to reduce
micronutrient malnutrition. Food Nutr
Bull 2011;32:S31–40. Consortium (2012). Nigeria releases Vitamin A
cassava to Improve Public Health for Millions. Stories of Change, CGIAR. http://www.cgiar.org/consortium-news/nigeria-vitamin-a-cassava-improve-public-health/
Dulle, F. W. and Aina, L. O. (1999). The Information Needs of Small Scale Dairy Farmers in Tanzania, International Association of Association of Agricultural
information Specialists (IAALD) Quarterly Bulletin 44 (3-4), 173- 176.
Ebewore, S. O., Ebodion, J. and Oboh, O. O. (2013). “Profitability Analysis of Yam Production in Ika South LGA of Delta State, Nigeria.” Journal of Biology,
Agriculture and Healthcare Vol 3, No2. p. 121.
Fauquet, C. And Fargette, D. (1990). "African
Cassava Mosaic Virus: Etiology,
Epidemiology, and Control" (PDF).
Plant Disease. 74 (6): 404–11. Ferris, S. (2005). Developing Market Information
Services in Eastern Africa: the Food Net Experience, Local, National and Regional Market Information Services. International Institute of Tropical (IITA), Ibadan Nigeria
Food and Agriculture Organisation of the United Nations (1990). "Roots, Tubers, Plantains and Bananas in Human Nutrition", Rome, 1990, Ch. 7 "Toxic Substances and Anti-nutritional Factors", third paragraph.
Mayo-Wilson E, Imdad A, Herzer K, Yakoob M.Y, Bhutta ZA (2011). Vitamin A Supplements
for Preventing Mortality, Illness, and
Blindness in Children Aged Under 5:
Systematic Review and Meta-analysis.
BMJ 2011;343:D5094. Mtega, W. and Benard, R. (2013). The State of
Rural Information and Communication Services in Tanzania: a meta-analysis. International Journal of Information and
Communication Technology Research,
3(2), 64 – 73.
Nwaru, J. C. (2004). Determinants of Farm and off-Farm Incomes and Savings of Food Crop Farmers in Imo State, Nigeria: Implications for poverty alleviation. The
Nigerian Agricultural Journal. pp 36:26-
42.
Opeyemi, E. A, Adewumi, M. O., Ajewole, O.O. and Ologunde, O. O. (2017). Determinants of adoption of vitamin A bio-fortified cassava variety among farmers in Oyo State, Nigeria. University of Ilorin, Department of Agricultural Economics and Farm Management, Ilorin, Kwara State, Nigeria
Ozowa, V. N. (1995). Information Needs of Small Scale Farmers in Africa: The Nigerian Example, United Nations System Standing Committee on Nutrition. Progress in nutrition: 6th report on the world nutrition situation [Internet]. Geneva (Switzerland): United Nations System Standing Committee on Nutrition. Progress in nutrition: 6th report on the world nutrition situation [Internet]. Geneva (Switzerland):

Nigerian Journal of Rural Sociology Vol. 18, No. 2, 2018
33
United Nations System Standing Committee on Nutrition
Nigerian Journal of Rural Sociology Vol. 18, No. 2, 2018
34
ANALYSIS OF THE OUTCOMES OF WASTE SCAVENGING AS A MEANS OF LIVELIHOOD
COPING STRATEGY AMONG SCAVENGERS IN SOUTHWESTERN NIGERIA 1Ogunjimi, S. I, 2Ajala, A. O. and 1Alabi, O. O.
1Department of Agricultural Economics and Extension, Federal University Oye-Ekiti, Ekiti State, Nigeria 2Department of Agricultural Economics and Extension, Landmark University, Omu-Aran, Kwara State, Nigeria
Correspondence e-mail address: [email protected], [email protected]
ABSTRACT
This study examines economic benefits and the health implications associated with the scavenging in Ekiti and Osun States, Nigeria. The research is based on data collected through multistage sampling procedures from 120 waste scavengers drawn equally from the four solid waste dumpsites in the study areas using interview schedule and focus group discussion. These interview elicited information about scavenger’s activities, experiences, opinions and feelings concerning their operations, economic benefits and health challenges. The data used for the study were generated from primary and secondary sources. The Data obtained was analyzed using descriptive statistics on SPSS software. The mean age of the research participants was 27years and majority did not attended school or stopped at primary school level. Waste scavenging was dominated by males (77%). The research also revealed that most of the scavengers were youths from the community and migrants from surrounding villages. The reasons for their involvement in waste scavenging business such as picking of recyclable products like plastics, metals and glass bottles include joblessness and economic consideration. The study further reveals that majority of scavengers are exposed daily to a numerous life threatening health problems which might result to death as they sort through the waste for recyclable products. The paper concluded that most of the scavengers were exposed to environmental hazards which could lead to health problems in the cause of their daily activities. Given the health hazards that scavengers were been exposed to in this enterprise, policy measures that would enhance the health status of the scavengers need to be adopted by Government and Non-Governmental Organisation. Keywords: Dumpsites, Health, Scavenger, Waste, Wealth
INTRODUCTION
Migration of rural dwellers to urban cities has led to population explosion which in turn resulted into increases in waste generation and also creates a large pool of unemployed and underemployed in the society. In the past few decades, the process of urbanization has accelerated mainly in cities coping with informal hyper, most of which are located in sub-Saharan Africa (UN-Habitat, 2010). These cities are characterized by an economy heavily dependent on the informal sector and very extensive poverty (Owusu-Sekyere, 2014). The high concentration of people in the emerging urban centres in the developing world has two implications: it leads to increases in waste generation and also creates a large pool of unemployed and underemployed residents with few alternative means of earning a living. In response to the unemployment growth led some youths in rural and urban areas to engage in waste scavenging as a mean of survival strategies. Wikipedia (2012) describes a waste picker (scavenger) as a person who salvages reusable or recyclable materials thrown away by others to sell or for personal consumption. Genemo (2010) stated that, some families cannot survive without the contribution of every member of the family as some parents cannot meet their basic needs, these forces their children to go to waste dumping sites to scavenge with the aim of increasing family income and maintaining their standard of living. Scavenging from the waste stream is an important economic activity that provides income for over 15 million people
worldwide, most of whom are in cities in developing countries, and it has a financial impact of several billions of US dollars every year (Medina, 2010). Waste scavenging is a popular informal activity which depends on the quantity and quality of waste generated by the population. The proliferation of waste scavengers on the streets and waste dumpsites in Nigeria since the early 1990s represents one of the most visible consequences of the deep economic crisis the country has been suffering. These scavengers play an important role in the process of waste recycling. Muktar (2011) stated that in Nigeria, like other developing countries, scavenging among youths begins with the collection of plastic bottles and cans, and it mostly takes place in the informal sector. However, people involved sort out the useful materials like paper, aluminium, glass, bottles, plastic etc. and sell them to the recycling industries. These serve as their source of income. Literature as shown that scavengers working under unhygienic condition which exposed them to health related problems. Ray et al (2002) was of opinion that scavengers working in the area of fleas and offensive odours in the waste disposal sites along with the lack of proper protective devices which have adverse effect on the life. Furthermore, Eric (2007) in study conducted in Buenos Aires Argentina find out that scavenger were exposed to health hazards which comprise of infection, chemical hazards, musculoskeletal damage, mechanical trauma, and emotional distress.

Nigerian Journal of Rural Sociology Vol. 18, No. 2, 2018
35
Most of the scholars worked on waste scavenging examined its economic significance as an efficient livelihood strategy (Reynals, 2002; Schamber and Suárez, 2002). Despite a lot of studies on scavenging as economic activities, much attention has not been paid to the health risks associated with it in the study area in view of the fact that scavengers live and work in unhygienic conditions and the nature of their occupation exposes them to hazards that may lead to the spread of various health challenges. Hence the study examined waste scavenging as a source of wealth or death? The specific objectives of the study are to:
i. describe the socioeconomic characteristics of scavengers;
ii. examine the economic benefits of waste scavenging; and to
iii. assess the health implications associated with waste scavenging.
METHODOLOGY
To achieve the objectives of the study, four solid waste dumpsites were randomly selected in Ikole-Ekiti and Ado-Ekiti in Ekiti State and Osogbo and Ile-Ife in Osun state.
Figure 1: Photograph of dumpsites at Ado-Ekiti, Ekiti State and Ile-Ife, Osun State Purposive sampling was employed in identifying those who were directly involved in the process. The research is based on data collected through multistage sampling procedures from 120
waste scavengers drawn equally from the four solid waste dumpsites in the study areas using interview schedule. Focus group discussion was used to measure quantitative data.

Nigerian Journal of Rural Sociology Vol. 18, No. 2, 2018
36
The data from the questionnaire survey was analysed using SPSS analytical programme. Waste scavengers’ demographic characteristics that were examined in the study include religion, age, ethnicity, income, marital status, educational qualification and working hours. Scavengers were asked to mention reason for entry into a job and some of the risks they had suffered repeatedly in the last twelve months preceding the study in their daily job. Lastly, three focus group discussions were held at the three dumpsites where scavenging takes place. Reason for entry into the scavenging job was measured using a 5 point Likert – type scale comprising of strongly agreed (5 point), agreed (4 point), neutral (3 point), disagreed (2 point), and strongly disagreed (1 point). The index was the sum on the scores of all 7 questions which the scavengers were asked with minimum score being 7 and maximum score being 35. Mean was used to rank the reasons for entry into the scavenging job in descending order of importance. Perceived Health related problems were measured using 3 point scale comprising always occurred (2) occasionally occurred (1) and not occurred (0). The index was the sum on the scores of all 8 questions which the scavengers were asked with minimum score being 0 and maximum score being 16.Mean was used to rank perceived health related problems the descending order of occurrence. RESULTS AND DISCUSSION
Socioeconomic characteristics The results from the table show that above average numbers of scavengers (54.4%) were observed in the age group 21 to 30 years and 14.5 % of scavengers were in the age group 20 year and below. The findings imply that youths of school age were into scavenging business despite the risks involved in the job. One of the participants from Osogbo in focus group discussion said that “My parents died when I
was young. There was no one to sponsor me and I
wanted to go to school. I used the income from
scavenging to fund myself through school, feeding,
buying books and clothing. The above disclose the reasons for working in the dumpsite at such a young age as a means for survival. Male (76.7%) dominated the business of scavenging. In this study, 48.3% of scavengers were married, The rest were either single who have never been married, separated, divorced and widowed( 51.7%) (Table 1). This is supported by the following statement from a woman at Ado-Ekiti:“Most women working
here are either divorced or separated with no
husband to support us. We struggle on our own to
pay house rent, feed the children and send them to
school form the money we made from this business.
Nigeria has earlier been identified to comprise of three main ethnic groups which include Hausa, Yoruba and Igbo. The ethnic group of waste workers is important most especially to waste pickers/scavengers since they have in the past been identified to be migrants who are out to make a living in the city (Benson and Vanqa-Mgijima, 2010; Hayami et al. 2006). In this study, the Hausas who are migrants from the northern part of Nigeria have the largest representation among scavengers in the study area. This findings is in line with Obadina (2015) findings that majority of scavengers in Lagos State were Hausas. In this study 48.7% of waste scavengers have no education. Despite the fact almost half were not educated we found out that some are highly educated up to higher institutions. One of the identified young scavengers stated that “I suffered
with verbal abuse from my friends which made me
drop out from school and faced my work
squarely.”The mean number of scavengers on the job working experience was 8.5years. Table1 also revealed that, 71.8 % scavengers have been working for between 5 to 10 years. Majority of the scavengers had average income of 16,000 monthly. Despite the fact the income realized was low they claimed that they were able to take care of their needs to certain extent.
Table 1: Socioeconomic characteristics of scavengers
Variables Frequency percentage Mean/STD
Age ≤ 30 82 68.4 27.4(5.8) 31-60 24 20.0 ≥ 60 14 11.6 Sex Male 92 76.7 Female 28 23.3 Marital status Married 58 48.3 Single 40 30.3 Widowed 7 5.8 Separated 9 7.5

Nigerian Journal of Rural Sociology Vol. 18, No. 2, 2018
37
Variables Frequency percentage Mean/STD
Divorced 6 5.0 Ethnicity Scavengers Hausa 68 56.7 Yoruba 31 25.8 Igbo 14 11.7 Others 7 5.8 Educational level Never 58 48.3 1-6(primary school) 34 28.3 7-12(Secondary school) 21 17.5 13 and above 7 5.8
Income ≤ 10,000 34 28.3 16,000(4,003) 11,000-20,000 61 50.8 ≥21,000 25 20.8 Reason for entry into a job at the dumpsite
This section examines the reasons for entry into scavenging. The primary reasons are to get out of poverty (92.6%) and unemployment (87.1%). This necessitated their need to seek for ways of making a living through waste scavenging. In addition to unemployed migrants, there are also waste workers who had been employed but due to loss of employment had to look for a way of getting a job. The finding indicated that some of the scavengers were into it for economic reason so
that they could satisfy their basic needs. The implication of this is that majority were into scavenging business not because of the interest in the job but due the joblessness. It is also being used as a means of getting out of poverty. These findings corroborated Owusu-Sekyere (2014) and Obadina (2015) their study in Ghana and Lagos that the scavengers are in the occupation, not by choice, but due to increased levels of unemployment and poverty.
Table 2: Reasons for Entry into a Job of scavenging
Reasons for scavenging Percent Rank
To get out of poverty 92.6 1st I cannot get job in my place or state 87.1 2nd Ability to take care of my family 85.2 3rd No certificate to do other job 73.5 4th Loss of job due to retrenchment 58.3 5th Inadequate access to credit facilities 56.3 6th I can be on my own 40.6 7th Perceived Health related problems
The study further reveals that majority (80.2%) of scavengers are exposed daily to a numerous life threatening health problems which might result to death as they sort through the waste for recyclable products, Scavenging has some detrimental effects on the health of the scavengers in descending order of their severity. The most prevalence was the headaches which occurred as a result of working in the sun (95.8%). This was followed by minor injuries from stepping on broken bottles or sharp objects in the refuse (90.5%), eye irritation (89.6%); respiratory diseases which include coughing and sneezing (87.4%) etc and backaches from bending down most of the time. Other infections that might associated with waste scavenging includes skin and blood infections resulting from direct contact with waste
and from infected wounds,( 67.2%). These an indication that scavengers were exposed to various environmental hazards arising from their daily activities such as respiratory diseases which occurred as a result of exposure to dust and hazardous compounds, accidental injuries that include skeletal disorders resulting from the handling of heavy containers, infected wounds from contact with sharp items, poisoning and chemical burns resulting from contact with hazardous chemical waste mixed with general waste; burns and other injuries from job-related accidents at waste disposal sites. This assertion is inline Chalin et al., (2003) who claimed that scavengers are usually exposed to accidents and injuries at dumpsite. Despite the seriousness of the health hazards outline, most of the scavengers at times over look them. This might be as a result of

Nigerian Journal of Rural Sociology Vol. 18, No. 2, 2018
38
inadequate knowledge of the health related information or cost of securing medical attention. As waste scavengers in the study areas make a
living, they are also exposed to health problems that have impending danger on their economic activity.
Table 3: Perceived health related problems among waste scavengers
Health problems % Rank
Headaches from working in the sun 95.8 1st Minor injuries 90.5 2nd Eye irritation 89.6 3rd Respiratory diseases 87.4 4th Minor injuries from stepping on broken bottles or sharp objects in the refuse
83.4 5th
Backaches from bending down 78.3 6th Skin disease and blood infections 67.2 7th Poisoning and chemical burns 49.1 8th Mean percentage= 80.2%
CONCLUSION AND RECOMMENDATIONS Waste scavenging arises mainly due to the existence of waste dumps and recycling enterprises on one hand, and the income earned as well as poverty on the other hand. Scavenging as an informal activity has employed a number of unemployed people. The reality from this study is that as waste scavengers scavenged for wealth in order to get out of poverty but at same time they are also exposed to a countless number of health related problems which might lead to death. Exposure to environmental hazards could be attributed to low level of education and inadequate safety measures. This situation needs to be of concerned to every shareholder in the areas of occupational safety. The paper recommends that given the environmental hazards associated with the enterprise, policy measures that would enhance the health status of the scavengers such as provision of necessary working equipment like hand gloves and boots needs to be adopted by Government. Training needs to be organised by government agency and Non-Governmental Organisation on the safety measures. Furthermore, they need to be targeted in federal government social intervention programmes. REFERENCES Benson and Vanqa-Mgijima (2010). The streets of
Cape Town. International Labour Research and Information Group (ILRIG), WIEGO Organising Series. Available at:http://www.Inclusivecities.org/toolbox/Organising_on_the_Streets_web.Pdf. [Accessed25/04/2012
Eric Norman Olaf Binion (2007) The perception of health with informal Recyclers in Buenos Aires, Argentina Unpublished Master of Arts Thesis in the Department of Geography
Chalin, C. G., Nguyen, H. T. L. and Nguyen, H., (2003). Issues related to the health of women and children waste pickers in Vietnam. Gender and the waste economy: Vietnamese and International experiences. Waste Econ program
Genemo, E. (2010). Worst forms of child Labour: A psychosocial study of children scavenging on the main waste dumpsite of Addis Ababa.
Hayami, Y., Dikshit, A. And Mishra, S., (2006). Waste pickers and collectors in Delhi: poverty and environment in an urban informal sector. The Journal of
Development Studies, vol. 42, no. 1, pp. 41-69.
Medina, M., (2007). The world's scavengers: salvaging for sustainable consumption and production. Rowman Altamira. https://rowman.com/ISBN/9780759113800/The-World's-Scavengers-Salvaging-for-Sustainable-Consumption-and-Production . Accessed on 23/08/2018.
Muktar, M. (2011). The Youth and Waste Scavenging in Nigeria: Implications For Socioeconomic and Health Hazards. PHD, Department of Economics Bayero University. Kano Nigeria. Accessed on www.ganji,com/article 8000/news 871.htm
Obadina, A. A. (2015). Solid waste management livelihood on Lagos dumpsite: Analysis of gender and social difference. Unpublished Doctoral Thesis. Submitted in partial fulfilment of the requirements for the award of Doctor of Philosophy of Loughborough University. https://dspace.lboro.ac.uk/2134/21827 accessed on 14/09/2018
Owusu-Sekyere, E. (2014). Scavenging for wealth or death? Exploring the health risk associated with waste scavenging in

Nigerian Journal of Rural Sociology Vol. 18, No. 2, 2018
39
Kumasi, Ghana. Ghana. Journal of
Geography, Vol. 6, 2014 Pages 63 – 80 Ray, M. R., Mukherjee, G., Roychowdhury S.,
Lahiri T. (2004). Respiratory and General Health Impairments of Rag Pickers in India: a Study in Delhi. Int Arch Occup
Environ Health. 2004; 77:595–598 Reynals, B. T. (2002). ‘De Cartoneros a
Recuperadores Urbanos’ Presented at Respuestas de la Sociedad Civil a la Emergencia Social: Brasil y Argentina compartenexperiencias, Master’s Thesis, Universidad Nacional.
Schamber, P. and Suárez, F. (2002). Actores sociales y Cirujeo y gestión de residuos una mir
ada sobre circuito informal del reciclaje en el conurbano bonaerense. Revista Realidad Económica Buenos Aires.190, 29‐37
United Nations Human Settlements Programme, UN-HABITAT (2010). Collection of
Municipal Solid Waste in Developing
Countries. United Nations Human Settlements Programme, Gutenberg Press Malta ISBN 978-92-1-132254-5.
Wikipedia, the free Encyclopaedia (2012)Waste picker retrieved from https://en.wikipedia.org/wiki/Waste_picker on 9/12/2018

Nigerian Journal of Rural Sociology Vol. 18, No. 2, 2018
40
COVERAGE OF AGRICULTURAL RELATED CORRUPT PRACTICES IN THE NIGERIAN
NEWSPAPERS 1Ani, N. A., 2Olajide, B. R. and 2Onyebuchi, S. I.
1African Regional aquaculture Centre of the Nigerian Institute for Oceanography and Marine Research, Extension Research and Liaison Services, Aluu
2Department of Agricultural Extension and Rural Development, University of Ibadan, Ibadan Correspondence e-mail address: [email protected]
ABSTRACT Corruption remains one of the most significant global issues in the 21st century, hence, its inclusion in the 2030 agenda for sustainable development. In Nigeria, corruption is a central problem facing the government and one of the bureaucratic offices that massive scales of corruption thrive, is the agricultural sector. Recognizing the conferral and agenda setting status of the media, this research investigated the coverage of Agricultural Related Corrupt Practices (ARCPs) in Nigerian national newspapers. Using content analysis as methodology and multi-stage sampling procedure, four (4) national newspapers and four hundred and thirty two (432) editions from which 71 qualified as ARCPs news were selected for the study between January 2010 and December 2015. Results show inter-newspaper variation in the coverage of ARCPs stories. Vanguard Newspapers (34.4%) was found to have reported the highest volume of ARCPs stories amongst the dailies. No stories were found on either the back pages or editorial pages of the newspapers studied, which represent a lack of ideological inclinations of the newspapers on burning national issues. The majority (98.6%) of the news reports were found on the inside pages. The typology of ARCPs most reported were items grouped as “others” (33.8%) but silent on bigger issues of corruption like misappropriation, bribery, embezzlement and extortion. The major source of news reports was found to be government functionaries (36.6%), superseding anti-corruption agencies like the like Independent Corrupt Practices and Other Related Offences Commission (2.8%). There was no significant difference (F= 1.294, P= 0.284) in the occurrence of stories on ARCPs across the dailies. To effectively address corruption and agricultural underdevelopment, a robust reportage of bigger ARCPs around bribery and corruption will no doubt translate to awareness, responsiveness and accountability in the administration of agricultural programmes and policies. Keywords: Corruption news, Content analysis, Nigeria's Agriculture, ARCP INTRODUCTION The manifest consequences of corrupt practices cannot be over-emphasized across sectors, public and private, in Nigeria. After the high cost of living and unemployment, Nigerians consider corruption to be the third most important problem facing their country, well ahead of the state of the country’s infrastructure and health service (UNODC, 2017). Structurally, corruption violates the social contract between citizens and their elected representatives and elevates the interests of the few over many. Perceptions of rampant corruption also contribute to public disillusionment and undermine the legitimacy of governments. This is exemplified when public resources are diverted to finance personal endeavours such as re-election campaigns (USAID, 2005). Nepotism or cronyism which is a typology of corruption generates deep grievances that contribute to conflicts, agitations, or even state failure, particularly if these cleavages follow pre-existing fault lines in society such as economic, religious, or ethnic delineations. Corruption is a complex social phenomenon with deep roots in bureaucratic and political institutions. While costs may vary among governments and institutions; systemic corruption may coexist with strong economic performance but experience suggests that corruption is bad for development (World Bank, 1997). It leads governments to intervene where they need not, and it undermines their ability to implement policies in
areas where government intervention is clearly needed. It also stifles entrepreneurship, professionalism and erodes the values of hard work, diligence and honesty. An encompassing definition of corruption has remained contentious among scholars, and anti-graft agencies. Nonetheless, Transparency International (2016) defines corruption as the abuse of entrusted power for private gain. It is the active or passive misuse of the powers of public officials for private financial or other benefits. The main element of the definition is that individuals, such as government officials, misuse the authority granted to them by their position for personal gain or that of their allies. It happens in many guises, ranging from the familiar experience of administrative bribery in daily encounters with public officials to clandestine grand schemes at misappropriating public funds. Corruption in agricultural systems constitutes problems for large and small landholders or farmers around the globe and particularly, developing economies. Rural dwellers and farmers, who constitute the bulk of the nation’s population, are often unduly subjected to demands for payments (extortion) along transportation routes of the value chain when transporting products to the markets. Nigerian agricultural sector is widely perceived and adjudged as corruption-prone which has sufficiently served as conduits for siphoning
Nigerian Journal of Rural Sociology Vol. 18, No. 2, 2018
41
public funds and encouraged different scales of corruption (Idachaba, 2014). How society would deal with its social problems depends largely on how they are discussed, selected and presented – in other words, framed to the public. Social problems should be rightly given a face and a name, and without this, it might not be addressed with proper policy measures (Hilgartner, 1988). Therefore, the role of the media in addressing the scourge and pervasiveness of corruption cannot be over-emphasized. It plays significant roles in investigation, whistle-blowing, reportage and agenda-setting especially during prosecutorial phases in courts or investigative undertakings for public engagement. It is noteworthy that research attention is growing on corruption, even if, slowly among social scientists across disciplines. However, studies in Nigeria with reference to corruption in the agricultural sector are scarce. Taking cognizance of status conferral of the media in addition to her agenda-setting prominence, this research investigated the coverage of Agricultural Related Corrupt Practices (ARCPs) in Nigerian national newspapers. This is to offer an explanation to agricultural-related corruption as a socio-economic problem as reported in the dailies. The specific objectives included: i. investigate the frequency of the coverage of
ARCPs in the Nigerian newspapers; ii. determine the placement or prominence given
to ARCPs in Nigerian newspapers; iii. investigate the typologies of ARCPs reported
in the Nigerian newspapers and; iv. determine the sources of ARCPs news in the
Nigerian newspapers. Hypothesis of the study, stated in null form, is
as follows; There is no significant difference in the frequency of the coverage of ARCPs news in the Nigerian newspapers.
METHODOLOGY The population of the study comprises of all news articles or stories on ARCPs reported in the newspapers. The period covered by the study was from January 2010 to December 2015. The period matched an administration characterized by allegations of corruption and sharp practices. It also coincided with the period of implementation of the highly-rated Agricultural Transformation Agenda (ATA) of Nigeria’s government where huge resources were invested for agricultural revolution, transformation and development. In a multi-stage sampling procedure, purposive sampling was employed to select four (4) national newspapers – Vanguard Newspaper, The Guardian Newspaper, The Punch Newspaper and The
Nigerian Tribune, in the first stage. Principally, these dailies have columns dedicated to agriculture, natural resources and rural development news. Stage two employed a systematic technique to select three years- 2010, 2012 and 2014 out of the six-year period under investigation. In each of the years, stage three systematically selected six months: January, March, May, July, September and November. In stage four, two weeks were systematically selected out of the four weeks in each month. And finally, stage five was for the selection of the newspaper editions. For a true representation, editions were purposively selected to correspond with days dedicated to the reportage of agricultural issues. In all, to a total of four hundred and thirty two (432) editions were generated for the study. Out of the 432 editions of newspapers that emerged from the sampling procedure, four hundred and seven (407) editions were found at the research library. Although 407 editions were studied, only seventy one (71) stories qualified as ARCPs. All the qualified stories were used for statistical analysis. The unit of analysis was the individual news item or a story in the selected newspapers. A news item or story was any article which reported ARCPs in the selected dailies. Data were collected from the sampled newspapers from the Kenneth Dike Library of the University of Ibadan, Oyo State. To achieve this, a coding sheet detailing conceptualization and operationalization of variables was developed. It contained all the variables under investigation with their appropriate response categories. Data were analysed using both descriptive- frequency, percentage; and inferential statistics- test of difference.
RESULTS AND DISCUSSION Determination of occurrence and frequency of
ARCPs in the dailies Results in Table 1 show spatial (yearly) variations in the frequency of the coverage of ARCPs in the dailies. Specifically, the Nigerian Tribune (35.5%) recorded the highest coverage of ARCPs in 2010, The Guardian (36.8%) in 2012 and the Vanguard (42.9%) in 2014. This suggests a fluctuation in the coverage of ARCPs in the newspapers. Notwithstanding, on the aggregate, Vanguard (32.4%) reported the highest percentage of ARCPs stories, followed by The Punch (23.9%), while The Guardian (21.1%) was the least. In related research on constructing corruption as a social problem in Nigeria (Chikwendu, 2015), Vanguard recorded the highest coverage when compared to other dailies considered. This suggests that Vanguard pays higher attention in terms of proportion to corruption and other social problems when compared to other national dailies.
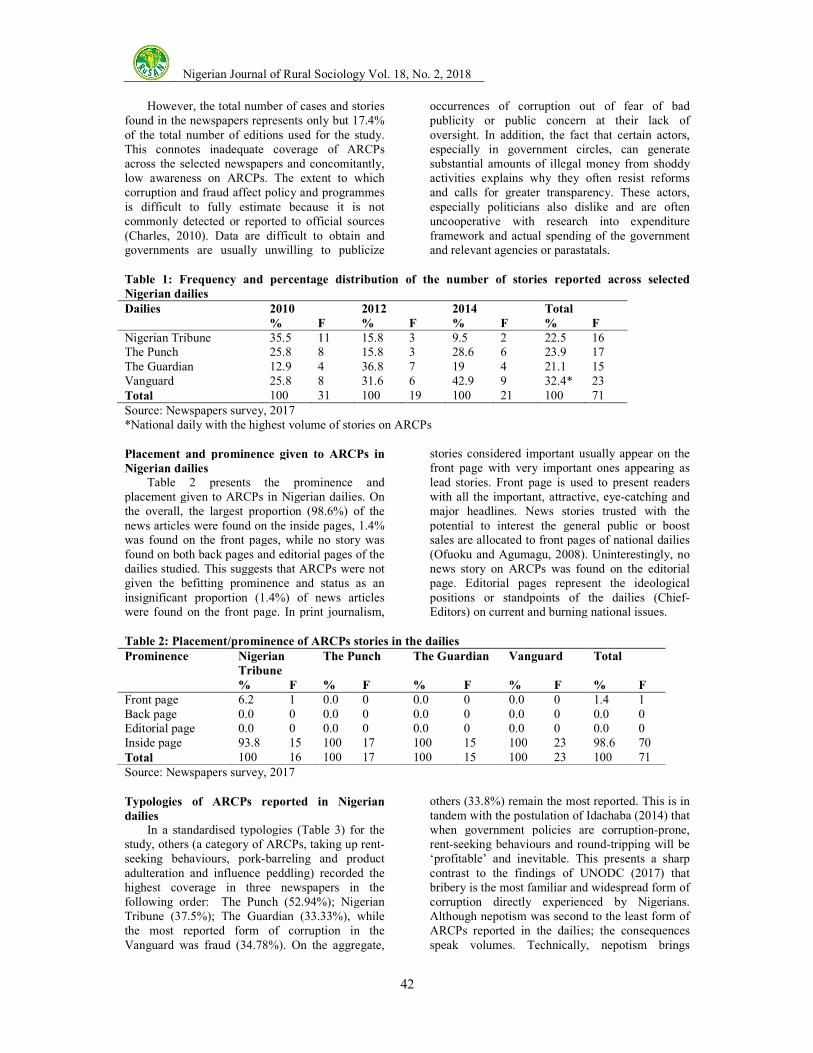
Nigerian Journal of Rural Sociology Vol. 1
However, the total number of cases and stories found in the newspapers represents only but 17.4% of the total number of editions used for the study. This connotes inadequate coverage of ARCPs across the selected newspapers and concomitlow awareness on ARCPs. The extent to which corruption and fraud affect policy and programmes is difficult to fully estimate because it is not commonly detected or reported to official sources (Charles, 2010). Data are difficult to obtain and governments are usually unwilling to publicize Table 1: Frequency and percentage distribution of the number of stories reported across selected
Nigerian dailies Dailies 2010
% F
Nigerian Tribune 35.5 11The Punch 25.8 8The Guardian 12.9 4Vanguard 25.8 8Total 100 31Source: Newspapers survey, 2017 *National daily with the highest volume of Placement and prominence given to ARCPs in
Nigerian dailies Table 2 presents the prominence and placement given to ARCPs in Nigerian dailies. On the overall, the largest proportion (98.6%) of the news articles were found on the inside pages, 1.4% was found on the front pages, while no story was found on both back pages and editorial pages of the dailies studied. This suggests that ARCPs were not given the befitting prominence and status as an insignificant proportion (1.4%) of news articles were found on the front page. In print journalism, Table 2: Placement/prominence of ARCPs stories in the dailies
Prominence Nigerian
Tribune % F
Front page 6.2 1 Back page 0.0 0 Editorial page 0.0 0 Inside page 93.8 15 Total 100 16 Source: Newspapers survey, 2017
Typologies of ARCPs reported in Nigerian
dailies In a standardised typologies (Table 3) for the study, others (a category of ARCPs, taking up rentseeking behaviours, pork-barreling and product adulteration and influence peddling) recorded the highest coverage in three newspapers in the following order: The Punch (52.94%); Nigerian Tribune (37.5%); The Guardian (33.33%), while the most reported form of corruption in the Vanguard was fraud (34.78%). On the aggregate,
Nigerian Journal of Rural Sociology Vol. 18, No. 2, 2018
42
However, the total number of cases and stories found in the newspapers represents only but 17.4% of the total number of editions used for the study. This connotes inadequate coverage of ARCPs across the selected newspapers and concomitantly, low awareness on ARCPs. The extent to which corruption and fraud affect policy and programmes is difficult to fully estimate because it is not commonly detected or reported to official sources (Charles, 2010). Data are difficult to obtain and
ments are usually unwilling to publicize
occurrences of corruption out of fear of bad publicity or public concern at their lack of oversight. In addition, the fact that certain actors, especially in government circles, can generate substantial amounts of illegal money from shoddy activities explains why they often resist reforms and calls for greater transparency. These actors, especially politicians also dislike and are often uncooperative with research into expenditure framework and actual spending of theand relevant agencies or parastatals.
Table 1: Frequency and percentage distribution of the number of stories reported across selected
2012 2014 Total F % F % F % F 11 15.8 3 9.5 2 22.5 16 8 15.8 3 28.6 6 23.9 17 4 36.8 7 19 4 21.1 15 8 31.6 6 42.9 9 32.4* 23 31 100 19 100 21 100 71
hest volume of stories on ARCPs
Placement and prominence given to ARCPs in
Table 2 presents the prominence and placement given to ARCPs in Nigerian dailies. On the overall, the largest proportion (98.6%) of the
n the inside pages, 1.4% was found on the front pages, while no story was found on both back pages and editorial pages of the dailies studied. This suggests that ARCPs were not given the befitting prominence and status as an
of news articles were found on the front page. In print journalism,
stories considered important usually appear on the front page with very important ones appearing as lead stories. Front page is used to present readers with all the important, attractive, eyemajor headlines. News stories trusted with the potential to interest the general public or boost sales are allocated to front pages of national dailies (Ofuoku and Agumagu, 2008). Uninterestingly, no news story on ARCPs was found on the epage. Editorial pages represent the ideological positions or standpoints of the dailies (ChiefEditors) on current and burning national issues.
Table 2: Placement/prominence of ARCPs stories in the dailies The Punch The Guardian Vanguard Total
% F % F % F % 0.0 0 0.0 0 0.0 0 1.40.0 0 0.0 0 0.0 0 0.00.0 0 0.0 0 0.0 0 0.0100 17 100 15 100 23 98.6100 17 100 15 100 23 100
Typologies of ARCPs reported in Nigerian
ed typologies (Table 3) for the study, others (a category of ARCPs, taking up rent-
barreling and product adulteration and influence peddling) recorded the highest coverage in three newspapers in the
94%); Nigerian Tribune (37.5%); The Guardian (33.33%), while the most reported form of corruption in the Vanguard was fraud (34.78%). On the aggregate,
others (33.8%) remain the most reported. This is in tandem with the postulation of Idachaba (2014) that when government policies are corruptionrent-seeking behaviours and round-‘profitable’ and inevitable. This presents a sharp contrast to the findings of UNODC (2017) that bribery is the most familiar and widespread form of corruption directly experienced by Nigerians. Although nepotism was second to the least form of ARCPs reported in the dailies; the consequences speak volumes. Technically, nepotism brings
occurrences of corruption out of fear of bad publicity or public concern at their lack of oversight. In addition, the fact that certain actors, especially in government circles, can generate
llegal money from shoddy activities explains why they often resist reforms and calls for greater transparency. These actors, especially politicians also dislike and are often uncooperative with research into expenditure framework and actual spending of the government and relevant agencies or parastatals.
Table 1: Frequency and percentage distribution of the number of stories reported across selected
stories considered important usually appear on the front page with very important ones appearing as lead stories. Front page is used to present readers
eye-catching and major headlines. News stories trusted with the potential to interest the general public or boost sales are allocated to front pages of national dailies (Ofuoku and Agumagu, 2008). Uninterestingly, no news story on ARCPs was found on the editorial page. Editorial pages represent the ideological positions or standpoints of the dailies (Chief-Editors) on current and burning national issues.
Total
F 1.4 1 0.0 0 0.0 0 98.6 70 100 71
others (33.8%) remain the most reported. This is in tandem with the postulation of Idachaba (2014) that when government policies are corruption-prone,
-tripping will be ‘profitable’ and inevitable. This presents a sharp contrast to the findings of UNODC (2017) that bribery is the most familiar and widespread form of
n directly experienced by Nigerians. Although nepotism was second to the least form of ARCPs reported in the dailies; the consequences speak volumes. Technically, nepotism brings

incompetent people into power, weakens performance on delivery of services an Table 3: Percentage and frequency distribution of the forms of ARCPs in the Nigerian dailies
Forms of corruption Nigerian
Tribune
% Contract inflation 0.0 Embezzlement 12.5 Extortion 6.25 Bribery 0.0 Favouritism/Nepotism 6.25 Fraud 12.5 Looting 12.5 Misappropriation 12.5 Others 37.5 Total 100 Source: Newspapers survey (2017) * Typology of ARCPs most reported Sources of ARCPs stories reported in the
Nigerian newspapers From Table 4, it became obvious that majority: 56.2%, 52.9% and 26.7% of news sources quoted in the Nigerian Tribune, The Punch and The Guardian, respectively, came from government officials whereas in the Vanguard, EFCC (21.%) discriminated as the major news source quoted. In the final analysis, political parties (0%), Nigerian Police Force (NPF) (1.4%), ICPC (2.8%), anonymous sources (2.8%) and EFCC (7%) were the least quoted sources of news stories in the selected dailies. This finding does not depict adirect association with the mandate of the Nigerian law enforcement and anti-corruption agencies NPF, ICPC and EFCC, as regards investigation, arrest and prosecution of offenders as these agencies are primarily charged with corruption detection and prosecution. Interestingly, civil society organisations (21.1%) have fared relatively well in their activities by creating awareness or enlightenment to discourage corruption. It challenges the investigative, watchdog and
Table 4: Distribution of sources of news articles in Nigerian dailies
News sources Nigerian
Tribune
% EFCC 0.0 ICPC 0.0 NPF 0.0 Political parties 0.0 Government 56.2 CSOs 37.5 Reporters & whistle blowers 6.2 Anonymous 0.0 Others 0.0 Total 100 Source: Newspapers survey (2017)
Nigerian Journal of Rural Sociology Vol. 18, No. 2, 2018
43
incompetent people into power, weakens performance on delivery of services and ultimately
stifles development (OECD, 2014).
Table 3: Percentage and frequency distribution of the forms of ARCPs in the Nigerian dailies
Nigerian
Tribune The Punch The
Guardian Vanguard
F % F % F % F 0 0 0 6.67 1 4.35 1 2 17.65 3 6.67 1 13.04 3 1 5.88 1 6.67 1 8.70 2 0 0.0 0 0.0 0 0.0 0 1 0.0 0 0.0 0 4.35 1 2 0.0 0 33.33 5 34.78 8 2 5.88 1 0 0 8.70 2 2 17.65 3 13.33 2 8.70 2 6 52.94 9 33.33 5 17.39 4 16 100 17 100 15 100 23
Sources of ARCPs stories reported in the
From Table 4, it became obvious that majority: 56.2%, 52.9% and 26.7% of news sources quoted in the Nigerian Tribune, The Punch and The Guardian, respectively, came from government officials whereas in the Vanguard, EFCC (21.%)
news source quoted. In the final analysis, political parties (0%), Nigerian Police Force (NPF) (1.4%), ICPC (2.8%), anonymous sources (2.8%) and EFCC (7%) were the least quoted sources of news stories in the selected dailies. This finding does not depict a direct association with the mandate of the Nigerian
corruption agencies - NPF, ICPC and EFCC, as regards investigation, arrest and prosecution of offenders as these agencies are primarily charged with corruption
ecution. Interestingly, civil society organisations (21.1%) have fared relatively well in their activities by creating awareness or enlightenment to discourage corruption. It challenges the investigative, watchdog and
gatekeeper functions of the media and NPF. The results are apt or fitting because corruption is controlled only when citizens no longer tolerate it (World Bank, 1997). Furthermore, from the standpoint of theories of the press, the emergence of government officials as the major source of news stories on ARCPs is worrisome. It is retrogressive and surprising evidence that authoritarian theory of the press is thriving in Nigeria. The essential characteristic of an authoritarian society is that the state controls the media and ranks higher than individuals in the control or ownership of the media and in the scale of social values (Siebert et al., 1956 in Flor, 2007). Being that this work was conducted in the 21century- 2017, the picture expected in terms of media control and ownership is a libertarian scenario. In libertarian societies, the press is not appropriated as an instrument of the government but as a watchdog, a mechanism, through which a people check or balance the activities of government (Siebert et al., 1956 in Flor, 2007).
Table 4: Distribution of sources of news articles in Nigerian dailies Nigerian
Tribune The Punch The
Guardian Vanguard Total
F % F % F % F % 0 0.0 0 0.0 0 21.7 5 7 0 0.0 0 0.0 0 8.7 2 2.80 0.0 0 0.0 0 4.3 1 1.40 0.0 0 0.0 0 0.0 0 0.0
9 52.9 9 26.7 4 17.4 4 36.6* 6 17.6 3 20.0 3 13 3 21.1
1 11.8 2 26.7 4 34.8 8 21.10 5.9 1 6.7 1 0.0 0 2.80 11.8 2 20 3 0.0 0 7.016 100 17 100 15 100 23 100
2, 2018
stifles development (OECD, 2014).
Table 3: Percentage and frequency distribution of the forms of ARCPs in the Nigerian dailies Total
% F 2.82 2 12.68 9 7.04 5 0.0 0 2.82 2 21.13 15 7.04 5 12.68 9 33.8* 24
100 71
gatekeeper functions of the media and even the NPF. The results are apt or fitting because corruption is controlled only when citizens no longer tolerate it (World Bank, 1997).
Furthermore, from the standpoint of theories of the press, the emergence of government officials as
e of news stories on ARCPs is worrisome. It is retrogressive and surprising evidence that authoritarian theory of the press is thriving in Nigeria. The essential characteristic of an authoritarian society is that the state controls the
er than individuals in the control or ownership of the media and in the scale
, 1956 in Flor, 2007). Being that this work was conducted in the 21st
2017, the picture expected in terms of media control and ownership is a libertarian scenario. In libertarian societies, the press is not appropriated as an instrument of the government but as a watchdog, a mechanism, through which a
or balance the activities of , 1956 in Flor, 2007).
Total
F 5
2.8 2 1.4 1 0.0 0 36.6* 26 21.1 15 21.1 15 2.8 2 7.0 5 100 71

Nigerian Journal of Rural Sociology Vol. 1
* Most quoted source of ARCPs Test of hypothesis The result of the hypothesis as presented in Table 5, reveals that there was no significant difference (F= 1.294, P= 0.284) in the occurrence (frequency) of ARCPs stories in the dailies. This implies that the occurrence of ARCPs cases was not determined by the name of the daily. This finding is interesting arguing from the standpoint of
Table 4.11: Results of ANOVA analysis of frequency/occurrence of ACRPs in the dailies
Source of
variation Sum of
Squares Between Groups 20.821 Within Groups 359.376 Total 380.197 Source: Newspapers survey (2017)
CONCLUSIONS AND RECOMMENDATIONS News stories were not strategically placed in the dailies as none of the stories was reported on the editorial and front pages of the newspapers. Editorial and front pages of newspapers are usually reserved for attractive, eye-catchy and outstanding stories. Majority of the news reports were found on the inside pages. Consequently, in all the newspapers, no story was reported on bribery as a form of ARCPs. The salient typology of ARCPs promoted in the dailies was items grouothers. Against the conjecture that ARCPs stories would come from law enforcement and anticorruption agencies- EFCC, ICPC, NPF or even civil society organisations, the major source of news reports was found to be government functionaries. Frostily, statements or pronouncements from government officials are usually taken with a pinch of salt because of the officials’ predilection or propensity for propaganda and blatant falsehood in their public relations. Based on the findings of the study, it was deduced that there were obvious variations in the frequency of stories on ARCPs; both across the years and newspapers. ARCPs news reports did not receive strategic placement in all the dailies. Perhaps, it was politics, economics, sports and entertainment that received advantageous placements in comparison to ARCPs. The emergence of government functionaries as the major source of news reports is worrisome in relation to media independence. Based on the conclusions of the study, the following recommendations are prescribed: i. Given the insubstantial occurrence of ARCPs
news stories in the dailies, comprehensive attention should be given to ARCPs stories. This is because if the agricultural sector remains compromised, our industries cannot grow.
Nigerian Journal of Rural Sociology Vol. 18, No. 2, 2018
44
The result of the hypothesis as presented in Table 5, reveals that there was no significant difference (F= 1.294, P= 0.284) in the occurrence (frequency) of ARCPs stories in the dailies. This implies that the occurrence of ARCPs cases was
y the name of the daily. This finding is interesting arguing from the standpoint of
media ownership, loyalties, affiliations, ideological backgrounds and audience or market share. The ownership, patronage, loyalties, affiliations, ideological backgrounds, etc. against popular impressions in the public opinion, did not reflect on the occurrence and frequency of ARCPs across the dailies.
Table 4.11: Results of ANOVA analysis of frequency/occurrence of ACRPs in the dailies Df Mean Square F Sig. Decision
3 6.940 1.294 0.284 Not significant67 5.364 70
CONCLUSIONS AND RECOMMENDATIONS News stories were not strategically placed in
the dailies as none of the stories was reported on the editorial and front pages of the newspapers. Editorial and front pages of newspapers are usually
catchy and outstanding stories. Majority of the news reports were found on the inside pages. Consequently, in all the newspapers, no story was reported on bribery as a form of ARCPs. The salient typology of ARCPs promoted in the dailies was items grouped as others. Against the conjecture that ARCPs stories would come from law enforcement and anti-
EFCC, ICPC, NPF or even civil society organisations, the major source of news reports was found to be government
statements or pronouncements from government officials are usually taken with a pinch of salt because of the officials’ predilection or propensity for propaganda and blatant falsehood in their public relations.
Based on the findings of the study, it was deduced that there were obvious variations in the frequency of stories on ARCPs; both across the years and newspapers. ARCPs news reports did not receive strategic placement in all the dailies. Perhaps, it was politics, economics, sports and
that received advantageous placements in comparison to ARCPs. The emergence of government functionaries as the major source of news reports is worrisome in relation to media independence. Based on the conclusions of the study, the following
Given the insubstantial occurrence of ARCPs news stories in the dailies, comprehensive attention should be given to ARCPs stories. This is because if the agricultural sector remains compromised, our industries cannot
ii. Attention should be given to the placement of stories on ARCPs on the editorial pages and front pages by law enforcement and prosecution agencies. Evidence has it that development communication is the current paradigm in media practice and in a strict sense; the essence of the media. Reportage on corruption should never be sidestepped if the menace of corruption must be checked.
iii. Civil societies and the media should rise to the occasion; reclaim the center stage in the reportage of ARCPs. This can be achieved by mainstreaming and undertaking investigative journalism and multidisciplinary research on corruption in the agricultural sector.
iv. Government functionaries as the major source of news reports should be challenged or addressed with robust engagement as the focus or interest is to see corruption suffocated in all the agricultural value chain. This is one way the media can be instrumental; working for food security and national development.
REFERENCES Charles C. (2010). Corruption and Fraud in
Agricultural and Energy SubsIdentifying the key Issues, Global Subsidy Initiative Policy Brief. Retrieved on December 08, 2016 from http://www.iisd.org/library/corruptionand-fraud-agricultural-andsubsidies-identifying-key-issues
Chikwendu R. (2016). Constructing Corrua Social Problem in Nigeria: A Content Analysis of Four Nigerian Newspapers. Retrieved on December 10, 2016 from http://essay.utwente.nl/70865/
Fadairo, S. O., Fadairo, A. O. and Aminu(2014). Coverage of Corruption News by Major Newspapers in Nigeria, New Media
media ownership, loyalties, affiliations, ideological backgrounds and audience or market share. The ownership, patronage, loyalties, affiliations,
etc. against popular impressions in the public opinion, did not reflect on the occurrence and frequency of ARCPs across the
Decision
Not significant
be given to the placement of stories on ARCPs on the editorial pages and front pages by law enforcement and prosecution agencies. Evidence has it that development communication is the current paradigm in media practice and in a strict
f the media. Reportage on corruption should never be sidestepped if the menace of corruption must be checked. Civil societies and the media should rise to the occasion; reclaim the center stage in the reportage of ARCPs. This can be achieved by
ng and undertaking investigative journalism and multidisciplinary research on corruption in the agricultural sector. Government functionaries as the major source of news reports should be challenged or addressed with robust engagement as the focus
rest is to see corruption suffocated in all the agricultural value chain. This is one way the media can be instrumental; working for food security and national development.
Charles C. (2010). Corruption and Fraud in Agricultural and Energy Subsidies: Identifying the key Issues, Global Subsidy Initiative Policy Brief. Retrieved on December 08, 2016 from http://www.iisd.org/library/corruption-
and-energy-issues
Constructing Corruption as a Social Problem in Nigeria: A Content Analysis of Four Nigerian Newspapers. Retrieved on December 10, 2016 from http://essay.utwente.nl/70865/
and Aminu, O. verage of Corruption News by
Major Newspapers in Nigeria, New Media

Nigerian Journal of Rural Sociology Vol. 18, No. 2, 2018
45
and Mass Communication, vol. 24 (2014). Retrieved on February 20, 2016 from http://iiste.org/Journals/index.php/NMMC/article/view/12552/12884
Idachaba F. S. (2014). Government, Corruption and the Underdevelopment of Nigerian Agriculture, University Press PLC, Ibadan.
Organisation for Economic Cooperation and Development (OECD) (2016). Glossary of Statistical Terms. http://stats.oecd.org/glossary/search.asp Retrieved 05/12/2016
Ofuoku, A. U. and Agumagu, A. C (2008). Farmers’ perception of audio visual aids on technology dissemination by agricultural development programme in Delta State, Nigeria. Agricultura Tropica Et Subtropica, 41(4): 192-196
Transparency International (2016). What is Corruption? Retrieved on 12/10/2016 at URL http://www.transparency.org/what-is-corruption
UNODC (2017). Corruption in Nigeria Bribery: public experience and response. Retrieved on October 01, 2017 from https://www.unodc.org/documents/data-and-analysis/Crime-statistics/Nigeria/Corruption_Nigeria_2017_07_31_web.pdf
USAID (2005). Anti-corruption Strategy Paper. Retrieved on February 05, 2017 from http://www.usaid.gov/policy/anticorruption_strategy05.pdf
World Bank (2010). World Development Report 2010: Development and Climate Change. Washington, DC.. https://openknowledge.worldbank.org/handle/10986/4387
World Bank (1997). Helping Countries Combat Corruption: The Role of the World Bank. Retrieved on 20/02/2017 from http://www1.worldbank.org/publicsector/anticorrupt/corruptn/corrptn.pdf
Nigerian Journal of Rural Sociology Vol. 18, No. 2, 2018
46
CONTRIBUTION OF LEAFY VEGETABLE FARMING TO THE LIVELIHOOD OF WOMEN IN
IKORODU LOCAL GOVERNMENT AREA, LAGOS STATE NIGERIA 1Anozie, O., 1Koyenikan, M. J. and 2Obar, E. E.
1Department of Agricultural Economics and Extension Services, University of Benin 2Department of Agricultural Extension and Rural Development, University of Ibadan, Ibadan
Correspondence e-mail address: [email protected] ABSTRACT The study assessed the contribution of leafy vegetable farming to the livelihood of women in Ikorodu Local Government of Lagos State, Nigeria. Structured questionnaire and interview schedule were used to collect data from 99 respondents on socioeconomic characteristics, other livelihood activities engaged in, livelihoods status and constraints faced in urban vegetable farming. Data was analysed using means, percentages, standard deviation, Chi-square, Pearson Product Moment Correlation, Linear regression at 5% level of significance. Findings reveal that the mean age of respondents was 46years, average farm size and income were 1acre and ₦76,373, respectively. One-quarter(25.3%) of the women diversified into other sources of livelihood activities (such as petty trading, tailoring, hairdressing), although most (98.0%) engaged in vegetable production as their primary source of income. Most respondents were food secure (87.9%), while56.6% and 35.4% had access to educational services for their children and health services, respectively. Respondents had high livelihood status
(60.6%). High cost of labour (x̅=1.57), climatic factors (x̅=1.33) and pests and disease (x̅=1.29) were the severe
constraints to urban vegetable farming. Respondents’ educational status (r=0.23) was positively correlated with their livelihood status. Constraints (r=-0.37) faced by respondents was negatively correlated to their livelihood status. Age (β=-0.40), farming experience (β=0.45), and constraints (β=-0.34), were predictors of the livelihood status of the women in the study area. The study concluded that leafy vegetable farming contributed to the livelihood status of the women. Adult education should be encouraged as education helped the women to manage information on how to better their lives. Keywords: Vegetable farming, livelihood status, urban agriculture INTRODUCTION Urbanisation-the increase in the urban share of total population – is inevitable. A United Nations report (United Nations, 2007) indicates that an unprecedented scale of urban growth will be noticed in the developing countries of Africa and Asia, and that this growth will occur in a single generation. The UN report further stated that by 2030, towns and cities of the developing world will make up 80 percent of the urban populace. While urbanization can lead to economic growth-that is – if proper plans and policies are put in place. It can also be highly detrimental if handled with levity. In Nigeria, rapid, largely unchecked urbanization is a common feature in cities like Lagos, Kano and Ibadan. Lagos is the economic centre of the country with a population of 9,013,534 (NPC, 2007) making it the most populous state in the country despite the fact that it is the smallest in size (3577km2/ 0.4% of Nigeria landmass) in terms of the land area. Oduwaye (2005) posits that Lagos as a mega city has the lowest urban living standard among the 28megacities in the world. The rate of population growth is about 275, 000 persons per annum with a population density of 2,594 persons per square km. The resultant effect of the unprecedented increase in population includes; income poverty, increased food insecurity, poor-quality and over-crowded shelter, lack of public services and infrastructure such as pipe borne water, sanitation facilities, waste collection, drainage and roads as well as insecure land tenure. These affect urban
poor men and women but it has more effects on women. Poor women are particularly disadvantaged due to socio-cultural norms which limit their access to and control over resources despite the triple burden of reproduction, production and community work. Mtsor and Idisi (2014) maintains that women’s lack of independent land rights rules out one of the main fallback positions for women seeking sustainable livelihoods in the face of rising poverty. Consequently, in order to alleviate urban poverty, improve urban poor livelihoods, food security, and to enhance urban waste management, many cities in developing countries approved and stimulated the development of urban agriculture as one of the alternative strategy (Resource Centers on Urban Agriculture and Food security, 2014; Baker 2012). Agricultural activities carried out in the urban area includes cultivation of vegetables, rearing of livestock small ruminants (goat, sheep) and fish farming. Women are mostly involved in vegetable production because it requires a relatively small land area, minimum capital, and that vegetables mature more quickly than other crops. Vegetables are not labour intensive, but provide a quick source of income for the farmers. According to the Food and Agriculture Organisation, (2008), vegetable farming has the potential to provide an initial step towards establishing an income base for more poor household. Women are not only growing but also marketing and storing vegetables as part of their contribution to family income, food security, and access to family healthcare. It also enables women

Nigerian Journal of Rural Sociology Vol. 18, No. 2, 2018
47
to attain some degree of financial independence with family budget (Adebisi-Adelani, Olajide-Taiwo, Adeoye, Olajide-Taiwo, 2011). Anosike and Fasona (2004) maintain that “the high rate of poverty among urban households and the growing responsibilities of women to assure household survival have caused urban agriculture to become a crucial activity in Lagos. However, inadequate access to land and water are obstacles to efficient and effective agricultural practices and in comparison to men, women are more affected”. In their study, they reported that land in Lagos is usually rented and about two plots of land is allocated to four to six farmers. Many women are usually not able to cope with the payments due to poor production output and sales and their inability to access a better land. Additionally, the women in the state argued that due to their inability to have a say in decision making, they are not able to benefit from communal efforts as do their counterparts. Despite these limiting factors women are still saddled with the responsibility of provision of food and household welfare. In a state like Lagos, with a burgeoning population and the severe constraints limiting women to achieve their full potentials in urban agriculture, it therefore becomes imperative to assess the contributions of urban leafy vegetable farming to the livelihood of women in the state. Additionally, to bring to light the livelihood status of women and other constraints they face in leafy vegetable farming in Lagos state. Several literatures have concentrated on benefits of urban agriculture, its prospects or focused on its effect on the living standard of urban farmers generally. However, there is a paucity of literature on the contributions of leafy vegetable farming to livelihoods with a particular focus of women living in Lagos state where there is an increasing rate of urban slum and low standard of living. To this end this study sought to address the following specific objectives; 1. describe the socio-economic characteristics of
the urban vegetable women farmers in the study area.
2. identify other livelihood activities that respondents are involved in, in the study area.
3. ascertain the livelihood status of urban women farmers in the study area.
4. identify the constraints associated with urban vegetable farming in the study area.
The following null hypotheses were tested; H01: There is no significant relationship between
the selected socio-economic characteristics of the respondents and their livelihood status.
H02: There is no significant relationship between the constraints faced by the respondents and their livelihood status.
H03: There is no significant contribution of the independent variables (socio-economic characteristics, involvement in other activities
and constraints) to the livelihood status of the respondents.
METHODOLOGY Lagos state is one of the 36 states in Nigeria and lies to the South-west of Nigeria with Ikeja as its capital. It extends approximately from latitude 6º2' north to 6º4' north and from longitude 2º45' east. It is the largest city in Nigeria as well as on the Africa continent. Lagos population as at 2016 is 21million (estimate) (National Population Commission, 2018). In 2012 Lagos surpassed Cairo in size to become the largest city in Africa. The World Economic Forum (WEF) states that Lagos is the fastest-growing city in the world, with a growth of 85 people per hour. The population growth of Lagos is faster than that of London and New York put together, with the two cities growing at a rate of 9 and 10 people per hour. Due to heavy migration, the city has a diverse population. It also faces a major issue of inequality in the distribution of wealth and income. Lagos state has been described as the “mega-city of slums” with millions living in and around the lagoons with no access to road, clean water, electricity or waste disposal (National Bureau of Statistics, 2018). Lagos state is classified into five agricultural zones which are Badagry, Epe, Ikorodu, Ikeja, Lekki. The population of this study included women farmers that are into Ugu (Telfaria occidentalis) and Ewedu (Corchorus spp) production. Multi-stage sampling procedure was employed to select respondents for the study. The first stage was the purposive selection of Ikorodu agricultural zone out of the five agricultural zones in the state. Ikorodu was selected due to the large population of vegetable farmers in the zone. In the second stage, Ikorodu North Local Council Development Area (LCDA) was purposively chosen out of four LCDAs because of the large population of female vegetable producers in the area. In the third stage, three communities were randomly selected from the 15 communities in the LCDA. The last stage was a random sampling of respondents to obtain a sample size of ninety-nine (99) female vegetable farmers. Primary data for the study was collected through a structured questionnaire. The questionnaire was divided into different sections to provide information that addressed the specific objectives. Independent variables of the study were measured as follows; Other livelihood activities involved in was measured by listing out alternative livelihood options and respondents were required that tick from the option Yes or No and scores of 1 and 0 were assigned, respectively. Constraints faced by respondents was measured on a 3-point Likert typed scale of serious constraint mild constraint and not a constraint. Scores of 2, 1 and 0 were assigned respectively.

Nigerian Journal of Rural Sociology Vol. 18, No. 2, 2018
48
Weighted mean was used to rank constraints in their order of severity. The dependent variable is livelihood status. The study adapted the method used by Gebrekidan (2015) in to measure livelihood status. The components he used to determine livelihood status were; primary source of employment, food security and access to social services. Primary employment and source of income was measured by asking respondents to indicate their primary source of employment. A list of employment sources was given and the respondents were to indicate their primary employment. Yes was coded 1 and No as 0. The item with the highest frequency was regarded as the primary source of employment and the primary source of income. Food security was measured using the Food and Nutrition Technical Assistance (FANTA-2) methodology for Household Food Security Survey Model (HFSSM) (Deitchler, Ballard, Swindale and Coates, 2011). The HFSSM model covers food accessibility, food availability, and food utilization. The model comprises of 18 questions, and respondents were required to tick either Yes or No based on the occurrence of each item in their household. Scores of 1 and 0 were assigned respectively.For the frequency of occurrence, respondents who tick the Yes option were required to indicate the frequency of the occurrence from a 3 point Likert typed scale of Sometimes, Often and Never. Since often and sometimes are in the affirmative, they were coded as 1 while never was coded 0. Access to social services such as Health and education was measured by asking respondents to respond to question under each component. A 3-point Likert type scale of increased, decreased and not changed was used. Scores of 2, 1 and 0 were assigned respectively. Scores from each were standardized and a mean score was obtained which was used to categorized respondents into high, and low livelihood status. Data obtained were analysed using descriptive statistics while inferential statistics such as Chi-square, Pearson Product Moment Correlation and Regression were used to test the hypotheses at 5% significance level.
RESULTS AND DISCUSSION
Socioeconomic characteristics Table 1 shows that 37% of the respondents were between 41-50 years with a mean of 46 years. This is an indication that the women urban vegetable farmers have past their child bearing age but are still in their middle age and are expected to be strong enough to withstand the level of rigor associated with vegetable farming in an urban settlement. This contrary to the findings of Odok and Agbachome (2012) who in their study in
Calabar reported that the mean age of farmers in the area is 35 years. A high percentage (70.7%) of the respondents was married. This is a plus to urban farming because the family members (children) can provide labour, which is a primary requirement for urban agriculture. Furthermore, the divorced and widowed represent 25.3% of the respondents; this implies that one-quarter of the respondents have female- headed households and as such, they are responsible for the upkeep of their families. The results in Table 1 also show that the mean household size of the respondents was5 years. This implies that respondents have a small family size and a small family size implies low expenditures and dependency burden. This finding somewhat corroborates that of Aina, Oladapo, Adebosin and Ajilola (2012) who observed that a majority of the farmers in Ibadan metropolis have a small family size of 1-3 persons. On educational status, the results show that 39.4% of the women had primary education, 43.4% of the women had secondary education, and 1.0% of the women had tertiary education. This reveals that most urban farmers are educated thus, increases their chances of adopting new techniques that will boost agricultural productivity.Also, the mean farming experience of the respondents was 17 years. It indicates that the respondents are not new to urban vegetable production. With a form of formal education coupled with excellent farming experience, respondents will be more knowledgeable and open to innovations in urban vegetable farming. This is in tandem with the findings of Asadu, Egbujor, Char and Ifedika, (2013) and Danso (2004) who reported that a higher number of urban farmers are educated and this contributes to their income as they are willing to adopt practices that will increase their productivity. More than two-thirds of the respondents had less than one acre of vegetable farm. It shows that most of the respondents are small scale farmers. Additionally, the results reveal that more than half (52.5%) of these women got their farmlands by rent, while 9.1% were farming on borrowed land. This may be due to the fact that they are female and are constrained in assessing lands or due to the fact that they are limited by space for vegetable production because of industrialization, housing, which is a common trend in urban area. This agrees with Edeoghon and Anozie (2015) who reported that land is a very serious constraint among urban vegetable farmers in Lagos state. The results in Table 1 further shows that74.7% of the respondents were full time vegetable farmers. Most (97.9%) of the respondents were either a member of a cooperative or vegetable producers’ association. The high full-time participation in vegetable farming and membership in a social organisation by respondents might

Nigerian Journal of Rural Sociology Vol. 18, No. 2, 2018
49
enhance their access to resources and therefore boost their vegetable production. Odoemenem, (2007) stated that high percentage of the women in cooperative society may be because the cooperative society is a good source of information on agricultural production and is a source of inputs and credit facilities to farmers. On income, the result shows that respondents had an average monthly income of ₦76,373.72. This indicates that
the women are making enough money to meet their basic needs when compared to the current Federal minimum wage in Nigeria, which is ₦30,000. This contradicts the findings of Salau and Attah (2012) who attests that the estimated mean monthly income for urban farmer is ₦13,686. They also stated that low income adversely affects productivity because it leads to low capital investment.
Table 1: Distribution of respondents by their socioeconomic characteristics, n=99
Variable Frequency Percentage Mean
Age
≤34 11 11.1 46
31-34 21 21.2 41-45 37 37.4 51-60 18 18.2
Above 60 12 12.1
Marital status Single 4 4.0
Married 70 70.7 Divorced 8 8.1
Widowed 17 17.2
Educational status No formal education 16 16.2
1-6 years 39 39.4 7-12 years 43 43.4
>12 years 1 1.0
Farming experience
1-10 42 42.4 17
11-20 28 28.3 21-30 20 20.2 31-40 8 8.1 >40 1 1.0 Household size 1-3 30 30.3 5
4-6 46 46.5 7-9 19 19.2 10-12 4 4.0 Farm size (acre) ≤ 1 63 63.6 1
1 -2 25 25.3 > 2 11 11.1 Social group
Cooperative 63 63.6 Veg. prod. Association 34 34.3 None 2 2.1 Working status Fulltime 74 74.7
Part-time 25 25.3 Source of land Inherited 17 17.2
Borrowed 9 9.1 Leased 1 1.0
Rented 52 52.5 Owned 20 20.2
Monthly income
≤ ₦50000 35 35.4 ₦76,373
₦500001-100000 41 41.4

Nigerian Journal of Rural Sociology Vol. 18, No. 2, 2018
50
Variable Frequency Percentage Mean
₦100001-150000 21 21.2 >150000 2 2.0 Source: Field survey, 2017
Other livelihood activities that respondents are
involved in Results in Table 2 shows the other livelihood activities respondents were engaged in. Less than one-tenth (7.2%) of the respondents were involved in trading, while 6.1% were involved in tailoring. This shows that 25 respondents out of 99 practice livelihood diversification. Hence, 74 respondents depend sole on income from urban vegetable farming. The implication of livelihood
diversification is that these women have more than one source of income and this may positively impact on their livelihood status as it makes them able to afford their basic necessities such as accommodation, shelter and food. This is in line with the submission of Adepoju and Obayelu (2013), who reported that due to the risks and uncertainties associated with farming, there is an increasing involvement in off-farm and non-farm activities by the rural populace so as to help improve their welfare.
Table 2: Other livelihood activities engaged in by respondents.
Other livelihood activities Yes
Freq. %
Petty trading 7 7.2 Teaching 0 0 Tailoring 6 6.1 Hairdressing 4 4.0 Housekeeping and babysitting for others 3 3.0 Civil service 1 1.0 Catering None
4 74
4.0 74.7
Source: Field survey, 2017 Livelihood status of the respondents The livelihood status of the respondents was measured under 3 categories; Respondents’ primary employment / source of
income
Almost all (98.0%) of the respondents, as reported in Table 3, engaged in leafy vegetable production as their primary source of income. Not more than 1% of the women had petty trading and tailoring as their primary source of income respectively. This indicates that leafy vegetable production is the primary source of income for almost all respondents. Hence, their basic and other essential
needs of the family are met through the sales of vegetables. The high involvement of the women in vegetable farming may be due to the unavailability of jobs in the study area and the fact that vegetable requires a relatively small amount of capital and land for start-up and a short gestation period. This supports the finding of Tewodros (2007) and Axumite (1994) who opined that individuals involved in urban vegetable farming were people who are not employed or whose salary is too little to sustain their lives and that it was a matter of survival.
Table 3: Distribution of respondents by primary source of employment / income
Primary employment/ source of income Yes Frequency Percentage Vegetable production 97 98.0 Petty trading 1 1.0 Teaching 0 .00 Tailoring 1 1.0 Hairdressing 0 .00 Housekeeping and babysitting for others 0 .00
Source: Field survey, 2017
Contribution of vegetable farming to
respondents’ food security status
Results in Table 4 shows that for household items, over 90% of the respondents never had to worry that their food will run out before they get
money to buy more and could afford balanced meals. For the adult items, 97% of the adults never cut size or skipped meals and none (100%) of the adult never lost weight or didn’t eat for a whole day in three months or more. Furthermore, for the
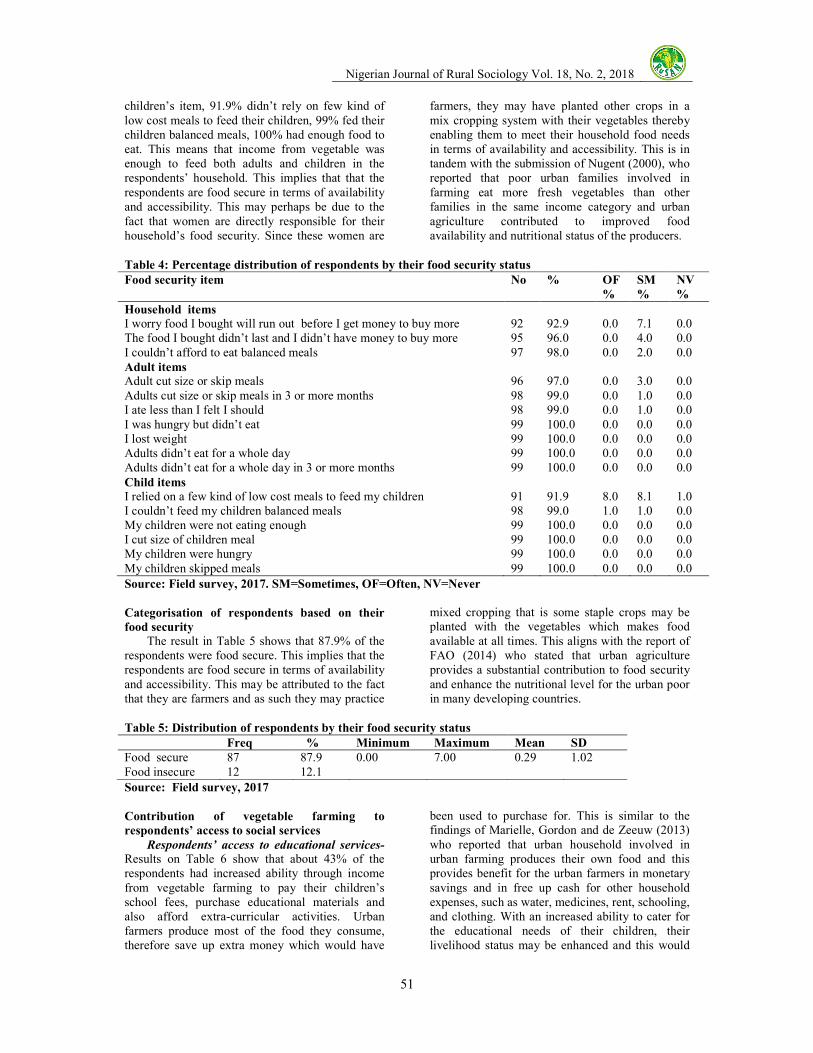
Nigerian Journal of Rural Sociology Vol. 18, No. 2, 2018
51
children’s item, 91.9% didn’t rely on few kind of low cost meals to feed their children, 99% fed their children balanced meals, 100% had enough food to eat. This means that income from vegetable was enough to feed both adults and children in the respondents’ household. This implies that that the respondents are food secure in terms of availability and accessibility. This may perhaps be due to the fact that women are directly responsible for their household’s food security. Since these women are
farmers, they may have planted other crops in a mix cropping system with their vegetables thereby enabling them to meet their household food needs in terms of availability and accessibility. This is in tandem with the submission of Nugent (2000), who reported that poor urban families involved in farming eat more fresh vegetables than other families in the same income category and urban agriculture contributed to improved food availability and nutritional status of the producers.
Table 4: Percentage distribution of respondents by their food security status Food security item No % OF
%
SM
%
NV
%
Household items
I worry food I bought will run out before I get money to buy more 92 92.9 0.0 7.1 0.0
The food I bought didn’t last and I didn’t have money to buy more 95 96.0 0.0 4.0 0.0 I couldn’t afford to eat balanced meals 97 98.0 0.0 2.0 0.0 Adult items Adult cut size or skip meals 96 97.0 0.0 3.0 0.0
Adults cut size or skip meals in 3 or more months 98 99.0 0.0 1.0 0.0 I ate less than I felt I should 98 99.0 0.0 1.0 0.0 I was hungry but didn’t eat 99 100.0 0.0 0.0 0.0 I lost weight 99 100.0 0.0 0.0 0.0 Adults didn’t eat for a whole day 99 100.0 0.0 0.0 0.0 Adults didn’t eat for a whole day in 3 or more months 99 100.0 0.0 0.0 0.0 Child items I relied on a few kind of low cost meals to feed my children 91 91.9 8.0 8.1 1.0
I couldn’t feed my children balanced meals 98 99.0 1.0 1.0 0.0 My children were not eating enough 99 100.0 0.0 0.0 0.0 I cut size of children meal 99 100.0 0.0 0.0 0.0 My children were hungry 99 100.0 0.0 0.0 0.0 My children skipped meals 99 100.0 0.0 0.0 0.0
Source: Field survey, 2017. SM=Sometimes, OF=Often, NV=Never
Categorisation of respondents based on their
food security
The result in Table 5 shows that 87.9% of the respondents were food secure. This implies that the respondents are food secure in terms of availability and accessibility. This may be attributed to the fact that they are farmers and as such they may practice
mixed cropping that is some staple crops may be planted with the vegetables which makes food available at all times. This aligns with the report of FAO (2014) who stated that urban agriculture provides a substantial contribution to food security and enhance the nutritional level for the urban poor in many developing countries.
Table 5: Distribution of respondents by their food security status
Freq % Minimum Maximum Mean SD
Food secure 87 87.9 0.00 7.00 0.29 1.02 Food insecure 12 12.1
Source: Field survey, 2017
Contribution of vegetable farming to
respondents’ access to social services
Respondents’ access to educational services-
Results on Table 6 show that about 43% of the respondents had increased ability through income from vegetable farming to pay their children’s school fees, purchase educational materials and also afford extra-curricular activities. Urban farmers produce most of the food they consume, therefore save up extra money which would have
been used to purchase for. This is similar to the findings of Marielle, Gordon and de Zeeuw (2013) who reported that urban household involved in urban farming produces their own food and this provides benefit for the urban farmers in monetary savings and in free up cash for other household expenses, such as water, medicines, rent, schooling, and clothing. With an increased ability to cater for the educational needs of their children, their livelihood status may be enhanced and this would

Nigerian Journal of Rural Sociology Vol. 18, No. 2, 2018
52
also promote social development in the community. This agrees with the findings of Hull and Midgley (2015) who stated that education is the single most vital element in combating poverty, empowering
women, promoting human rights and democracy, protecting the environment and controlling population growth.
Table 6: Percentage distribution of respondents based on children’s access to educational services
Educational service DC
NC IC
Freq % Freq % Freq %
Income from vegetable farming is sufficient to pay my children's school fees
23 23.2 33 33.3 43 43.4
Income from vegetable farming is sufficient to buy educational materials for my children
22 22.2 34 34.4 43 43.3
Income from vegetable farming is sufficient to pay for my children's extra-curricular activities
22 22.2 34 34.4 43 43.3
Income from vegetable farming is sufficient to sponsor my children at tertiary level
21 21.2 45 45.5 33 33.3
Source: Field survey, 2017
DC= decreased, NC=not changed, IC=increased
Categorisation of respondents based on
children’s access to educational service Results on Table 7 shows the categorisation of respondents on children’s access to educational services. More than half (56.6%) of the respondents had access to educational services for the children. This means that with the income from vegetable
farming, more than half of the women can provide their children’s educational needs. This result agrees with the findings of Adedeji and Ademiluyi (2009) from the research on urban agriculture in Lagos State and reported that the production of leafy vegetables provide quick returns that helps families to meet their needs.
Table 7: Distribution of respondents based on children’s access to educational services
Freq % Minimum Maximum Mean SD
High 56 56.6 0.00 10.0 5.94 3.50 Low 43 43.4
Source: Field survey, 2017
Respondents by access to health services Results in Table 8show that 37.0% of the women had increased ability to pay their medical bills, 35.4% were able to buy the drugs, and 34.4%
were able to afford the medical bills for their children. This means that a little above one-third of the respondents’ income from vegetable farming had increased their access to medical services.
Table 8: Percentage distribution of respondents by access to health services
Health service IC DC NC
freq % freq % Freq %
With the income from vegetable farming, I am able to pay my medical bills
37 37.4 18 18.2 44 44.4
With the income from vegetable farming, I am able to buy drugs
35 35.4 20 20.2 44 44.4
With the income from vegetable farming, I am able to pay for my children's medical bill
34 34.4 21 21.2 44 44.4
Source: Field survey, 2017.
IC=increased, DC= decreased, NC=not changed. Categorisation of respondents based on their
access to health services Results in Table 9 shows that 35.4% of the respondents have high access to health services. This implies that almost two-third (64.6%) of respondents had low access to health services. Inability of the respondents to have access to health
services may have a negative impact on not just their farming activities but also on their livelihood status, as the saying goes “health is wealth”. This agrees with the findings of Asenso-Okyere, Chiang, Thangata and Andal (2011) who stated that the health status of farmers affects their ability to
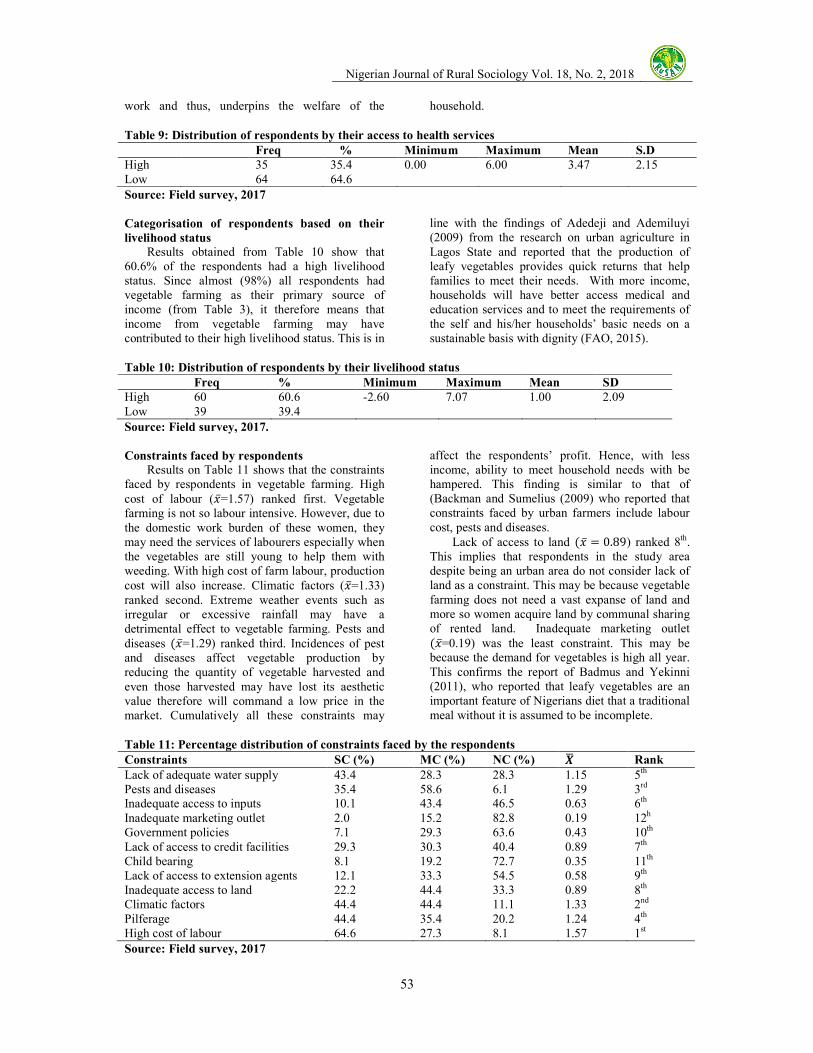
Nigerian Journal of Rural Sociology Vol. 18, No. 2, 2018
53
work and thus, underpins the welfare of the household.
Table 9: Distribution of respondents by their access to health services
Freq % Minimum Maximum Mean S.D
High 35 35.4 0.00 6.00 3.47 2.15 Low 64 64.6
Source: Field survey, 2017
Categorisation of respondents based on their
livelihood status
Results obtained from Table 10 show that 60.6% of the respondents had a high livelihood status. Since almost (98%) all respondents had vegetable farming as their primary source of income (from Table 3), it therefore means that income from vegetable farming may have contributed to their high livelihood status. This is in
line with the findings of Adedeji and Ademiluyi (2009) from the research on urban agriculture in Lagos State and reported that the production of leafy vegetables provides quick returns that help families to meet their needs. With more income, households will have better access medical and education services and to meet the requirements of the self and his/her households’ basic needs on a sustainable basis with dignity (FAO, 2015).
Table 10: Distribution of respondents by their livelihood status
Freq % Minimum Maximum Mean SD
High 60 60.6 -2.60 7.07 1.00 2.09 Low 39 39.4
Source: Field survey, 2017.
Constraints faced by respondents
Results on Table 11 shows that the constraints faced by respondents in vegetable farming. High cost of labour (�̅=1.57) ranked first. Vegetable farming is not so labour intensive. However, due to the domestic work burden of these women, they may need the services of labourers especially when the vegetables are still young to help them with weeding. With high cost of farm labour, production cost will also increase. Climatic factors (�̅=1.33) ranked second. Extreme weather events such as irregular or excessive rainfall may have a detrimental effect to vegetable farming. Pests and diseases (�̅=1.29) ranked third. Incidences of pest and diseases affect vegetable production by reducing the quantity of vegetable harvested and even those harvested may have lost its aesthetic value therefore will command a low price in the market. Cumulatively all these constraints may
affect the respondents’ profit. Hence, with less income, ability to meet household needs with be hampered. This finding is similar to that of (Backman and Sumelius (2009) who reported that constraints faced by urban farmers include labour cost, pests and diseases. Lack of access to land (�̅ = 0.89) ranked 8th. This implies that respondents in the study area despite being an urban area do not consider lack of land as a constraint. This may be because vegetable farming does not need a vast expanse of land and more so women acquire land by communal sharing of rented land. Inadequate marketing outlet (�̅=0.19) was the least constraint. This may be because the demand for vegetables is high all year. This confirms the report of Badmus and Yekinni (2011), who reported that leafy vegetables are an important feature of Nigerians diet that a traditional meal without it is assumed to be incomplete.
Table 11: Percentage distribution of constraints faced by the respondents
Constraints SC (%) MC (%) NC (%) � Rank
Lack of adequate water supply 43.4 28.3 28.3 1.15 5th Pests and diseases 35.4 58.6 6.1 1.29 3rd Inadequate access to inputs 10.1 43.4 46.5 0.63 6th Inadequate marketing outlet 2.0 15.2 82.8 0.19 12h Government policies 7.1 29.3 63.6 0.43 10th Lack of access to credit facilities 29.3 30.3 40.4 0.89 7th Child bearing 8.1 19.2 72.7 0.35 11th Lack of access to extension agents 12.1 33.3 54.5 0.58 9th Inadequate access to land 22.2 44.4 33.3 0.89 8th Climatic factors 44.4 44.4 11.1 1.33 2nd Pilferage 44.4 35.4 20.2 1.24 4th High cost of labour 64.6 27.3 8.1 1.57 1st
Source: Field survey, 2017

Nigerian Journal of Rural Sociology Vol. 18, No. 2, 2018
54
SC= Serious constraint, MC= Mild constraint, NC= Not a constraint,
Relationship between the selected socio-
economic characteristics of the respondents and
their livelihood status The Chi-square result in Table 12 shows that there was a significant relationship between working status and livelihood status of the
respondents (χ2= 3.86, p= 0.05). This means that
full time farmers had a better livelihood status than their counterparts who are part-time farmers. The study therefore established that vegetable farming on a full-time basis can significantly improve an individual’s livelihood status.
Table 12: Table showing the Chi-square analysis of the relationship between the working status of
respondents and their livelihood status
Variable χ2 df p-value CC Decision
Working status of respondents 3.86* 2 0.05 0.19 S
Source: Field survey, 2017 χ2
= chi-square, DF=degree of freedom, P=significance value, CC=contingency coefficient, D=decision The Pearson Product Moment Correlation results in Table 13 shows that a significant and positive relationship exists between the farming experience (r =0.19, p=0.05) of the respondents and the livelihood status. This implies that their farming experience contributed to their livelihood status, respondents with a higher farming experience had a better livelihood status than their counterparts with low farming experience. Educational status (r=0.23, p=0.21) of respondents was positively related to the livelihood status and this positive relationship was significant. This implies that their educational status contributed to their livelihood status, respondents with a higher educational qualification had a better livelihood status than those with lower educational qualification. This can be attributed to the fact that an educated mind is an informed mind. This agrees with the findings of (Asadu, Egbujor, Char and Ifedika, 2013) and Danso (2004) who reported that
a higher number of urban farmers are educated and this contributes to their income as they are willing to adopt practices that will increase their productivity. Constraints faced by the respondents (r=-0.37, p=0.000) has a significant negative relationship with their livelihood status. This shows that in vegetable farming, constraints faced by respondents had a significant impact on their livelihood status. The negative relationship depicts that the lesser the constraints faced, the higher their livelihood status and vice-versa. This means that respondents that faced lesser constraints had a better livelihood status than their counterparts with more constraints. The results on Table 11 shows that high cost of labour, climatic factors and pests and diseases are the three most serious constraints faced by the respondents and that these constraints have an impact on the livelihood status of the respondents
Table 13: Table showing the PPMC analysis of the relationship between selected socioeconomic
characteristics and constraints of respondents and their livelihood status
Variable r-value p-value Decision
Educational status 0.23* 0.02 S Farming experience 0.19* 0.05 S Constraints -0.371** 0.00 S Source: Field survey, 2017 Linear regression results
The result in Table 14 shows the contribution of the independent variables to the livelihood status of the respondents. The model reveals that three variables regressed on the livelihood status of the women gave a coefficient of variable determination (R2) of 0.251 showing that the variation in their livelihood status is explained to about 25per cent as a result of the variation in the identified variables. Thus three variables can explain 25per cent of the variation in the dependent variable. This implies that they determine 25per cent of the variation that can be observed in their livelihood status of the respondents.
The farming experience of the respondents (β=0.45, p=0.006) was the highest predictor of the livelihood status of the respondents. This indicates that the respondents with more farming experience have a higher livelihood status. This is because with increased farming experience the farmers become more knowledgeable on the production thereby adopting techniques which will increase productivity and production and in turn increase their income which simultaneously leads to better livelihood status. The age of the respondents (β=-0.41, p= -2.687) was also significant. This means the older farmers, are 40.8% less likely to have a higher livelihood status than their counterparts who

Nigerian Journal of Rural Sociology Vol. 18, No. 2, 2018
55
are younger. This is because farming by the respondents is largely manual and required some amount of physical energy which an old person may not withstand. The constraints (β= -0.34, p=0.001) faced by respondents in vegetable farming was significant. This suggests that a unit
increase in the constraint resulted in 34.15% decrease in their livelihood status. Exploiting these variables positively can improve the livelihood status of women urban vegetable farmers in Lagos state.
Table 14: Table showing determinants of livelihood status of the respondents
Model Β T Sig
Constants 3.43 0.001 Age of respondents -0.41 -2.69 0.009 Farming experience of the respondents 0.45 2.79 0.006 Household size of the 0.05 0.40 0.690 Farm size of the 0.07 0.41 0.682 Average monthly income of the respondents -0.13 -0.82 0.416 Marital status of the respondents -0.09 -0.83 0.411 Religion of the respondents -0.02 -0.16 0.876 Vegetable association -0.12 -1.24 0.217 Full time 0.03 0.30 0.762 Rented land 0.16 -1.48 0.143 Constraints -0.34 -3.38 0.001
Source: Field survey, 2017
R= 0.501, R2=0.251, adjusted R
2=0.156, β=beta value, t=t-statistic
CONCLUSION AND RECOMMENDATIONS
The respondents in the study area were food secured, had high access to educational services, low access to health services, however, their livelihood status was high. They were majorly constrained by high cost of labour, climatic factors and pest and diseases. Respondents’ educational status and working status positively influenced their livelihood status, while constraints had a negative influence on it. Major contributors of respondents’ livelihood status were age, farming experience and constraints to vegetable farming. Extension agents should furnish respondents with information on climate adaptation and climate smart strategies and effective measures of pest control. Urban vegetable farming should be encouraged especially for young women as this will assist in improving their livelihood status. Extension agents should also engage women in adult education, as education helped the women to manage information on how to better their lives.
REFERENCES Adebisi-Adelani, O., Olajide-Taiwo, F.B., Adeoye,
I. and Olajide-Taiwo, L.O. (2011). Analysis of constraints facing farmers in Oyo State. World Journal of Agricultural
Sciences, 7 (2): 189-192 Adedeji, O. H. and Ademiluyi, I. A. (2009). Urban
agriculture and urban land use planning: Need for a synthesis in metropolitan Lagos, Nigeria. Journal of Geography and
Regional Planning,2(3):43-50 Adepoju, A. O. and Obayelu, O. A. (2013).
Livelihood diversification and welfare of
rural households in Ondo State, Nigeria. Journal of Development and Agricultural
Economics, 5(12), 482-489. Aina, O. S., Oladapo, A., Adebosin, W. G. and
Ajilola, S. (2012). Urban livelihood: Urban agriculture implication in food security. A Journal of Applied
Phytotechnology in Environmental
Sanitation,1, 156-161, May 2012. Anosike, V. and Fasona, M. (2004). Gender
dimension of urban commercial farming in Lagos, Nigeria. Urban agriculture magazine, 12, pp. 27-28
Asadu, A. N., Egbujor, C. I., Chah, J. M. and Ifedika, P. I. (2013). Gender roles in crop production in Imo State, Nigeria. Journal
of Agricultural Extension, 17(2), 1-5 Asenso-Okyere, K., Chiang, C., Thangata., P., and
Andam, K. S. (2011). Interactions between health and farm labour productivity. International Food Policy
Research Institute, Washington D.C. Axumite, G. (1994). Urban farming, cooperatives,
and the urban poor in Addis Ababa. In: Lee-Smith, D. Maxwell, D.G. Memon, P.A. Mougeot, L. J. A. Sawio, C. J. Canada: International Development Research Centre.
Backman, S. and Sumelius, J. (2009). Identifying the driving forces behind price fluctuations and potential food crisis. Discussion Papers No.35, Department of economics and management. University of Helsinki.
Nigerian Journal of Rural Sociology Vol. 18, No. 2, 2018
56
Badmus, M. A. and Yekinni, O. T. (2011). Economic Analysis of Exotic Vegetable Production among urban Fadama women farmers in Akinyele Local Government Area Oyo State, Nigeria. Proceedings of
International Conference of Agriculture. Baker, J. L. (2012). Impacts of financial food and
fuel crisis on the urban poor. Direction in urban development issues, note series, Washington, D.C. World Bank. Pp 17-18.
Danso, G., Cofie, O., Annang, E., Obuopie, E. and Keraita (2004). Gender and urban agriculture. The case of Accra, Ghana. Paper presented at the RUAF/WMI/Urban/Harvest. Women feeding cities, workshop on gender mainstreaming in urban food production and food security, pp, 33-34
Deitchler, M., Ballard T., Swindale, A. and Coates, J. (2011). Introducing a simple measure of household hunger for cross-cultural Use.Washington, D.C.: Food and Nutri-tion Technical Assistance II Project, AED, 2011.
Edeoghon, C. O. and Anozie, O. (2015). Effect of vegetable profitability on living standards of urban farmers in Lagos state.Nigerian
Journal of Rural Sociology. 15(2), March 2015
Food and Agriculture Organisation (2015). Growing Greener Cities in Africa. FAO. Retrieved by 2015, February 14 from www.fao.org/ag/agp/greenercities/
Food and Agriculture Organisation. (2014). Urban Agriculture. Retrieved by July, 7, 2014, from (www.fao.org/urban-agriculture/en/)
Food and Agricultural Organisation (FAO) (2008). Food Information for Action Practical Guide. Published by EC, FAO Food security programme.
Gebrekidan, A. (2015). Assessing the contribution of urban agriculture to improved livelihood and environmental protection: The case of vegetables producers, Bole sub city, Addis Ababa. (Master’s thesis), University of Addis Ababa, Ethiopia.
Hull, A., and Midgley, J. (2004). Social policy for development. London
Lagos State Government. (2006). The Authentic Census: Lagos State Social Security Exercise and Population Figure.
Marielle, D., Gordon, P. and de Zeeuw, H. (2013). Urban agriculture. World Bank’s Urban Development and Resilience Unit of the Sustainable Development Network, the Urban Development. World Bank.
Mtsor, Y. G. and Idisi, P. D. (2014). Gender inequality and women participation in agricultural development in Nigeria. Journal of Education and Review, 2(11) pp. 296-301
National Population Commission, (NPC). (2007). Advertorial- National Population Commission: Lagos State claim on the provisional result of the 2006 census is unfounded. NPC, Feb 8th 2007.
National Population Commission, (NPC). (2018). Lagos State population data
National Bureau of Statistics, (NBS). (2018). Nigeria data and statistics
Nugent, R. (2000). The impact of urban agriculture on the household and local economies. South Africa.
Odoemenem, I. U. (2007). Capital resource mobilization and allocation of efficiency by small scale cereal crop farmers of Benue State, Nigeria. (PhD Dissertation). Department of Agricultural Economics and Extension Ebonyi State University, Abakaliki, Nigeria
Odok, G. N. and Agbachom, E. E. (2012). An economic analysis of commercial vegetable enterprises in Calabar, Nigeria. African journal of social sciences. 2(20) 12-22
Oduwaye, L. (2005). Residential land values and their determinants in high density neighbourhoods of Metropolitan Lagos. Res. Rev. 21(2): 37-53.
Resource centers on urban Agriculture and food security. (2014). Urban Agriculture why and what. FAO Retroxy.
Salau, E. S. and Attah, A. J. (2012). A socioeconomic analysis of urban agriculture in Nassarawa state, Nigeria. Production agriculture and technology
Journal. PAT June, 2012; 8(1),17-19 Tewodros, F. (2007). Livelihood dependence on
urban agriculture in Addis Ababa, Ethiopia: Norwegian University of Life Sciences
United Nations, (2007). State of the world cities report. London: Earth Scan

Nigerian Journal of Rural Sociology Vol. 18, No. 2, 2018
57
IMPACT OF COMMUNITY BASED AGRICULTURE AND RURAL DEVELOPMENT PROJECT ON
PARTICIPANTS OUTPUT IN KADUNA STATE
Atiku, J. A. National Animal Production Research Institute, Ahmadu Bello University, Zaria, Nigeria
Correspondence e-mail address: [email protected] ABSTRACT
This study was designed to assess the Impact of Community Based Agriculture and Rural Development Project (CBARDP) on the participants Output in Zaria and Igabi Local Government Areas of Kaduna State, Nigeria. The objectives of the study were to: describe the socio-economic characteristics of the respondents; determine the impact of the project on the participants’ output; and; identify the constraints encountered by the project participants. A multi-stage sampling technique was employed to select a sample size of 185 respondents from a sample frame of 1852. Structured questionnaire was used to elicit primary data. Descriptive statistics, t-test and chow test were utilized for data analyses. Findings revealed that; majority (70.0%) of the participating farmers were females and 27.0% of the participating farmers attended postsecondary school, 85.0% of the non-participating farmers were also females with average age of 41 years and 91.0% married, having a household size between 6-10 persons and 32% of the non-participating farmers having an educational attainment of primary. The various constraints encountered by the project participants were inadequate extension contact, lack of involvement of farmers in planning and inadequate co-operation among the participants. The Chow test analysis revealed that CBARDP had a positive impact (p<0.05) on participants output (2.17). It was therefore, concluded that CBARDP had positive impact on the participants output in Kaduna State. It was recommended that the project should be scaled out to other non-benefitting Local Government Areas of the State. Project implementers should adopt the use of community driven development projects (CDD). Keywords: Community-Based Project, Rural Development and Participants’ Output
INTRODUCTION
Agriculture constitutes one of the most important sectors of Nigeria’s economy, in terms of generating employment and contribution to Gross Domestic Product (GDP) and export revenue earnings. It contributes 22% to GDP, equivalent to $112.12 billion (N18.513 billion Naira at N165 per dollar) (Christie, 2014).For more than two decades, the agricultural sector of the Nigerian economy has continued to perform below expectation despite the huge sum of money being allocated to the sector in each year’s budget (Onyeahialam, 2002). In 2002, about N9.874 billion was mapped out for the sector (Obasanjo, 2002). Previously, government embarked on various reform programmes with a view to increase food production. These programmes include among others: Farm Settlement Scheme established in 1960, National Accelerated Food Production Programme 1972, Agricultural Development Projects 1972, Nigerian Agricultural and Co-operative Bank 1973, Operation Feed the Nation 1976, River Basin Development Authority 1976, Directorate of Food, Roads and Rural Infrastructures 1986, National Directorate of Employment 1987, National Agricultural Land Development Authority 1988 and Food Security and Poverty Alleviation Programme 1999. All these programmes have significant merit, but the facts remain that none singly or collectively have addressed the felt needs of the farmers to any significant and sustainable extent (Ladele, 1990; Idachaba, 2000 and Ijere, 1992). Recently, the Federal Government of Nigeria prepared and adopted a new National Rural Development Strategy in 2001, Project Implementation Manual
(2006). The strategy aimed at improving livelihood and food security through a process of Community Based Agriculture and Rural Development Project (CBARDP). The strategy called for a community driven development approach that ensures the active participation of beneficiaries and Local Government at all levels of decision making. The project counterpart funds were from the African Development Bank (AFDB) contributing 81%, the Federal Government of Nigeria 3%, five participating states: Kaduna inclusive, contributing 6% respectively to their own state projects. The nine selected LGAs from each State; contributing 9% each while the project sites (participants) 1%. The broad objective of this study was to assess the impact of Community Based Agriculture and Rural Development Project (CBARDP) on the participants’ output in Kaduna State. While, the specific objectives were to: i. i describe the socio-economic characteristics of
the participating farmers and the non-participating farmers:
ii. ii determine the impact of CBARDP on the output of participating farmers.
iii. iii identify the constraints of the participating farmers in the project
METHODOLOGY
A multistage sampling procedure was employed to get the respondents. In the first stage, two Local Government Areas were selected purposively, based on proximity and financial constrants out of the nine CBARDP benefiting LGAs in Kaduna State. These were Zaria in Northern senatorial zone and Igabi in central senatorial zone. At the second stage three villages

Nigerian Journal of Rural Sociology Vol. 18, No. 2, 2018
58
were selected from each Local Government Area, because they were the participating villages making a total of six villages. These are Igabi, Gwaraji and Gwada in Igabi LGA, Kofar-Galadima, Kugu-Dutsen Abba and Aba Wuciciri from Zaria LGA. Thirdly, out of the one thousand eight hundred and fifty two (1852) sample frame of respondents , 10% was randomly selected, which formed the sample size of 185 for this study. Primary data were collected through the administration of a structured questionnaire by enumerators through verbal interview with the respondents. Specific information collected included: socio-economic characteristics of the respondents and the output of the respondents. Descriptive statistics, inferential
Statistics (t-test) and chow test were utilized for the analysis.
RESULTS AND DISCUSSION
Socioeconomic characteristics Results in Table 1 reveals that 70% of the participants in the project were females and 85% of the non-participants were also females. In addition, the results in Table 1 indicate that 42% of the participants were between the ages of 41-50 years; while 34% of the non-participants were within the range of between 21-30 years old. This implies that farmers between the ages of 41-50 participated more in the project.
Table 1: Socio-economic characteristics of the respondents
Variables
Participants
Frequency
Percentages
Non-participants
Frequency
Percentage
Sex
Male Female Total
Marital status
married single Divorced Total
Age 20-30 31-40 41-50 51-60 61-70 71-80 Total
Min Max Mean
30 69 99 96 3 99 9 19 42 21 6 2 99 25 80 47
30.0 70.0 100 97 3 100 9.1 19.2 42.4 21.2 6.1 2.0 100
13 73 86 74 11 1 86 40 26 12 8 - - 86 14 60 33
15 85 100 86 13 1 100 46.5 30.2 14.0 9.3 - - 100
Impact of CBARDP project on maize output of
farmers The average maize output (4,293.94kg) for participants was higher than the mean output for non-participants (3,304.65kg). The minimum maize output obtained for the participants and non-
participants was 1tonne, while the maximum output were 400 and 300 bags respectively depending on the farm size. The standard deviation of the maize output for participants (56.2) was higher than that of non-participants (53.0).
Table 2: Frequency distribution of maize output of participants and non-participants in CBARD project
Participants Non-participants
Kg Frequency Percentage Frequency Percentage
100-2000 50 58.1 46 46.5 2100-4000 19 22.1 24 24.2 4100-6000 3 3.5 8 8.1 6100-8000 4 4.7 5 5.1 8100-10000 10 11.7 16 16.2 Total 86 100 99 100
Mean 42.9 33.0
Minimum 1 1
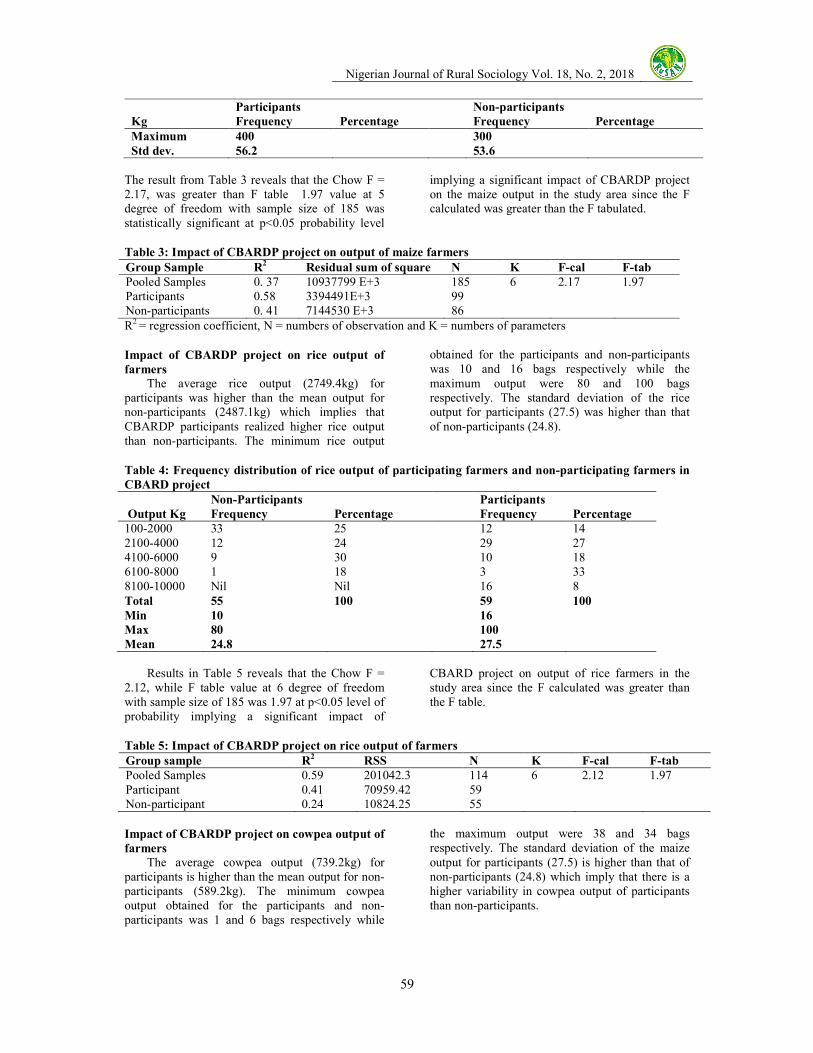
Nigerian Journal of Rural Sociology Vol. 18, No. 2, 2018
59
Participants Non-participants
Kg Frequency Percentage Frequency Percentage
Maximum 400 300
Std dev. 56.2 53.6
The result from Table 3 reveals that the Chow F = 2.17, was greater than F table 1.97 value at 5 degree of freedom with sample size of 185 was statistically significant at p<0.05 probability level
implying a significant impact of CBARDP project on the maize output in the study area since the F calculated was greater than the F tabulated.
Table 3: Impact of CBARDP project on output of maize farmers
Group Sample R2
Residual sum of square N K F-cal F-tab
Pooled Samples 0. 37 10937799 E+3 185 6 2.17 1.97 Participants 0.58 3394491E+3 99 Non-participants 0. 41 7144530 E+3 86 R2 = regression coefficient, N = numbers of observation and K = numbers of parameters
Impact of CBARDP project on rice output of
farmers
The average rice output (2749.4kg) for participants was higher than the mean output for non-participants (2487.1kg) which implies that CBARDP participants realized higher rice output than non-participants. The minimum rice output
obtained for the participants and non-participants was 10 and 16 bags respectively while the maximum output were 80 and 100 bags respectively. The standard deviation of the rice output for participants (27.5) was higher than that of non-participants (24.8).
Table 4: Frequency distribution of rice output of participating farmers and non-participating farmers in
CBARD project
Non-Participants Participants
Output Kg Frequency Percentage Frequency Percentage
100-2000 33 25 12 14 2100-4000 12 24 29 27 4100-6000 9 30 10 18 6100-8000 1 18 3 33 8100-10000 Nil Nil 16 8 Total 55 100 59 100
Min 10 16
Max 80 100
Mean 24.8 27.5
Results in Table 5 reveals that the Chow F = 2.12, while F table value at 6 degree of freedom with sample size of 185 was 1.97 at p<0.05 level of probability implying a significant impact of
CBARD project on output of rice farmers in the study area since the F calculated was greater than the F table.
Table 5: Impact of CBARDP project on rice output of farmers
Group sample R2 RSS N K F-cal F-tab
Pooled Samples 0.59 201042.3 114 6 2.12 1.97 Participant 0.41 70959.42 59 Non-participant 0.24 10824.25 55
Impact of CBARDP project on cowpea output of
farmers
The average cowpea output (739.2kg) for participants is higher than the mean output for non-participants (589.2kg). The minimum cowpea output obtained for the participants and non-participants was 1 and 6 bags respectively while
the maximum output were 38 and 34 bags respectively. The standard deviation of the maize output for participants (27.5) is higher than that of non-participants (24.8) which imply that there is a higher variability in cowpea output of participants than non-participants.

Nigerian Journal of Rural Sociology Vol. 18, No. 2, 2018
60
Table 6: Frequency distribution of cowpea output of participants and non-participants in CBARD project
Non-Participants Participants
Output Kg Frequency Percentage Frequency Percentage
100-1000 12 50.0 8 26.6 1100-2000 8 33.3 18 60.0 2100-3000 4 16.7 2 6.7 3100-4000 Nil Nil 2 6.7 Total 24 100 30 100
Min 1 6
Max 30 38
Mean 5.89 7.39
The impact of CBARDP project on the cowpea output of the participants and non-participants in the study area was achieved using chow test statistics. The Chow Test is a test that determines if the coefficients from two regression analyses are the same. However, three different linear regressions were carried out comprising of the pooled samples of participants and non-participants, and separate linear regression for participants and non-participants respectively. The residual sum of square of each of the three regressions was used to compute the chow test. The decision rule was that if Chow F-statistics is greater
than that of F-table, there is impact of CBARDP on cowpea production and structural differences between the participants and non-participants in terms of cowpea output, if otherwise there is no impact of CBARDP project in the study area. The results in table 7 revealed that the Chow F =4.83, while F table value at 6 degree of freedom with sample size of 185 was 1.97 at p<0.05 level of probability implying a significant impact of CBARD project on output of cowpea farmers in the study area since the F calculated was greater than the F table.
Table 7: Impact of CBARDP project on cowpea output of farmers
Group sample R2 RSS N K F-cal F-tab
Pooled samples 0.57 4248109E+07 54 6 4.83 1.97 Participant 0.51 3426267 E+07 30 Non-participant 0.34 7294023 E+06 24
Constraints faced by the Respondents in
CBARDP
The results in Table 8 revealed that 56% of the participants interviewed complained about inadequate production inputs as the major constraint in the study area. Another constraint (2nd in ranking) was inadequate provision of infrastructure which constituted 13%. Inadequate extension contact had 11% (ranked 3rd), lack of credit facilities was (ranked 4th) with 10% of the participants. The results further indicates that lack of farmers involvement in planning at the initial stage of the project which was (ranked 5th) with 7%. The
participants interviewed complained of short term period of the project which was (ranked 6th) and had 2% while lack of co-operation among the participants, of the project in the study area was 1% and (ranked 7th). Production inputs serve as the most important materials needed in the process of agricultural production, because it used to determine the quantity of output obtained by the farmers, so any short fall in the supply of inputs may lead to poor harvest by the farmers. Lack of good road network, poor extension contact lack of funds, poor co-operation between farmers and finally lack of farmer’s involvement in planning impedes the development of agriculture general.
Table 4.15 constraints faced by Respondents
Constraint Frequency Percentage Ranking
Inadequate production inputs Inadequate infrastructure Inadequate extension contact Lack of credit facilities Lack of involvement of farmers in planning Life span of the project was short Lack of good co-operation among the participants
66 15 13 12 8 2 1
56 13 11 10 7 2 1
1st
2nd
3rd
4th 5th 6th 7th
Total 117 100 Note: * = Multiple responses

Nigerian Journal of Rural Sociology Vol. 18, No. 2, 2018
61
CONCLUSION AND RECOMMENDATIONS
It was concluded that due to the project intervention the farmers’ output was increased to a significant level. Meaning that, CBARDP had improved the output of the participants in the study area. Based on the findings of the study, it was recommended that: i. The project be scaled out to other non-
CBARDP benefitting local government areas of the state in order to record an increase on output.
ii. The project planners and implementers should intensify sensitization among rural dwellers and adopt the use of community driven development projects as such will help in addressing farmer’s priority needs.
ii. Extension workers should sensitize farmers on the importance of improved seeds in crop production.
iii. The ratio of extension workers to farmers should be balance so as have wider coverage of famers
REFERENCES
Adekunle, A. A., Terry, A. A., Ademola, A. A. (2005). Bridging the communication Gap between scientists and farmers in katsina state of Nigeria: A review of the activities of the Information and communication support for Agricultural Growth in Nigeria (ICS-Nigeria) project in Katsina state. Printed by International Institute for Tropical Agriculture (IITA), Ibadan, Nigeria, Pp5-14.
Christie, V. (2014). “A closer look at Nigeria’s GDP Rebasing”. NKC Independent
Economist, www.cnheafrica.com, 23-12-2014.
Idachaba F. S. (2000). Desirable and Workable Agricultural Policies For Nigeria. Ibadan University Press, Ibadan, Nigeria, Pp 14-16.
Ijere, M. O. (1992). Choice of Strategies for Rural
Development: ACENA Publishers, Enugu, Nigeria, Pp19- 25.
Kaduna State Agricultural Development Project (2007). Highlight on the Activities and Achievements of Kaduna Agricultural Development Project.
Ladele, A. A. (1990). Socio-Economic Analysis of the Impact of Agricultural Co-Operative Organisations on Farmers in Kwara and Oyo States. Unpublished Ph.D Thesis, University of Ibadan.
National Population Commission (2006). National and Housing Survey,National Population Commission, Abuja Nigeria.
Obasanjo O. (2002). Why we should not neglect agriculture, Newswatch Magazine, June, Pp. 4-6.
Olaleye, R. S., Ibrahim, M. and Ojo, M. A. (2009). Probit Analysis of Women’s Access to Agricultural Inputs in Bosso Local Government Area, Niger State, Nigeria Journal of Agricultural Extension 13 (2): 1-9.
Onyeahialam, V. (2002). “Administration of agricultural development programme towards socioeconomic development of Nigeria. Journal of policy and
development studies, 1 (2), 15-23. Project Implementation Manual (2006),
Community Based Agriculture and Rural Development (CBARDP), Pp 17-19
Nigerian Journal of Rural Sociology Vol. 18, No. 2, 2018
62
PARTICIPATION OF RURAL DWELLERS IN COMMUNITY-BASED NATURAL RESOURCES
MANAGEMENT PROGRAMME IN ONDO STATE, NIGERIA 1Adeloye, K. A., 2Aladekomo, F., 3Adepoju, A. G. and 4Filusi, O. J. 1Department of Agriculture, Wesley University, Ondo, Ondo state
2Department of Agricultural Sciences, Adeyemi College of Education, Ondo, Ondo state 3Department of Agricultural Economics, University of Ibadan, Ibadan, Nigeria
4Department of Agricultural Extension and Rural Development, Obafemi Awolowo University, Ile-Ife, Osun state
Correspondence e-mail address: [email protected]
ABSTRACT The study investigated participation of rural dwellers in Community-Based Natural Resources Management Programme (CBNRMP) in Ondo State, Nigeria. Data were gathered through structured interview schedule from 120 rural dwellers participating in CBNRMP. Data collected were analyzed using descriptive statistical tools such as frequency counts, percentage, mean and standard deviation while Pearson Product Moment Correlation (PPMC) was used to test the hypothesis set. Results of the study showed that the mean age of rural dwellers participating in CBNRMP in the study area was 56.2± 16.8 years. Many (56.7%) of them were married and spent an average of 12.3± 9.5 years in formal school. The majority (83.3%) of the respondents took farming as main occupation, also many of the respondents got information about CBNRMP through extension workers (66.7%) and television/radio (60.0%). Majority (71.7%) of the respondents had favourable perception of CBNRMP. There were positive and significant association between respondents’ participation in CBNRMP and their age (r= 0.512; ρ≤ 0.01); years of formal education (r= 0.483; ρ≤ 0.01); perception of CBNRMP (r= 0.542; ρ≤ 0.01) occupation (χ2= 33.483; ρ≤ 0.01); marital status (χ2= 32.851; ρ≤ 0.05); source of information about CBNRMP (χ2= 31.612; ρ≤ 0.01). Rural dwellers’ participation in CBNRMP was high in the study area. It was recommended that conducive atmosphere that enhances meaningful participation of beneficiaries should be encouraged the more and challenges militating against participation of rural dwellers in CBNRMP should be adequately addressed by the stakeholders of the programme. Keywords: Participation, Rural dwellers, Natural resources, Perception
INTRODUCTION
Participation is a rich concept that varies with its application and definition. The way participation is defined also depends on the context in which it occurs. For some, it is a matter of principle; for others, practice; for still others, an end in itself. Participation can be taken as the mean as well as the end by itself. The distinctions between these are neither clear-cut nor mutually exclusive, but they do represent two different purposes and approaches to promote participatory development. Participation as a meanssimply see participation as the process whereby local people cooperate or collaborate with the externally introduced development collaborates in accomplishing development project(Nelson and Wright, 1995). In this way, participation becomes the means through which the initiatives implemented more effectively. The government or donors are the one who initiate development processes and use community resource to provide service to the people (Mulwa, 2008). Participation as an end is regarding participation as a goal in itself. This goal expressed as the empowering of people in terms of their skills acquisition, knowledge and experience to take greater responsibility for their development. The concept of participation as an end aimed at ensuring that people are responsible in solving their own social-economic problems (Gaventa and Barrett, 2012;Department for International Development DFID, 2010). There is still hot debate
among practitioners and in the literature about whether participation is a means or an end or both; in this study, participation is taken as both. Community-Based Natural Resources
Management Programme (CBNRMP) in Ondo
State: Explorative review
Community-Based Natural Resource Management Programme (CBNRMP) was promoted by International Fund for Agricultural Development (IFAD) and Federal Government, but funded by the IFAD, Federal Government, Niger Delta Development Commission (NDDC), participating States and Local Government Areas for a period of eight (8) years. The goal of CBNRMP was to improve the livelihoods and living conditions of at least 400,000 rural families (households) in the nine Niger Delta States. The programme started in the year 2005 in Ondo State and was scheduled for completion on 2013 but had a two-year extension at the request of the Federal Government of Nigeria, which brought the completion date to 2015 (IFAD, 2006, CBNRMP, 2014). Projects are carried out based on the need of the people in the communities using bottom-top approach; the communities identify their pressing needs that the programme intends to proffer solution. There are Community Base Animator Teams (CBAT) which consist of six (6) people 3 male (one youth) and 3 female (one youth).The programme (for training/capacity building) has

Nigerian Journal of Rural Sociology Vol. 18, No. 2, 2018
63
been using the concept of Training-of-Trainers (ToT) through a step down process in which primary beneficiaries pass on what they know after they have been “trained” to others in their community or commodity group. The enterprises/ projects supported by CBNRMP operate within the crop, livestock, fisheries, processing and vocational trade sectors (on-farm, off-farm and non-farm) (CBNRMP, 2014). Selections of Local Government Areas (LGAs) to benefits in Ondo State were based on the poorest ones and the communities that participated were the extreme poor communities in terms of basic social and economic facilities. Nine (9) out of eighteen (18) LGAs in Ondo State were involved, which covered 27 communities. The importance of rural areas cannot be over emphasized in the developing nation’s economy because rural areas predominantly provide food for teeming population and raw materials for agricultural based industries. Also rural area serves as a place of refuge during crisis and most urban dwellers go there to relax. In general, the rural areas engage in primary activities that form the foundation of any developing nation’s economy. Unfortunately, in some developing nations like Nigeria, the rural area has suffered long time neglect in such a way that has created wide gap between the rural and urban areas most especially in the area of social and economic opportunities, physical development and available infrastructural facilities. The situation of rural areas above calls for its development that involves the transformation of the rural areas into a socially, economically, politically, educationally and materially desirable condition, with a purpose of improving the quality of life of the rural population (Jibowo, 2000; Ekong, 2010). Recently, CBNRMP that makes participating rural dwellers assume central role in project identification and implementation was put in place between the year 2005 and 2013 in selected LGAs of Ondo State. Adisa (2013) recorded increase in level of improvement in socio economic status of CNBRMP’s beneficiaries. There is need to examine participation of beneficiaries that warranted this increase in level of socioeconomic improvement in the study area. The main objective of this study was to investigate the participation of rural dwellers in Community-Based Natural Resources Management Programme (CBNRMP) in Ondo State, while the specific objectives were to; i. describe the socioeconomic characteristic of
CBNRMP’s participating rural dwellers in the study area;
ii. investigate rural dwellers’ perception of CBNRMP;
iii. examine the level of participation of rural dwellers in CBNRMP; and
iv. analyse the challenges militating against participation of rural dwellers in CBNRMP in the study area.
The research hypotheses are as stated; i. There is no significant relationship between
rural dwellers’ participation in CBNRMP and their socioeconomic characteristics;
ii. There is no significant relationship between rural dwellers’ participation in CBNRMP and their perception of the programme.
METHODOLOGY The study was conducted in Ondo State, one of the NDDC members in Nigeria. Multi stage sampling technique was used to select respondents for the study. At first stage, four (4) out of nine (9) participating LGAs were randomly. The selected LGAs were Idanre, Ondo- East, Okitipupa and Ile-Oluji/Okeigbo. Fifty per cent of rural communities participating in the programme were proportionally selected from each of the selected LGAs making twelve communities. The selected communities were Oloruntedo, Kajola-ojurin, Ebijaw, Ikota, Ibutitan, Elemo, AraromiFasawe, Ayede-oja, Kajola-usama, Owena Egbeda, Abalaka and Oniyewu. Finally, one hundred and twenty rural dwellers were proportionately selected and were interviewed for the study. Duly validated and pretested structural interview schedule were used to elicit information from the respondents. Data were summarized with percentages, means and standard deviation, while Chi-square and Pearson Product Moment Correlation (PPMC) were employed to make inferences from the hypothesis. The dependent variable for this study was conceptualised as participation of rural dwellers in CBNRMP in Ondo State. It was measured by listing and scoring the natures of participation of rural women at each stage of community based development activities (Problem identification, Decision-making, Planning, Implementation and Evaluation stage) against a 4-rating scale of Very often (4), Often (3), Occasionally (2), Never (1). The respondents’ perception of CBNRMP was determined by asking the respondents to indicate their view using 10 declarative sentences on a 5-point scale of Strongly Agreed (5), Agreed (4), Undecided (3), Disagreed (2), Strongly Disagreed (1).
RESULTS AND DISCUSSION Results in Table 1 revealed that majority (60.2%) of the respondents were at their old age, while 7.5 percent were youth; the mean age of the respondents was 56.2 with standard deviation of 16.8. This implies that the respondents comprise few active people, which might be because of high rate of rural-urban migration. Furthermore, it was revealed that there was marginal (48.3:51.7) difference in number between male and female

Nigerian Journal of Rural Sociology Vol. 18, No. 2, 2018
64
among the respondents, indicating that the programme is gender sensitive. The table also showed that the mean of years spent in formal schools was 12.3 with standard deviation of 9.5; this revealed that majority could read and write which would affect their participation in CBNRMP positively, also vast majority of the respondents were Yorubas since the study area falls in Yoruba land. Vast majority (83.3%) of them were farmers by occupation while few engaged in trading and public service; in addition, many (66.7%) of the
respondents had information about the programme from extension workers. The table also revealed that many (56.7%) of the respondents was married; this implies that high percentage of married was involved in the programme. This finding was in consonance with earlier reports of Adisa and Jibowo (2006) that that reported that high percentage of married in the rural communities of Osun State are involved in the community based development projects.
Table 1: Distribution of respondents according to their socioeconomic characteristics, n=120
Variables Frequency Percentage Mean Standard deviation
Age (years)
< 30 9 7.5 30-50 36 30.0 56.2 16.8 > 50 75 62.5
Sex Male 58 48.3
Female 62 51.7 Years of formal education
>12 53 44.2
7-12 33 27.5 12.3 9.5 1-6 21 17.5 No formal education 13 10.8 *Occupation
Farming 100 83.3
Trading 52 43.3 Public service 15 12.5 *Source of information about CBNRMP Extension workers 80 66.7
Television and radio 72 60.0 Neighbours 55 45.8 Marital status
Married 68 56.7 Widowed/widower 24 20.0 Single 28 23.4 Ethnicity Yoruba 111 92.2
Igbo 3 2.6 Others 6 5.2 Source: Field survey, 2016 *Multiple choices
Perception of respondents about CBNRMP
The result in Table 3 revealed that perception means score was 72.7 with standard deviation of 1.8. This analysis shows that many (71.7%) of the respondents had favourable perception of CBNRMP. It could, without doubt therefore, be inferred that the favourable perception of the
respondents about CBNRMP should lead to full participation in its activities; this could result into development of the study area in no small measure. This result is in line with Adisa et al. (2003), which reported similar favourable perception of community-based development among rural dwellers in Osun State.
Table 3: Distribution of the respondents by perception about the programme, n=120
Perception statements SA A DA SD
Information dissemination about the project is inadequate.
0 (0.0)
4 (3.3)
49 (0.8)
67 (55.8)
The project implementation is good the way it has always been carried out.
30 (25)
86 (71.7)
4 (3.3)
0 (0.0)

Nigerian Journal of Rural Sociology Vol. 18, No. 2, 2018
65
Perception statements SA A DA SD
The project agency has carried the people in the community along properly.
54 (45)
61 (50.8)
5 (4.2)
0 (0.0)
The project needs improvement in some areas. 26 (21.7) 57 (47.5) 34 (28.3) 0 (0.0) There is proper utilisation and monitoring of the project by the rural people.
58 (48.3)
58 (48.3)
4 (3.3)
3 (2.5)
The project focus on the identify need of the people.
41 (34.2)
71 (59.2)
8 (6.7)
0 (0.0)
The project was only enforced on the people. 0 (0.0) 5 (4.2) 44 (36.7) 0 (0.0) The project has impact positively on the well being of the community.
69 (57.5)
50 (41.7)
1 (0.8)
0 (0.0)
The staff agencies are not easily accessible and capable of ensuring project success.
6 (5)
15 (12.5)
70 (58.3)
71 (59.2)
The project is a waste of resource by the government
0 (0.0)
95 (79.2) 25 (20.8) 29 (24.2)
SA = Strongly Agreed, A = Agreed, DA = Disagreed, SD = Strongly Disagreed Mean = 72.7 Standard deviation = 1.8 Source: Field survey, 2016
Participation of respondents in CBNRMP
Result in Table 3 revealed that the participation of rural dwellers in CBNRMP ranges from problem identification to evaluation/monitoring. Many (54.4%) of the respondents participated often as initiators, while few (38.1%) participated in evaluation/monitoring at the beginning of the programme. This finding is in agreement with that of Okunade et al (2005) who reported that the rural dwellers participated at
every stage of community based development activities at different levels from problem identification, decision-making, planning for action, implementation and evaluation/monitoring stage. The finding also corroborates that of Deji (2007) who reported that the participation of rural dwellers is inevitably significant to the success and sustainability of rural development projects and that the level of their participation determines the extent to which the project succeeds.
Table 3: Distribution of respondents according to participation in CBNRMP, n= 120
*Participation VO OF OC N
Problem identification F(%) F(%) F(%) F(%)
Initiator 49(40.8) 65(54.4) 17(14.4) 7(5.6) Opinion giver 22(17.6) 59(47.2) 25(20.0) 44(35.2) Information seeker 47(37.6) 63(50.4) 29(23.2) 11(8.8) Information giver 68(54.4) 39(31.2) 29(23.2) 14(11.2) Decision-making
Attending meeting 69(55.2) 69(55.2) 12(9.6) 0(0.0) Committee member 84(67.2) 66(52.8) 0(0.0) 0(0.0) Debate and discussion 34(27.2) 97(77.6) 11(8.8) 8(6.4) Conducting opinion poll 32(25.6) 64(51.2) 47(37.6) 7(5.6) Planning of action
Arranging meetings 60(48.0) 77(61.6) 13(10.4) 0(0.0) Source of input 84(67.2) 53(42.4) 13(10.4) 0(0.0) Work organisation framework 55(44.0) 95(76.0) 0(0.0) 0(0.0) Implementation Fund 97(77.6) 53(42.4) 0(0.0) 0(0.0) Equipment/materials 77(61.6) 73(58.4) 0(0.0) 0(0.0) Personal labour 48(38.4) 80(64.0) 15(12.0) 7(5.6) Hired labour 37(29.6) 68(54.4) 38(30.4) 7(5.6) Evaluation/monitoring Beginning 0(0.0) 31(24.8) 64(51.2) 55(44.0) Middle 0(0.0) 18(14.4) 47(37.6) 85(68.0) End 72(57.6) 7(5.6) 71(56.8) 0(0.0)
* Multiple responses VO=Very Often, OF=Often, OC=Occasionally, N= Never Source: Field survey, 2016
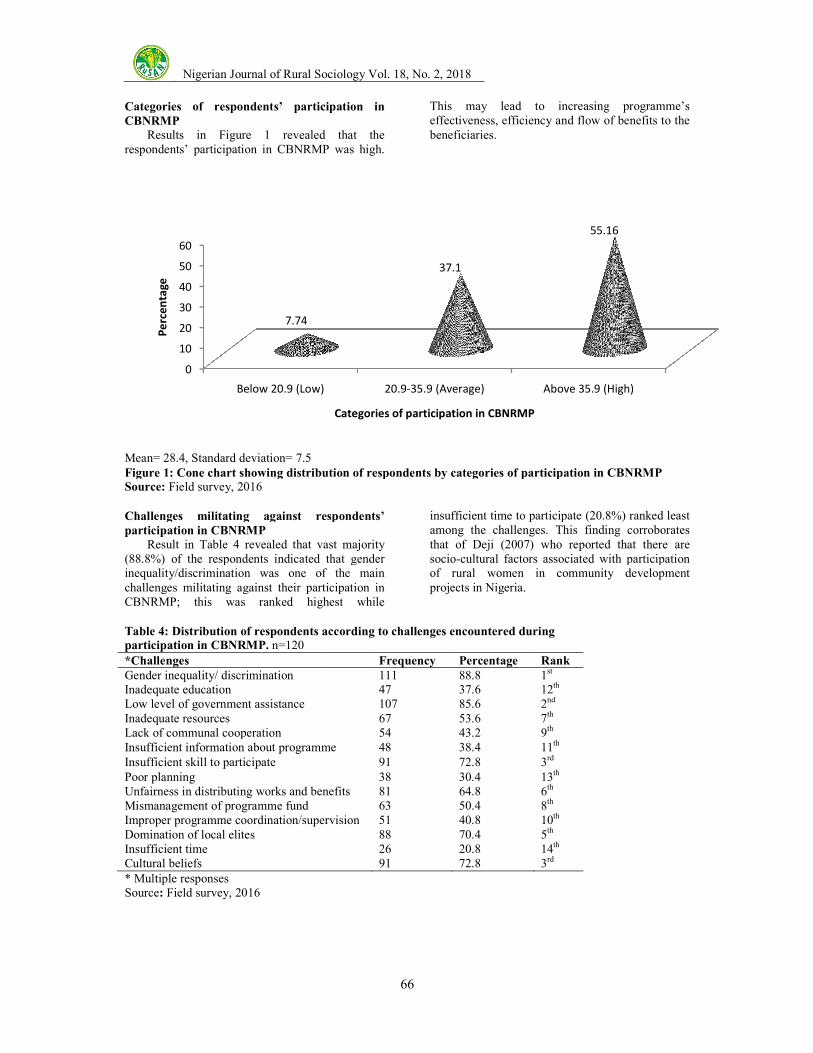
Nigerian Journal of Rural Sociology Vol. 1
Categories of respondents’ participation in
CBNRMP
Results in Figure 1 revealed that the respondents’ participation in CBNRMP was high.
Mean= 28.4, Standard deviation= 7.5 Figure 1: Cone chart showing distribution of respondents by categories of participation in CBNRMPSource: Field survey, 2016
Challenges militating against respondents’
participation in CBNRMP
Result in Table 4 revealed that vast majority (88.8%) of the respondents indicated that gender inequality/discrimination was one of the main challenges militating against their participaCBNRMP; this was ranked highest while
Table 4: Distribution of respondents according to challenges encountered duringparticipation in CBNRMP. n=120
*Challenges
Gender inequality/ discrimination Inadequate education Low level of government assistance Inadequate resources Lack of communal cooperation Insufficient information about programmeInsufficient skill to participate Poor planning Unfairness in distributing works and benefits Mismanagement of programme fund Improper programme coordination/supervisionDomination of local elites Insufficient time Cultural beliefs
* Multiple responses Source: Field survey, 2016
0
10
20
30
40
50
60
Below 20.9 (Low)
7.74
Pe
rce
nta
ge
Nigerian Journal of Rural Sociology Vol. 18, No. 2, 2018
66
Categories of respondents’ participation in
Results in Figure 1 revealed that the respondents’ participation in CBNRMP was high.
This may lead to increasing programme’s effectiveness, efficiency and flow of benefits to the beneficiaries.
Figure 1: Cone chart showing distribution of respondents by categories of participation in CBNRMP
Challenges militating against respondents’
vast majority respondents indicated that gender
inequality/discrimination was one of the main challenges militating against their participation in CBNRMP; this was ranked highest while
insufficient time to participate (20.8%) ranked least among the challenges. This finding corroborates that of Deji (2007) who reported that there are socio-cultural factors associated with participation of rural women in community development projects in Nigeria.
Table 4: Distribution of respondents according to challenges encountered during
Frequency Percentage Rank
111 88.8 1st 47 37.6 12th 107 85.6 2nd 67 53.6 7th 54 43.2 9th
Insufficient information about programme 48 38.4 11th 91 72.8 3rd 38 30.4 13th
Unfairness in distributing works and benefits 81 64.8 6th 63 50.4 8th
Improper programme coordination/supervision 51 40.8 10th 88 70.4 5th 26 20.8 14th 91 72.8 3rd
Below 20.9 (Low) 20.9-35.9 (Average) Above 35.9 (High)
37.1
55.16
Categories of participation in CBNRMP
This may lead to increasing programme’s ess, efficiency and flow of benefits to the
Figure 1: Cone chart showing distribution of respondents by categories of participation in CBNRMP
insufficient time to participate (20.8%) ranked least among the challenges. This finding corroborates that of Deji (2007) who reported that there are
cultural factors associated with participation l women in community development
Above 35.9 (High)
55.16

Nigerian Journal of Rural Sociology Vol. 18, No. 2, 2018
67
Hypothesis testing
Table 4 reveals that at 0.01 level of significance, occupation (χ2=33.483); sex (χ2=29.502); and source of information about CBNRMP (χ2=31.612) had significant association with participation in CBNRMP. Furthermore, at 0.05 level of significance, the respondents’ marital status (χ2=32.851) also had significant association with participation in CBNRMP. Whereas ethnicity (χ2 =4.370) had no significant association with
participation in CBNRMP. The contingency coefficient revealed a weak association between sex (C=0.036), marital status (C=0.037), occupation (C=0.038), source of information (C=0.037), and participation in CBNRMP, based on Kerlinger (1986), which described C value of 0.28 as moderate relationship, and greater values as higher association. Thus, ethnicity of the respondents has nothing to do with participation in CBNRMP
Table 4: Results of Chi-Square analysis of the relationship between socio economic characteristics of
respondents and participation in CBNRMP, n= 120
Variables χ2 Value df p-value C
Sex 29.502 2 0.001** 0.036 Occupation 33.483 4 0.001** 0.038 Source of information 31.612 2 0.001** 0.037 Ethnicity 4.370 5 0.635 0.017 Marital status 32.851 5 0.003* 0.037
Source: Field survey, 2016 * Significant at 0.05 level of significant DF- Degree of Freedom ** Significant at 0.01 level of significant C- Contingency coefficient Result in Table 5 revealed that at 0.01 level of significance, respondents’ age (r= 0.512), years of formal education (r= 0.483) and perception towards CBNRMP (r=0.542) had significant relationship with participation in CBNRMP. Thus, increase in
respondents’ age and years of formal education, together with favourable perception towards CBNRMP could increase participation in CBNRMP.
Table5: Correlation analysis showing relationship between socioeconomic characteristics, perception of
the respondents and participation in CBNRMP, n= 120
Variables Correlation
coefficient (r)
Coefficient of
determination (r2)
Decision
Age 0.521 0.271** Significant Years of formal education 0.483 0.233** Significant Perception towards CBNRMP 0.542 0.294** Significant Source: Field survey, 2016**Significant at the 0.01 level
CONCLUSION AND RECOMMENDATIONS Based on the findings of this study, it was concluded that the level of rural dwellers’ participation in CBNRMP was high in the study area. It was recommended that conducive atmosphere that enhances meaningful participation of beneficiaries should be encouraged and challenges militating against participation in CBNRMP should be resolved, since high participation in CBNRMP was linked to its effectiveness and efficiency.
REFERENCES
Adisa, B.O (2013): Assessing the Contribution of Community-Based Natural Resources Management Programme to Environmental Sustainability in Ondo State, Nigeria; African Journal of
Environmental Science and Technology 7 (10): 12-21
Adisa, B. O., M. A. Oladoja and O. A. Adeokun (2003): Participation of Community Based Organisations in Environment Protection Projects in Osun State, Nigeria; The
Nigerian Journal of Rural Sociology
Association 2(3): 294 Adisa, B. O. and A. A. Jibowo (2006): Effect of
Community Variables on Participation of Community Based Organisation in Development Projects in Osun State, Nigeria: The Nigeria Journal of Rural
Sociological Association 6 (1and2): 83-94 Community-Based Natural Resource Management
Programme (CBNRMP) (2014): Supervision Report
Deji, O. F. (2007): Community Socio-cultural Factors Associated with the Participation

Nigerian Journal of Rural Sociology Vol. 18, No. 2, 2018
68
of Local Women’s Associations in Rural Community Development Projects in Nigeria. Journal of Social Sciences, 2:1-6.
Department for International Development (DFID) (2010): Improving Public Services, in The Politics of Poverty: Elites, Citizens and States: Findings from Ten Years of DFID-
funded Research on Governance and
Fragile States 2001–2010, Department for International Development, London.
Ekong, E. E. (2010) An Introduction to Rural
Sociology. Dove Educational Publisher Uyo, Nigeria pp. 20-37, 132-133
Gaventa, J. and G. Barrett (2012): Mapping the Outcomes of Citizen Engagement, World
Development, 40 (12): 2399–2410. International Fund for Agricultural Development
(IFAD)/ Federal Government Community Based Natural Resources Management Programme (2006) Activity Report.
Jibowo, A. A. (2000). Essentials of Rural
Sociology. Gbem Sodipo Press Limited, Abeokuta. pp. 223-225.
Kerlinger, N. F. (1986): Foundation of Behaviour
Research, Third Edition, Worth Harcout brace College Publishers, pp.453-455.
Mulwa, F. (2008): Participatory Monitoring and
Evaluation of Community rojects, Paulines Publications Africa, Nairobi, Kenya p. 13
Nelson, N. and Wright, S. 1995): Power and
Participatory Development: Theory and
Practice, (Eds.) (Intermediate Technology Publication, London.
Okunade, E. O., Farinde, A. J. and Laogun, E. A. (2005): Participation of Women Local Leaders in Women Based Rural Development Projects in Osun state, Nigeria. Journal of Social Sciences, 10(1): 37-41
Nigerian Journal of Rural Sociology Vol. 18, No. 2, 2018
69
ATTITUDE OF RURAL HOUSEHOLDS TO COMMUNITY DEVELOPMENT PROJECTS IN OGUN
STATE, NIGERIA 1Aromolaran A. K., 1Alarima C. I., 1Abiona B. G., 2Adekola, O. A. and 1Amole, A. B.
1Federal University of Agriculture Abeokuta Nigeria 2Oyo State College of Agriculture and Technology, Igboora, Nigeria
Correspondence e-mail address: [email protected]
ABSTRACT
This study examined the attitude of rural households to Community Development Projects in Ogun state Nigeria. Multi-stage sampling procedure was used to select 120 rural household heads. Data were collected with an interview schedule and analyzed using frequency counts, percentages, mean and correlation. Results reveal that 55.8% of the respondents were male, 53.3% had secondary education and the mean age was 38 years with an average household size of 6 persons. Findings also reveal that the implemented Community Development Projects (CDPs) indicated by more than 60% of the households included borehole, installation of a transformer, security post and entrance gate. Most (64.0%) of them had an undesirable attitude to the CDPs. The strategies used to accomplish these CDPs with the mean score above 2.0 were clear goal setting, delegation and participatory evaluation. The main problems encountered in CDPs were the unwillingness of members to contribute financially (86.7%), lack of cooperation (80.8%) and distrust among members (75.0%). There was a significant relationship between strategies used (r= 0.85, p<0.05) and attitude to CDPs. It was concluded that many of the rural households had undesirable attitude towards CDPs and it is significantly related to strategies used in the project handling and implementation. Therefore, it is recommended that factors which predispose people to undesirable attitude towards CDPs should be resolved at the community level to win peoples’ trust and cooperation so as to improve their attitude in projects that can transform their rural communities. Keywords: Community Development Projects, Attitude and Rural households INTRODUCTION
Development is a gradual process which brings about changes, growth, advancement and transformation in aspects of human life. This cut across the physical, environmental, social and economic parts of the populace. Development targets to increase the level of living and quality of life of the people meeting their needs and solving the immediate problems in their locality. The interpretation of development could be complex based on the perspective of different people. According to Chambers (1997) development is a “good change’’ but this is not as straightforward as it sounds. Thomas (2004) refers to the meaning of development as a process of historical change which was first conceptualized as a process of structural societal change. The word development could be explained in three ways, which include seeing development as a vision, as a historical process that takes place over long periods of time due to inevitable processes and as actions to change things for better (Thomas, 2000). Most of the developments are as a result of deliberate efforts of either authorities or group of people with the mandate to transform their locality. The government authorities are saddled with the responsibility of development in both urban and rural areas. Burki et al (1999) pointed out that the development experiences from some parts of the world, for instance, the Caribbean, East Asia and East European countries were due to the decentralization which was chosen as an important component of their development agenda. The essence of creating local government all over the world is to facilitate the development of the
grassroots and the provision of service delivery to the rural area (Ajayi, 2000) In the developing countries, most of the times the government fails in their responsibility of providing development to improve the lives of the people. According to Nwachukwu and Nzotta (2010), the rate at which infrastructure construction projects fail or abandoned is retrogressive in most developing economies. Even where development is provided by the government, the concentration is mainly in the urban and the access to modern facilities, basic amenities such as drinking water, good feeder roads and electric power supply are limited in the rural areas(U.N. Habitat, 2003). Due to the shortage of these facilities and amenities, people especially in rural areas, put efforts and resources together to construct structure and projects collectively that can improve their standard of living. Monaheng (2000) opined that the people-centred development approach put people’s well-being in the centre and the welfare of the earth as their ecological base as a means of realizing the needs of the people. In order to provide development that will meet the felt need of the people especially at the grassroots, the participation of the people in the communal projects is inevitable. Swanepoel and DeBeer (2006) asserted that Community Development is neither an individual nor few persons’ activities, but rather a collective activity involving a group of people sharing mutual social challenges, concerns, and Community Development needs. United Nations (2014) defines Community Development as a process in which community members take collective action to create solutions

Nigerian Journal of Rural Sociology Vol. 18, No. 2, 2018
70
to their collective problems. It is a comprehensive term given to the practices of local leaders, advocates, citizens and experts in various aspects of communities, with aims of improving and building stronger and more resilient local communities. Lenihan (2012) opined that if governments really want citizens and stakeholders to take ownership of issues, they must engage the public in a real dialogue where all parties work through the matters and agreed on the plan of action together. Olukoshi and Nyamnjo (2005) pointed out that the common explanation why certain projects did not have communal support is because of the top-down approach to development most African leaders adopted while planning and power are left in the hands of certain elites of various sectors. Community Development Projects (CDPs) even though it is communal, not individual, the process still requires the individual’s commitments in terms of time, energy and resources. Since the resources of the people are involved, accountability and transparency cannot be ruled out so as to build the confidence of the people in the process of the CDPs. How the project is being initiated, strategies and approached used in the implementation as well as the problems emanated in communal projects among other factors could influence the attitude of the people towards the projects. The attitude of the people affects their commitment to the project in terms of contribution in both financial and non-financial resources. In order to obtain a positive outcome for CDPs, the issues instigating the attitude of the peoples should be explored and addressed. In this view, this study examined the attitude of rural households to Community Development Projects (CDPs) in Ogun state Nigeria. The study specifically assessed the CDPs, strategies used and problem encountered in implementing the projects, and whether the attitude of the rural households towards CDPs is desirable or not. The hypothesis was tested for the relationship between strategies used in implementing CDPs and attitude of the rural households to CDPs.
METHODOLOGY
The study was carried out in Ogun state in the southwestern region of Nigeria. It is a rainforest zone with a land mass area of 16,406,226 km2 which lies on latitudes 70 01′ and 70 18′, longitudes 20 45′ and 30 55′. The annual rainfall is between 1000mm and 2599mm. The population of Ogun state was estimated by the 2006 Census to be 3,728,098 (National Population Commission, 2006). The state shares boundary with the Republic of Benin on the west and Ondo state on the East, while it is Oyo state in the North and Lagos State as well as the Atlantic Ocean on the South. Ogun State is a ‘gateway’ to Nigeria from other coastal
West African countries like Benin and Togo Republic, Ghana, Sierra Leone and Liberia among others. The study area has received assistance from the State government via the Community Development Councils and Community Development Associations to carry out Self- Help projects that can meet the need in their communities. In recent times, the World Bank partner with the Ogun State government on World Bank Assisted Community and Social Development Projects which is met to further boost development in communities across the State and this makes the location suitable for this study. A multistage sampling procedure was used to select 120 respondents for the study. The selection procedures were as follows: Simple random sampling method was used to select two senatorial zones out of the three zones in Ogun State at the first stage. Fifty percent of the Local Government Area (LGA) from the chosen senatorial zones were selected for the study which make six LGAs at the second stage. Two wards were selected using random sampling to make twelve wards at the third stage. At the fourth stage, a random selection of one rural community in each of the wards was done. Finally, from the frame of the list of rural households in each community, a random selection was carried out to select ten rural household heads respectively from the rural communities which added up to 120 rural household heads. An interview schedule was used to elicit information from rural households. Measurement of variables i. Community Development Projects were
measured at nominal level using Yes =1 and No = 0
ii. Problems encountered in implementing Community Development Projects were measured at nominal level using Yes =1 and No = 0
iii. Strategies used in implementing CDPs were measured using a scale consisting of “All the time”, “Most of the time”, “Sometimes” and “Never” which were assigned 4, 3, 2 and 1 respectively.
iv. The attitudes were measured using a Five-point Likert scale of fourteen items: Strongly agree (SA), Agree (A), Undecided (U), Disagree (D) and Strongly Disagree (SD) which were assigned a score of 5 to 1 respectively. A total attitude score was obtained from the aggregate of the attitude scores of each of the respondents while the mean composite index of the attitude was used to further transform the attitude into two categories of desirable and undesirable attitude.
Data were analysed using descriptive statistics such as frequency counts and percentages. The inferential statistical tool used to test the hypothesis

Nigerian Journal of Rural Sociology Vol. 18, No. 2, 2018
71
was Pearson Product Moment Correlation (PPMC) to determine the relationship between the strategies used and the attitude of rural households to CDPs. The total attitude score was used for the computation of the hypothesis since it is compatible with the selected statistical tool for the hypothesis testing. RESULTS AND DISCUSSION
Socioeconomic characteristic Table 1 presents the socioeconomic characteristics of the rural households’ heads. The result reveals that 55.8 percent of them were male with an average age of 38years. More than half (52.5%) were married and had an average household size of 6 persons. The implication is that the married and their family members are more settled in the study area, they will definitely require basic amenities to support their living. If these amenities are not provided, the dwellers might have to suffer for lack of these amenities. The respondents were young considering their average age, they are likely to still reproduce more offspring who will need basic facilities and services for their survival. Ngugi et al (2003) opined that households with couples, married, and actually living together were more likely to participate in
community project and activities than those married and living separately for whatever reasons, those whose marriage partners were deceased or those that were single. Many (53.3%) of the rural households heads had secondary education, this could enhance their understanding of the process of developing the study area. The level of education helps in prioritizing required development project and assist in accessing available opportunities that could aid the Community Development Projects. It is also important that in community-based projects all segments of the community, especially the youth, adequately participate in the projects from the planning stage, and have some basic knowledge and skills to run and sustain the project (Frank, 2006). The success of the CDPs cannot be achieved without financial commitment either contributed or sought from external sources. The result in Table1 also showed that the average income of the respondents was ₦68,534.00 per annum; the implication is the respondents may find it difficult to financially contribute to the CDPs because of the low income they are earning. Bremerand Bhuiyan (2014) asserted that tenure status and income level influence community participation in community-led infrastructure development.
Table 1. Socioeconomic characteristics of the rural households Variables Modal frequency (Percentage) Mean Age (years) 38 years Sex 67 (55.8%) Male Marital status 63 (52.5%) Married Household size 6 persons Level of education Income per annum
64 (53.3%) Secondary education
₦68,534.00
Implemented community development projects
in the study area
Entries in Figure 1 indicate the projects carried out via the communal efforts. It reveals that about 70 percent of the rural households pointed out that digging of borehole was one of the CDPs. The borehole was to supply water for the community since water is essential for their living both for domestic and livelihoods use. UN Habitat (2011) reported that over 76% (3 in 4) in peri-urban areas and nearly half are without regular access to potable water. Another CDPs executed was the installation of transformer (67.6%). This is to access electricity which could be used to power the pumping machine in the borehole as well as other activities within the communities. The communal assets and properties of the people call for the
cautiousness for security in the community. This could be the reason for the entrance gate (65.8%) that was constructed so as to prevent illegal entry into the community and the building of security post also indicted by 60.8percent of the respondents so as to monitor both properties and lives in the community for protection. The security post serves as an office for any type of security system been operated in the area. The security gadget could be kept at the post and also strategic security plans can be mapped out at the security post before the security personnel set out for their duties. Although other CDPs were carried out in the study area, the main focus and concentration were on the challenges of water supply, provision of electricity and security of lives and properties.
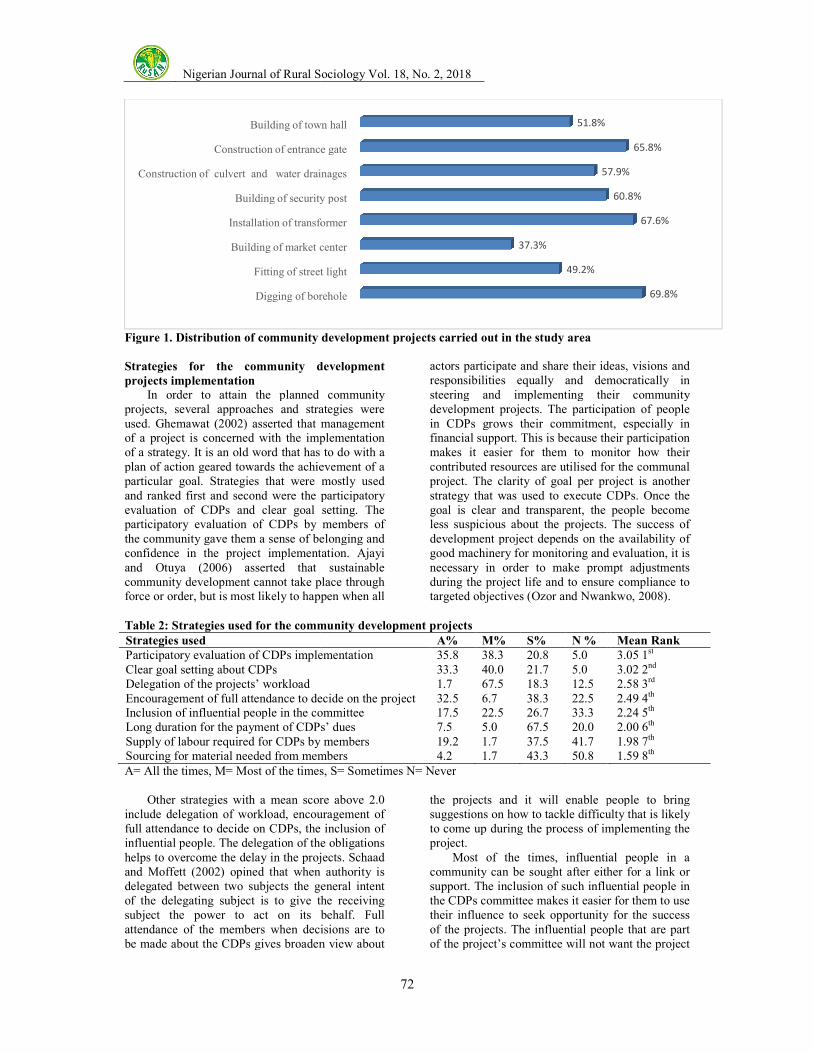
Nigerian Journal of Rural Sociology Vol. 1
Figure 1. Distribution of community development projects carried out in the study area
Strategies for the community development
projects implementation
In order to attain the planned community projects, several approaches and strategies were used. Ghemawat (2002) asserted that management of a project is concerned with the implementation of a strategy. It is an old word that has to do with a plan of action geared towards the achievement of a particular goal. Strategies that were mostly used and ranked first and second were the participatory evaluation of CDPs and clear goal setting. The participatory evaluation of CDPs by members of the community gave them a sense of belonging and confidence in the project implementation. Ajayi and Otuya (2006) asserted that scommunity development cannot take place through force or order, but is most likely to happen when all Table 2: Strategies used for the community
Strategies used
Participatory evaluation of CDPs implementation Clear goal setting about CDPs Delegation of the projects’ workload Encouragement of full attendance to decide on the projectInclusion of influential people in the committee Long duration for the payment of CDPs’ dues Supply of labour required for CDPs by membersSourcing for material needed from membersA= All the times, M= Most of the times, S= Sometimes N= Never Other strategies with a mean score above 2.0 include delegation of workload, encouragement of full attendance to decide on CDPs, the inclusion of influential people. The delegation of the obligations helps to overcome the delay in the projects.and Moffett (2002) opined that when authority is delegated between two subjects the general intent of the delegating subject is to give the receiving subject the power to act on its behalf. Full attendance of the members when decisions are to be made about the CDPs gives broaden view abou
Digging of borehole
Fitting of street light
Building of market center
Installation of transformer
Building of security post
Construction of culvert and water drainages
Construction of entrance gate
Building of town hall
Nigerian Journal of Rural Sociology Vol. 18, No. 2, 2018
72
Figure 1. Distribution of community development projects carried out in the study area
community development
In order to attain the planned community projects, several approaches and strategies were
(2002) asserted that management of a project is concerned with the implementation of a strategy. It is an old word that has to do with a plan of action geared towards the achievement of a particular goal. Strategies that were mostly used
nd second were the participatory evaluation of CDPs and clear goal setting. The participatory evaluation of CDPs by members of the community gave them a sense of belonging and confidence in the project implementation. Ajayi and Otuya (2006) asserted that sustainable community development cannot take place through force or order, but is most likely to happen when all
actors participate and share their ideas, visions and responsibilities equally and democratically in steering and implementing their community development projects. The participation of people in CDPs grows their commitment, especially in financial support. This is because their participation makes it easier for them to monitor how their contributed resources are utilised for the communal project. The clarity of goal per project is another strategy that was used to execute CDPs. Once the goal is clear and transparent, the people become less suspicious about the projects. The success of development project depends on the availability of good machinery for monitoring and evaluation, it is necessary in order to make prompt adjustments during the project life and to ensure compliance to targeted objectives (Ozor and Nwankwo, 2008).
community development projects
A% M% S% N %
Participatory evaluation of CDPs implementation 35.8 38.3 20.8 5.0 33.3 40.0 21.7 5.0 1.7 67.5 18.3 12.5
Encouragement of full attendance to decide on the project 32.5 6.7 38.3 22.5 Inclusion of influential people in the committee 17.5 22.5 26.7 33.3
payment of CDPs’ dues 7.5 5.0 67.5 20.0 Supply of labour required for CDPs by members 19.2 1.7 37.5 41.7 Sourcing for material needed from members 4.2 1.7 43.3 50.8 A= All the times, M= Most of the times, S= Sometimes N= Never
score above 2.0 include delegation of workload, encouragement of full attendance to decide on CDPs, the inclusion of influential people. The delegation of the obligations helps to overcome the delay in the projects. Schaad
en authority is delegated between two subjects the general intent of the delegating subject is to give the receiving subject the power to act on its behalf. Full attendance of the members when decisions are to be made about the CDPs gives broaden view about
the projects and it will enable people to bring suggestions on how to tackle difficulty that is likely to come up during the process of implementing the project. Most of the times, influential people in a community can be sought after either for a link support. The inclusion of such influential people in the CDPs committee makes it easier for them to use their influence to seek opportunity for the success of the projects. The influential people that are part of the project’s committee will not want th
Digging of borehole
Fitting of street light
Building of market center
Installation of transformer
Building of security post
Construction of culvert and water drainages
Construction of entrance gate
Building of town hall
49.2%
37.3%
57.9%
51.8%
actors participate and share their ideas, visions and responsibilities equally and democratically in steering and implementing their community development projects. The participation of people in CDPs grows their commitment, especially in financial support. This is because their participation makes it easier for them to monitor how their
ed for the communal The clarity of goal per project is another
strategy that was used to execute CDPs. Once the goal is clear and transparent, the people become less suspicious about the projects. The success of development project depends on the availability of
ery for monitoring and evaluation, it is necessary in order to make prompt adjustments during the project life and to ensure compliance to targeted objectives (Ozor and Nwankwo, 2008).
Mean Rank
3.05 1st 3.02 2nd 2.58 3rd 2.49 4th 2.24 5th 2.00 6th 1.98 7th 1.59 8th
the projects and it will enable people to bring suggestions on how to tackle difficulty that is likely to come up during the process of implementing the
Most of the times, influential people in a community can be sought after either for a link or support. The inclusion of such influential people in the CDPs committee makes it easier for them to use their influence to seek opportunity for the success of the projects. The influential people that are part of the project’s committee will not want the project
69.8%
67.6%
60.8%
57.9%
65.8%

Nigerian Journal of Rural Sociology Vol. 18, No. 2, 2018
73
to fail probably because of their name, position and integrity. Ozor and Nwankwo (2008) opined that local leaders were able to play important role in community development because of their high level of intelligence, being a cosmopolitan, good level of education, good connections, and their high influence on the people. Problems of Community Development Projects
implementation
Entries in Table 3 show that most (86.7%) of the rural households indicated that people are reluctant to contribute money for CDPs. Funding is an important factor in the execution of projects. Communal projects require a financial contribution of many people, when people are unwilling to contribute, it slows down the process of implementing the project and could lead to an abandonment of the project. Ugboh (2007) opined that insufficient funds have prevented many good ideas that were developed in communities. Lack of cooperation among members is another main (80.8%) problem encountered in implementing CDPs. Once the members of the community cannot reach consensus on what project they want to carry out, it becomes difficult to progress on the project. Platteau and Gaspart (2003) opined that
communities are believed to have a better knowledge of the prevailing local conditions, and a better ability to enforce rules, monitor behaviour and verify actions related to interventions that favour CDPs. Rural people are sometimes sceptical about the communal project which they believed is a way of extorting peoples’ resources. This could be the reason for doubting the process of CDPs and their scepticism affects their attitude towards the communal projects, the implementation process and project committee. The peoples’ unwillingness to contribute money for the CDPs creates another problem, which leads to inadequate funding (67.5%). If the members of the community are willing to contribute then there will be enough fund to complete the project embarked by the community. When the felt need of the community cannot be met due to inadequate fund both from internal and external sources, the people tend to have an unfavourable disposition of the process for the CDPs and it influences their attitudes towards the communal projects. The inability of many projects to generally satisfy the desires and aspirations of the end user is also an instance of project failure (Nwachukwu and Nzotta 2010).
Table 3: Problems encountered in implementing Community Development Projects
Problems Frequency Percentage
Unwillingness to contribute financially 104 86.7%
Lack of cooperation of members 97 80.8%
Distrust among members (Skepticism) 90 75.0%
Inadequate funding for the projects 81 67.5%
Leadership crises and misappropriation of fund 75 62.5%
Poor planning and delay of actions 74 61.7%
Clashes of interests and ideas 52 43.3%
Influential peoples’ control over the projects 41 34.2%
Even when fund for the project is collected, its misappropriation (62.5%) is another problem which leads to leadership crises, and it hinders the progress of the CDPs. The community fund can be misused or even embezzled by the leaders who have access to the fund, sometimes, the purpose of the fund can be changed with little or no consultation with the members of the community. This act of misuse of fund creates crises especially when those that are not convenient with the misappropriation disagree with the leadership. Meanwhile, some of the leaders want to dictate where the project will be sited, solely supply the materials required and disburse the fund, all these causes disagreement among them. Adams and Zulu (2015) opined that the management model of a community project is plagued by corruption, financial mismanagement, and political interference. The crises arise from the clashes of interests and ideas, the plan of actions that
supposed to be a collective representation is hijacked by a few influential people and that can defeat the purpose of the communal project. Rural households’ attitude towards community
development projects Findings in Table 4 show that the respondents agreed that the CDPs did not meet their expectations and duration for the project implementation was too long with a mean score above 3.5. The implication is that the hope of the people about the CDPs was not realized, then people tend to look for an alternative solution to solve their problems. This could also be the reason for undesirable attitude shows by the rural households in the study area. Lasker and Weiss (2003) affirmed that every individual is crucial for development in rural areas; children, youth, men, women and community leaders. Every member is considered important for the flourishing of a community-based project (Leavy and Smith, 2010).

Nigerian Journal of Rural Sociology Vol. 1
Table 4: Attitudes of rural household heads towards community development projects
Attitudinal statement
CDPs did not meet my expectations Implementation duration of the project is too longCDPs are necessary for the communityOnly a few people take advantage of the CDPsCDPs give household heads more sense of responsibility in the community The price of materials for the projects are inflated CDPs makes life comfortable for the communityMany of the CDPs generate strife and clashes CDPs are used as means of extorting money It is satisfying that CDPs provide temporary jobCooperation/bonds for CDPs lasted for short period My money will rather be used for a personal project rather than CDPs The projects make the people of the community to be more united CDPs have not been very useful to households inThe Community could have been better without the CDPs There is free access to all the CDPs Figure 2 showed the categorisation of the overall attitude of the rural households towards Community Development Projects (CDPs) in the study area. More than half (64.0%) of the rural households had an undesirable attitude towards CDPs, this implies that many of the rural households will have detrimental attitude and behaviour towards the communal project. The attitudes of the people have significant impact on their acceptance, commitment and participation in any project be it government, communal or foreigintervention. Community members need to be
Figure 2: Categorisation of rural households' attitude to
Undesirable
attitude
64%
Nigerian Journal of Rural Sociology Vol. 18, No. 2, 2018
74
Table 4: Attitudes of rural household heads towards community development projects
SA% A% U% D% SD%
35.8 35.8 17.5 7.5 3.3 of the project is too long 12.5 60.0 6.7 17.5 3.3
CDPs are necessary for the community 1.7 62.5 20.0 6.7 9.2 Only a few people take advantage of the CDPs 4.2 65.0 14.2 1.7 15.0 CDPs give household heads more sense of 36.7 15.8 12.5 6.7 28.3
The price of materials for the projects are inflated 16.7 24.2 30.8 19.2 9.2 the community 7.5 51.7 9.2 12.5 19.2
strife and clashes - 49.2 20.0 25.0 5.8 CDPs are used as means of extorting money 7.5 24.2 25.0 36.7 6.7 It is satisfying that CDPs provide temporary job 22.5 6.7 13.3 47.5 10.0 Cooperation/bonds for CDPs lasted for short - 31.7 8.3 32.5 27.5
My money will rather be used for a personal 65.0 9.2 15.0 10.8 -
The projects make the people of the community to 9.2 1.7 15.0 46.7 27.5
CDPs have not been very useful to households in 27.5 48.3 9.2 15.0 - have been better without 3.3 1.7 6.7 45.0 43.3
8.3 2.5 2.5 41.6 45.0
ation of the overall attitude of the rural households towards Community Development Projects (CDPs) in the study area. More than half (64.0%) of the rural households had an undesirable attitude towards
any of the rural households will have detrimental attitude and behaviour towards the communal project. The
of the people have significant impact on their acceptance, commitment and participation in any project be it government, communal or foreign intervention. Community members need to be
considered without partiality for them to be actively involved in the project activities, sharing experiences and expertise among themselves, and for everyone in the community to benefit (Hall, Clark and Frost, 2010). The effectiveness and success of CDPs process can be achieved if more people exhibit desirable attitude towards the projects in the community. In the study area, the few that had desirable attitude could be the ones that pushed forward the implementwhile others were dragged along due to their negative attitude.
ation of rural households' attitude to community development projects
Desirable attitude
36%
Desirable attitude
Undesirable attitude
SD% Mean
3.93 3 .61 3.41
3.34 3.26
3.20 3.16
3.13 2.89
2.84 2.44
2.23
2.18
2.12 1.77
1.75
considered without partiality for them to be actively involved in the project activities, sharing experiences and expertise among themselves, and for everyone in the community to benefit (Hall,
2010). The effectiveness and success of CDPs process can be achieved if more people exhibit desirable attitude towards the
In the study area, the few that had desirable attitude could be the ones that pushed forward the implementation of CDPs while others were dragged along due to their
Nigerian Journal of Rural Sociology Vol. 18, No. 2, 2018
75
Test of hypothesis
Entries in Table 5 showed that there is a significant relationship (r = 0.85 p < 0.05) between the strategies used and attitude of the rural households towards Community Development Projects. The result shows that there is a positive relationship between the two variables. This means that the better the strategies used in the implementation of CDPs in the rural communities, the more improved is the attitude of the people to
CDPs. This implies that the strategies used in the implementation of CDPs are noteworthy factors that could determine the attitude of the people towards CDPs. The more acceptable strategies are used, the more the likelihood that the people will exhibit a desirable attitude towards the CDPs. The undesirable attitude could hinder absolute participation in the CDPs which can lead to delay or failure of the projects.
Table 5: Correlation result of the relationship between strategies and attitude to CDPs
Variables r value p-value Decision
Strategies used * attitude to CDPs 0.85 0.015 S
CONCLUSION AND RECOMMENDATIONS
Based on the outcome of the study, it was concluded that most of the rural households in the study area had an undesirable attitude towards Community Development Projects. The main problem encountered in the implementation of CDPs wasthe unwillingness to contribute financially for the project while participatory evaluation of CDPs implementation process was the most used strategies in the study area. It was also established that the strategies used in implementing the project are significantly related to the attitude of the rural households towards the projects. The strategies used in implementing the project is an important factor in a desirable attitude towards CDPs. If the rural households’ attitude is undesirable towards CDPs that are supposed to be their collective project, then, their attitude to the government-owned project could be awful. Therefore, it is recommended that community leaders, program planners and foreign organisation that have an interest in transforming rural area via CDPs should choose participatory and people inclusive approaches in the development process. The government should also encourage a bottom-top approach in rural development to bring about pro-poor growth and policies that can socially fortify the rural communities in the country. REFERENCES Ajayi, A. R. and Otuya, N. (2006). Women’s
participation in self-help community development projects in Ndokwa agricultural zone of Delta State, Nigeria. Community Development Journal,41(2), 189-209.
Ajayi, K., (2000). Theory and practice of local
government.AdoEkiti: University of Ado-Ekiti Printing press.
Bremer, J. and Bhuiyan, S. H. (2014). Community-led infrastructure development in informal areas in urban Egypt: A case study. Habitat International, 44, 258–267.10.1016/j.habitatint.2014.07.004
Burki S. J., Perry G. E., and Dillinger W. (1999). Beyond the Centre: Decentralizing
the State Washington D.C.: World Bank.
Chambers, R. (1997). Responsible well-being: A personal agenda for development. World
Development, 25(11), 1743-1754. Frank, K. I. (2006). The potential of youth
participation in planning. Journal of
Planning Literature, 20 (4), 351-371. Ghemawat, P. (2002). Competition and business
strategy in historical perspective. Business
History Review,769(1), 34-74 Hall, A., Clark, N. and Frost, A. (2010). Bottom-
up, bottom-line: Development-relevant enterprises in East Africa and their significance for agricultural innovation. Research In to Use (RIU) Discussion Paper 02: 3-41.
Lasker, R. D. and Weiss, E. S. (2003). Broadening participation in community problem solving: a multidisciplinary model to support collaborative practice and research. Journal of Urban
Health, Bulletin of the New York Academy
of Medicine 80(1). 14 - 47. Leavy, J. and Smith, S. (2010). Future farmers:
Youth aspirations, expectations and life choices. Future Agricultures Discussion Paper 013: 1-15.
Mbabazi, P. K. (2005) Which way for Africa in the 21st Century?' CODESRIA bulletin 3and4: Pp 53.
Monaheng, T. (2000). Community development and empowerment. Unit 9 in De Beer, F and Swanepoel, H. Introduction to development studies (2nd Edition). Oxford University Press.
NPC (2006). National Population Census. Bulletin 2006, 151-176. Nigeria: NPC.
Nwachukwu, C. C. andNzotta, S. M. (2010). Quality factors indexes: a measure of project success constraints in a developing economy. Interdisciplinary

Nigerian Journal of Rural Sociology Vol. 18, No. 2, 2018
76
Journal of Contemporary Research in
Business,2(2), 505. Ngugi, D., Denford, M., Epperson, J., and
Acheampong, Y. (2003). “Determinants of Household Participation in Rural Development Projects.” In Proceedings of Annual Conference of Southern Agricultural Economic Association, 1-21.
Olukoshi, A. and Nyamnjo F. (2005) Rethink African Development, CODESRIA Bulletin 3 and 4: pp 1.
Ozor, N. and Nwankwo, N. (2008). The role of local leaders in community development programmes in Ideato Local Government Area of Imo State: Implication for Extension Policy. Journal of Agricultural
Extension, 12 (2) 63-75. Platteau, J. P. and Gaspart F. (2003) Disciplining
local leaders in Community-Based Development. Centre for Research on the Economics of Development (CRED), Namur Belgium.
Schaad A. and Moffett J. (2002). Delegation of obligation. In Proceedings of 3rd International Workshop on Policies for Distributed Systems and Networks, (POLICY 02), p.25 June 05-07.
Schmitz, A. (2003). New shape of Suburbia:
Trends in residential development. Urban Land Institute: Washington, DC, USA.
Swanepoel, H. and De Beer, F. (2006).Community
development: Breaking the cycle of
poverty. Lansdowne: Juta. Thomas, A. (2000) Development as practice in a
liberal capitalist world. Journal of
International Development, 12 (6), 773–787.
Thomas, A. (2004). The study of development. Paper prepared for DSA Annual Conference, 6 November, Church House, London.
Ugboh, O. (2007) Gender differences in the role of local leaders in rural and community development in Delta State Nigeria. Pakistan Journal of Social Sciences, 4 (4), 534-539.
UN Habitat (2011). The Malawi Urbanization Challenge. Human Settlements Program. Available at http://www.unmalawi.org/agencies/unhabitat.html#unhab_2
UN Habitat, (2003). The state of the world cities: Trend in Sub Saharan Africa urbanization and metropolitanisation; www.unhabitat.org
United Nations Development Group. (2014) United Nations Development System- A collective approach to supporting capacity development (PDF). Retrieved 7 July

Nigerian Journal of Rural Sociology Vol. 18, No. 2, 2018
77
BENEFITS DERIVED FROM MILLENNIUM DEVELOPMENT GOALS FACILITATED
BOREHOLES IN RURAL AREAS OF ONDO STATE, NIGERIA
Adejuwon, O. T. and Oyesola, O. B. Department of Agricultural Extension and Rural Development, University of Ibadan, Ibadan, Nigeria
Correspondence e-mail address: [email protected]
ABSTRACT Rural infrastructural development has a crucial role to play in the development of any nation. Despite the efforts of the three tiers of governments in Nigeria and that of the international organisations to improve rural wellbeing, most of the infrastructural development efforts have not been sustainable. Therefore, this study assessed the benefits derived from the Millennium Development Goals (MDGs) facilitated boreholes in rural areas of Ondo State, Nigeria. Three stage sampling procedure was used to obtain data from 152 beneficiaries in the study area. Information on socioeconomic characteristics, level of use of the infrastructure, constraints to use of the infrastructure, and benefits derived from the infrastructure were obtained using both qualitative and quantitative methods of data collection; information obtained were analyzed using descriptive and inferential statistics. Majority (66.5%) of the respondents were between the age range of 31 and 60 years with mean age of 44 ± 14.28, 55.3% had a household size of between 1 and 5 people, 61.2% were female, 95.4% had formal education, 60.5% were Christians, and 59.9% were married. High percentage (98.6%) of the respondents stated that borehole was not in use always. The highest ranked constraints faced by the beneficiaries in the use of the
borehole was lack of maintenance (x̅=1.14). The major benefit derived was provision of drinkable water
(x̅=1.87). Significant relationship existed between level of use of the infrastructure (r= -0.358, p=0.002) and the
benefits derived from the infrastructure. It was therefore concluded that the beneficiaries did not benefit from the infrastructure as expected due to low level of use. Keywords: Benefits, Millennium Development Goals, Borehole
INTRODUCTION
Over the last half century, foreign aid has emerged as a dominant strategy for infrastructural development, human capacity building and thus addressed poverty alleviation in the rural areas of Nigeria; yet it seems that the rural dwellers continue to suffer from economic hardship, raising questions of whether foreign aid is worthwhile and effective in Nigeria. Despite the intervention of the international organisations, the non-availability of infrastructures and the poor state of the available ones is alarming. Corroborating this, Fasanya and Onakoya (2012) argued that many government programmes and policies in Nigeria have focused on improving living standards of Nigerians, but have found it difficult to reduce rural poverty. MDG is another foreign supported intervention in Nigeria, financed by the United Nations; it was born at the United Nations Conference on Sustainable Development, in 2012. The objective was to produce a set of universally applicable goals that balances the three dimensions of sustainable development: environmental, social, and economic (affecting every sector). MDG completed her mandate in December, 2015. MDG (2015) asserted that the goals had been achieved. It was agreed that the goals should be sustained, this gave birth to Sustainable Development Goals (SDGs), which was primarily aimed at sustaining the development that the MDGs achieved Among the eight goals of MDGs, the following seven (7) were supposed to have direct effect on the rural dwellers; to eradicate extreme poverty and hunger, to achieve universal primary education, to promote gender equality and
empower women, to reduce child mortality, to improve maternal health, to combat HIV/AIDS, malaria, and other diseases and to ensure environmental sustainability. The infrastructures provided in the rural areas of Ondo State can only be traced to four of these goals. These goals are; to achieve universal primary education, to reduce child mortality, to improve maternal health, to combat HIV/AIDS, malaria, and other diseases. In achieving the goals, MDGs provided maternity centres, boreholes, construction and rehabilitation of classroom blocks in selected rural communities of Ondo State where the facilities were lacking. Boreholes were provided to make water available and accessible to the people; this is targeted at achieving goal 4 which is to reduce child mortality. Despite the provision of borehole in the study area, Olugbamila and Ogunyemi (2015) asserted that continued low level of access to potable water may not be unconnected to non-functional status of the public pipe borne or borehole water. However, the state of and hence the level of benefits derived from borehole water through MDGs has not been investigated to ascertain the extent to which this has contributed to alleviating stress associated with lack of water in rural communities. According to Omogbemi, Dogara and Olabode (2015), rural infrastructures are found today in many rural areas in Nigeria. However, there are a number of abandoned/unused or non-serviceable infrastructures spread all over the country despite the fact that the cost of their execution is quite alarming. Thus, there has been growing awareness on the need for stakeholders to execute only those
Nigerian Journal of Rural Sociology Vol. 18, No. 2, 2018
78
infrastructures that can be operated and maintained at the village level with little or no institutional support. Furthermore, past experiences have shown that except the community is carried along from the time of planning to the time of completion, there is bound to be failure in its sustainability. So many researches has been done in the area of availability of intervention projects as well as accessibility of the projects in rural areas of Nigeria; but there is no adequate information on the benefits derived from the interventions, especially the boreholes provided by foreign organisations. Therefore, this study ascertained the benefits derived from MDGs facilitated boreholes in rural areas of Ondo State. The specific objectives were to; i. describe the socioeconomic characteristics of
the beneficiaries. ii. ascertain the beneficiaries level of use of the
infrastructure; iii. identify the constraints to the use of the
infrastructure in the study area. The hypothesis of the study is as stated; there
is no significant relationship between the level of use of the infrastructure and benefit derived from the infrastructure in the study area
METHODOLOGY This study was carried out in Ondo State, popularly called the Sunshine State. The state was created on 3 February 1976 from the former Western State. It originally included what is now Ekiti State, which was split off in 1996. Akure is the state capital. Ondo State is located in South-West Nigeria, on latitude 5045’N to 8015’N and longitude 4045’Eto 6000’E.It has the tropical wet-and-dry climate with mean annual rainfall of about 1500 mm and 2000mm in the derived savannah and humid forest zones respectively. (Akinyemi and Andreas, 2011). The state is divided into three senatorial districts, namely; Ondo North, Ondo Central and Ondo South. There are 18 local government areas in the state. The population of Ondo state according to National Population Census report stood at 3,440,000 people (NPC, 2008). The population of this study consisted of all household heads in the local government areas that had benefited from MDGs facilitated boreholes in Ondo State, Nigeria. Multi-stage sampling procedure was used to select respondents from the population of household heads in the selected Local Government Areas. Stage 1: Purposive sampling was used to select two (2) local Government Areas with the highest number of MDGs borehole, namely Okitipupa and Ondo East).
Stage 2: The communities where the projects were executed in each LGA were purposively selected. Stage 3: Two communities were randomly selected from the selected communities in each of the two selected Local Government Areas. Stage 4: In each of the selected communities, proportionate random sampling technique was used to select twenty five percent (25%) household heads which covered all the sub-groups in the family. In all, two hundred and twenty (152) respondents were selected for data collection. Measuring the dependent variable of the study, i.e. benefit derived from the intervention, respondents were asked to tick Yes or No to indicate if they benefited from the borehole available in their area, Yes had a value of 1 while No had a value of 0. They were also asked to indicate the level of benefit on a three point scale of High, Moderate, Low and Not beneficial with scores of 3, 2, 1 and 0 respectively. Minimum score was 0.00, maximum score was 24.00 and the mean was9.64 4.
RESULTS AND DISCUSSION
Socioeconomic characteristics Result in Table 1 reveals that 47.4% of the respondents were between the ages of 41 and 60, 20.4% were between 61 and 70, 19.1% of the respondents were between ages of 31 and 40, 10.5% were below 30 years of age, while only 2.6% were above 70 years of age. Mean age of 44 ± 14.28. The result shows that majority (53.1%) were below 50years of age. The Table also reveals that majority (55.3%) of the respondents had between 1 and 5 household size,38.2% had between 6 and 10 household size, with 5.2% having between 11 and 15 household size, while 1.3% had above 15 household sizes. Mean household size of 5 ± 3.18. This implies that majority of the households in the study area had large household size which could lead to high pressure on the infrastructure. Furthermore, majority (61.2%) of the respondents were female, and 38.8% were male. Result on education attainment of the respondents reveals that majority (65.9%) had tertiary education, secondary 19.0% and primary education 10.5% while only 4.6% of the respondents had no formal education. This implies that indigenes of the study area are well educated. The findings also corroborates the findings of (Adepoju and Obayelu, 2013) who stated that most indigene of the study area (Ondo State) have one form of formal education or the other Majority (60.5%) of the respondents were Christians, 38.8% were Muslims, while only 0.7% was a traditional worshiper. This implies that majority of the people in the study area were Christians. Previous researches indicate that

Nigerian Journal of Rural Sociology Vol. 18, No. 2, 2018
79
Muslims in the study area are about 35% of the total population (SCSN, 2005).
Table 1: Distribution of respondents according to their socioeconomic characteristics
Variable description Frequency Percentage Mean / Std. deviation
Age (years) Less or equal to 30 16 10.3 Mean = 44
Std. Deviation = 13.18 31-40 29 19.1 41-50 36 23.7 51-60 36 23.7 61-70 31 20.4 Above 70 4 2.6 Household size 1-5 84 55.3 Mean = 5
Std. Deviation = 3.18
6-10 58 38.2 11-15 9 5.2 Above 15 1 1.3 Sex Male 59 38.8 Female 93 61.2 Highest level of education No formal education 7 4.6 Primary education 16 10.5 Secondary education 29 19.0 HSC/OND 19 12.5 NCE 30 19.7 B. Sc / HND 39 25.6 Master degree 10 6.8 Ph.D 2 1.3 Religion Christianity 92 60.5 Islam 59 38.8 Traditional 1 0.7 Marital status Single 23 15.1 Married 87 59.9 Divorced 9 5.9 Widowed (er) 27 17.8 Separated 6 1.3 Source: Field survey, 2017
Table 1also reveals that majority (59.9%) of the respondents were married. This implies that majority of the respondents were married and thus classified as being responsible as marriage is believe to confer responsibility on individual. As asserted by Jibowo (2000) that marriage is an important institution in any community for it is an
important framework within which social role and status are prescribed. Frequency of use of the infrastructures Result of analysis presented on Figure 1 on the frequency of use of the boreholes reveals that majority (98.6%) of the respondents were not using the infrastructure, while the remaining 1.4% use it occasionally,

Nigerian Journal of Rural Sociology Vol. 18, No. 2, 2018
80
Source: Field survey, 2017
Figure 1: Distribution of respondents’ level of use of the infrastructures This is in agreement with the view of FGD participants that all the boreholes were not in use because they were not in good condition. The discussants at the FGDs stated that reasons for the bad state of the borehole were lack of maintenance by the donor agency, use of inferior materials and not completion of some of the project. Constraints to the use of borehole
Result in Table 2 shows that lack of maintenance (x�=1.14), small over-head tanks
(x�=0.89) and lack of technical knowhow on maintenance (x�= 0.79) were the most severe constraints faced by the respondents in the use of the borehole provided by MDGs. Some other constraints faced by the beneficiaries were bad road (x�=0.73), some borehole projects were not completed (x�=0.60) and level charge before use (x�=0.34).
Table 2 Distribution of the constraints to the use of borehole
Constraints Very severe Severe Not a constraint Mean Rank
Freq % Freq % Freq %
Levies charged before use 12 17.1 0 0.0 58 82.9 0.34 6th Location of the borehole 3 4.3 1 1.4 66 94.3 0.10 8th Technical know how 24 34.3 7 10.0 39 55.7 0.79 3rd Lack of maintenance 34 48.6 12 17.1 24 34.3 1.14 1st Small over-hand tank 24 34.3 14 20.0 32 45.7 0.89 2nd The project was not Completed
21 30.0 0 0.0 49 70.0 0.60 5th
Bad road 15 21.4 21 30.0 34 48.6 0.73 4th The project stopped Working
8 11.4 0 0.0 62 88.6 0.23 7th
Grand mean 0.60 Source: Field survey, 2017 This corroborates the findings of Enefiok and Ekong (2014) that lack of maintenance is the major problem with MDGs water projects in Nigeria. Benefits derived from borehole by respondents Results in Table 3 indicate that benefits derived through the provision of borehole in the study area through MDGs intervention included provision of drinkable water (x�=1.87), reduction in hours spent in search of water (x�=1.07) and improve unity in the community (x�=0.80).
This implies that MDGs only succeeded in providing drinkable water and could not provide other beneficial impact because it did not serve the people for long. This corroborate the statements of the discussants during the FGD that the borehole only provided drinkable water and also reduced distance covered in search of water for few months before they stopped working.
98.6
1.4 00
20
40
60
80
100
120
Not in use Occasionally Always
Series1

Nigerian Journal of Rural Sociology Vol. 18, No. 2, 2018
81
Table 3: Distribution of benefits derived from boreholes by respondents Level of benefit High Moderate Low Not
beneficial
Mean
Rank
Freq % Freq % Freq % Freq %
Provision of drinkable water
35 50.0 11 15.7 3 4.3 21 30.0 1.87 1st
Reduce incidence of cholera and other related ailment
3 4.3 3 4.3 2 2.9 62 88.6 0.24 5th
Provision of water for Irrigation
3 4.3 2 2.9 2 2.9 63 90.0 0.21 7th
Reduce hour spent in search of water
15 21.4 13 18.6 4 5.7 38 54.3 1.07 2nd
Reduces child mortality 3 4.3 3 4.3 2 2.9 62 88.6 0.24 5th It improves sanitation of the environment
3 4.3 3 4.3 4 5.7 60 85.7 0.27 4th
It improves the unity in the community
8 11.4 10 14.3 12 17.1 40 57.2 0.80 3rd
Grand mean 0.67 Source: Field survey, 2017
Categorisation of level of benefits derived from
the infrastructure
Table 4 shows the level of benefit derived from boreholes provided by MDGs in the study
area. The result shows that majority (84.9%) said it was low while 15.1% said the benefit derived from the borehole was high. The low benefit derived may be due to low level of use.
Table 4 Distribution of categories of level of benefits derived from the infrastructures
Level Frequency Percentage
Low (0.00-4.70) 129 84.9 High (4.71-21.00) 23 15.1 Total 152 100.0
Relationship between level of use of the
infrastructure and the benefit derived from the
infrastructures Results of analysis in Table 5 show that there is significant relationship between the level of use
of borehole (r = -0.358, p = 0.0002), and the benefit derived from the infrastructure, hence, the null hypothesis is rejected. The boreholes were not in use, hence it affected the benefits.
Table 5: Results of test of relationship between level of use of the infrastructure and the benefit derived
from the infrastructure
Variable r-value p-value Decision
Level of use 0.358 0.002 Significant Source: Field survey, 2017
CONCLUSION AND RECOMMENDATION The study concluded that the level of use is very low because most of the infrastructures were in bad conditions because they were not properly maintained. The benefit derived was low due to the low level of use. Based on the findings of the work, the following recommendations are hereby made: i. The donor agency should have a maintenance
team for the infrastructure; also the beneficiaries should be encouraged to maintain the infrastructure in the study area.
ii. MDGs should rehabilitate all abandoned boreholes in the study area.
iii. MDGs should engage professionals in the field of rural sociology for her community entrance process.
REFERENCES Adepoju, A. O. and Obayelu, O. A. (2013).
Livelihood diversification and welfare of rural households in Ondo State, Nigeria. Journal of Development and Agricultural
Economics. Vol. 5 pp. 482-489. DIO 10.58971/JDAE2013.0497.
Akinyemi, G. O. and Andreas, M. (2011). Climate and bio-climate analysis of Ondo State, Nigeria. Meteorologische Zeitschrift. An Empirical Analysis for Nigeria.

Nigerian Journal of Rural Sociology Vol. 18, No. 2, 2018
82
International Journal of Economics and
Financial Issues Vol. 20, No. 5, pp 1. Enefiok, E. I. andEkong, E. E. (2014). Rural water
Supply and Sustainable Development in Nigeria: A case analysis of Akwa Ibom State. American Journal of Rural
Development, 20142(4), pp 68-73. DOI: 10.12691/ajrd-2-4-2.
Fasanya, I. O. and Onakoya, A. B. (2012). Does Foreign Aid Accelerate Economic Growth?
Jibowo, A. A. (2000). Essentials of Rural Sociology. Gbemi Sodipo press Ltd, Abeokuta, Nigeria, 244p
Millennium Development Goals (MDG) (2015). The 2015 Millennium Development Goals Report. Retrieved from www.google.com on 10/03/2017.
National Bureau of Statistics (NBS) (2016). National Bureau of Statistics 2016 report. Retrived from www.nbs.com on 26/02/2017
Nigerian Population Commission (NPC) (2008). The report on live birth, death, and
stillbirth Registration in Nigeria (1994-2007). Retrieved from www.google.com on 11/10/2017
Olugbamila, O. B. and Ogunyemi, O. F. (2015). Assessment of Water Supply Situation in Owo, Ondo State, Nigeria: Implications for the Attainment of the Millennium Development Goals. International Journal
of Scientific and Research Publications,
Volume 5, pp 4. Omogbemi, Y., Dogara, B. and Olabode, O. T.
(2015). Operation and Maintenance of Rural Water Supply Schemes in Nigeria: an Overview. P 2 Retrieved from www.google.com on 1/3/2017.
SCSN (2005). Supreme Council for Sharia in Nigeria press release. Retrieved from www.google.comon 22/07/2017.
UNICEF (2016). Highlights of 2016 UNICEF
report on the state of the world's children,
retrieved from www.unicef.com on
14/01/2017 Vol. 2, No. 4, 2012, pp.423-
431, ISSN: 2146-4138
www.econjournals.com

Nigerian Journal of Rural Sociology Vol. 18, No. 2, 2018
83
DETERMINANTS OF CHILD LABOUR AMONG RURAL FARMING HOUSEHOLDS IN KWARA
STATE, NIGERIA 1Oladimeji, Y. U. and 2Edun, A. J.
1Department of Agricultural Economics, Faculty of Agriculture/Institute for Agricultural, Research (IAR), Ahmadu Bello University, Zaria, Nigeria
2Department of Political Science, University of Ilorin, Ilorin, Nigeria Correspondence e-mail address: [email protected]
ABSTRACT
The persistence of child labour is a barrier to the achievement of the global Sustainable Development Goals (SDGs) set for 2030 to eradicate poverty, provide decent quality learning for all children up to secondary school level, reduce inequality and create decent jobs. The study assessed the determinants of child labour among rural farming households in Kwara state, Nigeria. Primary data was obtained through multistage random sampling of 378 rural farming household heads from six (6) Local Government Areas (LGAs) out of 12 in Kwara State, Nigeria through field surveys. The tools of analysis were descriptive statistics, Foster-Greer-Thorbecke (FGT) index, Tobit regression model and Kernel density estimation. The result revealed that economic factors driven by poverty are the most important reasons for child labour. The result also showed that the bulk of child labour engaged in family farm labour (46.1%), domestic servants (10.0%) and hired labour (8.1%). The pooled results indicated that the determinants of child labour among rural households include age (0.302), marital status (0.087), adjusted household size (-0.219), cultural factor (0.007) and occupation (0.361) were statistically significant at different level of probability. The result obtained signified that household heads depend largely on child labour earning to supplement their income from agricultural production. Legislation must spell out the chores children could render to the family with special attention to age groups. Governments need to ensure that all children have access to basic education as a front-line response to child labour. Keywords: Child labour, education, interventions, poverty INTRODUCTION Child labour remains endemic in many of the developing countries thereby representing an obstacle to Sustainable Development Goals (SDGs).These goals include the eradication of poverty, provision of decent quality learning for all children up to secondary school level, reduced inequality and the creation of decent jobs (United Nations General Assembly, 2015). According to Guarcello, Lyon and Valdivia (2015), Quattri and Watkins (2016) child labour keeps children out of school, hinders effective learning and denies children the opportunity to acquire knowledge and skills they need to escape poverty, which also their countries will need to drive inclusive growth and human development. The symptoms of child labour include loss of freedom, violation of rights, source of vulnerability and constraint on learning. In addition to exposure to risk of injury, these children are denied the chance to acquire what Sen (1994) describes as ‘human capabilities’ - the knowledge, skills and competencies needed to expand choice and extend opportunity. Nigerian population has increased from about 60 million in 1963 to 88.5 million in 1991 (National Population Census, NPC, 1963 and 1991) and to a recent estimated figure of over 184 million in 2016 (NPC, 2016). This implies that Nigeria is experiencing rapid population and many poor rural families are struggling for a better life in rural and urban areas. This drives rural households to engage their wards to work in order to supplement family incomes.
Globally, an estimated 246 million children are engaged in child labour. More than 70% (172 million) of these children work in hazardous conditions including working in mines, chemicals and pesticides in the agricultural sector or with dangerous machinery. They are also employed as domestic servants in homes, hired farm labour, debt bondage, bus conductors and begging. The vast majority of working children (over 70%) work in the agricultural sector and it is pertinent to note that sub-Saharan Africa has an estimated 48 million child workers (United Nations International Children’s Emergency Fund, UNICEF, 2016). The International Labour Organisation (ILO, 2013) estimates that about 25% of Nigeria’s 80 million children under the age of fourteen are involved in child labour (Lana, 2014). The definition of child labour is not simple because it includes three difficult concepts, which are “child”, “work” and “labour”. Child labour refers to children working in contravention of ILO standards contained in Conventions 138 and 182, which stated that all children below 12 years of age working in any economic activities, those aged between 12 and 14 engaged in more than light work, and all children engaged in the worst forms of child labour contravene ILO labour standards. ILO reports (2013) also opined that if a child’s work does not hinder children’s schooling or do not affect their health physically and mentally, then it is generally not categorised as child labour. For instance, helping parents at home, looking after siblings or working for pocket money after school hours and during holidays cannot be classified as

Nigerian Journal of Rural Sociology Vol. 18, No. 2, 2018
84
child labour. Although child work is considered a part of children’s training to be responsible adults, child labour is exploitative (ILO reports, 2013). Child labour is a complex issue and various factors behind the labouring predominate in different contexts. To be able to combat child labour in the study area, the underlying causes must be understood. Considering the growing importance of child labour among the rural households in the study area, the study examined factors that determine child labour among rural households in Kwara State Nigeria and to what extent has this improved the well-being of the households.
METHODOLGY
Kwara State is situated in North Central Nigeria with Ilorin as capital. It is located between latitude 7° 45ʹ and 9 30ʹ N and longitude 2° 30ʹ E and 6°25ʹ E with a land mass covering about 32,500 square km and a total land size of 3,682,500 ha (Oladimeji et al., 2015a). The state’s population and farm families were projected in 2018 to be about 3.4 million and 336,315 respectively representing 3.2% annual growth rate and an average density of 106 persons per square km with majority living in rural areas. The study was carried out in six (6) Local Government Areas (LGAs) namely Asa, Baruten, Edu, Ifelodun, Moro, and Patigi, being predominantly farming areas of Kwara State, Nigeria. The study is based on primary sources of the data gathered by field surveys in 2017 off farming season through questionnaire and interview. It focused on socioeconomic characteristics of household heads and data on child labour among the households. Three categories of child labour were captured based on the main principles of the ILO convention concerning the minimum age of admission to employment and work are as follows: (i) hazardous work: any work which is likely to jeopardize children’s physical, mental or moral health, safety or morals should not be undertaking by children under the age of 16-18. (ii) basic minimum age for work should be after completion of secondary schooling, which is generally 16 years and above, and (iii) light work: children between the age of 13 and 15 years old may do light work as long as it does not threaten their health or hinder their education or vocational orientation and training. The questionnaire content and face validity were confirmed through reconnaissance survey and National Agency for Prohibition of Trafficking in Persons (NAPTIP) using pretested questions. The reliability estimates for every component of each dimension satisfied the minimum Cronbach alpha levels with calculated alpha coefficient value of 0.70,
The analysis in this paper was based on a multi stage random household survey conducted in six (6) LGAs in 2017 off-farming season. The LGAs were selected being an area with households that have myriads opportunity to child labour based on reconnaissance survey carried out. The villages that have proximity with quarrying and mining sites were listed. Two villages each were randomly selected from the six LGAs. The selected villages were Ogbondoroko, Laduba (Asa LGA); Gwanara, Ilesha Baruba (Baruten), Songahi, Bacita (Edu), Babanla, Igbaja (Ifelodun), Onipako, Beriberi (Moro); and Ellah, Sunkuso (Patigi). From each of the selected villages, 25% of the household heads were selected randomly using ballot technique. The last stage involved using a Slovian formula adopted by Oladimeji et al. (2017) for calculating sample size based on the assumption of 5% expected margins of error, 95% confidence interval and applying the finite population correction factor. The formula was expressed as follows:
...... (1) Where: ��is the sample size; � = 0.05; � = total number of respondents. Therefore, 378 household heads were randomly selected using the card method. Descriptive statistics such as frequency counts, mean, standard deviation, percentages, graphs and tables were used to describe the variables included in the model. Foster-Greer-Thorbecke (FGT) indices were used to determine the influence of income earned with or without child labour on wellbeing of rural farmers given as:
...... (2) Where: ��� is the poverty index for the ith sub-groups, n is the total number of households, Yi is the per adult equivalent income/consumption expenditure of i-th households, z is the poverty line, q is the number of the sampled household population below the poverty line and � is the aversion to poverty as it ranges from 0 to 2 (Foster, Greer and Thorbecke, 1984). Tobit regression model was used to determine the factors that influenced child labour among rural households thus:
.... (3) i= 1, 2..., 378 Where: �� =the dependent variable and Xi = Independent variable define in Table 1, β is a vector of unknown co-efficient and µi is an independently distributed error term (Tobin, 1958).
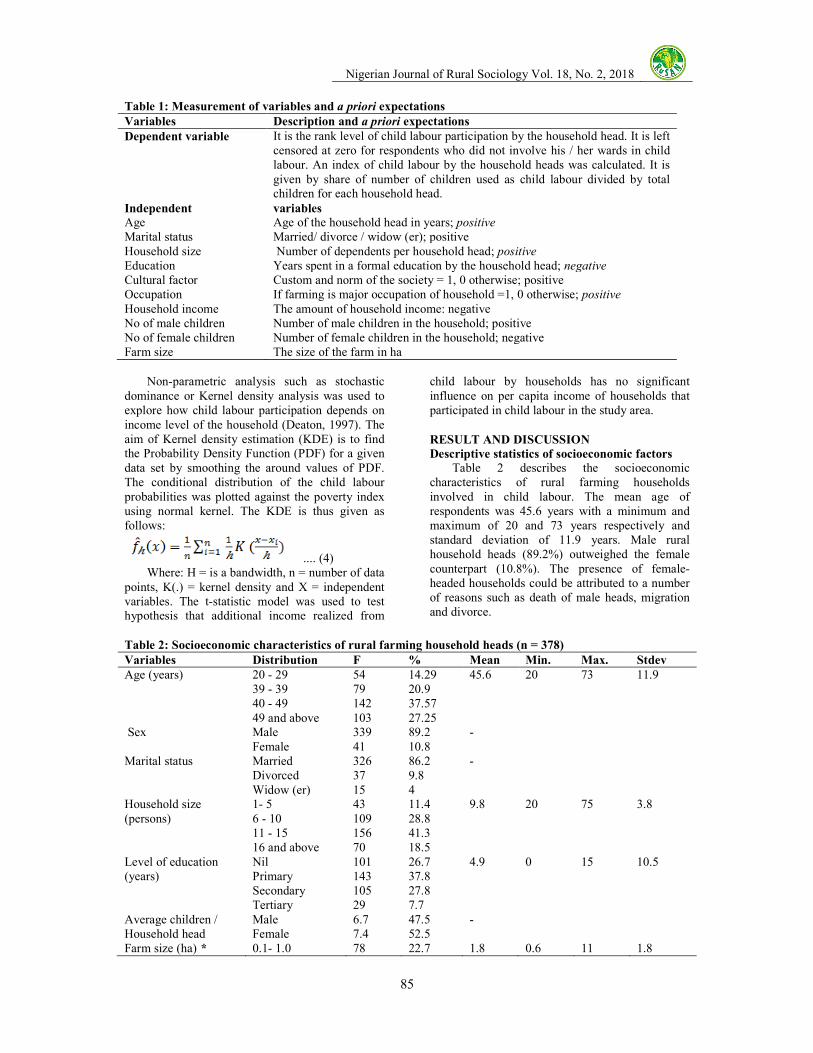
Nigerian Journal of Rural Sociology Vol. 18, No. 2, 2018
85
Table 1: Measurement of variables and a priori expectations
Variables Description and a priori expectations
Dependent variable It is the rank level of child labour participation by the household head. It is left censored at zero for respondents who did not involve his / her wards in child labour. An index of child labour by the household heads was calculated. It is given by share of number of children used as child labour divided by total children for each household head.
Independent variables
Age Age of the household head in years; positive Marital status Married/ divorce / widow (er); positive Household size Number of dependents per household head; positive Education Years spent in a formal education by the household head; negative Cultural factor Custom and norm of the society = 1, 0 otherwise; positive Occupation If farming is major occupation of household =1, 0 otherwise; positive Household income The amount of household income: negative No of male children Number of male children in the household; positive No of female children Number of female children in the household; negative Farm size The size of the farm in ha Non-parametric analysis such as stochastic dominance or Kernel density analysis was used to explore how child labour participation depends on income level of the household (Deaton, 1997). The aim of Kernel density estimation (KDE) is to find the Probability Density Function (PDF) for a given data set by smoothing the around values of PDF. The conditional distribution of the child labour probabilities was plotted against the poverty index using normal kernel. The KDE is thus given as follows:
.... (4) Where: H = is a bandwidth, n = number of data points, K(.) = kernel density and X = independent variables. The t-statistic model was used to test hypothesis that additional income realized from
child labour by households has no significant influence on per capita income of households that participated in child labour in the study area.
RESULT AND DISCUSSION
Descriptive statistics of socioeconomic factors
Table 2 describes the socioeconomic characteristics of rural farming households involved in child labour. The mean age of respondents was 45.6 years with a minimum and maximum of 20 and 73 years respectively and standard deviation of 11.9 years. Male rural household heads (89.2%) outweighed the female counterpart (10.8%). The presence of female-headed households could be attributed to a number of reasons such as death of male heads, migration and divorce.
Table 2: Socioeconomic characteristics of rural farming household heads (n = 378)
Variables Distribution F % Mean Min. Max. Stdev
Age (years) 20 - 29 54 14.29 45.6 20 73 11.9 39 - 39 79 20.9 40 - 49 142 37.57 49 and above 103 27.25 Sex Male 339 89.2 - Female 41 10.8 Marital status Married 326 86.2 - Divorced 37 9.8 Widow (er) 15 4 Household size 1- 5 43 11.4 9.8 20 75 3.8 (persons) 6 - 10 109 28.8 11 - 15 156 41.3 16 and above 70 18.5 Level of education Nil 101 26.7 4.9 0 15 10.5 (years) Primary 143 37.8 Secondary 105 27.8 Tertiary 29 7.7 Average children / Male 6.7 47.5 - Household head Female 7.4 52.5 Farm size (ha) * 0.1- 1.0 78 22.7 1.8 0.6 11 1.8

Nigerian Journal of Rural Sociology Vol. 18, No. 2, 2018
86
Variables Distribution F % Mean Min. Max. Stdev
1.1-2.0 136 39.7
2.1-3.0 80 23.3
>3 49 14.3
* indicates that the sample size is not equal to 378 Field survey, 2016/2017 The result of household size in Table 2 showed that the average number of persons per household was approximately 10 which could affect the amount of farm and non-farm labour, determine the food and nutritional requirements of household and often affects poverty status and household food security. The result of the analysis of the years of schooling of respondent shows that the educational status is largely skewed towards the informal education as about 64.6% of the pooled rural households either had only primary schooling or did not have formal schooling, while only 7.7 percent attended tertiary school. Therefore, literacy rate was very low among the rural households sampled with mean year of schooling of 4.9 years below 2015 UNDP mean education index of 5 years for Nigeria. Figure 1 depicts the reasons for households’ involvement in child labour. The result revealed that poverty status (34.2%), economic hardship
(28.3%) and self-actualization (17.2%) constituted the major reasons (80%) for involvement in child labour. The rate of child labour in the study area implies that households in poor conditions wish to get out of poverty and therefore find it necessary to earn additional income. According to the poverty theory, it is most common for children to work because families need to increase their household income. Johansson (2009) opined that children in the developing countries are the cheapest workforce to be found as they have no education and not so many employment options. This makes them perfect employees for wealthy households or greedy employers. The study therefore found child labour to correlate partly to the child labour in the study area. Studies have demonstrated that the most notable reason for child labour is poverty (Johansson, 2009, Lana, 2014, Oladimeji et al., 2015a).
Fig 1: Reasons for households’ involvement in child labour Result in figure 1 also revealed that about 28.3% of respondents’ household engaged in child labour due to economic hardship. Contrary to the findings of Johansson (2009), the result found child labour as a contribution to the family earning as majority of the children contributed their earnings to help the household economy. The findings on economic hardship is comparable with studies of Oladimeji et al. (2015 a and b) and Quattri and Watkins, 2016. The study also showed that 17.2% of children who participated in child labour did on volition that is, not enforced by the parents (figure 1). The principal argument of the theory about child labour as a means of self-actualization is that many
children would want to work even if they did not have to. This is in line with finding in the study area as 17.2% of the children are willing to be involved in child labour. Quattri and Watkins, (2016) opined that children working because they want to establish certain independence is another indicator of the self-actualization theory. Thus, the result showed that poverty, economic hardship and self-actualization are the most important reasons for households’ involvement in child labour in the study area. Results in Figure 2 indicate households by activities participated as a child labourers. The results showed that the children of the sampled rural households were involved in child labour as
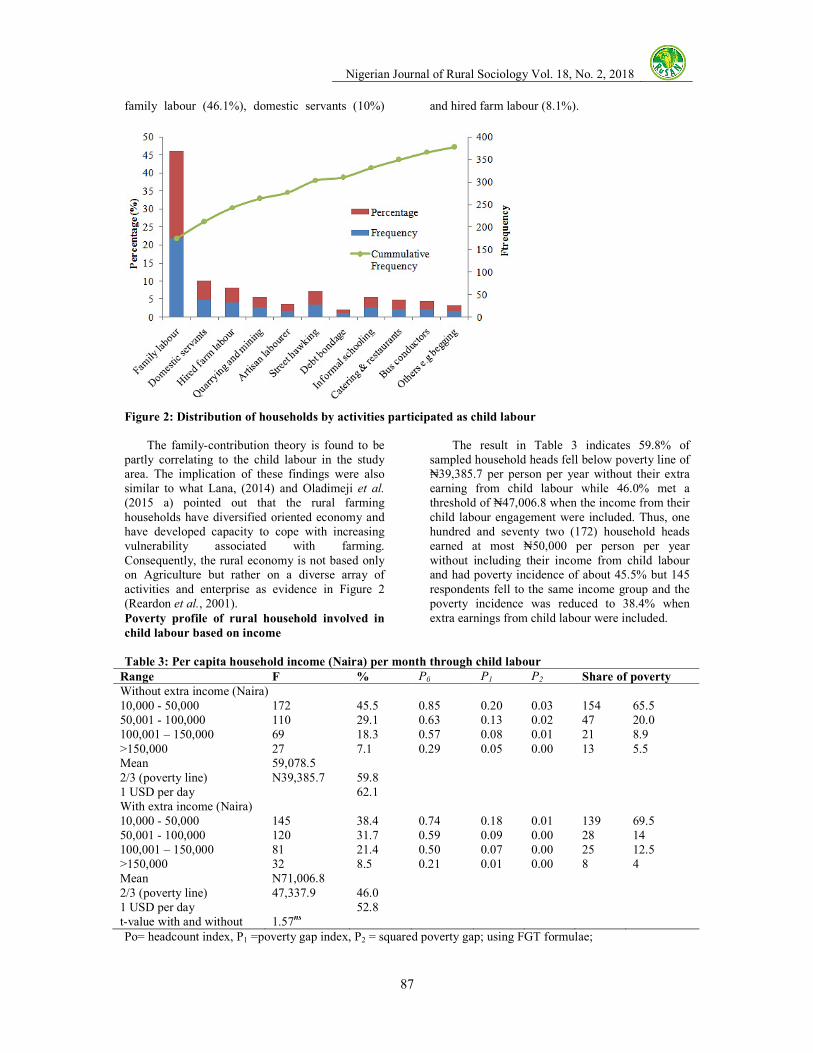
Nigerian Journal of Rural Sociology Vol. 18, No. 2, 2018
87
family labour (46.1%), domestic servants (10%) and hired farm labour (8.1%).
Figure 2: Distribution of households by activities participated as child labour The family-contribution theory is found to be partly correlating to the child labour in the study area. The implication of these findings were also similar to what Lana, (2014) and Oladimeji et al. (2015 a) pointed out that the rural farming households have diversified oriented economy and have developed capacity to cope with increasing vulnerability associated with farming. Consequently, the rural economy is not based only on Agriculture but rather on a diverse array of activities and enterprise as evidence in Figure 2 (Reardon et al., 2001). Poverty profile of rural household involved in
child labour based on income
The result in Table 3 indicates 59.8% of sampled household heads fell below poverty line of ₦39,385.7 per person per year without their extra earning from child labour while 46.0% met a threshold of ₦47,006.8 when the income from their child labour engagement were included. Thus, one hundred and seventy two (172) household heads earned at most ₦50,000 per person per year without including their income from child labour and had poverty incidence of about 45.5% but 145 respondents fell to the same income group and the poverty incidence was reduced to 38.4% when extra earnings from child labour were included.
Table 3: Per capita household income (Naira) per month through child labour
Range F % P0 P1 P2 Share of poverty
Without extra income (Naira) 10,000 - 50,000 172 45.5 0.85 0.20 0.03 154 65.5 50,001 - 100,000 110 29.1 0.63 0.13 0.02 47 20.0 100,001 – 150,000 69 18.3 0.57 0.08 0.01 21 8.9 >150,000 27 7.1 0.29 0.05 0.00 13 5.5 Mean 59,078.5 2/3 (poverty line) N39,385.7 59.8 1 USD per day 62.1 With extra income (Naira) 10,000 - 50,000 145 38.4 0.74 0.18 0.01 139 69.5 50,001 - 100,000 120 31.7 0.59 0.09 0.00 28 14 100,001 – 150,000 81 21.4 0.50 0.07 0.00 25 12.5 >150,000 32 8.5 0.21 0.01 0.00 8 4 Mean N71,006.8 2/3 (poverty line) 47,337.9 46.0 1 USD per day 52.8 t-value with and without 1.57ns Po= headcount index, P1 =poverty gap index, P2 = squared poverty gap; using FGT formulae;
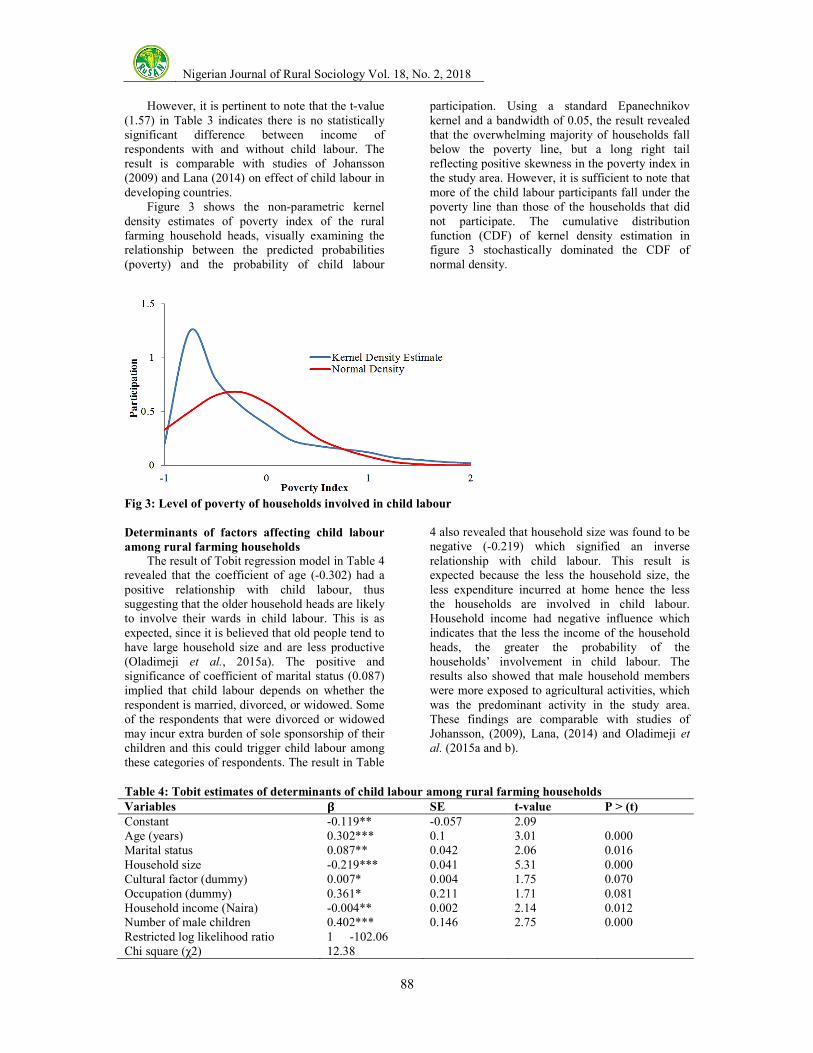
Nigerian Journal of Rural Sociology Vol. 18, No. 2, 2018
88
However, it is pertinent to note that the t-value (1.57) in Table 3 indicates there is no statistically significant difference between income of respondents with and without child labour. The result is comparable with studies of Johansson (2009) and Lana (2014) on effect of child labour in developing countries. Figure 3 shows the non-parametric kernel density estimates of poverty index of the rural farming household heads, visually examining the relationship between the predicted probabilities (poverty) and the probability of child labour
participation. Using a standard Epanechnikov kernel and a bandwidth of 0.05, the result revealed that the overwhelming majority of households fall below the poverty line, but a long right tail reflecting positive skewness in the poverty index in the study area. However, it is sufficient to note that more of the child labour participants fall under the poverty line than those of the households that did not participate. The cumulative distribution function (CDF) of kernel density estimation in figure 3 stochastically dominated the CDF of normal density.
Fig 3: Level of poverty of households involved in child labour Determinants of factors affecting child labour
among rural farming households
The result of Tobit regression model in Table 4 revealed that the coefficient of age (-0.302) had a positive relationship with child labour, thus suggesting that the older household heads are likely to involve their wards in child labour. This is as expected, since it is believed that old people tend to have large household size and are less productive (Oladimeji et al., 2015a). The positive and significance of coefficient of marital status (0.087) implied that child labour depends on whether the respondent is married, divorced, or widowed. Some of the respondents that were divorced or widowed may incur extra burden of sole sponsorship of their children and this could trigger child labour among these categories of respondents. The result in Table
4 also revealed that household size was found to be negative (-0.219) which signified an inverse relationship with child labour. This result is expected because the less the household size, the less expenditure incurred at home hence the less the households are involved in child labour. Household income had negative influence which indicates that the less the income of the household heads, the greater the probability of the households’ involvement in child labour. The results also showed that male household members were more exposed to agricultural activities, which was the predominant activity in the study area. These findings are comparable with studies of Johansson, (2009), Lana, (2014) and Oladimeji et
al. (2015a and b).
Table 4: Tobit estimates of determinants of child labour among rural farming households
Variables � SE t-value P > (t)
Constant -0.119** -0.057 2.09 Age (years) 0.302*** 0.1 3.01 0.000 Marital status 0.087** 0.042 2.06 0.016 Household size -0.219*** 0.041 5.31 0.000 Cultural factor (dummy) 0.007* 0.004 1.75 0.070 Occupation (dummy) 0.361* 0.211 1.71 0.081 Household income (Naira) -0.004** 0.002 2.14 0.012 Number of male children 0.402*** 0.146 2.75 0.000 Restricted log likelihood ratio 1 -102.06 Chi square (χ2) 12.38
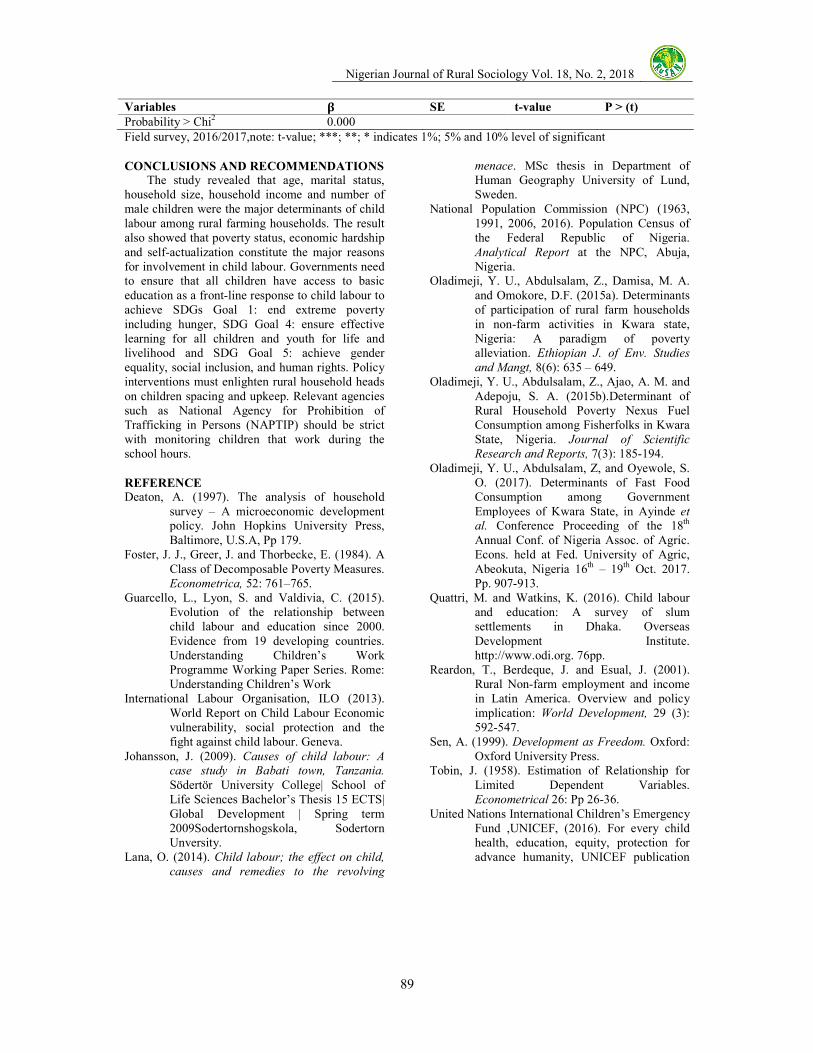
Nigerian Journal of Rural Sociology Vol. 18, No. 2, 2018
89
Variables � SE t-value P > (t)
Probability > Chi2 0.000 Field survey, 2016/2017,note: t-value; ***; **; * indicates 1%; 5% and 10% level of significant
CONCLUSIONS AND RECOMMENDATIONS The study revealed that age, marital status, household size, household income and number of male children were the major determinants of child labour among rural farming households. The result also showed that poverty status, economic hardship and self-actualization constitute the major reasons for involvement in child labour. Governments need to ensure that all children have access to basic education as a front-line response to child labour to achieve SDGs Goal 1: end extreme poverty including hunger, SDG Goal 4: ensure effective learning for all children and youth for life and livelihood and SDG Goal 5: achieve gender equality, social inclusion, and human rights. Policy interventions must enlighten rural household heads on children spacing and upkeep. Relevant agencies such as National Agency for Prohibition of Trafficking in Persons (NAPTIP) should be strict with monitoring children that work during the school hours.
REFERENCE Deaton, A. (1997). The analysis of household
survey – A microeconomic development policy. John Hopkins University Press, Baltimore, U.S.A, Pp 179.
Foster, J. J., Greer, J. and Thorbecke, E. (1984). A Class of Decomposable Poverty Measures. Econometrica, 52: 761–765.
Guarcello, L., Lyon, S. and Valdivia, C. (2015). Evolution of the relationship between child labour and education since 2000. Evidence from 19 developing countries. Understanding Children’s Work Programme Working Paper Series. Rome: Understanding Children’s Work
International Labour Organisation, ILO (2013). World Report on Child Labour Economic vulnerability, social protection and the fight against child labour. Geneva.
Johansson, J. (2009). Causes of child labour: A
case study in Babati town, Tanzania.
Södertör University College| School of Life Sciences Bachelor’s Thesis 15 ECTS| Global Development | Spring term 2009Sodertornshogskola, Sodertorn Unversity.
Lana, O. (2014). Child labour; the effect on child,
causes and remedies to the revolving
menace. MSc thesis in Department of Human Geography University of Lund, Sweden.
National Population Commission (NPC) (1963, 1991, 2006, 2016). Population Census of the Federal Republic of Nigeria. Analytical Report at the NPC, Abuja, Nigeria.
Oladimeji, Y. U., Abdulsalam, Z., Damisa, M. A. and Omokore, D.F. (2015a). Determinants of participation of rural farm households in non-farm activities in Kwara state, Nigeria: A paradigm of poverty alleviation. Ethiopian J. of Env. Studies
and Mangt, 8(6): 635 – 649. Oladimeji, Y. U., Abdulsalam, Z., Ajao, A. M. and
Adepoju, S. A. (2015b).Determinant of Rural Household Poverty Nexus Fuel Consumption among Fisherfolks in Kwara State, Nigeria. Journal of Scientific
Research and Reports, 7(3): 185-194. Oladimeji, Y. U., Abdulsalam, Z, and Oyewole, S.
O. (2017). Determinants of Fast Food Consumption among Government Employees of Kwara State, in Ayinde et
al. Conference Proceeding of the 18th Annual Conf. of Nigeria Assoc. of Agric. Econs. held at Fed. University of Agric, Abeokuta, Nigeria 16th – 19th Oct. 2017. Pp. 907-913.
Quattri, M. and Watkins, K. (2016). Child labour and education: A survey of slum settlements in Dhaka. Overseas Development Institute. http://www.odi.org. 76pp.
Reardon, T., Berdeque, J. and Esual, J. (2001). Rural Non-farm employment and income in Latin America. Overview and policy implication: World Development, 29 (3): 592-547.
Sen, A. (1999). Development as Freedom. Oxford: Oxford University Press.
Tobin, J. (1958). Estimation of Relationship for Limited Dependent Variables. Econometrical 26: Pp 26-36.
United Nations International Children’s Emergency Fund ,UNICEF, (2016). For every child health, education, equity, protection for advance humanity, UNICEF publication
Nigerian Journal of Rural Sociology Vol. 18, No. 2, 2018
90
SUSTAINABILITY OF THE YOUTH AGRICULTURE EMPOWERMENT PROGRAMMES IN OSUN
AND OYO STATES
Tijani, S. A. Department of Agricultural Extension and Rural Development, University of Ibadan, Ibadan, Nigeria
Correspondence e-mail: [email protected]
ABSTRACT The problem of youth unemployment in Nigeria necessitated both the federal and state governments to introduce several empowerment programmes particularly in agriculture in order to enhance the economic capacity of youths. However, some of these programmes barely outlive the political regime that initiated them. Meanwhile, Osun youth empowerment programme has been acclaimed to be a model copied by other local and international organisations. Therefore, this study investigated sustainability of youth empowerment programmes in agriculture in Osun and Oyo States. Three (3) Local Government Areas (LGA) with 25% of the beneficiaries were selected randomly from each of the two states to give a total of 260 respondents. Data were collected using structured questionnaire and analysed using descriptive and inferential statistics at α0.05. The study revealed more male participation in the programme in both states, high formal education with mean age of 28.2 (Osun) and 31.5 years (Oyo). Major benefit derived by respondents was positive attitudinal change towards agriculture (Osun=96.1%, Oyo= 73.5%) and job opportunity (Osun=91.6%, Oyo=87.4%) Respondents’ level of participation in the programme was low (Osun=56.1%, Oyo= 58.4%), 60.6% and 89.3% in Osun and Oyo respectively perceived the programme to be unsustainable. Inadequate funding, lack of post empowerment support and monitoring were the major constraints to sustainability There was a significant relationship between benefits derived (r = 0.398) by respondents’ in Oyo, constraints in both states (Osun =0.243, Oyo = 0.855) and sustainability of the programme. The youth empowerment programme in agriculture in both states was adjudged unsustainable. Monitoring and evaluation process as well as, appropriate legislation to insulate the programme from political shocks should be included from onset. Keywords: Youth empowerment, agriculture, sustainability, unemployment
INTRODUCTION
The agricultural sector has been described as the engine for economic growth and improved livelihoods in Africa (Diao, Hazell, and Thurlow, 2007; World Bank 2006) because the majority of the population in sub-Saharan Africa depends directly or indirectly on it (Diao et al., 2007). Agwu and Kadiri (2014) identified agricultural sector in Nigeria as the segment that is most critical to the achievement of the elusive goal of a diversified economy. It has equally been seen as a tool for job creation, income generation and maintenance of sustainable livelihood. In addition, agricultural and rural development constitutes an important factor in alleviating poverty in any economy particularly in Nigeria where poverty is a rural phenomenon. However, most of the world’s food is produced by ageing smallholder farmers in developing countries like Nigeria, such older farmers are less likely to adopt the new technologies needed to sustainably increase agricultural productivity and ultimately feed the growing world population (Food and Agricultural Organisation of United Nations (FAO, 2014). Meanwhile, youths are the future of every society. In agriculture, youths perform the most tedious jobs in the farm. Rural youth contribute to family labour (White, 2012); they also constitute a moving force in the development of their communities (Ekong, 2003) but they have the impression that agricultural production can rarely be a profitable venture. To correct this impression,, there is urgent need to teach them the importance
and prospects in farming in order to increase the farming population. Hence, the renewed zeal by all tiers of government to re-engage youth in agriculture. Furthermore, as Nigeria grapples with the problem of unemployment among youths in the country (Abefe-Balogun, 2015), the Federal Government and various states in the country have designed and executed several empowerment programmes particularly in agriculture to enhance the economic capacity of youths (Umeh and Odo, 2002). Such programmes include; National Poverty Eradication Programme (NAPEP), Youth Initiative for Sustainable Agriculture (YISA), Youth Integrated Training Farm (Kwara State), Agricultural Youths Empowerment Scheme (AGRIC-YES), Graduate Farmers Scheme, Osun Youth Empowerment Scheme (O-YES) and youth empowerment scheme of Oyo state (YES-O) to mention a few. The empowerment programme embarked on by the Osun State government has been acclaimed to be a model copied by other local and international organisations such as World Bank Youth Employment and Social Support Operations (YESSO) programme (Osun Defender, 2014). O-YES is a palliative livelihood programme with the aim of ensuring food security, job creation and economic transformation using agriculture as a key driver. The agricultural aspect of the scheme include: Osun Broiler Outgrowers Production Scheme (O’BOPS), O’ Beef/O’ Ram programme to exploit cattle/sheep rearing business, Osun Rural Enterprise and Agricultural Programme (O’ REAP)

Nigerian Journal of Rural Sociology Vol. 18, No. 2, 2018
91
for food production and food security and O’Germany for sponsoring the travelling of selected youth to Germany for capacity building in modern farming techniques. The programme did not only target youths who are seen as engines of economic and social development but also primary school children who are enjoying free feeding (O’Meal). In the same vein, YES-O was inaugurated to reduce youth unemployment in the state by acquiring the necessary skills for a period of one year to enable them fit-in for job placements and entrepreneurship. YES-O covered six pivot components which include: Environment, Works and Transportation, Emergency, Health, Agriculture and Education. The agricultural component was charged with the responsibility of providing extension services to farmers, ensuring increase crop and animal production under the administrative control of the ministry of agriculture. However, experience has shown that these programmes that is, government empowerment programmes barely outlive the administration that initiated them. More so, that Osun and Oyo states are facing dire economic challenges in the form of dwindling economic fortune. This implies that sustainability of the programme could be threatened as a result of the economic downturn. The ripple effects of the economic challenge may definitely affect the states’ agricultural empowerment Programme (Ogunlela, 2015). The pertinent question is, how will the states cope with the sustenance of the programmes in the face of the protracted economic crunch they are currently facing? There is urgent need to determine if the programme has been insulated from other envisaged and unforeseen situations such as regime change, market dynamics, and instability in government policy, which may occur upon the expiration of the incumbent administration. Sustainability evaluation of project and programmes will provide guidance and guarantee the ultimate aim of ensuring the lasting development impact in the society while saving resources such that the ripple effect of the development programmes extend to generation yet unborn. The study was guided by the following specific objectives; 1. identify the benefits derived from youth empowerment programmes in agriculture by the respondents; 2. describe the sources of information available to the beneficiaries of the empowerment programme; 3. ascertain the level of satisfaction of the respondents about the programme; 4. examine perceived sustainability of the programmes and 5. determine constraints to the sustainability of the empowerment programmes.
The study assumed that no significant relationship exists between socioeconomic characteristics of respondents' benefits derived from the programme, level of satisfaction of the respondents about the programme and perceived sustainability of the programme in both states.
METHODOLOGY
The study was carried out in Osun and Oyo states. Both states are located in southwestern Nigeria with population of over 3million and 5,591,589 respectively (NPC 2006). Osun state occupies a land mass of approximately 14,875km2
while Oyo occupies approximately 28, 454km2 (NBS, 2013). The major occupation in both states is farming and they are dominated by Yoruba ethnic tribe. The land tenure system, originally communal in nature, has long given way to individual tenure in both states. Population of the study comprised of all beneficiaries of youth empowerment programme in agriculture in both states. A multi-stage sampling procedure was used in the selection of respondents for this study. In the first stage, simple random sampling was used to select three LGAs from each of the three senatorial districts in Osun state. The selected LGAs are Ife central LGA, Atakunmosa West LGA and Obokun LGA from Osun east senatorial district; Boluwaduro LGA, Olorunda LGA and Boripe LGA from Osun central senatorial district and Ede North LGA, Iwo LGA and Egbedore LGA from Osun west senatorial district. In the second stage, 25% of the total beneficiaries in the selected LGAs were randomly selected amounting to 130 respondents (45 out of 180, 33 out of 130 and 52 out of 210 in the selected LGAs in Osun east senatorial district, Osun central senatorial district and Osun west senatorial district respectively using proportionate sampling). In Oyo state however, the list of beneficiaries (380 in all) was obtained from the state coordinator out of which 34% of these beneficiaries were randomly selected to give a total of 130 respondents as in Osun state. The total sample size for the study was 260 respondents. Data was collected from respondents using structured questionnaire and analysed using descriptive statistics, PPMC and t-test at α0.05. Respondents’ level of satisfaction with the empowerment programme was measured using eight items (e.g Time for practical and entire programme, relevance of training to the enterprise, the training method adopted, mode of selecting beneficiaries etc) on a three-point scale of satisfactory = 2, moderately satisfactory = 1 and not satisfactory = 0. Mean of the scores was computed and used to classify level of satisfaction into high and low satisfaction. Sustainability was taken as perceived sustainability and it was measured by providing respondents with a set of 26

Nigerian Journal of Rural Sociology Vol. 18, No. 2, 2018
92
statements on sustainability in four main domains (economic, political, ownership and technical) using 5-point likert- type scale of strongly agree = 5, agree = 4, undecided = 3, disagree = 2 and strongly disagree = 1. Sustainability index was computed and the empowerment programme was categorised as sustainable and unsustainable using mean (Osun = 65.2, Oyo = 58.4) as benchmark. Constraints to sustainability were measured as either a constraint = 1 or not a constraint = 0. Mean was obtained and used to rank constraints according to severity.
RESULT AND DISCUSSION
Personal characteristics Table 1 shows that the mean age of respondents in Osun was 28.2years while that of Oyo was 31.5years. It shows that Youths in Osun state were more younger than their counterpart in Oyo state. Nevertheless, most of the respondents in Osun (75.7%) and Oyo (95.3%) states were between the ages of 21 and 40 years. This shows that the programmes in each state captured youths, who are the intended beneficiaries especially within the context of prolonged youth age and postponed transition to adulthood. This might also explain the reason behind participation of overwhelming majority (92.1%) of beneficiaries in Osun state in
Osun Broilers Out-growers Production Schemes (O’BOPS) which is stressful but less capital intensive. This also can be said to make respondents in Oyo to fit into any available activity irrespective of its energy requirement such as cultivation of maize, cassava, soybean, bee, vegetable, snail, extension activity and processing because these activities are energy driven and could only be effectively accomplished by young vibrant individuals. Youths are generally known for their activeness and energy to which Odubola (2009) asserted that it makes them more viable for agricultural activities. More males were involved in the programmes in the two states; Osun (78.7%) and Oyo (76.8%). This confirms the commonly held notion that agriculture is male dominated, owing to its energy demanding nature. This agrees with the finding of Oladele and Kareem (2003) that males are readily available for energy demanding jobs like agriculture. Majority of the respondents (Osun, 68.5% and Oyo, 76.2%) had at least 13 years of formal education. However, the inclusion of beneficiaries with no formal education shows that the programmes do not discriminate based on someone’s educational status. This is also pointing to the fact that, many criteria might have been used in the selection of the beneficiaries.
Table 1: Personal characteristics of respondents
Variables Osun Oyo Mean
Age
20 and below 21-30 years
19.7 59.2
4.6 40.0
Osun = 28.2
31-40 years 16.5 51.5 Oyo = 31.5 40 and above 4.7 3.8 Sex Male 78.7 76.8 Female 21.3 23.2 Years of schooling No formal education 5.5 3.1 1-6 (primary education) 13.4 6.2 Osun = 11.4 7-12 (secondary education) 17.3 14.6 Oyo = 11.9 Above 12 (tertiary education) 63.5 76.2 Programme participated O' BOPS O’GERMANY
92.1 7.9
- -
Membership of association Yes 86.6 44.6 No 13.4 55.4
Benefits derived by respondents from the
programmes Table 2 shows that while 100.0% of the respondents in Osun indicated skill acquisition as benefit, skill acquisition was a benefit to 81.5% in Oyo. The participants are taught requisite farming skills during training via which they are empowered for self-sustenance. All agricultural
activities inculcates practical training to the recipients, thus acquisition of skill in this programme will make respondents to be self-sufficient in all areas of life thus encouraging sustainability of the programme. This aligns with Idoko (2014), who retorted that training through skill acquisition and capacity building programmes will enhance the sustainability of the youths in

Nigerian Journal of Rural Sociology Vol. 18, No. 2, 2018
93
different fields of endeavour. Agriculture is widely known to provide employment to people, to which 91.3% (Osun) and 87.4% (Oyo) of the participants attested to, which translates to a means of alleviating poverty for 85.8% (Osun) and 76.0% (Oyo) thereby helping to boost the self-esteem and
confidence of 98.4% (Osun) and 84.7% (Oyo) of them. Hence, agriculture is a field of study that prepare people for gainful employment and enables one to carry out successfully a socially “useful occupation.
Table 2: Distribution of respondents based on benefits derived from programmes
Benefits Derived Osun Oyo Skill acquisition 100.0 81.5 Self Esteem and confidence 98.4 84.7 Positive change in attitude towards agriculture as a vocation
96.1 73.5
Provision of job opportunities 91.3 87.4 Alleviation of poverty 85.8 76.0 Additional Qualification 81.1 55.5 Access to Fund/capital 71.7 40.0 Linkage to market 70.1 61.5 Linkage to input supplier 66.1 71.4 Multiple responses
Source: Field survey, 2016
Sources of information on farming enterprise
Table 3 shows that the respondents received relevant information concerning agriculture at varying intervals from various sources. Results show that while professional associations was ranked the most primal source of agricultural information in Osun (mean=1.60), radio was ranked 1st in Oyo. This suggests that professional associations provide easy and convenient access to agricultural information, as members of such associations are profit-driven partners in the execution of the programmes with government. Therefore, timely, genuine, relevant and reliable information are supplied to respondents so as to enhance their enterprise profitability, which also enhances the profit of the professional associations
as well. Radio a popular channel for communicating agricultural and non-agricultural information ranked 2nd in Osun state. However, extension agent ranked 6th and 4th in Osun and Oyo respectively indicates its unpopularity as a source of agricultural information in the study areas. This might be due to shortage of public agricultural extension agent (extension to farmer ratio; 1:1000) and unwillingness of farmers to patronize private extension agent due to the perception of agricultural extension information as a public good in Nigeria. Ahmad, Akram, Rauf, Khan and Pervez (2007) also observed that the role of extension field staff in dissemination of agricultural information was not significant and their interaction with farmers was meagre.
Table 3: Distribution of respondents based on sources of agricultural information
Sources of Information Osun Oyo
Mean Rank Mean Rank
Professional associations Radio
1.60 1.52
1st 2nd
1.24 1.55
3rd 1st
Television 1.50 3rd 1.32 2nd Newspapers 1.35 4th 1.19 5th Mobile devices 1.31 5th 1.19 5th Extension Agents 1.19 6th 1.23 4th Input Dealers 1.03 7th 0.4 6th
Source: Field survey, 2016
Areas and level of satisfaction with programmes Table 4 shows that the aspect of the programme that the respondents were mostly satisfied with time given to practical classes as it was ranked highest (mean=1.72), followed by time spent on empowerment training (mean=1.70) for Osun. Comparatively, these were respectively ranked last, that is, 8th (mean=0.56) and 6th
(mean=1.12) for Oyo. It is evident that the beneficiaries in Osun relished instances of programmes activities that involved hands-on practical or physical demonstration of such activities that engage more of their senses and are capable of arousing their interest and sustainability of the empowerment programme with the respondents, which was not so with the

Nigerian Journal of Rural Sociology Vol. 18, No. 2, 2018
94
beneficiaries in Oyo. Contrastingly, the beneficiaries in Oyo were most pleased with training method adopted for the programmes (ranked 1st with mean of 1.53) and they considered training obtained relevant to their enterprises (ranked 2nd, mean=1.5), whereas Osun beneficiaries ranked them 6th (mean=1.42) and 5th (mean=1.50) respectively. Apparently, this infers specificity of the agricultural programmes to beneficiaries’ needs in Oyo relative to Osun. Nevertheless, it is pertinent to note that a high level of satisfaction can lead to an increase in their
productivity (Wagner and Harter, 2006) and consequently sustainability of the empowerment programme. Table 5 further shows that the level of satisfaction about the youth empowerment in agriculture program was high in Osun and low in Oyo states. This could be attributed to the organised nature of the empowerment programme in Osun state as it was observed that participants in Osun had varieties of activities and areas of specializations as opposed that of Oyo state.
Table 4: Areas of satisfaction with the empowerment programme
Statements Osun Oyo
Mean Rank Mean Rank
Time given to practical classes 1.72 1st 0.56 8th Attitude of other beneficiaries during training 1.70 2nd 1.34 4th Time spent for empowerment training 1.70 2nd 1.12 6th Coordination of the empowerment programme 1.61 3rd 1.06 7th The mode of selecting beneficiaries 1.52 4th 1.42 3rd Relevance of training to the enterprise 1.50 5th 1.51 2nd The training method adopted for the programme 1.42 6th 1.53 1st Personal assessment of Trainers’ competence 1.40 7th 1.14 5th Source: Field survey, 2016 Table 5: Level of satisfaction with the empowerment programme
States Categories Freq. Percent Mean Max.
value
Min.
value
Osun Low (5.0-10.8) 59 45.3 11.12±3.2 16 5 High (10.9-16.0) 71 54.7 Oyo Low (3-8.2) 67 51.5 11.12±3.2 13 3 High (8.3-13.0) 63 48.5
Perceived sustainability of programmes Table 6 shows the beneficiaries’ perception towards the sustainability of youth empowerment programmes in agriculture. Relating to economic sustainability, statement on access to factors of production had the highest mean (4.30) in Osun, while in Oyo it had the lowest mean (1.60). The statement that some beneficiaries are only after the grants promised by government was 3rd (mean=2.00) and 4th (mean=3.39) in Oyo and Osun respectively. Such set of beneficiaries can be likened to free-riders who, according to Albert (2000), are usually the unintended beneficiaries of a socially provided public good. They as a result channel any grant received into other non-agricultural ventures. Results on the perceived political sustainability of the programmes showed that the statement on enactment of relevant policies to support the survival of the programmes had the highest mean scores (Osun=4.28, Oyo=4.20) in both states. This corroborates an earlier finding on the uncertainty over the political environment to support programme continuity in the country, a trend that
keeps recurring as a result of a systemic policy problem and continues to be a bane to effective agricultural development. Concerning ownership sustainability, a similar trend was observed as the statement on beneficiaries benefitting more when there is a positive programme outcome had the highest mean scores (Osun=4.01, Oyo=4.30) in both states. This will give the impression to the beneficiaries that they are stakeholders of the programmes, which would make them to assiduously work towards achieving the stated objectives of the programmes. The perception of respondents on the technical sustainability of the programmes in agriculture reveals that statements on the programmes could have done more in equipping beneficiaries with the skills to undertake agricultural projects and need of task force to recommend areas of programmes requiring improvement had the highest (mean=4.06) and joint second highest (mean=4.01) mean scores in Osun but the statements respectively came out second highest (mean=4.10) and highest (mean=4.20) in Oyo.

Nigerian Journal of Rural Sociology Vol. 18, No. 2, 2018
95
Table 6: Perceived sustainability of youth empowerment scheme in agriculture Dimensions of sustainability Osun (mean) Oyo (mean)
Economic sustainability
1. Access to factors of production such as land, capital and inputs could be a challenge if government fails to provide them.
4.30 1.60
2. My enterprise may be incapable of meeting my needs if there is no further support from government.
3.95 2.10
3. Expansion for increased profitability may not be possible in my business enterprise without continuous help from government.
3.67 3.00
4. Some beneficiaries seem to be after the grants promised by the government rather than being trained to be self-reliant.
3.39 2.00
Political sustainability 1. There seem to be laws in place to ensure the continuity of the programme
from one regime to another. 3.24
2.50
2. The programme is seen to be more of political propaganda; therefore it may be discontinued by next government.
3.55 2.05
3. More relevant government policies need to be enacted to support the programme for its survival.
4.28 4.20
4. The government seems to be fulfilling all its promises, to ensure success of the programme.
2.12 3.40
5. The programme might fail because many of the achievements claimed are untrue.
3.55 2.60
6. Government seems committed to building on the successes of the programme.
3.53 3.10
7. Constitutional amendment processes are required to scrap the programme.
3.17 2.70
8. The programme may be scrapped as soon as the incumbent government leaves office.
3.66 1.90
Ownership sustainability 1. The government is willing to bear the loss in case of negative outcomes. 2.74 2.60 2. The programme appears to benefit all, despite party affiliations. 2.30 2.90 3. Beneficiaries benefit more when there is positive result. 4.01 4.30 4. It appears beneficiaries cannot make decision on the enterprise without
approval from the government 3.65 3.50
5. The programme may be a sheer waste of time of beneficiaries as people view the programme as political campaign rather than to empower them
3.42 2.20
Technical sustainability 1. The programme could have done better in equipping beneficiaries with
the skills to undertake agricultural projects. 4.06 4.10
2. There ought to be a special task force established to recommend areas requiring improvement in the programme.
4.01 4.20
3. Non-governmental organisations (NGOs) should get more involved in the programme.
4.01 3.80
4. There seems to be adequate resources to empower the beneficiaries 2.20 2.50 5. Infrastructures appear to be available to be used by beneficiaries. 2.29 2.60 6. The experience gathered looks insufficient to manage and maintain a
bigger farm enterprise 3.72 2.40
7. The programme may not achieve set objectives as it is a means to perpetrate corruption by the state government
3.47 3.50
8. Beneficiaries seem capable to source market for produce if government fails to buy.
2.33 3.00
9. The beneficiaries could take advantage of cooperatives formed to access more governmental support
1.84 3.40
Source: Field survey, 2016.

Nigerian Journal of Rural Sociology Vol. 18, No. 2, 2018
96
Table 7: Categorisation of perceived sustainability of Osun-YE programmes in agriculture
Sustainability Percentage Minimum Maximum Mean
Unsustainable (Below mean)
60.6 49.00 87.00 61.8
Sustainable (Mean and above)
39.4
Field survey, 2016
Table 8: Categorisation of perceived sustainability of Oyo-YE programme in agriculture
Sustainability Percentage Minimum Maximum Mean
Unsustainable (Below mean)
89.3 44.00 76.00 61.8
Sustainable (Mean and above)
10.7
Field survey, 2016
Constraints to sustainability of programmes
As shown in Table 9, inadequate funding was ranked as the primal constraint affecting the sustainability of the programmes in Osun but second in Oyo state. This is because fund is essential to the success of any program/project/activities without which the empowerment programme will drag, there will be lack of equipment or facilities to organise the training effectively, payment of trainers and money to support the trainees to take-off/ put what has learnt into practice and this will greatly affect sustainability of the programme. Meanwhile uncertainty over the political environment to support continuity of programmes was ranked 3rd and 4th respectively in Osun and Oyo. In Nigeria in particular, regime change implies non funding or scrabing of programmes initiated by the previous government no matter how laudable they are thus, resulting in collapse of such programmes. Hence, lack of continuity in government programme(s) means unsustainability of the programme. These findings are quite germane as Salako and Badmus (2014) stated that most government’s empowerment programmes often fail to achieve the targeted goal due to inadequate funding. Relating to policy issue, International Institute of Tropical Agriculture (IITA) (2005) advanced that overtime policy instability, policy inconsistencies, narrow
base of policy formulation, poor policy implementation and weak institutional framework for policy coordination have remained constraints to effective agricultural development. Meanwhile, in Osun and Oyo respectively, poor post-empowerment support was ranked 2nd and 3rd while inadequate monitoring and evaluation of the beneficiaries was ranked 4th and 1st. All the constraints identified by the respondents revolved round the issue of funding such as monitoring and evaluation that involve cost of transportation, feeding and sometimes accommodation. In line with these, Jide (2009) asserted that government does not always give programme participants support such as grant or loan to establish their own enterprises and also fail to provide an enabling environment after conclusion of programmes. Additionally, it is reported that government employment programmes do not always have adequate supervision (Akinremi and Sonaiya, 2009), which results in poor service delivery. It is interesting to point out that simultaneously in the two states, negative attitude of other beneficiaries during training, favouritism in the process of selecting beneficiaries which accounted for some beneficiaries of more than 40years of age as youth and Inadequate access to Agricultural Knowledge and Information Systems were ranked 5th, 7th and 11th respectively.
Table 9: Constraints to the sustainability of the empowerment programmes
Osun Oyo
Constraints Mean Rank Mean Rank
Inadequate fund or capital support by the government. 0.81 1st 0.92 2nd Poor post-empowerment support by the government 0.72 2nd 0.82 3rd Uncertainty over the political environment to support continuity 0.69 3rd 0.81 4th Inadequate monitoring and evaluation of the beneficiaries 0.59 4th 0.94 1st Negative attitude of other beneficiaries during training 0.58 5th 0.68 5th Non-payment for the produce purchased by government 0.58 5th 0.26 12th Favouritism in the process of selecting beneficiaries 0.56 7th 0.52 7th Present means/method of extension service delivery 0.56 7th 0.48 8th Programme is fraught with excessive bureaucracy 0.55 9th 0.53 6th
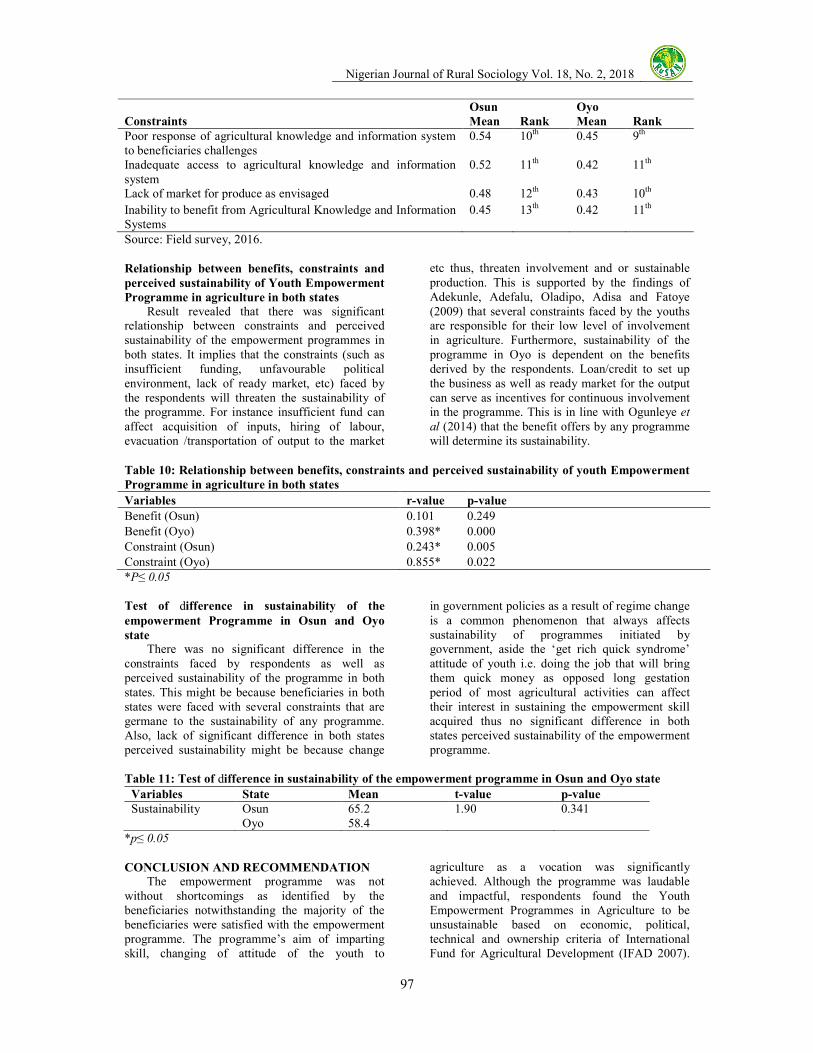
Nigerian Journal of Rural Sociology Vol. 18, No. 2, 2018
97
Osun Oyo
Constraints Mean Rank Mean Rank
Poor response of agricultural knowledge and information system to beneficiaries challenges
0.54 10th 0.45 9th
Inadequate access to agricultural knowledge and information system
0.52 11th 0.42 11th
Lack of market for produce as envisaged 0.48 12th 0.43 10th
Inability to benefit from Agricultural Knowledge and Information Systems
0.45 13th 0.42 11th
Source: Field survey, 2016.
Relationship between benefits, constraints and
perceived sustainability of Youth Empowerment
Programme in agriculture in both states
Result revealed that there was significant relationship between constraints and perceived sustainability of the empowerment programmes in both states. It implies that the constraints (such as insufficient funding, unfavourable political environment, lack of ready market, etc) faced by the respondents will threaten the sustainability of the programme. For instance insufficient fund can affect acquisition of inputs, hiring of labour, evacuation /transportation of output to the market
etc thus, threaten involvement and or sustainable production. This is supported by the findings of Adekunle, Adefalu, Oladipo, Adisa and Fatoye (2009) that several constraints faced by the youths are responsible for their low level of involvement in agriculture. Furthermore, sustainability of the programme in Oyo is dependent on the benefits derived by the respondents. Loan/credit to set up the business as well as ready market for the output can serve as incentives for continuous involvement in the programme. This is in line with Ogunleye et
al (2014) that the benefit offers by any programme will determine its sustainability.
Table 10: Relationship between benefits, constraints and perceived sustainability of youth Empowerment
Programme in agriculture in both states
Variables r-value p-value
Benefit (Osun) 0.101 0.249
Benefit (Oyo) 0.398* 0.000
Constraint (Osun) 0.243* 0.005
Constraint (Oyo) 0.855* 0.022 *P≤ 0.05
Test of difference in sustainability of the
empowerment Programme in Osun and Oyo
state There was no significant difference in the constraints faced by respondents as well as perceived sustainability of the programme in both states. This might be because beneficiaries in both states were faced with several constraints that are germane to the sustainability of any programme. Also, lack of significant difference in both states perceived sustainability might be because change
in government policies as a result of regime change is a common phenomenon that always affects sustainability of programmes initiated by government, aside the ‘get rich quick syndrome’ attitude of youth i.e. doing the job that will bring them quick money as opposed long gestation period of most agricultural activities can affect their interest in sustaining the empowerment skill acquired thus no significant difference in both states perceived sustainability of the empowerment programme.
Table 11: Test of difference in sustainability of the empowerment programme in Osun and Oyo state
Variables State Mean t-value p-value
Sustainability Osun Oyo
65.2 58.4
1.90 0.341
*p≤ 0.05
CONCLUSION AND RECOMMENDATION The empowerment programme was not without shortcomings as identified by the beneficiaries notwithstanding the majority of the beneficiaries were satisfied with the empowerment programme. The programme’s aim of imparting skill, changing of attitude of the youth to
agriculture as a vocation was significantly achieved. Although the programme was laudable and impactful, respondents found the Youth Empowerment Programmes in Agriculture to be unsustainable based on economic, political, technical and ownership criteria of International Fund for Agricultural Development (IFAD 2007).

Nigerian Journal of Rural Sociology Vol. 18, No. 2, 2018
98
Youth empowerment scheme in agriculture of Oyo state did not get it right from onset because beneficiaries were not given opportunity to decide on what they want to be empowered on. Thus, putting sustainability of the programme in a great doubt. Based on the findings, the following are recommended; 1. Subsequent programme should be gender sensitive in order to balance male to female enrolment. 2. There must be viable link between beneficiaries and extension agent in order to enhance productivity. 3. There may be need for Osun state government to substitute O’Germany (that is, sponsoring the travelling of some (40) youths to Germany for capacity building in modern farming technique) with a less expensive and relevant empowerment programme. 4. Government, development experts and donor agencies must ensure that sustainability of programme is taken into cognizance at every level of the programme and incorporation of monitoring and evaluation from the beginning so as to prevent wastage of resources. 5. Appropriate legislation to insulate the programme from political shocks should be included from onset.
REFERENCES
Abefe-Balogun, B. (2015). Osun State Youth Empowerment Scheme: A key to Sustainable Development. Journal of
Economics and Sustainable Development 6(9): 260-267.
Adekunle, O. A., Adefalu, L. L., Oladipo, F. O., Adisa, R. S., and Fatoye, A. D. (2009). Constraints to youths’ involvement in agricultural production in Kwara State, Nigeria. Journal of Agricultural Extension 13(1), 102-108.
Agwu, M. E, and Kadiri, I. (2014). Analysis of critical strategic factors for the successful implementation of poverty alleviation programmes in Nigeria. International
Journal of Computational Engineering
and Management, Vol. 17(1) 1–9 Ahmad, M., Akram, M., Rauf, R., Khan, I.A. and
Pervez, U. (2007). Interaction of Extension Worker with Farmers and Role of Radio and Television as Sources of Information in Technology Transfer: A Case Study of Four Villages of District Peshawar and Charsadda. Sarhad J.
Agric., 23, 515-518. Akinremi, S. and Sonaiya, A. (2009). Rural-Urban
Socio Economic Link; The Example of Migration is Modern Migration in West
Africa. Oxford University of Press, London, p129.
Albert, H. (2000). Agricultural Service Systems: A
Framework For Orientation. Eschborn; Germany. Pp 7.
Diao, X., Hazell, P., and Thurlow. J. (2007). “The Role of Agriculture in African Development” World Development 38(10): 1375-1383.
Ekong, E. E. (2003). An Introduction to rural sociology. Dove educational publishers, Uyo, Nigeria. Pp213-320.
FAO (2014). The State of Food Insecurity in the World Strengthening the Enabling Environment for Food Security and Nutrition. Rome, FAO.
Idoko, C. U. (2014). Skill Acquisition and Youth Empowerment in Nigeria. Global Journal
of Commerce and Management
Perspective 3(1): 51-54. Accessed www.gifre.org 6th of August 2016.
IFAD (2007). Quality Enhancement for Project Design: Guidelines for Internal Project Review. Programme Management Department. Rome, www.ifad.org/actionplan/deliverables/qe.pdf.
International Institute of Tropical Agriculture (IITA) (2005). Agriculture in Nigeria: Identifying Opportunities for Increased commercialization and investment.
Jide, S. S. (2009). Cross Examination of Income Generating Activities Among Youths in Southwestern Nigeria. Journal of
Economics.Vol.3(3) 56-61 National Bureau of Statistics (2013). The Nigeria
Poverty Profile, Abuja: NBS Odubola, P. (2009). Prospecting for Strategic
Advantage: The Proactive Entrepreneurial Personality and Small Firm Innovation. Journal of Small Business Management,
New York. Vol 40.pp. 85-97. Ogunlela, J. (2015). Perspective: Putting Osun
State’s Salary Challenge in a Fairer Context. The Nation Newspaper, Nigeria. Retrieved online from www.the nation online ng.net July 3rd 2015.
Oladele, I. O., and Kareem, A. I. (2003). Adoption
Rate and Continued Use of Selected
Arable Crop Technologies among
Farmers in Oyo State. Journal of Food,
Agriculture and Environment. 3: 291-294
Osun Defender (2014). Aregbesola clinches independent man of the year award with a bang. Tuesday February 25, 2014 Vol 9, No. 024 www.osundefender.org
Salako, A. and Badmus, O. P. (2014). Strategic
Management of Small firms in Hostile and Benign Environments. Strategic
Management Journal, 10, 75-87.

Nigerian Journal of Rural Sociology Vol. 18, No. 2, 2018
99
Umeh, G. N., and Odo, B. I. (2002). Profitability of Poultry Production among School Leavers in Anocha Local Government Area of Anambra State, Nigeria. Nigeria Journal
of Animal Production 29: 76-80. Wagner, R. and Harter, J. K. (2006). The Elements
of Great Managing, 12: New York: Gallup Press.
White, B. (2012). Agriculture and the generation problem: Rural youth, employment and the future of farming. Presented at the
FAC – ISSER Conference ― Young People, Farming and Food, Accra, Ghana.
World Bank (2006). "Africa Development Indicators." Retrieved from http://siteresources.worldbank.org/INTWDR2008/Resources/2795087-1191427986785/StaatzJandDembeleN_AgriForDevtInSSA_ve19.pdf on 18th February

Nigerian Journal of Rural Sociology Vol. 18, No. 2, 2018
100
REPORTAGE OF FORESTRY-RELATED ISSUES IN SELECTED NIGERIAN NEWSPAPERS
Badiru, I. O., Akanbi F. S. and Obar, E. E. Department of Agricultural Extension and Rural Development, University of Ibadan, Ibadan
Correspondence e-mail address: [email protected]
ABSTRACT
Sustainable forest management is central to reducing climate change impact. The media can help impress this importance on the minds of policymakers and the general public. However, the extent to which the media is carrying out its agenda-setting role in this respect is not absolute. This study, therefore, examined the reportage of forestry-related issues in Nigerian newspapers. A purposive sampling technique was used to select three Nigerian daily newspapers (Punch, Guardian and Vanguard) that have wide readership and report on forestry-related issues. The study was carried out between 1st January and 31st June 2016. Data on type of issues reported, the frequency of reportage, space allotted and placement was collected and analysed using frequency counts, percentages and mean and Analysis of Variance (ANOVA). The result of the findings show that more than half of the forest-related issues reported were on public awareness (64.7%) with the modal frequency of reportage being11-20days (41.2%) while modal space allotted was 66-767cm2(76.5%). All issues (100%) were placed on the inner pages. Forestry related issues were not adequately covered in the newspapers. The study recommends that Government sponsor or subsidise forest related news in Nigerian newspapers to increase their reportage. Keywords: Agenda-setting, forestry news, forest-resource management, newspaper reportage, sustainability.
INTRODUCTION
Background
Climate change is a topical issue confronting the human race in the 21st century. The effects of climate change are pervasive and cut across many development agendas such as poverty eradication, health care, economic growth and risk reduction. With the global increase in temperature and the attendant rise in the sea levels, human settlement, livelihoods, lives, biodiversity, food security, infrastructure and properties have been adversely affected (Idowu, Ayoola, Opele and Ikenweiwe, 2011). These effects are enormous, particularly in developing countries because of the limited ability to prepare for and cope with its impacts. In addition, the projections of climate change are worrisome and present an enormous development challenge. However, sound scientific studies show that climate change can be averted since humans mainly induce it through mishandling forests and its resources (Owusu, 2016). As a result of this, the clarion call for the elimination of this menace is underscored in the Sustainable Development mantra. In order to assuage the destructive impacts associated with climate change, sustainable forest management practices have been identified as part of the significant mitigation strategies. Experts in climate studies have drawn a nexus between forests management and climate change mitigation (Food and Agriculture Organisation (FAO, 2008), Black and Hendrick, 2009, Archana, 2013, Rodney, 2015). However, solving the challenges of climate change through forest management requires a shift from sole knowledge of experts to public awareness and knowledge of forest management practices which can be achieved through the media. The catastrophic effects of climate extremes make it a core media issue. This is because the media is a powerful tool for bringing about social
change by shaping public perception and translating science into easily understandable forms for policy formulation (Weingart, Engels and Pansegrau, 2000; Ukonu, Akpan and Anorue, 2012). In addition to this, the crucial roles of the media in our contemporary society make it an ideal tool for communicating forest-related issues. Hence, climate actions through sustainable forest management can be expedited by media such as newspapers, television, radio stations and the internet through twitter, Facebook, blog articles and instagram. Among these media of disseminating forest-related issues, the newspapers are durable, fashionable and vital channel to reach decision makers, policy makers and opinion leaders (GreenCom, 2001). Newspapers can frame issues in a way as to attract the audience. They tend to be educative and timely in providing the latest local and global issues (Chowdhury and Halder, 2016). Furthermore, newspapers are capable of controlling economic and political powers by providing a platform for public discussion and debates thus, providing societal guidance and direction. Issues commonly discussed in newspapers may centre on developmental issues such as health, education and agriculture (Yushau, 2014) and environment. There are also evidences of the report of news items centred on politics, education, sports, business, religion, entertainment, arts, culture and environment. As a result of the global attention given to climate change, experience has shown that issues related to management of trees, forest and the ecosystem have gain prominence in most national dailies in Nigeria. Thus, it is not uncommon to see issues bothering on sustainable forest conservation practices and its importance and the perils associated with indiscriminate exploitation of forest resources (Dana, 2008). One of the ways

Nigerian Journal of Rural Sociology Vol. 18, No. 2, 2018
101
newspapers inform and educate the public about issues is framing, which means the way a message is shared and received (Taylor, 2011). The manner in which forestry-related news and stories are framed can attract the attention of readers and, thus, the consumption of such news. Studies conducted by Oso (2006), Galadima (2006), Nwabueze (2007) and Moeti, Maraisane and Marou (2008) and Ukonu, Akpan and Anorue (2012) posit that development issues such as agriculture, climate change mitigation, environmental and sustainable forest management were not given priority in Nigerian newspapers as reflected in the daily, weekly and monthly reportage. This low priority is worrying given the fact that Africa will be one of the hardest hit areas in the coming decades (Mare, 2011). Furthermore, given the urgency of climate change, it cannot be categorically stated that the Nigerian newspaper's reporting of forestry-related issues as a method of climate change mitigation reflects this urgency. Moreover, given the fact that newspapers are commercial products and the stories they carry can make or mar the sale of the paper, it becomes imperative to determine how forestry-related issues are framed in Nigerian newspapers. Therefore, this study intends to find out whether forestry-related issues as a strategy of climate change mitigation is adequately represented in Nigerian newspaper. It is against this background that this study was designed to: 1. find out the type of forestry-related issues
reported in selected newspapers, 2. assess the frequency of reportage of forestry-
related issues in the selected newspapers; 3. determine the space allotted to forestry-related
issues in the selected newspapers and 4. find out the placement/prominence of forestry-
related issues in selected newspapers.
METHODOLOGY This study employed content analysis as its research method. All the national daily newspapers in Nigeria made up the population for content analysis. Out of these, three national daily newspapers (The Punch, Guardian and Vanguard) were purposively selected based on their full
coverage of readers and total bias in news reportage as affirmed by Nigerian Guild of Editors (2010). The study was carried out between 1st January to 30th June 2016. Therefore, the selected newspaper articles within this period formed the total sample for the study. Thus, newspaper articles for this study were gathered from the Kenneth Dike Library, University of Ibadan (research library database) using keywords ‘forest-related issues'. Type of forest-related issues were nominally categorised as forest hazard, forest awareness, forest crime, sustainability. The frequency of forest-related issues was based on the number of times forestry-related issues were covered across the newspapers investigated from 1st January – 30th June 2016. (Interval) The Space allotted was determined by measuring the total area allotted to forest-related issues covered in each edition of the newspapers. This was collected at an interval level measured in cm2. Placement/Prominence of forest-related issues was determined based on whether the news items were placed on the front page, middle page or back page. This was measured at ordinal level. Data were analysed using descriptive statistics such as frequency counts, percentages, mean and standard deviation and inferential statistics such as Analysis of Variance (ANOVA).
RESULTS AND DISCUSSION
Type of forest-related issues reported in the
selected newspapers The result in Table 1 shows that more than half (64.7%) of forest-related issues in the three (3) newspapers centred on public awareness, (60%) of forest-related issues reported in the Punch newspaper was on forest hazards, while (87.5%) and (50.0%) of forest-related news reported in the Guardian and Vanguard newspapers were based on public awareness respectively. This implies that information dissemination on forest issues to the public was probably intended to increase their awareness of the consequences of over-exploitation of forest resources which could help reduce climate change
Table 1: Distribution of type of forest-related issues reported in the selected newspaper
News type Punch Guardian Vanguard Total
F % F % F % F %
Hazard 3 60.0 1 12.5 0 0.0 4 23.5
Public awareness 2 40.0 7 87.5 2 50.0 11 64.7
Sustainability 0 0.0 0 0.0 1 25.0 1 5.88
Crime 0 0.0 0 0.0 1 25.0 1 2.88
Total 5 100.0 8 100.0 4 100.0 17 100.0
Source: Field Survey, 2016
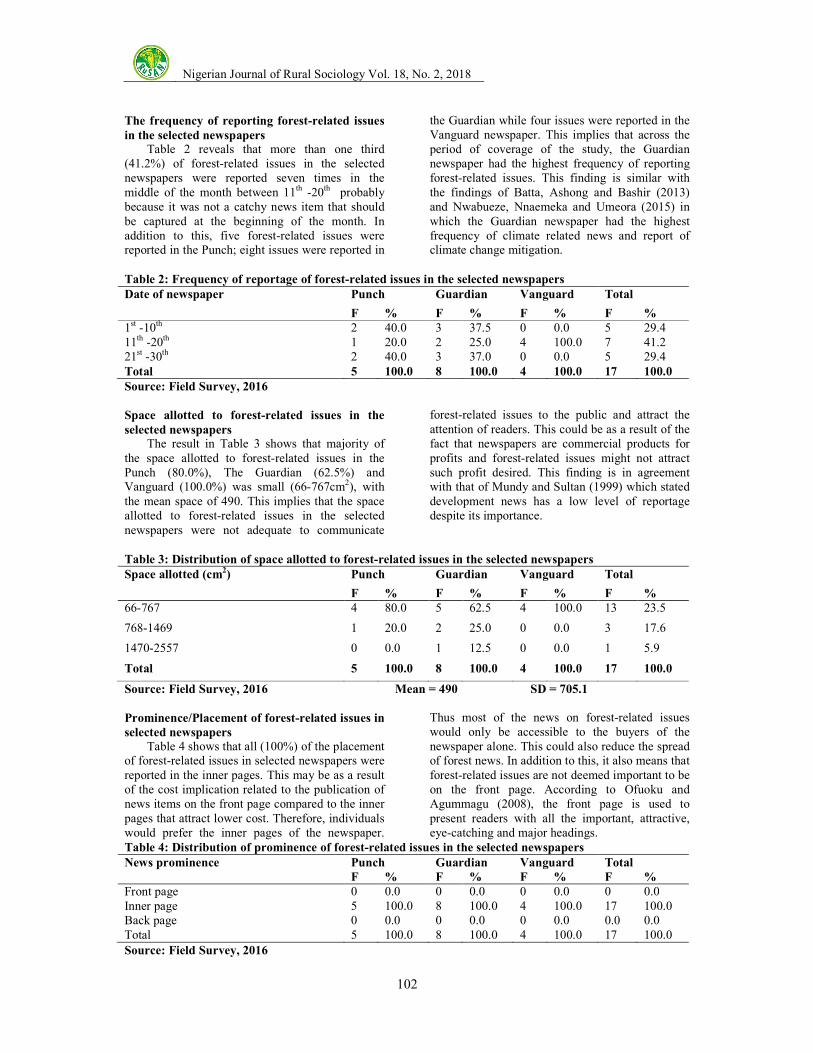
Nigerian Journal of Rural Sociology Vol. 18, No. 2, 2018
102
The frequency of reporting forest-related issues
in the selected newspapers Table 2 reveals that more than one third (41.2%) of forest-related issues in the selected newspapers were reported seven times in the middle of the month between 11th -20th probably because it was not a catchy news item that should be captured at the beginning of the month. In addition to this, five forest-related issues were reported in the Punch; eight issues were reported in
the Guardian while four issues were reported in the Vanguard newspaper. This implies that across the period of coverage of the study, the Guardian newspaper had the highest frequency of reporting forest-related issues. This finding is similar with the findings of Batta, Ashong and Bashir (2013) and Nwabueze, Nnaemeka and Umeora (2015) in which the Guardian newspaper had the highest frequency of climate related news and report of climate change mitigation.
Table 2: Frequency of reportage of forest-related issues in the selected newspapers
Date of newspaper Punch Guardian Vanguard Total
F % F % F % F %
1st -10th 2 40.0 3 37.5 0 0.0 5 29.4 11th -20th 1 20.0 2 25.0 4 100.0 7 41.2 21st -30th 2 40.0 3 37.0 0 0.0 5 29.4 Total 5 100.0 8 100.0 4 100.0 17 100.0
Source: Field Survey, 2016
Space allotted to forest-related issues in the
selected newspapers The result in Table 3 shows that majority of the space allotted to forest-related issues in the Punch (80.0%), The Guardian (62.5%) and Vanguard (100.0%) was small (66-767cm2), with the mean space of 490. This implies that the space allotted to forest-related issues in the selected newspapers were not adequate to communicate
forest-related issues to the public and attract the attention of readers. This could be as a result of the fact that newspapers are commercial products for profits and forest-related issues might not attract such profit desired. This finding is in agreement with that of Mundy and Sultan (1999) which stated development news has a low level of reportage despite its importance.
Table 3: Distribution of space allotted to forest-related issues in the selected newspapers
Space allotted (cm2) Punch Guardian Vanguard Total
F % F % F % F %
66-767 4 80.0 5 62.5 4 100.0 13 23.5
768-1469 1 20.0 2 25.0 0 0.0 3 17.6
1470-2557 0 0.0 1 12.5 0 0.0 1 5.9
Total 5 100.0 8 100.0 4 100.0 17 100.0
Source: Field Survey, 2016 Mean = 490 SD = 705.1
Prominence/Placement of forest-related issues in
selected newspapers
Table 4 shows that all (100%) of the placement of forest-related issues in selected newspapers were reported in the inner pages. This may be as a result of the cost implication related to the publication of news items on the front page compared to the inner pages that attract lower cost. Therefore, individuals would prefer the inner pages of the newspaper.
Thus most of the news on forest-related issues would only be accessible to the buyers of the newspaper alone. This could also reduce the spread of forest news. In addition to this, it also means that forest-related issues are not deemed important to be on the front page. According to Ofuoku and Agummagu (2008), the front page is used to present readers with all the important, attractive, eye-catching and major headings.
Table 4: Distribution of prominence of forest-related issues in the selected newspapers
News prominence Punch Guardian Vanguard Total
F % F % F % F %
Front page 0 0.0 0 0.0 0 0.0 0 0.0 Inner page 5 100.0 8 100.0 4 100.0 17 100.0 Back page 0 0.0 0 0.0 0 0.0 0.0 0.0 Total 5 100.0 8 100.0 4 100.0 17 100.0
Source: Field Survey, 2016

Nigerian Journal of Rural Sociology Vol. 18, No. 2, 2018
103
Test of hypothesis Test of difference in space allotted to forestry-related issues in the selected newspaper. Table 5 reveals that there was no significant difference (F = 1.28, P = 0.309) in the space allotted to forestry-
related issues in the selected newspapers. This implies that forest news reported had similar space allotment in the selected newspapers. This could make the readers of the newspaper see the news in an almost similar manner.
Table 5: Test of difference in space allotted to forestry-related issues in the selected newspapers
Sum of squares Df Mean Square F P-value Decision
Between groups 1228631.12 2 614315.56 1.28 0.309 NS Within groups 6726921.83 14 480494.42 Total 7955552.94 16
Source: Field Survey, 2016
CONCLUSIONS AND RECOMMENDATIONS Based on the findings of this study, the following conclusions were made: The frequency of reporting forestry-related issues in the selected newspapers was generally low, so also the spaces allotted and their prominence. Public awareness issues, however, dominated the reportage issues. Based on the findings, the Government should sponsor or subsidise forestry-related news in Nigerian newspapers to increase their reportage given its importance in reducing the effects of climate change.
REFERENCES
Archana, K. (2013). Impact of deforestation on climate change.Journal of Environmental
Science, Toxicology and Food
Technology, 4(2), 24-28. www.iosrjournals.org
Batta, H.E., Ashong, A. C. and Bashir, A. S. (2013). Press coverage of climate change issues in Nigeria and implications for public participation opportunities. Journal
of sustainable development, 6(2), 56-69. http://dx.doi.org/10.5539/jsd.v6n2p56.
Black, K. And Hendrick, E. (2009).Climate change and Irish Forestry. Cosford Connect, No. 9. www.coford.ie
Chowdhury, S. and Halder, S. (2016).Educational dissemination through newspaper daily. Journal of Education and Practice, 7(7), 1-12.
FAO (2008). Forests and climate change. FAO Newsroom.www.fao.org
Galadima, A. J. (2006). Coverage of environmental issues and problems by Nigeria news magazines. The Nigeria Journal of
Communications, 4(1 & 2), 92-99. GreenCom (2001). Environmental education and
communication (EE & C) for behaviour change. Its role in forest, water and biodiversity resource management for sustained economic growth in Bolivia. Environmental education and
communication (GreenCom) Project, pg. 106
Idowu, A. A., Ayoola, S. O., Opele, A. I. And Ikenweiwe, N. B. (2011). Impact of climate change in Nigeria. Iranian Journal
of Energy and Environment, 2(2), 145-152 Mare, A. (2011). Climate change, mediation and
mediatisation in Southern Africa: Towards climate and environmental journalism. Africa Adapt symposium, Addis Ababa, Ethiopia.
Moeti, L., Maraisane, V. and Marou, T. (2008).Mass media and the environment in Lesotho. In V. Agbanu and C. Nwabueze. Readings in mass communications: Global perspectives on communication issues. Owerri: Top Shelve Publishers, pp. 144-155
Mundy, P. and Sultan, J. (1999).Information revolutions, Wageningen CTA.
Nigerian Guild of Editors (2010).Quality of Newspapers in Nigeria. A summit on quality newspapers in Nigeria held on the 17th of October, 2013 in Abuja, Federal Capital Territory.
Nwabueze, C. (2007). Environmental
communication: Perspectives on green
communications and information
management. Enugu: Daisy Press Nwabueze, C., Nnaemeka, D. and Umeora, D.
(2015). Nigerian newspapers’ coverage of climate change issues. European Scientific
Journal, 11(17), 171-184 Oso, I. (2006). Framing the environment: Press
coverage of environmental problems. The Nigerian Journal of Communication, 4(1 & 2), pp.66-77
Owusu, M. (2016).Gender vulnerability to climate change and livelihood security in urban slum communities in Accra, Ghana. Department of Geography, Environment and Population. The University of Adelaide.
Rodney, J. K. (2015). Climate change impacts and adaptations in forest management: a review. Annals of Forest Science,

Nigerian Journal of Rural Sociology Vol. 18, No. 2, 2018
104
Springer Verlag/EDP Sciences, 72(2), 145-167
Ukonu, M. O., Akpan, C. S. and Anorue, L. I. (2012). Nigerian Newspaper Coverage of Climate Change, 2009-2010. Journal of
New Media and Mass Communication, 5, 22-37.
Weingart, P., Engels, A. and Pansegrau, P. (2000). Risks of communication: Discourses on
climate change in science, politics and the mass media. Public understanding of science, 9, 261-283
Yushau, A. (2014). Nigerian newspapers and the coverage of developmental issues: An analysis of This Day and Daily Trust Newspapers