Nigerian Gross Domestic Product Report · Introduction 2 Nigerian Gross Domestic Product Report Q2...
98
Nigerian Gross Domestic Product Report (Q2 2019) Data Source: National Bureau of Statistics Report Date: September 2019
Transcript of Nigerian Gross Domestic Product Report · Introduction 2 Nigerian Gross Domestic Product Report Q2...
Nigerian Gross Domestic Product Report
(Q2 2019)
Data Source: National Bureau of Statistics
Report Date: September 2019

Content
Preface
Introduction 2
Overview of GDP in Second Quarter 2019 3
1
Oil Sector 4
Methodology 81
Non-Oil Sector 5
Major Economic Sectors: Q2 2019 8
Appendix 90
Acknowledgements/Contact 96

This publication provides data on Quarterly Gross Domestic Product (GDP) estimates for the four quarters
of 2018, the annual figure for 2018, as well as the first and second quarters of 2019.
Quarterly National Accounts (QNA) are integrated system of macroeconomic accounts designed to
describe the entire system of production in a nation on a quarterly basis. They provide a picture of the
current economic status of the economy that is more timely and frequent than that provided by Annual
National Accounts (ANA). The key attribute of QNA is that they provide a reasonable level of detail of the
economy that help government to assess, analyse, and monitor economic growth on a regular basis.
QNA adopts the same concepts, definitions and structure as ANA. In principle QNA covers the entire
sequence of accounts and balance sheets as reflected in the 2008 System of National Accounts (2008 SNA).
Data for this analysis were obtained from the Quarterly Establishment Survey (QES) conducted by the
National Bureau of Statistics (NBS). This series covers major aggregates of quarterly GDP by kind of
economic activities at current and constant (2010) prices.
We are grateful to the various agencies and establishments that made their data available as input to the
estimates.
Preface
Nigerian Gross Domestic Product Report Q2 20191
Dr. Yemi Kale,
Statistician – General,
National Bureau of Statistics,
Abuja – Nigeria.
August, 2019.

The National Bureau of Statistics (NBS), has been conducting Establishment Surveys to provide data for the
estimation of the Gross Domestic Product (GDP) for the country. In 2008, NBS started to improve the GDP
series by conducting Quarterly Establishment Surveys (QES) for the four quarters of each year to
complement the annual surveys which normally take place in the first quarter of the succeeding year.
In 2018, the National Bureau of Statistics (NBS) conducted the Quarterly Establishment Surveys for the
first three quarters of 2018 (Q1-Q3/ 2018), while the fourth quarter survey for 2018, the first and second
quarter survey for 2019 were conducted in 2019. These surveys produced the data that was used for the
compilation of the quarterly GDP for the four quarters of 2018(Q1 – Q4, 2018), the first and second
quarters of 2019.
In subsequent sections of this report, emphasis will be given to the composition of GDP in the second
quarter of 2019 and the corresponding quarter in 2018. We will also be looking at the immediate past
quarter of 2019 (Q1 2019).
Introduction
2Nigerian Gross Domestic Product Report Q2 2019

Nigeria’s Gross Domestic Product (GDP) grew by 1.94%(year-on-year) in real terms in the second quarter of
2019. Compared to the second quarter of 2018, which recorded a growth of 1.50%, the growth observed in
Q2 2019 indicates an increase of 0.44% points. When compared to 2.10% (revised from 2.01% due to oil
output revisions) recorded in the first quarter of 2019 however, the Q2 2019 real growth rate indicates a
decline of –0.16% points.
During the quarter, aggregate GDP stood at N34,944,151.61 million in nominal terms, an increase of
13.83% over the performance in the second quarter of 2018 and 9.8% over the preceding quarter. The
performance observed in Q2 2019 follows an equally strong first quarter performance, and was likely aided
by stability in oil output as well as the successful political transition. Overall, a total of 15 activities grew
faster in Q2 2019 relative to last year, while 13 activities had higher growth rates relative to the preceding
quarter. On a half year basis, real growth in the first half of 2019 stood at 2.02%, higher than in 2018 which
was 1.69%. Quarter on quarter, real GDP increased by 2.85% compared to a decline of –13.69% in the
preceding period. For better clarity, the Nigerian economy has been classified broadly into the oil and non-
oil sectors.
Overview of GDP in Q2 2019
3
Figure1: Real GDP Growth
Nigerian Gross Domestic Product Report Q2 2019

Figure 2: Crude Oil Output (MBPD)
In Q2 2019, Nigeria recorded average daily oil production of 1.98million barrels per day (mbpd), or 7.6%
higher than the daily average production of 1.84mbpd recorded in the same quarter of 2018 but slightly less
than output recorded in Q1 2019 (1.99mbpd-revised from 1.96 mbpd).
The Oil Sector
4
The oil sector posted a real growth rate of 5.15% (year-on-year) in Q2 2019, representing a 9.10% points
increase relative to the rate recorded in the corresponding quarter of 2018. It also indicates an increase of
6.61% points when compared to Q1 2019(revised). Quarter-on-Quarter, the oil sector recorded a growth
rate of –1.55% in Q2 2019.
The sector contributed 8.82% to total real GDP in Q2 2019, up from levels recorded in the corresponding
period of 2018 but down compared to the preceding quarter,
Nigerian Gross Domestic Product Report Q2 2019
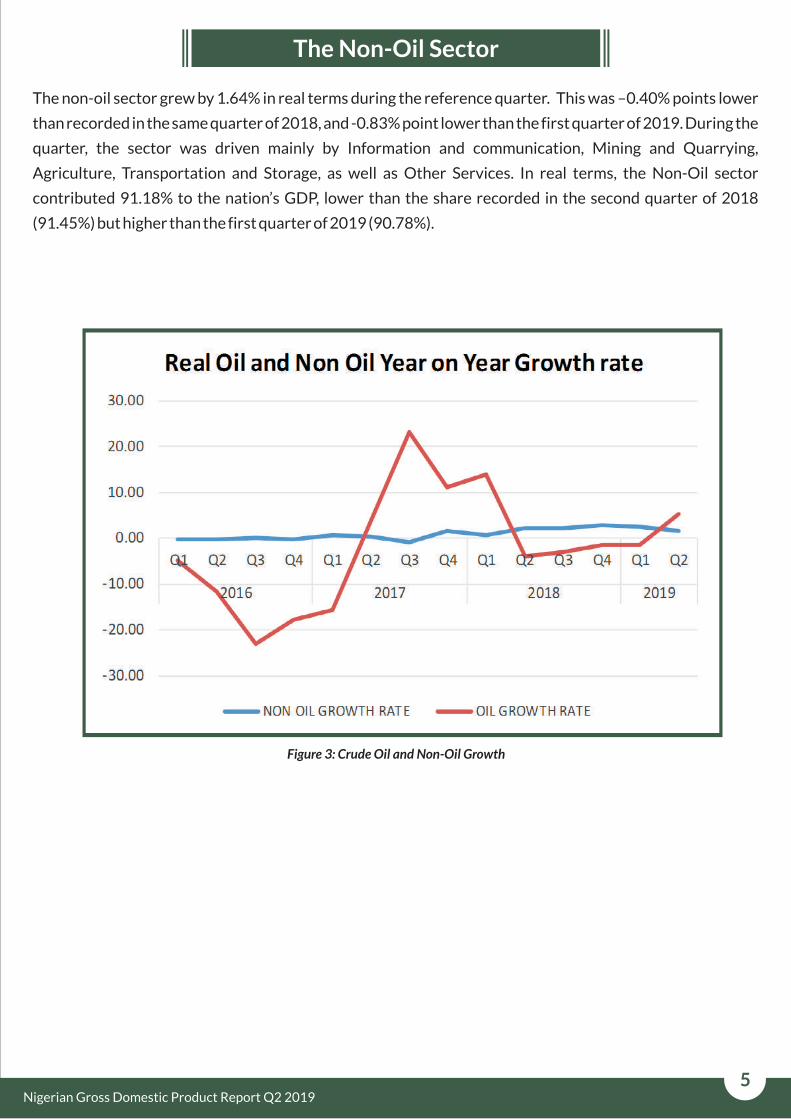
Figure 3: Crude Oil and Non-Oil Growth
The Non-Oil Sector
The non-oil sector grew by 1.64% in real terms during the reference quarter. This was –0.40% points lower
than recorded in the same quarter of 2018, and -0.83% point lower than the first quarter of 2019. During the
quarter, the sector was driven mainly by Information and communication, Mining and Quarrying,
Agriculture, Transportation and Storage, as well as Other Services. In real terms, the Non-Oil sector
contributed 91.18% to the nation’s GDP, lower than the share recorded in the second quarter of 2018
(91.45%) but higher than the first quarter of 2019 (90.78%).
5Nigerian Gross Domestic Product Report Q2 2019

GDP REPORT Q2 2019
REAL QUARTERLY GDP GROWTH FOR Q2 2019 AT
1.94%
(FROM 2.10% IN Q1 2019)
N34.94 trillion
NOMINAL GDP
(Q2 2019)
N16.90 trillion
REAL GDP
(Q2 2019)
YEARLY GDP GROWTH RATE
2011 2012 2013 2014 2015
5.31%
4.21%
5.49%
6.22%
2.79%
2016 2017
0.82%
-1.58%
2018
1.91%
6Nigerian Gross Domestic Product Report Q2 2019
Q2 2017 Q3 2017 Q4 2017
0.72%1.17%
1.89%1.50% 1.81%
Q1 2018 Q2 2018 Q3 2018
2.11%
Q4 2018
2.38%
Q1 2019
2.10% 1.94%
Q2 2019
GDP REPORT Q2 2019
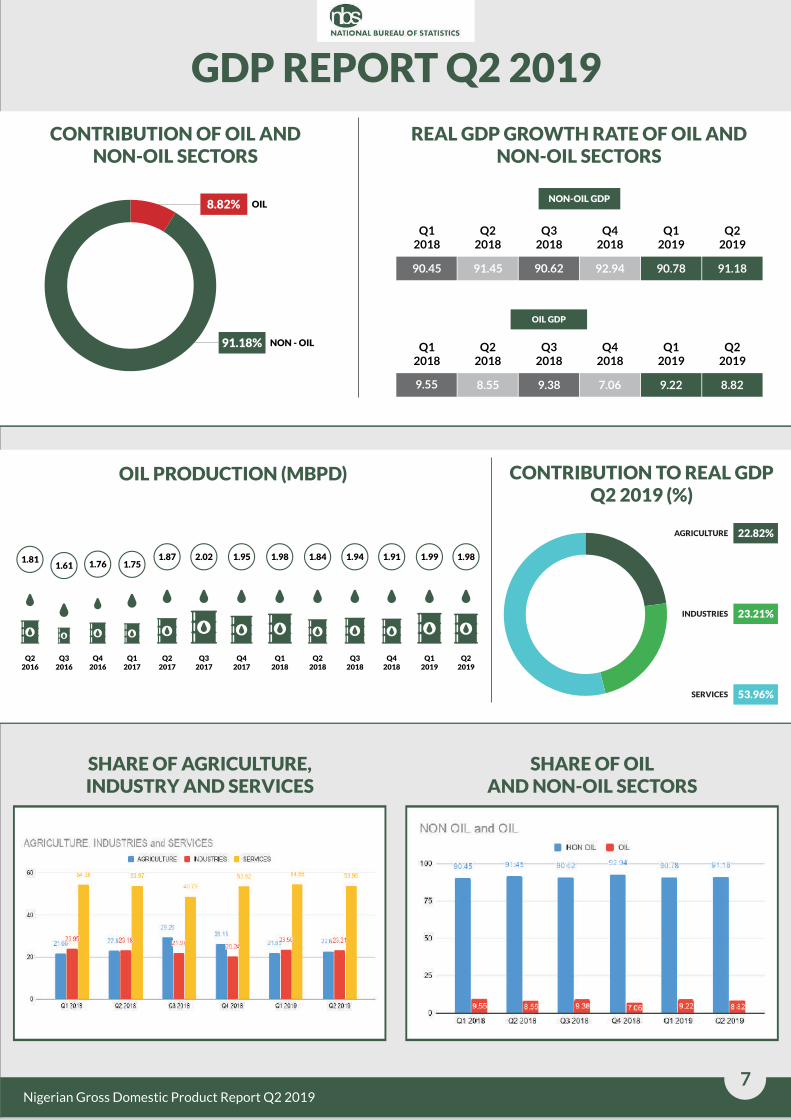
CONTRIBUTION OF OIL AND NON-OIL SECTORS
REAL GDP GROWTH RATE OF OIL AND NON-OIL SECTORS
CONTRIBUTION TO REAL GDP Q2 2019 (%)
SHARE OF AGRICULTURE, INDUSTRY AND SERVICES
SHARE OF OIL AND NON-OIL SECTORS
8.82% OIL
91.18% NON - OIL
OIL PRODUCTION (MBPD)
22.82%
23.21%
53.96%
AGRICULTURE
INDUSTRIES
SERVICES
NON-OIL GDP
7Nigerian Gross Domestic Product Report Q2 2019
OIL GDP
Q12018
9.55 8.55 9.38
Q22018
Q32018
Q42018
7.06
Q12019
9.22
Q12018
90.45 91.45 90.62
Q22018
Q32018
Q42018
92.94
Q12019
90.78
Q22019
8.82
Q22019
91.18
Q2 2016
Q3 2016
Q4 2016
1.811.61 1.76
Q1 2017
1.75
Q2 2017
1.87
Q3 2017
2.02
Q4 2017
1.95
Q1 2018
1.98
Q2 2018
1.84
Q3 2018
1.94
Q42018
1.91
Q12019
1.99
Q22019
1.98

Major Economic Sectors: Q2 2019
8
Mining & Quarrying
The Mining & Quarrying sector consists of Crude Petroleum and Natural Gas, Coal Mining, Metal ore and
Quarrying and other Minerals sub-activities. In nominal terms, the sector grew by –18.35% (year on year) in
Q2 2019. Quarrying and other minerals exhibited the highest growth rate of all the sub-activities at 67.65%,
followed by coal production at 28.76%. However, Crude Petroleum and Natural gas remained the most
dominant activity in the sector (97.22%). The Mining & Quarrying sector contributed 8.84% to aggregate
GDP in the second quarter of 2019, lower than the contributions recorded in Q2 2018 (12.32%) and the
previous quarter (9.98%).
In real terms, the Mining and Quarrying sector grew by 5.02% (year-on-year) during the second quarter of
2019. This was 8.85% points higher compared to the same quarter of 2018 and 6.38% points higher than the
first quarter of 2019. On a quarter on quarter basis, the growth rate recorded was –0.72%. The contribution
of Mining and Quarrying to Real GDP stood at 8.97%, slightly higher than 8.71% recorded in the
corresponding quarter of 2018 but lower than 9.29% recorded in the first quarter of 2019.
Figure 4: Mining and Quarrying real growth
Nigerian Gross Domestic Product Report Q2 2019

Mining and Quarrying sector
Mining and Quarrying Sector: Q1 2018 – Q2 2019
Mining and Quarrying sector grew by 5.02% in Q2 2019 from -
1.37% in Q1 2019 and -1.23% in Q4 2018.
GDP REPORT Q2 2019
9Nigerian Gross Domestic Product Report Q2 2019

Crude Petroleum
Crude Petroleum and Natural Gas: Q1 2018 – Q2 2019
GDP REPORT Q2 2019
Crude Petroleum and Natural Gas under Mining And
Quarrying sector grew by 5.15% in Q2 2019 from -1.46% in Q1
2019 and -1.62% in Q4 2018.
10Nigerian Gross Domestic Product Report Q2 2019
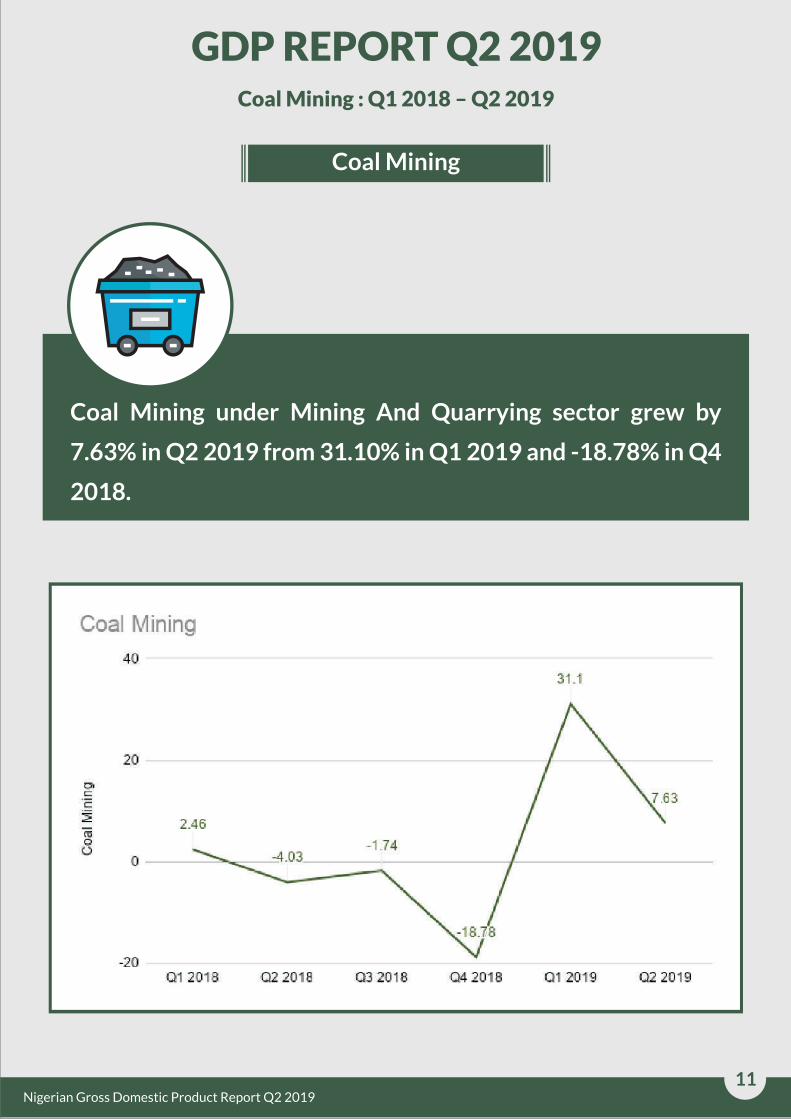
Coal Mining
Coal Mining : Q1 2018 – Q2 2019
Coal Mining under Mining And Quarrying sector grew by
7.63% in Q2 2019 from 31.10% in Q1 2019 and -18.78% in Q4
2018.
GDP REPORT Q2 2019
11Nigerian Gross Domestic Product Report Q2 2019
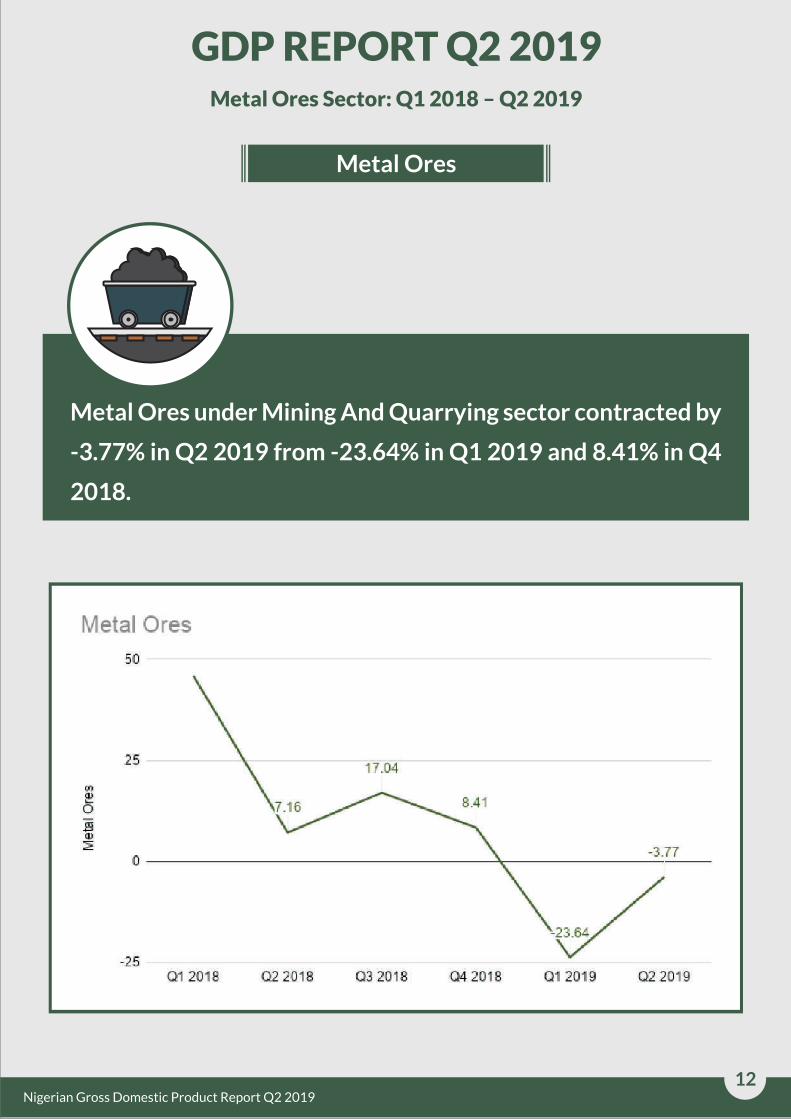
Metal Ores
Metal Ores Sector: Q1 2018 – Q2 2019
Metal Ores under Mining And Quarrying sector contracted by
-3.77% in Q2 2019 from -23.64% in Q1 2019 and 8.41% in Q4
2018.
GDP REPORT Q2 2019
12Nigerian Gross Domestic Product Report Q2 2019
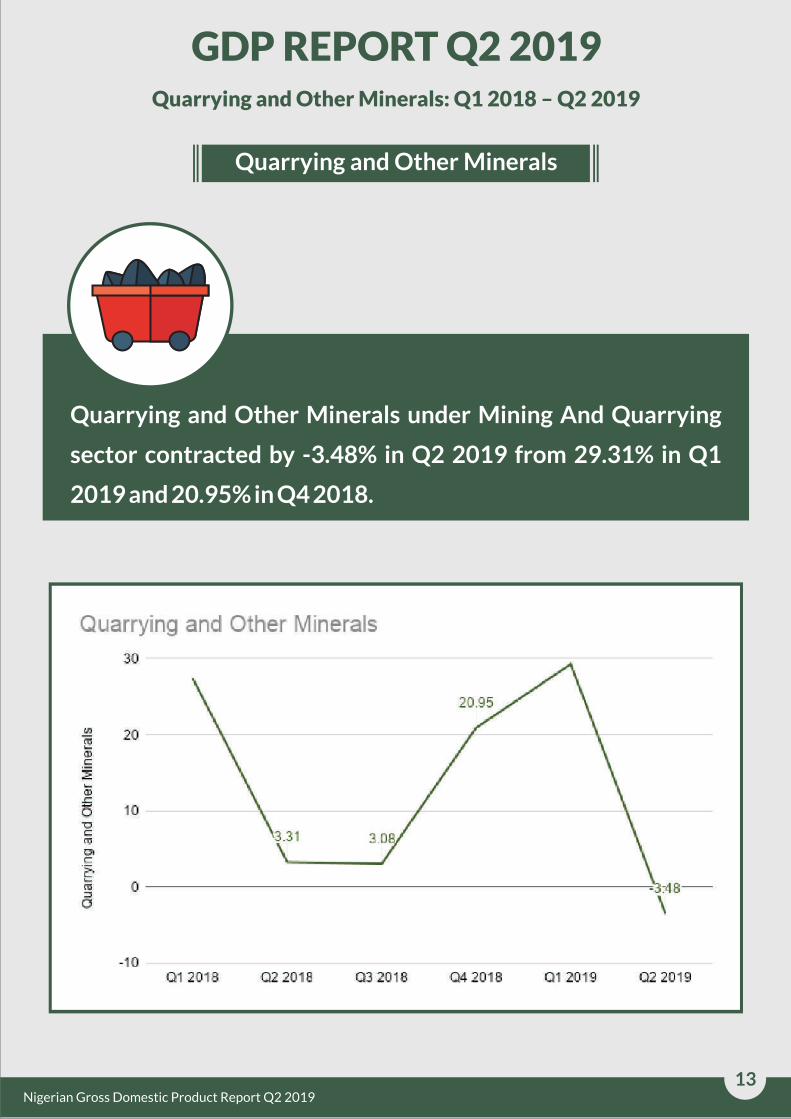
Quarrying and Other Minerals
Quarrying and Other Minerals: Q1 2018 – Q2 2019
Quarrying and Other Minerals under Mining And Quarrying
sector contracted by -3.48% in Q2 2019 from 29.31% in Q1
2019 and 20.95% in Q4 2018.
GDP REPORT Q2 2019
13Nigerian Gross Domestic Product Report Q2 2019
14
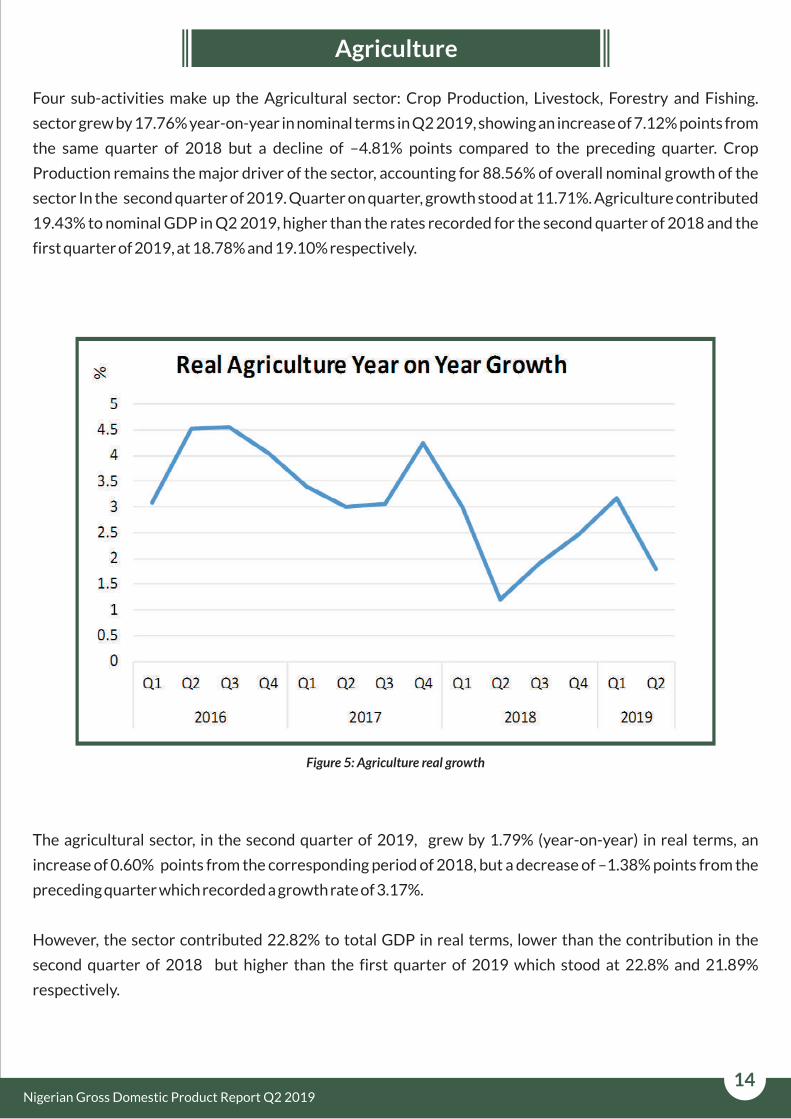
Agriculture
Four sub-activities make up the Agricultural sector: Crop Production, Livestock, Forestry and Fishing.
sector grew by 17.76% year-on-year in nominal terms in Q2 2019, showing an increase of 7.12% points from
the same quarter of 2018 but a decline of –4.81% points compared to the preceding quarter. Crop
Production remains the major driver of the sector, accounting for 88.56% of overall nominal growth of the
sector In the second quarter of 2019. Quarter on quarter, growth stood at 11.71%. Agriculture contributed
19.43% to nominal GDP in Q2 2019, higher than the rates recorded for the second quarter of 2018 and the
first quarter of 2019, at 18.78% and 19.10% respectively.
Figure 5: Agriculture real growth
The agricultural sector, in the second quarter of 2019, grew by 1.79% (year-on-year) in real terms, an
increase of 0.60% points from the corresponding period of 2018, but a decrease of –1.38% points from the
preceding quarter which recorded a growth rate of 3.17%.
However, the sector contributed 22.82% to total GDP in real terms, lower than the contribution in the
second quarter of 2018 but higher than the first quarter of 2019 which stood at 22.8% and 21.89%
respectively.
Nigerian Gross Domestic Product Report Q2 2019

Agriculture sector
Agriculture: Q1 2018 – Q2 2019
Agriculture sector grew by 1.79% in Q2 2019 from 3.17% in Q1
2019 and 2.46% in Q4 2018.
GDP REPORT Q2 2019
15Nigerian Gross Domestic Product Report Q2 2019

Crop production under agriculture sector grew by 1.94% in Q2
2019 from 3.27% in Q1 2019 and 2.48% in Q4 2018.
Crop Production
Crop Production: Q1 2018 – Q2 2019
GDP REPORT Q2 2019
16Nigerian Gross Domestic Product Report Q2 2019

Livestock under agriculture sector contracted by -0.01% in Q2
2019 from 0.88% in Q1 2019 and 2.35% in Q4 2018.
Livestock
Livestock: Q1 2018 – Q2 2019
GDP REPORT Q2 2019
17Nigerian Gross Domestic Product Report Q2 2019

Forestry under agriculture sector grew by 3.23% in Q2 2019
from 2.19% in Q1 2019 and 1.73% in Q4 2018.
Forestry
Forestry: Q1 2018 – Q2 2019
GDP REPORT Q2 2019
18Nigerian Gross Domestic Product Report Q2 2019

Fishing under agriculture sector grew by 1.09% in Q2 2019
from 7.09% in Q1 2019 and 1.97% in Q4 2018.
Fishing
Fishing: Q1 2018 – Q2 2019
GDP REPORT Q2 2019
19Nigerian Gross Domestic Product Report Q2 2019
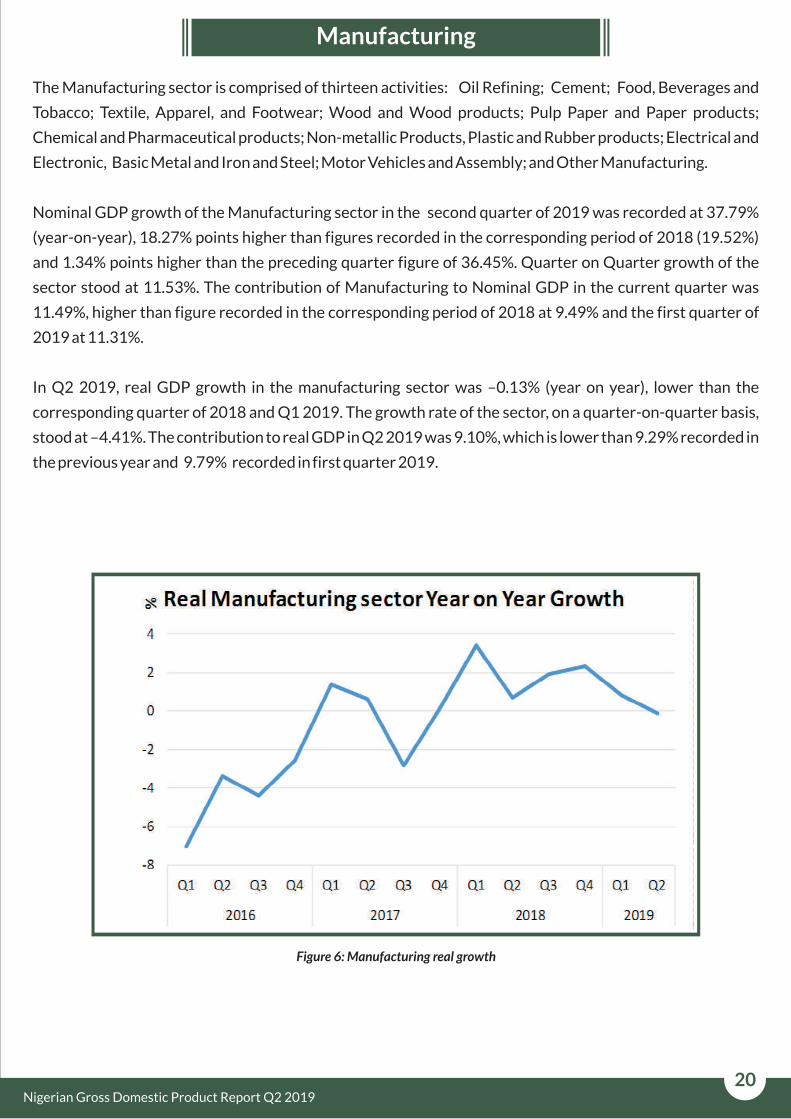
Manufacturing
The Manufacturing sector is comprised of thirteen activities: Oil Refining; Cement; Food, Beverages and
Tobacco; Textile, Apparel, and Footwear; Wood and Wood products; Pulp Paper and Paper products;
Chemical and Pharmaceutical products; Non-metallic Products, Plastic and Rubber products; Electrical and
Electronic, Basic Metal and Iron and Steel; Motor Vehicles and Assembly; and Other Manufacturing.
Nominal GDP growth of the Manufacturing sector in the second quarter of 2019 was recorded at 37.79%
(year-on-year), 18.27% points higher than figures recorded in the corresponding period of 2018 (19.52%)
and 1.34% points higher than the preceding quarter figure of 36.45%. Quarter on Quarter growth of the
sector stood at 11.53%. The contribution of Manufacturing to Nominal GDP in the current quarter was
11.49%, higher than figure recorded in the corresponding period of 2018 at 9.49% and the first quarter of
2019 at 11.31%.
In Q2 2019, real GDP growth in the manufacturing sector was –0.13% (year on year), lower than the
corresponding quarter of 2018 and Q1 2019. The growth rate of the sector, on a quarter-on-quarter basis,
stood at –4.41%. The contribution to real GDP in Q2 2019 was 9.10%, which is lower than 9.29% recorded in
the previous year and 9.79% recorded in first quarter 2019.
Figure 6: Manufacturing real growth
20Nigerian Gross Domestic Product Report Q2 2019

Manufacturing sector
Manufacturing Sector: Q1 2018 – Q2 2019
Manufacturing sector contracted by -0.13% in Q2 2019 from
0.81% in Q1 2019 and 2.35% in Q4 2018.
GDP REPORT Q2 2019
21Nigerian Gross Domestic Product Report Q2 2019

Oil Refining
Oil Refining : Q1 2018 – Q2 2019
Oil Refining under Manufacturing sector contracted by -
23.83% in Q2 2019 from -49.62% in Q1 2019 and 33.60% in Q4
2018.
GDP REPORT Q2 2019
22Nigerian Gross Domestic Product Report Q2 2019
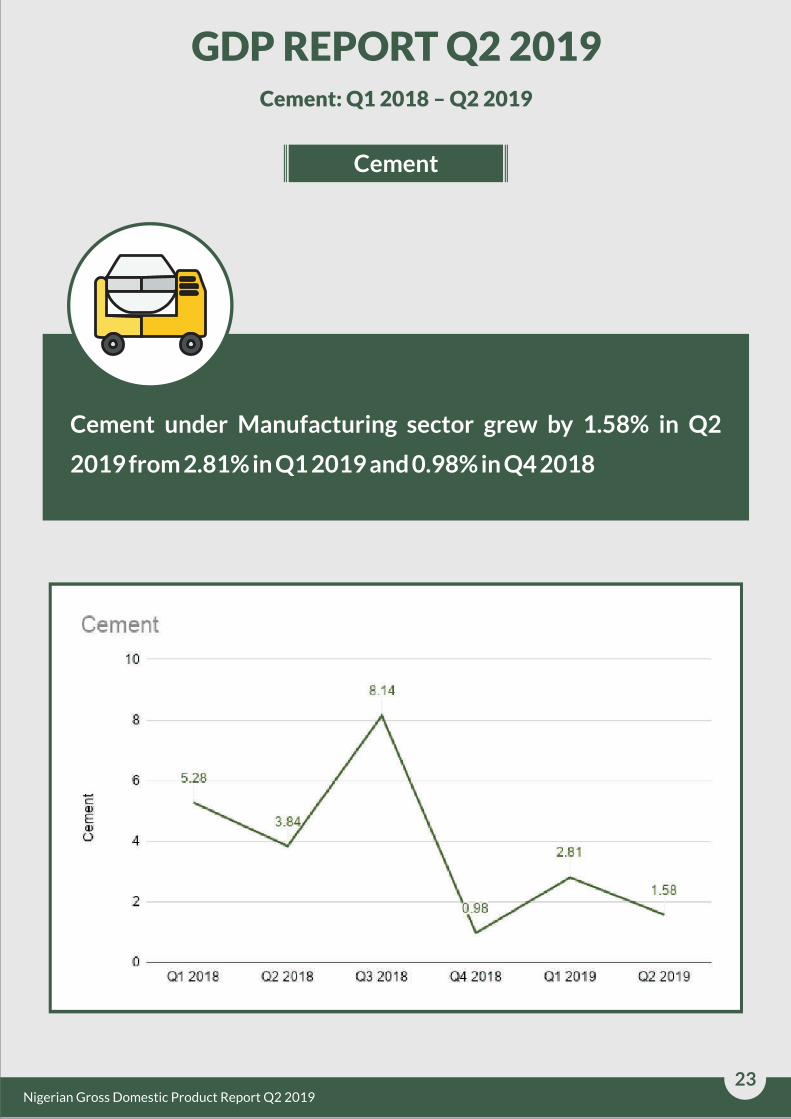
Cement
Cement: Q1 2018 – Q2 2019
Cement under Manufacturing sector grew by 1.58% in Q2
2019 from 2.81% in Q1 2019 and 0.98% in Q4 2018
GDP REPORT Q2 2019
23Nigerian Gross Domestic Product Report Q2 2019
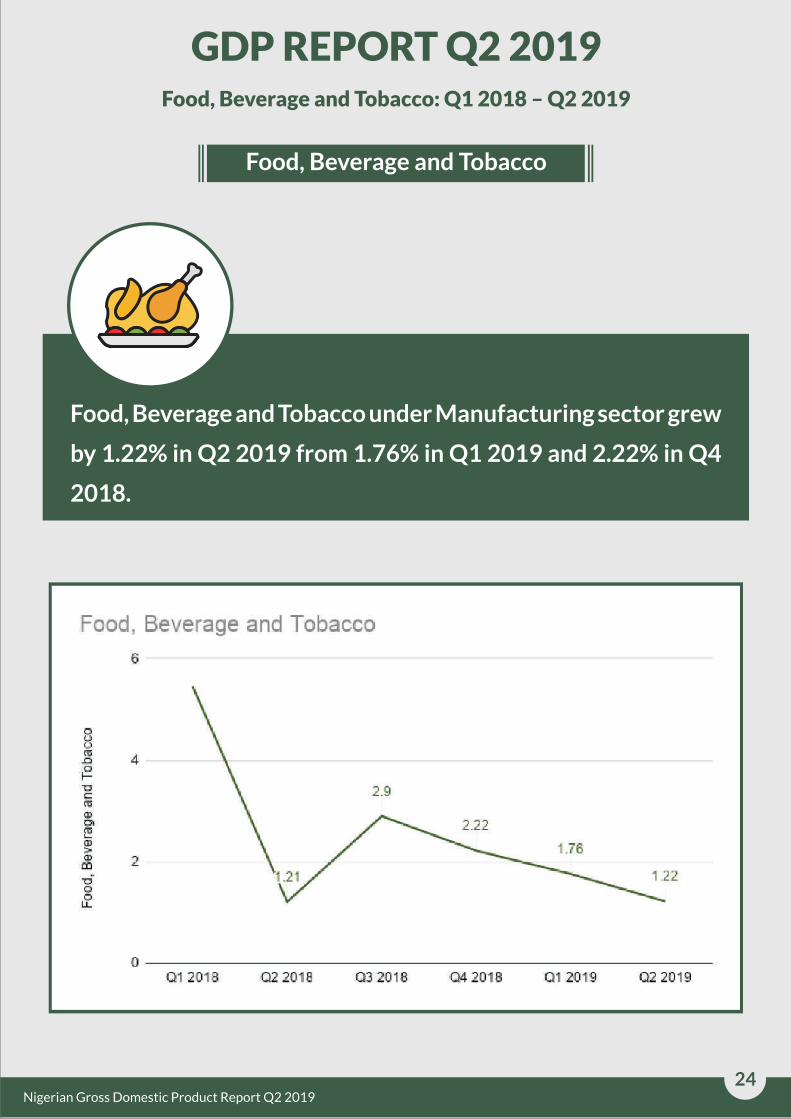
Food, Beverage and Tobacco
Food, Beverage and Tobacco: Q1 2018 – Q2 2019
Food, Beverage and Tobacco under Manufacturing sector grew
by 1.22% in Q2 2019 from 1.76% in Q1 2019 and 2.22% in Q4
2018.
GDP REPORT Q2 2019
24Nigerian Gross Domestic Product Report Q2 2019

Textile, Apparel and Footwear
Textile, Apparel and Footwear: Q1 2018 – Q2 2019
Textile, Apparel and Footwear under Manufacturing sector
contracted by -1.42% in Q2 2019 from 1.01% in Q1 2019 and
1.24% in Q4 2018.
GDP REPORT Q2 2019
25Nigerian Gross Domestic Product Report Q2 2019

Wood and Wood Products
Wood and Wood Products: Q1 2018 – Q2 2019
Wood and Wood Products under Manufacturing sector grew
by 1.19% in Q2 2019 from 1.39% in Q1 2019 and 1.62% in Q4
2018.
GDP REPORT Q2 2019
26Nigerian Gross Domestic Product Report Q2 2019

Pulp, Paper and Paper Products
Pulp, Paper and Paper Products: Q1 2018 – Q2 2019
Pulp, Paper and Paper Products under Manufacturing sector
grew by 2.33% in Q2 2019 from 2.06% in Q1 2019 and 2.62% in
Q4 2018.
GDP REPORT Q2 2019
27Nigerian Gross Domestic Product Report Q2 2019

Chemical and Pharmaceutical Products
Chemical and Pharmaceutical Products: Q1 2018 – Q2 2019
Chemical and Pharmaceutical Products under Manufacturing
sector contracted by -1.27% in Q2 2019 from 1.66% in Q1 2019
and 1.52% in Q4 2018.
GDP REPORT Q2 2019
28Nigerian Gross Domestic Product Report Q2 2019

Non-Metallic Products
Non-Metallic Products: Q1 2018 – Q2 2019
Non-Metallic Products under Manufacturing sector grew by
0.96% in Q2 2019 from 3.67% in Q1 2019 and 2.26% in Q4
2018
GDP REPORT Q2 2019
29Nigerian Gross Domestic Product Report Q2 2019

Plastic and Rubber Products
Plastic and Rubber Products: Q1 2018 – Q2 2019
Plastic and Rubber Products under Manufacturing sector grew
by 2.26% in Q2 2019 from 4.36% in Q1 2019 and 3.44% in Q4
2018.
GDP REPORT Q2 2019
30Nigerian Gross Domestic Product Report Q2 2019
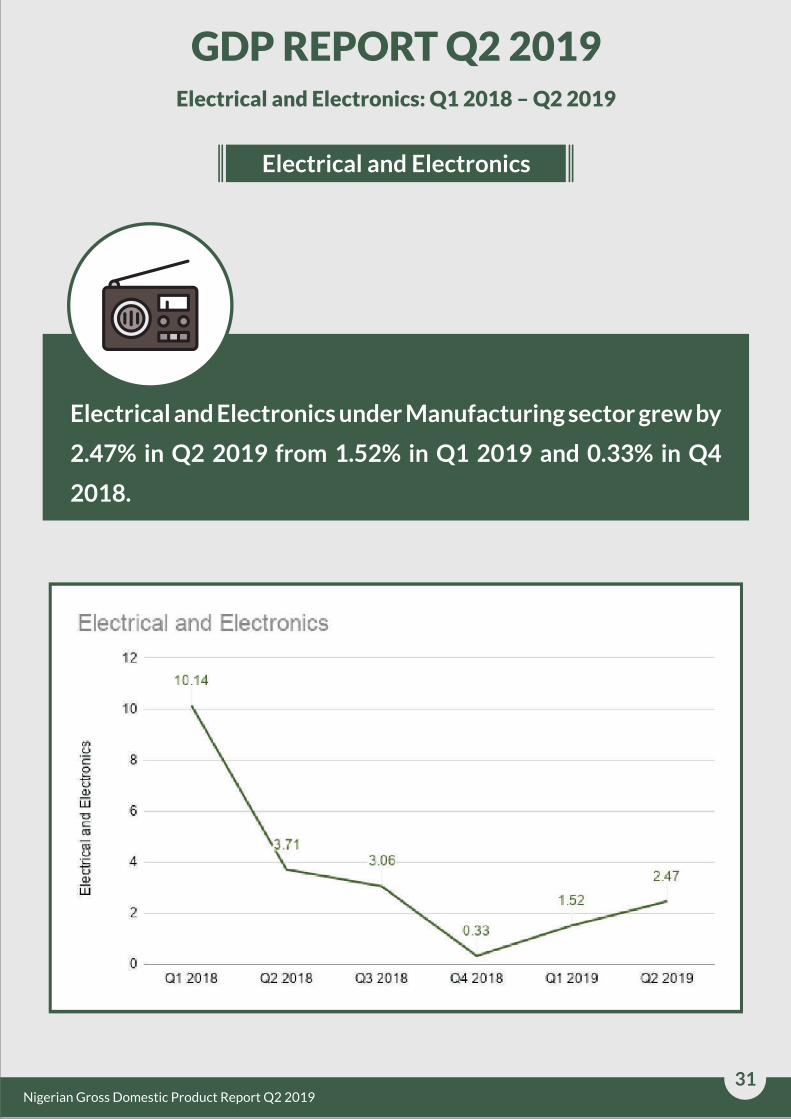
Electrical and Electronics
Electrical and Electronics: Q1 2018 – Q2 2019
Electrical and Electronics under Manufacturing sector grew by
2.47% in Q2 2019 from 1.52% in Q1 2019 and 0.33% in Q4
2018.
GDP REPORT Q2 2019
31Nigerian Gross Domestic Product Report Q2 2019
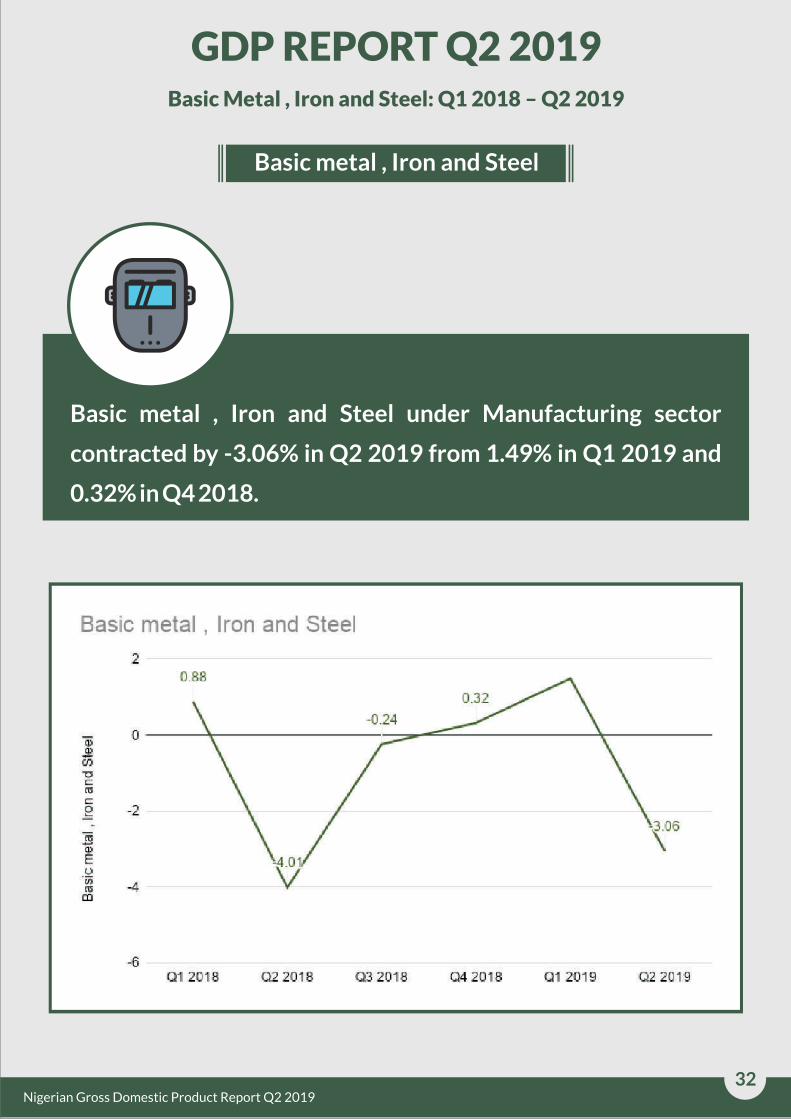
Basic metal , Iron and Steel
Basic Metal , Iron and Steel: Q1 2018 – Q2 2019
Basic metal , Iron and Steel under Manufacturing sector
contracted by -3.06% in Q2 2019 from 1.49% in Q1 2019 and
0.32% in Q4 2018.
GDP REPORT Q2 2019
32Nigerian Gross Domestic Product Report Q2 2019

Motor Vehicles & Assembly
Motor Vehicles & Assembly: Q1 2018 – Q2 2019
Motor Vehicles & Assembly under Manufacturing sector
contracted by -1.50% in Q2 2019 from 13.32% in Q1 2019 and -
5.70% in Q4 2018
GDP REPORT Q2 2019
33Nigerian Gross Domestic Product Report Q2 2019

Other Manufacturing
Other Manufacturing: Q1 2018 – Q2 2019
Other Manufacturing under Manufacturing sector grew by
0.07% in Q2 2019 from -1.26% in Q1 2019 and 1.70% in Q4
2018.
GDP REPORT Q2 2019
34Nigerian Gross Domestic Product Report Q2 2019

35
Electricity, Gas, Steam and Air Conditioning Supply
The Electricity, Gas, Steam and Air conditioning Supply sector recorded a year on year growth of 29.75% in
the second quarter of 2019. This is 4.25% points higher than 25.50% growth rate recorded in the
corresponding quarter of 2018, and –11.61% points lower than the growth rate of 41.36% recorded in the
quarter before. Quarter–on-quarter, the sector recorded a growth rate of 151.63%. The contribution of
Electricity, Gas, Steam and Air Conditioning Supply to Nominal GDP in the quarter under review was 0.83%
higher than the contribution made in the corresponding quarter of 2018 and the quarter before.
In real terms, the sector grew by 0.43% in Q2 2019, a decrease from the growth rate of 7.59% recorded in
the same quarter of 2018. When compared to the immediate past quarter, there was a decrease of –8.03%
points. Quarter-on-quarter, the sector grew at a rate of 123.72%. The contribution of this sector to real
GDP in the quarter was 0.46%, slightly down from Q2 2018 by -0.01% points and up by 0.25% points from
Q1 2019 contribution to GDP.
Figure 7: Elect. Gas an Steam real growth
Nigerian Gross Domestic Product Report Q2 2019

Electricity, Gas ,Steam And Air Conditioning Supply
Electricity, Gas, Steam and Air Conditioning Supply: Q1 2018 – Q2 2019
Electricity, Gas ,Steam and Air Conditioning Supply sector
grew by 0.43% in Q2 2019 from 8.47% in Q1 2019 and 0.95% in
Q4 2018.
GDP REPORT Q2 2019
36Nigerian Gross Domestic Product Report Q2 2019

37
Construction
The Construction sector grew by 42.80% in nominal terms (year on year) in the second quarter of 2019,
declining by –1.28% points compared to the rate of 44.09% recorded in the same quarter of 2018, and by by
–24.18% points when compared to the rate recorded in the preceding quarter. Nominal growth, quarter on
quarter, was recorded at 22.36%. Construction contributed 6.87% to nominal GDP in the second quarter of
2019, higher than 5.47% it contributed a year earlier and 6.16% contributed in the first quarter of 2019.
The real growth rate of the construction sector in the second quarter of 2019 was recorded at 0.67% (year
on year), lower by –7.00% points from the rate recorded the previous year. Relative to the preceding
quarter, there was a decline of –2.51% points. Quarter on quarter, the sector grew by 12.12% in real terms,
higher (by 10.76% points) than 1.36% recorded in the first quarter of 2019.
The sector’s contribution to aggregate real GDP was 4.45% in the current quarter, which was slightly lower
than its contribution of 4.51% in the same quarter of the previous year, but higher than in the immediate past
quarter where it contributed 4.09%.
Figure 8: Construction real growth
Nigerian Gross Domestic Product Report Q2 2019

Construction
Construction: Q1 2018 – Q2 2019
Construction sector grew by 0.67% in Q2 2019 from 3.18% in
Q1 2019 and 2.05% in Q4 2018.
GDP REPORT Q2 2019
38Nigerian Gross Domestic Product Report Q2 2019

In real terms, the trade sector’s year on year growth stood at –0.25%, or 1.89% points higher than the rate
recorded one year earlier at –2.14%, but –1.10% points lower than in the preceding quarter at 0.85%.
Quarter on quarter growth stood at –1.77%. In real terms, Trade’s contribution to GDP was 16.10%, lower
than the 16.45% it represented in the previous year, and 16.86% recorded in 2019 first quarter.
Figure 9: Trade real growth
Trade
In the second quarter of 2019, the nominal year on year growth rate of Trade sector stood at 3.03%. This
indicates an increase of 3.04% points when compared to the growth rate of –0.01% in the second quarter of
2018, but –1.79% points lower than the preceding quarter growth rate of 4.82%. The quarter on quarter
growth rate was –0.50%. Trade’s contribution to Nominal GDP in the second quarter of 2019 was 15.36%,
lower than the contribution in the same quarter of the previous year, and the contribution in the preceding
quarter.
39Nigerian Gross Domestic Product Report Q2 2019

Wholesale and Retail Trade
Trade: Q1 2018 – Q2 2019
Trade sector contracted by -0.25% in Q2 2019 from 0.85% in
Q1 2019 and 1.02% in Q4 2018.
GDP REPORT Q2 2019
40Nigerian Gross Domestic Product Report Q2 2019

41
Accommodation and Food Services
In nominal terms, Accommodation and Food Services grew by 20.18% year on year in the second quarter of
2019 . This represents an increase of 3.62% points relative to the same quarter of 2018, when the growth
rate was 16.56%. Growth was lower than in the preceding quarter by –10.11% points when growth was
30.29%. Accommodation and Food Services’ contribution to nominal GDP stood at 0.67% in the quarter
under review, higher than the figure recorded a year prior but lower than first quarter 2019 contribution
recorded at 1.19%.
The real year on year growth rate for this sector, in Q2 2019, stood at 2.92%, or 0.49% points higher than
2.43% recorded the previous year. Relative to the preceding quarter, growth rate was –1.23% points lower,
while quarter on quarter real growth was –40.99%.
The sector, in Q2 2019 represented 0.64% of real GDP, which is relatively same as the contribution recorded
in the second quarter of 2018 but lower than the first quarter 2019 contribution of 1.12%.
Nigerian Gross Domestic Product Report Q2 2019

Accommodation and Food Services
Accommodation and Food Services: Q1 2018 – Q2 2019
Accommodation and Food Services sector grew by 2.92% in Q2
2019 from 4.15% in Q1 2019 and 2.05% in Q4 2018.
GDP REPORT Q2 2019
42Nigerian Gross Domestic Product Report Q2 2019

Information & Communication
The Information and Communication sector is composed of the four activities of Telecommunications and
Information Services; Publishing; Motion Picture, Sound Recording and Music Production; and
Broadcasting.
In nominal terms, the second quarter of 2019 saw the sector grow by 40.54% (year-on-year), a 27.37%
points increase from the rate recorded in the same quarter of 2018, and 29.10% points higher than rate
recorded in the preceding quarter. The Quarter on Quarter growth rate was recorded at 43.41%. The
Information and Communications sector contributed 13.85% to total Nominal GDP in the second quarter of
2019, higher than rate of 11.22% recorded in the same quarter of 2018 and higher than the 10.60% it
contributed in the preceding quarter.
The sector, in the second quarter of 2019, recorded a growth rate of 9.01% in real terms, year on year. From
the rate recorded in the corresponding period of 2018, this indicated a decline of –2.80% points. Quarter on
Quarter, the sector exhibited a growth of 12.53% in real terms. In terms of contribution to real GDP, the
sector accounted for 14.57% of total real GDP in the second quarter of 2019, higher than in the same
quarter of the previous year in which it represented 13.63% and higher than in the preceding quarter, in
which it accounted for 13.32%.
Figure 10: Info and Communication real growth
43Nigerian Gross Domestic Product Report Q2 2019
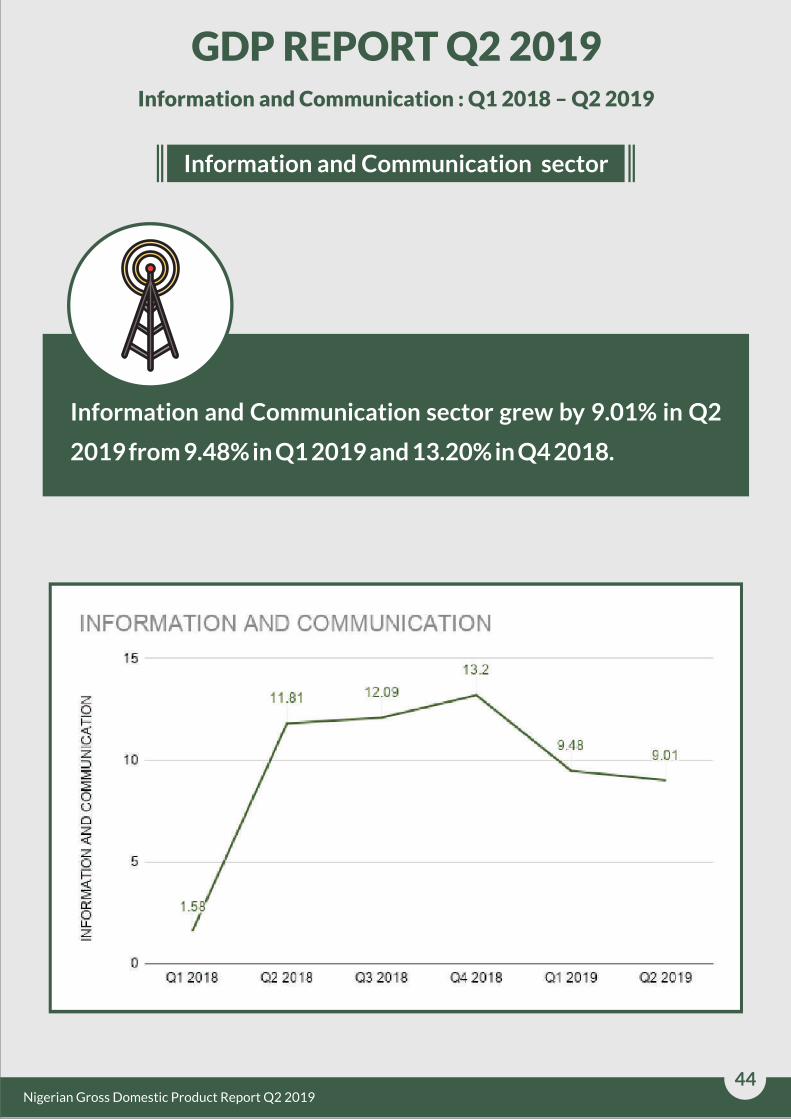
Information and Communication sector
Information and Communication : Q1 2018 – Q2 2019
Information and Communication sector grew by 9.01% in Q2
2019 from 9.48% in Q1 2019 and 13.20% in Q4 2018.
GDP REPORT Q2 2019
44Nigerian Gross Domestic Product Report Q2 2019

Telecommunications
Telecommunications: Q1 2018 – Q2 2019
Telecommunications & Information Services under
Information and Communication sector grew by 11.34% in Q2
2019 from 12.18% in Q1 2019 and 16.67% in Q4 2018.
GDP REPORT Q2 2019
45Nigerian Gross Domestic Product Report Q2 2019

Publishing
Publishing: Q1 2018 – Q2 2019
Publishing under Information and Communication sector
grew by 4.60% in Q2 2019 from -0.07% in Q1 2019 and 3.76%
in Q4 2018.
GDP REPORT Q2 2019
46Nigerian Gross Domestic Product Report Q2 2019
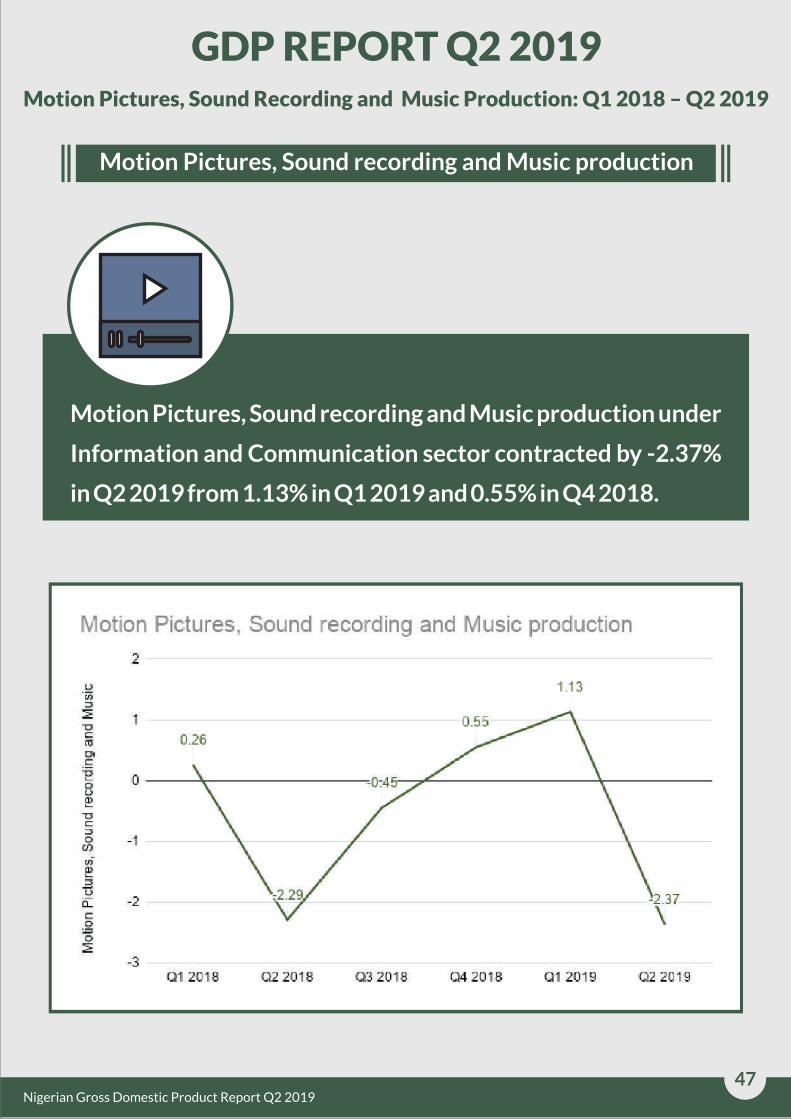
Motion Pictures, Sound recording and Music production
Motion Pictures, Sound Recording and Music Production: Q1 2018 – Q2 2019
Motion Pictures, Sound recording and Music production under
Information and Communication sector contracted by -2.37%
in Q2 2019 from 1.13% in Q1 2019 and 0.55% in Q4 2018.
GDP REPORT Q2 2019
47Nigerian Gross Domestic Product Report Q2 2019

Broadcasting
Broadcasting: Q1 2018 – Q2 2019
Broadcasting under Information and Communication sector
grew by 3.20% in Q2 2019 from 2.33% in Q1 2019 and 2.01% in
Q4 2018.
GDP REPORT Q2 2019
48Nigerian Gross Domestic Product Report Q2 2019
49
Six activities make up the Transportation and Storage sector: Road Transport; Rail Transport and Pipelines;
Water Transport; Air Transport; Transport Services; and Post and Courier Services.
The sector grew by 25.56% in nominal terms in the second quarter of 2019 (year on year). This growth rate is
lower when compared to 38.56% recorded for the corresponding quarter of 2018 and 50.39% in the
preceding quarter. The fastest growing activities in this quarter were Post and Courier Services (39.53%)
and Road transport (27.10%) year on year. Quarter on Quarter growth stood at –16.84%. Transport
contributed 1.88% to Nominal GDP in Q2 2019, an increase from 1.71% recorded in the corresponding
period of 2018, but lower than 2.49% recorded in the first quarter of 2019.
In real terms, the Transportation and Storage sector grew by 8.02% in Q2 2019. This rate represented a
decline of –13.73% points relative to the same quarter of the previous year and a decrease of –11.48%
points relative to the preceding quarter. Quarter on Quarter, growth was –19.03%. The contribution of the
sector to real GDP in the Q2 2019 stood at 1.38%, an increase from 1.30% recorded a year prior, but lower
than 1.76% recorded in the first quarter of 2019.
Transportation and Storage
Nigerian Gross Domestic Product Report Q2 2019
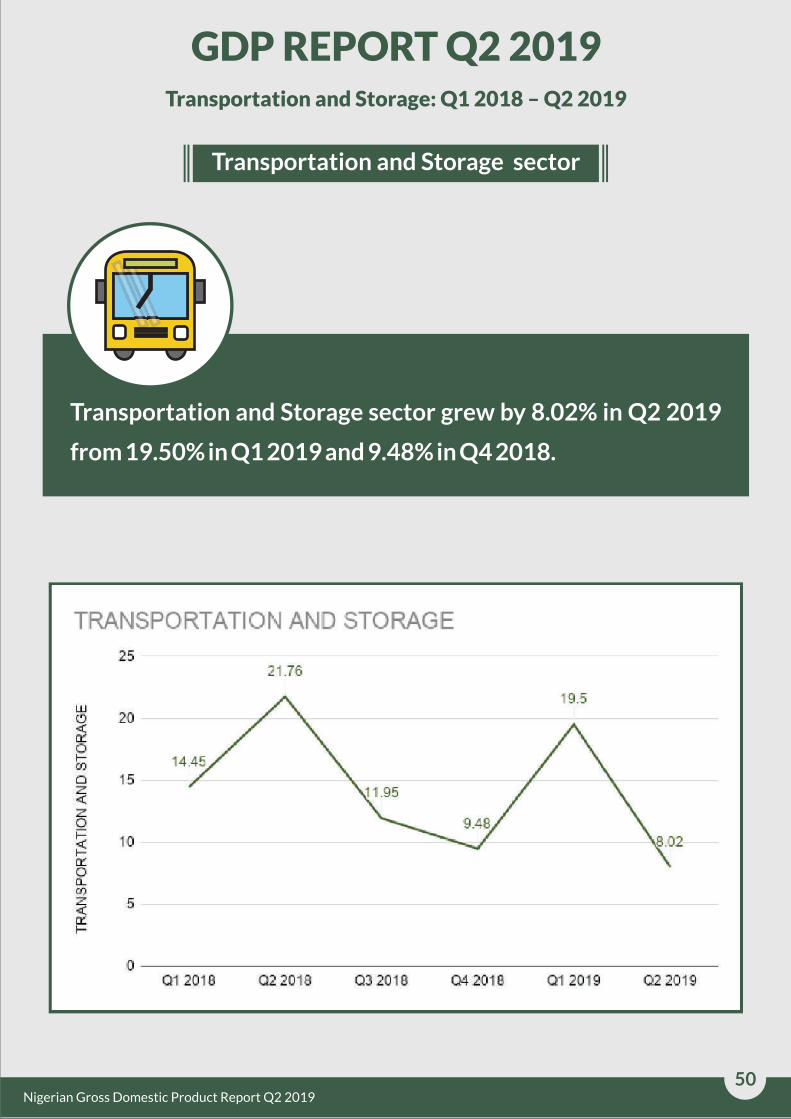
Transportation and Storage sector
Transportation and Storage: Q1 2018 – Q2 2019
Transportation and Storage sector grew by 8.02% in Q2 2019
from 19.50% in Q1 2019 and 9.48% in Q4 2018.
GDP REPORT Q2 2019
50Nigerian Gross Domestic Product Report Q2 2019
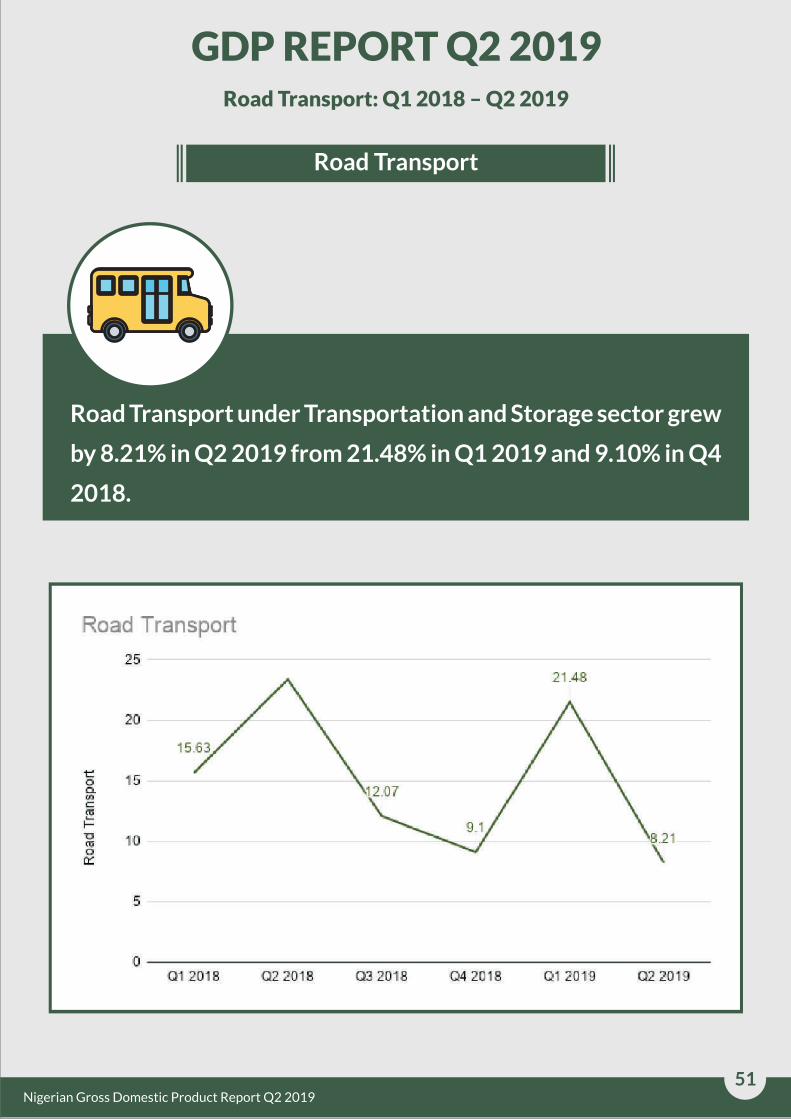
Road Transport
Road Transport: Q1 2018 – Q2 2019
Road Transport under Transportation and Storage sector grew
by 8.21% in Q2 2019 from 21.48% in Q1 2019 and 9.10% in Q4
2018.
GDP REPORT Q2 2019
51Nigerian Gross Domestic Product Report Q2 2019
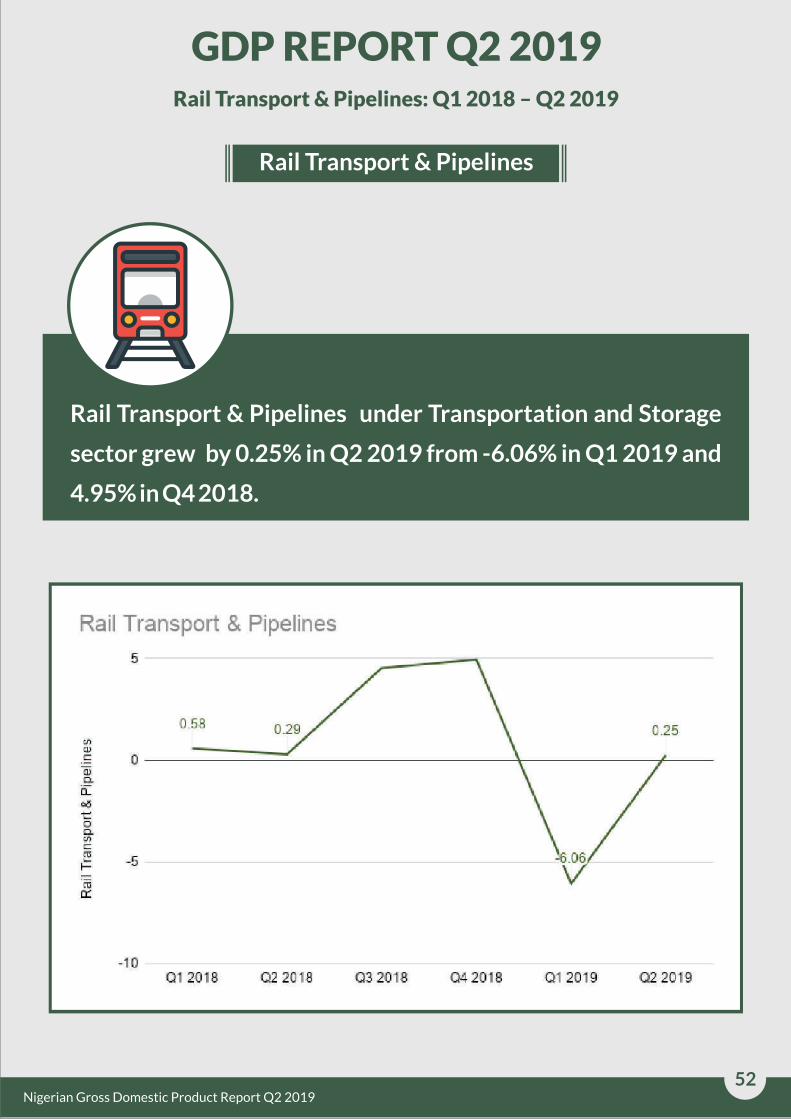
Rail Transport & Pipelines
Rail Transport & Pipelines: Q1 2018 – Q2 2019
Rail Transport & Pipelines under Transportation and Storage
sector grew by 0.25% in Q2 2019 from -6.06% in Q1 2019 and
4.95% in Q4 2018.
GDP REPORT Q2 2019
52Nigerian Gross Domestic Product Report Q2 2019

Water Transport
Water Transport: Q1 2018 – Q2 2019
Water Transport under Transportation and Storage sector
contracted by -1.10% in Q2 2019 from 0.44% in Q2 2019 and
1.96% in Q4 2018.
GDP REPORT Q2 2019
53Nigerian Gross Domestic Product Report Q2 2019

Air Transport
Air Transport: Q1 2018 – Q2 2019
Air Transport under Transportation and Storage sector grew
by 12.31% in Q2 2019 from 9.09% in Q1 2019 and 23.70% in
Q4 2018.
GDP REPORT Q2 2019
54Nigerian Gross Domestic Product Report Q2 2019

Transport Services
Transport Services: Q1 2018 – Q2 2019
Transport Services under Transportation and Storage sector
grew by 1.87% in Q2 2019 from 2.11% in Q1 2019 and 1.78% in
Q4 2018.
GDP REPORT Q2 2019
55Nigerian Gross Domestic Product Report Q2 2019
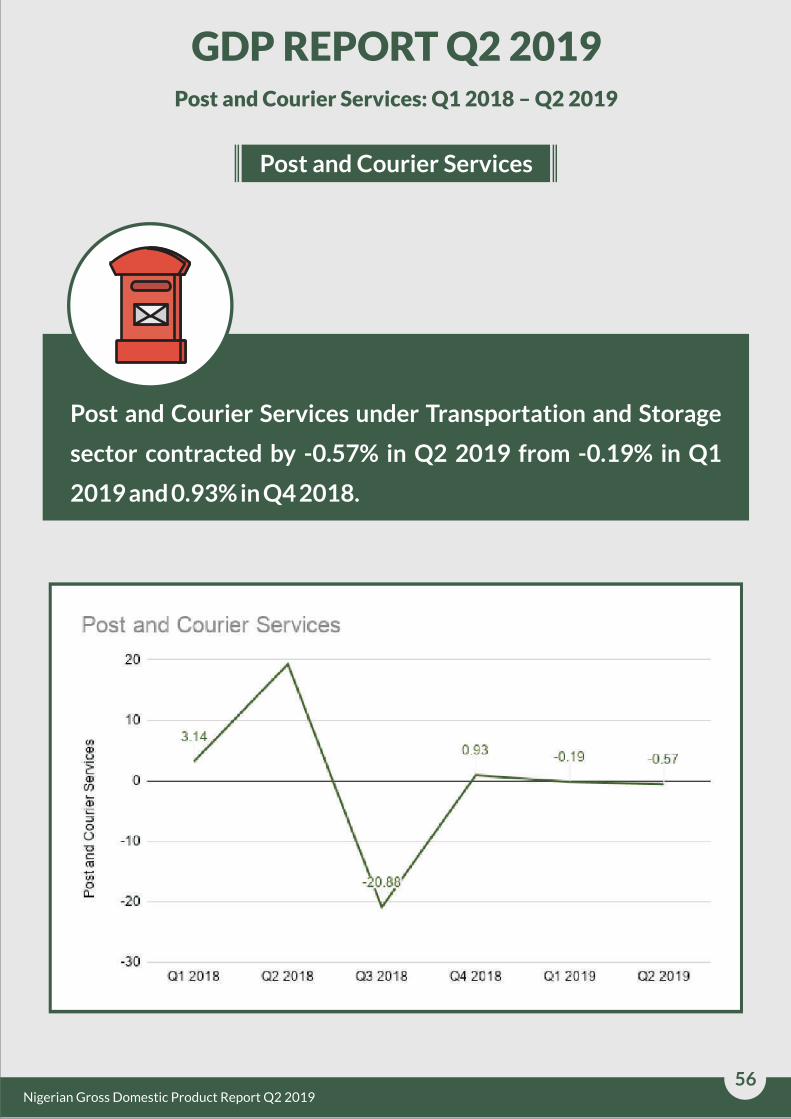
Post and Courier Services
Post and Courier Services: Q1 2018 – Q2 2019
Post and Courier Services under Transportation and Storage
sector contracted by -0.57% in Q2 2019 from -0.19% in Q1
2019 and 0.93% in Q4 2018.
GDP REPORT Q2 2019
56Nigerian Gross Domestic Product Report Q2 2019
57
Arts, Entertainment and Recreation
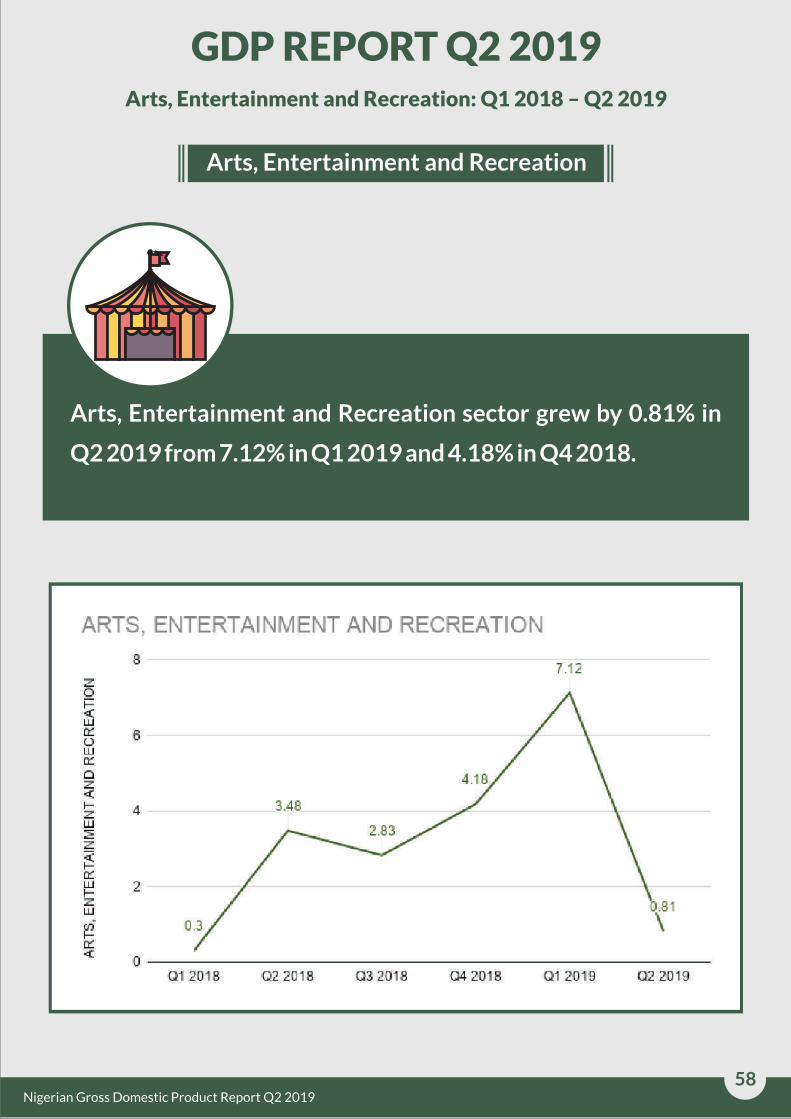
In Nominal terms, the growth of Arts, Entertainment and Recreation sector was 14.99% during the second
quarter of 2019 (year-on-year), representing an increase of 6.81% points relative to the preceding quarter
and an increase of 10.94% points compared with the period a year earlier. On a quarterly basis, growth was
recorded at -13.05%, lower than quarter-on-quarter growth of Q1 2019 recorded at 35.44%. The activity
contributed 0.22% to total nominal GDP in Q2 2019, relatively unchanged from Q2 2018 but lower than
0.27% recorded in Q1 of 2019.
In real terms, the activity grew by 0.81% year on year, which was –2.66% points slower than Q2 2018, and
–6.31% points slower than the preceding quarter. Quarter on Quarter, growth stood at –23.39% in real
terms. Arts, Entertainment and Recreation contributed 0.23% to real GDP in Q2 2019, relatively same as in
the previous year, but less than 0.31% recorded in the first quarter of 2019.
Nigerian Gross Domestic Product Report Q2 2019
Arts, Entertainment and Recreation
Arts, Entertainment and Recreation: Q1 2018 – Q2 2019
Arts, Entertainment and Recreation sector grew by 0.81% in
Q2 2019 from 7.12% in Q1 2019 and 4.18% in Q4 2018.
GDP REPORT Q2 2019
58Nigerian Gross Domestic Product Report Q2 2019
59
Real Estate Services
In nominal terms, Real Estate Services in the second quarter of 2019 grew by 2.09%, or 1.06% points higher
than the growth rate reported for the same period in 2018 but lower by -8.18% points compared to the
preceding quarter. Quarter-on-Quarter, the sector growth rate was 20.59%. The contribution to nominal
GDP in Q2 2019 stood at 6.36% as against 7.09% recorded in the second quarter of 2018 and 5.79%
recorded in the first quarter of 2019.
The sector’s real GDP growth rate in Q2 2019 stood at -3.84%, which is 0.04% points higher from growth
recorded in the second quarter of 2018, but lower by –4.78% points relative to Q1 2019. Quarter-on-
quarter, the sector grew by 18.80% in the second quarter of 2019. The sector contributed 6.44% to real GDP
in Q2 2019, higher than the 5.57% it recorded in the preceding quarter but lower than the corresponding
quarter of 2018.
Nigerian Gross Domestic Product Report Q2 2019

Real Estate
Real Estate: Q1 2018 – Q2 2019
Real Estate sector contracted by -3.84% in Q2 2019 from
0.93% in Q1 2019 and -3.85% in Q4 2018.
GDP REPORT Q2 2019
60Nigerian Gross Domestic Product Report Q2 2019
Finance and Insurance
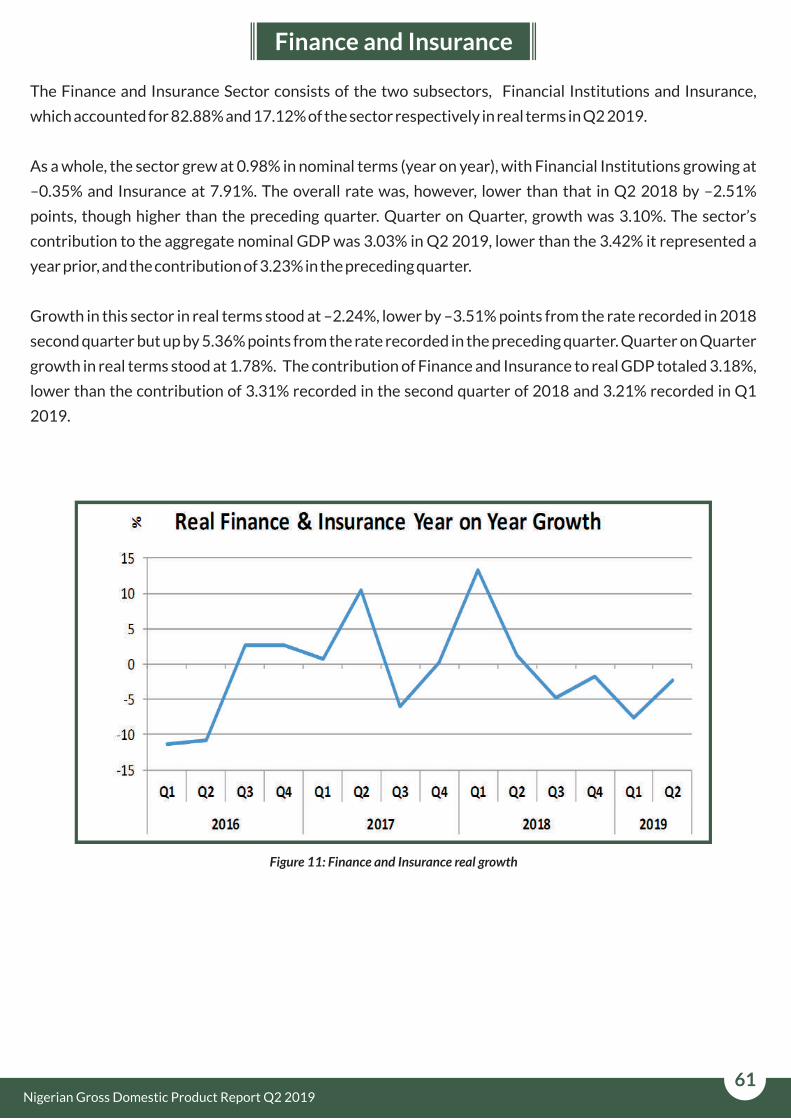
The Finance and Insurance Sector consists of the two subsectors, Financial Institutions and Insurance,
which accounted for 82.88% and 17.12% of the sector respectively in real terms in Q2 2019.
As a whole, the sector grew at 0.98% in nominal terms (year on year), with Financial Institutions growing at
–0.35% and Insurance at 7.91%. The overall rate was, however, lower than that in Q2 2018 by –2.51%
points, though higher than the preceding quarter. Quarter on Quarter, growth was 3.10%. The sector’s
contribution to the aggregate nominal GDP was 3.03% in Q2 2019, lower than the 3.42% it represented a
year prior, and the contribution of 3.23% in the preceding quarter.
Growth in this sector in real terms stood at –2.24%, lower by –3.51% points from the rate recorded in 2018
second quarter but up by 5.36% points from the rate recorded in the preceding quarter. Quarter on Quarter
growth in real terms stood at 1.78%. The contribution of Finance and Insurance to real GDP totaled 3.18%,
lower than the contribution of 3.31% recorded in the second quarter of 2018 and 3.21% recorded in Q1
2019.
Figure 11: Finance and Insurance real growth
61Nigerian Gross Domestic Product Report Q2 2019

Financial Institutions
Financial Institutions: Q1 2018 – Q2 2019
Financial Institutions under Finance and Insurance sector
contracted by -3.52% in Q2 2019 from -9.21% in Q1 2019 and -
2.13% in Q4 2018.
GDP REPORT Q2 2019
62Nigerian Gross Domestic Product Report Q2 2019
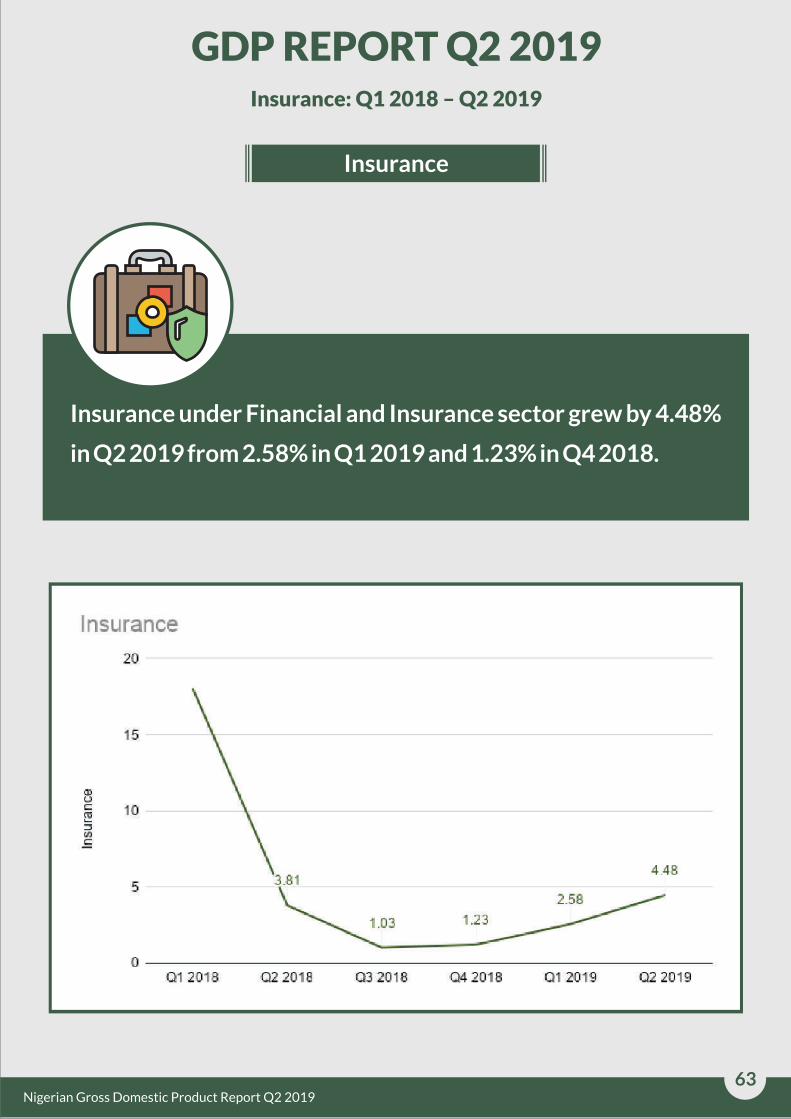
Insurance
Insurance: Q1 2018 – Q2 2019
Insurance under Financial and Insurance sector grew by 4.48%
in Q2 2019 from 2.58% in Q1 2019 and 1.23% in Q4 2018.
GDP REPORT Q2 2019
63Nigerian Gross Domestic Product Report Q2 2019
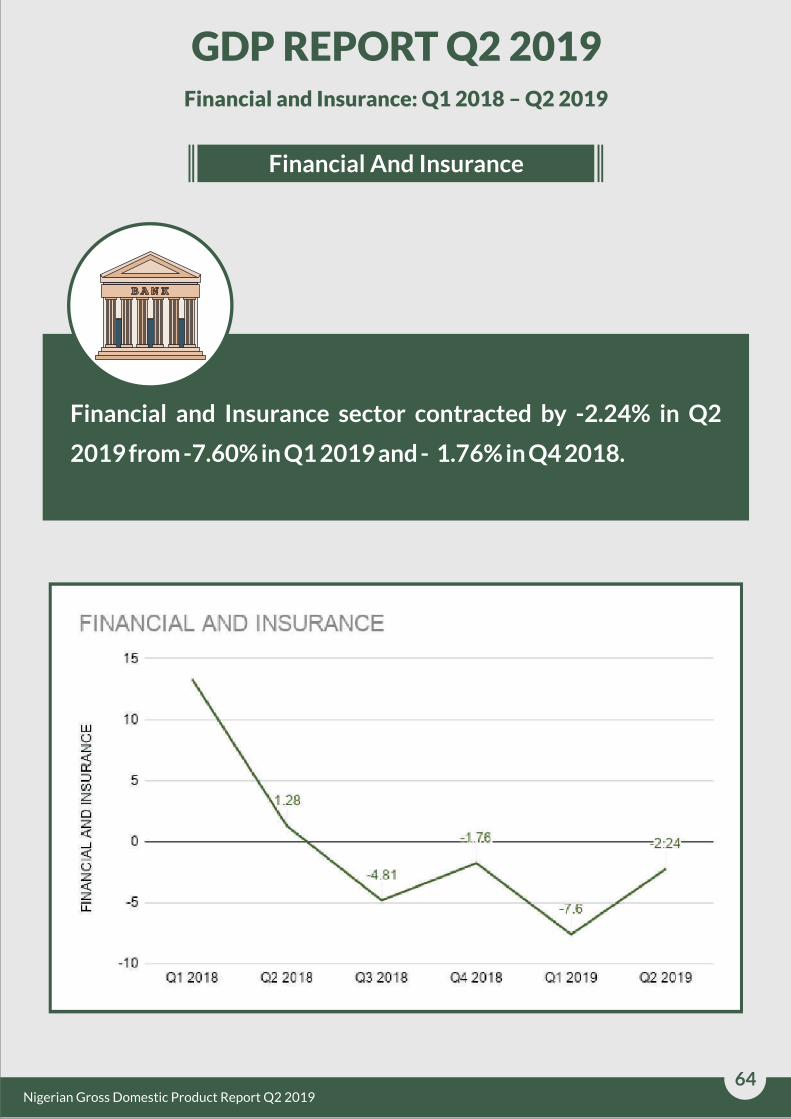
Financial And Insurance
Financial and Insurance: Q1 2018 – Q2 2019
Financial and Insurance sector contracted by -2.24% in Q2
2019 from -7.60% in Q1 2019 and - 1.76% in Q4 2018.
GDP REPORT Q2 2019
64Nigerian Gross Domestic Product Report Q2 2019

65Nigerian Gross Domestic Product Report Q2 2019
Administrative and Support Services
In nominal terms, the Administrative and Support Services sector grew by 5.38% (year on year) in Q2 2019,
or 6.69% points higher compared to Q2 2018 but –0.04% points lower than the growth rate in the previous
quarter. Quarter on Quarter growth rate in the sector was 2.42% in Q2 2019. The contribution of
Administrative and Support Services to nominal GDP was 0.02% in Q2 2019, same as recorded in the same
period in 2018 and in the preceding quarter.
In real terms, the sector recorded a growth rate of 2.03% (year-on-year), an increase of 5.44% points from
the corresponding quarter of 2018 and 0.60% points from the rate recorded in Q1 2019. Quarter–on-
quarter, the sector grew by 1.10% in Q2 2019. The sector’s contribution to real GDP was 0.02% in 2019
second quarter, roughly unchanged from the corresponding quarter in 2018 and first quarter of 2019.
66Nigerian Gross Domestic Product Report Q2 2019
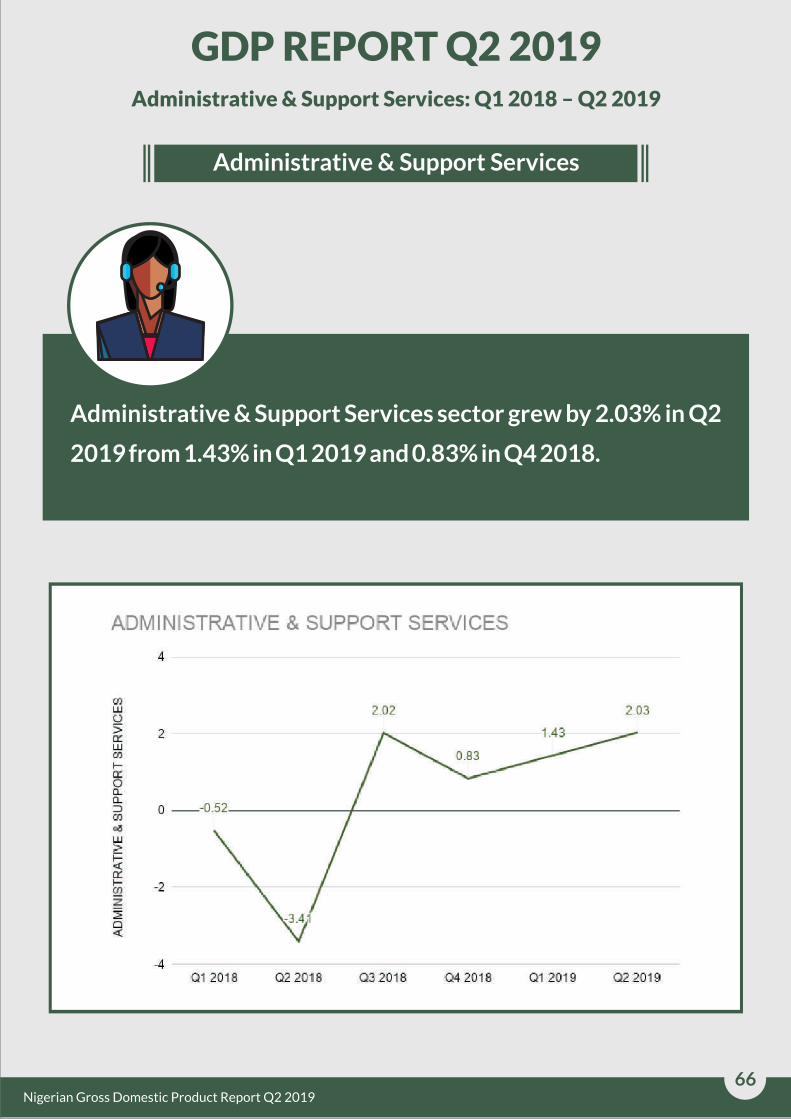
Administrative & Support Services
Administrative & Support Services: Q1 2018 – Q2 2019
Administrative & Support Services sector grew by 2.03% in Q2
2019 from 1.43% in Q1 2019 and 0.83% in Q4 2018.
GDP REPORT Q2 2019

67Nigerian Gross Domestic Product Report Q2 2019
Professional, Scientific and Technical Services
In Q2 2019, Professional, Scientific and Technical Services recorded a nominal growth of 4.53% (year-on-
year), or 0.24% points higher than Q2 2018, but –1.20% points down from the rate recorded in Q1 2019.
Quarter-on-Quarter, the sector grew by 6.18%. The contribution of Professional, Scientific and Technical
Services to nominal GDP was 3.40% in Q2 2019, down from the 3.70% contribution in Q2 2018 and 3.51%
recorded in Q1 2019.
Real growth in the sector was recorded at 1.21% in Q2 2019, a decrease of –0.86% points relative to the
rate recorded in the corresponding period of 2018, and –0.52% points lower than that of Q1 2019. On a
quarter-on-quarter basis, the sector grew by 4.82% in Q2 2019. Professional, Scientific and Technical
Services contributed 3.56% to aggregate GDP in Q2 2019, lower than the 3.59% it contributed in Q2 2018
but higher than 3.50% in Q1 2019.

68Nigerian Gross Domestic Product Report Q2 2019
Professional, Scientific and Technical Services
Professional, Scientific and Technical Services: Q1 2018 – Q2 2019
Professional, Scientific and Technical Services sector grew by
1.21% in Q2 2019 from 1.73% in Q1 2019 and 0.46% in Q4
2018.
GDP REPORT Q2 2019
69Nigerian Gross Domestic Product Report Q2 2019
Education
Nominal growth in the Education sector during the second quarter of 2019 was 11.09% (year-on-year), up
by 6.58% points from the growth of 4.52% reported in the corresponding quarter of 2018, and up by 1.45%
points when compared to Q1 2019 growth rate of 9.64%. The contribution of Education to nominal GDP in
Q2 2019 was 1.71%, down from 1.75% estimated in Q2 2018 and 2.06% recorded in Q1 2019.
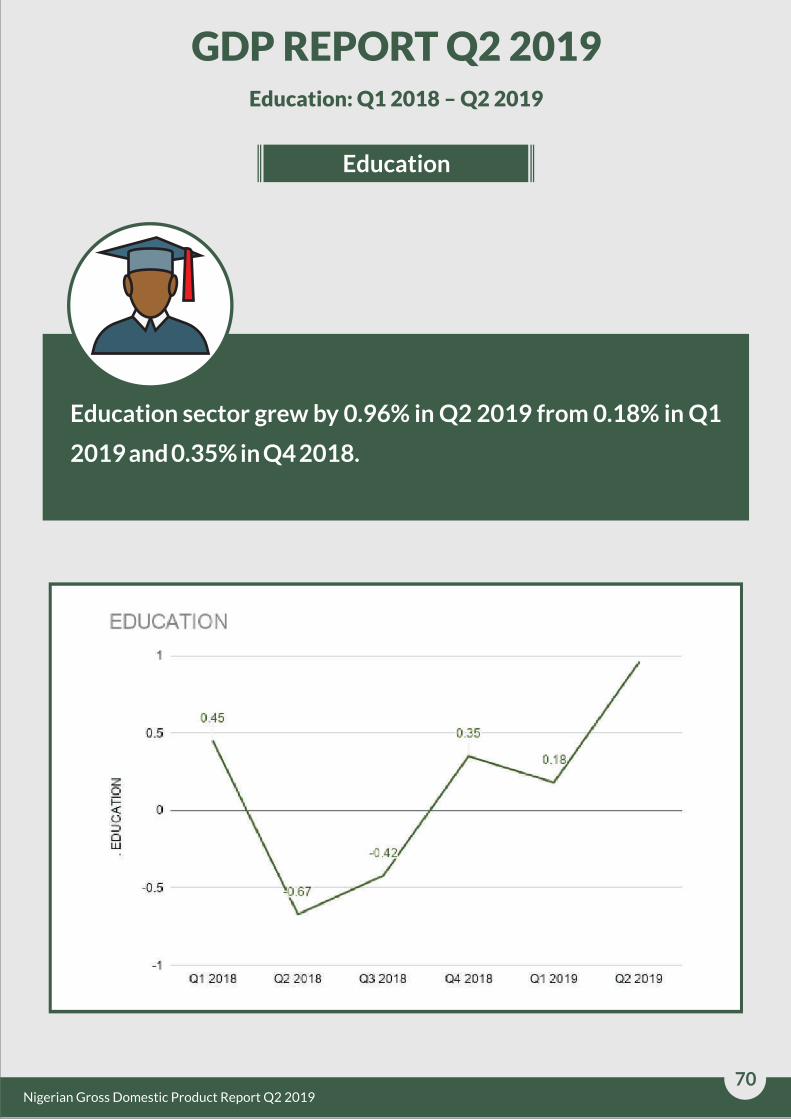
Real growth in Education, year-on-year, stood at 0.96% in Q2 2019, indicating an increase of 1.63% points
from the corresponding quarter of 2018 which was estimated at –0.67%. When compared with the previous
quarter’s rate of 0.18%, the sector increased by 0.78% points. The Education sector contributed 1.78% to
total real GDP in Q2 2019 which was relatively same as 1.79% reported for the corresponding quarter of
2018 but lower than 2.11% recorded in Q1 2019.
70Nigerian Gross Domestic Product Report Q2 2019
Education
Education: Q1 2018 – Q2 2019
Education sector grew by 0.96% in Q2 2019 from 0.18% in Q1
2019 and 0.35% in Q4 2018.
GDP REPORT Q2 2019

71Nigerian Gross Domestic Product Report Q2 2019
Public Administration
In nominal terms, the Public Administration sector grew by –0.22% in Q2 2019, or 2.92% points higher than
the corresponding quarter of 2018 and 10.62% points higher than in Q1 2019. Quarter-on-Quarter, the
sector grew by 20.92%. The contribution of Public Administration to Nominal GDP stood at 2.07% in Q2
2019, lower than 2.36% recorded in Q2 2018 but higher than 1.88% recorded in Q1 2019.
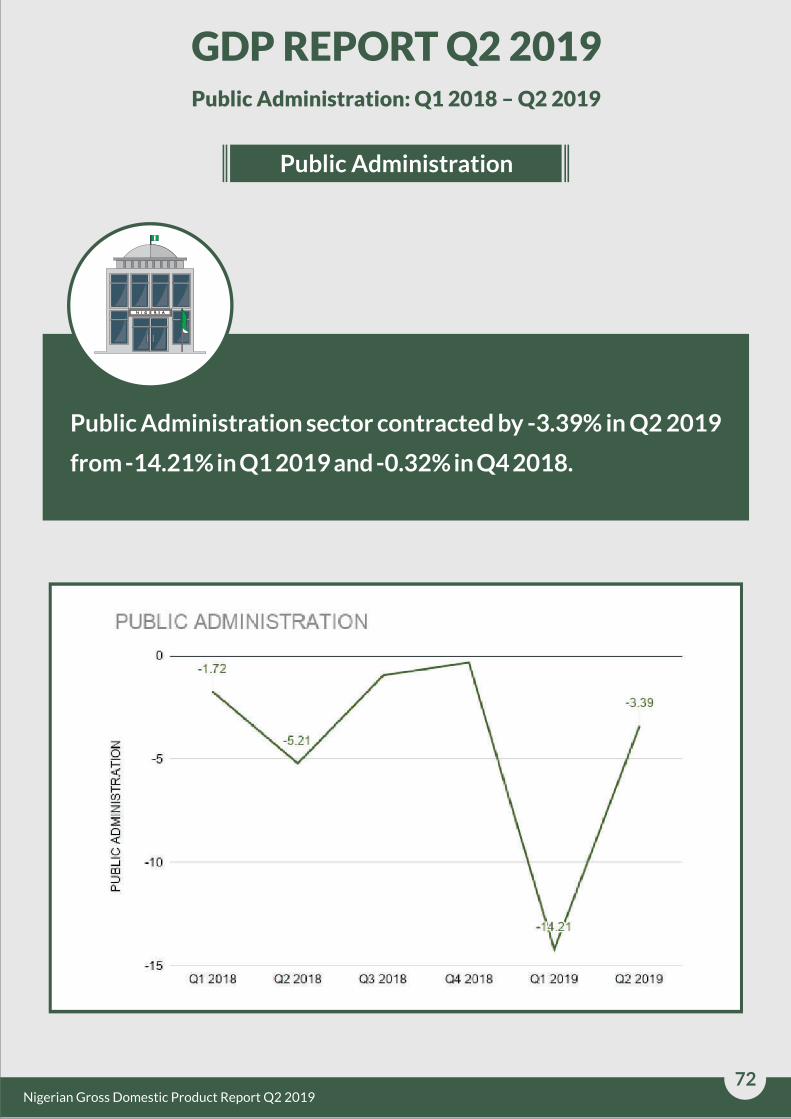
In real terms, the sector recorded a growth rate of –3.39% (year on year) in Q2 2019, higher by 1.82% points
and 10.82% points from rates in Q2 2018 and Q1 2019 respectively. Quarter on Quarter, the sector grew by
19.37% in Q2 2019. The contribution of Public Administration to Real GDP stood at 2.17% in Q2 2019,
lower compared to 2.29% in Q2 2018 and higher compared to 1.87% in Q1 2019.
72Nigerian Gross Domestic Product Report Q2 2019
Public Administration
Public Administration: Q1 2018 – Q2 2019
Public Administration sector contracted by -3.39% in Q2 2019
from -14.21% in Q1 2019 and -0.32% in Q4 2018.
GDP REPORT Q2 2019

Human Health and Social Services
The year on year growth rate for Human Health and Social Services, in nominal terms, was 15.67%, an
increase relative to the growth rate of 5.33% reported in the same quarter of 2018. Quarter on Quarter
growth was 16.98% while the contribution to nominal GDP was 0.68% in Q2 2019, up from 0.67% recorded
in Q2 2018, and 0.64% recorded in Q1 2019.
Real GDP growth for Human Health and Social Services in Q2 2019 stood at 1.13% (year-on-year)
compared to 0.41% for the corresponding period of 2018, indicating an increase of 0.72% points. Quarter-
on-Quarter, this sector grew by 6.77%.
The contribution of Human Health and Social Services to real GDP was 0.71% in Q2 2019, relatively same
as recorded in Q2 2018 but higher than 0.68% recorded for the preceding quarter.
73Nigerian Gross Domestic Product Report Q2 2019

Human Health and Social Services
Human Health and Social Services: Q1 2018 – Q2 2019
Human Health and Social Services sector grew by 1.13% in Q2
2019 from -0.16% in Q1 2019 and -0.64% in Q4 2018.
GDP REPORT Q2 2019
74Nigerian Gross Domestic Product Report Q2 2019

Other Services
In nominal terms, Other Services grew by 5.92% (year-on-year) in Q2 2019. This growth rate is higher than
the 4.96% growth rate recorded in the same quarter of the previous year but lower than the 6.38% in Q1
2019. Quarter on Quarter growth was –21.58%. This sector contributed 3.03% to the aggregate nominal
GDP in Q2 2019, lower than 3.26% it contributed in the same period of the previous year and lower than
4.25% it contributed in the preceding quarter.
Other Services’ real GDP grew by 2.55% (year-on-year) in Q2 2019. This growth was -0.17% points lower
than the growth recorded in the same period of the previous year, but higher by 0.20% points from Q1 2019.
Quarter on Quarter growth was –22.58%. The sector contributed 3.18% to real GDP in Q2 2019, relatively
same as the 3.16% reported for the corresponding quarter of 2018, but lower than 4.23% recorded in Q1
2019.
75Nigerian Gross Domestic Product Report Q2 2019

Other Services
Other Services: Q1 2018 – Q2 2019
Other Services sector grew by 2.55% in Q2 2019 from 2.35% in
Q1 2019 and 1.24% in Q4 2018.
GDP REPORT Q2 2019
76Nigerian Gross Domestic Product Report Q2 2019
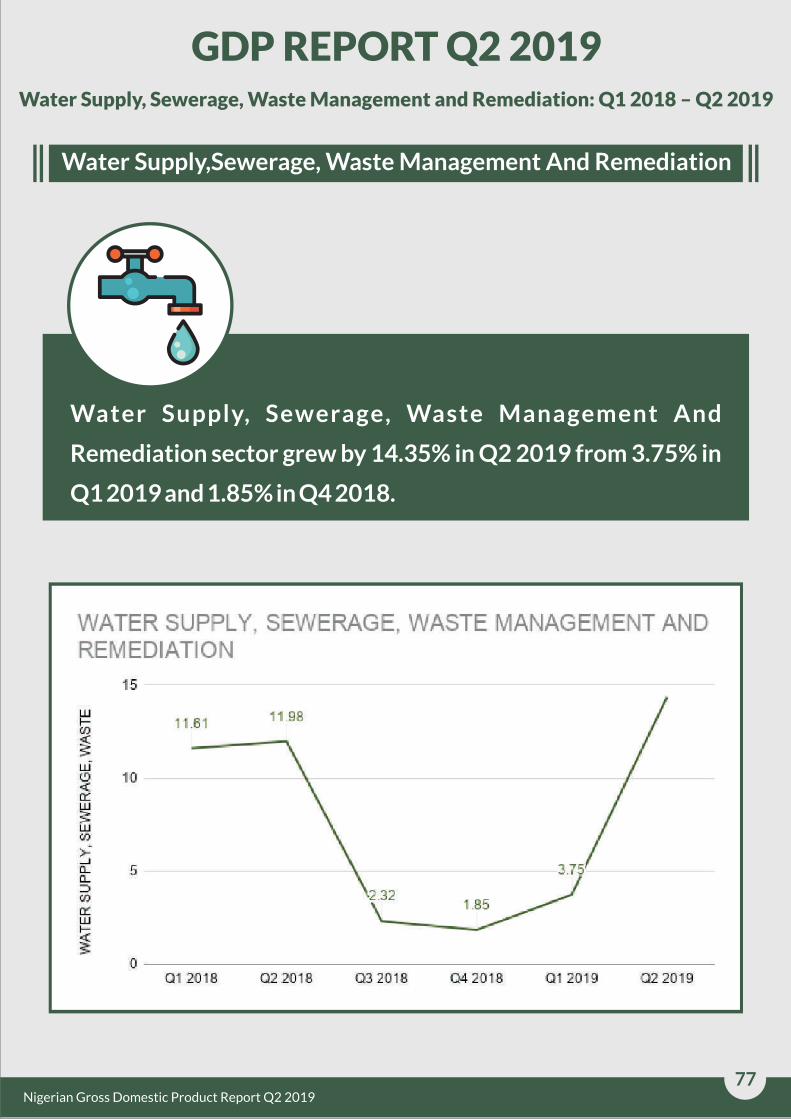
Water Supply,Sewerage, Waste Management And Remediation
Water Supply, Sewerage, Waste Management and Remediation: Q1 2018 – Q2 2019
Water Supply, Sewerage, Waste Management And
Remediation sector grew by 14.35% in Q2 2019 from 3.75% in
Q1 2019 and 1.85% in Q4 2018.
GDP REPORT Q2 2019
77Nigerian Gross Domestic Product Report Q2 2019

Industries
Industries: Q1 2018 – Q2 2019
Industries sector grew by 2.10% in Q2 2019 from 0.42% in Q1
2019 and 0.95% in Q4 2018.
GDP REPORT Q2 2019
INDUSTRIES
ELECTRICITY, GAS ,STEAM AND AIR CONDITIONING SUPPLY
WATER SUPPLY,SEWERAGE, WASTE MANAGEMENT
AND REMEDIATION CONSTRUCTION MINING AND QUARRYING MANUFACTURING
78Nigerian Gross Domestic Product Report Q2 2019

Services
Services: Q1 2018 – Q2 2019
GDP REPORT Q2 2019
TRADE
ACCOMMODATION AND FOOD SERVICES
TRANSPORTATION AND STORAGE
INFORMATION AND COMMUNICATION
ARTS, ENTERTAINMENT AND RECREATION
FINANCIAL AND INSURANCE
REAL ESTATE
PROFESSIONAL, SCIENTIFIC AND TECHNICAL SERVICES
ADMINISTRATIVE & SUPPORT SERVICES
PUBLIC ADMINISTRATION
EDUCATION
HUMAN HEALTH AND SOCIAL SERVICES
OTHER SERVICES
Road Transport
Rail Transport & Pipelines
Water Transport
Air Transport
Transport Services
Post and Courier Services
Telecommunications
Publishing,
Motion Pictures, Sound recording and Music production
Broadcasting
Financial Institutions
Insurance
79Nigerian Gross Domestic Product Report Q2 2019
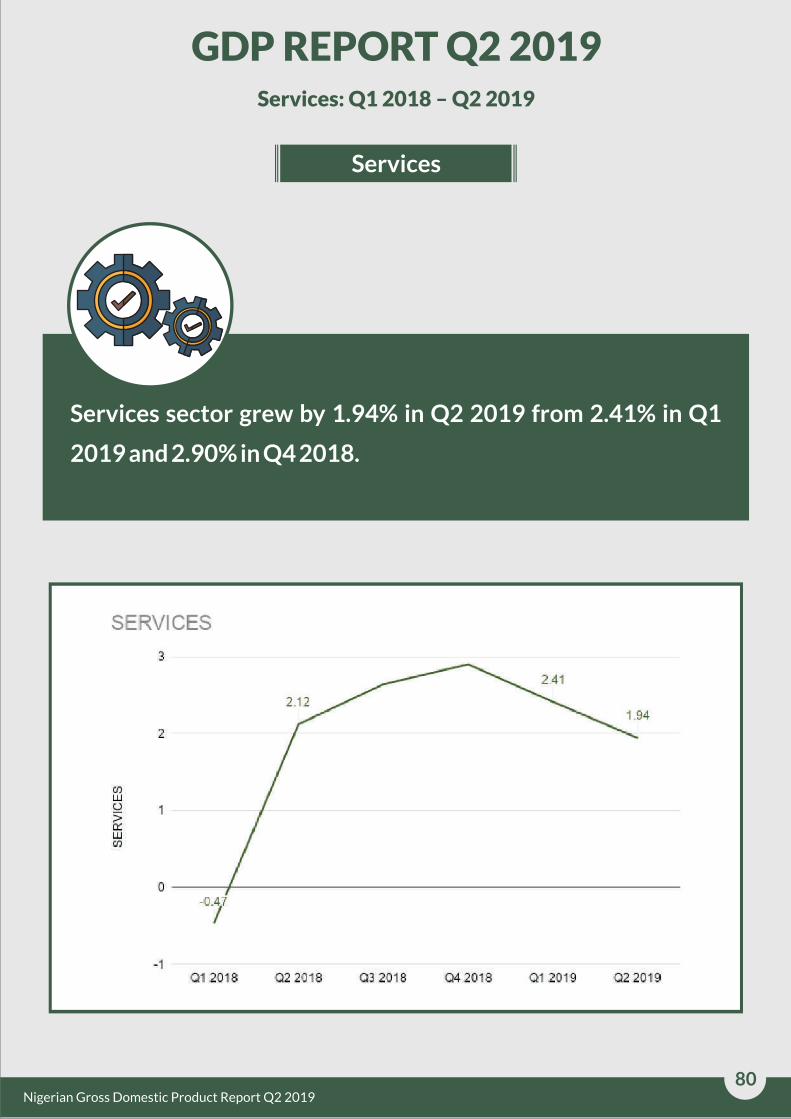
Services
Services: Q1 2018 – Q2 2019
Services sector grew by 1.94% in Q2 2019 from 2.41% in Q1
2019 and 2.90% in Q4 2018.
GDP REPORT Q2 2019
80Nigerian Gross Domestic Product Report Q2 2019

Methodological Notes
81
Quarterly National Accounts (QNA) are an integrated system of macroeconomic accounts designed to describe the entire system
of production in a nation on a quarterly basis. They provide a picture of the current economic status of an economy on a more
frequent basis than Annual National Accounts (ANA). In providing a reasonable level of detailed information of the economy,
QNA allows the government to regularly assess, analyze and monitor economic developments.
In line with international standards outlined under the United Nations Statistics Division (UNSTATS), four major methodological
pillars underpin GDP compilation in Nigeria:
The System of National Accounts (SNA 2008 version)
The internationally agreed standard of recommendations as to how to compile measures of economic activity.
The International Standard Industrial Classification (ISIC Revision 4.0):
This is the international reference for the classification of productive activities. Its main purpose is to provide a set of activity
categories that can be used for the collection and reporting of statistics according to such activities.
The Central Product Classification (CPC version 2)
A classification based on the physical characteristics of goods or on the nature of services rendered. The CPC covers products
that are output of economic activities.
Data for this analysis were obtained from the Quarterly Establishment Survey (QES) conducted by the National Bureau of
Statistics (NBS), tax receipts from the Federal Inland Revenue Service, and other administrative sources such as the Nigerian
National Petroleum Corporation. The series covers major aggregates of quarterly GDP under 46 activities at current and
constant (2010) prices.
UUsing the above data and standards, GDP is computed as gross output minus intermediate consumption. Both gross output and
intermediate consumption are detailed below for each activity:
1. AGRICULTURE
Under Section A, Division 01-03 of ISIC rev 4, Agriculture is divided into four main activities.
1.1 CROP PRODUCTION
Section A, Division 01 of ISIC Rev 4
Gross Output: Quantities produced multiplied by farm gate price, less losses (wastages).
Intermediate consumption: Seeds, fertilizer, pesticides, hire of farm implements and simple farm tools that are used up in
one farming season.
1.2 LIVESTOCK PRODUCTION
Section A, Division 01 of ISIC Rev 4
Gross Output is calculated using the following Live animals and their produce + imports = animals slaughtered and their
produce– animals which died of natural causes +exports + change in animal stock.
Intermediate Consumption: Value of animal feeds as input in the production of livestock and livestock products (such as
broiler starter concentrate, breeder concentrate, ground cake, guinea corn etc.)
Nigerian Gross Domestic Product Report Q2 2019
Methodological Notes
82
1.3 FORESTRY
Section A, Division 02 of ISIC Rev 4
Gross Output: Value and quantity of timbers of various types (firewood, charcoal, uncultivated materials gathered).
Other forest products obtained using expenditure approach. Sawn-logs, and other wood products categories are
obtained using the production method, whereby, the quantity of logs produced is multiplied by the price per cubic of log.
Intermediate consumption: Expenditure on seeds and sapling, fuel oils, lubricants, feed, hand tools and spare parts,
payments for contract work and other services.
1.4 FISHING
Section A, Division 03 of ISIC Rev 4
Gross Output: Measured by multiplying quantity in kilogram by the average price to obtain the value of production.
Intermediate consumption: Intermediate consumption here is captured according to expenditure on fingerlings, nets,
feeds and other operating expenses.
2. MINING AND QUARRYING
Section B, Division 05-09 of ISIC Rev 4.0
2.1 CRUDE PETROLEUM AND NATURAL GAS
Section B, Division 06 of ISIC Rev 4
Gross Output: Quantity of crude petroleum produced (barrels) and Natural gas in million cubic feet (mcf) multiplied by
the average price in domestic currency (equivalent of the price in dollar during the account period).
Intermediate Consumption: Includes purchase of consultancy services, Transportation, Electricity Bills, Water bills, Cost
of Fuel used, Minor Repairs and Maintenance, Medical expense to staff, License & Registration fees, Travelling allowance,
Staff Uniform, Rents on machinery & buildings, Spare Parts etc.
2.2 COAL MINING
Section B, Division 05 of ISIC Rev 4
Gross Output: Quantity produced multiplied by the average price.
Intermediate Consumption: Cost of raw materials used; both imported and Local, purchase of consultancy services,
transportation, electricity bills, water bills, cost of fuel used, minor repairs and maintenance, medical expense to staff,
royalty, travelling allowance, special clothing use at work, rents on machinery & buildings, Spare Parts etc.
2.3 METAL ORES
Section B, Division 07 of ISIC Rev 4
Gross Output: Quantity produced multiplied by the average price
Intermediate Consumption: Cost of raw materials used; both imported and Local, purchase of consultancy services,
transportation, electricity bills, water bills, cost of fuel used, minor repairs and maintenance, medical expense to staff,
royalty, travelling allowance, special clothing used at work, rents on machinery & buildings, Spare Parts etc.
2.4 QUARRYING AND OTHER MINING
Section B, Division 08 of ISIC Rev 4
Gross Output: Quantity produced multiplied by the average price
Intermediate Consumption: Cost of raw materials used; both imported and local, purchase of consultancy services,
transportation, electricity bills, water bills, cost of fuel used, minor repairs and maintenance, medical expense to staff,
Nigerian Gross Domestic Product Report Q2 2019

Methodological Notes
83
royalty, travelling allowance, special clothing used at work, rents on machinery & buildings, Spare Parts etc.
3. MANUFACTURING
Section C, Division 10-33 of ISIC Rev 4.
Gross output =Revenue from sales of goods + Revenue from sales of goods bought for resale (trade margin) + Revenue
from rendering services to other +Closing stock of finished goods -Opening stock of finished goods +Closing stock of
work-in-progress -Opening stock of work-in-progress
Intermediate consumption = Purchases of raw materials and supplies + Purchases of goods bought for resale + Purchases
of packaging materials +Fuels and lubricants +Electricity +Water and Sewerage +Repair and Maintenance +Freight
charges and transport +Closing stock of raw materials and supplies - Opening stock of raw materials and supplies
+Insurance premium +All other costs and expenses for goods and services
4. ELECTRICITY, GAS, STEAM AND AIR CONDITIONING SUPPLY
Section D, Division 35 of ISIC Rev 4.
Gross Output: The value of output is the amount of gas and electricity paid for. Hence, value added is the output less
intermediate consumption.
Intermediate Consumption=other cost of sales+Indirect expenses
5. WATER SUPPLY, SEWERAGE, WASTE MANAGEMENT AND REMEDIATION
Section E, Division 36 of ISIC Rev. 4
Gross output = Water revenue+Sewage revenue+New connections
Intermediate Consumption=other cost of sales+Indirect expenses
6. TRADE
Section G, Divisions 45 to 47 of ISIC Rev. 4.
Gross Output: This is equal to the trade margin, i.e. the difference between the revenue of goods sold and the value of the
goods purchased for resale.
Intermediate Consumption: Goods and services needed to run the trading establishment, such as packaging materials,
electricity, office supplies, and rentals.
7. CONSTRUCTION
Section F, Division 41 to 43 of ISIC Rev 4.
Gross Output: Value of work done and other incomes.
Intermediate Consumption: This comprises cement, blocks, metals/iron bars,sand, stone, wood, gravel, other
construction inputs, and cost of fuel used by generator, water bills and expenses on internet services/telephone/postage
bills during the construction period.
8. ACCOMODATION AND FOOD SERVICES
Section I, Division 55 to 56 of ISIC Rev. 4.
Gross Output: Income generated from Accommodation, Catering, Restaurants, Beverage Service activities, Other
income Intermediate Consumption includes expenses incurred in running the businesses.
9. TRANSPORTATION AND STORAGE
This industry broadly categorized under ISIC Rev. 4, Section H, division 49-53. The sector is divided into 6 sub-economic
Nigerian Gross Domestic Product Report Q2 2019

Methodological Notes
84
activities.
9.1 ROAD TRANSPORT
Section H, Division 49 of ISIC Rev 4
Gross Output: The output of road transport is the revenue generated for the period under consideration.
Intermediate Consumption: Intermediate consumption consists of fuels and lubricants used electricity bills, water bills,
office supplies, and rentals.
9.2 RAIL TRANSPORT AND PIPELINES
Section H, Division 49 of ISIC Rev 4
Gross Output: Receipts from passengers, goods traffic and subventions from Federal Government. The Petroleum
Pipeline Product income is from the transportation of the petroleum products and crude oil to designated depots and
refineries in Nigeria.
Intermediate Consumption: This consists of the summation of all expenses incurred in the production process such as
fuels and lubricants used, electricity bills, water bills, office supplies, and rentals.
9.3 WATER TRANSPORT
Section H, Division 50 of ISIC Rev 4
Gross Output: Receipts from passengers and goods traffic.
Intermediate Consumption: Fuels and lubricants used electricity bills, water bills, office supplies, and rentals.
9.4 AIR TRANSPORT
Section H, Division 51 of ISIC Rev 4
Gross Output: Receipts from passengers and Cargoes (goods traffic).
Intermediate Consumption: Fuels and lubricants used, electricity bills, water bills, office supplies, and rentals, Spare
parts, Consultancy, Audit fees
9.5 TRANSPORT SERVICES
Section H, Division 52 of ISIC Rev 4
Gross Output: Receipts from services for storage and transportation activities.
Intermediate Consumption: Fuels and lubricants used, transportation cost, electricity bills, water bills, office supplies,
and rentals.
9.6 POST AND COURIER SERVICES
Section H, Division 53 of ISIC Rev 4
Gross Output: Receipts from services rendered on number of mails and parcels handled.
Intermediate Consumption: Fuels and lubricants used, transportation cost, electricity bills, water bills, office supplies,
and rentals.
10. INFORMATION AND COMMUNICATION
Categorized under ISIC Rev. 4, Section J, Division 58-63, the sector is divided into 4 economic activities:
Nigerian Gross Domestic Product Report Q2 2019

Methodological Notes
85
10.1 TELECOMMUNICATION AND INFORMATION SERVICES
Section J, division 61 to 63 of ISIC Rev 4.
Gross Output: Revenue from telephone, telex, Facsimile, telegraph, and other income from satellite and internet
services. Intermediate consumption: Transit fees, operational expenditure, minor repairs and maintenance and other
expenses.
10.2 PUBLISHING
Section J, Division 58 of ISIC Rev 4
Gross Output: Revenue from publishing services.
Intermediate consumption: This includes details of the cost structure including transportation fees, operational
expenditure, minor repairs etc.
10.3 MOTION PICTURE AND SOUND RECORDING
Section J, Division 59 of ISIC Rev 4.
Gross Output: Revenue generated/total sales from the number of movies and sound recordings produced including
revenue generated from TV rights, royalties and fees.
Intermediate consumption: Detail on the cost structure of operating firms including transportation fees, operational
expenditure, minor repairs and maintenance, and other administrative expenses.
10.4 BRODCASTING
Section J, Division 60 of ISIC Rev 4
Gross Output: Public corporation data derived from Accountants General’s reports, while private component relies on
revenue generated from services rendered e.g. advertisement.
Intermediate consumption: Details of the cost structure of market participants which include transportation fees,
operational expenditure, minor repairs and maintenance
11. ARTS ENTERTAINMENT AND RECREATION
Section R, division 90-93 of ISIC Rev 4.
Gross Output: Revenue generated was estimated in two categories: one as a market output and the second as non-
market output (public establishments)
Intermediate consumption: Details of the cost structure were obtained from the financial reports of firms.
12. FINANCE AND INSURANCE SERVICES
Section k, Division 64-66 of ISIC Rev 4, Finance and Insurance Services is divided into two (2) sectors.
12.1 FINANCIAL INSTITUTIONS
Section K, Division 64 of ISIC Rev 4
Gross Output: Gross output for financial services are measured by Financial Services Indirectly Measured (FISIM).
Gross Output = Implicit service charges (FISIM) +Explicit service changes.
Intermediate Consumption: Details of the cost structure are extracted from the data supplied such as; Currency Issue
Expenses, Administrative Expenses, Repairs and Maintenance, Consultancy Fees, Bank Charges, Audit fees, Directors
related expenses
Nigerian Gross Domestic Product Report Q2 2019

Methodological Notes
86
12.2. INSURANCE
Section K, Division 65 of ISIC Rev 4
Gross Output:
Output of life insurance: Output = Actual premiums earned+Plus Premium supplements -Benefits due -Minus Increases
(plus decreases) in life insurance technical reserves
Output of non-life (General) insurance: Output = Actual premiums earned +Premium supplements - Adjusted claims
incurred
Output of funded pension fund: Output = Actual pension contributions+Supplementary contributions -Benefits due
+Plus Change in the actuarial reserves+Property income
Intermediate consumption: consists of the cost structure (operating expenses) from the annual reports of institutions.
13. REAL ESTATE
Section L, Division 68 of ISIC Rev 4
Gross Output: Sum of fees and commissions receivable for the services rendered.
Intermediate consumption: Details of the cost structure including transportation fees, operational expenditure, minor
repairs and maintenance etc.
14. PROFESSIONAL SCIENTIFIC AND TECHNICAL SERVICES
Section M, Division 69-75 of ISIC Rev 4.
Gross Output: Sum of revenues receivable for the services rendered.
Intermediate consumption: Details of the cost structure including transportation fees, operational expenditure, minor
repairs and maintenance etc.
15. ADMINISTRATIVE AND SUPPORT SERVICES
Section N, Division 77-82 of ISIC RE 4.
Gross Output: Sum of fees and commissions receivable for the services rendered.
Intermediate consumption: Details of the cost structure including transportation fees, operational expenditure, minor
repairs and maintenance etc.
16 . PUBLIC ADMINISTRATION
Section O, Division 48 of ISIC Rev. 4
Gross output Basic = Intermediate consumption (Less commodity sales and fees) +Compensation of
employees+Consumption of fixed capital +Other taxes less subsidies on production.
17. EDUCATION
Section P, division 85 of ISIC Rev. 4.
Gross Output: Consists of government production, which is a non-market service offered without charge or at a price not
economically significant, and private production, offered at the market price.
Government Production (non-market service):
Gross output Basic=+Intermediate consumption (Less commodity sales and fees) +Compensation of
employees+Consumption of fixed capital +Other taxes less subsidies on production.
Private Production (market service):
Nigerian Gross Domestic Product Report Q2 2019
Methodological Notes
87
Gross output Basic=Total output-Intermediate consumption + other taxes less subsidies on production.
Intermediate consumption: Details of cost structure including transportation fees, operational expenditure, minor
repairs and maintenance etc.
18. HUMAN HEALTH AND SOCIAL SERVICES
Section Q, Division 86-88 of ISIC Rev. 4.
Gross Output: Consists of government production, which is a non-market service offered without charge or at a price not
economically significant, and private production, offered at the market price.
Government production (non-makret service):
Gross output Basic = Intermediate consumption (Less commodity sales and fees)+Compensation of
employees+Consumption of fixed capital +Other taxes less subsidies on production.
Private production (market service):
Gross output Basic = Total output-Intermediate consumption+ other taxes less subsidies on production.
Intermediate consumption: Details of the cost structure of operators including transportation fees, operational
expenditure, minor repairs and maintenance etc.
19. OTHER SERVICE ACTIVITIES
Section S Division 94 to 96 of ISIC Rev.4.
Gross Output: Income generated from the various services rendered.
Nigerian Gross Domestic Product Report Q2 2019

Appendix
88Nigerian Gross Domestic Product Report Q2 2019
2018 2019
Q1 Q2 Q3 Q4 Total Q1 Q2
ACTIVITY SECTOR
AGRICULTURE
1. Crop Production 4,201,158.94 5,040,537.40 7,761,398.05 7,204,703.55 24,207,797.93 5,174,393.33 5,947,453.57
2. Livestock 479,988.00 481,746.01 495,605.98 591,262.16 2,048,602.16 514,932.01 500,680.74
3. Forestry 60,024.07 70,007.69 65,263.98 77,494.90 272,790.64 65,980.47 77,863.37
4. Fishing 216,687.29 172,289.75 194,363.91 258,764.08 842,105.03 321,896.13 262,603.99
MINING AND QUARRYING
5. Crude Petroleum and Natural Gas 3,921,287.24 3,728,989.91 3,452,485.75 2,321,111.08 13,423,873.98 3,148,350.00 3,001,940.94
6. Coal Mining 3,277.28 3,199.78 779.7 2,525.34 9,782.10 5,157.03 4,119.97
7. Metal Ores 5,230.87 2,256.54 2,047.24 1,369.38 10,904.02 4,794.35 2,597.76
8. Quarrying and Other Minerals 7,763.36 47,285.00 66,067.91 82,988.10 204,104.37 18,430.92 79,274.94
MANUFACTURING
9. Oil Refining 41,551.21 54,296.69 55,485.44 59,326.00 210,659.34 21,915.32 42,651.71
10. Cement 251,811.33 304,027.71 386,990.79 402,920.84 1,345,750.67 469,994.42 481,080.24
11. Food, Beverage and Tobacco 1,193,619.15 1,269,942.41 1,394,538.30 1,474,258.93 5,332,358.79 1,469,652.37 1,512,871.82
12. Textile, Apparel and Footwear 610,644.02 681,231.74 799,453.43 874,360.09 2,965,689.27 858,939.41 893,764.81
13. Wood and Wood Products 82,187.10 81,682.72 90,935.08 95,550.45 350,355.36 100,006.97 106,250.34
14. Pulp, Paper and Paper Products 23,769.27 29,575.65 35,607.38 39,634.88 128,587.19 41,235.67 48,417.01
15. Chemical and Pharmaceutical Products 55,229.45 68,122.84 77,178.01 79,403.69 279,933.99 77,164.29 134,497.15
16. Non-Metallic Products 110,213.67 141,043.79 168,800.41 170,158.67 590,216.54 190,183.63 220,420.51
17. Plastic and Rubber products 83,997.97 93,637.40 103,396.30 108,795.94 389,827.61 111,996.49 196,787.56
18. Electrical and Electronics 1,400.15 2,202.04 2,696.46 2,709.16 9,007.81 2,094.15 4,421.72
19. Basic metal , Iron and Steel 58,821.56 65,186.21 75,615.46 82,683.14 282,306.36 75,445.25 133,595.31
20. Motor vehicles & assembly 19,639.59 27,612.27 29,317.90 37,449.12 114,018.88 54,394.97 32,686.74
21. Other Manufacturing 105,938.17 95,944.63 120,567.56 134,365.73 456,816.09 127,573.06 208,364.51
22. ELECTRICITY, GAS ,STEAM AND AIR CONDITIONING SUPPLY 81,146.88 222,463.20 239,671.93 328,271.07 871,553.07 114,709.87 288,647.51
23. WATER SUPPLY,SEWERAGE, WASTE MANAGEMENT AND REMEDIATION 45,463.50 62,184.23 56,445.53 47,430.16 211,523.43 63,475.58 95,959.65
24. CONSTRUCTION 1,174,608.22 1,680,686.49 1,402,656.04 1,773,110.02 6,031,060.77 1,961,424.27 2,400,060.43
25. TRADE 5,144,977.56 5,208,238.20 5,490,402.86 6,074,826.04 21,918,444.66 5,392,759.49 5,365,910.12
26. ACCOMMODATION AND FOOD SERVICES 291,126.93 193,615.38 300,286.75 359,336.82 1,144,365.87 379,311.55 232,683.86
27. Road Transport 475,445.71 466,019.91 479,054.58 638,418.07 2,058,938.27 728,473.03 592,299.55
28. Rail Transport & Pipelines 38.2 107.4 71.14 127.1 343.84 36.87 112.28
29. Water Transport 1,578.84 2,851.05 3,144.49 2,284.15 9,858.53 1,628.91 2,887.41
30. Air Transport 29,228.69 31,449.12 42,027.74 46,647.14 149,352.70 40,878.71 36,426.97
31. Transport Services 12,101.72 21,041.46 26,620.63 29,244.58 89,008.40 12,602.84 22,569.55
32. Post and Courier Services 8,300.14 3,134.93 3,045.40 6,385.59 20,866.06 8,464.72 4,374.02
33. Telecommunications & Information Services 2,138,814.13 2,529,674.68 2,229,516.15 2,769,302.85 9,667,307.82 2,460,192.27 3,782,643.68
34. Publishing, 9,362.36 9,098.50 7,761.36 8,511.35 34,733.58 9,545.81 10,583.20
34. Motion Pictures, Sound recording and Music production 367,473.24 294,808.01 275,889.65 312,010.72 1,250,181.62 375,329.70 328,295.51
36. Broadcasting 512,279.09 609,663.32 389,861.44 515,846.23 2,027,650.08 529,411.17 717,674.34
37.ARTS, ENTERTAINMENT AND RECREATION 80,673.94 65,993.58 57,970.08 64,438.06 269,075.66 87,277.21 75,886.96
FINANCIAL AND INSURANCE
38. Financial Institutions 922,832.19 880,896.48 756,430.89 888,840.52 3,449,000.07 870,767.54 877,839.42
39. Insurance 146,803.79 168,020.11 120,118.32 112,812.76 547,754.99 156,510.25 181,317.21
40. REAL ESTATE 1,670,919.80 2,176,477.68 2,294,971.07 2,490,448.56 8,632,817.11 1,842,549.42 2,221,912.32
41. PROFESSIONAL, SCIENTIFIC AND TECHNICAL SERVICES 1,057,575.87 1,135,846.17 1,302,500.63 1,366,565.87 4,862,488.55 1,118,243.22 1,187,336.05
42. ADMINISTRATIVE & SUPPORT SERVICES 6,195.17 6,347.36 7,437.14 7,615.25 27,594.92 6,531.21 6,689.04
43. PUBLIC ADMINISTRATION 671,401.66 725,467.14 702,381.88 826,844.31 2,926,094.99 598,654.42 723,874.69
44. EDUCATION 597,242.17 537,206.62 709,266.80 890,811.51 2,734,527.11 654,821.02 596,797.81
45. HUMAN HEALTH AND SOCIAL SERVICES 187,570.40 206,193.50 206,827.74 221,099.49 821,691.13 203,886.34 238,498.35
46. OTHER SERVICES 1,271,204.34 1,001,264.08 885,093.86 1,347,544.18 4,505,106.46 1,352,334.01 1,060,526.99
GDP Current Basic Price 28,438,604.23 30,699,566.80 33,368,049.14 35,230,607.63 127,736,827.81 31,824,349.67 34,944,151.61
Net Indirect Taxes on Products 244,341.51 255,730.32 412,980.70 437,027.11 1,350,079.64 261,770.54 299,076.86
GDP Current Market Price 28,682,945.74 30,955,297.12 33,781,029.84 35,667,634.75 129,086,907.45 32,086,120.21 35,243,228.48
TRANSPORTATION AND STORAGE
INFORMATION AND COMMUNICATION
Table One: Gross Domestic Product At Current Basic Prices (=N=Million)
Appendix
89Nigerian Gross Domestic Product Report Q2 2019
2018 2019
Q1 Q2 Q3 Q4 Total Q1 Q2
ACTIVITY SECTOR
AGRICULTURE
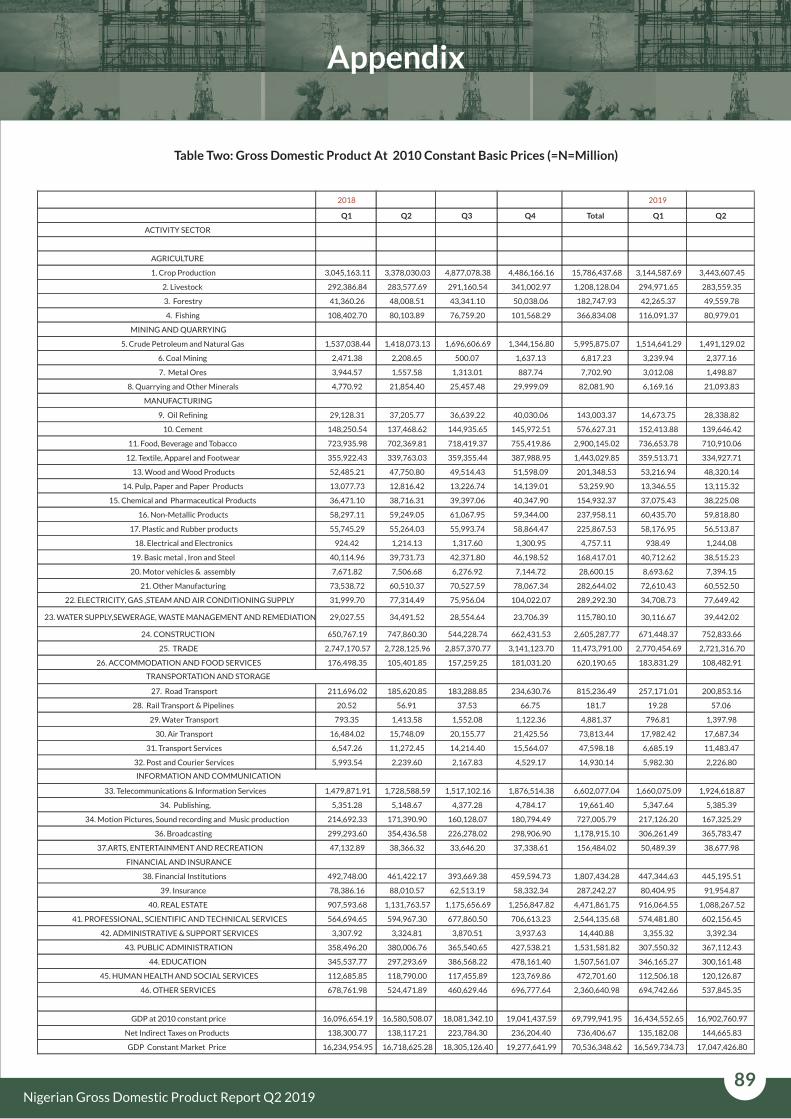
1. Crop Production 3,045,163.11 3,378,030.03 4,877,078.38 4,486,166.16 15,786,437.68 3,144,587.69 3,443,607.45
2. Livestock 292,386.84 283,577.69 291,160.54 341,002.97 1,208,128.04 294,971.65 283,559.35
3. Forestry 41,360.26 48,008.51 43,341.10 50,038.06 182,747.93 42,265.37 49,559.78
4. Fishing 108,402.70 80,103.89 76,759.20 101,568.29 366,834.08 116,091.37 80,979.01
MINING AND QUARRYING
5. Crude Petroleum and Natural Gas 1,537,038.44 1,418,073.13 1,696,606.69 1,344,156.80 5,995,875.07 1,514,641.29 1,491,129.02
6. Coal Mining 2,471.38 2,208.65 500.07 1,637.13 6,817.23 3,239.94 2,377.16
7. Metal Ores 3,944.57 1,557.58 1,313.01 887.74 7,702.90 3,012.08 1,498.87
8. Quarrying and Other Minerals 4,770.92 21,854.40 25,457.48 29,999.09 82,081.90 6,169.16 21,093.83
MANUFACTURING
9. Oil Refining 29,128.31 37,205.77 36,639.22 40,030.06 143,003.37 14,673.75 28,338.82
10. Cement 148,250.54 137,468.62 144,935.65 145,972.51 576,627.31 152,413.88 139,646.42
11. Food, Beverage and Tobacco 723,935.98 702,369.81 718,419.37 755,419.86 2,900,145.02 736,653.78 710,910.06
12. Textile, Apparel and Footwear 355,922.43 339,763.03 359,355.44 387,988.95 1,443,029.85 359,513.71 334,927.71
13. Wood and Wood Products 52,485.21 47,750.80 49,514.43 51,598.09 201,348.53 53,216.94 48,320.14
14. Pulp, Paper and Paper Products 13,077.73 12,816.42 13,226.74 14,139.01 53,259.90 13,346.55 13,115.32
15. Chemical and Pharmaceutical Products 36,471.10 38,716.31 39,397.06 40,347.90 154,932.37 37,075.43 38,225.08
16. Non-Metallic Products 58,297.11 59,249.05 61,067.95 59,344.00 237,958.11 60,435.70 59,818.80
17. Plastic and Rubber products 55,745.29 55,264.03 55,993.74 58,864.47 225,867.53 58,176.95 56,513.87
18. Electrical and Electronics 924.42 1,214.13 1,317.60 1,300.95 4,757.11 938.49 1,244.08
19. Basic metal , Iron and Steel 40,114.96 39,731.73 42,371.80 46,198.52 168,417.01 40,712.62 38,515.23
20. Motor vehicles & assembly 7,671.82 7,506.68 6,276.92 7,144.72 28,600.15 8,693.62 7,394.15
21. Other Manufacturing 73,538.72 60,510.37 70,527.59 78,067.34 282,644.02 72,610.43 60,552.50
22. ELECTRICITY, GAS ,STEAM AND AIR CONDITIONING SUPPLY 31,999.70 77,314.49 75,956.04 104,022.07 289,292.30 34,708.73 77,649.42
23. WATER SUPPLY,SEWERAGE, WASTE MANAGEMENT AND REMEDIATION 29,027.55 34,491.52 28,554.64 23,706.39 115,780.10 30,116.67 39,442.02
24. CONSTRUCTION 650,767.19 747,860.30 544,228.74 662,431.53 2,605,287.77 671,448.37 752,833.66
25. TRADE 2,747,170.57 2,728,125.96 2,857,370.77 3,141,123.70 11,473,791.00 2,770,454.69 2,721,316.70
26. ACCOMMODATION AND FOOD SERVICES 176,498.35 105,401.85 157,259.25 181,031.20 620,190.65 183,831.29 108,482.91
27. Road Transport 211,696.02 185,620.85 183,288.85 234,630.76 815,236.49 257,171.01 200,853.16
28. Rail Transport & Pipelines 20.52 56.91 37.53 66.75 181.7 19.28 57.06
29. Water Transport 793.35 1,413.58 1,552.08 1,122.36 4,881.37 796.81 1,397.98
30. Air Transport 16,484.02 15,748.09 20,155.77 21,425.56 73,813.44 17,982.42 17,687.34
31. Transport Services 6,547.26 11,272.45 14,214.40 15,564.07 47,598.18 6,685.19 11,483.47
32. Post and Courier Services 5,993.54 2,239.60 2,167.83 4,529.17 14,930.14 5,982.30 2,226.80
33. Telecommunications & Information Services 1,479,871.91 1,728,588.59 1,517,102.16 1,876,514.38 6,602,077.04 1,660,075.09 1,924,618.87
34. Publishing, 5,351.28 5,148.67 4,377.28 4,784.17 19,661.40 5,347.64 5,385.39
34. Motion Pictures, Sound recording and Music production 214,692.33 171,390.90 160,128.07 180,794.49 727,005.79 217,126.20 167,325.29
36. Broadcasting 299,293.60 354,436.58 226,278.02 298,906.90 1,178,915.10 306,261.49 365,783.47
37.ARTS, ENTERTAINMENT AND RECREATION 47,132.89 38,366.32 33,646.20 37,338.61 156,484.02 50,489.39 38,677.98
FINANCIAL AND INSURANCE
38. Financial Institutions 492,748.00 461,422.17 393,669.38 459,594.73 1,807,434.28 447,344.63 445,195.51
39. Insurance 78,386.16 88,010.57 62,513.19 58,332.34 287,242.27 80,404.95 91,954.87
40. REAL ESTATE 907,593.68 1,131,763.57 1,175,656.69 1,256,847.82 4,471,861.75 916,064.55 1,088,267.52
41. PROFESSIONAL, SCIENTIFIC AND TECHNICAL SERVICES 564,694.65 594,967.30 677,860.50 706,613.23 2,544,135.68 574,481.80 602,156.45
42. ADMINISTRATIVE & SUPPORT SERVICES 3,307.92 3,324.81 3,870.51 3,937.63 14,440.88 3,355.32 3,392.34
43. PUBLIC ADMINISTRATION 358,496.20 380,006.76 365,540.65 427,538.21 1,531,581.82 307,550.32 367,112.43
44. EDUCATION 345,537.77 297,293.69 386,568.22 478,161.40 1,507,561.07 346,165.27 300,161.48
45. HUMAN HEALTH AND SOCIAL SERVICES 112,685.85 118,790.00 117,455.89 123,769.86 472,701.60 112,506.18 120,126.87
46. OTHER SERVICES 678,761.98 524,471.89 460,629.46 696,777.64 2,360,640.98 694,742.66 537,845.35
GDP at 2010 constant price 16,096,654.19 16,580,508.07 18,081,342.10 19,041,437.59 69,799,941.95 16,434,552.65 16,902,760.97
Net Indirect Taxes on Products 138,300.77 138,117.21 223,784.30 236,204.40 736,406.67 135,182.08 144,665.83
GDP Constant Market Price 16,234,954.95 16,718,625.28 18,305,126.40 19,277,641.99 70,536,348.62 16,569,734.73 17,047,426.80
TRANSPORTATION AND STORAGE
INFORMATION AND COMMUNICATION
Table Two: Gross Domestic Product At 2010 Constant Basic Prices (=N=Million)
Appendix
90Nigerian Gross Domestic Product Report Q2 2019
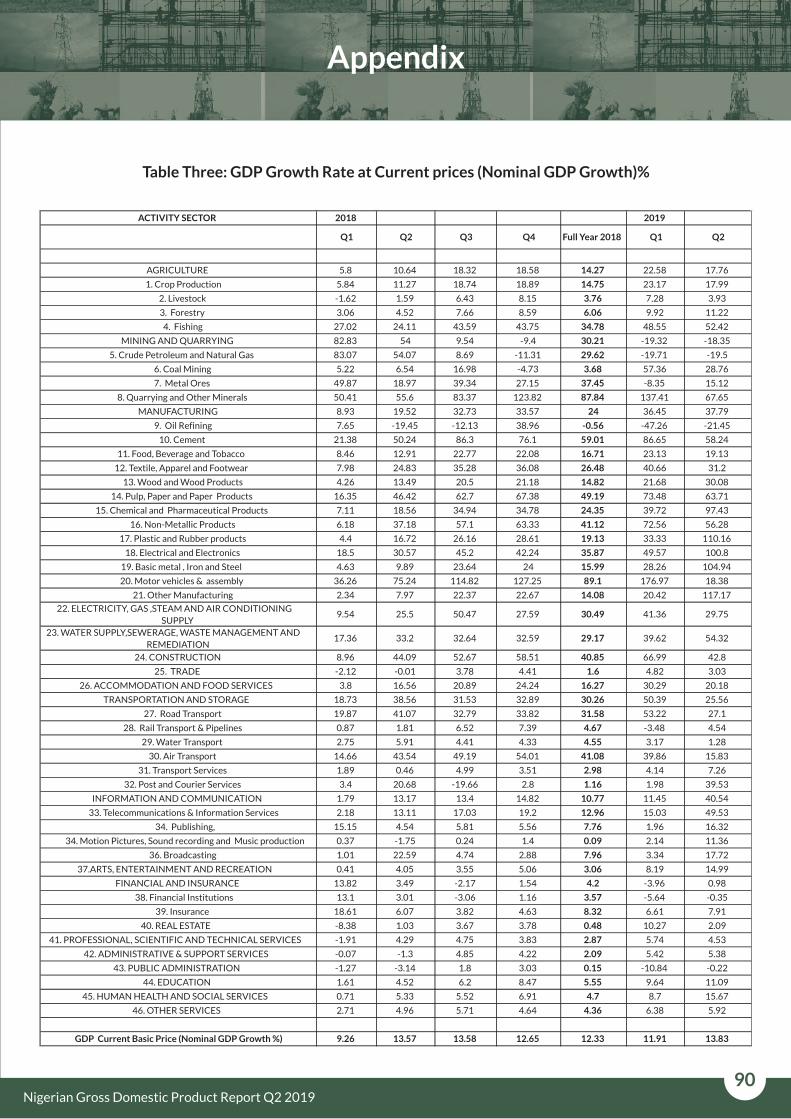
ACTIVITY SECTOR 2018 2019
Q1 Q2 Q3 Q4 Full Year 2018 Q1 Q2
AGRICULTURE 5.8 10.64 18.32 18.58 14.27 22.58 17.76
1. Crop Production 5.84 11.27 18.74 18.89 14.75 23.17 17.99
2. Livestock -1.62 1.59 6.43 8.15 3.76 7.28 3.93
3. Forestry 3.06 4.52 7.66 8.59 6.06 9.92 11.22
4. Fishing 27.02 24.11 43.59 43.75 34.78 48.55 52.42
MINING AND QUARRYING 82.83 54 9.54 -9.4 30.21 -19.32 -18.35
5. Crude Petroleum and Natural Gas 83.07 54.07 8.69 -11.31 29.62 -19.71 -19.5
6. Coal Mining 5.22 6.54 16.98 -4.73 3.68 57.36 28.76
7. Metal Ores 49.87 18.97 39.34 27.15 37.45 -8.35 15.12
8. Quarrying and Other Minerals 50.41 55.6 83.37 123.82 87.84 137.41 67.65
MANUFACTURING 8.93 19.52 32.73 33.57 24 36.45 37.79
9. Oil Refining 7.65 -19.45 -12.13 38.96 -0.56 -47.26 -21.45
10. Cement 21.38 50.24 86.3 76.1 59.01 86.65 58.24
11. Food, Beverage and Tobacco 8.46 12.91 22.77 22.08 16.71 23.13 19.13
12. Textile, Apparel and Footwear 7.98 24.83 35.28 36.08 26.48 40.66 31.2
13. Wood and Wood Products 4.26 13.49 20.5 21.18 14.82 21.68 30.08
14. Pulp, Paper and Paper Products 16.35 46.42 62.7 67.38 49.19 73.48 63.71
15. Chemical and Pharmaceutical Products 7.11 18.56 34.94 34.78 24.35 39.72 97.43
16. Non-Metallic Products 6.18 37.18 57.1 63.33 41.12 72.56 56.28
17. Plastic and Rubber products 4.4 16.72 26.16 28.61 19.13 33.33 110.16
18. Electrical and Electronics 18.5 30.57 45.2 42.24 35.87 49.57 100.8
19. Basic metal , Iron and Steel 4.63 9.89 23.64 24 15.99 28.26 104.94
20. Motor vehicles & assembly 36.26 75.24 114.82 127.25 89.1 176.97 18.38
21. Other Manufacturing 2.34 7.97 22.37 22.67 14.08 20.42 117.17
22. ELECTRICITY, GAS ,STEAM AND AIR CONDITIONING
SUPPLY9.54 25.5 50.47 27.59 30.49 41.36 29.75
23. WATER SUPPLY,SEWERAGE, WASTE MANAGEMENT AND
REMEDIATION17.36 33.2 32.64 32.59 29.17 39.62 54.32
24. CONSTRUCTION 8.96 44.09 52.67 58.51 40.85 66.99 42.8
25. TRADE -2.12 -0.01 3.78 4.41 1.6 4.82 3.03
26. ACCOMMODATION AND FOOD SERVICES 3.8 16.56 20.89 24.24 16.27 30.29 20.18
TRANSPORTATION AND STORAGE 18.73 38.56 31.53 32.89 30.26 50.39 25.56
27. Road Transport 19.87 41.07 32.79 33.82 31.58 53.22 27.1
28. Rail Transport & Pipelines 0.87 1.81 6.52 7.39 4.67 -3.48 4.54
29. Water Transport 2.75 5.91 4.41 4.33 4.55 3.17 1.28
30. Air Transport 14.66 43.54 49.19 54.01 41.08 39.86 15.83
31. Transport Services 1.89 0.46 4.99 3.51 2.98 4.14 7.26
32. Post and Courier Services 3.4 20.68 -19.66 2.8 1.16 1.98 39.53
INFORMATION AND COMMUNICATION 1.79 13.17 13.4 14.82 10.77 11.45 40.54
33. Telecommunications & Information Services 2.18 13.11 17.03 19.2 12.96 15.03 49.53
34. Publishing, 15.15 4.54 5.81 5.56 7.76 1.96 16.32
34. Motion Pictures, Sound recording and Music production 0.37 -1.75 0.24 1.4 0.09 2.14 11.36
36. Broadcasting 1.01 22.59 4.74 2.88 7.96 3.34 17.72
37.ARTS, ENTERTAINMENT AND RECREATION 0.41 4.05 3.55 5.06 3.06 8.19 14.99
FINANCIAL AND INSURANCE 13.82 3.49 -2.17 1.54 4.2 -3.96 0.98
38. Financial Institutions 13.1 3.01 -3.06 1.16 3.57 -5.64 -0.35
39. Insurance 18.61 6.07 3.82 4.63 8.32 6.61 7.91
40. REAL ESTATE -8.38 1.03 3.67 3.78 0.48 10.27 2.09
41. PROFESSIONAL, SCIENTIFIC AND TECHNICAL SERVICES -1.91 4.29 4.75 3.83 2.87 5.74 4.53
42. ADMINISTRATIVE & SUPPORT SERVICES -0.07 -1.3 4.85 4.22 2.09 5.42 5.38
43. PUBLIC ADMINISTRATION -1.27 -3.14 1.8 3.03 0.15 -10.84 -0.22
44. EDUCATION 1.61 4.52 6.2 8.47 5.55 9.64 11.09
45. HUMAN HEALTH AND SOCIAL SERVICES 0.71 5.33 5.52 6.91 4.7 8.7 15.67
46. OTHER SERVICES 2.71 4.96 5.71 4.64 4.36 6.38 5.92
GDP Current Basic Price (Nominal GDP Growth %) 9.26 13.57 13.58 12.65 12.33 11.91 13.83
Table Three: GDP Growth Rate at Current prices (Nominal GDP Growth)%

Appendix
91Nigerian Gross Domestic Product Report Q2 2019
ACTIVITY SECTOR 2018 2019
Q1 Q2 Q3 Q4 Full Year 2018 Q1 Q2
AGRICULTURE 3 1.19 1.91 2.46 2.12 3.17 1.79
1. Crop Production 3.45 1.49 1.87 2.48 2.26 3.26 1.94
2. Livestock -1.85 -1.95 2.56 2.35 0.33 0.88 -0.01
3. Forestry 2.94 3.96 3.72 1.73 3.06 2.19 3.23
4. Fishing 4.25 -1.35 0.84 1.97 1.64 7.09 1.09
MINING AND QUARRYING 14.1 -3.84 -2.81 -1.23 1.11 -1.37 5.02
5. Crude Petroleum and Natural Gas 14.02 -3.95 -2.91 -1.62 0.97 -1.46 5.15
6. Coal Mining 2.46 -4.03 -1.74 -18.78 -5.81 31.1 7.63
7. Metal Ores 45.94 7.16 17.04 8.41 26.34 -23.64 -3.77
8. Quarrying and Other Minerals 27.45 3.31 3.08 20.95 10.33 29.31 -3.48
MANUFACTURING 3.39 0.68 1.92 2.35 2.09 0.81 -0.13
9. Oil Refining 7.06 -21.49 -17.39 33.6 -3.97 -49.62 -23.83
10. Cement 5.28 3.84 8.14 0.98 4.5 2.81 1.58
11. Food, Beverage and Tobacco 5.46 1.21 2.9 2.22 2.93 1.76 1.22
12. Textile, Apparel and Footwear 1.85 2.73 1.04 1.24 1.69 1.01 -1.42
13. Wood and Wood Products 1.53 2.23 1.47 1.62 1.7 1.39 1.19
14. Pulp, Paper and Paper Products 3.41 5.88 2.06 2.62 3.44 2.06 2.33
15. Chemical and Pharmaceutical Products 1.36 -1.62 1.24 1.52 0.61 1.66 -1.27
16. Non-Metallic Products -4.94 0.6 0.36 2.26 -0.48 3.67 0.96
17. Plastic and Rubber products 0.43 1.28 0.95 3.44 1.54 4.36 2.26
18. Electrical and Electronics 10.14 3.71 3.06 0.33 3.75 1.52 2.47
19. Basic metal , Iron and Steel 0.88 -4.01 -0.24 0.32 -0.75 1.49 -3.06
20. Motor vehicles & assembly 2.29 -2.88 -4.02 -5.7 -2.54 13.32 -1.5
21. Other Manufacturing -0.63 -3.66 1.67 1.7 -0.11 -1.26 0.07
22. ELECTRICITY, GAS ,STEAM AND AIR CONDITIONING
SUPPLY4.93 7.59 18.27 0.95 7.3 8.47 0.43
23. WATER SUPPLY,SEWERAGE, WASTE MANAGEMENT AND
REMEDIATION11.61 11.98 2.32 1.85 7.21 3.75 14.35
24. CONSTRUCTION -1.54 7.66 0.54 2.05 2.33 3.18 0.67
25. TRADE -2.57 -2.14 0.98 1.02 -0.63 0.85 -0.25
26. ACCOMMODATION AND FOOD SERVICES 0.29 2.43 2.66 2.05 1.76 4.15 2.92
TRANSPORTATION AND STORAGE 14.45 21.76 11.95 9.48 13.91 19.5 8.02
27. Road Transport 15.63 23.36 12.07 9.1 14.47 21.48 8.21
28. Rail Transport & Pipelines 0.56 0.29 4.52 4.95 2.86 -6.04 0.25
29. Water Transport 2.43 4.33 2.45 1.96 2.87 0.44 -1.1
30. Air Transport 10.22 24.29 24.35 23.7 20.7 9.09 12.31
31. Transport Services 2.33 0.05 3.54 1.78 1.96 2.11 1.87
32. Post and Courier Services 3.14 19.24 -20.88 0.93 0.09 -0.19 -0.57
INFORMATION AND COMMUNICATION 1.58 11.81 12.09 13.2 9.65 9.48 9.01
33. Telecommunications & Information Services 1.88 11.54 14.97 16.67 11.33 12.18 11.34
34. Publishing, 12.53 3.38 4.32 3.76 6.03 -0.07 4.6
34. Motion Pictures, Sound recording and Music production 0.26 -2.29 -0.45 0.55 -0.44 1.13 -2.37
36. Broadcasting 0.9 21.92 4.01 2.01 7.38 2.33 3.2
37.ARTS, ENTERTAINMENT AND RECREATION 0.3 3.48 2.83 4.18 2.53 7.12 0.81
FINANCIAL AND INSURANCE 13.3 1.28 -4.81 -1.76 2.03 -7.6 -2.24
38. Financial Institutions 12.58 0.81 -5.67 -2.13 1.41 -9.21 -3.52
39. Insurance 18.07 3.81 1.03 1.23 6.12 2.58 4.48
40. REAL ESTATE -9.4 -3.88 -2.68 -3.85 -4.74 0.93 -3.84
41. PROFESSIONAL, SCIENTIFIC AND TECHNICAL SERVICES -2.35 2.07 1.93 0.46 0.57 1.73 1.21
42. ADMINISTRATIVE & SUPPORT SERVICES -0.52 -3.41 2.02 0.83 -0.18 1.43 2.03
43. PUBLIC ADMINISTRATION -1.72 -5.21 -0.95 -0.32 -2.05 -14.21 -3.39
44. EDUCATION 0.45 -0.67 -0.42 0.35 -0.03 0.18 0.96
45. HUMAN HEALTH AND SOCIAL SERVICES -0.37 0.41 -0.68 -0.64 -0.32 -0.16 1.13
46. OTHER SERVICES 2.24 2.72 2.86 1.24 2.17 2.35 2.55
GDP at 2010 constant price (Real GDP Growth %) 1.89 1.5 1.81 2.38 1.91 2.1 1.94
Table Four: GDP Growth Rate at Constant 2010 prices (Real GDP Growth)%

Appendix
92Nigerian Gross Domestic Product Report Q2 2019
2018 2019
Q1 Q2 Q3 Q4 Total Q1 Q2
ACTIVITY SECTOR
AGRICULTURE
1. Crop Production 137.96 149.22 159.14 160.6 153.35 164.55 172.71
2. Livestock 164.16 169.88 170.22 173.39 169.57 174.57 176.57
3. Forestry 145.12 145.82 150.58 154.87 149.27 156.11 157.11
4. Fishing 199.89 215.08 253.21 254.77 229.56 277.28 324.29
MINING AND QUARRYING
5. Crude Petroleum and Natural Gas 255.12 262.96 203.49 172.68 223.89 207.86 201.32
6. Coal Mining 132.61 144.87 155.92 154.25 143.49 159.17 173.31
7. Metal Ores 132.61 144.87 155.92 154.25 141.56 159.17 173.31
8. Quarrying and Other Minerals 162.72 216.36 259.52 276.64 248.66 298.76 375.82
MANUFACTURING
9. Oil Refining 142.65 145.94 151.44 148.2 147.31 149.35 150.51
10. Cement 169.86 221.16 267.01 276.03 233.38 308.37 344.5
11. Food, Beverage and Tobacco 164.88 180.81 194.11 195.16 183.87 199.5 212.81
12. Textile, Apparel and Footwear 171.57 200.5 222.47 225.36 205.52 238.92 266.85
13. Wood and Wood Products 156.59 171.06 183.65 185.18 174 187.92 219.89
14. Pulp, Paper and Paper Products 181.75 230.76 269.21 280.32 241.43 308.96 369.16
15. Chemical and Pharmaceutical Products 151.43 175.95 195.9 196.8 180.68 208.13 351.86
16. Non-Metallic Products 189.06 238.05 276.41 286.73 248.03 314.69 368.48
17. Plastic and Rubber products 150.68 169.44 184.66 184.82 172.59 192.51 348.21
18. Electrical and Electronics 151.46 181.37 204.65 208.24 189.35 223.14 355.42
19. Basic metal , Iron and Steel 146.63 164.07 178.46 178.97 167.62 185.31 346.86
20. Motor vehicles & assembly 256 367.84 467.07 524.15 398.67 625.69 442.06
21. Other Manufacturing 144.06 158.56 170.95 172.12 161.62 175.7 344.11
22. ELECTRICITY, GAS ,STEAM AND AIR CONDITIONING SUPPLY 253.59 287.74 315.54 315.58 301.27 330.49 371.73
23. WATER SUPPLY,SEWERAGE, WASTE MANAGEMENT AND REMEDIATION 156.62 180.29 197.68 200.07 182.69 210.77 243.29
24. CONSTRUCTION 180.5 224.73 257.73 267.67 231.49 292.12 318.8
25. TRADE 187.28 190.91 192.15 193.4 191.03 194.65 197.18
26. ACCOMMODATION AND FOOD SERVICES 164.95 183.69 190.95 198.49 184.52 206.34 214.49
27. Road Transport 224.59 251.06 261.37 272.09 252.56 283.26 294.89
28. Rail Transport & Pipelines 186.21 188.71 189.56 190.42 189.23 191.28 196.78
29. Water Transport 199.01 201.69 202.6 203.51 201.96 204.43 206.54
30. Air Transport 177.32 199.7 208.51 217.72 202.34 227.33 205.95
31. Transport Services 184.84 186.66 187.28 187.9 187 188.52 196.54
32. Post and Courier Services 138.48 139.98 140.48 140.99 139.76 141.5 196.43
33. Telecommunications & Information Services 144.53 146.34 146.96 147.58 146.43 148.2 196.54
34. Publishing, 174.96 176.72 177.31 177.91 176.66 178.5 196.52
34. Motion Pictures, Sound recording and Music production 171.16 172.01 172.29 172.58 171.96 172.86 196.2
36. Broadcasting 171.16 172.01 172.29 172.58 171.99 172.86 196.2
37.ARTS, ENTERTAINMENT AND RECREATION 171.16 172.01 172.29 172.58 171.95 172.86 196.2
FINANCIAL AND INSURANCE
38. Financial Institutions 187.28 190.91 192.15 193.4 190.82 194.65 197.18
39. Insurance 187.28 190.91 192.15 193.4 190.69 194.65 197.18
40. REAL ESTATE 184.1 192.31 195.21 198.15 193.05 201.14 204.17
41. PROFESSIONAL, SCIENTIFIC AND TECHNICAL SERVICES 187.28 190.91 192.15 193.4 191.13 194.65 197.18
42. ADMINISTRATIVE & SUPPORT SERVICES 187.28 190.91 192.15 193.4 191.09 194.65 197.18
43. PUBLIC ADMINISTRATION 187.28 190.91 192.15 193.4 191.05 194.65 197.18
44. EDUCATION 172.84 180.7 183.48 186.3 181.39 189.16 198.83
45. HUMAN HEALTH AND SOCIAL SERVICES 166.45 173.58 176.09 178.64 173.83 181.22 198.54
46. OTHER SERVICES 187.28 190.91 192.15 193.4 190.84 194.65 197.18
GDP Deflator 176.67 185.15 184.54 185.02 183 193.64 206.74
TRANSPORTATION AND STORAGE
INFORMATION AND COMMUNICATION
Table Five: Implicit Price Deflators
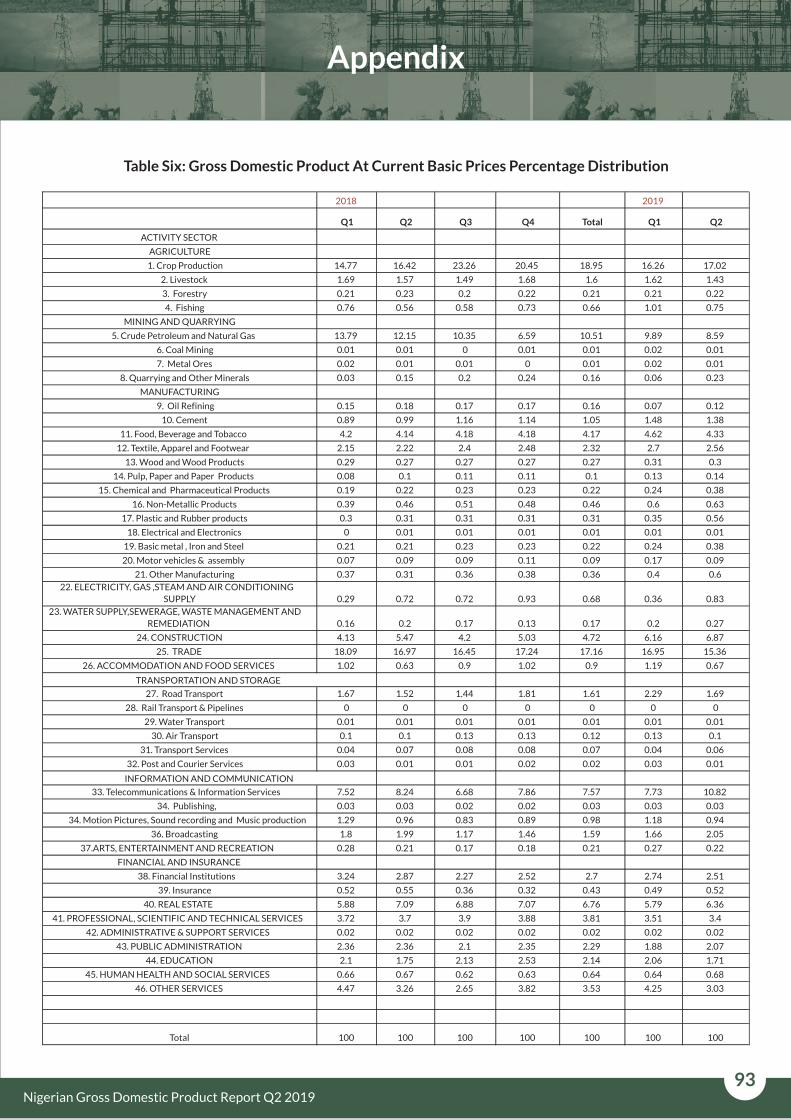
Appendix
93Nigerian Gross Domestic Product Report Q2 2019
2018 2019
Q1 Q2 Q3 Q4 Total Q1 Q2
ACTIVITY SECTOR
AGRICULTURE
1. Crop Production 14.77 16.42 23.26 20.45 18.95 16.26 17.02
2. Livestock 1.69 1.57 1.49 1.68 1.6 1.62 1.43
3. Forestry 0.21 0.23 0.2 0.22 0.21 0.21 0.22
4. Fishing 0.76 0.56 0.58 0.73 0.66 1.01 0.75
MINING AND QUARRYING
5. Crude Petroleum and Natural Gas 13.79 12.15 10.35 6.59 10.51 9.89 8.59
6. Coal Mining 0.01 0.01 0 0.01 0.01 0.02 0.01
7. Metal Ores 0.02 0.01 0.01 0 0.01 0.02 0.01
8. Quarrying and Other Minerals 0.03 0.15 0.2 0.24 0.16 0.06 0.23
MANUFACTURING
9. Oil Refining 0.15 0.18 0.17 0.17 0.16 0.07 0.12
10. Cement 0.89 0.99 1.16 1.14 1.05 1.48 1.38
11. Food, Beverage and Tobacco 4.2 4.14 4.18 4.18 4.17 4.62 4.33
12. Textile, Apparel and Footwear 2.15 2.22 2.4 2.48 2.32 2.7 2.56
13. Wood and Wood Products 0.29 0.27 0.27 0.27 0.27 0.31 0.3
14. Pulp, Paper and Paper Products 0.08 0.1 0.11 0.11 0.1 0.13 0.14
15. Chemical and Pharmaceutical Products 0.19 0.22 0.23 0.23 0.22 0.24 0.38
16. Non-Metallic Products 0.39 0.46 0.51 0.48 0.46 0.6 0.63
17. Plastic and Rubber products 0.3 0.31 0.31 0.31 0.31 0.35 0.56
18. Electrical and Electronics 0 0.01 0.01 0.01 0.01 0.01 0.01
19. Basic metal , Iron and Steel 0.21 0.21 0.23 0.23 0.22 0.24 0.38
20. Motor vehicles & assembly 0.07 0.09 0.09 0.11 0.09 0.17 0.09
21. Other Manufacturing 0.37 0.31 0.36 0.38 0.36 0.4 0.6
22. ELECTRICITY, GAS ,STEAM AND AIR CONDITIONING
SUPPLY 0.29 0.72 0.72 0.93 0.68 0.36 0.83
23. WATER SUPPLY,SEWERAGE, WASTE MANAGEMENT AND
REMEDIATION 0.16 0.2 0.17 0.13 0.17 0.2 0.27
24. CONSTRUCTION 4.13 5.47 4.2 5.03 4.72 6.16 6.87
25. TRADE 18.09 16.97 16.45 17.24 17.16 16.95 15.36
26. ACCOMMODATION AND FOOD SERVICES 1.02 0.63 0.9 1.02 0.9 1.19 0.67
27. Road Transport 1.67 1.52 1.44 1.81 1.61 2.29 1.69
28. Rail Transport & Pipelines 0 0 0 0 0 0 0
29. Water Transport 0.01 0.01 0.01 0.01 0.01 0.01 0.01
30. Air Transport 0.1 0.1 0.13 0.13 0.12 0.13 0.1
31. Transport Services 0.04 0.07 0.08 0.08 0.07 0.04 0.06
32. Post and Courier Services 0.03 0.01 0.01 0.02 0.02 0.03 0.01
33. Telecommunications & Information Services 7.52 8.24 6.68 7.86 7.57 7.73 10.82
34. Publishing, 0.03 0.03 0.02 0.02 0.03 0.03 0.03
34. Motion Pictures, Sound recording and Music production 1.29 0.96 0.83 0.89 0.98 1.18 0.94
36. Broadcasting 1.8 1.99 1.17 1.46 1.59 1.66 2.05
37.ARTS, ENTERTAINMENT AND RECREATION 0.28 0.21 0.17 0.18 0.21 0.27 0.22
FINANCIAL AND INSURANCE
38. Financial Institutions 3.24 2.87 2.27 2.52 2.7 2.74 2.51
39. Insurance 0.52 0.55 0.36 0.32 0.43 0.49 0.52
40. REAL ESTATE 5.88 7.09 6.88 7.07 6.76 5.79 6.36
41. PROFESSIONAL, SCIENTIFIC AND TECHNICAL SERVICES 3.72 3.7 3.9 3.88 3.81 3.51 3.4
42. ADMINISTRATIVE & SUPPORT SERVICES 0.02 0.02 0.02 0.02 0.02 0.02 0.02
43. PUBLIC ADMINISTRATION 2.36 2.36 2.1 2.35 2.29 1.88 2.07
44. EDUCATION 2.1 1.75 2.13 2.53 2.14 2.06 1.71
45. HUMAN HEALTH AND SOCIAL SERVICES 0.66 0.67 0.62 0.63 0.64 0.64 0.68
46. OTHER SERVICES 4.47 3.26 2.65 3.82 3.53 4.25 3.03
Total 100 100 100 100 100 100 100
TRANSPORTATION AND STORAGE
INFORMATION AND COMMUNICATION
Table Six: Gross Domestic Product At Current Basic Prices Percentage Distribution

Appendix
94Nigerian Gross Domestic Product Report Q2 2019
2018 2019
Q1 Q2 Q3 Q4 Total Q1 Q2
ACTIVITY SECTOR
AGRICULTURE
1. Crop Production 18.92 20.37 26.97 23.56 22.62 19.13 20.37
2. Livestock 1.82 1.71 1.61 1.79 1.73 1.79 1.68
3. Forestry 0.26 0.29 0.24 0.26 0.26 0.26 0.29
4. Fishing 0.67 0.48 0.42 0.53 0.53 0.71 0.48
MINING AND QUARRYING
5. Crude Petroleum and Natural Gas 9.55 8.55 9.38 7.06 8.59 9.22 8.82
6. Coal Mining 0.02 0.01 0 0.01 0.01 0.02 0.01
7. Metal Ores 0.02 0.01 0.01 0 0.01 0.02 0.01
8. Quarrying and Other Minerals 0.03 0.13 0.14 0.16 0.12 0.04 0.12
MANUFACTURING
9. Oil Refining 0.18 0.22 0.2 0.21 0.2 0.09 0.17
10. Cement 0.92 0.83 0.8 0.77 0.83 0.93 0.83
11. Food, Beverage and Tobacco 4.5 4.24 3.97 3.97 4.15 4.48 4.21
12. Textile, Apparel and Footwear 2.21 2.05 1.99 2.04 2.07 2.19 1.98
13. Wood and Wood Products 0.33 0.29 0.27 0.27 0.29 0.32 0.29
14. Pulp, Paper and Paper Products 0.08 0.08 0.07 0.07 0.08 0.08 0.08
15. Chemical and Pharmaceutical Products 0.23 0.23 0.22 0.21 0.22 0.23 0.23
16. Non-Metallic Products 0.36 0.36 0.34 0.31 0.34 0.37 0.35
17. Plastic and Rubber products 0.35 0.33 0.31 0.31 0.32 0.35 0.33
18. Electrical and Electronics 0.01 0.01 0.01 0.01 0.01 0.01 0.01
19. Basic metal , Iron and Steel 0.25 0.24 0.23 0.24 0.24 0.25 0.23
20. Motor vehicles & assembly 0.05 0.05 0.03 0.04 0.04 0.05 0.04
21. Other Manufacturing 0.46 0.36 0.39 0.41 0.4 0.44 0.36
22. ELECTRICITY, GAS ,STEAM AND AIR CONDITIONING
SUPPLY 0.2 0.47 0.42 0.55 0.41 0.21 0.46
23. WATER SUPPLY,SEWERAGE, WASTE MANAGEMENT AND
REMEDIATION 0.18 0.21 0.16 0.12 0.17 0.18 0.23
24. CONSTRUCTION 4.04 4.51 3.01 3.48 3.73 4.09 4.45
25. TRADE 17.07 16.45 15.8 16.5 16.44 16.86 16.1
26. ACCOMMODATION AND FOOD SERVICES 1.1 0.64 0.87 0.95 0.89 1.12 0.64
27. Road Transport 1.32 1.12 1.01 1.23 1.17 1.56 1.19
28. Rail Transport & Pipelines 0 0 0 0 0 0 0
29. Water Transport 0 0.01 0.01 0.01 0.01 0 0.01
30. Air Transport 0.1 0.09 0.11 0.11 0.11 0.11 0.1
31. Transport Services 0.04 0.07 0.08 0.08 0.07 0.04 0.07
32. Post and Courier Services 0.04 0.01 0.01 0.02 0.02 0.04 0.01
33. Telecommunications & Information Services 9.19 10.43 8.39 9.85 9.46 10.1 11.39
34. Publishing, 0.03 0.03 0.02 0.03 0.03 0.03 0.03
34. Motion Pictures, Sound recording and Music production 1.33 1.03 0.89 0.95 1.04 1.32 0.99
36. Broadcasting 1.86 2.14 1.25 1.57 1.69 1.86 2.16
37.ARTS, ENTERTAINMENT AND RECREATION 0.29 0.23 0.19 0.2 0.22 0.31 0.23
FINANCIAL AND INSURANCE
38. Financial Institutions 3.06 2.78 2.18 2.41 2.59 2.72 2.63
39. Insurance 0.49 0.53 0.35 0.31 0.41 0.49 0.54
40. REAL ESTATE 5.64 6.83 6.5 6.6 6.41 5.57 6.44
41. PROFESSIONAL, SCIENTIFIC AND TECHNICAL SERVICES 3.51 3.59 3.75 3.71 3.64 3.5 3.56
42. ADMINISTRATIVE & SUPPORT SERVICES 0.02 0.02 0.02 0.02 0.02 0.02 0.02
43. PUBLIC ADMINISTRATION 2.23 2.29 2.02 2.25 2.19 1.87 2.17
44. EDUCATION 2.15 1.79 2.14 2.51 2.16 2.11 1.78
45. HUMAN HEALTH AND SOCIAL SERVICES 0.7 0.72 0.65 0.65 0.68 0.68 0.71
46. OTHER SERVICES 4.22 3.16 2.55 3.66 3.38 4.23 3.18
Total 100 100 100 100 100 100 100
TRANSPORTATION AND STORAGE
INFORMATION AND COMMUNICATION
Table Seven: Gross Domestic Product At 2010 Basic Prices Percentage Distribution
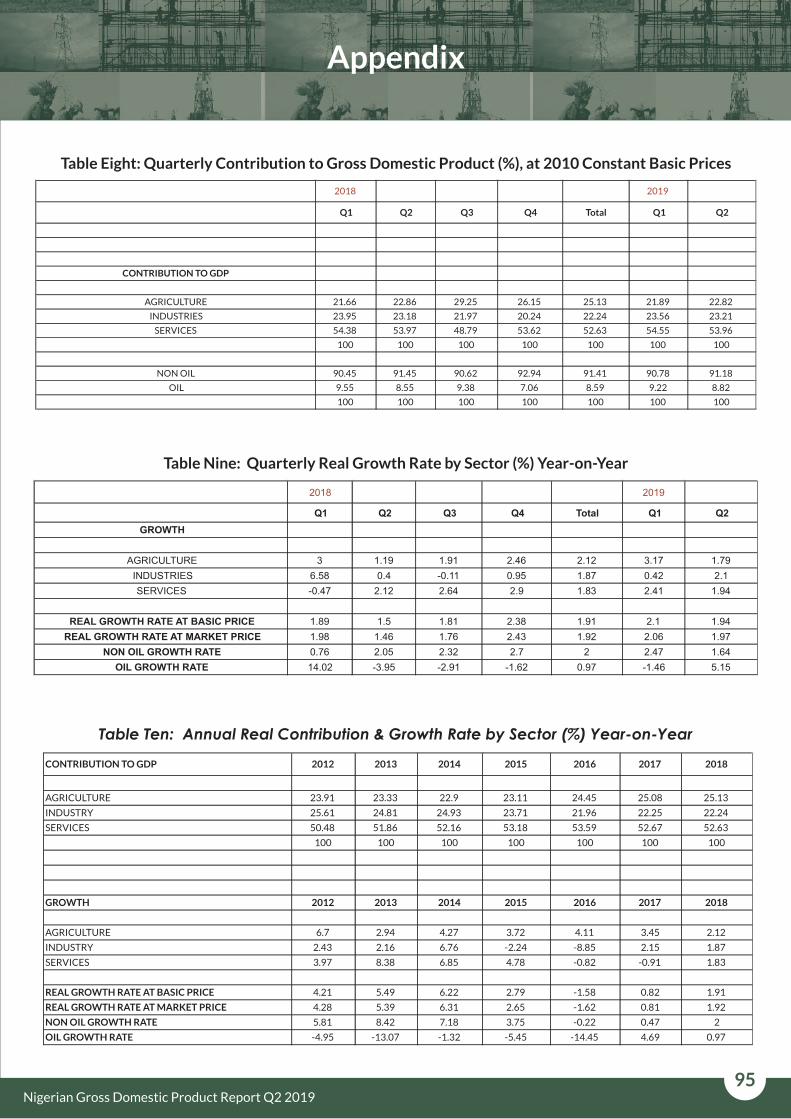
Appendix
95Nigerian Gross Domestic Product Report Q2 2019
2018 2019
Q1 Q2 Q3 Q4 Total Q1 Q2
CONTRIBUTION TO GDP
AGRICULTURE 21.66 22.86 29.25 26.15 25.13 21.89 22.82
INDUSTRIES 23.95 23.18 21.97 20.24 22.24 23.56 23.21
SERVICES 54.38 53.97 48.79 53.62 52.63 54.55 53.96
100 100 100 100 100 100 100
NON OIL 90.45 91.45 90.62 92.94 91.41 90.78 91.18
OIL 9.55 8.55 9.38 7.06 8.59 9.22 8.82
100 100 100 100 100 100 100
Table Eight: Quarterly Contribution to Gross Domestic Product (%), at 2010 Constant Basic Prices
2018 2019
Q1 Q2 Q3 Q4 Total Q1 Q2
GROWTH
AGRICULTURE 3 1.19 1.91 2.46 2.12 3.17 1.79
INDUSTRIES 6.58 0.4 -0.11 0.95 1.87 0.42 2.1
SERVICES -0.47 2.12 2.64 2.9 1.83 2.41 1.94
REAL GROWTH RATE AT BASIC PRICE 1.89 1.5 1.81 2.38 1.91 2.1 1.94
REAL GROWTH RATE AT MARKET PRICE 1.98 1.46 1.76 2.43 1.92 2.06 1.97
NON OIL GROWTH RATE 0.76 2.05 2.32 2.7 2 2.47 1.64
OIL GROWTH RATE 14.02 -3.95 -2.91 -1.62 0.97 -1.46 5.15
Table Nine: Quarterly Real Growth Rate by Sector (%) Year-on-Year
Table Ten: Annual Real Contribution & Growth Rate by Sector (%) Year-on-Year
CONTRIBUTION TO GDP 2012 2013 2014 2015 2016 2017 2018
AGRICULTURE 23.91 23.33 22.9 23.11 24.45 25.08 25.13
INDUSTRY 25.61 24.81 24.93 23.71 21.96 22.25 22.24
SERVICES 50.48 51.86 52.16 53.18 53.59 52.67 52.63
100 100 100 100 100 100 100
GROWTH 2012 2013 2014 2015 2016 2017 2018
AGRICULTURE 6.7 2.94 4.27 3.72 4.11 3.45 2.12
INDUSTRY 2.43 2.16 6.76 -2.24 -8.85 2.15 1.87
SERVICES 3.97 8.38 6.85 4.78 -0.82 -0.91 1.83
REAL GROWTH RATE AT BASIC PRICE 4.21 5.49 6.22 2.79 -1.58 0.82 1.91
REAL GROWTH RATE AT MARKET PRICE 4.28 5.39 6.31 2.65 -1.62 0.81 1.92
NON OIL GROWTH RATE 5.81 8.42 7.18 3.75 -0.22 0.47 2
OIL GROWTH RATE -4.95 -13.07 -1.32 -5.45 -14.45 4.69 0.97
96
Acknowledgements/Contacts
We acknowledge our technical partners, Proshare in the design, concept and production of this publication.
Acknowledgements
Contact Us
Head Office Address
Plot 762,IndependenceAvenue,Central
Business District,FCT, Abuja Nigeria.
[email protected]+234 803 386 5388
@nigerianstat www.nigerianstat.gov.ng NBSNigeria
Nigerian Gross Domestic Product Report Q2 2019