NIGERIA SNAPSHOT Q3:2018 - Broll
8
NIGERIA SNAPSHOT Q3:2018 Property Intel Progressive property people.
Transcript of NIGERIA SNAPSHOT Q3:2018 - Broll

NIGERIA SNAPSHOT Q3:2018
Property Intel
Progressive property people.
NIGERIA SNAPSHOT Q3:2018 2
Nigeria’s economy grew by 1.5% in the second quarter of 2018, with the International Monetary Fund (IMF) predicting a full year growth rate
of 1.9%. Nonetheless, the pace of growth is slowing as GDP growth has declined from levels recorded in Q1:2018, edging investors and
other stakeholders towards a cautiously optimistic view on the economy’s recovery prospects. This is attributable to the country’s persistent
dependence on oil revenues to drive growth, with no real improvements in employment and aggregate demand.
The pace of increase in consumer prices has slowed dramatically, relative to recessionary levels in 2016/2017. Year-on-year (y-o-y) inflation
has declined to 11.28% as at September 2018, a stark difference from the 15.91% recorded the previous year. However, inflationary levels have
begun to pick up, as seen with a rise to current levels from 11.14% recorded in July 2018. This has reinforced the Central Bank of Nigeria’s (CBN)
decision to maintain the Monetary Policy Rate (MPR) at 14% so as to enable the economy to withstand any consequences of further increases
in the consumer price level.
Economic Overview
The Nigerian economy has sustained five consecutive quarters of positive growth, effectively
pulling the country out of a recession. However, this recovery has been relatively slow in
comparison to previous recessions, with low growth rates anticipated. Other macroeconomic
fundamentals, such as inflation and forex stability, have also generally performed well since
2017. However, economists and investors are concerned about recent shifts in the general
progress of the economy, as a notable slowdown in the pace of recovery is raising some red
flags. Are these signs of a turning point in the general economic trend that took off in 2017,
or rather a blip in the trend?
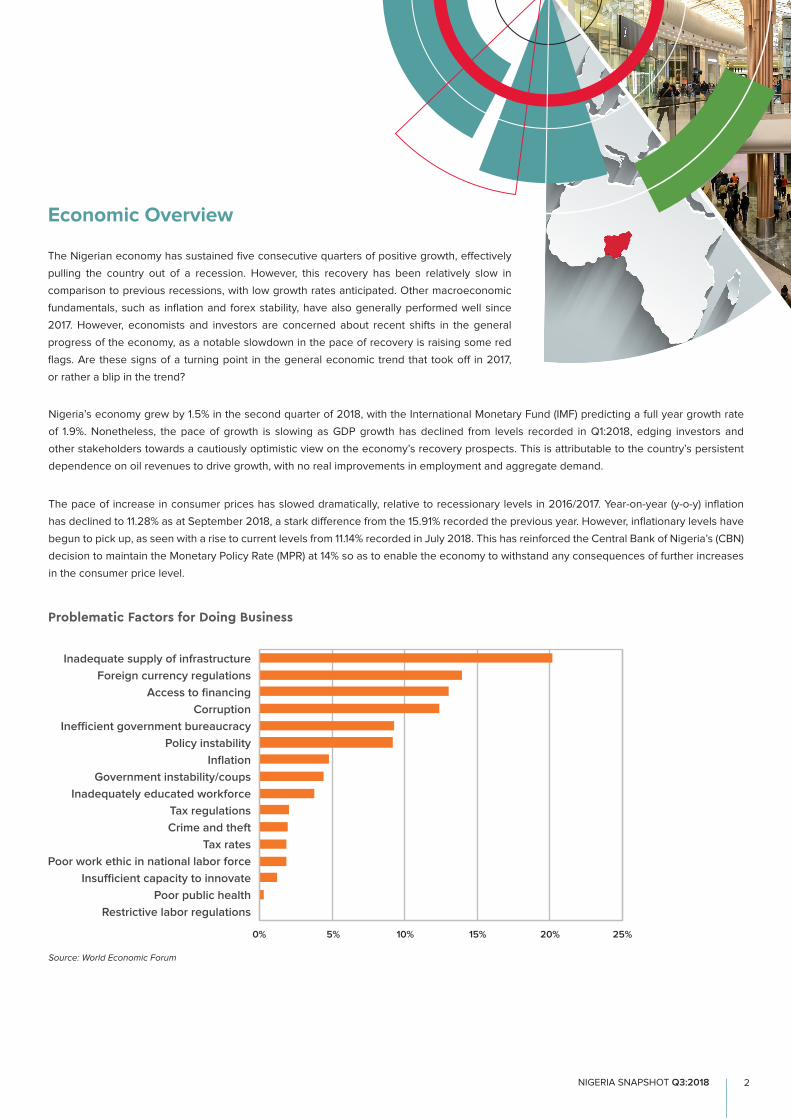
Problematic Factors for Doing Business
0% 5% 10% 15% 20% 25%
Restrictive labor regulations Poor public health
Insufficient capacity to innovate Poor work ethic in national labor force
Tax rates Crime and theft Tax regulations
Inadequately educated workforce Government instability/coups
Inflation Policy instability
Inefficient government bureaucracy Corruption
Access to financing Foreign currency regulations
Inadequate supply of infrastructure Inadequate supply of infrastructure
Foreign currency regulations
Access to financing
Corruption
Inefficient government bureaucracy
Policy instability
Inflation
Government instability/coups
Inadequately educated workforce
Tax regulations
Crime and theft
Tax rates
Poor work ethic in national labor force
Insufficient capacity to innovate
Poor public health
Restrictive labor regulations
0% 5% 10% 15% 20% 25%
Source: World Economic Forum

NIGERIA SNAPSHOT Q3:2018 3
Foreign exchange reserve levels have also increased in the past year,
majorly attributable to the CBN’s aggressive forex policy. The capacity of the
CBN to execute further accretion in reserve levels is largely dependent on the
performance of the global and domestic oil markets. Therefore, reserve levels
have fallen in recent times as production levels worryingly decline. Nonetheless,
reserves are up 13% year-to-date (y-t-d) and 34% y-o-y. With well over $9billion (y-t-d) in
intervention in key forex market segments, dollar liquidity has kept Naira values relatively
constant. NAFEX, parallel market and the official market rates all closed Q3:2018 at N363.92/
US$, N361/US$ and N306.35/US$ respectively. This is despite the fact that emerging market
currencies are falling. The stock market is a better illustration of investor sentiment about the
economy, with the market closing Q3:2018 at 32,766 index points, 14.5% lower y-t-d.
0 50
100 150 200 250 300 350 400 450
Jan-1
3
Jun-1
3
Nov-13
Apr-14
Sep-14
Feb-15
Jul-1
5
Dec-15
May-16
Oct-16
Mar-17
Aug-17
Jan-1
8
Jun-1
8
Nig
eria
n N
aira
US$ € £
Exchange Rate - Official Market
450
400
350
300
250
200
150
100
50
0
Nig
eri
an
Na
ira
Source: CBN
Jan-13
Jun-13
Nov-
13
Apr-14
Sep-14
Feb-15
Jul-1
5
Dec-
15
May
-16
Oct
-16
Mar
-17
Aug-17
Jan-18
Jun-18
US$ € £
Size: 923,768km2
Capital City: Abuja
Total Population: 196.2million (2018 est)
Youth Dependency: 82% (2017)
Elderly Dependency: 5% (2017)
Internet Users: 49.5 per 100 people (2018 est)
GDP Growth: 1.5% (Q2:2018)
GDP Growth Forecast: 1.9% - 2.1% (2018 est)
Inflation Rate: 11.28% (Sept 2018)
Interest Rate: 14% (Sept 2018)
Ease of Doing Business Ranking/190: 146 (2019)
Global Competitiveness Ranking/137: 125 (2017/2018)
Facts about Nigeria

NIGERIA SNAPSHOT Q3:2018 4
80 +
70 - 74
60 - 64
50 - 54
40 - 44
20 - 24
10 - 14
0 - 4
21 18 15 12 9 6 3 0 3 6 9 12 15 18 0 - 4
10 - 14
20 - 24
30 - 34
40 - 44
50 - 54
60 - 64
70 - 74
80 +
Millions Male Female
9 3 1515 3 918 6 6 1812 0 12
Male Female
Millions
Population: 2017
Source: Population Pyramid
Retail Market Overview
The ripple effect of improved macroeconomic conditions from recessionary levels has yet to have a significant impact on the
recovery of the retail market. The rise in oil prices has helped to boost forex inflows and exchange rate stability, but has also contributed
to inflationary pressures in the market. Renewed signs of weakness in the wider economy have made investors increasingly cautious in their
investment decisions. Over the last 12 months, underlining trends have persisted. These include contracted purchasing power, high tenant
turnover rates, high rental and operational costs and an oversupply of mall space. Landlords continue to offer financial incentives in order to
drive up occupancies within their malls.
The exchange rate is one of the defining factors for tenancy in malls, beyond base rents and service charges. With retailers becoming more
informed with regards to market dynamics and seeking competitive leasing terms, some malls have operated under tenant-friendly exchange
rates, which are typically close to official market rates. However, a number of such malls have recently revised these policies, now operating
under rates that are close to secondary market (parallel market) rates. This is likely to have a negative impact on existing and prospective
tenants in regards to rental obligations.
International brand interest in the retail market is unrelenting, however, these brands are seeking experienced local franchise operators
to collaborate with. The challenge here is that many local franchisees are not financially able to take on new brands within their portfolios.
Nonetheless, within the first three quarters of 2018 , there have been market entrants from Europe and North America in premises measuring
less than 50m².
Leisure retail offerings are becoming increasingly vital in differentiating malls in the market. Therefore, landlords are incorporating more
family-friendly offerings, cinemas and arcades to capture changing consumer preferences. With regards to new developments, very few malls
(+-10,000m²) are currently in the pipeline in the core and secondary markets, with the focus being on smaller design concepts that are
specifically tailored to the demographics within the mall’s catchment area.
Currently, average asking rental prices for 50m² - 200m² of prime retail space hover around US$30 – US$70/m²/month in the core markets
of Abuja and Lagos. In secondary market locations, average asking rental prices range between US$15 – US$25/m²/month. Transactions are
ultimately conducted on a case-by-case basis and achievable rents could fall well below the average.
Ag
e G
rou
p

NIGERIA SNAPSHOT Q3:2018 5
Office Market Overview
A relative improvement in office market dynamics has been evident in the first three quarters
of 2018 This is attributable to reduced risk aversion by investors. However, the market remains
a tenants’ market with landlords having to offer favourable leasing terms to drive occupancy levels.
Although, there are definitive features in the market that drive notable premiums at some buildings, such
as location, quality of build, amenities, and so on.
A trend that continues to consolidate itself in the market is the rise in demand for more turnkey office options by blue-chip
and large corporates. This development is largely attributable to preferences by corporates to mitigate initial capital outlay of which
fit-out and furniture costs constitute a significant portion, especially in prime grade buildings.
The oil and gas sector recorded the highest number of enquiries within the first nine months of the year, which is attributable to the performance
of oil in the global and domestic markets. Other industries that have also contributed to the level of activity include FMCG, Pharmaceutical,
Technology, Finance and Consulting, with space requirements from as low as 200m² to as high as 2,000m², although average occupier
demand for space ranges from 200m² – 500m². Turnaround time from enquiry stage to the closing of the transaction is still lengthy, typically
12 to 18 months, depending on the profile of the client and the industry in which they operate.
Average asking base rentals for office space within the core markets have remained fairly constant in the past six to eight months, ranging from
approximately US$50/m²/month to US$70/m²/month for A-grade buildings and US$33/m²/month to US$50/m²/month for B-grade properties.
As landlords are effectively price takers in the market, financial incentives by means of fit-out allowance, longer beneficial occupation periods
and rent-free periods tend to discount the rent being paid by the tenant; i.e. net effective rent (base rent minus incentives).
It is anticipated that activity in the office market will continue to improve, albeit at a very gradual pace. This can be attributed to the lingering
uncertainty about the economy’s growth and employment prospects. Vacancy levels are expected to rise, especially with the delivery of
over 40,000m² of prime space over the next six to 12 months. With a shallow pool of existing corporates in the market, competitive leasing
strategies are set to persist.

NIGERIA SNAPSHOT Q3:2018 6
Industrial Market Overview
The sector’s performance has been generally mixed although underlying challenges
such as inadequate infrastructure and stalling growth persist. There have been some
notable properties that have come onto the market for sale by large corporates in the
past six to 12 months, adding to the current oversupply in the market. Nonetheless, there are
stakeholders that are successfully operating in the market despite these bottlenecks, with emphasis
on industrial activity in areas such as the Lagos Free Trade Zone.
There is a strong demand for efficient and quality industrial facilities, however, there is a mismatch between demand
and supply of stock in the market. Most of the existing facilities are dated and designed with low eave heights, as well as
inadequate yard size, which do not meet the quality and standards required by many corporates. Over the years, the case for allocating
much needed investment capital towards developing new industrial parks has been less convincing from an investors’ viewpoint. As such, the
development appetite in the industrial market has been much less aggressive relative to the office, retail and residential sectors. High land
costs in desired locations such as Lagos, as well as weak infrastructure, reduce the sector’s investment potential. These factors reinforce the
current rentals in the market, which range from US$1/m²/month to US$6/m²/month. The new build market, which is typically characterised by
newer properties that are close to global standards, is predominantly owner-occupied.
Over the coming years, increased activity in the industrial sector will hinge on sustainable policies to revive the industrial and manufacturing
base of the country. This would be strengthened by investment into adequate attendant infrastructure (roads, rail, ports, power, etc.) which
could lead to the repositioning of the sector.
RETAIL OFFICES INDUSTRIAL
Prime Space(50m² - 200m²)
A-grade B-grade C-grade Prime Space
Demand - Next 6 Months (Up/Down/Stable)
Supply - Next 6 Months (Up/Down/Stable)
Average Net Asking Rent (US$/m²/month) 30 - 70 50 - 70 33 - 50 5 - 15 1 - 6
Average Vacancy Rate (%) 20% 70% n/a n/a n/a
Average Yield (%) 8% - 10% 8.5% - 9.5% 10.5% + n/a 10% - 12%
Market Indicators (Lagos) - Q3:2018
Source: Broll Database

Property Intel
Progressive property people.
Elaine Wilson
Divisional Director - Broll Property Intel
+27 11 441 4083
Bolaji Edu
CEO - Broll Nigeria
+234 1 270 1890
Disclaimer
Broll Property Group has taken every care in the preparation of this report. The sources of information used are believed to be accurate and
reliable, but no guarantee of accuracy or completeness can be given. Neither Broll Property Group, nor any CBRE company, nor any director,
representative or employee of Broll Property Group, accepts liability for any direct or consequential loss arising from the use of this document
or its content. The information and opinions contained in this report are subject to change without notice. No part or parts of this report may
be stored in a retrieval system or reproduced or transmitted in any form or by any means, electronic, mechanical, reprographic, recording or
otherwise, now known or to be devised, without prior consent from Broll Property Group.
Researchers
Nnenna Alintah
Amaka Ajaegbu
Daniella Martino
V
alua
tion &
Adv
isory Services
Rea
l Est
ate
Inve
stor
Ser
vice
s

V
alua
tion &
Adv
isory Services
[email protected] I www.broll.com
Broll Property Group (Head Office)
Broll South Africa
Physical address: 61 Katherine Street,
Sandown Ext. 54, Johannesburg
Phone: +27 11 441 4000
Email: [email protected]
Website: www.broll.com
Broll Botswana
Physical address: 1st Floor, The Hub, iTowers,
Gaborone
Phone: +267 398 1973
Email: [email protected]
Broll Ghana
Physical address: 7th Floor, Ridge Tower,
6th Avenue, Ridge, Accra
Phone: +233 302 672 888
Email: [email protected]
Website: www.brollghana.com
Broll Indian Ocean (Madagascar, Mauritius,
Seychelles & Réunion)
Physical address: Suite 2IJ, 2nd Floor,
Raffles Tower, Ebene
Phone: +230 468 1222
Email: [email protected]
Website: www.broll-io.com
Broll Kenya
Physical address: Westlands Business Park,
Acacia Block, Ground Floor, Waiyaki Way,
Nairobi
Phone: +254 712 668 448
Email: [email protected]
Website: www.broll.co.ke
Broll Malawi
Physical address: Kabula House, Ground
Floor, Chilembwe Road, Blantyre
Phone: +265 184 3311
Email: [email protected]
Website: www.broll.co.mw
Broll Mozambique
Physical address: Rua Mateus, Sansao
Muthemba, Maputo
Phone: +258 21 496 852
Email: [email protected]
Website: www.broll.co.mz
Broll Namibia
Physical address: Zanlumor Building,
2nd Floor, Post Street Mall, Windhoek
Phone: +264 6 137 4500
Email: [email protected]
Website: www.brollnamibia.com.na
Broll Nigeria
Physical address: 6th Floor, ED Building,
47 Marina, Lagos Island, Lagos
Phone: +234 1 270 1890
Email: [email protected]
Website: www.broll.com.ng
Broll Uganda
Physical address: The Acacia Mall, 4th Floor,
Plot 14-18 Cooper Road, Kampala
Phone: +256 312 531 500
Broll Zambia
Physical address: Manda Hill Mall,
Cnr Great East and Manchinchi Roads, Lusaka
Phone: +260 21 125 5550
Email: [email protected]
Website: www.broll.co.zm