Nifty
109
A Project On Study of Nifty Derivatives & Risk Minimization Trading Strategy IN PARTIAL FULFILMENT FOR THE REQUIREMT OF THE PROJECT STUDY COURSE OF TWO YEAR (FULL TIME) M.B.A. PROGRAMME College: IIBS BANGALORE Submitted by: NAME: PARMJEET KUMAR SINGH ROLL NO: 38 (S09) SECTION: A Email address:- [email protected] Mobile no:- 09019194668 Submitted to: INTERNATIONAL INSTITUTE OF BUSINESS STUDY
-
Upload
parmjeet-singh -
Category
Documents
-
view
193 -
download
4
Transcript of Nifty
A
Project
On
Study of Nifty Derivatives
&
Risk Minimization Trading Strategy
IN PARTIAL FULFILMENT FOR THE REQUIREMT OF THE PROJECT STUDY COURSE OF TWO YEAR (FULL TIME) M.B.A. PROGRAMME
College:IIBS BANGALORE
Submitted by:NAME: PARMJEET KUMAR SINGHROLL NO: 38 (S09)SECTION: AEmail address:- [email protected] no:- 09019194668Submitted to:
INTERNATIONAL INSTITUTE OF BUSINESS STUDY

CERTIFICATE FROM INSTITUTE
This is to certify that Mr. Ankit Shah and Mr. Ashish Ashara, students of MBA
(2008-10 batch) at N.R. Institute of Business Management, Gujarat University,
Ahmedabad have prepared a Grand Project on “Study of Nifty Derivatives & Risk
Minimization Trading Strategies” in partial fulfillment of two years full-time MBA
Program of Gujarat University. This project work has been undertaken under the guidance
of Prof. Anjali Choksi, core faculty at N.R. Institute of Business Management, Gujarat
University, Ahmedabad.
This is also to ascertain that this project has been prepared only for the award of
MBA degree and has not been submitted for any other purpose.
Dr. Hitesth Ruparel Prof. Anjali Choksi
Director Core faculty
_________________ _________________
Date: 20/03/2010
Place: Ahmedabad
INTERNATIONAL INSTITUTE OF BUSINESS STUDY

PREFACE
Derivatives occupy a very significant place in the field of finance and are virtually driving
the global financial markets of the day. Several markets of the world have witnessed a
phenomenal rise in trading derivative instruments over a past three decades.
With the world embracing the derivatives trading on a large scale, the Indian market
obviously cannot remain aloof, especially after liberalization has been set in motion.
Derivatives are like a deep ocean of knowledge for the learners of finance. The reason to
choose this subject was the emergence of derivatives trading in the different sectors of the
Indian economy. Derivatives are the means to achieve the objectives like risk management
by fund managers and hedging by traders. By looking at the importance of the derivatives
we make an attempt to determine the trend of Nifty and on the basis of that framing trading
strategies to minimize the risk while maximize the profit exposure.
This project would be a powerful base for us to undergo further studies in the risk
management field and even in the field of finance as a whole.
ACKNOWLEDGEMENT
Motivation and co-operation are the main two pillars on which the success
of any project relies. So first of all we would like to thank core faculty and
our project guide Prof . Anjali Choksi who made us aware about the project
and motivated us to work on the guidelines of this unique, new and
knowledge based project. She has guided us at each and every stage of the
project. She has been enthusiastically involved in every aspects of the
INTERNATIONAL INSTITUTE OF BUSINESS STUDY
project. Overall we are highly indebted to her for all the knowledge,
guidance and motivation that she has provided us throughout our project.
We would also like to thank our friends and those who have helped us
during this project directly or indirectly.
Every person wants to prove himself in this fast, dynamic and cut-throat
competitive world. When he/ she gets an opportunity to do so then he or she
will find that success is very near to him/her. So, we would like to
acknowledge our thanks to our Director Prof. Hitesh Ruparel who gave us
opportunity to prove ourselves. We also would like to express our gratitude
to our project Co-ordinator Mr.Sunil c.Shah (Vice-president Arcadia
Shares & stock Brokers pvt ltd & Mr. Kalpesh d.Shah
(Business Associate- Arcadia shares & stock brokers Pvt ltd) and the
Manager of Arcadia Shares & stock brokers Pvt Ltd. for their kind
support and assistance.
ANKIT SHAH
ASHISH ASHARA
INTERNATIONAL INSTITUTE OF BUSINESS STUDY

EXECUTIVE SUMMARY
One of the interesting developments in financial markets over the last 15 to 20 years has been the growing popularity of derivatives or contingent claims. In many situations, both hedgers and speculators find it more attractive to trade a derivative on an asset than to trade the asset itself. Some derivatives are traded on exchanges. Others are made available to corporate clients by financial institutions or added to new issues of securities by underwriters.
In this report we have included history of Derivatives. Than we have included Derivatives
Market in India. Than after we have included stock market Derivatives.
In this report we have taken a first look at forward, futures and options contracts. A forward or futures contract involves an obligation to buy or sell an asset at a certain time in the future for a certain price. There are two types of options: calls and puts. A call option gives the holder the right to buy an asset by a certain date for a certain price. In India the derivatives market has grown very rapidly. There are mainly three types of traders: hedgers, speculators and arbitrageurs.
In the next section, we have tried to determine the study of Nifty derivatives for the short term period using the two important indicators namely Open Interest & Put/Call Ratio. In which Put/Call Ratio analysis proves to be more effective indicators. Moreover in the analysis of Put/Call Ratio, Combination of Open Interest & Volume gives more accurate results.
In the last section, we have determined different trading strategies for different market views i.e. Bullish, Bearish, Range bound & Volatile. On the basis of investors’ perceptions they can use suited strategies which will minimize the loss. There are also some arbitrage strategies prevailing in the market like reversal, conversion etc. which give fix amount of profit irrespective of market movements but it is not readily available in the market but one has to grab such Opportunities.
PLACE: DATE:
INTERNATIONAL INSTITUTE OF BUSINESS STUDY

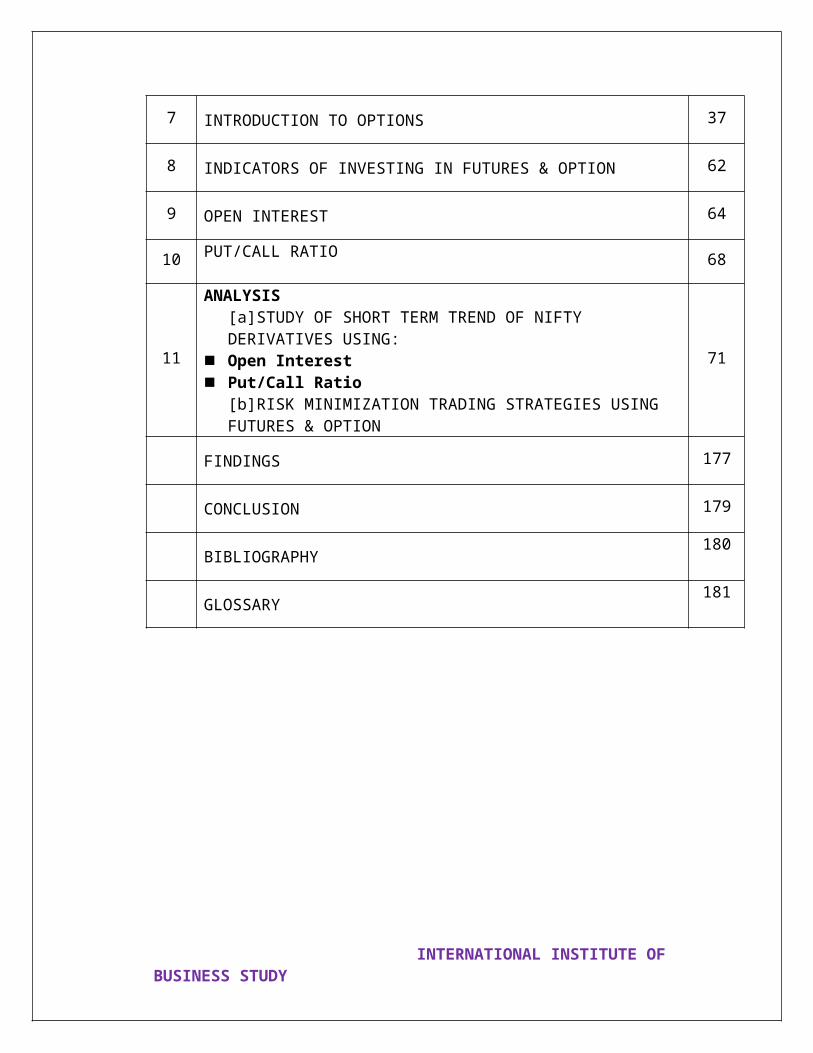
INDEX
Sr.
no Topics Pg.
no.
1INTRODUCTION TO INDIAN CAPITAL MARKET 1
2 INTRODUCTION TO DERIVATIVES 4
3 DEVELOPMENT OF DERIVATIVES MARKET IN INDIA 9
4 RESEARCH METHODOLOGY 12
5 STOCK MARKET DERIVATIVES 15
6 INTRODUCTION TO FUTURES 19
7 INTRODUCTION TO OPTIONS 37
8 INDICATORS OF INVESTING IN FUTURES & OPTION 62
9 OPEN INTEREST 64
10 PUT/CALL RATIO 68
11
ANALYSIS[a]STUDY OF SHORT TERM TREND OF NIFTY DERIVATIVES USING:
Open Interest Put/Call Ratio
[b]RISK MINIMIZATION TRADING STRATEGIES USING FUTURES & OPTION
71
FINDINGS 177
CONCLUSION 179
BIBLIOGRAPHY180
INTERNATIONAL INSTITUTE OF BUSINESS STUDY
GLOSSARY181
INTERNATIONAL INSTITUTE OF BUSINESS STUDY
CHAPTER1
INTRODUCTION TOCAPITAL
INTERNATIONAL INSTITUTE OF BUSINESS STUDY
CH. 1 INTRODUCTION TO INDIAN CAPITAL MARKET
CAPITAL MARKET In today’s era investor invest their funds after basic analysis. The basic function of financial market is to facilitate the transfer of funds from surplus sectors that is from (lenders) to deficit sectors (borrowers). If we look at the financial cycle then we can say that households make their savings, which is provided to industrial sectors, which earn profit and finally this profit will go to the households in the form of interest and dividend. Indian Financial System is made-up of 2 types of markets i.e. Money market & Capital Market. The money market has 2 components-The organized & unorganized. The organized market is dominated by commercial banks. The other major participants are RBI, LIC, GIC, UTI, and STCI. The main function of it is that of borrowing & lending of short term funds. On the other hand unorganized money market consists of indigenous bankers & money lenders. This sector is continuously providing finance for trade as well as personal consumption.
Capital MarketPrimary Market
Secondary Market
To create funds, new firms use Primary Market by publishing their issues in different
instruments. On the other hand Secondary Market provides base for trading and securities
that have already been issued.
PAST OF SHARE MARKET
Before 1996, all the transactions were done through physical form in security market. Because of physical form investors were facing so many problems.At that time the certificates were transferred to the purchase holder. On the other hand they are now transferred directly in their electronic form which is much more quicker and safer.
BSE
The Stock Exchange, Mumbai, popularly known as "BSE" was established in 1875 as
"The Native Share and Stock Brokers Association". It is the oldest one in Asia, even
older than the Tokyo Stock Exchange, which was established in 1878. It is a voluntary
non-profit making Association of Persons (AOP) and is currently engaged in the process of
converting itself into demutualised and corporate entity. It has evolved over the years into
INTERNATIONAL INSTITUTE OF BUSINESS STUDY
its present status as the premier Stock Exchange in the country. It is the first Stock
Exchange in the Country to have obtained permanent recognition in 1956 from the Govt.
of India under the Securities Contracts (Regulation) Act, 1956.
NSE
To obviate the problem, RELATED TO PHYSICAL FORM the NSE introduced screen based trading system (SBTC) where a member can punch into the computer the quantities of shares & the prices at which he wants to transact.
INTERNATIONAL INSTITUTE OF BUSINESS STUDY

CAHPTER2
INTRODUCTION TODERIVATIVES
INTERNATIONAL INSTITUTE OF BUSINESS STUDY

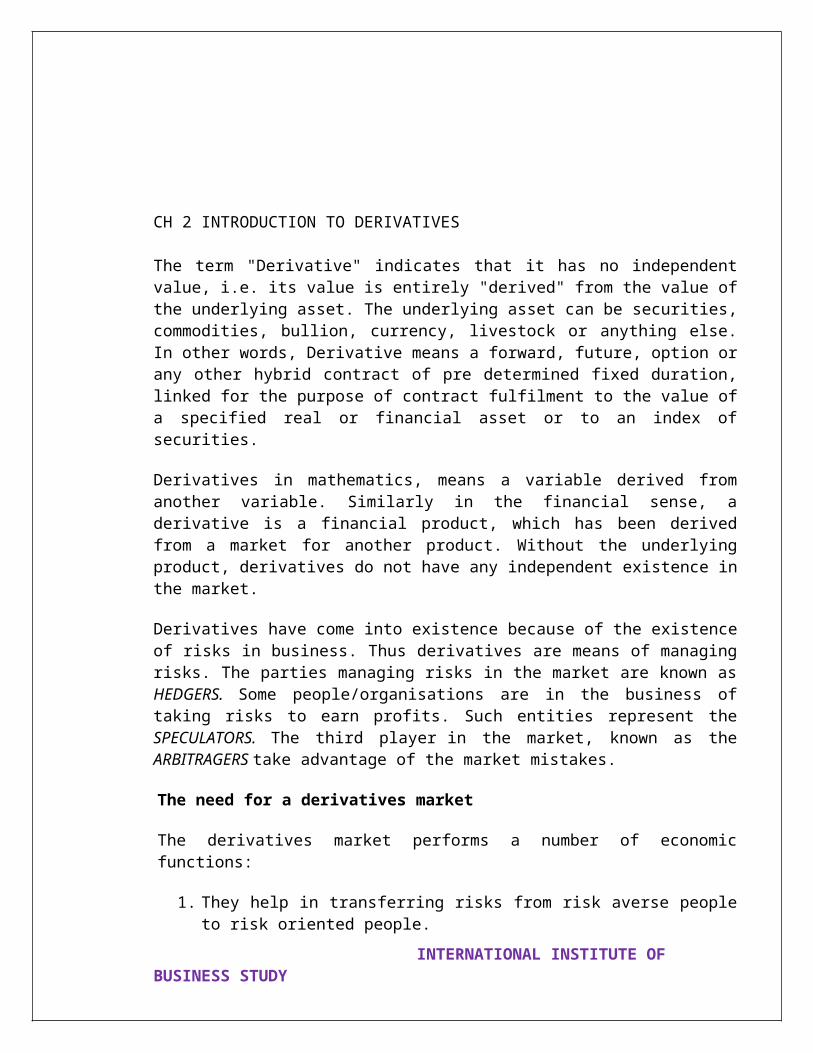
CH 2 INTRODUCTION TO DERIVATIVES
The term "Derivative" indicates that it has no independent value, i.e. its value is entirely "derived" from the value of the underlying asset. The underlying asset can be securities, commodities, bullion, currency, livestock or anything else. In other words, Derivative means a forward, future, option or any other hybrid contract of pre determined fixed duration, linked for the purpose of contract fulfilment to the value of a specified real or financial asset or to an index of securities.
Derivatives in mathematics, means a variable derived from another variable. Similarly in the financial sense, a derivative is a financial product, which has been derived from a market for another product. Without the underlying product, derivatives do not have any independent existence in the market.
Derivatives have come into existence because of the existence of risks in business. Thus derivatives are means of managing risks. The parties managing risks in the market are known as HEDGERS. Some people/organisations are in the business of taking risks to earn profits. Such entities represent the SPECULATORS. The third player in the market, known as the ARBITRAGERS take advantage of the market mistakes.
The need for a derivatives market
The derivatives market performs a number of economic functions:
1. They help in transferring risks from risk averse people to risk oriented people.2. They help in the discovery of future as well as current prices.3. They catalyze entrepreneurial activity.4. They increase the volume traded in markets because of participation of risk-averse
people in greater numbers.5. They increase savings and investment in the long run.
Factors driving the growth of financial derivatives1. Increased volatility in asset prices in financial markets,2. Increased integration of national financial markets with the international markets,3. Marked improvement in communication facilities and sharp decline in their costs,4. Development of more sophisticated risk management tools, providing economic
agents a wider choice of risk management strategies, and5. Innovations in the derivatives markets, which optimally combine the risks and
returns over a large number of financial assets leading to higher returns, reduced risk as well as transactions costs as compared to individual financial assets.
A derivative is a financial instrument whose value depends on the value of other, more basic underlying variables. The main instruments under the derivative are:1. Forward contract
INTERNATIONAL INSTITUTE OF BUSINESS STUDY

2. Future contract3. Options4. Swaps
1. Forward Contract:
A forward contract is a particularly simple derivative. It is an agreement to buy or sell an asset at a certain future time for a certain price. The contract is usually between two financial institutions or between a financial institution and one of its corporate clients. It is not normally traded on an exchange.One of the parties to a forward contract assumes a long position and agrees to buy the underlying asset on a specified future date for a certain specified price. The other party assumes a position and agrees to sell the asset on the same date for the same price. The specified price in a forward contract will be referred to as delivery price. The forward contract is settled at maturity. The holder of the short position delivers the asset to the holder of the long position in return for a cash amount equal to the delivery price. A forward contract is worth zero when it is first entered into. Later it can have position or negative value, depending on movements in the price of the asset.
2. Futures Contract:
A futures contract is an agreement between two parties to buy or sell an asset at a certain time in the future for a certain price. Unlike forward contracts, futures contract are normally traded on an exchange. To make trading possible, the exchange specifies certain standardized features of the contract. As the two parties to the contract do not necessarily know each other, the exchange also provides a mechanism, which gives the two parties a guarantee that the contract will be honoured.
One way in which futures contract is different from a forward contract is that an exact delivery date is not specified. The contract is referred to by its delivery month, and the exchange specifies the period during the month when delivery must be made.
3. Options:
An option is a contract, which gives the buyer the right, but not the obligation, to buy or sell specified quantity of the underlying assets, at a specific (strike) price on or before a specified time (expiration date). The underlying may be commodities like wheat/rice/ cotton/ gold/ oil/ or financial instruments like equity stocks/ stock index/ bonds etc.
There are basic two types of options. A call options gives the holder the right to buy the underlying asset by a certain date for a certain price. A put option gives the holder the right to sell the underlying asset by a certain date for a certain price.
4. Swaps:
INTERNATIONAL INSTITUTE OF BUSINESS STUDY
Swaps are private agreements between two companies to exchange cash flows in the future according to a prearranged formula. They can be regarded as portfolios of forward contracts.
5. Warrants:
Options generally have lives of upto one year, the majority of options traded on options exchanges having a maximum maturity of nine months. Longer-dated options are called warrants and are generally traded over-the-counter.
6. LEAPS:
The acronym LEAPS means Long-Term Equity Anticipation Securities. These are options having a maturity of up to three years.
7. Baskets: Basket options are options on portfolios of underlying assets. The underlying asset is usually a moving average or a basket of assets. Equity index options are a form of basket options.
Types of Traders in Derivatives Market:
1. HedgersHedgers are interested in reducing a risk that they already face. The purpose of hedging is to make the outcome more certain. It does not necessarily improve the outcome.
2. SpeculatorsWhereas hedgers want to eliminate an exposure to movements in the price of assets, speculators wish to take a position in the market. Either they are betting that a price will go up or they are betting that it will go down. Speculating using futures market provides an investor with a much higher level of leverage than speculating using spot market. Options also give extra leverage.
3. ArbitrageursThey are a third important group of participants in derivatives market. Arbitrage involves locking in a riskless profit by entering simultaneously into transactions in two or more markets. Arbitrage is sometimes possible when the futures price of an asset gets out of line with its cash price.
INTERNATIONAL INSTITUTE OF BUSINESS STUDY
CHAPTER3
DEVELOPMENT OFDERIVATIVES MARKET IN INDI
INTERNATIONAL INSTITUTE OF BUSINESS STUDY

CH 3 DEVELOPMENT OF DERIVATIVES MARKET IN INDIA
The first step towards introduction of derivatives trading in India was the promulgation of the Securities Laws(Amendment) Ordinance, 1995, which withdrew the prohibition on options in securities. The market for derivatives, however, did not take off, as there was no regulatory framework to govern trading of derivatives. SEBI set up a 24–member committee under the Chairmanship of Dr.L.C.Gupta on November 18, 1996 to develop appropriate regulatory framework for derivatives trading in India. The committee submitted its report on March 17, 1998 prescribing necessary pre–conditions for introduction of derivatives trading in India. The committee recommended that derivatives should be declared as ‘securities’ so that regulatory framework applicable to trading of ‘securities’ could also govern trading of securities. SEBI also set up a group in June 1998 under the Chairmanship of Prof.J.R.Varma, to recommend measures for risk containment in derivatives market in India. The report, which was submitted in October 1998, worked out the operational details of margining system, methodology for charging initial margins, broker net worth, deposit requirement and real–time monitoring requirements.
The Securities Contract Regulation Act (SCRA) was amended in December 1999 to Include derivatives within the ambit of ‘securities’ and the regulatory framework was developed for governing derivatives trading. The act also made it clear that derivatives shall be legal and valid only if such contracts are traded on a recognized stock exchange, thus precluding OTC derivatives. The government also rescinded in March 2000, the three–decade old notification, which prohibited forward trading in securities.
Derivatives trading commenced in India in June 2000 after SEBI granted the final approval to this effect in May 2001. SEBI permitted the derivative segments of two stock exchanges, NSE and BSE, and their clearing house/corporation to commence trading and settlement in approved derivatives contracts. To begin with, SEBI approved trading in index futures contracts based on S&P CNX Nifty and BSE–30(Sensex) index. This was followed by approval for trading in options based on these two indexes and options on individual securities.
The trading in BSE Sensex options commenced on June 4, 2001 and the trading in options on individual securities commenced in July 2001. Futures contracts on individual stocks were launched in November 2001. The derivatives trading on NSE commenced with S&P CNX Nifty Index futures on June 12, 2000. The trading in index options commenced on June 4, 2001 and trading in options on individual securities commenced on July 2, 2001. Single stock futures were launched on November 9, 2001. The index futures and options contract on NSE are based on S&P CNX.
Trading and settlement in derivative contracts is done in accordance with the rules, byelaws, and regulations of the respective exchanges and their clearing house/corporation duly approved by SEBI and notified in the official gazette. Foreign Institutional Investors (FIIs) are permitted to trade in all Exchange traded derivative products.
Measures specified by SEBI to protect the rights of investor in the Derivative Market
INTERNATIONAL INSTITUTE OF BUSINESS STUDY

1. Investor's money has to be kept separate at all levels and is permitted to be used only against the liability of the Investor and is not available to the trading member or clearing member or even any other investor.
2. The Trading Member is required to provide every investor with a risk disclosure document which will disclose the risks associated with the derivatives trading so that investors can take a conscious decision to trade in derivatives.
3. Investor would get the contract note duly time stamped for receipt of the order and execution of the order. The order will be executed with the identity of the client and without client ID order will not be accepted by the system. The investor could also demand the trade confirmation slip with his ID in support of the contract note. This will protect him from the risk of price favour, if any, extended by the Member.
4. In the derivative markets all money paid by the Investor towards margins on all open positions is kept in trust with the Clearing House/Clearing corporation and in the event of default of the Trading or Clearing Member the amounts paid by the client towards margins are segregated and not utilised towards the default of the member. However, in the event of a default of a member, losses suffered by the Investor.
INTERNATIONAL INSTITUTE OF BUSINESS STUDY

CHAPTER
4
RESEARCH
METHODOLOGY
INTERNATIONAL INSTITUTE OF BUSINESS STUDY

CH 4 RESEARCH METHODOLOGY
Objectives
To determine the short term trend of nifty future using the important derivatives market indicators like Open interest and Put Call ratio.To determine the derivatives trading strategy on the basis of different market outlooks which will minimize the risk exposure and at the same times will maximize the profits.Scope of studyWe have done the study of nifty futures only.We have studied the short term trend of nifty futures for the month of Feb, 2010 only.We have used two important indicators Open Interest and Put-Call Ratio only to determine the trend of Nifty.Data collection sourcesPrimary –NoSecondary
Various stock market web sites Magazines Capitaline Neo software Odin diet Software
Beneficiaries of study Derivative traders Hedge funds Institutional investors Arbitragers Hedger Speculators Jobbers Investors
Limitations
We have taken only Nifty futures for the purpose of study and not any other stock. The period of study is only one month derivative contract which may not give the
same result every time. We have use only two indicators namely Open Interest and Put-Call ratio to
determine the trend of Nifty. Few of the strategies prescribed in the study may give unlimited loss if the market
goes other way round.
INTERNATIONAL INSTITUTE OF BUSINESS STUDY

CHAPTER
5
STOCK MARKET
DERVATIVES
INTERNATIONAL INSTITUTE OF BUSINESS STUDY
CH 5 Stock Market Derivatives
Futures & Options
In India, the National Stock Exchange of India Limited (NSE) commenced trading in derivatives with the launch of index futures on June 12, 2000. The futures contracts are based on the popular benchmark S&P CNX Nifty Index.
The Exchange introduced trading in Index Options (also based on Nifty) on June 4, 2001. NSE also became the first exchange to launch trading in options on individual securities from July 2, 2001. Futures on individual securities were introduced on November 9, 2001. Futures and Options on individual securities are available on 180 securities stipulated by SEBI.
Instruments available in India
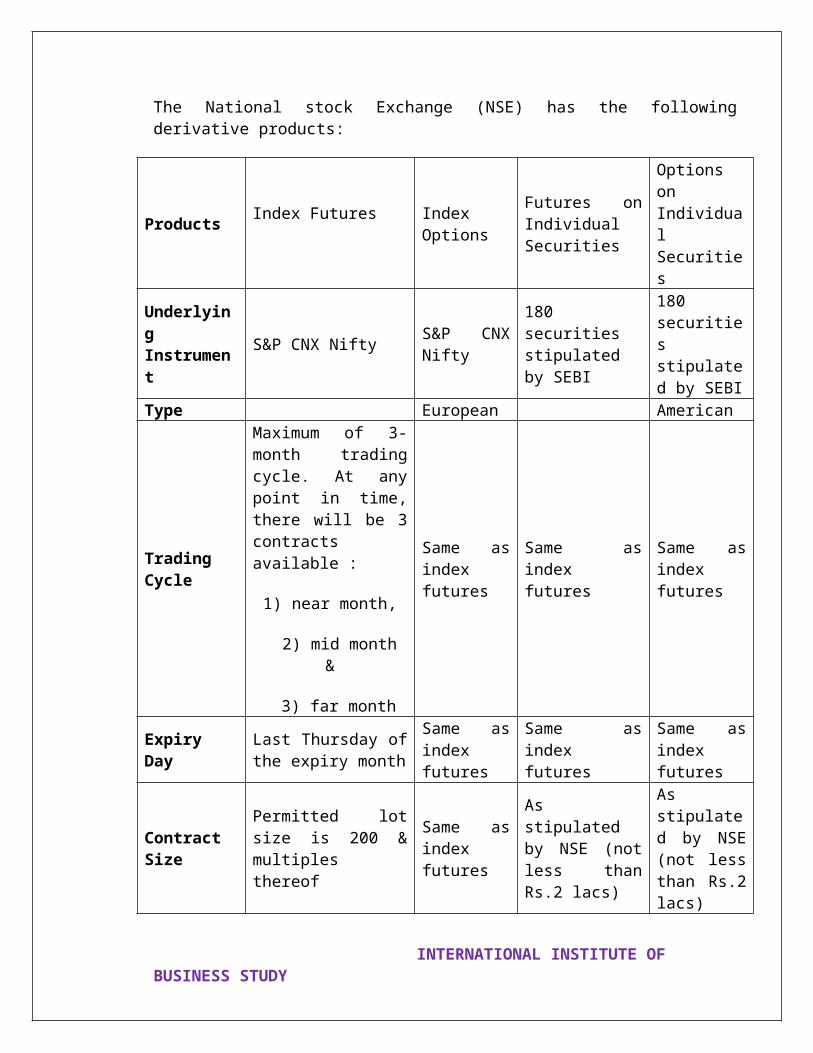
The National stock Exchange (NSE) has the following derivative products:
ProductsIndex Futures Index
Options
Futures on Individual Securities
Options on Individual Securities
Underlying Instrument
S&P CNX NiftyS&P CNX Nifty
180 securities stipulated by SEBI
180 securities stipulated by SEBI
Type European American
Trading Cycle
Maximum of 3-month trading cycle. At any point in time, there will be 3 contracts available :
1) near month,
2) mid month &
3) far month
Same as index futures
Same as index futures
Same as index futures
Expiry DayLast Thursday of the expiry month
Same as index futures
Same as index futures
Same as index futures
Contract SizePermitted lot size is 200 & multiples thereof
Same as index futures
As stipulated by NSE (not less than Rs.2 lacs)
As stipulated by NSE (not less than Rs.2 lacs)
BSE also offers similar products in the derivatives segment
INTERNATIONAL INSTITUTE OF BUSINESS STUDY

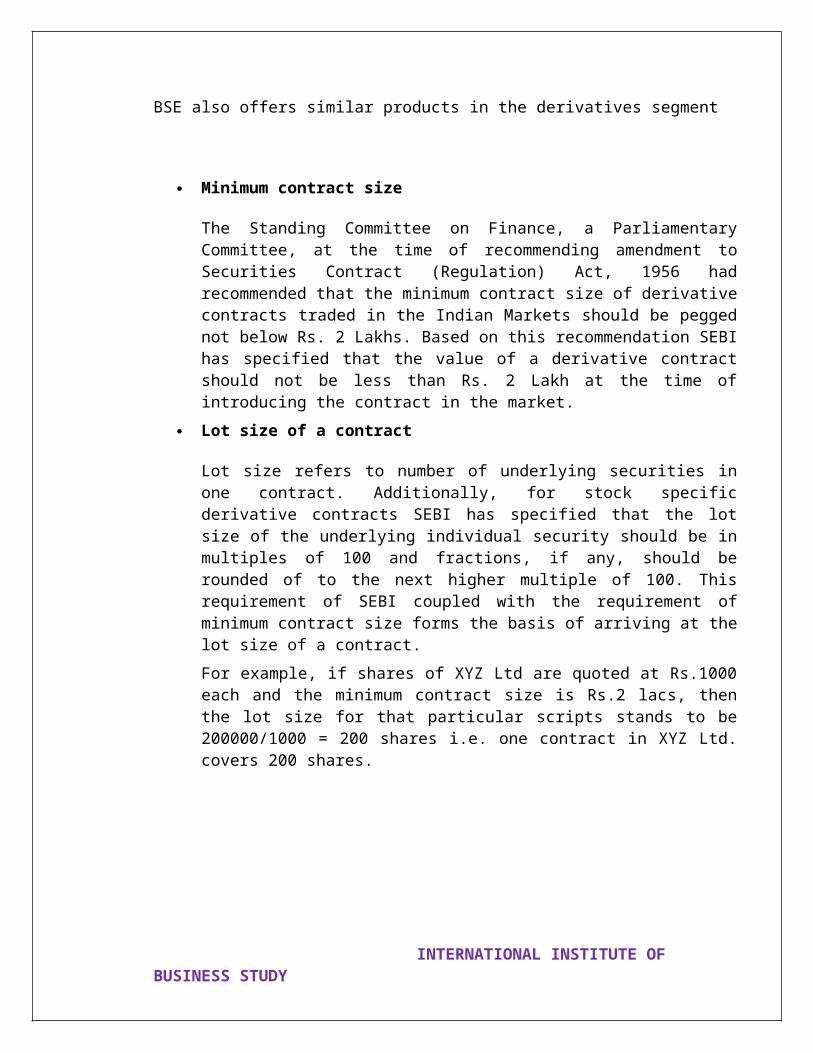
Minimum contract size
The Standing Committee on Finance, a Parliamentary Committee, at the time of recommending amendment to Securities Contract (Regulation) Act, 1956 had recommended that the minimum contract size of derivative contracts traded in the Indian Markets should be pegged not below Rs. 2 Lakhs. Based on this recommendation SEBI has specified that the value of a derivative contract should not be less than Rs. 2 Lakh at the time of introducing the contract in the market.
Lot size of a contract
Lot size refers to number of underlying securities in one contract. Additionally, for stock specific derivative contracts SEBI has specified that the lot size of the underlying individual security should be in multiples of 100 and fractions, if any, should be rounded of to the next higher multiple of 100. This requirement of SEBI coupled with the requirement of minimum contract size forms the basis of arriving at the lot size of a contract.
For example, if shares of XYZ Ltd are quoted at Rs.1000 each and the minimum contract size is Rs.2 lacs, then the lot size for that particular scripts stands to be 200000/1000 = 200 shares i.e. one contract in XYZ Ltd. covers 200 shares.
INTERNATIONAL INSTITUTE OF BUSINESS STUDY
CHAPTER
6
INTRODUCTION TO
FUTURES
INTERNATIONAL INSTITUTE OF BUSINESS STUDY
CH 6 INTRODUCTION TO FUTURES
Introduction of futures in India
The first derivative product introduced in the Indian securities market was “INDEX FUTURES" in June 2000. In India the “STOCK FUTURES” were first introduced on November 9, 2001 how Futures Markets Came About
Many people see pictures of the large crowd of traders standing in a crowd yelling and signaling with their hands, holding pieces of paper, and writing frantically. To the outsider, it looks like chaos. But do you really think that there is in fact chaos going on in the worlds futures pits? Not a chance. Actually, everyone in the crowd knows exactly what's going on. It is in fact, another language. Learn the language and you know what is going on.
How does this differ from the way things operated in the 'old days'? Before there were organized grain and commodity markets, farmers would bring their harvested crops to major population centers. There they would search for buyers. There were no storage facilities; and many times the harvest would rot before buyers were found. Also, because many farmers would bring their crops to market at the same time, the price of the crops or commodities would be driven down. There was tremendous supply in relation to demand. The reverse was true in the spring. Many times there would be a shortage of crops and commodities and the price would rise sharply.
Futures prices and the bid and asked price are continuously transmitted throughout the world electronically. Regardless of what geographic location the speculator or hedger is located in, he has the same access to price information as everyone else. Farmers, bankers, manufacturers, corporations, all have equal access. All they have to do is call their broker and arrange for the purchase or sale of a futures contract. The person who takes the opposite side of your trade may be a competitor who has a different outlook on the future price, it may be a floor broker, or it could be a speculator.
Types of Futures
Agricultural
The first type of agricultural contract is the grains. This group includes corn, oats, and wheat. The second type of agricultural contract is the oils and meal. This group includes soybeans, soya meal, soya oil, sunflower seed oil, and sunflower seed. The third group of agricultural commodities is livestock. This group includes live hogs, cattle, and pork bellies. The fourth type of agricultural commodities is the forest products group. For each of these commodities there are different contract months available. There are also different grades available. And there are different types of the commodity available. Contract months generally revolve around the harvest cycle. More actively traded commodities usually have more contract months available. Almost every month a new type of contract appears to meet the needs of a continuously growing corporate and institutional market.
INTERNATIONAL INSTITUTE OF BUSINESS STUDY

Metallurgical
The group of metallurgical commodities includes the metals and the petroleum's. The metals group includes gold, silver, copper, palladium, and platinum. The petroleum group includes crude oil, gasoline, heating oil, and propane. Different contract months, grades, amounts, and types, of these contracts are available. Almost every month a new type of contract appears to meet the needs of a continuously growing corporate and institutional market.
Interest Bearing Assets
This group of futures began trading in 1975. Yet it is this group that has seen the most explosive growth. This group of futures contracts includes Treasury Bills, Treasury Bonds, Treasury Notes, Municipal Bonds, and Eurodollar Deposits. The entire yield curve is represented and it is possible to trade these instruments with tremendous flexibility as to maturity.
Indexes
Today, there are futures on most major indexes. The S&P 500, New York Stock Exchange Composite, New York Stock Exchange Utilities Index, Commodities Research Bureau (CRB), Russell 2000, S&P 400 Midcap, Value Line, and the FT-Se 100 Index (London). Stock index futures are settled in cash. There is no actual delivery of a good. The only possibility for the trader to settle his positions is to buy or sell an offsetting position or in cash at expiration. Almost every month a new type of contract appears to meet the needs of a continuously growing corporate and institutional market.
Foreign Currencies
In the 1970's when freely floating exchange rates were established it became possible to trade foreign currencies. Most major foreign currencies are traded. The principal currencies traded are the Canadian dollar, Japanese yen, British pound, Swiss franc, French franc, Eurodollar, Euromark, and the Deutsch mark. The forward market in currencies is much larger than the foreign exchange futures market. Additionally, there is now cross currency futures that trade. Examples of these are the Deutsch mark/French franc and the Deutsch mark/yen. Almost every month a new type of contract appears to meet the needs of a continuously growing corporate and institutional market.
Miscellaneous
Today, the number and variety of futures contracts that trade increase every month. Catastrophe insurance, cheddar cheese, cocoa, coffee, sugar, orange juice, diammonium phosphate (fertilizer), and anhydrous ammonia. Most of the contracts that trade which are not very liquid, and which one would never trade, are very useful to certain parties.
INTERNATIONAL INSTITUTE OF BUSINESS STUDY

Generally, these are corporations, which are using these contracts to hedge positions. They use them primarily to lock in a pre-determined price for their cost of goods and offset risk. Because many of these commodities are not liquid, they are poor selections for the speculator to bet on.
The Indian capital market has grown quite well in the last decade. In the boom period of 1992 and thereafter, even the common man living in a village was attracted to the stock market. The stock market was considered a profitable investment opportunity. Before July 2001, various stock exchanges including the BSE, NSE, and the Delhi Stock Exchange (DSE), provided carry forward facilities through the traditional badla system. By means of this system the purchase or sale of a security was not postponed till a particular future date; instead the system only provided for the carry forward of a transaction from one settlement period (seven days) to the next settlement period for the payment of a fee known as badla charges.
FeaturesEvery futures contract is a forward contract. They:
Are entered into through exchange, traded on exchange and clearing corporation/house provides the settlement guarantee for trades.
Are of standard quantity; standard quality (in case of commodities). Have standard delivery time and place.
Frequently used terms in futures market
Contract Size – It specifies the amount of the asset that has to be delivered under one contract.
Multiplier - It is a pre-determined value, used to arrive at the contract size. It is the price per index point.
have only cash settlement system.
Concept of basis in futures market
Basis is defined as the difference between cash and futures prices:Basis = Cash prices - Future prices.
Basis can be either positive or negative (in Index futures, basis generally is negative).
Basis may change its sign several times during the life of the contract. Basis turns to zero at maturity of the futures contract i.e. both cash and future prices
converge at maturity.
Sensex Futures
Sensex Futures are futures whose underlying asset is the stock market index. The index is an indicator of the broad market which reflects stock market movements. It is one of the oldest and reliable barometers of the Indian Stock Market; it provides time series data over a fairly long period of time. The Sensex enables one to effectively gauge stock market movements. The BSE 30 Sensex was first compiled in 1986 and is the market
INTERNATIONAL INSTITUTE OF BUSINESS STUDY
capitalization weighted index of 30 scripts which represents 30 large well-established and financially sound companies. The Sensex represents a broad spectrum of companies in a variety of industries. It represents 14 major industry groups which are large enough to be used for effective hedging. Given the lower cost structure and the overwhelming popularity of the Sensex, Sensex futures are expected to garner large volumes. The Sensex is the first index to be launched by any Stock Exchange in India and has the the largest social recall attached with it.
The Indian market is witnessing low volumes as it is in its nascent stages of growth. Retail participation will improve with better understanding and comfort with the product whereas the market is yet to witness institutional participation. FIIs have not been able to participate as they are still awaiting certain clarifications pertaining to margins from the Reserve Bank of India.
Why Sensex Futures?
Sensex futures are expected to evolve as the most liquid contract in the country. This is because Institutional investors in India and abroad, money managers and small investors use the Sensex when it comes to describing the mood of the Indian Stock markets. Thus is has been observed that the Sensex is an effective proxy for the Indian stock markets. Higher liquidity in the product essentially translates to lower impact cost of trading in Sensex futures. The arbitrage between the futures and the equity market is further expected to reduce impact cost. Trading in Stock index futures is likely to be pre-dominantly retail driven. Internationally, stock index futures are an institutional product with 60% of the volumes generated from hedging needs. Immense retail participation to the extent of 80 - 90% is expected in India based on the following factors:
Stock Index Futures require lower capital adequacy and margin requirements when compared to margins on carry forward of individual scripts.
Index futures have lower brokerage costs. Savings in cost is possible through reduced bid-ask spreads where stocks are traded
in packaged forms. The impact cost will be much lower in case of stock index futures as opposed to
dealing in individual scripts. The chances of manipulation are much lesser since the market is conditioned to
think in terms of the index and therefore would prefer to trade in stock index futures.
The Stock index futures are expected to be extremely liquid given the speculative nature of our markets and the overwhelming retail participation expected to be fairly high. In the near future, stock index futures will definitely see incredible volumes in India. It will be a blockbuster product and is pitched to become the most liquid contract in the world in terms of number of contracts traded if not in terms of notional value.
The advantage to the equity or cash market is in the fact that they would become less volatile as most of the speculative activity would shift to stock index futures. The stock index futures market should ideally have more depth, volumes and act as a stabilizing
INTERNATIONAL INSTITUTE OF BUSINESS STUDY
factor for the cash market. However, it is to early to base any conclusions on the volume or to form any firm trend.
Interpreting Futures Data
Derivatives market data is available on the Derivatives Trading and Settlement System (DTSS) under the head market summary. This terminal is provided to all members of the Derivatives Segment. Non-members can have access to the same information via the financial newspapers or from the Daily Official List of the Stock Exchange.
Theoretical way of Pricing Index Futures
The theoretical way of pricing any Future is to factor in the current price and holding costs or cost of carry.
In general, the Futures Price = Spot Price + Cost of Carry
Cost of carry is the sum of all costs incurred if a similar position is taken in cash market and carried to maturity of the futures contract less any revenue which may result in this period. The costs typically include interest in case of financial futures (also insurance and storage costs in case of commodity futures). The revenue may be dividends in case of index futures.
S&P CNX Nifty Futures
A futures contract is a forward contract, which is traded on an Exchange. NSE commenced trading in index futures on June 12, 2000. The index futures contracts are based on the popular market benchmark S&P CNX Nifty index.
NSE defines the characteristics of the futures contract such as the underlying index, market lot, and the maturity date of the contract. The futures contracts are available for trading from introduction to the expiry date.
Contract Specifications Trading Parameters
Contract Specifications
Security descriptorThe security descriptor for the S&P CNX Nifty futures contracts is:
INTERNATIONAL INSTITUTE OF BUSINESS STUDY

Market type : NInstrument Type : FUTIDXUnderlying : NIFTYExpiry date : Date of contract expiryInstrument type represents the instrument i.e. Futures on Index.Underlying symbol denotes the underlying index which is S&P CNX NiftyExpiry date identifies the date of expiry of the contract
Underlying Instrument
The underlying index is S&P CNX NIFTY.
Trading cycle
S&P CNX Nifty futures contracts have a maximum of 3-month trading cycle - the near month (one), the next month (two) and the far month (three). A new contract is introduced on the trading day following the expiry of the near month contract. The new contract will be introduced for three month duration. This way, at any point in time, there will be 3 contracts available for trading in the market i.e., one near month, one mid month and one far month duration respectively.
Expiry day
S&P CNX Nifty futures contracts expire on the last Thursday of the expiry month. If the last Thursday is a trading holiday, the contracts expire on the previous trading day.
Trading Parameters
Contract sizeThe permitted lot size of S&P CNX Nifty futures contracts is 200 and multiples thereof
Base PricesBase price of S&P CNX Nifty futures contracts on the first day of trading would be the previous day’s closing Nifty value. The base price of the contracts on subsequent trading days would be the daily settlement price of the futures contracts.
Price bands
There are no day minimum/maximum price ranges applicable for S&P CNX Nifty futures contracts. However, in order to prevent erroneous order entry by trading members, operating ranges are kept at + 10 %. In respect of orders which have come under price freeze, members would be required to confirm to the Exchange that there is no inadvertent error in the order entry and that the order is genuine. On such confirmation the Exchange may approve such order.
Futures on Individual Securities
INTERNATIONAL INSTITUTE OF BUSINESS STUDY

A futures contract is a forward contract, which is traded on an Exchange. NSE commenced trading in futures on individual securities on November 9, 2001. The futures contracts are available on 31 securities stipulated by the Securities & Exchange Board of India (SEBI). (Selection criteria for securities)
NSE defines the characteristics of the futures contract such as the underlying security, market lot, and the maturity date of the contract. The futures contracts are available for trading from introduction to the expiry date.
Contract Specifications Trading Parameters
Contract Specifications
Security descriptor
The security descriptor for the futures contracts is:Market type : NInstrument Type : FUTSTKUnderlying : NIFTYExpiry date : Date of contract expiry
Underlying Instrument
Futures contracts are available on 31 securities stipulated by the Securities & Exchange Board of India (SEBI). These securities are traded in the Capital Market segment of the Exchange.
Trading cycleFutures contracts have a maximum of 3-month trading cycle - the near month (one), the next month (two) and the far month (three). New contracts are introduced on the trading day following the expiry of the near month contracts. The new contracts are introduced for three month duration. This way, at any point in time, there will be 3 contracts available for trading in the market (for each security) i.e., one near month, one mid month and one far month duration respectively.
Expiry dayFutures contracts expire on the last Thursday of the expiry month. If the last Thursday is a trading holiday, the contracts expire on the previous trading day.
Trading Parameters
Contract sizeThe permitted lot size for the futures contracts on individual securities shall be the same as the same lot size of options contract for a given underlying security or such lot size as may
INTERNATIONAL INSTITUTE OF BUSINESS STUDY
be stipulated by the Exchange from time totime.
The value of the option contracts on individual securities may not be less than Rs. 2 lakhs at the time of introduction. The permitted lot size for the options contracts on individual securities would be in multiples of 100 and fractions if any shall be rounded off to the next higher multiple of 100.
Base PricesBase price of futures contracts on the first day of trading (i.e. on introduction) would be the previous day’s closing value of the underlying security. Price bands
There are no day minimum/maximum price ranges applicable for futures contracts. However, in order to prevent erroneous order entry by trading members, operating ranges are kept at + 20 %. In respect of orders which have come under price freeze, members would be required to confirm to the Exchange that there is no inadvertent error in the order entry and that the order is genuine. On such confirmation the Exchange may approve such order.
DIFFERENCE BETWEEN FUTURES AND OPTIONS
Although exchange-traded futures and options may act as substitutes for each other, they have some crucial differences. In futures, the risk exposure and profit potential are unlimited for both the parties, while in options, risk exposure is unlimited and profit potential limited for the sellers, and it is the other way round for the buyers. The maturity of contracts is longer in futures than in options. In futures, there is no premium paid or received by any party, while in options the buyers have to pay a premium to the sellers. While Futures impose obligations on both the parties, options do so only on the sellers. Both the parties have to put in margins in futures trading, but only the sellers have to do so in options trading.
STOCK INDICES IN INDIAN STOCK MARKET
A stock price moves for two possible reasons news about the company or stock (such as strike in the factory, grant of a major contract or new product launch) or news about the economy (such as growth in the economy, are related budget announcement or a war or warlike situation). The job of an index is to capture the movement of the stock market with reference to news about the economy and the country. Each stock movement contains the mixture of two elements, stock news and index news. The most important stock market indices on which index futures contracts have been introduced are the S & P CNX nifty and the BSE sensex.
Margin Money
INTERNATIONAL INSTITUTE OF BUSINESS STUDY
The aim of margin money is to minimize the risk of default by either counter-party. The payment of margin ensures that the risk is limited to the previous day’s price movement on each Margin money is like a security deposit or insurance against a possible Future loss of value.
Different Types of Margin
Yes, there can be different types of margin like Initial Margin, Variation margin, Maintenance margin and Additional margin.
Objective of Initial Margin
The basic aim of Initial margin is to cover the largest potential loss in one day. Both buyer and seller have to deposit margins. The initial margin is deposited before the opening of the day of the Futures transaction. Normally this margin is calculated on the basis of variance observed in daily price of the underlying (say the index) over a specified historical period (say immediately preceding 1 year). The margin is kept in a way that it covers price movements more than 99% of the time. Usually three sigma (standard deviation) is used for this measurement. This technique is also called value at risk (or VAR).Based on the volatility of market indices in India, the initial margin is expected to be around 8-10%.
Variation or Mark-to-Market Margin
All daily losses must be met by depositing of further collateral - known as variation margin, which is required by the close of business, the following day. Any profits on the contract are credited to the client’s variation margin account.
Maintenance Margin
Some exchanges work on the system of maintenance margin, which is set at a level slightly less than initial margin. The margin is required to be replenished to the level of initial margin, only if the margin level drops below the maintenance margin limit. For e.g.. If Initial Margin is fixed at 100 and Maintenance margin is at 80, then the broker is permitted to trade till such time that the balance in this initial margin account is 80 or more. If it drops below 80, say it drops to 70, and then a margin of 30 (and not 10) is to be paid to replenish the levels of initial margin. This concept is not expected to be used in India.
Additional Margin
In case of sudden higher than expected volatility, additional margin may be called for by the exchange. This is generally imposed when the exchange fears that the markets have become too volatile and may result in some crisis, like payments crisis, etc. This is a preemptive move by exchange to prevent breakdown.
INTERNATIONAL INSTITUTE OF BUSINESS STUDY

Cross Margining
This is a method of calculating margin after taking into account combined positions in Futures, options, cash market etc. Hence, the total margin requirement reduces due to cross-Hedges. This is unlikely to be introduced in India immediately.
SETTLEMENT OF INDEX FUTURES CONTRACT
Stock index futures transactions are settled by cash delivery. No physical delivery of stock is given by the short. The long also does not make payment for the full value. In case of Nifty futures contract, the last trading day is the last Thursday of the contract’s expiring month. The amount is determined by referring to the cash price at the close of trading in the cash market on the last trading day in the futures contract.
INTERNATIONAL INSTITUTE OF BUSINESS STUDY

CHAPTER7
INTRODUCTION TOOPTION
INTERNATIONAL INSTITUTE OF BUSINESS STUDY
CH 7 INTRODUCTION TO OPTIONS
As its name signifies, an option is the right to buy or sell a particular asset for a limited time at a specified rate. These contracts give the buyer a right, but do not impose an obligation, to buy or sell the specified asset at a set price on or before a specified date. Today, options are traded not only in commodities, but in all financial assets such as treasury bills (T-bills), forex, stocks and stock indices.
Four Components to an Option
There are four components to an option. They are: The underlying security, the type of option (put or call), the strike price, and the expiration date. Let's take an XYZ November 100-call option as an example. XYZ is the underlying security. November is the expiration month. 100 is the strike price (sometimes referred to as the exercise price). And the option is a call (the holder has the right, not the obligation, to buy 100 shares of XYZ at a price of 100).
The Parties to an Option
There are two parties to an option. There is the party who buys the option; and there is the party who sells the option. The party who sells the option is the writer. The party who writes the option has the obligation to fulfill the terms of the contract need to it be exercised. This can be done by delivering to the appropriate broker 100 shares of the underlying security for each option written.
Types of Option Contracts
The options are of two styles. 1) European option and 2) American option
An American style option is the one, which can be exercised by the buyer on or before the expiration date, i.e. anytime between the day of purchase of the option and the day of its expiry. The European kind of option is the one that can be exercised by the buyer on the expiration day only and not anytime before that.
The options are of two types. 1) Call option and 2) Put option.
Call Option
A call option gives the holder/buyer, the right to buy specified quantity of the underlying asset at the strike price on or before expiration date. The seller however, has the obligation to sell the underlying asset if the buyer of the call option decides to exercise his option to buy. One can buy call option when he or she expects the market to be bullish and sell call option when he or she expects the market to be bearish.
INTERNATIONAL INSTITUTE OF BUSINESS STUDY
Example: An investor buys one European call option on Infosys at the strike price of Rs.3500 at a premium of Rs.100. If the market price of Infosys on the day of expiry is more than Rs.3500, the option will be exercised. The investor will earn profits once the share price crosses Rs.3600. Suppose stock price is Rs.3800, the option will be exercised and the investor will buy 1 share of Infosys from the seller of the option at Rs.3500 and sell it in the market at Rs.3800 making a profit of Rs.200.
Put Option
A put option gives the buyer the right to sell specified quantity of the underlying asset at the strike price on or before an expiry date. The seller of the put option however, has the obligation to buy the underlying asset at the strike price if the buyer decides to exercise his options to sell. One can buy put option when he or she expects the market to be bearish and sell put option when he or she expects the market to be bullish.
Example: An investor buys one European put option on Reliance at the strike price of Rs.300 at a premium of Rs.25. If the market price of Reliance on the day of expiry is less than Rs.300, the option will be exercised. The investor will earn profits once the share price goes below 275. Suppose stock price is Rs.260, the buyer of the put option immediately buys Reliance share in the market @ Rs.260 and exercises his option selling the Reliance share at Rs.300 to the option writer thus making a net profit of Rs.15.
In-the-Money, At-the-Money, Out-the-Money
An option is said to be ‘at-the-money’, when the option’s strike price is equal to the underlying asset price. This is true for both puts and calls.
A call option is said to be in-the-money when the strike price of the option is less than the underlying asset price. On the other hand, a call option is out-of-the-money when the strike price is greater than the underlying asset price A put option is in-the-money when the strike price of the option is greater than the spot price of the underlying asset. A put option is out-the-money when the strike price is less than the spot price of underlying asset.
Options are said to be deep in-the-money (or deep out-the-money) if exercise price is at significant variance with the underlying asset price.
CALL OPTION PUT OPTION
INTERNATIONAL INSTITUTE OF BUSINESS STUDY
In-the-money Strike price < spot price Strike price > spot priceAt-the-money Strike price = spot price Strike price = spot priceOut-the-money Strike price > spot price Strike price < spot price
Stock index options The stock index options are options where the underlying asset is a stock Index. For Example: Options on S&P 500 Index/ options on BSE Sensex etc.
Options on individual stocks
Options contracts where the underlying asset is an equity stock, are termed as options on stocks.
They are mostly American style options cash settled or settled by physical delivery.
Frequently used terms in options market
Underlying- The specific security/ asset on which an options contract is based. Option premium – this is the price paid by the buyer to the seller to acquire the
right to buy or sell. Strike price or exercise price – the strike or exercise price of an option is the
specified / pre-determined price of the underlying asset at which the same can be bought or sold if the option buyer exercises his right to buy/ sell on or before the expiration day.
Expiration date – is the date on which the option expires. On expiration date, either the option is exercised or it expires worthless.
Exercise date – is the date on which the option is actually exercised. Open interest – the total number of options contracts outstanding in the market at
any given point of time. Option holder – is the one who buys an option which can be a call or a put option.
Option value
An option premium or the value of the option can be broken into two parts: 1. Intrinsic value and 2. Time value.
The intrinsic value of an option is defined as the amount by which an option is in-the-money or the immediate exercise value of the option when the underlying position is marked-to-market.
For a call option: Intrinsic Value = spot price – strike priceFor a put option: Intrinsic Value = strike price - spot price
Factors affecting the value of an option (premium)
There are two types of factors that affect the value of the option premium:
1) Quantifiable factors:
INTERNATIONAL INSTITUTE OF BUSINESS STUDY
Underlying stock price The strike price of the option The volatility of the underlying stock The time to expiration The risk free interest rate.
2) Non-Quantifiable Factors:
Market participants’ varying estimates of the underlying asset’s future volatility
Individuals’ varying estimates of future performance of the underlying asset, based on fundamental or technical analysis.
The effect of supply and demand- both in the options marketplace and in the market for the underlying asset.
Effect of various factors on option value
As discussed earlier we know that the option price is affected by different factors. In this section, the effect of various factors is shown in the following table:
Factor Option Type Impact on Option ValueComponent of Option Value
Share price moves up
Call OptionOption Value will also move up
Intrinsic Value
Share price moves down
Call Option Option Value will move down Intrinsic Value
Share price moves up
Put Option Option Value will move down Intrinsic Value
Share prices moves down
Put Option Option Value will move up Intrinsic Value
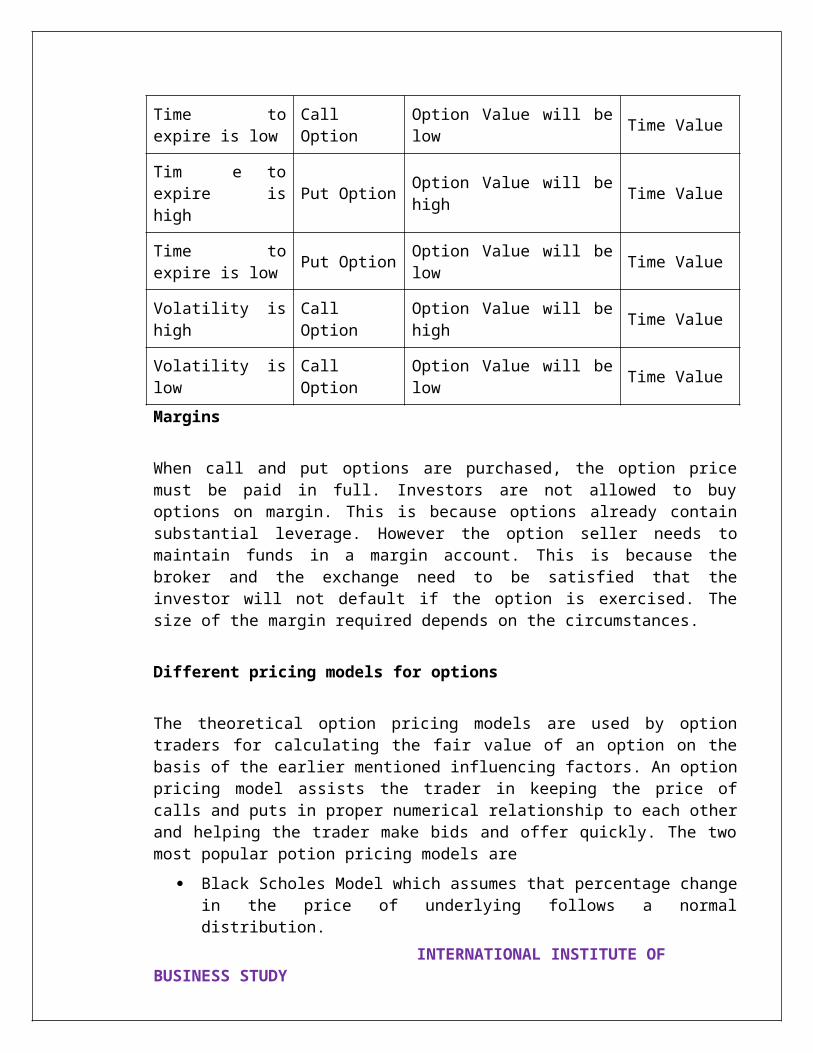
Time to expire is high
Call Option Option Value will be high Time Value
Time to expire is low
Call Option Option Value will be low Time Value
Tim e to expire is high
Put Option Option Value will be high Time Value
INTERNATIONAL INSTITUTE OF BUSINESS STUDY
Time to expire is low
Put Option Option Value will be low Time Value
Volatility is high Call Option Option Value will be high Time Value
Volatility is low Call Option Option Value will be low Time Value
Margins
When call and put options are purchased, the option price must be paid in full. Investors are not allowed to buy options on margin. This is because options already contain substantial leverage. However the option seller needs to maintain funds in a margin account. This is because the broker and the exchange need to be satisfied that the investor will not default if the option is exercised. The size of the margin required depends on the circumstances.
Different pricing models for options
The theoretical option pricing models are used by option traders for calculating the fair value of an option on the basis of the earlier mentioned influencing factors. An option pricing model assists the trader in keeping the price of calls and puts in proper numerical relationship to each other and helping the trader make bids and offer quickly. The two most popular potion pricing models are
Black Scholes Model which assumes that percentage change in the price of underlying follows a normal distribution.
Binomial Model which assumes that percentage change in price of the underlying follows a binomial distribution.
Who decides on the premium paid on options & how is it calculated?
Options premium is not fixed by the Exchange. The fair value/ theoretical price of an option can be known with the help of pricing models and then depending on market conditions the price is determined by competitive bids and offers in the trading environment. An option’s premium/ price is the sum of intrinsic value and time value (explained above). If the price of the underlying stock is held constant, the intrinsic value portion of an option premium will remain constant as well.
Advantages of options
Besides offering flexibility to the buyer in form of right to buy or sell, the major advantage of options is their versatility. They can be as conservative or as speculative as one’s investment strategy dictates.Some of the benefits of options are as under:
INTERNATIONAL INSTITUTE OF BUSINESS STUDY
High leverage as by investing small amount of capital (in form of premium), one can take exposure in the underlying asset of much greater value.
Pre-known maximum risk for an option buyer. Large profit potential and limited risk for option buyer. an investor knows that no matter how far the stock drops, it can be sold at the strike
price of the put anytime until the put expires.
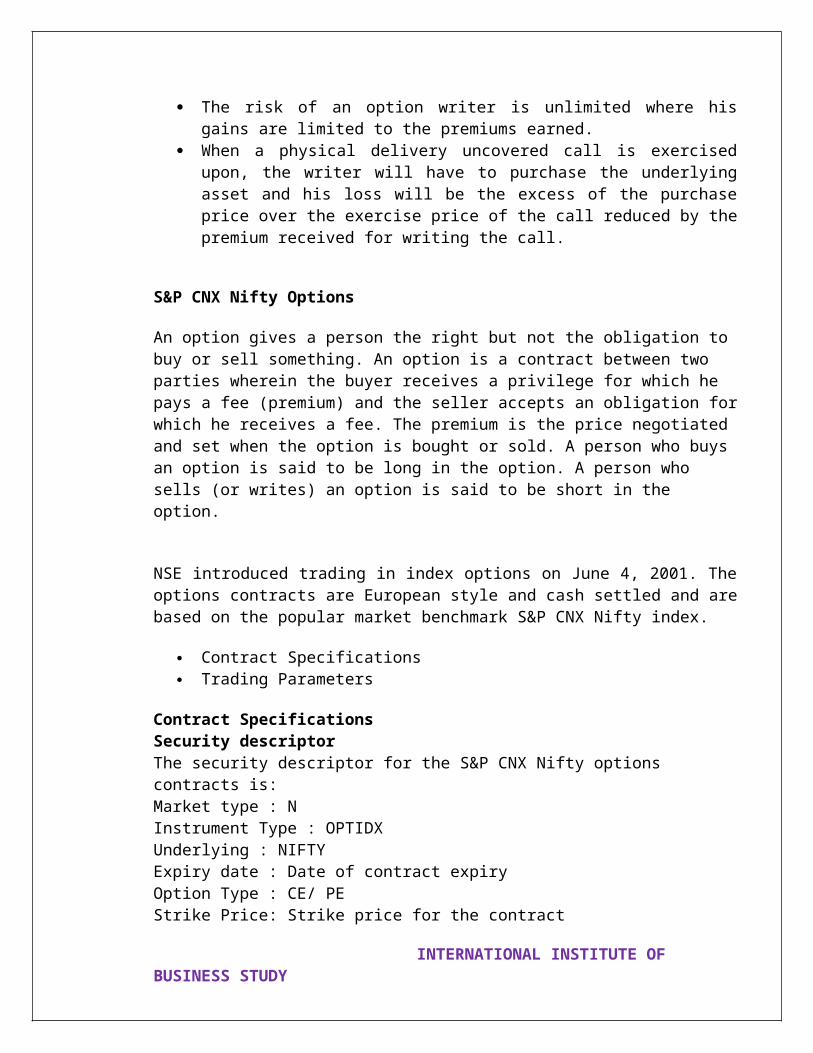
Risk and gains involved in options The risk/loss of an option buyer is limited to the premium that he has paid whereas
his gains are unlimited. The risk of an option writer is unlimited where his gains are limited to the
premiums earned. When a physical delivery uncovered call is exercised upon, the writer will have to
purchase the underlying asset and his loss will be the excess of the purchase price over the exercise price of the call reduced by the premium received for writing the call.
S&P CNX Nifty Options
An option gives a person the right but not the obligation to buy or sell something. An option is a contract between two parties wherein the buyer receives a privilege for which he pays a fee (premium) and the seller accepts an obligation for which he receives a fee. The premium is the price negotiated and set when the option is bought or sold. A person who buys an option is said to be long in the option. A person who sells (or writes) an option is said to be short in the option.
NSE introduced trading in index options on June 4, 2001. The options contracts are European style and cash settled and are based on the popular market benchmark S&P CNX Nifty index.
Contract Specifications Trading Parameters
Contract SpecificationsSecurity descriptorThe security descriptor for the S&P CNX Nifty options contracts is:Market type : NInstrument Type : OPTIDXUnderlying : NIFTYExpiry date : Date of contract expiryOption Type : CE/ PEStrike Price: Strike price for the contract
Underlying Instrument
INTERNATIONAL INSTITUTE OF BUSINESS STUDY

The underlying index is S&P CNX NIFTY.
Trading cycle
S&P CNX Nifty options contracts have a maximum of 3-month trading cycle - the near month (one), the next month (two) and the far month (three). On expiry of the near month contract, new contracts are introduced at new strike prices for both call and put options, on the trading day following the expiry of the near month contract. The new contracts are introduced for three month duration.
Expiry day
S&P CNX Nifty options contracts expire on the last Thursday of the expiry month. If the last Thursday is a trading holiday, the contracts expire on the previous trading day.
Strike Price Intervals
The Exchange provides a minimum of five strike prices for every option type (i.e. call & put) during the trading month. At any time, there are two contracts in-the-money (ITM), two contracts out-of-the-money (OTM) and one contract at-the-money (ATM).
Trading Parameters
Contract size
The permitted lot size of S&P CNX Nifty options contracts is 50 and multiples thereof
Price bands
There are no day minimum/maximum price ranges applicable for options contracts. However, in order to prevent erroneous order entry, operating ranges and day minimum/maximum ranges for options contract are kept at 99% of the base price. In view of this, members will not be able to place orders at prices which are beyond 99% of the base price
Options on Individual Securities
An option gives a person the right but not the obligation to buy or sell something. An option is a contract between two parties wherein the buyer receives a privilege for which he pays a fee (premium) and the seller accepts an obligation for which he receives a fee. The premium is the price negotiated and set when the option is bought or sold. A person who buys an option is said to be long in the option. A person who sells (or writes) an option is said to be short in the option.
INTERNATIONAL INSTITUTE OF BUSINESS STUDY
NSE became the first exchange to launch trading in options on individual securities. Trading in options on individual securities commenced from July 2, 2001. Option contracts are American style and cash settled and are available on 31 securities stipulated by the Securities & Exchange Board of India (SEBI). (Selection criteria for securities)
Contract Specifications Trading Parameters
Contract Specifications
Security descriptorThe security descriptor for the options contracts is:
Market type : NInstrument Type : OPTSTKUnderlying : Symbol of underlying securityExpiry date : Date of contract expiryOption Type : CA / PAStrike Price: Strike price for the contract
Underlying InstrumentOption contracts are available on 31 securities stipulated by the Securities & Exchange Board of India (SEBI). These securities are traded in the Capital Market segment of the Exchange.
Trading cycleOptions contracts have a maximum of 3-month trading cycle - the near month (one), the next month (two) and the far month (three). On expiry of the near month contract, new contracts are introduced at new strike prices for both call and put options, on the trading day following the expiry of the near month contract. The new contracts are introduced for three month duration.
Expiry day
Options contracts expire on the last Thursday of the expiry month. If the last Thursday is a trading holiday, the contracts expire on the previous trading day.
Strike Price Intervals
The Exchange provides a minimum of five strike prices for every option type (i.e. call & put) during the trading month. At any time, there are two contracts in-the-money (ITM),
INTERNATIONAL INSTITUTE OF BUSINESS STUDY

two contracts out-of-the-money (OTM) and one contract at-the-money (ATM).
The strike price interval would be:
Price of Underlying Strike Price interval (Rs.)
Less than or equal to Rs. 50 2.50
>Rs.50 to < Rs150 5
> Rs.150 to < Rs.250 10
> Rs.250 to < Rs.500 20
> Rs.500 to < Rs.1000 30
> Rs.1000 to < Rs.2500 50
>Rs.2500 100
New contracts with new strike prices for existing expiration date are introduced for trading on the next working day based on the previous day's underlying close values, as and when required. In order to decide upon the at-the-money strike price, the underlying closing value is rounded off to the nearest strike price interval.
The in-the-money strike price and the out-of-the-money strike price are based on the at-the-money strike price interval.
Trading Parameters
Contract sizeThe value of the option contracts on individual securities may not be less than Rs. 2 lakhs at the time of introduction. The permitted lot size for the options contracts on individual securities would be in multiples of 100 and fractions if any, shall be rounded off to the next higher multiple of 100.
Price bands
There are no day minimum/maximum price ranges applicable for options contracts. However, in order to prevent erroneous order entry, operating ranges and day minimum/maximum ranges for options contracts are kept at 99% of the base price. In view of this, members will not be able to place orders at prices which are beyond 99% of the base price. Members desiring to place orders in option contracts beyond the day min-max range would be required to send a request to the Exchange. The base prices for option
INTERNATIONAL INSTITUTE OF BUSINESS STUDY

contracts may be modified, at the discretion of the Exchange, based on the request received from trading members.
How does option get settled?Option is a contract which has a market value like any other tradable commodity. Once an option is bought there are following alternatives that an option holder has:
One can sell an option of the same series as the one had bought and close out/square off his/ her position in that option at any time on or before the expiration.
One can exercise the option on the expiration day in case of European option or; on or before the expiration day in case of an American option. In case the option is ‘out of money’ at the time of expiry, it will expire worthless.
Settlement Mechanism:Options Contracts on Index or Individual Securities
Daily Premium Settlement
Premium settlement is cash settled and settlement style is premium style. The premium payable position and premium receivable positions are netted across all option contracts for each (Clearing Member) CM at the client level to determine the net premium payable or receivable amount, at the end of each day.
Final Exercise Settlement
Final Exercise settlement is effected for option positions at in-the-money strike prices existing at the close of trading hours, on the expiration day of an option contract. Long positions at in-the money strike prices are automatically assigned to short positions in option contracts with the same series, on a random basis.
For index options contracts, exercise style is European style, while for options contracts on individual securities, exercise style is American style. Final Exercise is Automatic on expiry of the option contracts.
Option contracts, which have been exercised, shall be assigned and allocated to Clearing Members at the client level.
Exercise settlement is cash settled by debiting/ crediting of the clearing accounts of the relevant Clearing Members with the respective Clearing Bank.
Final settlement loss/ profit amount for option contracts on Index is debited/ credited to the relevant CMs clearing bank account on T+1 day (T = expiry day).
Final settlement loss/ profit amount for option contracts on Individual Securities is debited/ credited to the relevant CMs clearing bank account on T+3 day (T = expiry day).
INTERNATIONAL INSTITUTE OF BUSINESS STUDY
Open positions, in option contracts, cease to exist after their expiration day. The pay-in / pay-out of funds for a CM on a day is the net amount across settlements and all TMs/ clients, in F&O Segment.
Options on Futures Contracts
Put and call options are being traded on an increasing number of futures contracts. Trading options on futures allows the speculator to participate in the futures market and know in advance what the maximum loss on his position will be. The purchase of a call entitles the option buyer the right, but not the obligation, to purchase a futures contract at a specified price at any time during the life of the option. The underlying futures contract and the price are specified. The purchase of a put option entitles the option buyer the right, not the obligation, to sell a specified futures contract at a specified price. Keep in mind that the profit realized with an option strategy is reduced by the option premium. The option's price is determined in the same fashion that an equity option is determined.
THE BLACK-SCHOLES MODEL
The Black-Scholes model is the most important option pricing model, which almost accurately values the option price. Option trading got a big boost after the model was developed in 1973. Originally, it was for non-dividend paying stocks, but was subsequently modified to be useful for value other asset options as well. This model uses the following equations for pricing European call options.
C = SN(d1) – X exp-rt N(d2)d1= ln(S/X exp-rt)/t + 0.5 td2= d1- t
here, c= option priceS = spot priceX= strike pricer= risk-free interest ratet= time to expiration= annualised volatility of stock returns (standard deviation of stock returns)ln is the natural logarithmN ( ) is the cumulative probability distribution function for a standardized normal variable
VOLATILITY
Volatility of a stock price is a measure of how uncertain we are about future stock price movements. As volatility increases, the chance that the stock will do very well or very poorly increases. For the owner of the stock, these two outcomes tend to offset each other
INTERNATIONAL INSTITUTE OF BUSINESS STUDY

1) Historical Volatility:
Historical volatility is a statistical measurement of past price movements. It is found by finding the standard deviation of the price relative on any underlying.
In mathematical form it is given by the following equation.
Wheren+1 : number of observations Si : stock price at end of ith interval (i =1,2,3,….,n) ui : ln(Si / Si-1)There is an important issue concerned with whether time should be measured in calendar days or trading days when volatility parameters are being estimated and used. Usage of historical and implied volatility
The concept of Normal Distribution states that you can derive a deep understanding of possible movements in the share price from the figure of historical volatility. The movement will be within 1 standard deviation 66% of the time, within 2 standard deviations 95% of the time and within 3 standard deviations 99% of the time.
Example:Suppose the historical volatility today for Satyam scrip is 4.43%. If Satyam’s closing price today is Rs 287, expected movement in the next one day can be tabulated as under:
Number of Standard
Deviations
Percentage Price Movement
Lower Price
Higher Price
Probability
One 4.43% 13 274 300 66%Two 8.86% 26 261 313 95%Three 13.29% 38 325 249 99%
Similarly possible movement over the next nine days can be forecasted as under: Number of Standard
Deviations
Percentage Price Movement
Lower Price
Higher Price
Probability
One 13.29% 38 325 249 66%Two 26.58% 76 211 363 95%Three 39.87% 114 173 401 99%
Predicting is a rather difficult science. First of all, we are not looking at direction at all. We are not saying whether Satyam will move up or down. Secondly, we are forecasting possible maximum swing in magnitude irrespective of direction. For example, we are saying that Satyam will close between Rs 249 to Rs 325 tomorrow and the probability of
INTERNATIONAL INSTITUTE OF BUSINESS STUDY
this happening is 99%. The implication is that the probability of Satyam closing below Rs 249 or above Rs 325 is 1%.
CHAPTER8
INDICATORS OFINVESTING IN FUTURES & OPTION
INTERNATIONAL INSTITUTE OF BUSINESS STUDY
CH 8 INDICATORS OF INVESTING IN FUTURES & OPTION:
1. OPEN INTEREST2. PUT/CALL RATIO3. VOLUME4. COST OF CARRY5. MARKET WIDE POSITION LIMIT6. ROLL OVER POSITION7. PUT CALL PARITY
INTERNATIONAL INSTITUTE OF BUSINESS STUDY

CHAPTER9
OPEN INTEREST
INTERNATIONAL INSTITUTE OF BUSINESS STUDY
CH 9 OPEN INTEREST
Open Interest is the number of open contracts of a given future or option contract. An open contract can be a long or short contract that has not been exercised, closed out, or allowed to expire. Open interest is really more of a data field than an indicator.
Interpretation
Incidentally, in individual stocks, open interest can be a better indicator of demand than trading volumes in the underlying. Volumes are often used as an indication of bullishness. However, daily volumes reflect short-term daily trades that are closed out by settling rather than delivery. These day trades distort the picture of long-term demand.
By itself, open interest only shows the liquidity of a specific contract or market. However, combining volume analysis with open interest sometimes provides subtle clues to the flow of money in and out of the market:
Rising volume and rising open interest confirm the direction of the current trend. Falling volume and falling open interest signal that an end to the current trend may be
imminent.
But options are differentiated according to price as well as position. Analysts can easily break down open interest into puts and calls. Then, the open interest put-call ratio can be analysed in a fashion similar to the traded put-call ratio.
How to interpret the open interest?
Scrip: HDIL.
DATE SPOT PRICE
VOLUME OPEN INTEREST
PUT-CALL RATIO
June 3 641.00 683600 398800 0.75June 4 635.00 531600 414400 0.55June 5 647.80 747200 482800 0.54June 6 635.00 663600 444000 1.03June 7 624.00 668400 486800 0.75June 10 650.90 603200 467600 0.79June 11 661.00 831200 480800 0.66June 12 652.60 490400 486800 0.50June 13 651.00 1243200 498800 0.38June 14 644.00 525200 501600 0.44June 17 643.00 332000 503600 0.45June 18 644.30 468000 470800 0.26
The above table shows spot price, futures volume, futures open interest and put/call ratios on daily bases. As we have mentioned earlier that one must keep in mind that one must
INTERNATIONAL INSTITUTE OF BUSINESS STUDY

decide that increase in open interest is due to bullishness or bearishness in case of futures contracts
CHAPTER10
PUT/CALL RATIO
INTERNATIONAL INSTITUTE OF BUSINESS STUDY
PUT/CALL RATIO
The Put/Call Ratio ("P/C Ratio") is a market sentiment indicator that shows the relationship between the numbers of Puts to Calls traded.
Interpretation
A Call gives an investor the right to purchase lot size of stock at a pre-determined price. Investors who purchase Calls expect stock prices to rise in the coming months. Conversely, a Put gives an investor the right to sell lot size of stock at a pre-set price. Investors purchasing Puts expect stock prices to decline.
The P/C Ratio is a contrarian indicator. When it reaches "excessive" levels, the market usually corrects by moving the opposite direction. The following table, general guidelines for interpreting the P/C Ratio. However, the market does not have to correct itself just because investors are excessive in their bullish/bearish beliefs!
P/C ratioIndication
Less than 0.35 Extremely bullishGreater than 0.75 Excessively bearish
Greater than 0.35 andless than 0.75
Uncertain
CalculationThe Puts/Calls Ratio is calculated by dividing the volume of Puts by the volume of Calls.
P/C Ratio=Volume Traded For Put Options/Volume Traded For Call Options
DYNAMICS IN PUT CALL RATIO:
But as per recent observation it is quiet evident that the above mentioned ratios doesn’t work as per its interpretation. So we have found out the recent observation as per Open Interest as well as Volume basis as below.
P/C ratioIndication
Less than 0.65 Extremely bullishGreater than 1.35 Extremely bearish
Greater than 0.65 andless than 1.35
Uncertain
INTERNATIONAL INSTITUTE OF BUSINESS STUDY

CHAPTER11
ANALYSIS
INTERNATIONAL INSTITUTE OF BUSINESS STUDY
[a] STUDY OF SHORT TERM TREND OF NIFTY DERIVATIVES USING:
Put/Call Ratio Open Interest
Put/ Call Ratio:
There are two ways in which we can determine Put/Call Ratio:
o On the basis of Volume o On the basis of Open Interest
PUT/CALL RATIO ON THE BASIS OF VOLUME OF NIFTY FUTURES FOR THE MONTH OF FEB-2010.
DATETRADING
DAYPRE. DAY PUT/CALL
RATIO
CLOSING PUT
CALL RATIO
PRE. DAY NIFTY
CLOSING
CLOSING DAY
NIFTY
VIEW RESULT
29/1/2010 1 1.08 1.01 4867 4882 BULLISH SUCCESS1/2/2010 2 1.01 1.11 4882 4899 BEARISH FAILURE2/2/2010 3 1.11 1.18 4899 4830 BEARISH SUCCESS3/2/2010 4 1.18 1.07 4830 4925.8 BULLISH SUCCESS4/2/2010 5 1.07 0.99 4925.8 4845.35 BULLISH FAILURE5/2/2010 6 0.99 1.05 4845.35 4718.65 BEARISH SUCCESS6/2/2010 7 1.05 1.11 4718.65 4757.25 BEARISH FAILURE8/2/2010 8 1.11 1.05 4757.25 4760.4 BULLISH SUCCESS9/2/2010 9 1.05 1.03 4760.4 4792.65 BULLISH SUCCESS10/2/2010 10 1.03 0.84 4792.65 4757.2 BULLISH FAILURE11/2/2010 11 0.84 0.93 4757.2 4826.85 BEARISH FAILURE15/2/2010 12 0.93 1.01 4826.85 4801.95 BEARISH SUCCESS16/2/2010 13 1.01 0.94 4801.95 4855.75 BULLISH SUCCESS17/2/2010 14 0.94 0.84 4855.75 4914 BULLISH SUCCESS18/2/2010 15 0.84 1.12 4914 4886.8 BEARISH SUCCESS19/2/2010 16 1.12 1.06 4886.8 4845.95 BULLISH FAILURE22/2/2010 17 1.06 0.91 4845.95 4856.6 BULLISH SUCCESS
SUCCESS / FAILURE RATIO:
From the above mentioned 17 trading days, in 11 trading days it follows the Put/Call Ratios (Volume) Criterion, so the success ratio is 65%, while in 6 trading it has turned around the other way.
INTERNATIONAL INSTITUTE OF BUSINESS STUDY

PUT/CALL RATIO ON THE BASIS OF OPEN INTEREST OF NIFTY FUTURES FOR THE MONTH OF FEB-2010.
DATE TRADING DAY
PRE. DAY PUT/CALL
RATIO
CLOSING PUT CALL
RATIO
PRE. DAY NIFTY
CLOSING
CLOSING DAY
NIFTYVIEW RESULT
29/1/2010 1 1.1 1.04 4867 4882 BULLISH SUCCESS1/2/2010 2 1.04 1.09 4882 4899 BEARISH FAILURE2/2/2010 3 1.09 1.2 4899 4830 BEARISH SUCCESS3/2/2010 4 1.2 1.08 4830 4925.8 BULLISH SUCCESS4/2/2010 5 1.08 1.17 4925.8 4845.35 BEARISH SUCCESS5/2/2010 6 1.17 1.08 4845.35 4718.65 BULLISH FAILURE6/2/2010 7 1.08 0.98 4718.65 4757.25 BULLISH SUCCESS8/2/2010 8 0.98 0.97 4757.25 4760.4 BULLISH SUCCESS9/2/2010 9 0.97 0.94 4760.4 4792.65 BEARISH SUCCESS10/2/2010 10 0.94 1 4792.65 4757.2 BULLISH SUCCESS11/2/2010 11 1 0.91 4757.2 4826.85 BEARISH SUCCESS15/2/2010 12 0.91 1.02 4826.85 4801.95 BEARISH SUCCESS16/2/2010 13 1.02 0.96 4801.95 4855.75 BULLISH SUCCESS17/2/2010 14 0.96 1.08 4855.75 4914 BEARISH FAILURE18/2/2010 15 1.08 1.12 4914 4886.8 BEARISH SUCCESS19/2/2010 16 1.12 1.06 4886.8 4845.95 BULLISH FAILURE22/2/2010 17 1.06 0.97 4845.95 4856.6 BULLISH SUCCESS
SUCCESS / FAILURE RATIO:
INTERNATIONAL INSTITUTE OF BUSINESS STUDY
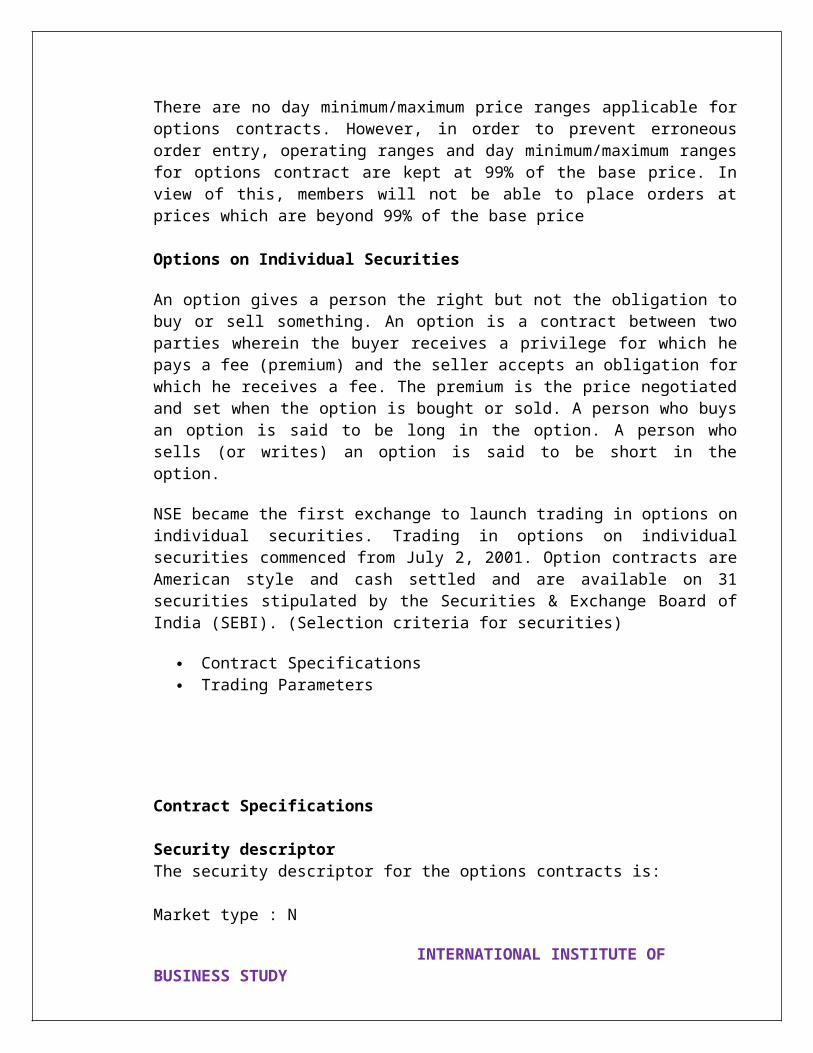
From the above mentioned 17 trading days, in 13 trading days it follows the Put/Call Ratios (Open Interest) Criterion, so the success ratio is 76.47% while in 4 trading days it has turned around the other way.
PUT/CALL RATIO ON THE BASIS OF COMBINATION OF OPEN INTEREST & VOLUME OF NIFTY FUTURES FOR THE MONTH OF FEB-2010.
DAY OI VIEWVOL. VIEW
COMMON VIEW RESULT
1 BULLISH BULLISH YES SUCCESS2 BEARISH BEARISH YES FAILURE3 BEARISH BEARISH YES SUCCESS4 BULLISH BULLISH YES SUCCESS5 BEARISH BULLISH NO NA6 BULLISH BEARISH NO NA7 BULLISH BEARISH NO NA8 BULLISH BULLISH YES SUCCESS9 BULLISH BULLISH YES SUCCESS10 BEARISH BULLISH NO NA11 BULLISH BEARISH NO NA12 BEARISH BEARISH YES SUCCESS13 BULLISH BULLISH YES SUCCESS14 BEARISH BULLISH NO NA15 BEARISH BEARISH YES SUCCESS16 BULLISH BULLISH YES FAILURE
INTERNATIONAL INSTITUTE OF BUSINESS STUDY
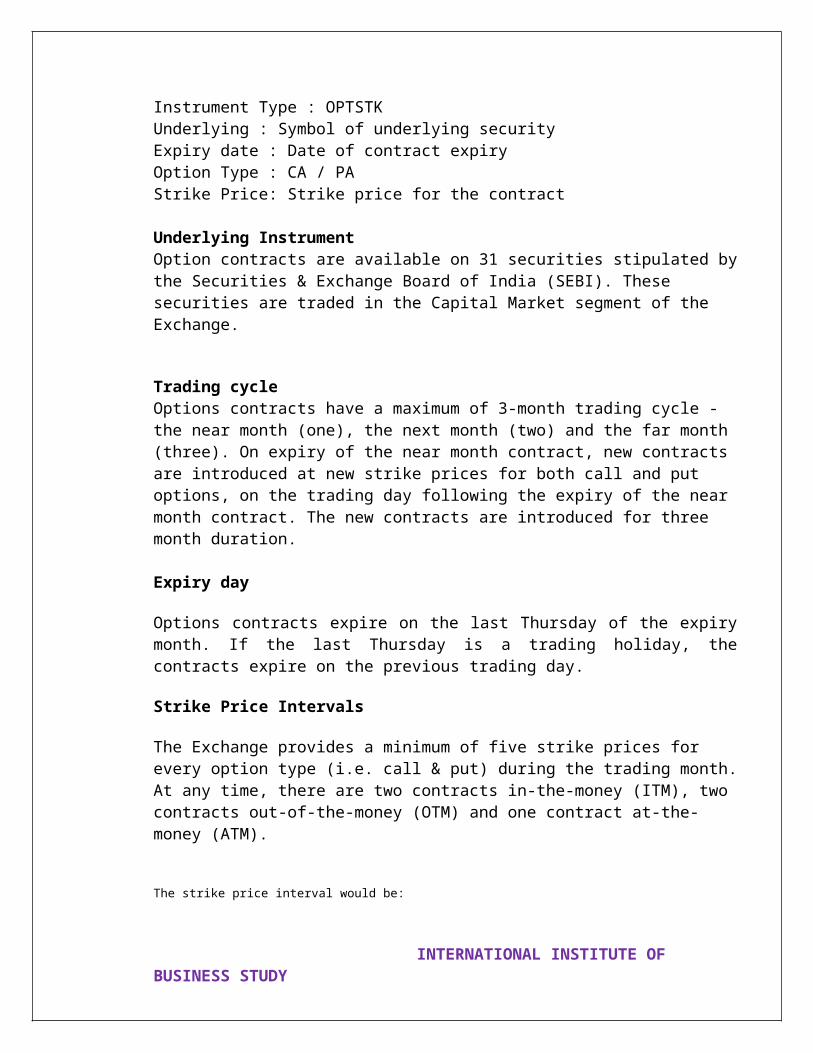
SUCCESS /FAILURE RATIOS:
DATETRADING
DAYPREV
DAY O.ICLOSING DAY O.I
PREV.CLOSING NIFTY
CLOSING NIFTY
NEXT DAY
NIFTY CLOSING VIEW RESULT
29/1/2010 1 22932750 27986150 4843.7 4872.05 4882 BULLISH SUCC 1/2/2010 2 27986150 29923300 4872.05 4882 4899 BULLISH SUCC 2/2/2010 3 29923300 29896500 4882 4899 4830 BEARISH SUCC 3/2/2010 4 29896500 32216250 4899 4830 4925.8 BEARISH FAIL 4/2/2010 5 32216250 29924950 4830 4925.8 4845.35 BEARISH FAIL 5/2/2010 6 29924950 30668050 4925.8 4845.35 4718.65 BEARISH SUCC 6/2/2010 7 30668050 31376300 4845.35 4718.65 4757.25 BEARISH NETR 8/2/2010 8 31376300 31349800 4718.65 4757.25 4760.4 BEARISH NETR 9/2/2010 9 31349800 31265550 4757.25 4760.4 4792.65 BEARISH NETR 10/2/2010 10 31265550 29230200 4760.4 4792.65 4757.2 BEARISH SUC 11/2/2010 11 29230200 29873700 4792.65 4757.2 4826.85 BEARISH FAIL 15/2/2010 12 29873700 28537150 4757.2 4826.85 4801.95 BEARISH SUC 16/2/2010 13 28537150 28928050 4826.85 4801.95 4855.75 BEARISH FAIL 17/2/2010 14 28928050 28665850 4801.95 4855.75 4914 BEARISH FAIL 18/2/2010 15 28665850 30541650 4855.75 4914 4886.8 BULLISH FAIL 19/2/2010 16 30541650 26499600 4914 4886.8 4845.95 BULLISH FAIL 22/2/2010 17 26499600 24762400 4886.8 4845.95 4856.6 BULLISH FAIL 23/2/2010 18 24762400 22727400 4845.95 4856.6 4870.55 BEARISH FAIL 24/2/2010 19 22727400 20702050 4856.6 4870.55 4862 BEARISH SUCC 25/2/2010 20 20702050 14860050 4870.55 4862 4863.2 BULLISH SUCC
From the above mentioned 16 trading days, in 10 trading days, it has given the same view regarding the market, from this, in 8 trading days it is successful. Thus the success ratio is 80%.while in 6 trading days, it contradicts. Thus the combination of Volume & Open Interest gives high accuracy than the individual.
INTERNATIONAL INSTITUTE OF BUSINESS STUDY
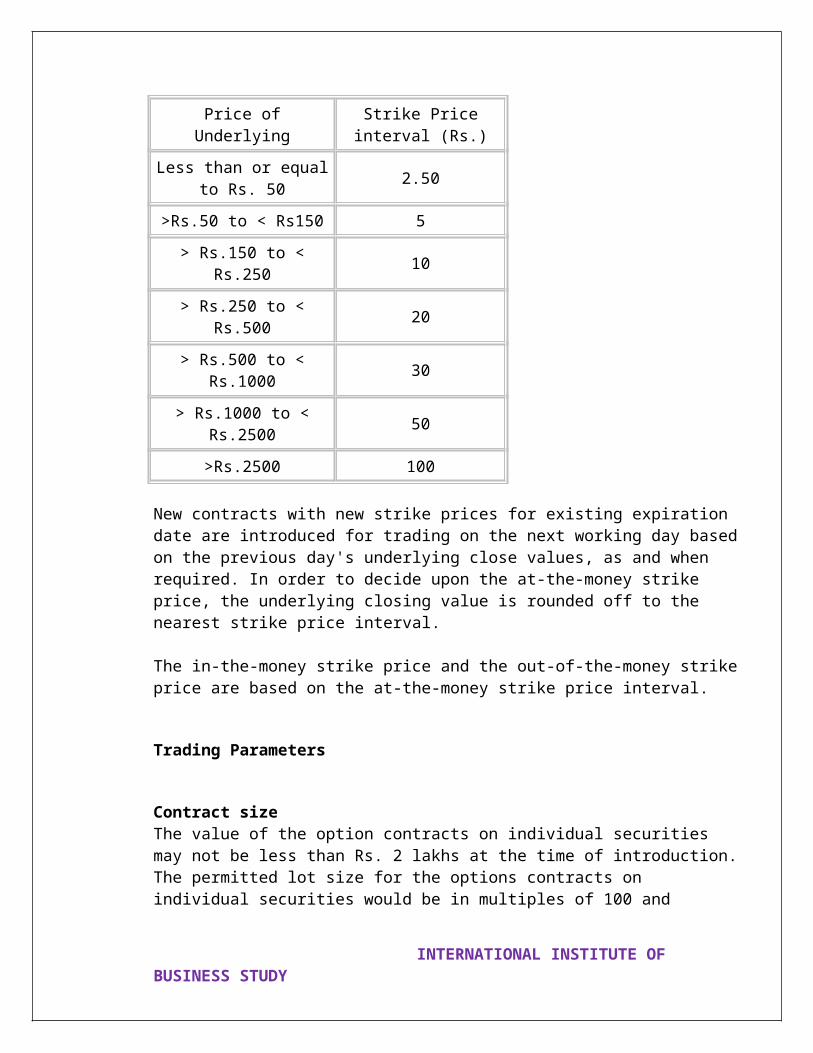
OPEN INTEREST:
The following are some interpretation that can be made using open interest. Rising open interest in an uptrend is bullish Declining open interest in an uptrend is bearish. Rising open interest in a downtrend is bearish. Declining open interest in a downtrend is bullish.There are a few interesting contrarian theories that revolve around the "Open Interest" in derivative contracts. The number of open contracts at the end of the day will vary according to demand for the underlying stock.
TABLE SHOWING THE RELATIONSHIP BETWEEN THE CHANGE IN OPEN INTEREST AND PRICE OF THE NIFTY FUTURES FOR THE MONTH OF FEB 2010 AND ITS EFFECT ON THE NEXT DAY PRICES.
INTERNATIONAL INSTITUTE OF BUSINESS STUDY
SUCCESS /FAILURE RATIOS:
From the above mentioned 20 trading days, in 10 trading days it follows the Open Interest Criterion, so the pure success ratio is 50.00% while in 7 trading days it has turned around the other way.And in 3 trading days, it has given the neutral result.
CH 11(B) THE RISK MINIMISATION TRADING STRATEGIES USING FUTURES AND OPTIONS ON THE BASIS OF:
Bullish Outlook Bearish Outlook
INTERNATIONAL INSTITUTE OF BUSINESS STUDY
Volatile Outlook
Range bound Outlook
Opportunistic Outlook
BY USING:
oOPTIONSoCOMBINATIONS OF FUTURES & OPTIONS
TRADING STRATEGIES USED FOR BULLISH OUTLOOK(1) Long Call Ladder(2) Bull Spread(3) Covered Call Writing(4) Protective Put Buying(5) Collar Strategy(6) Short Combo(7) Long Strap
TRADING STRATEGIES USED FOR BEARISH OUTLOOK(1) Long Put Ladder(2) Bear Spread(3) Covered Put Writing (4) Protective Call Buying (5) Reverse Collar Strategy(6) Long Combo(7) Long Strip
TRADING STRATEGIES USED FOR RANGEBOUND OUTLOOK(1) Long Condor(2) Double Top(3) Christmas Tree(4) Short Guts(5) Ratio Spread(6) Butterfly
INTERNATIONAL INSTITUTE OF BUSINESS STUDY

TRADING STRATEGIES USED FOR VOLATILE OUTLOOK(1) Long Guts(2) Short Condor(3) Butterfly Spread(4) Long straddle(5) Long strangle
TRADING STRATEGIES USED FOR OPPORTUNISTIC OUTLOOK(1) Conversion(2) Reversal(3) Long Box
TRADING STRATEGIES USED FOR BULLISH OUTLOOK(1) Long Condor Ladder
DESCRIPTION: - Buy a Call at a low Strike price K1, sell a call at a high Strike price K2 & sell a call at a higher Strike price K3
PAYOFF: At St < K1, fixed profit of Net Premium Received At K2 > St > K1, Profit increases linearly with the St At K3 > St > K2 , Fixed Profit ; i.e Net Premium Received +
Diference between K2 & K3 At St > K3, Profit falls linearly with St
When to Use: - When u have a Bullish Outlook but not very Bullish
Market expectation: Direction bearish/volatility bearish. In this case the holder expects the market to settle between B and C but feels that volatility will not rise.
Profit & loss characteristics at expiry:Profit: Limited to the difference between strikes A and B plus (minus) net credit (debit).
Loss: Unlimited if underlying rallies. At A or below, loss limited to net cost.
Break-even: Lower break-even reached when the underlying exceeds the lower strike option A, by the same amount as the net cost of the position. Higher break-even point reached when the intrinsic value of option A, plus (minus) the net credit (debit) from establishing the position, is equal to the intrinsic value of the two higher strike options at B and C.
Current Price of the Stock =So= 648
Strike Price of Call Option=K1= 640
INTERNATIONAL INSTITUTE OF BUSINESS STUDY
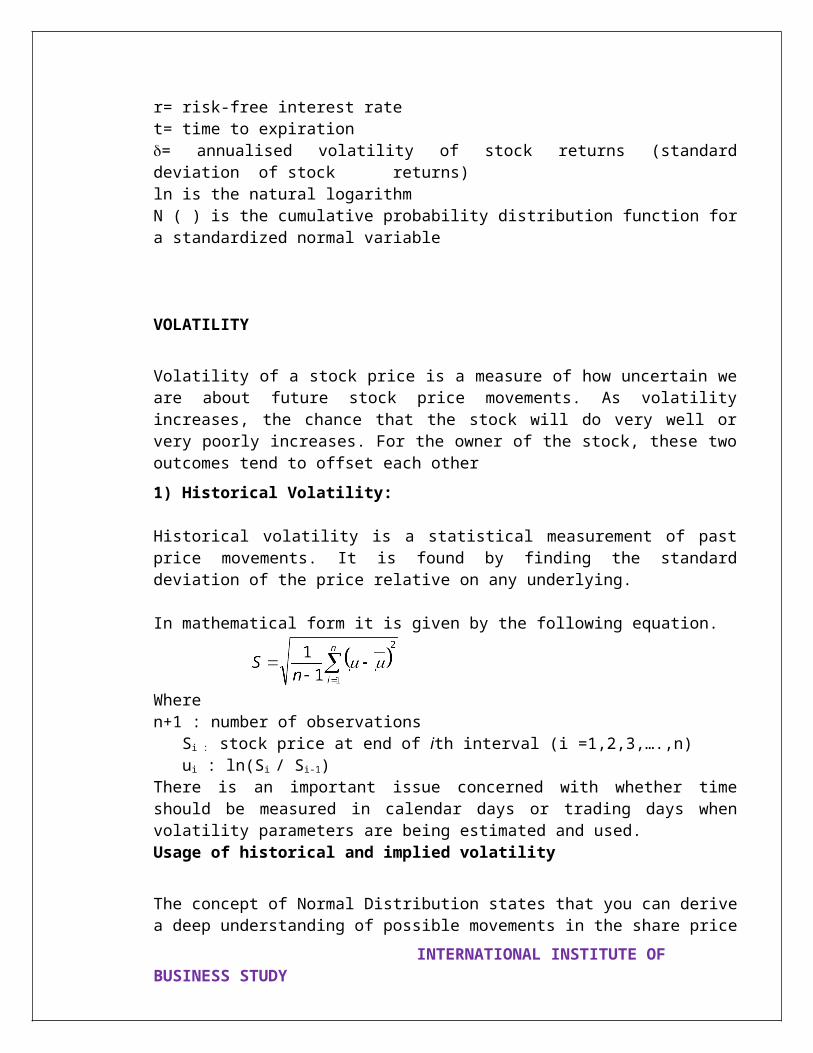
Premium of Call Option =K1= Rs. 20.2Strike Price of Call Option=K2= 660Premium of Call Option =K2= Rs. 14.45Strike Price of Call Option=K3= 680Premium of Call Optionk3 6.95
PAY-OFF TABLE:
St
Premium for K1
Gain / Loss on
K1
Premium for K2
Gain / Loss on
K2
Premium for K3
Gain / Loss on
K3
Total Gain/Los
s
635 20.2 -20.2 14.45 14.45 6.95 6.95 1.2636 20.2 -20.2 14.45 14.45 6.95 6.95 1.2637 20.2 -20.2 14.45 14.45 6.95 6.95 1.2638 20.2 -20.2 14.45 14.45 6.95 6.95 1.2639 20.2 -20.2 14.45 14.45 6.95 6.95 1.2640 20.2 -20.2 14.45 14.45 6.95 6.95 1.2641 20.2 -19.2 14.45 14.45 6.95 6.95 2.2642 20.2 -18.2 14.45 14.45 6.95 6.95 3.2643 20.2 -17.2 14.45 14.45 6.95 6.95 4.2644 20.2 -16.2 14.45 14.45 6.95 6.95 5.2645 20.2 -15.2 14.45 14.45 6.95 6.95 6.2646 20.2 -14.2 14.45 14.45 6.95 6.95 7.2647 20.2 -13.2 14.45 14.45 6.95 6.95 8.2648 20.2 -12.2 14.45 14.45 6.95 6.95 9.2649 20.2 -11.2 14.45 14.45 6.95 6.95 10.2650 20.2 -10.2 14.45 14.45 6.95 6.95 11.2651 20.2 -9.2 14.45 14.45 6.95 6.95 12.2652 20.2 -8.2 14.45 14.45 6.95 6.95 13.2653 20.2 -7.2 14.45 14.45 6.95 6.95 14.2654 20.2 -6.2 14.45 14.45 6.95 6.95 15.2655 20.2 -5.2 14.45 14.45 6.95 6.95 16.2656 20.2 -4.2 14.45 14.45 6.95 6.95 17.2657 20.2 -3.2 14.45 14.45 6.95 6.95 18.2658 20.2 -2.2 14.45 14.45 6.95 6.95 19.2659 20.2 -1.2 14.45 14.45 6.95 6.95 20.2660 20.2 -0.2 14.45 14.45 6.95 6.95 21.2661 20.2 0.8 14.45 13.45 6.95 6.95 21.2662 20.2 1.8 14.45 12.45 6.95 6.95 21.2663 20.2 2.8 14.45 11.45 6.95 6.95 21.2664 20.2 3.8 14.45 10.45 6.95 6.95 21.2665 20.2 4.8 14.45 9.45 6.95 6.95 21.2666 20.2 5.8 14.45 8.45 6.95 6.95 21.2667 20.2 6.8 14.45 7.45 6.95 6.95 21.2
INTERNATIONAL INSTITUTE OF BUSINESS STUDY

668 20.2 7.8 14.45 6.45 6.95 6.95 21.2669 20.2 8.8 14.45 5.45 6.95 6.95 21.2670 20.2 9.8 14.45 4.45 6.95 6.95 21.2671 20.2 10.8 14.45 3.45 6.95 6.95 21.2672 20.2 11.8 14.45 2.45 6.95 6.95 21.2673 20.2 12.8 14.45 1.45 6.95 6.95 21.2674 20.2 13.8 14.45 0.45 6.95 6.95 21.2675 20.2 14.8 14.45 -0.55 6.95 6.95 21.2676 20.2 15.8 14.45 -1.55 6.95 6.95 21.2677 20.2 16.8 14.45 -2.55 6.95 6.95 21.2678 20.2 17.8 14.45 -3.55 6.95 6.95 21.2679 20.2 18.8 14.45 -4.55 6.95 6.95 21.2680 20.2 19.8 14.45 -5.55 6.95 6.95 21.2681 20.2 20.8 14.45 -6.55 6.95 5.95 20.2682 20.2 21.8 14.45 -7.55 6.95 4.95 19.2
INTERNATIONAL INSTITUTE OF BUSINESS STUDY
(2) Bull Spread
DESCRIPTION: - Long on 1 Call at low Strike price K1 & Short on 1 Call at higher strike price K2
PAYOFF: At St ≤ K1, Loss is Fixed; i.e Net Premium Paid At K2 ≥ St ≥K1, Loss Reduces linearly with increase in Price At St > K2, Profit is Fixed; i.e K2 - K1 - Net Premium paid
Market Expectation: Market bullish/volatility neutral. The spread has the advantage of being cheaper to establish than the purchase of a single call, as the premium received from the sold call reduces the overall cost. The spread offers a limited profit potential if the underlying rises and a limited loss if the underlying falls.
When to Use: - Mildly Bullish Perspective
Profit and loss characteristics at expiry:Profit: Limited to the difference between the two strikes minus net premium cost. Maximum profit occurs where the underlying rises to the level of the higher strike B or above.Loss: Limited to any initial premium paid in establishing the position. Maximum loss occurs where the underlying falls to the level of the lower strike A or below.
Break-even: Reached when the underlying is above strike A by the same amount as the net cost of establishing the position.
Current Price of the Stock =So= 648Strike Price of Call Option=K1= 660Premium of Call Option =K1= Rs. 14.45Strike Price of Call Option=K2= 680Premium of Call Option =K2= Rs. 6.95
INTERNATIONAL INSTITUTE OF BUSINESS STUDY
PAY-OFF TABLE
StPremium for Kc1
Gain / Loss on
Kc1Premium for Kc2
Gain / Loss on
Kc2Total
Gain/Loss
613 37.65 -37.65 28.9 28.9 -8.75614 37.65 -37.65 28.9 28.9 -8.75615 37.65 -37.65 28.9 28.9 -8.75616 37.65 -37.65 28.9 28.9 -8.75617 37.65 -37.65 28.9 28.9 -8.75618 37.65 -37.65 28.9 28.9 -8.75619 37.65 -37.65 28.9 28.9 -8.75620 37.65 -37.65 28.9 28.9 -8.75621 37.65 -36.65 28.9 28.9 -7.75622 37.65 -35.65 28.9 28.9 -6.75623 37.65 -34.65 28.9 28.9 -5.75624 37.65 -33.65 28.9 28.9 -4.75625 37.65 -32.65 28.9 28.9 -3.75626 37.65 -31.65 28.9 28.9 -2.75627 37.65 -30.65 28.9 28.9 -1.75628 37.65 -29.65 28.9 28.9 -0.75629 37.65 -28.65 28.9 28.9 0.25630 37.65 -27.65 28.9 28.9 1.25631 37.65 -26.65 28.9 28.9 2.25632 37.65 -25.65 28.9 28.9 3.25633 37.65 -24.65 28.9 28.9 4.25634 37.65 -23.65 28.9 28.9 5.25635 37.65 -22.65 28.9 28.9 6.25636 37.65 -21.65 28.9 28.9 7.25637 37.65 -20.65 28.9 28.9 8.25638 37.65 -19.65 28.9 28.9 9.25639 37.65 -18.65 28.9 28.9 10.25640 37.65 -17.65 28.9 28.9 11.25641 37.65 -16.65 28.9 28.9 12.25642 37.65 -15.65 28.9 28.9 13.25643 37.65 -14.65 28.9 28.9 14.25644 37.65 -13.65 28.9 28.9 15.25645 37.65 -12.65 28.9 28.9 16.25646 37.65 -11.65 28.9 28.9 17.25647 37.65 -10.65 28.9 28.9 18.25648 37.65 -9.65 28.9 28.9 19.25649 37.65 -8.65 28.9 28.9 20.25
INTERNATIONAL INSTITUTE OF BUSINESS STUDY

650 37.65 -7.65 28.9 28.9 21.25651 37.65 -6.65 28.9 28.9 22.25652 37.65 -5.65 28.9 28.9 23.25653 37.65 -4.65 28.9 28.9 24.25654 37.65 -3.65 28.9 28.9 25.25655 37.65 -2.65 28.9 28.9 26.25656 37.65 -1.65 28.9 28.9 27.25657 37.65 -0.65 28.9 28.9 28.25658 37.65 0.35 28.9 28.9 29.25659 37.65 1.35 28.9 28.9 30.25660 37.65 2.35 28.9 28.9 31.25661 37.65 3.35 28.9 26.9 30.25662 37.65 4.35 28.9 24.9 29.25663 37.65 5.35 28.9 22.9 28.25664 37.65 6.35 28.9 20.9 27.25665 37.65 7.35 28.9 18.9 26.25666 37.65 8.35 28.9 16.9 25.25667 37.65 9.35 28.9 14.9 24.25668 37.65 10.35 28.9 12.9 23.25669 37.65 11.35 28.9 10.9 22.25670 37.65 12.35 28.9 8.9 21.25671 37.65 13.35 28.9 6.9 20.25672 37.65 14.35 28.9 4.9 19.25673 37.65 15.35 28.9 2.9 18.25674 37.65 16.35 28.9 0.9 17.25675 37.65 17.35 28.9 -1.1 16.25676 37.65 18.35 28.9 -3.1 15.25677 37.65 19.35 28.9 -5.1 14.25678 37.65 20.35 28.9 -7.1 13.25679 37.65 21.35 28.9 -9.1 12.25680 37.65 22.35 28.9 -11.1 11.25681 37.65 23.35 28.9 -13.1 10.25682 37.65 24.35 28.9 -15.1 9.25683 37.65 25.35 28.9 -17.1 8.25684 37.65 26.35 28.9 -19.1 7.25685 37.65 27.35 28.9 -21.1 6.25686 37.65 28.35 28.9 -23.1 5.25687 37.65 29.35 28.9 -25.1 4.25688 37.65 30.35 28.9 -27.1 3.25689 37.65 31.35 28.9 -29.1 2.25690 37.65 32.35 28.9 -31.1 1.25691 37.65 33.35 28.9 -33.1 0.25692 37.65 34.35 28.9 -35.1 -0.75693 37.65 35.35 28.9 -37.1 -1.75694 37.65 36.35 28.9 -39.1 -2.75
INTERNATIONAL INSTITUTE OF BUSINESS STUDY

695 37.65 37.35 28.9 -41.1 -3.75
INTERNATIONAL INSTITUTE OF BUSINESS STUDY
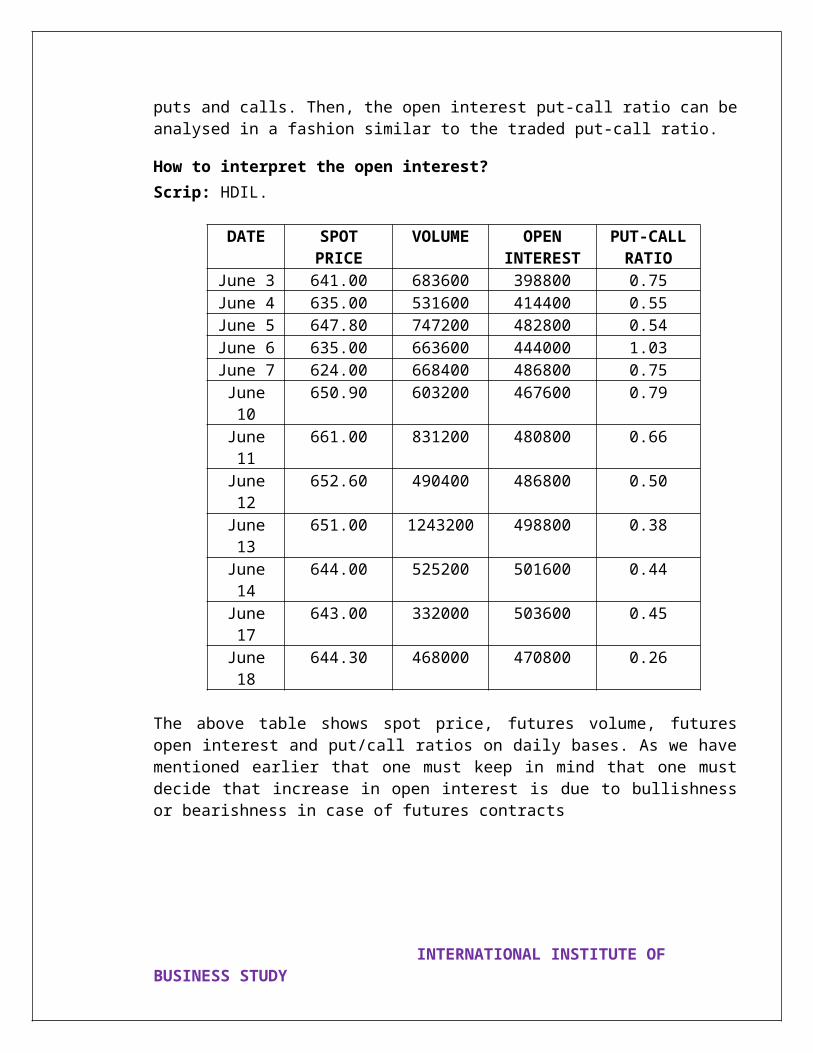
TRADING STRATEGIES USED FOR VOLATILE OUTLOOK
(1) Long Guts
DESCRIPTION: - Long on Call at a low Strike Price & Long on Put at a high Strike Price
PAYOFF: At St < K1, Profit Reduces Linearly with Increase in Price At K2 > St > K1, Loss is Fixed; i.e Difference between (K1 & K2) and
Total Premium Paid At St > K3, Profit increases Linearly with Increase in Price
When to Use: - When the stock is too volatile
Market expectation: Market neutral/volatility bullish. The market is at, or about the A-B range and a large directional move in the underlying is anticipated. Position has characteristics comparable to an in-the-money strangle.
Profit & loss characteristics at expiry:
Profit: Unlimited in a rising or falling market. A substantial directional movement is required however.Loss: Limited to the initial premium paid less the difference between A and B; occurs if the underlying remains within the range A-B.
Break-even: Reached if the underlying rises above the higher strike price B by the amount equal to the cost of establishing the position less A-B, or if the underlying falls below the lower strike price A by the amount equal to the cost of establishing the position less A-B.
Current Price of the Stock =So= 648
Strike Price of Put Option =Kp= 680
Premium of Put Option =P= Rs. 36.5
Strike Price of Call Option=Kc= 620
Premium of Call Option =C= Rs. 37.65
INTERNATIONAL INSTITUTE OF BUSINESS STUDY

PAY-OFF TABLEPrice of Stock on
Expiry Day ( St )
Premium Paid (
C )
Profit / Loss on
Call Position
Premium Put ( P )
Profit / Loss on
Put Position
Total Profit / Loss
595 37.65 -37.65 36.5 48.5 10.85596 37.65 -37.65 36.5 47.5 9.85597 37.65 -37.65 36.5 46.5 8.85598 37.65 -37.65 36.5 45.5 7.85599 37.65 -37.65 36.5 44.5 6.85600 37.65 -37.65 36.5 43.5 5.85601 37.65 -37.65 36.5 42.5 4.85602 37.65 -37.65 36.5 41.5 3.85603 37.65 -37.65 36.5 40.5 2.85604 37.65 -37.65 36.5 39.5 1.85605 37.65 -37.65 36.5 38.5 0.85606 37.65 -37.65 36.5 37.5 -0.15607 37.65 -37.65 36.5 36.5 -1.15608 37.65 -37.65 36.5 35.5 -2.15609 37.65 -37.65 36.5 34.5 -3.15610 37.65 -37.65 36.5 33.5 -4.15611 37.65 -37.65 36.5 32.5 -5.15612 37.65 -37.65 36.5 31.5 -6.15613 37.65 -37.65 36.5 30.5 -7.15614 37.65 -37.65 36.5 29.5 -8.15615 37.65 -37.65 36.5 28.5 -9.15616 37.65 -37.65 36.5 27.5 -10.15617 37.65 -37.65 36.5 26.5 -11.15618 37.65 -37.65 36.5 25.5 -12.15619 37.65 -37.65 36.5 24.5 -13.15620 37.65 -37.65 36.5 23.5 -14.15621 37.65 -36.65 36.5 22.5 -14.15622 37.65 -35.65 36.5 21.5 -14.15623 37.65 -34.65 36.5 20.5 -14.15624 37.65 -33.65 36.5 19.5 -14.15625 37.65 -32.65 36.5 18.5 -14.15626 37.65 -31.65 36.5 17.5 -14.15627 37.65 -30.65 36.5 16.5 -14.15628 37.65 -29.65 36.5 15.5 -14.15629 37.65 -28.65 36.5 14.5 -14.15630 37.65 -27.65 36.5 13.5 -14.15631 37.65 -26.65 36.5 12.5 -14.15632 37.65 -25.65 36.5 11.5 -14.15
INTERNATIONAL INSTITUTE OF BUSINESS STUDY

633 37.65 -24.65 36.5 10.5 -14.15634 37.65 -23.65 36.5 9.5 -14.15635 37.65 -22.65 36.5 8.5 -14.15636 37.65 -21.65 36.5 7.5 -14.15637 37.65 -20.65 36.5 6.5 -14.15638 37.65 -19.65 36.5 5.5 -14.15639 37.65 -18.65 36.5 4.5 -14.15640 37.65 -17.65 36.5 3.5 -14.15641 37.65 -16.65 36.5 2.5 -14.15642 37.65 -15.65 36.5 1.5 -14.15643 37.65 -14.65 36.5 0.5 -14.15644 37.65 -13.65 36.5 -0.5 -14.15645 37.65 -12.65 36.5 -1.5 -14.15646 37.65 -11.65 36.5 -2.5 -14.15647 37.65 -10.65 36.5 -3.5 -14.15648 37.65 -9.65 36.5 -4.5 -14.15649 37.65 -8.65 36.5 -5.5 -14.15650 37.65 -7.65 36.5 -6.5 -14.15651 37.65 -6.65 36.5 -7.5 -14.15652 37.65 -5.65 36.5 -8.5 -14.15653 37.65 -4.65 36.5 -9.5 -14.15654 37.65 -3.65 36.5 -10.5 -14.15655 37.65 -2.65 36.5 -11.5 -14.15656 37.65 -1.65 36.5 -12.5 -14.15657 37.65 -0.65 36.5 -13.5 -14.15658 37.65 0.35 36.5 -14.5 -14.15659 37.65 1.35 36.5 -15.5 -14.15660 37.65 2.35 36.5 -16.5 -14.15661 37.65 3.35 36.5 -17.5 -14.15662 37.65 4.35 36.5 -18.5 -14.15663 37.65 5.35 36.5 -19.5 -14.15664 37.65 6.35 36.5 -20.5 -14.15665 37.65 7.35 36.5 -21.5 -14.15666 37.65 8.35 36.5 -22.5 -14.15667 37.65 9.35 36.5 -23.5 -14.15668 37.65 10.35 36.5 -24.5 -14.15669 37.65 11.35 36.5 -25.5 -14.15670 37.65 12.35 36.5 -26.5 -14.15671 37.65 13.35 36.5 -27.5 -14.15672 37.65 14.35 36.5 -28.5 -14.15673 37.65 15.35 36.5 -29.5 -14.15674 37.65 16.35 36.5 -30.5 -14.15675 37.65 17.35 36.5 -31.5 -14.15676 37.65 18.35 36.5 -32.5 -14.15677 37.65 19.35 36.5 -33.5 -14.15
INTERNATIONAL INSTITUTE OF BUSINESS STUDY
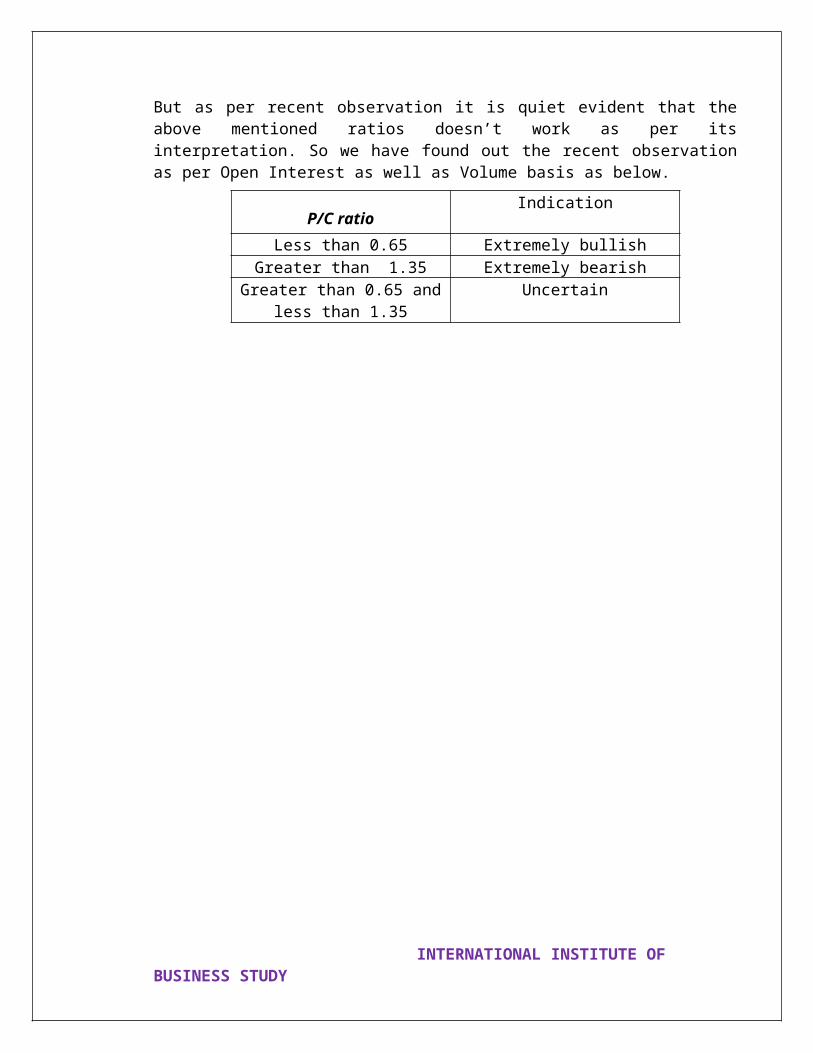
678 37.65 20.35 36.5 -34.5 -14.15679 37.65 21.35 36.5 -35.5 -14.15680 37.65 22.35 36.5 -36.5 -14.15681 37.65 23.35 36.5 -36.5 -13.15682 37.65 24.35 36.5 -36.5 -12.15683 37.65 25.35 36.5 -36.5 -11.15684 37.65 26.35 36.5 -36.5 -10.15685 37.65 27.35 36.5 -36.5 -9.15686 37.65 28.35 36.5 -36.5 -8.15687 37.65 29.35 36.5 -36.5 -7.15688 37.65 30.35 36.5 -36.5 -6.15689 37.65 31.35 36.5 -36.5 -5.15690 37.65 32.35 36.5 -36.5 -4.15691 37.65 33.35 36.5 -36.5 -3.15692 37.65 34.35 36.5 -36.5 -2.15693 37.65 35.35 36.5 -36.5 -1.15694 37.65 36.35 36.5 -36.5 -0.15695 37.65 37.35 36.5 -36.5 0.85696 37.65 38.35 36.5 -36.5 1.85697 37.65 39.35 36.5 -36.5 2.85698 37.65 40.35 36.5 -36.5 3.85699 37.65 41.35 36.5 -36.5 4.85700 37.65 42.35 36.5 -36.5 5.85701 37.65 43.35 36.5 -36.5 6.85702 37.65 44.35 36.5 -36.5 7.85703 37.65 45.35 36.5 -36.5 8.85704 37.65 46.35 36.5 -36.5 9.85705 37.65 47.35 36.5 -36.5 10.85
INTERNATIONAL INSTITUTE OF BUSINESS STUDY
INTERNATIONAL INSTITUTE OF BUSINESS STUDY

PAY-OFF TABLE
StPremium for Kc1
Gain / Loss on
Kc1Premium for Kp1
Gain / Loss on
Kp1Premium for Kc2
Gain / Loss on
Kc2Premium for Kp2
Gain / Loss on
Kp2Total
Gain/Loss
600 34.65 -34.65 7.85 -12.15 6.95 6.95 36.5 43.5 3.65601 34.65 -34.65 7.85 -11.15 6.95 6.95 36.5 42.5 3.65602 34.65 -34.65 7.85 -10.15 6.95 6.95 36.5 41.5 3.65603 34.65 -34.65 7.85 -9.15 6.95 6.95 36.5 40.5 3.65604 34.65 -34.65 7.85 -8.15 6.95 6.95 36.5 39.5 3.65605 34.65 -34.65 7.85 -7.15 6.95 6.95 36.5 38.5 3.65606 34.65 -34.65 7.85 -6.15 6.95 6.95 36.5 37.5 3.65607 34.65 -34.65 7.85 -5.15 6.95 6.95 36.5 36.5 3.65608 34.65 -34.65 7.85 -4.15 6.95 6.95 36.5 35.5 3.65609 34.65 -34.65 7.85 -3.15 6.95 6.95 36.5 34.5 3.65610 34.65 -34.65 7.85 -2.15 6.95 6.95 36.5 33.5 3.65611 34.65 -34.65 7.85 -1.15 6.95 6.95 36.5 32.5 3.65612 34.65 -34.65 7.85 -0.15 6.95 6.95 36.5 31.5 3.65613 34.65 -34.65 7.85 0.85 6.95 6.95 36.5 30.5 3.65614 34.65 -34.65 7.85 1.85 6.95 6.95 36.5 29.5 3.65615 34.65 -34.65 7.85 2.85 6.95 6.95 36.5 28.5 3.65616 34.65 -34.65 7.85 3.85 6.95 6.95 36.5 27.5 3.65617 34.65 -34.65 7.85 4.85 6.95 6.95 36.5 26.5 3.65618 34.65 -34.65 7.85 5.85 6.95 6.95 36.5 25.5 3.65619 34.65 -34.65 7.85 6.85 6.95 6.95 36.5 24.5 3.65620 34.65 -34.65 7.85 7.85 6.95 6.95 36.5 23.5 3.65621 34.65 -33.65 7.85 7.85 6.95 6.95 36.5 22.5 3.65622 34.65 -32.65 7.85 7.85 6.95 6.95 36.5 21.5 3.65623 34.65 -31.65 7.85 7.85 6.95 6.95 36.5 20.5 3.65624 34.65 -30.65 7.85 7.85 6.95 6.95 36.5 19.5 3.65625 34.65 -29.65 7.85 7.85 6.95 6.95 36.5 18.5 3.65626 34.65 -28.65 7.85 7.85 6.95 6.95 36.5 17.5 3.65627 34.65 -27.65 7.85 7.85 6.95 6.95 36.5 16.5 3.65628 34.65 -26.65 7.85 7.85 6.95 6.95 36.5 15.5 3.65629 34.65 -25.65 7.85 7.85 6.95 6.95 36.5 14.5 3.65630 34.65 -24.65 7.85 7.85 6.95 6.95 36.5 13.5 3.65631 34.65 -23.65 7.85 7.85 6.95 6.95 36.5 12.5 3.65632 34.65 -22.65 7.85 7.85 6.95 6.95 36.5 11.5 3.65633 34.65 -21.65 7.85 7.85 6.95 6.95 36.5 10.5 3.65634 34.65 -20.65 7.85 7.85 6.95 6.95 36.5 9.5 3.65635 34.65 -19.65 7.85 7.85 6.95 6.95 36.5 8.5 3.65636 34.65 -18.65 7.85 7.85 6.95 6.95 36.5 7.5 3.65637 34.65 -17.65 7.85 7.85 6.95 6.95 36.5 6.5 3.65638 34.65 -16.65 7.85 7.85 6.95 6.95 36.5 5.5 3.65
INTERNATIONAL INSTITUTE OF BUSINESS STUDY

639 34.65 -15.65 7.85 7.85 6.95 6.95 36.5 4.5 3.65640 34.65 -14.65 7.85 7.85 6.95 6.95 36.5 3.5 3.65641 34.65 -13.65 7.85 7.85 6.95 6.95 36.5 2.5 3.65642 34.65 -12.65 7.85 7.85 6.95 6.95 36.5 1.5 3.65643 34.65 -11.65 7.85 7.85 6.95 6.95 36.5 0.5 3.65644 34.65 -10.65 7.85 7.85 6.95 6.95 36.5 -0.5 3.65645 34.65 -9.65 7.85 7.85 6.95 6.95 36.5 -1.5 3.65646 34.65 -8.65 7.85 7.85 6.95 6.95 36.5 -2.5 3.65647 34.65 -7.65 7.85 7.85 6.95 6.95 36.5 -3.5 3.65648 34.65 -6.65 7.85 7.85 6.95 6.95 36.5 -4.5 3.65649 34.65 -5.65 7.85 7.85 6.95 6.95 36.5 -5.5 3.65650 34.65 -4.65 7.85 7.85 6.95 6.95 36.5 -6.5 3.65651 34.65 -3.65 7.85 7.85 6.95 6.95 36.5 -7.5 3.65652 34.65 -2.65 7.85 7.85 6.95 6.95 36.5 -8.5 3.65653 34.65 -1.65 7.85 7.85 6.95 6.95 36.5 -9.5 3.65654 34.65 -0.65 7.85 7.85 6.95 6.95 36.5 -10.5 3.65655 34.65 0.35 7.85 7.85 6.95 6.95 36.5 -11.5 3.65656 34.65 1.35 7.85 7.85 6.95 6.95 36.5 -12.5 3.65657 34.65 2.35 7.85 7.85 6.95 6.95 36.5 -13.5 3.65658 34.65 3.35 7.85 7.85 6.95 6.95 36.5 -14.5 3.65659 34.65 4.35 7.85 7.85 6.95 6.95 36.5 -15.5 3.65660 34.65 5.35 7.85 7.85 6.95 6.95 36.5 -16.5 3.65661 34.65 6.35 7.85 7.85 6.95 6.95 36.5 -17.5 3.65662 34.65 7.35 7.85 7.85 6.95 6.95 36.5 -18.5 3.65663 34.65 8.35 7.85 7.85 6.95 6.95 36.5 -19.5 3.65664 34.65 9.35 7.85 7.85 6.95 6.95 36.5 -20.5 3.65665 34.65 10.35 7.85 7.85 6.95 6.95 36.5 -21.5 3.65666 34.65 11.35 7.85 7.85 6.95 6.95 36.5 -22.5 3.65667 34.65 12.35 7.85 7.85 6.95 6.95 36.5 -23.5 3.65668 34.65 13.35 7.85 7.85 6.95 6.95 36.5 -24.5 3.65669 34.65 14.35 7.85 7.85 6.95 6.95 36.5 -25.5 3.65670 34.65 15.35 7.85 7.85 6.95 6.95 36.5 -26.5 3.65671 34.65 16.35 7.85 7.85 6.95 6.95 36.5 -27.5 3.65672 34.65 17.35 7.85 7.85 6.95 6.95 36.5 -28.5 3.65673 34.65 18.35 7.85 7.85 6.95 6.95 36.5 -29.5 3.65674 34.65 19.35 7.85 7.85 6.95 6.95 36.5 -30.5 3.65675 34.65 20.35 7.85 7.85 6.95 6.95 36.5 -31.5 3.65676 34.65 21.35 7.85 7.85 6.95 6.95 36.5 -32.5 3.65677 34.65 22.35 7.85 7.85 6.95 6.95 36.5 -33.5 3.65678 34.65 23.35 7.85 7.85 6.95 6.95 36.5 -34.5 3.65679 34.65 24.35 7.85 7.85 6.95 6.95 36.5 -35.5 3.65680 34.65 25.35 7.85 7.85 6.95 6.95 36.5 -36.5 3.65681 34.65 26.35 7.85 7.85 6.95 5.95 36.5 -36.5 3.65682 34.65 27.35 7.85 7.85 6.95 4.95 36.5 -36.5 3.65683 34.65 28.35 7.85 7.85 6.95 3.95 36.5 -36.5 3.65
INTERNATIONAL INSTITUTE OF BUSINESS STUDY

684 34.65 29.35 7.85 7.85 6.95 2.95 36.5 -36.5 3.65685 34.65 30.35 7.85 7.85 6.95 1.95 36.5 -36.5 3.65
INTERNATIONAL INSTITUTE OF BUSINESS STUDY
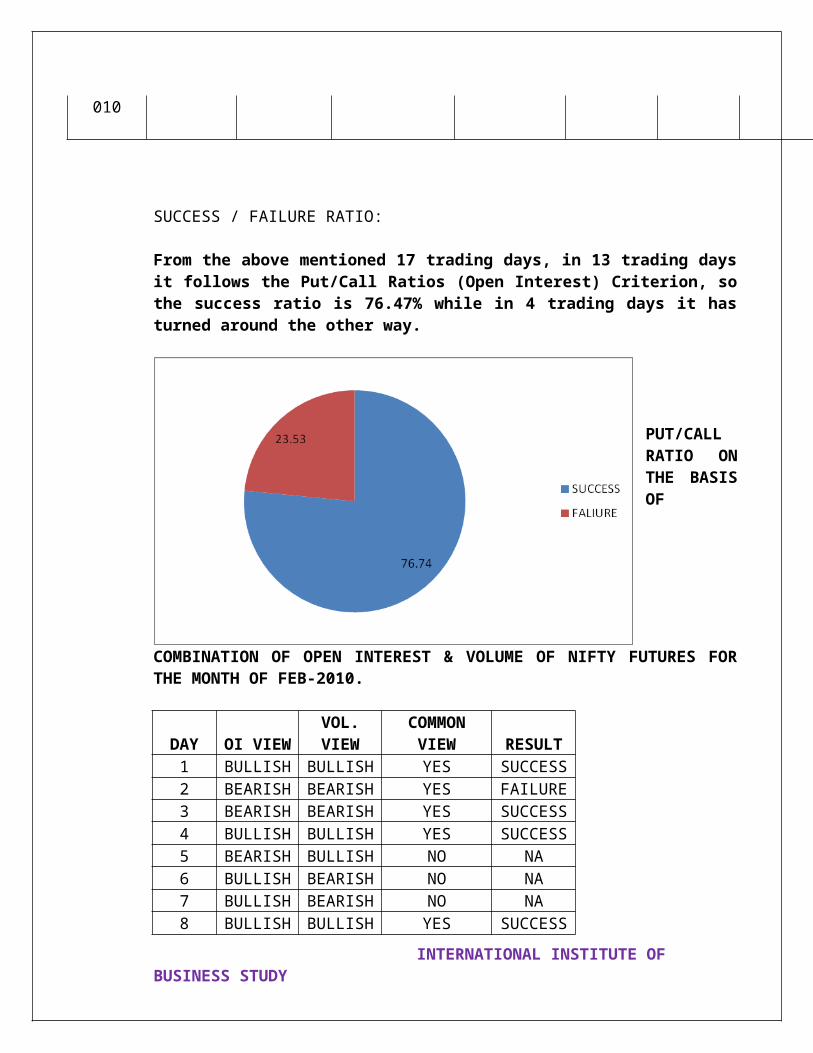
FINDINGS:
(1) Open Interest & Put/Call Ratio are the most important indicators which help to determine the trend of Nifty for the next trading day.
(2) Put/Call Ratio can be calculated on the basis of:(a) Open Interest(b) VolumeFor calculating Put/Call Ratio, Open Interest turned to more accurate base than Volume for determining the trend of nifty for the next trading day as it sort out all the outstanding positions from the total Volume.
(3) In determining the trend of the nifty for the next trading day, Analysis of Put/Call Ratio proves to be more accurate compared to the Open Interest Analysis.
(4) For even better Outcome, one can use the combination of Open Interest & Volume for calculating the Put/Call Ratio to determine the trend of nifty in the next trading day.
(5) Basically there are types four types of Outlooks prevailing in the derivatives market
(a) Bullish View(b) Bearish View(c) Range bound View(d) Volatile View
(6) The following table reflects the best suited strategies against each view:
VIEW STRATEGYBULLISH (a) Collar Strategy
(b) Short Combo(c) Long Strap
BEARISH (a) Reverse Collar(b) Long Combo(c) Long Strip
Volatile (a) Long Guts(b) Long Straddle(c) Short Condor
Range Bound (a) Double Top(b) Christmas Trees
(7) By practicing such type of trading strategy, one can earn unlimited profits if the market turns in favorable zone & if the market moves other way round, loss exposure is limited to a certain extent.
(8) There are certain Opportunistic trading strategy in the market in which one can earn fixed amount of profit, irrespective of the market movement, such type of
INTERNATIONAL INSTITUTE OF BUSINESS STUDY
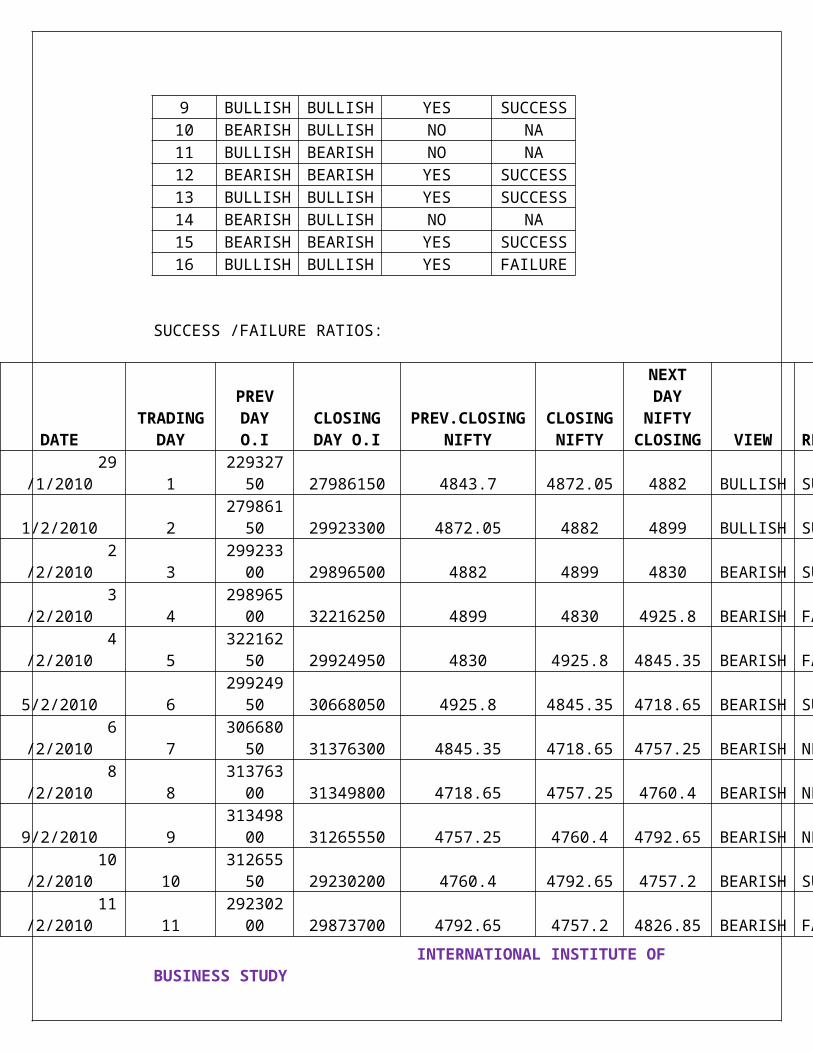
Trading strategies are known as Arbitrage Trading strategies which are not readily available but one has to grab such opportunities from the market from the price movements.
INTERNATIONAL INSTITUTE OF BUSINESS STUDY
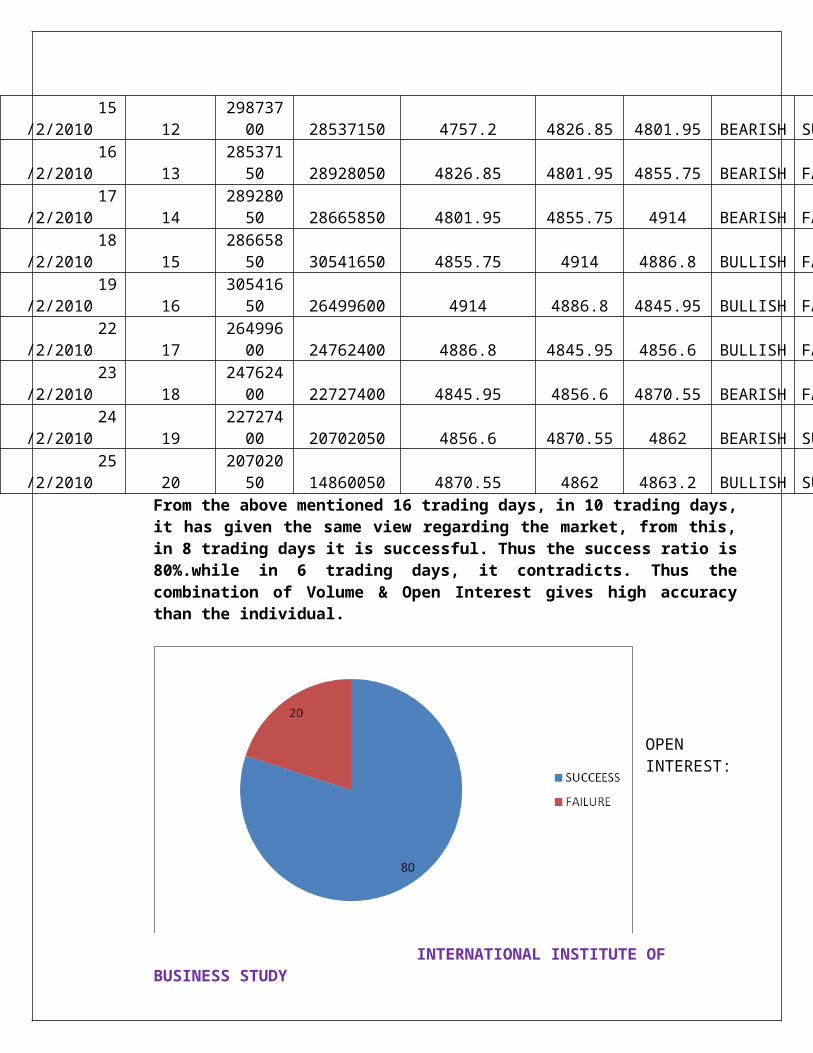
CONCLUSION:
There are many indicators which can be used while trading in derivative market but widely used & more effective are open interest & put call ratio. Investors can study both together & can arrive at meaningful trend. These indicators can also be jointly used with technical analysis indicators to find out profitable buying & selling points.
Trading strategy can be framed by individual taking several considerations like view for the market-bullish, bearish or uncertain, type of trader-hedger, speculator or arbitrageur, risk appetite, period of investment, type of analysis-fundamental or technical analysis etc.But important thing is to minimize loss & take the right opportunity. Now a day markets are very volatile, so it is in the interest of investors to frame volatile market strategies as stated above rather than to have one view. Investors should have constant look on the market to execute opportunistic strategies which gives fix amount of profit irrespective of market fluctuations. Investors rather than keeping one view bullish or bearish its better to have volatile market strategy with limited loss and limited profits.
INTERNATIONAL INSTITUTE OF BUSINESS STUDY

BIBLIOGRAPHY
BOOKS:
OPTIONS AND FUTURES –IN INDIAN PERSPECTIVE D. C. PATWARI
OPTIONS, FUTURES AND OTHER DERIVATIVES JOHN C. HULL
TECHNICAL ANALYSIS OF FUTURES MARKET JOHN MURPHY
FUTURES AND OPTIONS N.D. VOHRA & B.R. BAGRI
WEB SITES:
www.sebi.comwww.bseindia.comwww.nseindia.comwww.derivativesindia.comwww.hathwaysecurities.comwww.moneycontrol.comwww.arcadiastock.comwww.anagram.com
SOFTWARE:
CAPITALINE NEO ODIEN DIET OF NSE
INTERNATIONAL INSTITUTE OF BUSINESS STUDY

GLOSSARY
American-style Option: An option contract that may be exercised at any time between the date of purchase and the expiration date.
At-the-money: Option whose exercise price is the same as the market price of the underlying asset.
Bear: Someone who thinks market prices will decline.
Bull: Someone who thinks market prices will rise.
Call: An option contract granting the purchaser the right to buy the underlying instruments at the agreed strike price. A call obliges the seller to sell the underlying instrument at the agreed strike price, if the option is assigned to him.
Cash settlement: Settlement of a contract by payment or receipt of a settlement amount instead of the physical delivery of the underlying asset.
Closing: Conducting a transaction, which offsets the original trade and liquidates an existing position.
Contract unit: The number of units of the underlying instrument on which the contract bears, i.e. contract size. This may vary according to the underlying on which the contract bears.
European-style options: An option that can be exercised by the buyer only on the contract expiration date.
Exercise: A decision, reserved for the option holder, to request execution of the contract.
Expiration date: The date on which the option contract expires.
Hedge: A conservative strategy used to limit investment loss by effecting a transaction, which offsets an existing position.
Holder: The party who purchased an option.
In-the-money: A call is said to be "in-the-money" when the value of the underlying instrument is greater than the option strike price. A put is "in-the-money" when its strike price is greater than the value of the underlying instrument.
INTERNATIONAL INSTITUTE OF BUSINESS STUDY
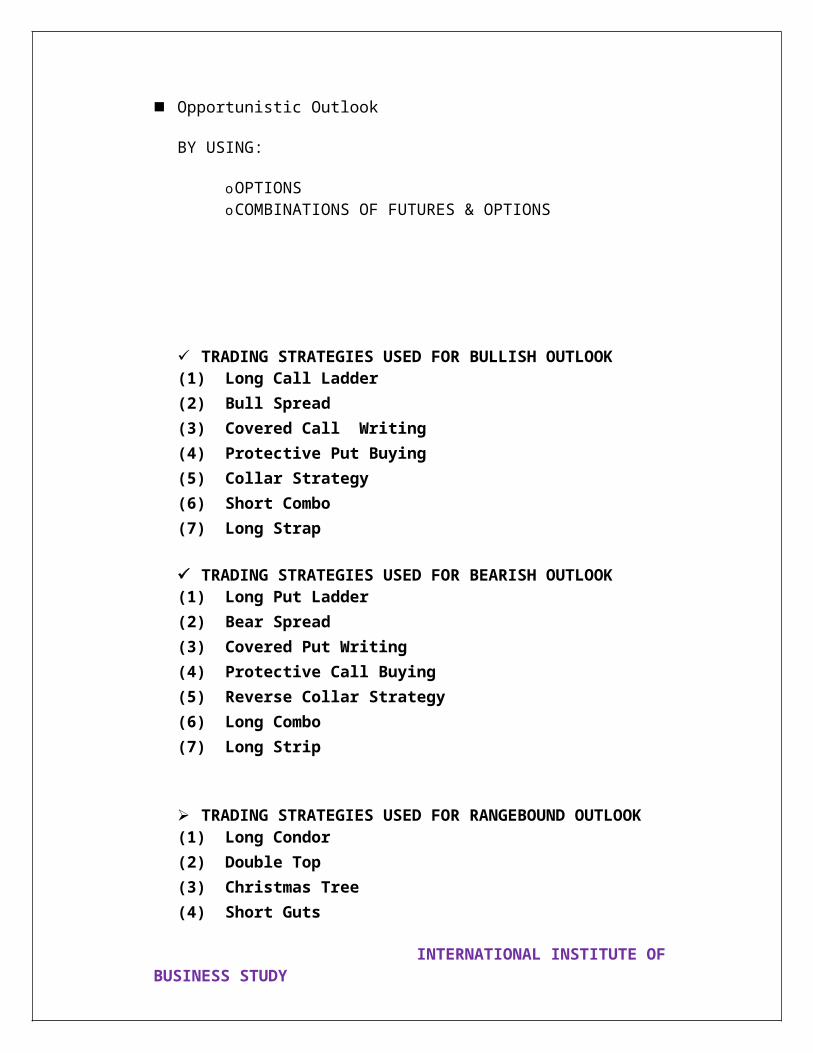
Intrinsic value: The intrinsic value of an option is the difference between the actual price of the underlying security and the strike price of the option. The intrinsic value of an option reflects the effective financial advantage that would result from the immediate exercise of that option.
Liquidity: Market situation in which quick purchase or sale of a security is possible without causing substantial changes in prices.
Long position: An investor’s position where the number of contracts bought exceeds the number of contracts sold. He is a net holder.
Lot size: Number of contract you want to buy or sell
Maintenance Margin: A set minimum margin that a customer must maintain in his margin account.
Mark-To-Market: Valuation of a financial instrument according to the current trading value (price) on the exchange.
Open interest: The number of outstanding option contracts in the exchange market or in a particular class or series.
Option: A contract that conveys the right, but not the obligation, to buy or sell a particular item at a certain price for a limited time. Only the seller of the option is obligated to perform.
Out-of-the-money: A call is "out-of-the-money" when the value of the underlying instrument is less than the option strike price. A put is "out-of-the-money" when its strike price is less than the value of the underlying instrument.
Premium: The price of an option–the sum of money that the option buyer pays and the option seller receives for the rights granted by the option.
at the agreed strike price. A put obliges the seller to purchase the underlying nstrument at the agreed strike price, if the option is assigned to him.tion: An investor’s position where the number of contracts sold exceeds the number of contracts bought. The person is a net seller.
Spot Price: Refers to the underlying current market price.
Strike price or exercise price: The price at which the option holder may purchase (in case of call) or sell (in case of put) the underlying instrument.
Time value: It is determined by the remaining lifespan of the option, the volatility and the cost of refinancing the underlying asset (interest rates).
Time value = option price - intrinsic value
INTERNATIONAL INSTITUTE OF BUSINESS STUDY

INTERNATIONAL INSTITUTE OF BUSINESS STUDY