NICE DSU TECHNICAL SUPPORT DOCUMENT 10: THE USE OF …
31
1 NICE DSU TECHNICAL SUPPORT DOCUMENT 10: THE USE OF MAPPING METHODS TO ESTIMATE HEALTH STATE UTILITY VALUES REPORT BY THE DECISION SUPPORT UNIT April 2011 Louise Longworth, 1 Donna Rowen 2 1. Health Economics Research Group (HERG), Brunel University, Uxbridge, Middlesex, UK. UB8 3PH. 2. School of Health and Related Research (ScHARR), University of Sheffield, Sheffield. Sheffield, UK. S1 4DA Decision Support Unit, ScHARR, University of Sheffield, Regent Court, 30 Regent Street Sheffield, S1 4DA Tel (+44) (0)114 222 0734 E-mail [email protected]
Transcript of NICE DSU TECHNICAL SUPPORT DOCUMENT 10: THE USE OF …

1
NICE DSU TECHNICAL SUPPORT DOCUMENT 10:
THE USE OF MAPPING METHODS
TO ESTIMATE HEALTH STATE UTILITY VALUES
REPORT BY THE DECISION SUPPORT UNIT
April 2011
Louise Longworth,1 Donna Rowen2
1. Health Economics Research Group (HERG), Brunel University, Uxbridge, Middlesex, UK. UB8 3PH.
2. School of Health and Related Research (ScHARR), University of Sheffield, Sheffield. Sheffield, UK. S1 4DA
Decision Support Unit, ScHARR, University of Sheffield, Regent Court, 30 Regent Street
Sheffield, S1 4DA
Tel (+44) (0)114 222 0734
E-mail [email protected]
2
ABOUT THE DECISION SUPPORT UNIT The Decision Support Unit (DSU) is a collaboration between the Universities of Sheffield,
York and Leicester. We also have members at the University of Bristol, London School of
Hygiene and Tropical Medicine and Brunel University.
The DSU is commissioned by The National Institute for Health and Clinical Excellence
(NICE) to provide a research and training resource to support the Institute's Technology
Appraisal Programme. Please see our website for further information www.nicedsu.org.uk
ABOUT THE TECHNICAL SUPPORT DOCUMENT SERIES The NICE Guide to the Methods of Technology Appraisali is a regularly updated document
that provides an overview of the key principles and methods of health technology assessment
and appraisal for use in NICE appraisals. The Methods Guide does not provide detailed
advice on how to implement and apply the methods it describes. This DSU series of
Technical Support Documents (TSDs) is intended to complement the Methods Guide by
providing detailed information on how to implement specific methods.
The TSDs provide a review of the current state of the art in each topic area, and make clear
recommendations on the implementation of methods and reporting standards where it is
appropriate to do so. They aim to provide assistance to all those involved in submitting or
critiquing evidence as part of NICE Technology Appraisals, whether manufacturers,
assessment groups or any other stakeholder type.
We recognise that there are areas of uncertainty, controversy and rapid development. It is our
intention that such areas are indicated in the TSDs. All TSDs are extensively peer reviewed
prior to publication (the names of peer reviewers appear in the acknowledgements for each
document). Nevertheless, the responsibility for each TSD lies with the authors and we
welcome any constructive feedback on the content or suggestions for further guides.
Please be aware that whilst the DSU is funded by NICE, these documents do not constitute
formal NICE guidance or policy.
Dr Allan Wailoo
Director of DSU and TSD series editor.
i National Institute for Health and Clinical Excellence. Guide to the methods of technology appraisal, 2008 (updated June 2008), London.

3
Acknowledgements
The authors are grateful to John Brazier, Ben van Hout, Andrea Manca, Simon Pickard, Allan
Wailoo and the team at NICE, led by Jennifer Priaulx, for their very helpful comments on an
earlier draft. The editor for the TSD series is Allan Wailoo.
The production of this document was funded by the National Institute for Health and Clinical
Excellence (NICE) through its Decision Support Unit. The views, and any errors or
omissions, expressed in this document are of the authors only. NICE may take account of part
or all of this document if it considers it appropriate, but it is not bound to do so.
This report should be referenced as follows:
Longworth, L., Rowen, D. NICE DSU Technical Support Document 10: The use of mapping
methods to estimate health state utility values. 2011. Available from
http://www.nicedsu.org.uk
4
EXECUTIVE SUMMARY
The NICE Guide to the Methods of Technology Appraisals recommends that quality adjusted
life years (QALYs) are used as the measure of outcome for economic evaluation, and that the
EQ-5D is the preferred measure of health-related utility to calculate QALYs. The guide also
recognises that EQ-5D data may not always be available to analysts producing submissions
and reports for NICE. Where such data are not available, the guide states that mapping can be
used to predict EQ-5D data.
‘Mapping’ is the development and use of an algorithm (or algorithms) to predict health-state
utility values using data on other indicators or measures of health. The algorithm can be
applied to data from clinical trials, other studies or economic models containing the source
predictive measure(s) to predict utility values even though the target preference-based
measure was not included in the original source study of effectiveness. The predicted utility
values can then be analysed using standard methods for trial-based analyses or summarised
for each health state within an economic model.
Although the use of mapping to predict utility data has only recently been referred to within
the NICE Guide to the Methods of Technology Appraisals, it has been used for several years
in NICE submissions. An overview of the use of mapping in Technology Appraisals recently
found that mapping had been used in over a quarter of submission to the TA programme.
This support document draws on previous research to report the methods that can be used to
map to EQ-5D data and draws on existing research, conducted for the NICE TA programme
and the wider literature. A series of recommendations are provided for analysts considering
the use of mapping to estimate health-related utility for inclusion in NICE Technology
Appraisals:
• In most cases, mapping should be considered at best a second-best solution to directly
collected EQ-5D values, as the use of mapping will lead to increased uncertainty and
error around the estimates of health-related utility.
• Mapping should be based on direct statistical association mapping rather than opinion.
This involves two stages: firstly using empirical data regression models are used to
estimate the relationship between ‘target’ EQ-5D utility scores and other ‘source’
indicators or measures of health. These models can be estimated specifically for the

5
TA or obtained from the mapping literature. Secondly the results of these models can
be applied to patient level or mean level data from the clinical trial(s) or observation
study containing the source predictive measure(s) in order to predict EQ-5D utility
values.
• The characteristics of the estimation sample should be similar to the target sample for
the mapping analysis, and should contain all variables from the target sample or
included in the economic model that are thought to impact on EQ-5D scores. Under
some circumstances, it may be appropriate for the estimation sample to include a
broader range of people, providing that the target sample is sufficiently represented.
• Standard statistical techniques should be used to examine the data prior to mapping
estimation to inform model selection and specification (for example frequency tables
and correlations). The dataset used to estimate the mapping regression should be fully
described including both the range of EQ-5D values and graphical plots showing the
distribution of EQ-5D data.
• The range of observed EQ-5D values from the source sample and predicted EQ-5D
values used in the cost-effectiveness model should be fully described to provide
information of whether the EQ-5D predicted utilities have involved extrapolation,
which should be avoided.
• The appropriate model type differs depending on the dataset and how it is applied.
Standard econometric and statistical techniques and judgement based on prior
knowledge of the clinical relationship between variables should be used to inform
model selection and application (such as statistical significance, sign and size of
coefficients, R-squared and adjusted R-squared, and information criterion of AIC and
BIC). The properties of the sample dataset should be used to inform model selection
and a justification should be provided explaining why the selected regression model
was chosen.
• The statistical properties of the mapping algorithms should be clearly described. The
root mean squared error or mean squared error should be reported. Errors should also
be reported across subsets of the EQ-5D range (e.g. EQ-5D<0, 0≤EQ-5D<0.25,
0.25≤EQ-5D<0.5, 0.5≤EQ-5D<0.75, 0.75≤EQ-5D≤1) and a plot of observed and
predicted values should be used.

6
• The model should be validated. Ideally this would be conducted using an external
sample similar to the target sample. However it is unlikely that this will be available
in many cases. Where the sample size is large enough to do so, it is recommended that
the sample is randomly split to provide an estimation subsample and validation
sample. The final model specification can then be re-estimated using the full sample.
• If there is no overlap in content between the measures of interest, mapping is unlikely
to be able to appropriately capture the relationship to estimate health-related utility.
Alternative methods for estimating health-related utility data should be considered in
these circumstances.
The main advantage of mapping is that it enables outcomes data collected in a trial or
observational study to be used in economic evaluation to meet the NICE reference case, even
if the main source trial or study did not include the EQ-5D. However, in most cases it is still
preferable to obtain directly collected data within studies of effectiveness. Whereas most
NICE submissions that have used mapping have used condition-specific measures of health
related quality of life or clinical indicators of disease severity to predict EQ-5D scores for
patients, the majority of published literature has focused on mapping between generic
measures using general population samples. Whilst there are areas of uncertainty in the most
appropriate methods for mapping, there is a significant amount of active research currently
being conducted in this area and we hope that these will be resolved in the near future.

7
CONTENTS 1. INTRODUCTION AND BACKGROUND ................................................................ 8
1.1. PURPOSE OF THIS TECHNICAL SUPPORT DOCUMENT ........................................................... 8
1.2. THE NICE METHODS GUIDE ............................................................................................... 8
1.3. WHAT IS MAPPING? ............................................................................................................ 9
1.4. NICE RECOMMENDATIONS ON MAPPING ........................................................................... 11
2. USE OF MAPPING IN NICE TECHNOLOGY APPRAISALS ............................. 12
3. HOW TO USE MAPPING IN HEALTH TECHNOLOGY ASSESSMENT ......... 14
3.1. THE ESTIMATION SAMPLE ................................................................................................. 15
3.2. THE MAPPING FUNCTION ................................................................................................... 16
3.2.1. Model specification ...................................................................................................... 16
3.2.2. Model type .................................................................................................................... 19
3.2.3. Performance ................................................................................................................. 21
3.2.4. Uncertainty .................................................................................................................. 22
3.2.5. Use of mapping algorithms from the literature .............................................................. 23
4. CONCLUSIONS ....................................................................................................... 23
5. SUMMARY OF RECOMMENDATIONS............................................................... 25
6. REFERENCES .......................................................................................................... 27
TABLES Table 1: Overview of mapping functions.......................................................................................... 17
8
INTRODUCTION AND BACKGROUND 1.1. PURPOSE OF THIS TECHNICAL SUPPORT DOCUMENT The Guide to the Methods of Technology Assessment (Methods Guide) describes key aspects
of analyses submitted to the technology appraisals programme.1 This Technical Support
Document (TSD) is part of a wider initiative to produce a series of TSDs that accompany the
Methods Guide. Each TSD describes how to use analytical techniques recommended in the
Methods Guide, offers suggestions for analyses for areas not currently covered in the
Methods Guide and identifies areas that would benefit from further methodological research.
This TSD is concerned with the Measurement and valuation of health: the use of mapping to
predict health-related utility data. Whilst the TSD looks at mapping health utilities in general,
particular emphasis is placed on mapping to generate utility estimates for use in decision
models in health technology assessment submissions to NICE.
1.2. THE NICE METHODS GUIDE The National Institute for Health and Clinical Excellence (NICE) Methods Guide provides
guidance to researchers and analysts on NICE’s preferred methods for conducting health
technology assessments (HTAs) for its Technology Appraisals Programme.11 NICE’s
preferred framework for economic evaluation is cost-utility analysis with quality adjusted life
years (QALYs) as the main measure of health outcomes. The latest version of the NICE
Methods Guide was updated in 2008 and provided more detailed guidance on the collection
and use of health-related utility data for NICE HTAs than the previous methods guide.
The 2008 Methods Guide states a preference for health-related utility data to be collected
directly from patients using the EQ-5D, a generic and preference-based health-related quality
of life (HRQL) measure. However, the Guide also recognises that such data may not always
be available to analysts formulating health technology assessment (HTA) submissions to
NICE. In these cases, the Guide recommends that consideration is given to ‘mapping’ or
‘cross-walking’ from other HRQL measures to the EQ-5D.
“Data using the EQ-5D instrument may not always be available. When EQ-5D
data are not available, methods can be used to estimate EQ-5D utility data by
mapping (also known as ‘cross-walking’) EQ-5D data from other HRQL
measures included in the relevant clinical trials(s). This can be done if an

9
adequate mapping function can be demonstrated and validated. Mapping should
be based on empirical data and the statistical properties of the mapping function
should be clearly described.
(NICE Guide to the methods of technology appraisal, 2008. Section 5.4.6)
1.3. WHAT IS MAPPING? ‘Mapping’ is the development and use of a model or algorithm to predict utility values using
data on other indicators or measures of health. The data used to predict the health-related
utility values could consist of condition-specific quality of life measures (such as the asthma
quality of life questionnaire 2), other generic quality of life questionnaires (such as the SF-36 3), clinical indicators of disease severity (such as the Canadian Cardiovascular Society Score
for angina4 or the Psoriasis Area and Severity Index5, socio-demographic variables or a
combination of these. Data on the ‘target’ preference-based measure (e.g. EQ-5D) and the
‘source’ predictive measure(s) (the indicators or measures of health that will be used to map
to the preference based measures) must be collected within a sample. From these sample data,
models can be developed to estimate the relationship between the target measure and the
other indicators or measures of health. Where the target measure is a multi-attribute
classification system such as EQ-5D, the data can be mapped to either the index utility value
or the individual dimension responses.
The models can then be applied to data from the clinical trial or other studies containing the
source predictive measure(s) to predict utility values even though the target preference-based
measure was not included in the original study. The predicted utility values can then be
analysed using standard methods for trial-based analyses or summarised for each health state
within an economic model.
In its simplest form, mapping can be considered equivalent to taking the mean value for a
given health state. For example, consider the case of a condition categorised into two health
states: stable disease and progressive disease. If EQ-5D data and the health state category
were collected for a sample of patients, we could estimate the mean EQ-5D value for patients
at each of the two stages of disease. These mean values could then be assigned to patients in a
trial in which the stage of disease is recorded. However, simply using a mean value (and
distribution where reported) for a similar broadly-defined health state from another dataset or
the reported literature can mask variation between patients.

10
Whether the mapping approach will offer an advantage over simply using mean values from
an external dataset will, in part, depend on the structure of the economic model being used to
reflect the decision problem. If the model has a simple structure with few health states, then
reliable estimates of the mean (and variance) of the EQ-5D values associated with those
health states may suffice. However where there are multiple predictors of health status that
can be measured and reflected in the decision-model, then the mapping approach can predict
the health-related utility value more accurately. For example, if the health states in a model
are defined according to a 20-point measure of disease severity, it may not be possible to
obtain EQ-5D values for each of those 20 levels of severity from a sufficient number of
patients. However – providing there is a predictable relationship between the EQ-5D and the
severity measure – the relationship between the measures can be estimated based on all the
data in order to provide EQ-5D estimates for each of the 20 health states. Mapping also
enables the health-related utility data to be linked directly back to data collected within the
clinical trial(s) used to inform the estimates of cost effectiveness.
Mapping is most commonly used in NICE submissions where utility data have not been
directly collected within the clinical trials of the treatments under consideration. However,
mapping techniques can also be used to incorporate utility data collected directly within the
main clinical trial of interest into economic models, where the structure of the model is driven
by other outcome measures. An economic model may have been constructed to define health
states using a clinical measure of disease severity. In this case, mapping techniques can be
used to explain the relationship between the two measures and to estimate the utility value (or
distribution of values) associated with a health state defined by the clinical measure. An
alternative approach would be to simply estimate the mean and variance for each of the
health states described by the model from the data collected. For example, in the case of
treatment for rheumatoid arthritis, the Health Assessment Questionnaire (HAQ)6 is a
commonly used measure of clinical outcomes. Several studies have sought to explain the
relationship between health-related utility and HAQ scores using mapping type methods (see 7 for a recent overview). It is possible to use this approach even when utility data have been
collected directly within the primary source/s for clinical effectiveness, as a means of
incorporating the data within the economic model. However, concerns have been expressed
when EQ-5D data have been used in this manner in one NICE Technology Appraisal. In this
appraisal concerns were expressed by the independent reviewers and Advisory Committee

11
that the estimated mapping function did not accurately reflect the observed data from the trial
when applied to the model (NICE TA198).
This guide focuses solely upon mapping using direct statistical association, and mapping
using “expert opinion” to convert between measures is not recommended for submissions to
NICE technology Appraisals.
1.4. NICE RECOMMENDATIONS ON MAPPING There are various options available to the analyst when considering the use of mapping for
the estimation of health state utilities for HTA. What measures to map to and which measures
to map from? What form should the model underpinning the algorithm take? Which
statistical methods should be employed? How should results be tested, validated and
reported?
In terms of which measure should be used as the outcome of the mapping exercise, the NICE
Methods Guide 2008 states a preference for mapping to the EQ-5D (Guide to methods of
technology appraisal, Section 5.4.6).1 This preference, as with the preference for EQ-5D
generally, is based on a need for consistency across NICE appraisals. The Methods Guide is
not restrictive about the source measures from which the EQ-5D utility data are predicted.
The Guide refers to measures included in the clinical trials, however this is not restrictive and
other types of studies may be more appropriate in some circumstances, for example if the
events of interest are rarely observed within a trial setting.
The Methods Guide also states that mapping should be based on empirical data. This means
that both the EQ-5D and the measure/s used to map from, are administered in a sample of
people to generate empirical data, rather than researchers (or others) attempting to map from
an measure to the EQ-5D based only on judgement or the face value of the measures.
The Guide also states that the adequacy of the mapping function should be demonstrated and
validated, and that the statistical properties of the function should be described (Guide to
methods of technology appraisal, Section 5.4.6).1 However, it is not prescriptive in stating
which statistical or other tests should be undertaken to demonstrate the adequacy and validity
of the resulting algorithm, nor does it stipulate the conditions under which an algorithm has
not been demonstrated as valid.

12
Section 2 summarises the use of mapping in HTAs for NICE to date. Section 3 of this
document draws on the existing literature and experience with the use of mapping to discuss
the various approaches that can be taken and to make recommendations for NICE HTAs
based on the evidence to date. Section 4 summarises the recommendations.
2. USE OF MAPPING IN NICE TECHNOLOGY APPRAISALS The 2008 edition was the first of the NICE Methods Guides to suggest mapping as a potential
solution for an absence of health state utility data. Previous Methods Guides cited a
preference for self-assessment of health status by patients8 and data from validated generic
preference-based measures,9 but did not offer guidance to the analyst on how to conduct cost-
utility analyses if such data had not been collected within clinical studies. Although not
mentioned in the earlier Methods Guides, the use of mapping for NICE HTAs is not new and
several NICE submissions have previously included mapping as a method of estimating
health-related utility values.
Two reviews of the health-related utility data included in NICE Technology Appraisals have
been published.10,11 An early review of independent assessment reports produced for the
Technology Appraisals Programme up to May 2003 by Stein and colleagues found that
mapping approaches had been used in NICE appraisals.12 The review covered 56 appraisals;
28 of which reported 45 cost-utility analyses. The authors report two clear cases of mapping
in appraisals: one where data from the Health Assessment Questionnaire (HAQ) were
mapped onto the EQ-5D in an appraisal of treatments for rheumatoid arthritis and; another
whereby data from the Child Health Assessment Questionnaire (CHAQ) were mapped to the
EQ-5D in an appraisal of etanercept for juvenile idiopathic arthritis. The methods used to
undertake the mapping were reported to be limited or not reported at all. Stein and colleagues
identified a further five appraisals where health states had been mapped to preference-based
questionnaires using opinion rather than empirical data. In two cases the mapping was
conducted on the basis of clinical opinion, in one case it was based on the opinions of the
HTA analysts and no details were provided in the remaining two cases. All but one of the
HTAs mapped health states onto the EQ-5D; the other HTA mapped health states to the
Index of Health-Related Quality of Life (IHQL).

13
Another review of health-related utility data included in NICE submissions has recently been
published.11 This included 46 appraisals conducted from the time of the implementation of
the 2004 Methods Guide up to the time that the current Methods Guide was introduced in
2008. Thirty-nine appraisals included cost-utility analyses; and when including both
independent and sponsor submissions, this accounted for 71 individual cost-utility analyses
submitted to NICE. The review found that the use of mapping had increased since the
previous review to 27% (n=19) of submissions over the period of the review. Empirical data
were used to generate the mapping mechanism in 16 submissions, one was based on expert
opinion and the methods used in the other two submissions were unclear. Six of the
submissions used published mapping algorithms in their analyses, and a further appraisal
used an existing, but unpublished, algorithm. The majority of submissions included analyses
that mapped to the EQ-5D (n=14). Other end-points for the mapping process included the
Health Utilities Index (HUI) (n=2), the SF-6D (n=1) and patients time trade-off values for
their own health (n=2). In most cases health state utility data were mapped from condition-
specific measures (n=14); the remainder mapped from generic HRQL measures (n=2), non-
standardised vignettes of health states (n=1) or the details were unclear (n=2).
A further 44 Technology Appraisals have been published over the two year period since the
publication of the updated NICE Methods Guide in June 2008. These recent appraisals have
been reviewed to assess the use of mapping since the new Methods Guidance was issued
(although it should be recognised that some of the analyses would have been conducted prior
to the publication of the updated Guide). The same methods were used to identify and extract
the data as reported in the previous review.11
Of the 44 appraisals, four included HTAs which used mapping to estimate health-related
utility data. All four of the appraisals based the mapping algorithm on empirical data. They
were based on previously developed mapping algorithms that were publicly available as fully
published studies (n=2), in abstract form (n=1) or from a previous NICE HTA report (n=1).
All four HTAs mapped from a condition-specific measure of either HRQL or disease
severity. Half of these analyses mapped data to EQ-5D utilities and the other half mapped to
patients’ time trade-off values of their own health. The submissions contained little
information about the statistical properties of the mapping algorithms; however they did
provide references to the original documents which described how the algorithms were
developed.

14
It is evident from the reviews of NICE Technology Appraisals that mapping was used to
estimate utilities for NICE HTA submissions prior to being explicitly referred to in the 2008
Methods Guide. The reviews suggest that mapping has been used in submissions from the
very early beginnings of NICE, but has become more common since the publication of the
2004 version of the NICE Methods Guide. An update of the earlier review conducted
specifically for this paper, has found that fewer HTAs used mapping to estimate health-
related utility data since being recognised as a potential ‘second best’ solution in the 2008
Methods Guide. The early review of NICE appraisals found several instances of mapping
based on the opinions of researchers or health care professionals. The later reviews show that
this has become less common, with most recent mapping analyses being based on empirical
data. However, the level of detail with which the mapping algorithms and analyses have been
presented in the documentation has been generally poor, with few details of the statistical
performance of the mapping algorithms being presented to the NICE Technology Appraisal
Committee.
3. HOW TO USE MAPPING IN HEALTH TECHNOLOGY
ASSESSMENT As stated previously, mapping enables data available in the trial(s) (non-preference-based
HRQL measures, preference-based measures, clinical measures, socio-demographic data) to
be used to estimate EQ-5D utility scores. Mapping involves three stages. Firstly a separate
‘estimation’ dataset is required that contains the data that you are mapping from, the ‘source’,
and the ‘target’ preference-based measure. Secondly regression methods are used to ‘map’
this data onto either the index score or the classification system of the target measure. Thirdly
the regression results are applied to the trial(s) or observational study dataset to estimate
utility scores for the target measure at either the mean or observational level. Ideally, a
validation stage should also be applied, whereby the regression results are validated against
another dataset. Each of these stages will be discussed in turn below with reference to
published literature on mapping.
This technical support document focuses upon mapping to EQ-5D, as this is stated as the
preferred measure for NICE Technology Appraisals. However, the approaches described
below could apply to other health-related utility measures.
15
3.1. THE ESTIMATION SAMPLE The generation of the mapping function involves the estimation of the statistical relationship
between the target measure (the EQ-5D) and the predictive measure(s) using an estimation
dataset. The first step in the mapping approach is to obtain the estimation sample. As this
assumes that the statistical relationship is the same across the estimation and trial datasets, the
choice of the ‘estimation sample’ is crucially important.
The estimation sample is the group of people, usually patients, who will complete the EQ-5D
to report their own health and from whom data on the ‘source’ measures will also be
obtained. In order to be confident about the generalisability of the mapping function to the
target sample, the clinical and demographic characteristics of people in the estimation sample
should be as similar to the characteristics of the ‘target’ sample to which the mapping
algorithm will be applied as possible. All covariates used in the mapping function should be
overlapping in distribution for the estimation and target samples. It is recommended that all
variables included within the target source (e.g. the main clinical trial/s used to inform
clinical effectiveness within the economic model) that are thought likely to impact on EQ-5D
values should be included in the estimation sample. If no existing dataset is available that
includes both the source and the EQ-5D it will be necessary to collect the data to estimate the
mapping regression. One study that uses this approach followed the same inclusion and
exclusion criteria for recruiting the estimation sample as the clinical trial which was the target
for the mapping.13 It may also be possible to use an estimation sample including a wider
range of observations, providing that the full range of clinical and demographic
characteristics are captured within the estimation sample (see for example14,15). However, the
ability of the mapping algorithm to predict the utility values of the target population will
depend upon its relevance to that population. For example, there are several papers mapping
the cancer-specific EORTC QLQ-C30 onto EQ-5D for different cancer patient groups. The
mapping regressions differ between the different patient samples used to estimate the
mapping algorithm, and one possible explanation is that the algorithms may not be
generalisable to different cancer conditions.16-19 This is an area that requires further research.
Alternatively ‘double mapping’ has been used in unpublished studies, where it has not been
possible to obtain a dataset that contains both the source and target measures. This involves
one estimation dataset to map from the source to an intermediary measure and a second

16
estimation dataset to map from the intermediary measure onto the target measure. These
estimates should be treated with caution as the process generates intermediary measure
estimates that are then used to generate estimates, meaning that mapping twice is likely to
increase the error and uncertainty around the EQ-5D estimates. If this approach is taken, the
uncertainty should be fully accounted for within the economic analysis.
3.2. THE MAPPING FUNCTION
3.2.1.Model specification
The model specification can take a number of forms depending on which best suits the data
and the decision problem at hand. The independent variable could be the utility index value
or the responses to the EQ-5D dimensions. The explanatory variables should be those which
best predict the EQ-5D values for health states included in the economic analysis. Additive
models are currently most commonly used, however alternative model specifications have
been used in the literature.
A recent review of mapping studies undertook a systematic search of the literature
supplemented by unpublished studies (identified by contacting researchers) in early 2007 and
reports on 30 studies covering 119 mapping models.20 As with the review of NICE
submissions (Section 2) the review of the literature found that the most common target
measure was EQ-5D (15 studies). However, in contrast to the review of NICE submissions in
which the source measures were largely condition-specific, the most commonly used source
measures in the literature were SF-36 (7 studies) and SF-12 (6 studies),. The most common
model specification involved the use of a preference-based index as the dependent variable
and dimension or item scores as independent variables. Papers also examined model
specifications including squared terms and interaction terms to explore possible non linear
relationships between the target and source measures. The review found that these had little
impact, but it is likely that this differs by source and target measures, patient group and
patient severity. The review found that the inclusion of non-health variables such as socio-
demographics made some improvement in the accuracy of the mapping function. Table 1
provides a summary of different model specifications for the mapping function.

17
Table 1: Overview of mapping functions
Dependent variables Independent variables Model selection and specification
Model type Performance Validation
EQ-5D index
EQ-5D dimension levels
Condition specific measure: Overall score, summary scores, item level scores, item level dummies, interaction terms, squared terms, cubic terms
Generic measures: Overall score, summary scores, item level scores, item level dummies, interaction terms, squared terms, cubic terms
Clinical measures: overall score, summary score, categorical dummies
Socio-demographic variables
Other relevant health data
Use prior knowledge of clinical relationships
Use standard statistical techniques to examine the data prior to mapping estimation (e.g. frequency tables and correlations)
Fully describe the dataset used to estimate the regression model including both range of EQ-5D and plots showing EQ-5D distribution
Fully describe the range of EQ-5D predicted values used in the cost-effectiveness model
Linear ordinary least squares (OLS)
Tobit
Censored least absolute deviation (CLAD)
Two part model (TPM)
Generalized linear model (GLM)
Latent class mixture model
Censored mixture model
Multinomial logit model
Goodness of fit: Statistical significance, sign and size of coefficients
R-squared and Adjusted R-squared
Information criterion of AIC and BIC
Further tests of model fit such as Ramsey RESET test, Park test, Jarque-Bera test
Plots to examine whether model assumptions are valid
Predictive ability:
Root mean squared error (RMSE) and mean squared error (MSE)
RMSE, MSE, mean error, mean absolute error by subset of severity range of EQ-5D and/or predictive measure(s)
Plots of observed and predicted EQ-5D scores
Application and assessment of mapping algorithm when applied to a validation sample
Validation sample can be a separate patient sample to the estimation dataset or the dataset used to estimate the mapping function can be randomly separated into estimation and validation samples

18
The recent review of mapping studies found that explanatory power using R-squared was
often low for models that involved mapping a condition-specific measure onto a generic
preference-based measure and errors were often larger than for models mapping a generic
measure onto a generic preference-based measure.20 This may occur due to limited
conceptual overlap as important dimensions in the condition-specific measure may not appear
in the generic measure and vice versa.
The estimation of the mapping regression relies upon statistical dependence between the EQ-
5D and the source measures, and the avoidance of omitted variables. If the source measures
have little conceptual overlap with the dimensions of the EQ-5D the regression model may
suffer from omitted variable bias, have poor explanatory power and large prediction errors.
This can undermine the model and the uncertainty around the predicted values may be
substantial. Where the EQ-5D is shown to not adequately capture the impact of the condition
or treatment, it may be necessary to consider using an alternative approach to utility
estimation (see TSD821 and TSD1122).
The selection of explanatory variables should be based on a combination of judgement based
on prior knowledge of the clinical relationships between variables, and standard statistical
and econometric techniques. Consideration should be given to the variables that are expected
to impact on the health-related utility of people with the condition of interest. This can be
based on patient and clinical opinion obtained directly or reported in the literature. Decision
rules for the inclusion of variables should be specified a priori, such as levels of statistical
significance and the signs of the coefficients matching prior stated beliefs. Correlation
should be used to examine the relationship between source and target measures, and if there
is poor correlation this indicates that the mapping function will perform poorly (see 23 for an
example of this). Akaike’s Information Criterion (AIC)24 and the Bayesian Information
Criterion (BIC)25 can be used to inform the choice of model specification (see for example 7).
Other tests should also be used to enable the researcher to define a robust model, such as
examining the extent to which the model suffers from misspecification (for example Ramsey
RESET test 26), omitted variables and heteroscedasticity (for example the Park test27) or non-
normality in the errors (for example the Jarque-Bera test28 see 29 for an explanation of its
usage in panel data).
The severity of the condition reflected in the source measure should also be captured by the
target measure. If the source measure cannot capture the same health problems captured by

19
the mild, moderate and severe levels of the EQ-5D it will not be able to accurately predict
these levels. The extent to which this is a problem will depend on the severity range of the
target and source measures, and the severity range of the estimation and trial dataset. The
dataset used to estimate the mapping regression should be fully described including both the
range of EQ-5D values and graphical plots showing the distribution of EQ-5D data. The
range of EQ-5D predicted values used in the cost-effectiveness model should also be fully
described to provide information of whether the predicted EQ-5D utilities have involved
extrapolation.
3.2.2.Model type The appropriate model type differs depending on the dataset and how it is applied. It also
depends on whether the aim is to predict the EQ-5D index value or whether it is to predict
responses to each of the five dimensions of health described by the EQ-5D. As specified in
section 1.1.2 the properties of the regression dataset should be clearly outlined. These
properties should then be used to inform model selection and a justification provided
explaining why the selected regression model was chosen.
Mapping to EQ-5D index values
The model type used to map source measures onto EQ-5D should take into account the
distribution of EQ-5D utilities in the estimation dataset. The EQ-5D index has been shown to
exhibit ceiling effects, meaning that typically EQ-5D datasets have a substantial proportion of
people reporting full health with an EQ-5D value at 1. Although the distribution of EQ-5D
index values varies by patient group and study, often a bimodal or trimodal distribution is
observed, with one peak around full health, one peak for moderate states and a further peak
for more severe states. The recent mapping review20 found that the most common estimation
technique was ordinary least squares (OLS), yet linear regressions may not always accurately
predict the EQ-5D distribution for high and low EQ-5D values.15,20
Some of the standard model specifications have been shown to predict fewer values towards
the extremes of the utility scale, even where they are evident in the observed source data.
OLS has been criticized in particular as being inappropriate for regressions mapping onto
EQ-5D due to the bounded nature of the EQ-5D as by definition people cannot have an EQ-
5D utility value higher than 1, which represents ‘full health’. In addition, the standard UK
value set has a lowest possible value of -0.594. The OLS model does not restrict the range of
values and therefore may lead to implausible predicted values outside of the existing range of
EQ-5D values. Researchers have explored alternative types of models to overcome the
20
theoretical limitations of OLS models for the analysis of EQ-5D data, including tobit15,30,31
and CLAD (censored least absolute deviation).15,30-32 The results of this research has been
mixed with some concluding that CLAD provides an improvement in model performance
compared to OLS,15,30,31 others stating that the improvement of CLAD over OLS is small,18
and the review of mapping studies found that the use of tobit and CLAD had little impact.
Most of the models are based on mean values, apart from CLAD which is a median model.
The choice between the use of mean and median values requires normative judgements as
well as statistical considerations. Health state valuation for economic evaluation for decision-
making has been mainly based on mean models to date, however there has been some recent
research utilizing median models.19,33-35
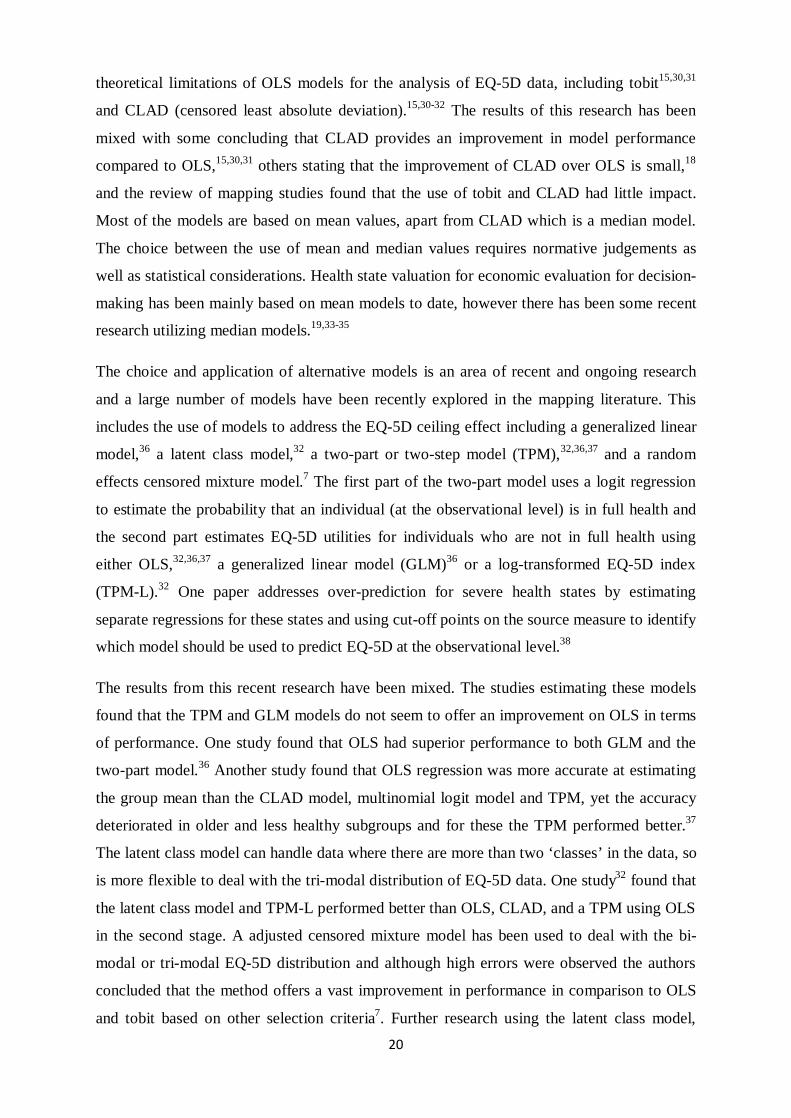
The choice and application of alternative models is an area of recent and ongoing research
and a large number of models have been recently explored in the mapping literature. This
includes the use of models to address the EQ-5D ceiling effect including a generalized linear
model,36 a latent class model,32 a two-part or two-step model (TPM),32,36,37 and a random
effects censored mixture model.7 The first part of the two-part model uses a logit regression
to estimate the probability that an individual (at the observational level) is in full health and
the second part estimates EQ-5D utilities for individuals who are not in full health using
either OLS,32,36,37 a generalized linear model (GLM)36 or a log-transformed EQ-5D index
(TPM-L).32 One paper addresses over-prediction for severe health states by estimating
separate regressions for these states and using cut-off points on the source measure to identify
which model should be used to predict EQ-5D at the observational level.38
The results from this recent research have been mixed. The studies estimating these models
found that the TPM and GLM models do not seem to offer an improvement on OLS in terms
of performance. One study found that OLS had superior performance to both GLM and the
two-part model.36 Another study found that OLS regression was more accurate at estimating
the group mean than the CLAD model, multinomial logit model and TPM, yet the accuracy
deteriorated in older and less healthy subgroups and for these the TPM performed better.37
The latent class model can handle data where there are more than two ‘classes’ in the data, so
is more flexible to deal with the tri-modal distribution of EQ-5D data. One study32 found that
the latent class model and TPM-L performed better than OLS, CLAD, and a TPM using OLS
in the second stage. A adjusted censored mixture model has been used to deal with the bi-
modal or tri-modal EQ-5D distribution and although high errors were observed the authors
concluded that the method offers a vast improvement in performance in comparison to OLS
and tobit based on other selection criteria7. Further research using the latent class model,
21
TPM-L and random effects censored mixture model is encouraged, especially for smaller
patient datasets as existing research has been conducted on relatively large datasets which
may not be typical for the datasets used to estimate mapping functions for NICE
submissions.7,32
Mapping to the EQ-5D dimension responses
Although the health-related utility values produced by the EQ-5D value sets are usually
treated as continuous, in practice they take a limited number of discrete values. An alternative
approach is to map to the descriptive system of the measure, which enables the value set to be
applied separately and therefore may better reflect the distribution of values that would have
been obtained if collected directly. In addition, if analysts are conducting technology
appraisals for agencies in addition to NICE, value sets from other countries can be applied to
the predictions from the mapping exercise. The most commonly used approach to mapping to
the EQ-5D dimensions has been through the use of logistic regression. Some papers reported
using a multinomial logit model to estimate separate mapping functions to predict the level of
each dimension of the target preference-based measure, and then applying the standard
published value sets to obtain utilities.37,39 However papers comparing this approach to other
approaches found that it did not offer an improvement.15,37
3.2.3.Performance
Measures of explanatory power such as R-squared report how well the mapping function
explains the variation in EQ-5D utilities in the estimation dataset. Although this is a useful
indicator of performance it does not show whether the mapping function is equally
appropriate across the entire range of EQ-5D utilities. If the aim of mapping is to estimate
EQ-5D utilities when EQ-5D data are unavailable from the primary source of effectiveness,
the accuracy of predictions is a key aspect of performance. Mean absolute error (mean
absolute difference between estimated and observed EQ-5D utilities) and root mean squared
error both indicate the “error” in the estimates in the dataset used to estimate the regression
and smaller errors are preferred. Whilst these errors are not necessarily representative of the
errors in the estimates when the results are applied in the separate dataset, they can provide
some indication of how large the errors are expected to be.
Some mapping studies have reported under-prediction for very mild EQ-5D utilities and
over-prediction for more severe states,15,40 with better prediction for mild and moderate
states. However in the literature surprisingly few studies report error across subset range,
meaning that the true extent of the problem cannot be determined. Errors should be reported

22
across subsets of the EQ-5D range (e.g. EQ-5D<0, 0≤EQ-5D<0.25, 0.25≤EQ-5D<0.5,
0.5≤EQ-5D<0.75, 0.75≤EQ-5D≤1) and a plot of observed and predicted values should be
used. These are useful for indicating whether there is systematic bias in the predictions and
whether heteroskedasticity is present. If there is systematic bias in the predictions,
consideration will need to be given to how it impacts on the results of the cost-effectiveness
analysis. For example, whether it is likely to be more significant for specific subgroups of
patients or for one intervention compared to another. In addition errors reported across
subsets of the range of the predictive measure(s) (see 7 for example) can inform application of
the mapping algorithm in the trial dataset and reporting this should be considered.
Some studies divide their estimation dataset into two samples; an estimation sample and a
validation sample (for example 40-43). The mapping function is estimated on the estimation
sample and its performance is examined using the validation sample. This has the advantage
that it assesses the mapping function by its prime purpose, however it reduces the sample size
of the estimation sample. A randomly allocated split of the data should enable the analyst to
assess how well the algorithm predicts the health state values for the validation sample. If
predictive ability is poor when assessed based on a non-random split of the data, it may not
be possible for the analyst to judge whether the poor performance is due to the functional
form of the model or a lack of generalisability to a systematically different population. The
reduced precision in the coefficients of the mapping function from the reduction in sample
size may be overcome by re-estimating the mapping model using the full dataset once the
specification of the model has been assessed using the split-sample approach. Furthermore if
the division of the estimation dataset into two is truly random the model is expected to
perform well, yet this does not necessarily indicate that it will perform similarly when applied
to the trial data if the characteristics of the sample are different to the estimation and
validation samples.
3.2.4.Uncertainty
The uncertainty in health-related utility values should be incorporated into economic analyses
as for all other parameters. There are different sources of uncertainty in the values estimated
from mapping analyses. The parameter uncertainty in the estimated regression analysis
should be taken into account using the standard error and correlation in probabilistic
sensitivity analysis. However, where mapping has been used to predict values for a sample of
patients where the data have not been directly collected there is also uncertainty in the
mapped values because they are predicted rather than directly reported. Furthermore, some

23
researchers have shown that the confidence intervals around the predicted values as a result
of mapping tend to be narrower than confidence intervals around directly observed
values.44,45 If there are multiple possible mapping functions, these can be applied in
sensitivity analyses to give an indication of the uncertainty associated with the choice of
algorithm. However alternative algorithms capturing plausible forms of the relationship
between the predicted utility values and alternative explanatory variables may not be
available. Further research is needed to establish the best ways of capturing all of the
uncertainty in the mapped utility estimates. Until then analysts and decision-makers should
be aware that uncertainty around mean mapped estimates may be underestimated.
3.2.5.Use of mapping algorithms from the literature
Generating a de novo mapping function gives the analyst control over the inclusion and
exclusion criteria for their estimation sample, and therefore influence over the generalisability
of their mapping function to their target population. However, existing mapping functions
may be available in the literature to the analyst. In these circumstances we recommend that
careful consideration is given to the generalisability of the mapping function to the target
population, including the range of disease severity over which the function was estimated and
the potential for systematic differences in the populations that could impact on the health
state utility values. Most of the considerations outlined above would also apply to the review
and use of published algorithms. There may be circumstances in which all the variables
included in the published algorithm are not available to the analyst in their dataset. Applying
these algorithms are still theoretically possible by applying mean values to these variables,
however this reduces the granularity in the resulting estimates.
4. CONCLUSIONS The main advantage of mapping is that it enables outcomes data collected in a trial or
observational study to be used in economic evaluation to meet the NICE reference case, even
if the study did not include the EQ-5D. Preferably, EQ-5D data should be collected directly
to reflect the impact of treatment on overall HRQL, rather than just on the variables used to
estimate the mapping algorithm. For example, if the mapping algorithm includes only a
clinical measure, the mapping function may not reflect the impact of other effects of
treatment that are not captured by the clinical measure. In addition, uncertainty and errors
around the estimates can affect the accuracy of the EQ-5D utilities when used in economic
evaluation.46 However, there may be exceptions where other data sources are most

24
appropriate. For example, where the trials are small or do not capture significant numbers of
events that are expected to impact on HRQL.
Mapping to EQ-5D should only be used when EQ-5D is appropriate for that patient group
and condition. All generic measures and EQ-5D in particular may not be appropriate for all
patient groups and conditions, and alternative methods such as the use of condition-specific
preference-based measures may be considered to be more appropriate under these
circumstances. Further guidance on this issue is provided in another Technical Support
Document (see TSD821 and TSD1122).
The review of NICE guidance has shown that there has been a decline in the practice of using
researcher or clinical opinion to map between measures; however the reporting of mapping
studies is still poor in NICE submissions. Most of the mapping studies that have been
included in NICE submissions have mapped from condition-specific measures of quality of
life or clinical indicators of disease severity. The literature search for the recent mapping
review20 demonstrated that there was little published evidence examining the suitability of
mapping in patient datasets. However since that review was conducted, mapping studies
estimated using patient datasets have been increasingly used and published.
We undertook an updated literature search using the same search strategy as the recent review
and found 31 studies meeting the inclusion criteria after an initial title sift. The large number
of studies that are identified signals the recent popularity of mapping and many of these
papers offer methodological developments to approaches undertaken prior to 2007. The
development and use of mapping algorithms for use in HTA is a developing area of
methodological and applied research. Recent developments include approaches such as
mapping between preference-based measures using general population visual analogue scale
values for both measures valued alongside each other.47 Recent developments in associated
areas that may be informative for the mapping literature include mapping between Rasch
scores and utility scores,48 the use of Gaussian processes49 and single equation and two-part
Beta regression models estimated using maximum-likelihood, quasi-likelihood and Bayesian
Markov-chain Monte Carlo methods.50
One study suggests that the performance of different models varies at the overall and
subgroup level,37 two studies found no significant difference between mapped and observed
QALY estimates,18,46 yet one of these studies found that incremental cost per QALY
estimates differed across four interventions using observed and mapped EQ-5D scores.46
Further research is needed examining the performance of mapping functions and estimation
25
techniques across subgroups of patients. Further research needs to compare and develop
different models, develop methods for incorporating error and uncertainty into the mapped
estimates and assess the impact of using mapped estimates rather than observed EQ-5D
values in economic evaluation.
5. SUMMARY OF RECOMMENDATIONS • In most cases, mapping should be considered at best a second-best solution to
directly collected EQ-5D values, as the use of mapping will lead to increased
uncertainty and error around the estimates of health-related utility.
• Mapping should be based on direct statistical association mapping rather than
opinion. This involves two stages: firstly using empirical data regression models are
used to estimate the relationship between ‘target’ EQ-5D utility scores and other
‘source’ indicators or measures of health. These models can be estimated specifically
for the TA or obtained from the mapping literature. Secondly the results of these
models can be applied to patient level or mean level data from the clinical trial(s) or
observation study containing the source predictive measure(s) in order to predict EQ-
5D utility values.
• The characteristics of the estimation sample should be similar to, and overlapping in,
distribution with the target sample for the mapping analysis, and should contain all
variables from the target sample or included in the economic model that are thought to
impact on EQ-5D scores. Under some circumstances, it may be appropriate for the
estimation sample to include a broader range of people, providing that the target
sample is sufficiently represented.
• Standard statistical techniques should be used to examine the data prior to mapping
estimation to inform model selection and specification (for example frequency tables
and correlations). The dataset used to estimate the mapping regression should be fully
described including both the range of EQ-5D values and graphical plots showing the
distribution of EQ-5D data.
• The range of observed EQ-5D values from the source sample and predicted EQ-5D
values used in the cost-effectiveness model should be fully described to provide
26
information of whether the EQ-5D predicted utilities have involved extrapolation,
which should be avoided.
• The appropriate model type differs depending on the dataset and how it is applied.
Standard econometric and statistical techniques and judgement based on prior
knowledge of the clinical relationship between variables should be used to inform
model selection and application (such as statistical significance, sign and size of
coefficients, R-squared and adjusted R-squared, information criterion of AIC and
BIC). The properties of the sample dataset should be used to inform model selection
and a justification should be provided explaining why the selected regression model
was chosen.
• The statistical properties of the mapping algorithms should be clearly described. The
root mean squared error or mean squared error should be reported. Errors should also
be reported across subsets of the EQ-5D range (e.g. EQ-5D<0, 0≤EQ-5D<0.25,
0.25≤EQ-5D<0.5, 0.5≤EQ-5D<0.75, 0.75≤EQ-5D≤1) and a plot of observed and
predicted values should be used.
• Wherever possible the model should be validated. Ideally this would be conducted
using an external sample similar to the target sample. However it is unlikely that this
will be available in many cases. Where the sample size is large enough to do so, it is
recommended that the sample is randomly split to provide an estimation subsample
and validation sample. The final model specification can then be re-estimated using
the full sample.
• If there is no overlap in content between the measures of interest, mapping is unlikely
to be able to appropriately capture the relationship to estimate health-related utility.
Alternative methods for estimating health-related utility data should be considered in
these circumstances.
27
6. REFERENCES
1. National Institute of Health and Clinical Excellence (NICE). Guide to the methods of
technology appraisal. 2008. London, NICE.
2. Juniper, E.F., O'Byrne, P.M., Guyatt, G.H., Ferrie, P.J., King, D.R. Development and
validation of a questionnaire to measure asthma control. European Respiratory Journal
1999; 14(4):902-907.
3. Ware, J.E., Jr., Sherbourne, C.D. The MOS 36-item short-form health survey (SF-36). I.
Conceptual framework and item selection. Medical Care 1992; 30(6):473-483.
4. Campeau, L. Letter: Grading of angina pectoris. Circulation 1976; 54(3):522-523.
5. Fredriksson, T., Pettersson, U. Severe psoriasis--oral therapy with a new retinoid.
Dermatologica 1978; 157(4):238-244.
6. Bruce, B., Fries, J.F. The Health Assessment Questionnaire (HAQ). Clinical and
Experimental Rheumatology 2005; 23(5 Suppl 39):S14-S18.
7. Hernandez Alava, M., Wailoo, A.J., Ara, R. Tails from the Peak District: Adjusted
Censored Mixture Models of EQ-5D Health State Utility Values. HEDS Discussion
Paper Series 10/08; University of Sheffield; 2010.
8. National Institute for Clinical Excellence (NICE). NICE Technology Appraisals: a
guide for manufacturers and sponsors. 2001.
9. National Institute for Clinical Excellence. Guide to the methods of technology
apprasial. 2004. London.
10. Stein, K., Fry, A., Round, A., Milne, R., Brazier, J. What value health? A review of
health state values used in early technology assessments for NICE. Applied Health
Economics and Health Policy. Applied Health Economics and Health Policy 2005;
4(4):219-228.
11. Tosh, J., Longworth, L., George, E. Utility Values in NICE Technology Appraisals.
Value in Health 2010; In print.
12. Stein, K., Fry, A., Round, A., Milne, R., Brazier, J. What value health? A review of
health state values used in early technology assessments for NICE. Applied Health
Economics and Health Policy. Applied Health Economics and Health Policy 2005;
4(4):219-228.
13. Longworth, L., Bryan, S. Estimating utility data from clinical indicators for patients
with stable angina. European Journal of Health Economics 2005; 6(4):347-353.

28
14. Ara, R., Brazier, J. Deriving an algorithm to convert the eight mean SF-36 dimension
scores into a mean EQ-5D preference-based score from published studies (where patient
level data are not available). Value in Health 2008; 11(7):1131-1143.
15. Rowen, D., Brazier, J., Roberts, J. Mapping SF-36 onto the EQ-5D index: how reliable
is the relationship? Health & Quality of Life Outcomes 2009; 7:27.
16. Crott, R., Briggs, A. Mapping the QLQ-C30 quality of life cancer questionnaire to EQ-
5D patient preferences. European Journal of Health Economics 2010; 11(4):427-434.
17. Kontodimopoulos, N., Aletras, V.H., Paliouras, D., Niakas, D. Mapping the cancer-
specific EORTC QLQ-C30 to the preference-based EQ-5D, SF-6D, and 15D
instruments. Value in Health 2009; 12(8):November-December.
18. McKenzie, L., van der Pol, M. Mapping the EORTC QLQ C-30 onto the EQ-5D
instrument: the potential to estimate QALYs without generic preference data. Value in
Health 2009; 12(1):167-171.
19. Wu, E.Q., Mulani, P., Farrell, M.H., Sleep, D. Mapping FACT-P and EORTC QLQ-
C30 to patient health status measured by EQ-5D in metastatic hormone-refractory
prostate cancer patients. Value in Health 2007; 10(5):408-414.
20. Brazier, J.E., Yang, Y., Tsuchiya, A., Rowen, D.L. A review of studies mapping (or
cross walking) non-preference based measures of health to generic preference-based
measures. European Journal of Health Economics 2010; 11(2):215-225.
21. Brazier, J.E., Longworth, L. NICE DSU Technical Support Document 8: An
introduction to the measurement and valuation of health for NICE submissions. 2011;
available from http://www.nicedsu.org.uk
22. Brazier, J.E., Rowen, D. NICE DSU Technical Support Document 11: Alternatives to
EQ-5D for generating health state utility values. 2011; available from
http://www.nicedsu.org.uk
23. Bosch, J.L., Hunink, M.G.M. The relationship between descriptive and valuational
quality-of-life measures in patients with intermittent claudication. Medical Decision
Making 1996; 16:217-225.
24. Akaike, H. Information theory and an extension of the maximum likelihood principle.
In: Petrov B.N., Csaki B.F., eds. Second International Symposium on Information
Theory. Academiai Kiado; Budapest: 1973; 267-281.
25. Schwarz, G. Estimating Dimension of A Model. Annals of Statistics 1978; 6(2):461-
464.
29
26. Ramsey, J. Tests for Specification Errors in Classical Linear Least Squares Regression
Analysis. Journal of the Royal Statistical Society: Series B (Statistical Methodology)
1969; 31(2):350-371.
27. Park, R. Estimation with Heteroscedastic Error Terms. Econometrica 1966; 34(4):888.
28. Jarque, C., Bera, A. A Test for Normality of Observations and Regression Residuals.
International Statistic Review 1987; 55:163-172.
29. Brazier, J., Roberts, J., Deverill, M. The estimation of a preference-based measure of
health from the SF-36. Journal of Health Economics 2002; 21(2):271-292.
30. Sullivan, P.W., Ghushchyan, V. Mapping the EQ-5D index from the SF-12: US general
population preferences in a nationally representative sample. Medical Decision Making
2006; 26(4):401-409.
31. Payakachat, N., Summers, K.H., Pleil, A.M., Murawski, M.M., Thomas III, J.,
Jennings, K. et al. Predicting EQ-5D utility scores from the 25-item National Eye
Institute Vision Function Questionnaire (NEI-VFQ 25) in patients with age-related
macular degeneration. Quality of Life Research 2009; 18(7):801-813.
32. Huang, I.C., Frangakis, C., Atkinson, M.J., Willke, R.J., Leite, W.L., Vogel, W.B. et al.
Addressing ceiling effects in health status measures: A comparison of techniques
applied to measures for people with HIV disease. Health Services Research 2008; 43(1
P1):327-339.
33. Lamers, L.M. The transformation of utilities for health states worse than death:
consequences for the estimation of EQ-5D value sets. Medical Care 2007; 45(3):238-
244.
34. Shaw, J.W., Pickard, A.S., Yager, R.R. Application of directional statistics to health
state valuation: a commentary on Craig and Oppe. Social Science and Medicine 2010;
71(3):429-430.
35. Shaw, J.W., Pickard, A.S., Yu, S., Chen, S., Iannacchione, V.G., Johnson, J.A. et al. A
median model for predicting United States population-based EQ-5D health state
preferences. Value in Health 2010; 13(2):278-288.
36. Dakin, H., Petrou, S., Haggard, M., Benge, S., Williamson, I. Mapping analyses to
estimate health utilities based on responses to the OM8-30 Otitis Media Questionnaire.
Quality of Life Research 2010; 19(1):65-80.
37. Chuang, L.H., Kind, P. Converting the SF-12 into the EQ-5D: an empirical comparison
of methodologies. Pharmacoeconomics 2009; 27(6):491-505.
38. Versteegh, M.M., Rowen, D., Brazier, J., Stolk, E.A. Mapping onto EQ-5D for patients
in poor health. Health & Quality of Life Outcomes 2010; 8(141):1-13.
30
39. Gray, A.M., Rivero-Arias, O., Clarke, P.M. Estimating the association between SF-12
responses and EQ-5D utility values by response mapping. Medical Decision Making
2006; 26(1):18-29.
40. Goldsmith, K.A., Dyer, M.T., Buxton, M.J., Sharples, L.D. Mapping of the EQ-5D
index from clinical outcome measures and demographic variables in patients with
coronary heart disease. Health & Quality of Life Outcomes 2010; 8(1):54.
41. Mortimer, D., Segal, L., Hawthorne, G., Harris, A. Item-based versus subscale-based
mappings from the SF-36 to a preference-based quality of life measure. Value in Health
2007; 10(5):398-407.
42. Lawrence, W.F.F., Fleishman, J.A. Predicting EuroQoL EQ-5D Preference Scores from
the SF-12 Health Survey in a Nationally Representative Sample. Medical Decision
Making 2004; 24(2):160-169.
43. Brazier, J.E., Kolotkin, R.L., Crosby, R.D., Williams, G.R. Estimating a preference-
based single index for the Impact of Weight on Quality of Life-Lite (IWQOL-Lite)
instrument from the SF-6D. Value in Health 2004; 7(4):490-498.
44. Rivero-Arias, O., Ouellet, M., Gray, A., Wolstenholme, J., Rothwell, P.M., Luengo-
Fernandez, R. Mapping the modified rankin scale (mRS) measurement into the generic
EuroQol (EQ-5D) health outcome. Medical Decision Making 2010; 30(3):341.
45. Siani, C., de Peretti, C., Castelli, C., Phung, T., Daures, J.P., Duru, G. Uncertainty
around the mean utility assessment accounting for mapping extrapolation: application to
prostate cancer. Paper presented to the 32nd meeting of the Journées des Économistes de
la Santé Français, 2-3 December 2010, Lyon. 2010; available from www.ces-asso.org
46. Barton, G.R., Sach, T.H., Jenkinson, C., Avery, A.J., Doherty, M., Muir, K.R. et al. Do
estimates of cost-utility based on the EQ-5D differ from those based on the mapping of
utility scores? Health & Quality of Life Outcomes 2008; 6:51.
47. Rowen, D., Brazier, J., Tsuchiya, A., Hernandez Alava, M., Ibbotson, R. The
simultaneous valuation of states from multiple instruments using ranking and VAS:
methods and preliminary results. HEDS Discussion Paper Series; 09/06; University of
Sheffield; 2009.
48. Young, T., Rowen, D., Norquist, J., Brazier, J. Developing preference-based health
measures: using Rasch analysis to generate health state values. Quality of Life Research
2010; 19:907-917.
49. Development of interim value sets for the new 5 level EQ-5D descriptive system. Paper
presented at the 27th plenary meeting of the EuroQol Group; 10 Sep 16; 2010.

31
50. Basu, A., Manca, A. Regression Estimators for Generic Health-Related Quality of Life
and Quality Adjusted Life Years. Medical Decision Making 2012; 32 (1): 56-69.