
NIAD-QE Study Seminar-2019 · 2019-08-19 · Dr. Jagannath Patil, Adviser National Assessment and...
44
Dr. Jagannath Patil, Adviser National Assessment and Accreditation Council (NAAC), Bengaluru Presentation on NAAC’s Revised Accreditation Framework (RAF): A Paradigm Shift NIAD-QE Study Seminar-2019 26 th July, 2019 Tokyo, Japan
Transcript of NIAD-QE Study Seminar-2019 · 2019-08-19 · Dr. Jagannath Patil, Adviser National Assessment and...

Dr. Jagannath Patil, Adviser National Assessment and Accreditation Council (NAAC), Bengaluru
Presentationon
NAAC’s Revised Accreditation Framework (RAF): A Paradigm Shift
NIAD-QE Study Seminar-2019
26th July, 2019Tokyo, Japan
Context: two decades of pioneering experience
Reform Process
Key Features of revised accreditation framework
Quality Indicator Framework
Current and Revised Framework by NAAC
QIF: Criteria, Key Indicators, Metrics & Weightage Chart
RAF – NAAC reforms: Impact and expected outcomes
RAF – Analysis of results of accreditation
RAF – Challenges and Way forward
2

National Assessment and Accreditation Council (NAAC) is premierQuality assurance organization of India which has it’s genesis inrecommendations of National Policy on Education (NPE),1986 andPlan of Action 1992.
Establishment of NAAC in 1994 by University Grants Commission(UGC) under provisions of 12 CCC of UGC Act, 1956.
Autonomous body governed by the Executive Committee and GeneralCouncil,
Also registered as Society in Karnataka having it’s base in Bangalore Core Academic Staff and National pool of Assessors
NAAC for Quality and Excellence
3
To make quality the defining element of
higher education in India through a
combination of self and external
quality evaluation, promotion and
sustenance initiatives.
4
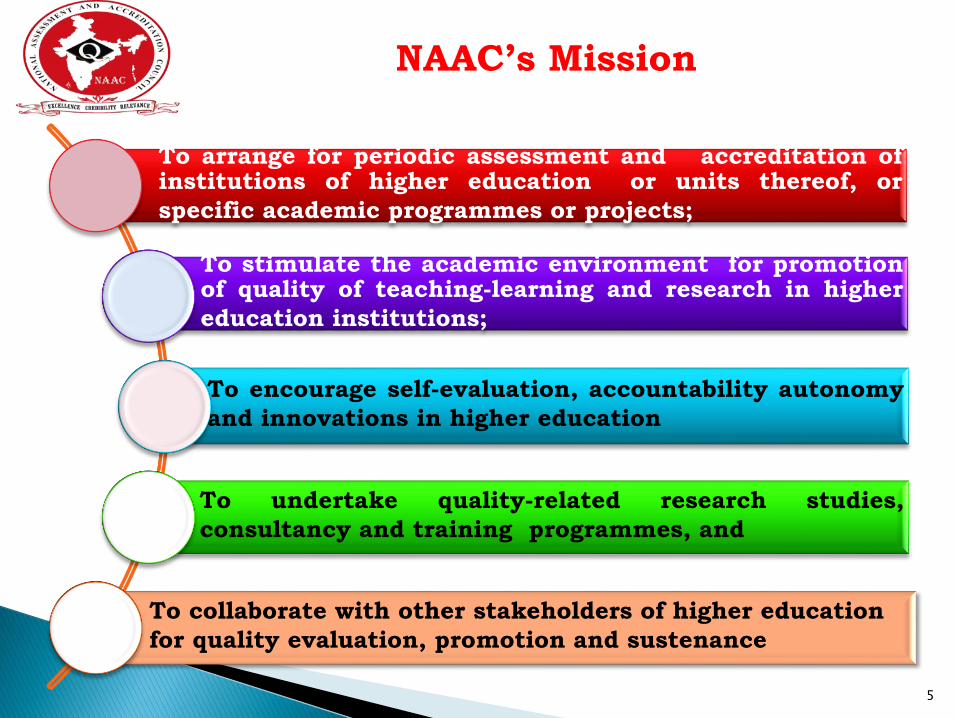
NAAC’s Mission
To arrange for periodic assessment and accreditation ofinstitutions of higher education or units thereof, or
specific academic programmes or projects;
To stimulate the academic environment for promotionof quality of teaching-learning and research in higher
education institutions;
To encourage self-evaluation, accountability autonomy
and innovations in higher education
To undertake quality-related research studies,
consultancy and training programmes, and
To collaborate with other stakeholders of higher education
for quality evaluation, promotion and sustenance
5

Mandatory regime, policy and funding
linkages
12,909 accreditation exercises(594 Universities and 12,315 Colleges),
1600 HEIs accreditedduring the period of 2016-17
7000 IQACs, series of good practices and
quality initiatives
NAAC’s process based on global good practices and norms
6

INQAAHE
CHEA
APQN
APQR
NAAC with
internationa
l networks
NAAC
(Global
partners)
UNESCO
COLEuropean
Commission
CHEA
NAACs Accreditation is recognised globally for admissions, placements
and collaborations
“Bengaluru Statement - 2016 on
Next - Generation Quality Assurance of Higher Education” has
facilitated 18 Global Quality
Assurance partners
Most USA universities recognise NAACs highest
grade 3 year HEI degrees equal to 4 year US degree
for further studies
Prestigious “APQN Quality Award 2017” for International Co-
operation in Quality Assurance
7

1st Cycle 2nd Cycle 3rd Cycle 4th Cycle Total
Universities 353 166 73 2 594
Colleges 7926 3448 920 21 12315
Total8279 3614 993 23 12909
Source: NAAC Statistics Unit, 2019
8

To know its strengths,
weaknesses, and
opportunities through
an informed review
process
Funding agencies look
for accreditation data for
performance funding.
Institutions to initiate
innovative and modern
methods of pedagogy
New sense of direction
and identity.
The society look for
reliable information on
quality education
offered.
Employers look for
reliable information on
the quality of education.
Opportunity to attract
students from within
India and abroad.
9

Revised Accreditation Framework (July 2017) developedin consultation with statutory bodies, experts andStakeholders.
Existing fifty (50) Core and Desirable indictors, aboutTwo Hundred (200) Assessment Indicators and questionsin manual synthesized.
Referencing with National Institutional RankingFramework (NIRF) and International Practices.
Consulted about 200 experts through national meet,workshops and Core Working Group and SectoralWorking Groups meetings.
Conducted a pilot study across the country to test theframework and benchmarks (100 HEIs).
Quality Indicator Framework (QIF) hosted on website andfeedback sought.
Provision of 5% optional/non applicable metrics toaddress diversity issue.
10
A Paradigm shift in approach and philosophy. From qualitative peer judgments to data based
quantitative indicator evaluation. System Generated scores (SGS) with combination of online
evaluation (70%) and peer judgment (30%). Automated Evaluation Model with Increased objectivity &
transparency. Significant difference in evaluation of Universities,
Autonomous Colleges and Affiliated/Constituent Colleges. Introducing key indicators on Alumni engagement and
Student satisfaction survey. Data validation by external professional agencies. Appropriate penalty provisions evolved for institutions
submitting fraudulent data/information/supportingdocuments.
11
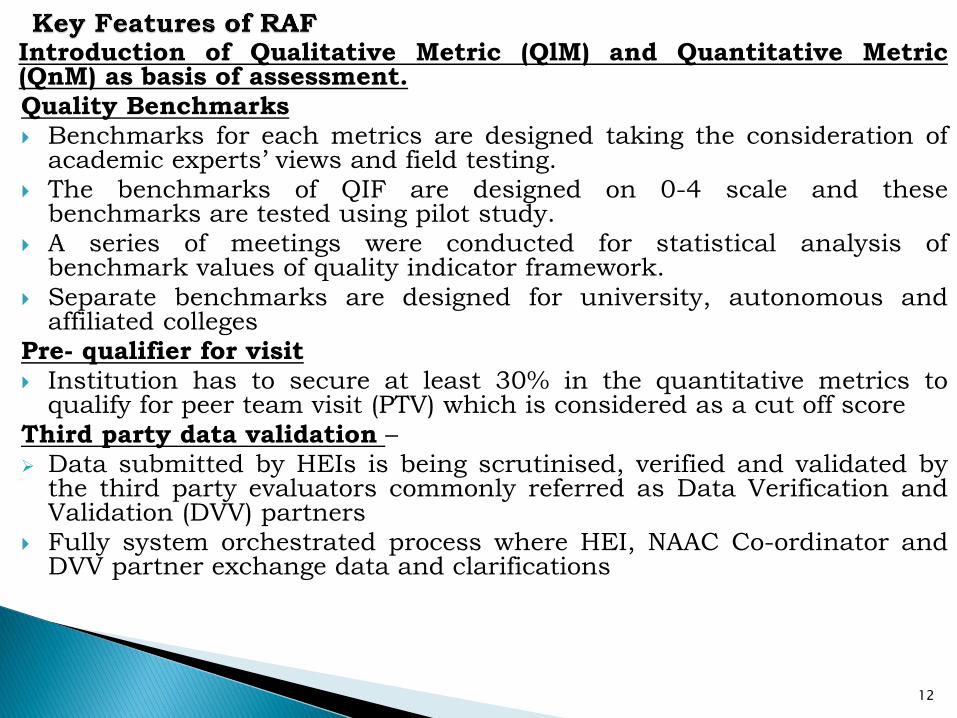
Introduction of Qualitative Metric (QlM) and Quantitative Metric(QnM) as basis of assessment.Quality Benchmarks Benchmarks for each metrics are designed taking the consideration ofacademic experts’ views and field testing.
The benchmarks of QIF are designed on 0-4 scale and thesebenchmarks are tested using pilot study.
A series of meetings were conducted for statistical analysis ofbenchmark values of quality indicator framework.
Separate benchmarks are designed for university, autonomous andaffiliated colleges
Pre- qualifier for visit Institution has to secure at least 30% in the quantitative metrics toqualify for peer team visit (PTV) which is considered as a cut off score
Third party data validation – Data submitted by HEIs is being scrutinised, verified and validated bythe third party evaluators commonly referred as Data Verification andValidation (DVV) partners
Fully system orchestrated process where HEI, NAAC Co-ordinator andDVV partner exchange data and clarifications
12
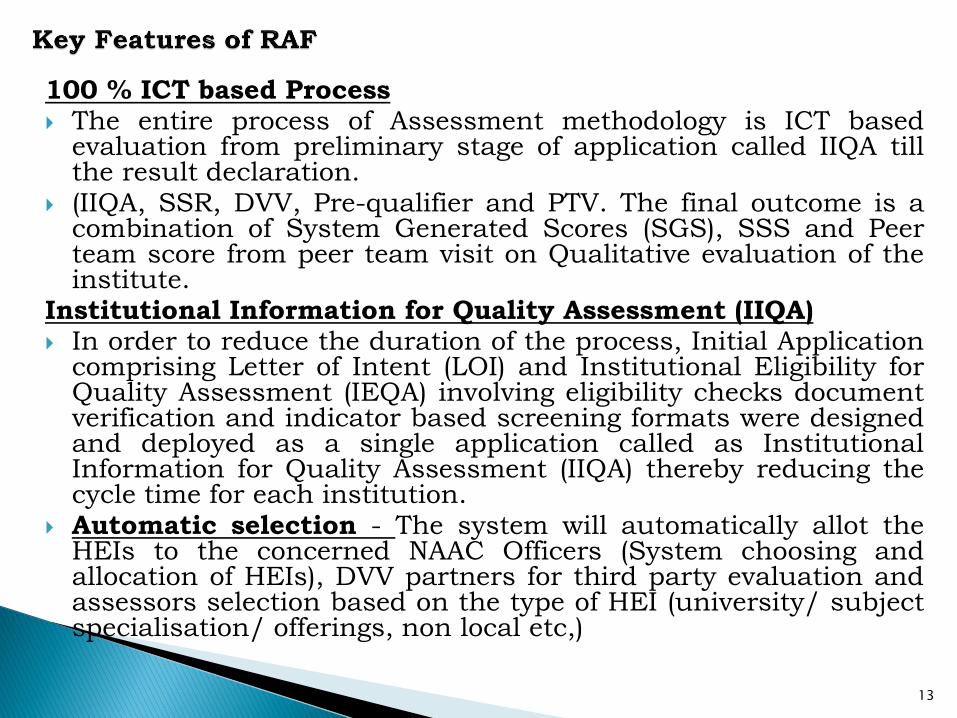
100 % ICT based Process The entire process of Assessment methodology is ICT basedevaluation from preliminary stage of application called IIQA tillthe result declaration.
(IIQA, SSR, DVV, Pre-qualifier and PTV. The final outcome is acombination of System Generated Scores (SGS), SSS and Peerteam score from peer team visit on Qualitative evaluation of theinstitute.
Institutional Information for Quality Assessment (IIQA) In order to reduce the duration of the process, Initial Applicationcomprising Letter of Intent (LOI) and Institutional Eligibility forQuality Assessment (IEQA) involving eligibility checks documentverification and indicator based screening formats were designedand deployed as a single application called as InstitutionalInformation for Quality Assessment (IIQA) thereby reducing thecycle time for each institution.
Automatic selection - The system will automatically allot theHEIs to the concerned NAAC Officers (System choosing andallocation of HEIs), DVV partners for third party evaluation andassessors selection based on the type of HEI (university/ subjectspecialisation/ offerings, non local etc,)
13

Outline of QIF
2.Teaching-Learning and
Evaluation 3.Research, Innovation
and Extension
4.Infrastructure and
Learning Resources
5. Student Support and Progression
6.Governance, Leadership and
Management
7.Institutional Values and
Best Practices
1.Curricular Aspects
14
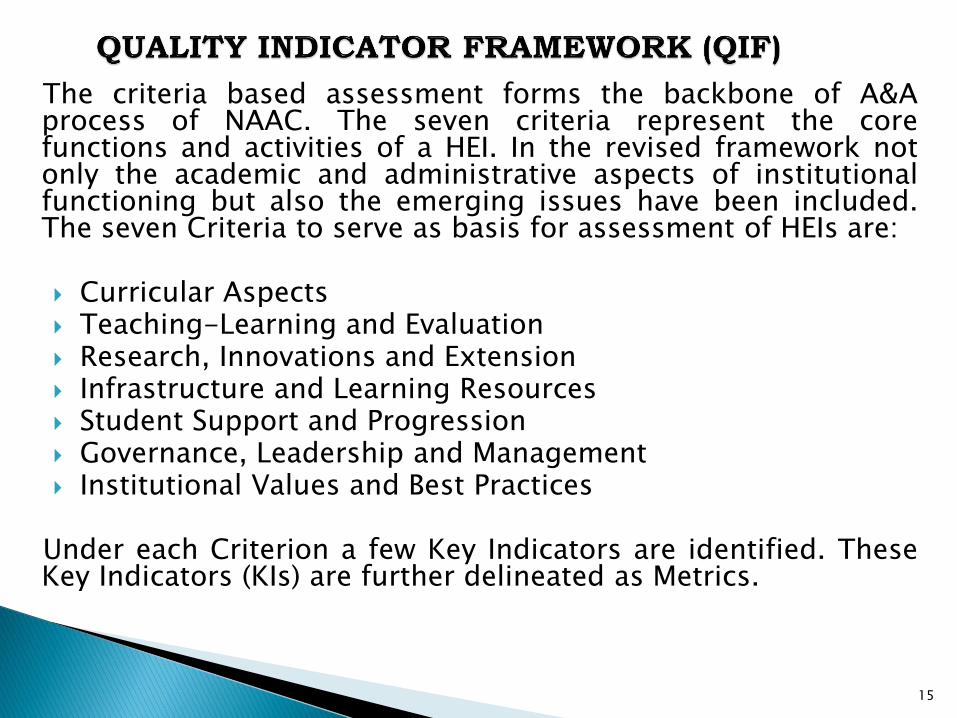
The criteria based assessment forms the backbone of A&Aprocess of NAAC. The seven criteria represent the corefunctions and activities of a HEI. In the revised framework notonly the academic and administrative aspects of institutionalfunctioning but also the emerging issues have been included.The seven Criteria to serve as basis for assessment of HEIs are:
Curricular Aspects Teaching-Learning and Evaluation Research, Innovations and Extension Infrastructure and Learning Resources Student Support and Progression Governance, Leadership and Management Institutional Values and Best Practices
Under each Criterion a few Key Indicators are identified. TheseKey Indicators (KIs) are further delineated as Metrics.
15

Type of HEIs Universities
Autonomous
Colleges
Affiliated
Colleges
Criteria 7 7 7
Key Indicators 34 34 32
Qualitative
Metrics (QlM) 38 38 41
Quantitative
Metrics (QnM) 99 98 80
Total Metrics
(QlM + QnM) 137 136 121
16
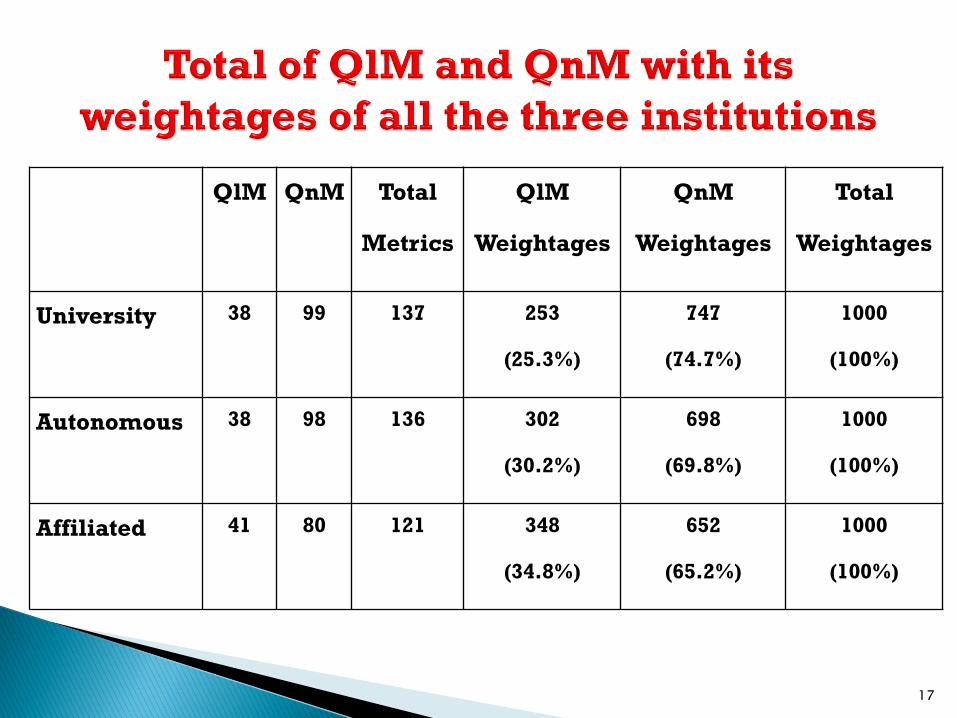
QlM QnM Total
Metrics
QlM
Weightages
QnM
Weightages
Total
Weightages
University 38 99 137 253
(25.3%)
747
(74.7%)
1000
(100%)
Autonomous 38 98 136 302
(30.2%)
698
(69.8%)
1000
(100%)
Affiliated 41 80 121 348
(34.8%)
652
(65.2%)
1000
(100%)
17

74.70%
25.30%
69.80%
30.20%
65.20%
34.80%
0.00%
10.00%
20.00%
30.00%
40.00%
50.00%
60.00%
70.00%
80.00%
18

2.7 - Student satisfaction Survey 30 50 50
3.3 - Innovation Ecosystem 30 20 10
5.4 - Alumni Engagement 10 10 10
7.1 - Institutional Values and Social
Responsibilities 50 50 50
7.2 - Best Practices 30 30 30
7.3 - Institutional Distinctiveness 20 20 20
The highlights of present QIF is as follows:-
19

Criteria Key Indicators Universities Autonomous
Colleges
Affiliated / Constituent
Colleges
1. Curricular
Aspects1.1 *(U)Curriculum Design and Development 50 50 NA
1.1. *(A) Curricular Planning and Implementation NA NA 20
1.2 Academic Flexibility 50 40 30
1.3 Curriculum Enrichment 30 40 30
1.4 Feedback System 20 20 20
Total 150 150 100
2. Teaching-
Learning and
Evaluation
2.1 Student Enrolment and Profile 10 20 30
2.2 Catering to Student Diversity 20 30 50
2.3 Teaching-Learning Process 20 50 50
2.4 Teacher Profile and Quality 50 60 80
2.5 Evaluation Process and Reforms 40 40 50
2.6 Student Performance and Learning Outcomes 30 50 40
2.7 Student satisfaction Survey 30 50 50
Total 200 300 350

Criteria Key Indicators Universities Autonomous
Colleges
Affiliated / Constituent
Colleges
3. Research,
Innovations and
Extension
3.1 Promotion of Research and Facilities20 20 NA
3.2 Resource Mobilization for Research 20 10 10
3.3 Innovation Ecosystem 30 20 10
3.4 Research Publications and Awards 100 20 20
3.5 Consultancy 20 10 NA
3.6 Extension Activities 40 50 60
3.7 Collaboration 20 20 20
Total 250 150 120
4. Infrastructure
and Learning
Resources
4.1 Physical Facilities 30 30 30
4.2 Library as a Learning Resource 20 20 20
4.3 IT Infrastructure 30 30 30
4.4 Maintenance of Campus
Infrastructure
20 20 20
Total 100 100 100
5. Student
Support and
Progression
5.1 Student Support 30 30 50
5.2 Student Progression 40 30 45
5.3 Student Participation and Activities20 30 25
5.4 Alumni Engagement 10 10 10
Total 100 100 130

Criteria Key Indicators Universities Autonomous
Colleges
Affiliated / Constituent
Colleges
6. Governance,
Leadership and
Management
6.1 Institutional Vision and Leadership10 10 10
6.2 Strategy Development and Deployment 10 10 10
6.3 Faculty Empowerment Strategies 30 30 30
6.4 Financial Management and Resource
Mobilization20 20 20
6.5 Internal Quality Assurance System 30 30 30
Total 100 100 100
7. Institutional
Values and Best
Practices
7.1 Institutional Values and Social
Responsibilities 50 50 50
7.2 Best Practices 30 30 30
7.3 Institutional Distinctiveness 20 20 20
Total 100 100 100
22

Qualitative/
Quantitative
Metrics
1.3. Curriculum Enrichment
(30)
Benchmark Values
4 3 2 1 0
1.3.1
QlMInstitution integrates cross cutting issues relevant to
Gender, Environment and Sustainability, Human
Values and Professional Ethics into the Curriculum
(10)
1.3.2
QnMNumber of value-added courses imparting
transferable and life skills offered during the last five
years
(10)
≥AA AA-BB BB-CC DD-CC <DD
1.3.3
QnMPercentage of students enrolled in the courses under
1.3.2 above
(5)
≥AA AA--BB BB-CC DD-CC <DD
1.3.4
QnMPercentage of students undertaking field projects /
internships
(5)
≥AA AA–BB BB–CC DD–CC <DD
Example: Qualitative Metric (QlM) and Quantitative Metric (QnM)
23

Qualitative Metrics (QlM) are benchmark statementsevaluated by peers based on description, data and sitevisits (peer judgement on scale of 0 to 4).
Quantitative Metrics (QnM) are numbers of specificactivities/output/achievement supported withdocumentary evidences. This is evaluated by DataValidation & Verification (DVV) through ICT interface,anonymously.
Based on series of Expert Committee Meetings and Pilotstudies benchmark values for QnM are decided by NAACand integrated into a software.
Software based on predetermined benchmark valuesgives score on 0 to 4.
24

GRADE
OF HEIs
INPUT FROM QUALITATIVE
METRICS USING PEER
JUDGEMENT
(25% to 35%)
INPUT FROM
QUANTITATIVE METRICS
USING COMPUTER
GENERATED SCORE
INCLUDING STUDENT
SATISFCATION SURVEY
(65% to 75%)
25

Range of Institutional
Cumulative Grade Point
Average (CGPA)
Letter Grade Status
3.51-4.00 A++ Accredited
3.26-3.50 A+ Accredited
3.01-3.25 A Accredited
2.76-3.00 B++ Accredited
2.51-2.75 B+ Accredited
2.01-2.50 B Accredited
1.51-2.00 C Accredited
<= 1.50 D Not Accredited
26
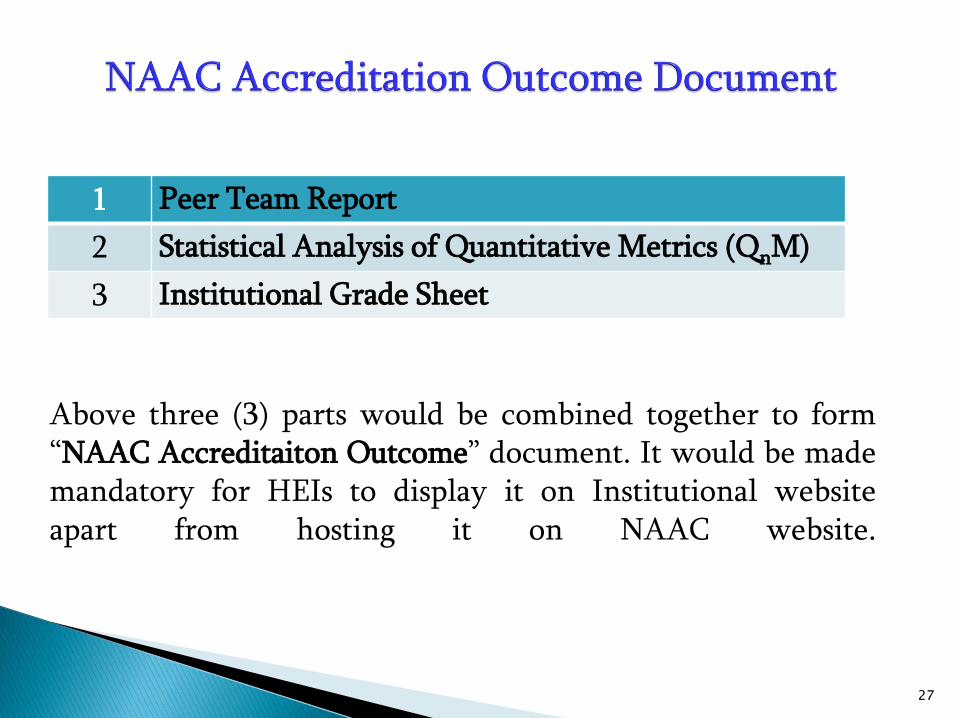
1 Peer Team Report
2 Statistical Analysis of Quantitative Metrics (QnM)
3 Institutional Grade Sheet
Above three (3) parts would be combined together to form“NAAC Accreditaiton Outcome” document. It would be mademandatory for HEIs to display it on Institutional websiteapart from hosting it on NAAC website.
27

Outcome documents: RAF of NAAC has introduction many newconcepts in its process. The final outcome of Assessment andAccreditation exercise brings an outcome document which is based onICT score (combination of evaluation of qualitative and quantitativemetrics). This document comprise of 3 parts
Peer Team Report: This report provides general information for theinstitution and its context along with criterion wise analysis based onpeer evaluation of qualitative indicators, overall analysis onInstitutional Strengths, Weaknesses, Opportunities and Challengesand also recommendations for Quality enhancement of the Institution.
Quality Profile of the Institution: This is a graphical representationreport based on Quantitative Metrics (QnM) which is a SystemGenerated Quality Profile of the HEI based on statistical analysis ofquantitative indicators in the NAAC’s QIF (Quality IndicatorFramework).This graphical presentation of institutional features werereflected through synthesis of quantifiable indicators.
Institutional Grade sheet: This contains the Institutional GradeSheet which is based on qualitative indicators, quantitative indicatorsand student satisfaction survey using existing calculation methodsbut generated through the software.
28

The Quantitative Metrics (QnM) of SSR will be sent for DataValidation and Verification (DVV) Process. After DVV process, a DVVDeviation report will be generated. On the basis of the Deviationreport, the A&A process will proceed further as per the followingconditions:
Institutions whose metrics have deviated by ≤ 10% will proceedfor Peer Team Visit with a condition of a Pre-qualifier, that theinstitution should score at least 30% in Quantitative Metrics(QnM) as per the final score after the DVV Process. If the HEIdoes not clear the Pre-qualifier score then they may apply in anyof the subsequent Windows by submitting the IIQA afresh andwith payment of fees.
29

Institutions will have to submit the entire
database. (At least 50% Student population)
The SSS questionnaire will be mailed to all
students.
Responses should be received from at least 10%
of the student population or 100 in case of
Colleges. (10% or 500 whichever is less in case of
Universities)
If the response rate is lower than the limits, the
metric will not be taken up for evaluation.
Student Satisfaction Survey (SSS) :
30

QIF for Specialised HEIs
NAAC has embarked on mission to addressdifferent categories of institutions by designingseparate methodology to special category of HEIsthrough developing separate quantitative andqualitative metrics for variety of specialised HEIssuch as Yoga, Sanskrit, Open and DistanceLearning (ODL), Health Sciences, TeacherEducation, etc.
Optional Metrics
Besides this, NAAC also introduced optional metrics- the provision to opt out some of the metrics whichmay not be applicable to institutes for variousreasons and essential metrics, provision to HEIs i.e.,mandatory and necessary to attend the essentialmetrics.
31
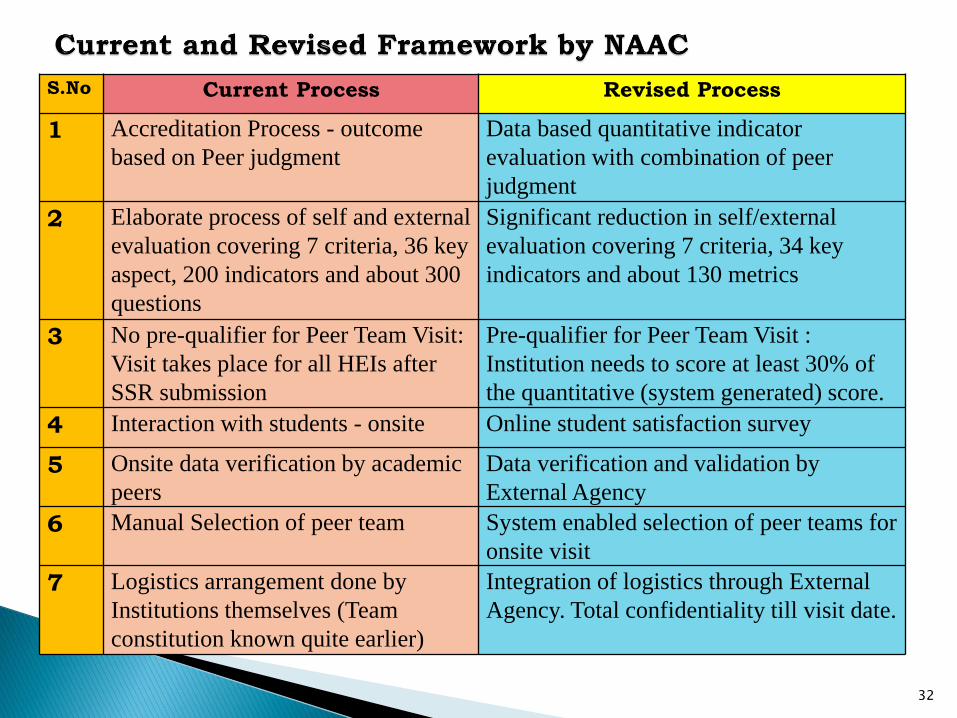
S.No Current Process Revised Process
1 Accreditation Process - outcome
based on Peer judgment
Data based quantitative indicator
evaluation with combination of peer
judgment
2 Elaborate process of self and external
evaluation covering 7 criteria, 36 key
aspect, 200 indicators and about 300
questions
Significant reduction in self/external
evaluation covering 7 criteria, 34 key
indicators and about 130 metrics
3 No pre-qualifier for Peer Team Visit:
Visit takes place for all HEIs after
SSR submission
Pre-qualifier for Peer Team Visit :
Institution needs to score at least 30% of
the quantitative (system generated) score.
4 Interaction with students - onsite Online student satisfaction survey
5 Onsite data verification by academic
peers
Data verification and validation by
External Agency
6 Manual Selection of peer team System enabled selection of peer teams for
onsite visit
7 Logistics arrangement done by
Institutions themselves (Team
constitution known quite earlier)
Integration of logistics through External
Agency. Total confidentiality till visit date.
32

Stakeholders’ Satisfaction
Input Process Output
• Students • Curricula• Faculty staff• Non-teaching staff• Facilities & Infrastructure• Teaching resources
• Teaching & Learning • Staff development• Student support & evaluation• Research• Administration
• Skilled and employable graduates • Research publications & output• Contribution to community
33

Out of total 121 Metrics
30 – Input based Metrics
53 – Process based Metrics
38 – Output based Metrics
34

Reducing the subjectivity due to variance in peerteam assessment.
Inculcation of competitive spirit by providingQuantitative benchmarks as basis of assessment.
Improvement of data management practices in HEIs.
Increased use of ICT in Teaching, Learning andGovernance for quality improvement.
Integrating the stakeholders involvement and feedback in quality improvement. (Key Indicators likeFeedback System, Student Satisfaction Survey,Alumni Engagement)
35
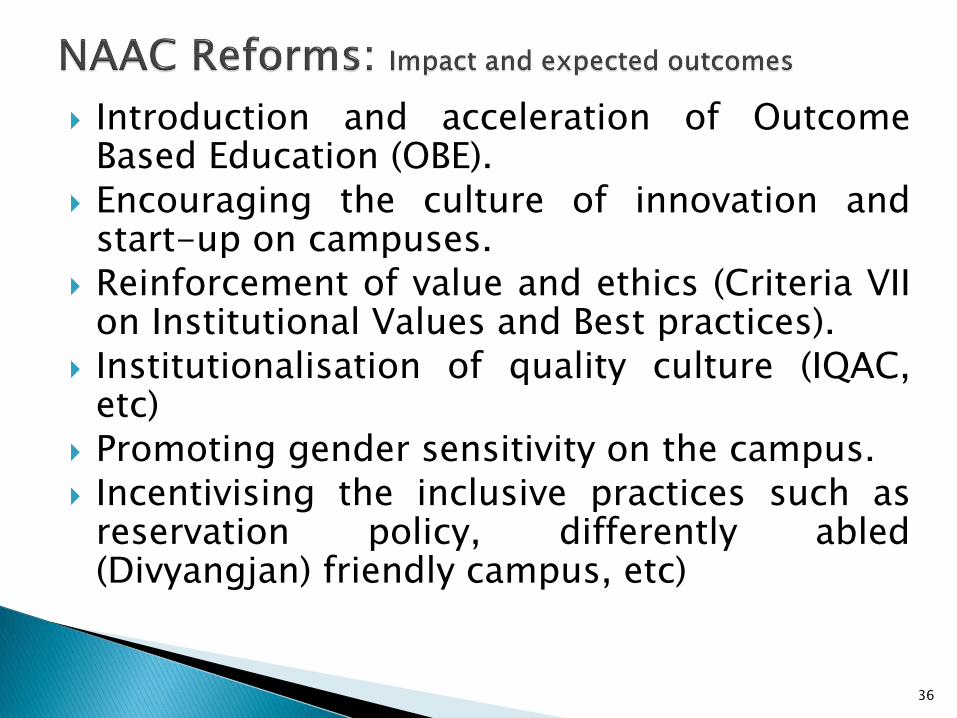
Introduction and acceleration of OutcomeBased Education (OBE).
Encouraging the culture of innovation andstart-up on campuses.
Reinforcement of value and ethics (Criteria VIIon Institutional Values and Best practices).
Institutionalisation of quality culture (IQAC,etc)
Promoting gender sensitivity on the campus. Incentivising the inclusive practices such as
reservation policy, differently abled(Divyangjan) friendly campus, etc)
36
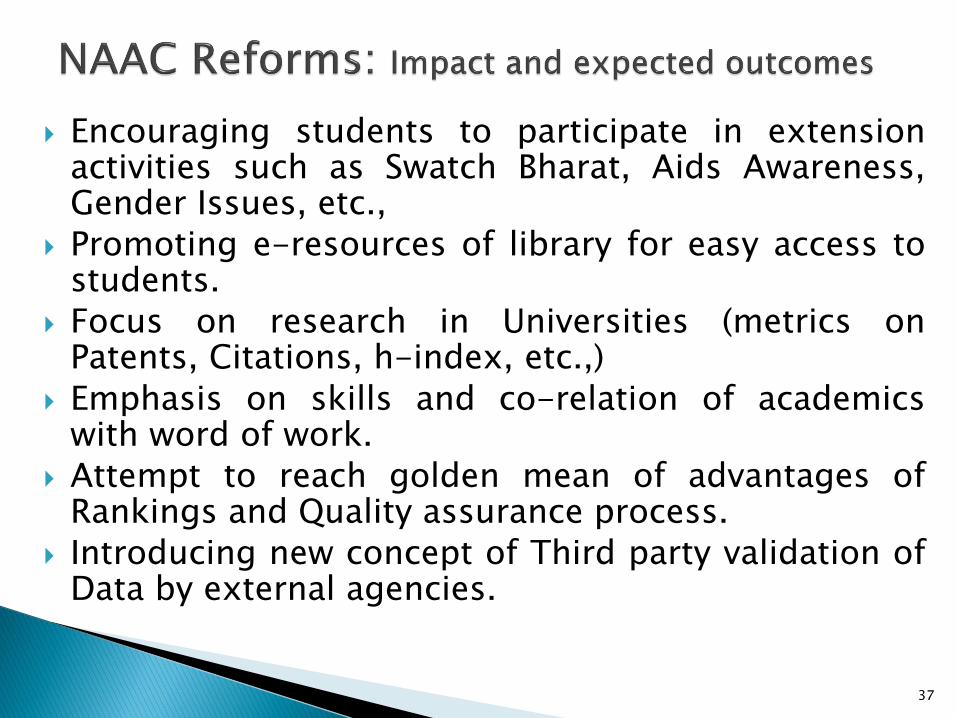
Encouraging students to participate in extensionactivities such as Swatch Bharat, Aids Awareness,Gender Issues, etc.,
Promoting e-resources of library for easy access tostudents.
Focus on research in Universities (metrics onPatents, Citations, h-index, etc.,)
Emphasis on skills and co-relation of academicswith word of work.
Attempt to reach golden mean of advantages ofRankings and Quality assurance process.
Introducing new concept of Third party validation ofData by external agencies.
37
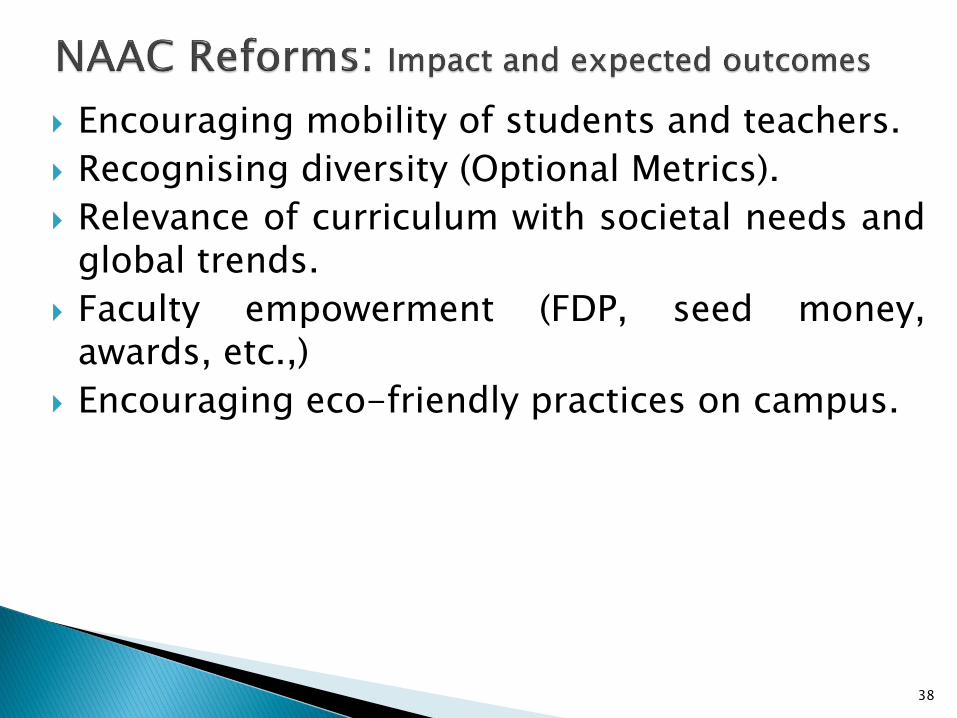
Encouraging mobility of students and teachers.
Recognising diversity (Optional Metrics).
Relevance of curriculum with societal needs andglobal trends.
Faculty empowerment (FDP, seed money,awards, etc.,)
Encouraging eco-friendly practices on campus.
38
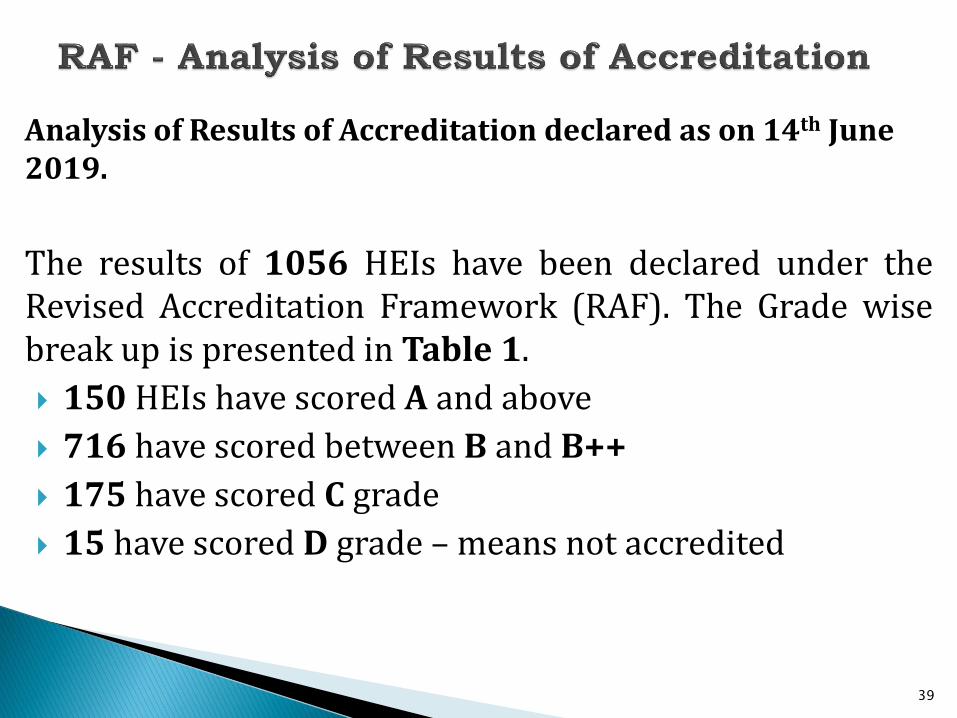
Analysis of Results of Accreditation declared as on 14th June 2019.
The results of 1056 HEIs have been declared under theRevised Accreditation Framework (RAF). The Grade wisebreak up is presented in Table 1.
150 HEIs have scored A and above
716 have scored between B and B++
175 have scored C grade
15 have scored D grade – means not accredited
39
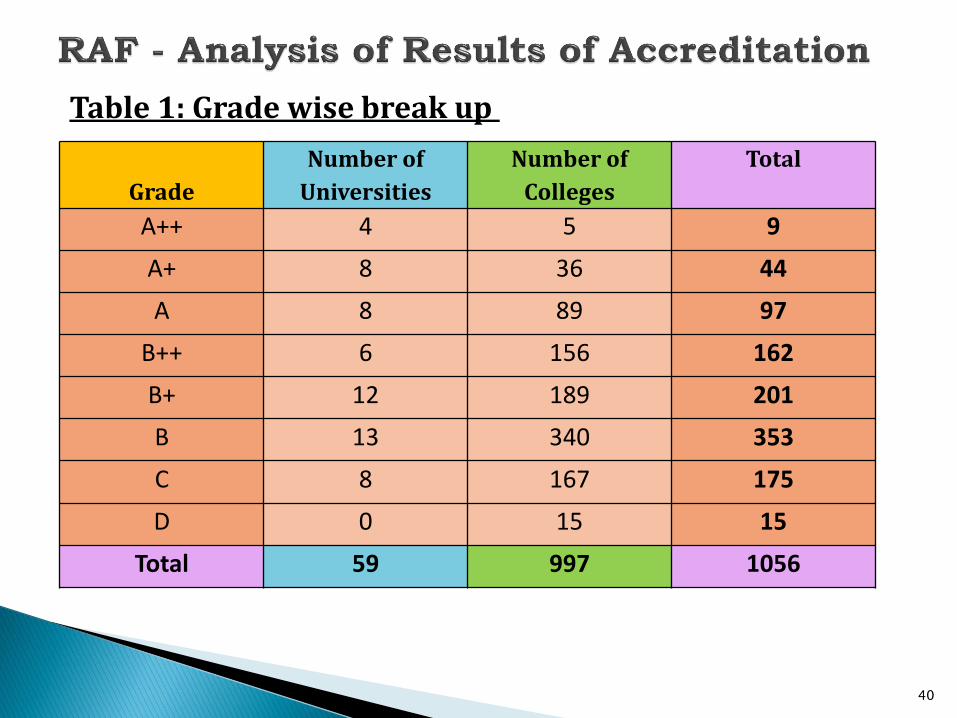
Grade
Number of
Universities
Number of
Colleges
Total
A++ 4 5 9
A+ 8 36 44
A 8 89 97
B++ 6 156 162
B+ 12 189 201
B 13 340 353
C 8 167 175
D 0 15 15
Total 59 997 1056
40
Table 1: Grade wise break up
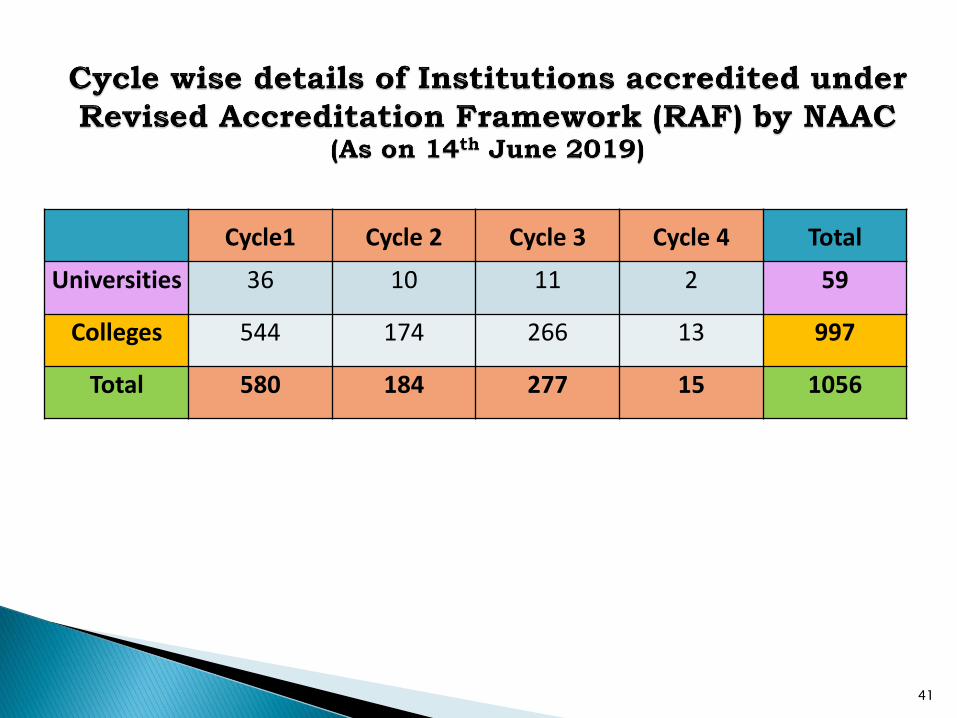
Cycle1 Cycle 2 Cycle 3 Cycle 4 Total
Universities 36 10 11 2 59
Colleges 544 174 266 13 997
Total 580 184 277 15 1056
41
Right step in the new era of technology driven mode ofassessment.
Possibilities of Integrating RAF work with India-EuropeBenchmarking Project on selected European and IndianUniversities on “Enhancing Quality AssuranceManagement and Benchmarking strategies in IndianUniversities” (EQUAM-BI).
Novel experiment of integration of Student SatisfactionSurvey (SSS) into formal A&A process can be emulated byother agencies.
Raising bar of Indian HEIs through competitivebenchmarks using quantitative metrics.
Experience by NAAC in use of ICT based data drivenassessment and accreditation and combination ofQualitative Metric (QlM) & Quantitative Metric (QnM) forassessment: A good practices worth adoption.
42

43

*This RAF is outcome of collective efforts of Core Working Group (CWG), Sectoral Working Groups
[SWGs] , NAAC Colleagues and authorities. Author was convener of CWG.
*Dr. Jagannath PatilAdviser, NAAC Past President, Asia Pacific Quality Network (APQN) and The International Network
for Quality Assurance Agencies in Higher Education (INQAAHE),
Founder Chairperson, Asia-Pacific Quality Register (APQR)
44


![ACHC ACCREDITATION STANDARDS ACHC ACCREDITATION GUIDE …€¦ · ACHC ACCREDITATION STANDARDS ACHC ACCREDITATION . GUIDE TO SUCCESS WORKBOOK [ HOME HEALTH ] ÍÍÜÏÎÓÞËÞÓÙØ](https://static.fdocuments.in/doc/165x107/5eac162a083b4c0f86673c3a/achc-accreditation-standards-achc-accreditation-guide-achc-accreditation-standards.jpg)