NI Wireless Test System Specifications
50
SPECIFICATIONS Cobham Wireless Test System Multi-Port Full Duplex RF Communications Test Set This document lists specifications for the Wireless Test System (WTS), NI-MCT001. The WTS is a communications test set with full duplex RF ports capable of both receiving and generating signals. You can use each RF port with integrated signal analyzer and signal generator components, which have up to 200 MHz of instantaneous bandwidth. The number of available signal analyzers and signal generators depends on the selected system model. Table 1. WTS Models WTS Model Part Number Signal Analyzers/Signal Generators Oscillator Number of Ports WTS-01 28541/416 1 signal analyzer/ 1 signal generator TCXO 8 WTS-02 28541/417 2 signal analyzers/ 2 signal generators TCXO 8 WTS-03 28541/418 2 signal analyzers/ 2 signal generators OCXO 8 WTS-04 28541/419 1 signal analyzer/ 1 signal generator OCXO 8 WTS-05 28541/420 2 signal analyzers/ 2 signal generators OCXO 16 Note Specifications apply to all WTS models in the previous table, unless otherwise noted. Caution The protection provided by this product may be impaired if it is used in a manner not described in this document. This document uses the following terms: • Signal Analyzer (SA) refers to the receive signal paths at the PORT <0..n> front panel connections. • Signal Generator (SG) refers to the transmit signal paths at the PORT <0..n> front panel connections.
Transcript of NI Wireless Test System Specifications
SPECIFICATIONS
Cobham Wireless Test SystemMulti-Port Full Duplex RF Communications Test Set
This document lists specifications for the Wireless Test System (WTS), NI-MCT001. The WTS is a communications test set with full duplex RF ports capable of both receiving and generating signals. You can use each RF port with integrated signal analyzer and signal generator components, which have up to 200 MHz of instantaneous bandwidth. The number of available signal analyzers and signal generators depends on the selected system model.
Table 1. WTS Models
WTS Model Part Number Signal Analyzers/SignalGenerators
Oscillator Number of Ports
WTS-01 28541/416 1 signal analyzer/1 signal generator
TCXO 8
WTS-02 28541/417 2 signal analyzers/2 signal generators
TCXO 8
WTS-03 28541/418 2 signal analyzers/2 signal generators
OCXO 8
WTS-04 28541/419 1 signal analyzer/1 signal generator
OCXO 8
WTS-05 28541/420 2 signal analyzers/2 signal generators
OCXO 16
Note Specifications apply to all WTS models in the previous table, unlessotherwise noted.
Caution The protection provided by this product may be impaired if it is used in amanner not described in this document.
This document uses the following terms:• Signal Analyzer (SA) refers to the receive signal paths at the PORT <0..n> front panel
connections.• Signal Generator (SG) refers to the transmit signal paths at the PORT <0..n> front panel
connections.

Specifications are warranted by design and under the following conditions, unless otherwisenoted:• 30 minutes warm-up time• Calibration cycle maintained• Chassis fan speed set to High
Specifications assume the WTS is configured to use the internal Reference Clock source,unless otherwise noted.
Note Within the specifications, self-calibration °C refers to the temperature of thelast successful self-calibration of the signal analyzer or signal generator connected tothe port in use.
Specifications describe the warranted, traceable product performance over ambienttemperature ranges of 0 °C to 50 °C, unless otherwise noted.
Typical values describe useful product performance beyond specifications that are not coveredby warranty and do not include guardbands for measurement uncertainty or drift. Typicalvalues may not be verified on all units shipped from the factory. Unless otherwise noted,typical values cover the expected performance of units over ambient temperature ranges of23 °C ± 5 °C with a 90% confidence level, based on measurements taken during developmentor production.
2σ specifications describe the 95th percentile values in which 95% of the cases are met with a95% confidence for any ambient temperature of 23 °C ± 5 °C
Nominal values (or supplemental information) describe additional information about theproduct that may be useful, including expected performance that is not covered underSpecifications or Typical values. Nominal values are not covered by warranty.
Specifications are subject to change without notice. For the most recent WTS specifications,visit ni.com/manuals.
ContentsElectromagnetic Compatibility Guidelines...............................................................................4Frequency..................................................................................................................................4
Frequency Settling Time................................................................................................... 5Internal Frequency Reference........................................................................................... 5Frequency Reference Input (REF IN)...............................................................................5Frequency Reference/Sample Clock Output (REF OUT).................................................5Spectral Purity...................................................................................................................6
Channel and Port Configuration............................................................................................... 6Signal Analyzer.........................................................................................................................7
Signal Analyzer Ports........................................................................................................7Amplitude Range.............................................................................................................. 7Amplitude Settling Time...................................................................................................7Absolute Amplitude Accuracy..........................................................................................8
2 | WTS Specifications

Frequency Response......................................................................................................... 8Average Noise Density....................................................................................................11Spurious Responses.........................................................................................................11LO Residual Power......................................................................................................... 11Residual Sideband Image................................................................................................13
Signal Generator..................................................................................................................... 15Signal Generator Ports.................................................................................................... 15Power Range................................................................................................................... 15Amplitude Settling Time.................................................................................................15Output Power Level Accuracy........................................................................................15Frequency Response....................................................................................................... 17Output Noise Density......................................................................................................20Spurious Responses.........................................................................................................20Third-Order Output Intermodulation.............................................................................. 21P1 dB...............................................................................................................................21LO Residual Power......................................................................................................... 22Residual Sideband Image................................................................................................24
Application-Specific Modulation Quality...............................................................................26WLAN 802.11ac............................................................................................................. 26WLAN 802.11n...............................................................................................................29WLAN 802.11a/g............................................................................................................ 30WLAN 802.11b/g-DSSS.................................................................................................33Bluetooth (1.0, 2.0, 2.1, 3.0, 4.0, 4.2)............................................................................. 34GSM................................................................................................................................ 34WCDMA.........................................................................................................................35CDMA2K........................................................................................................................36LTE..................................................................................................................................36TD-SCDMA....................................................................................................................37
Baseband Characteristics........................................................................................................ 38Onboard DRAM..............................................................................................................38
Hardware Front Panel............................................................................................................. 38Front Panel Connectors...........................................................................................................39
Ports................................................................................................................................ 39Power Requirements............................................................................................................... 45
AC Input..........................................................................................................................45Calibration...............................................................................................................................45
Two Year Calibration Interval Correction Factors.......................................................... 46Self-Calibration...............................................................................................................46
Physical Dimensions............................................................................................................... 47Environment............................................................................................................................47
Operating Environment...................................................................................................47Storage Environment.......................................................................................................47
Shock and Vibration................................................................................................................48Compliance and Certifications................................................................................................48
Safety.............................................................................................................................. 48Electromagnetic Compatibility....................................................................................... 48CE Compliance .............................................................................................................. 49
WTS Specifications | 3

Online Product Certification........................................................................................... 49Environmental Management........................................................................................... 49
Cobham Wireless Sales Offices...................................................................................... 50
Electromagnetic Compatibility GuidelinesThis product was tested and complies with the regulatory requirements and limits forelectromagnetic compatibility (EMC) stated in the product specifications. These requirementsand limits provide reasonable protection against harmful interference when the product isoperated in the intended operational electromagnetic environment.
This product is intended for use in industrial locations. However, harmful interference mayoccur in some installations, when the product is connected to a peripheral device or test object,or if the product is used in residential or commercial areas. To minimize interference withradio and television reception and prevent unacceptable performance degradation, install anduse this product in strict accordance with the instructions in the product documentation.
Furthermore, any changes or modifications to the product not expressly approved by NationalInstruments could void your authority to operate it under your local regulatory rules.
Caution To ensure the specified EMC performance, operate this product only withshielded cables and accessories.
Caution To ensure the specified EMC performance, the length of any cableconnected to the Monitor, REF IN, REF OUT, CAL OUT, and Port <0..n>connectors must be no longer than 3 m (10 ft).
Caution To ensure the specified EMC performance, the length of any cableconnected to the USB ports must be no longer than 30 m (100 ft).
FrequencyThe following characteristics are common to both signal analyzer and signal generatorsubsystems.
Frequency range 65 MHz to 6 GHz
4 | WTS Specifications

Table 2. Bandwidth
Center Frequency Instantaneous Bandwidth (MHz)
65 MHz to 109 MHz 20
>109 MHz to <200 MHz 40
200 MHz to 6 GHz 200
Tuning resolution 888 nHz
Frequency Settling Time
Table 3. Maximum Frequency Settling Time1
Settling Time Maximum Time (ms)
≤1 × 10⁻⁶ of final frequency 0.95
≤0.1 × 10⁻⁶ of final frequency 1.05
Internal Frequency Reference
Table 4. Internal Frequency Reference
Description TCXO (WTS-01 or WTS-02) OCXO (WTS-03, WTS-04, orWTS-05)
Initial adjustmentaccuracy
1 × 10⁻⁶ ±70 × 10-9
Temperature stability ±1 × 10⁻⁶, maximum ±5 × 10⁻⁹, maximum
Aging ±1 × 10⁻⁶ per year, maximum ±50 × 10-9 per year, maximum
Accuracy Initial adjustment accuracy ± Aging ± Temperature stability
Frequency Reference Input (REF IN)Refer to the REF IN section.
Frequency Reference/Sample Clock Output(REF OUT)Refer to the REF OUT section.
1 This specification includes only frequency settling and excludes any residual amplitude settling.
WTS Specifications | 5

Spectral Purity
Table 5. Single Sideband Phase Noise
Frequency Single Sideband Phase Noise (dBc/Hz), 20 kHz Offset
<3 GHz -99
3 GHz to 4 GHz -93
>4 GHz to 6 GHz -93
Figure 1. Measured Phase Noise at 900 MHz, 2.4 GHz, and 5.8 GHz
–65
–150
–140
–130
–120
–110
–100
–90
–80
–70
Frequency Offset from LO (Hz)
10 M100 1 k 10 k 100 k 1 M
Pha
se N
oise
(dB
c/H
z)
900 MHz
2,400 MHz
5,800 MHz
Channel and Port ConfigurationAll ports can be configured to perform measurement analysis. The software will route the port to a signal analyzer when in use and will terminate the port when not in use. When not in use, the RF port is internally terminated to improve channel-to-channel isolation.
You can configure signal generation for broadcast on up to four channels simultaneously. RF ports <0..3> and <4..7> support broadcast generation. The integrated signal generator(s) can drive each group of four channels, as shown in the following figure.
6 | WTS Specifications

Figure 2. WTS Block Diagram
Signal Analyzer (2)
Signal Generator (2)
Signal Generator (1)
Signal Analyzer (1)Port 0
Port 1
Port 2
Port 3
Port 4
Port 5
Port 6
Port 7
GeneratorPath
AnalyzerPath
Switch/Combiner Interface
(Full Duplex)
Bank A
Bank B
Refer to the NI Wireless Test System Instrument Software User Guide, available at ni.com/manuals, for a block diagram that illustrates the functionality of the WTS.
Signal Analyzer
Signal Analyzer PortsNumber of signal analyzer channel ports 8 or 16
Refer to the Ports section for additional port specifications.
Amplitude RangeAmplitude range Average noise level to +30 dBm (CW RMS)
RF reference level range/resolution ≥60 dB in 1 dB nominal steps
Amplitude Settling Time<0.1 dB of final value2 125 μs, typical
<0.5 dB of final value3, with LO retuned 300 μs
Port settling time4 65 μs, nominal
2 Constant LO frequency, constant RF input signal, varying input reference level.3 LO tuning across harmonic filter bands, constant RF input signal, varying input reference level.4 The settling that occurs when switching from one active port to another active port.
WTS Specifications | 7

Absolute Amplitude Accuracy
Table 6. Signal Analyzer Absolute Amplitude Accuracy
Input FrequencyAbsolute Amplitude Accuracy (±dB),
Self-Calibration °C ± 1 °C
65 MHz to <109 MHz —
≥109 MHz to <1.6 GHz ±0.55, typical
≥1.6 GHz to <4 GHz 0.45, typical
≥4 GHz to <5 GHz 0.65, typical
≥5 GHz to 6 GHz 0.60, typical
Conditions: maximum power level is set from -30 dBm to +30 dBm. For device temperatureoutside this range, there is an expected temperature coefficient of -0.036 dB/°C forfrequencies <4 GHz and -0.055 dB/°C for frequencies ≥4 GHz.
Frequency Response
Table 7. Signal Analyzer Frequency Response (dB) (Amplitude, Equalized)
RF Signal AnalyzerFrequency
Bandwidth (MHz) Self-Calibration °C ± 5 °C
200 MHz to <2.2 GHz 80 0.6
200 1.2
2.2 GHz to 6 GHz 80 0.5
200 0.9
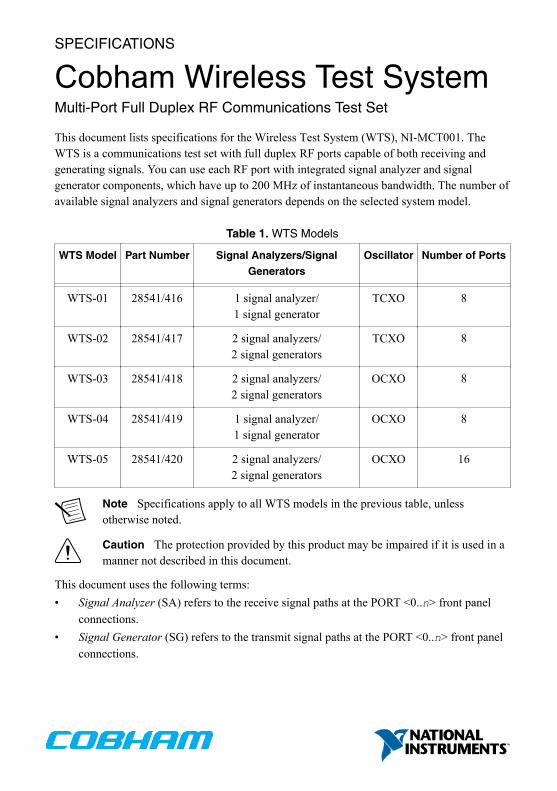
Conditions: maximum power level -30 dBm to +30 dBm. This specification is valid onlywhen the system is operating within the specified ambient temperature range and within thespecified range from the last self-calibration temperature, as measured with the onboardtemperature sensors.
Frequency response represents the relative flatness within a specified instantaneousbandwidth. Frequency response specifications are valid within any given frequency rangeand not the LO frequency itself.
8 | WTS Specifications

Figure 3. Measured 200 MHz Frequency Response, 0 dBm Reference Level,Bank A, Normalized
75.0 50.0 25.0 0.0 25.0 50.0 75.0
Frequency (MHz)
Err
or (
dB)
–0.6
–0.8
–0.4
–0.2
0.0
0.2
0.4
0.6
0.8
100.0–1.0
–100.0
1.0
800 MHz2,400 MHz3,800 MHz5,800 MHz
Figure 4. Measured 200 MHz Frequency Response, 0 dBm Reference Level,Bank B, Normalized
75.0 50.0 25.0 0.0 25.0 50.0 75.0
Frequency (MHz)
Err
or (
dB)
–0.6
–0.8
–0.4
–0.2
0.0
0.2
0.4
0.6
0.8
100.0–1.0
–100.0
1.0
800 MHz2,400 MHz3,800 MHz5,800 MHz
WTS Specifications | 9
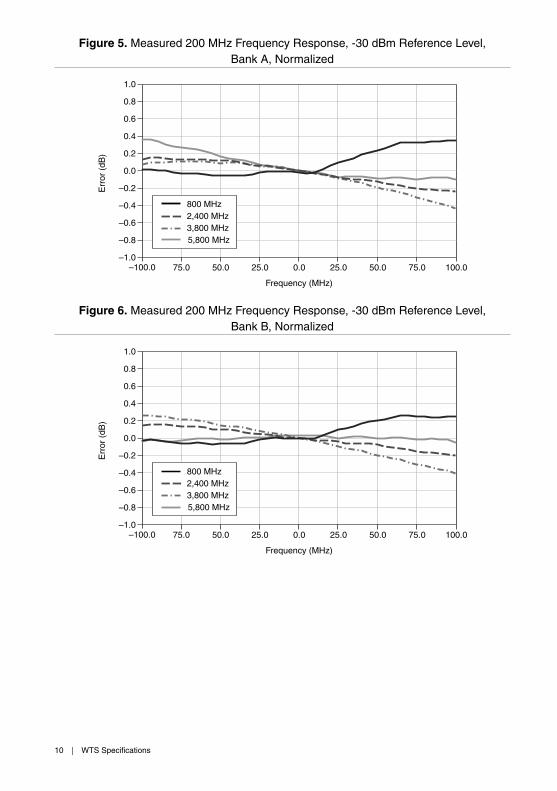
Figure 5. Measured 200 MHz Frequency Response, -30 dBm Reference Level,Bank A, Normalized
75.0 50.0 25.0 0.0 25.0 50.0 75.0 100.0
Frequency (MHz)
Err
or (
dB)
–1.0
–0.6
–0.8
–0.4
–0.2
0.0
0.2
0.4
0.6
0.8
–100.0
1.0
800 MHz2,400 MHz3,800 MHz5,800 MHz
Figure 6. Measured 200 MHz Frequency Response, -30 dBm Reference Level,Bank B, Normalized
75.0 50.0 25.0 0.0 25.0 50.0 75.0
Frequency (MHz)
Err
or (
dB)
–0.6
–0.8
–0.4
–0.2
0.0
0.2
0.4
0.6
0.8
100.0–1.0
–100.0
1.0
800 MHz2,400 MHz3,800 MHz5,800 MHz
10 | WTS Specifications

Average Noise Density
Table 8. Average Noise Density
Center FrequencyAverage Noise Level (dBm/Hz)
-30 dBm Reference Level 0 dBm Reference Level
80 MHz to <2.2 GHz -144 -135
2.2 GHz to <4.2 GHz -141 -134
4.2 GHz to 6 GHz -136 -131
Conditions: input terminated with a 50 Ω load; 10 averages; RMS average noise levelnormalized to a 1 Hz noise bandwidth; noise measured in 1 MHz centered 7.75 MHz fromLO frequency.
Spurious Responses
Nonharmonic Spurs
Table 9. Nonharmonic Spurs (dBc)
Frequency <100 kHz Offset ≥100 kHz Offset >1 MHz Offset
65 MHz to 3 GHz <-55, typical <-60 <-75
>3 GHz to 6 GHz <-55, typical <-55 <-70
Conditions: reference level ≥-30 dBm. Measured with a single tone, -1 dBr, where dBr isreferenced to the configured RF reference level.
LO Residual Power
Table 10. Signal Analyzer LO Residual Power
Center FrequencyLO Residual Power (dBr5)
Self-Calibration °C ± 1 °C Self-Calibration °C ± 5 °C
≤109 MHz -70, typical -67, typical
>109 MHz to 2 GHz -65, typical -61, typical
>2 GHz to 3 GHz -60, typical -58, typical
5 dBr is relative to the full scale of the configured RF reference level.
WTS Specifications | 11

Table 10. Signal Analyzer LO Residual Power (Continued)
Center FrequencyLO Residual Power (dBr5)
Self-Calibration °C ± 1 °C Self-Calibration °C ± 5 °C
>3 GHz to 6 GHz -56, typical -48, typical
Conditions: reference levels -30 dBm to +30 dBm; measured at ADC.
For optimal performance, Cobham recommends running self-calibration when the system temperature drifts ± 5 °C from the temperature at the last self-calibration. For temperature changes >±5 °C from self-calibration, LO residual power is -35 dBr.
Figure 7. Signal Analyzer LO Residual Power6 , Typical
Mea
sure
d R
esid
ual L
O P
ower
(dB
r)
–30
–84
–80
–75
–70
–65
–60
–55
–50
–45
–40
–35
6.0 G0 500 M 1.0 G 1.5 G 2.0 G 2.5 G 3.0 G 3.5 G 4.0 G 4.5 G 5.0 G 5.5 G
Frequency (Hz)
0 dBm Reference Level
–30 dBm Reference Level
5 dBr is relative to the full scale of the configured RF reference level.6 Conditions: Signal analyzer frequency range 109 MHz to 6 GHz. Measurement performed after
self-calibration.
12 | WTS Specifications
Residual Sideband Image
Table 11. Signal Analyzer Residual Sideband Image
Center Frequency Bandwidth (MHz)
Residual Sideband Image (dBc)
Self-Calibration°C ± 1 °C
Self-Calibration°C ± 5 °C
≤109 MHz 20 -60, typical -50, typical
>109 MHz to<200 MHz
80 -50, typical -45, typical
≥200 MHz to500 MHz
200 -50, typical -45, typical
>500 MHz to 3 GHz 200 -75, typical -67, typical
>3 GHz to 6 GHz 200 -70, typical -65, typical
Conditions: reference levels -30 dBm to +30 dBm.
Frequency response specifications are valid within any given frequency range, not the LO frequency itself.
This specification describes the maximum residual sideband image within a 200 MHz bandwidth at a given RF center frequency. Bandwidth is restricted to 20 MHz for LO frequencies ≤ 109 MHz and restricted to 80 MHz for frequencies >109 MHz to 200 MHz.
This specification is valid only when the system is operating within the specified ambient temperature range and within the specified range from the last self-calibration temperature, as measured with the onboard temperature sensors.
For optimal performance, Cobham recommends running self-calibration when the WTS temperature drifts ± 5 °C from the temperature at the last self-calibration. For temperature changes >± 5 °C from self-calibration, residual image suppression is -40 dBc.
WTS Specifications | 13

Figure 8. Signal Analyzer Residual Sideband Image, 0 dBm Reference Level, Typical
Offset Frequency (MHz)
Res
idua
l Sid
eban
d Im
age
(dB
c)
–60
–50
–40
–70
–90
–80
–100 –80 –60 –40 –20 0 20 40 60 80 100 120–100
–120
–30
900 MHz2,400 MHz3,800 MHz5,800 MHz
Figure 9. Signal Analyzer Residual Sideband Image8, -30 dBm Reference Level, Typical
Offset Frequency (MHz)
Res
idua
l Sid
eban
d Im
age
(dB
c)
–60
–50
–40
–70
–90
–80
–100 –80 –60 –40 –20 0 20 40 60 80 100 120–100
–120
–30
900 MHz2,400 MHz3,800 MHz5,800 MHz
7 Measurement performed after self-calibration.8 Measurement performed after self-calibration.
14 | WTS Specifications

Signal Generator
Signal Generator PortsSignal generator ports are designed to broadcast. Any ports that are not configured for outputhave a significantly attenuated output.
Number of signal generator channel ports 8 or 16
Refer to the Ports section for additional port specifications.
Power RangeCW output power range9, 65 MHz to 6 GHzfrequency
Noise floor to +6 dBm, average power
Amplitude Settling Time0.1 dB of final value10 50 μs
0.5 dB of final value11, with LO retuned 300 μs
Output Power Level Accuracy
Table 12. Signal Generator Absolute Amplitude Accuracy
Input Frequency Signal Generator Absolute AmplitudeAccuracy (±dB), Self-Calibration°C ± 1 °C
65 MHz to <109 MHz 0.35, typical
≥109 MHz to <1.6 GHz 0.31, typical
≥1.6 GHz to 4 GHz 0.40, typical
≥4 GHz to 5 GHz 0.50, typical
≥5 GHz to <5.9 GHz 0.35, typical
9 Higher output is uncalibrated and may be compressed.10 Constant LO frequency, varying RF output power range. Power levels ≤ 0 dBm. 175 μs for power
levels > 0 dBm.11 LO tuning across harmonic filter bands.
WTS Specifications | 15

Table 12. Signal Generator Absolute Amplitude Accuracy (Continued)
Input Frequency Signal Generator Absolute AmplitudeAccuracy (±dB), Self-Calibration°C ± 1 °C
≥5.9 GHz to 6 GHz 0.35, typical
Conditions: signal generator power level set from 0 dBm to -70 dBm.
For device temperature outside this range, there is an expected temperature coefficient of-0.036 dB/°C for frequencies <4 GHz, and -0.055 dB/°C for frequencies ≥4 GHz.
Figure 10. Relative Power Accuracy, -45 dBm to -5 dBm, 5 dB Steps, Measured
0.5 1.0 1.5 2.0 2.5 3.0 3.5 4.0 4.5 5.0 5.5 6.0
Frequency (GHz)
Err
or (
dB)
–1.0
–0.6
–0.8
–0.4
–0.2
0.0
0.2
0.4
0.6
0.8
1.0
0.0
Signal generator port-to-port balance ±0.5 dB, ±0.25 dB, typical
16 | WTS Specifications

Figure 11. Intra-Bank Port-to-Port Balance, -10 dB Power Level, Measured
1.0 1.5 2.0 2.5 3.0 3.5 G 4.0 4.5 5.0 5.5
Frequency (GHz)
Err
or (
dB)
–0.6
–0.8
–0.4
–0.2
0.0
0.2
0.4
0.6
0.8
1.0
0.0 6.00.5–1.0
Figure 12. Inter-Bank Port-to-Port Balance, -10 dB Power Level, WTS-01, Measured
0.0 6.0–1.0
–0.6
–0.8
–0.4
–0.2
0.0
0.2
0.4
0.6
0.8
1.0
0.5 1.0 1.5 2.0 2.5 3.0 3.5 4.0 4.5 5.0 5.5
Frequency (GHz)
Err
or (
dB)
Frequency Response
Table 13. Signal Generator Frequency Response (dB) (Amplitude, Equalized)
Output Frequency Bandwidth (MHz) Self-Calibration °C ± 5 °C
200 MHz to <2.2 GHz 80 0.75
200 1.30
WTS Specifications | 17

Table 13. Signal Generator Frequency Response (dB)(Amplitude, Equalized) (Continued)
Output Frequency Bandwidth (MHz) Self-Calibration °C ± 5 °C
2.2 GHz to 6 GHz 80 1.30
200 2.20
Conditions: Signal generator power level 0 dBm to -30 dBm. This specification is valid onlywhen the system is operating within the specified ambient temperature range and within thespecified range from the last self-calibration temperature, as measured with the onboardtemperature sensors.
Frequency response represents the relative flatness within a specified instantaneousbandwidth. Frequency response specifications are valid within any given frequency rangeand not the LO frequency itself.
Figure 13. 200 MHz Frequency Response, 0 dBm Reference Level,Bank A, Normalized, Measured
75.0 50.0 25.0 0.0 25.0 50.0 75.0
Frequency (MHz)
Err
or (
dB)
–0.6
–0.8
–0.4
–0.2
0.0
0.2
0.4
0.6
100.0–1.0
0.8
–100.0
1.0
800 MHz2,400 MHz3,800 MHz5,800 MHz
18 | WTS Specifications

Figure 14. 200 MHz Frequency Response, 0 dBm Reference Level,Bank B, Normalized, Measured
75.0 50.0 25.0 0.0 25.0 50.0 75.0 100.0
Frequency (MHz)
Err
or (
dB)
–1.0
–0.6
–0.8
–0.4
–0.2
0.0
0.2
0.4
0.6
0.8
–100.0
1.0
800 MHz2,400 MHz3,800 MHz5,800 MHz
Figure 15. 200 MHz Frequency Response, -20 dBm Reference Level,Bank A, Normalized, Measured
75.0 50.0 25.0 0.0 25.0 50.0 75.0
Frequency (MHz)
Err
or (
dB)
–0.6
–0.8
–0.4
–0.2
0.0
0.2
0.4
0.6
100.0–1.0
0.8
–100.0
1.0
800 MHz2,400 MHz3,800 MHz5,800 MHz
WTS Specifications | 19

Figure 16. 200 MHz Frequency Response, -20 dBm Reference Level,Bank B, Normalized, Measured
75.0 50.0 25.0 0.0 25.0 50.0 75.0
Frequency (MHz)
Err
or (
dB)
–0.6
–0.8
–0.4
–0.2
0.0
0.2
0.4
0.6
0.8
–1.0100.0–100.0
1.0
800 MHz2,400 MHz3,800 MHz5,800 MHz
Output Noise Density
Table 14. Average Output Noise Level
Center Frequency
Average Output Noise Level (dBm/Hz)
Signal Generator PowerLevel (-10 dBm)
Signal Generator PowerLevel (0 dBm)
250 MHz to <2.2 GHz -147 -143
2.2 GHz to 6 GHz -148 -139
Conditions: averages: 10; baseband signal attenuation: -40 dB; output tone frequency3.75 MHz from LO frequency; noise measured in 1 MHz around 7.75 MHz from LOfrequency.
Spurious Responses
Harmonics
Table 15. Second Harmonic Level (dBc)
Fundamental Frequency Signal Generator Power Level (-10 dBM)
80 MHz to <2.2 GHz -40
2.2 GHz to 6 GHz -28
20 | WTS Specifications

Nonharmonic Spurs
Table 16. Nonharmonic Spurs (dBc)
Frequency Nonharmonic Spurs (dBc)
<100 kHz Offset ≥100 kHz Offset >1 MHz Offset
65 MHz to 3 GHz <-55, typical <-62, typical <-75, typical
>3 GHz to 6 GHz <-55, typical <-57, typical <-70, typical
Conditions: output full scale level ≥-30 dBm; measured with a single tone at -1 dBFS.
Third-Order Output Intermodulation
Table 17. Third-Order Output Intermodulation Distortion (IMD3)
Fundamental Frequency IMD3 (dBc)
-20 dBm Tones 0 dBm Tones
200 MHz to <2.2 GHz -53 -31
2.2 GHz to 6 GHz -43 -23
Conditions: output full scale level ≥-30 dBm; measured with a single tone at -1 dBFS.
P1 dBFigure 17. Measured P1 dB Gain Compression, Typical
7.0
6.0
8.0
9.0
10.0
11.0
12.0
13.0
14.0
0.5 1.0 1.5 2.0 2.5 3.0 3.5 4.0 4.5 5.0 5.5
Frequency (GHz)
Out
put P
ower
at P
1 dB
G
ain
Com
pres
sion
(dB
m)
5.0
15.0
0.0 6.0
WTS Specifications | 21

LO Residual Power
Table 18. Signal Generator LO Residual Power (dBc)
Center Frequency LO Residual Power (dBc)
Self-Calibration °C ± 1 °C Self-Calibration °C ± 5 °C
≤109 MHz -60, typical -49, typical
>109 MHz to 200 MHz -65, typical -50, typical
>200 MHz to 2 GHz -67, typical -60, typical
>2 GHz to 3 GHz -60, typical -53, typical
>3 GHz to 5 GHz -65, typical -58, typical
>5 GHz to 6 GHz -60, typical -55, typical
Conditions: configured power levels -50 dBm to +10 dBm.
This specification is valid only when the system is operating within the specified ambient temperature range and within the specified range from the last self-calibration temperature, as measured with the onboard temperature sensors.
For optimal performance, Cobham recommends running self-calibration when the WTS temperature drifts ± 5 °C from the temperature at the last self-calibration. For temperature changes >± 5 °C from self-calibration, LO residual power is -40 dBc.
22 | WTS Specifications

Figure 18. Signal Generator LO Residual Power12, 109 MHz to 6 GHz, Typical
Mea
sure
d R
esid
ual L
O P
ower
(dB
c)–30
–82
–75
–80
–70
–65
–60
–55
–50
–45
–40
–35
Frequency (Hz)
6.0 G0 500 M 1.0 G 1.5 G 2.0 G 2.5 G 3.0 G 3.5 G 4.0 G 4.5 G 5.0 G 5.5 G
0 dBm Output Power
–30 dBm Output Power
Table 19. Signal Generator LO Residual Power (dBc), Low Power
Center Frequency Self-Calibration °C ± 5 °C
≤109 MHz -49, typical
>109 MHz to 375 MHz -50, typical
>375 MHz to 2 GHz -60, typical
>2 GHz to 3 GHz -53, typical
>3 GHz to 5 GHz -58, typical
12 Measurement performed after self-calibration.
WTS Specifications | 23

Table 19. Signal Generator LO Residual Power (dBc), Low Power (Continued)
Center Frequency Self-Calibration °C ± 5 °C
>5 GHz to 6 GHz -55, typical
Conditions: configured power levels < -50 dBm to -70 dBm.
This specification is valid only when the system is operating within the specified ambient temperature range and within the specified range from the last self-calibration temperature, as measured with the onboard temperature sensors.
For optimal performance, Cobham recommends running self-calibration when the system temperature drifts ± 5 °C from the temperature at the last self-calibration. For temperature changes >± 5 °C from self-calibration, LO residual power is -40 dBc.
Residual Sideband Image
Table 20. Signal Generator Residual Sideband Image
Center Frequency Bandwidth (MHz) Residual Sideband Image (dBc)
Self-Calibration°C ± 1°C
Self-Calibration°C ± 5 °C
≤109 MHz 20 -55, typical -42, typical
>109 MHz to200 MHz
80 -45, typical -40, typical
>200 MHz to500 MHz
200 -45, typical -50, typical
>500 MHz to 2 GHz 200 -70, typical -63, typical
24 | WTS Specifications

Table 20. Signal Generator Residual Sideband Image (Continued)
Center Frequency Bandwidth (MHz) Residual Sideband Image (dBc)
Self-Calibration°C ± 1°C
Self-Calibration°C ± 5 °C
>2 GHz to 6 GHz 200 -65, typical -55, typical
Conditions: reference levels -30 dBm to +30 dBm.
This specification describes the maximum residual sideband image within a 200 MHz bandwidth at a given RF center frequency. Bandwidth is restricted to 20 MHz for LO frequencies ≤109 MHz.
This specification is valid only when the system is operating within the specified ambient temperature range and within the specified range from the last self-calibration temperature, as measured with the onboard temperature sensors.
For optimal performance, Cobham recommends running self-calibration when the system temperature drifts ± 5 °C from the temperature at the last self-calibration. For temperature changes >± 5 °C from self-calibration, residual image suppression is -40 dBc.
Figure 19. Signal Generator Residual Sideband Image,0 dBm Average Output Power, Typical
Offset Frequency (MHz)
Res
idua
l Sid
eban
d Im
age
(dB
c)
–60
–50
–40
–70
–90
–80
–100 –80 –60 –40 –20 0 20 40 60 80 100 120–100
–120
–30
900 MHz2,400 MHz3,800 MHz5,800 MHz
13 Measurement performed after self-calibration.
WTS Specifications | 25

Figure 20. Signal Generator Residual Sideband Image14,-30 dBm Average Output Power, Typical
Offset Frequency (MHz)
Res
idua
l Sid
eban
d Im
age
(dB
c)
–60
–50
–40
–70
–90
–80
–100 –80 –60 –40 –20 0 20 40 60 80 100 120–100
–120
–30
900 MHz2,400 MHz3,800 MHz5,800 MHz
Application-Specific Modulation QualityTypical performance assumes the WTS is operating within ± 5 °C of the previous self-calibration temperature, and that the ambient temperature is 0 °C to 50 °C.
WLAN 802.11ac
Table 21. 802.11ac Signal Generator EVM
Bandwidth (MHz) 802.11ac Signal Generator EVM (dB)
Channel Tracking Disabled Channel Tracking Enabled
80 -36, typical -39, typical
160 -34.5, typical -38.5, typical
Conditions: Port<n> to RF IN of NI 5646R; 5,180 MHz; average power: -36 dBm to-10 dBm; EVM averaged over 50 packets; power averaged over 10 packets; 16 OFDM datasymbols; MCS = 9.
14 Measurement performed after self-calibration.
26 | WTS Specifications

Table 22. 802.11ac Signal Analyzer EVM
Bandwidth (MHz) 802.11ac Signal Analyzer EVM (dB)
Channel Tracking Disabled Channel Tracking Enabled
80 -38, typical -41.5, typical
160 -35, typical -39, typical
Conditions: Port<n> to RF OUT of NI 5646R; 5,180 MHz; average power: -20 dBm to0 dBm; EVM averaged over 50 packets; power averaged over 10 packets; 16 OFDM datasymbols; MCS = 9.
Figure 21. 802.11ac RMS EVM vs. Measured Average Power,80 MHz Bandwidth, Typical
EV
M (
dB)
–10.0
–50.0
–45.0
–40.0
–35.0
–30.0
–25.0
–20.0
–15.0
Measured Average Power (dBm)
–2.5–30.0 –27.5 –25.0 –22.5 –20.0 –17.5 –15.0 –12.5 –10.0 –7.5 –5.0
Generator - 80 MHz BandwidthAnalyzer - 80 MHz Bandwidth
15 Conditions: Generator = Port<n> to RF IN of NI 5646R; analyzer = Port<n> to RF OUT ofNI 5646R; 5,180 MHz; analyzer maximum power 10 dB above generator power level; EVMaveraged over 50 packets; power averaged over 10 packets; 16 OFDM data symbols; MCS = 9.
WTS Specifications | 27

Figure 22. 802.11ac RMS EVM vs. Measured Average Power16,160 MHz Bandwidth, Typical
EV
M (
dB)
–10.0
–50.0
–45.0
–40.0
–35.0
–30.0
–25.0
–20.0
–15.0
Measured Average Power (dBm)
–2.5–30.0 –27.5 –25.0 –22.5 –20.0 –17.5 –15.0 –12.5 –10.0 –7.5 –5.0
Generator - 160 MHz BandwidthAnalyzer - 160 MHz Bandwidth
Figure 23. 802.11ac Spectral Emissions Spectrum and Mask17, Measured
Spe
ctra
l Em
issi
ons
(dB
/Hz)
–90
–145
–140
–135
–130
–125
–120
–115
–110
–105
–100
–95
Frequency (Hz)
5.45 G4.90 G 4.95 G 5.00 G 5.05 G 5.10 G 5.15 G 5.20 G 5.25 G 5.30 G 5.35 G 5.40 G
16 Conditions: Generator = Port<n> to RF IN of NI 5646R; analyzer = Port<n> to RF OUT ofNI 5646R; 5,180 MHz; analyzer maximum power 10 dB above generator power level; EVMaveraged over 50 packets; power averaged over 10 packets; 16 OFDM data symbols; MCS = 9.
17 Conditions: Port<n> to Port<n>; generator average power: -16 dBm; maximum input power:-6 dBm; 160 MHz bandwidth; EVM averaged over 50 packets; power averaged over 10 packets;16 OFDM data symbols; MCS = 9.
28 | WTS Specifications

WLAN 802.11n
Table 23. 802.11n OFDM EVM (rms)
Frequency (MHz) 802.11n OFDM EVM (rms) (dB)
20 MHz Bandwidth 40 MHz Bandwidth
2,412 to 2,484 -48, typical -47, typical
4,915 to 5,825 -42, typical -42, typical
Conditions: Port<n> into NI 5646R; generator average power: -16 dBm; maximum inputpower -6 dBm; 5 packets; MCS = 7.
Figure 24. 802.11n RMS EVM vs. Measured Average Power, Typical
EV
M (
dB)
–50.0
–55.0
–45.0
–40.0
–35.0
–30.0
–25.0
–20.0
–15.0
Measured Average Power (dBm)
–2.5–30.0 –27.5 –25.0 –22.5 –20.0 –17.5 –15.0 –12.5 –10.0 –7.5 –5.0
Generator - 40 MHz BandwidthAnalyzer - 40 MHz BandwidthGenerator - 20 MHz BandwidthAnalyzer - 20 MHz Bandwidth
18 Conditions: Generator = Port<n> to RF IN of NI 5646R; analyzer = Port<n> to RF OUT ofNI 5646R; 2,412 MHz; analyzer maximum power 10 dB above generator power level; EVMaveraged over 50 packets; power averaged over 10 packets; 16 OFDM data symbols; MCS = 7.
WTS Specifications | 29

Figure 25. 802.11n RMS EVM vs. Measured Average Power19,Channel Tracking Enabled, Typical
EV
M (
dB)
–50.0
–55.0
–45.0
–40.0
–35.0
–30.0
–25.0
–20.0
–15.0
Measured Average Power (dBm)
–2.5–30.0 –27.5 –25.0 –22.5 –20.0 –17.5 –15.0 –12.5 –10.0 –7.5 –5.0
Generator - 40 MHz BandwidthAnalyzer - 40 MHz BandwidthGenerator - 20 MHz BandwidthAnalyzer - 20 MHz Bandwidth
WLAN 802.11a/g
Table 24. 802.11a/g OFDM EVM (rms) (dB)
Frequency (MHz) 20 MHz Bandwidth
2,412 to 2,484 -50, typical
4,915 to 5,825 -44, typical
Conditions: Port<n> into NI 5646R; generator average power: -16 dBm; maximum inputpower -6 dBm; 5 packets; data rate = 54 MBps.
Spectrum flatness20
2.4 GHz frequency band 4 dB, typical
5 GHz frequency band 4 dB, typical
19 Conditions: Generator = Port<n> to RF IN of NI 5646R; analyzer = Port<n> to RF OUT ofNI 5646R; 2,412 MHz; analyzer maximum power 10 dB above generator power level; EVMaveraged over 50 packets; power averaged over 10 packets; 16 OFDM data symbols; MCS = 7.
20 Conditions: Port<n> into NI 5646R; generator average power: -16 dBm; maximum input power-6 dBm; 5 packets; data rate = 54 MBps.
30 | WTS Specifications

Figure 26. 802.11a/g RMS EVM vs. Measured Average Power, 2,412 MHz, Typical
EV
M (
dB)
–15.0
–60.0
–55.0
–50.0
–45.0
–40.0
–35.0
–30.0
–25.0
–20.0
Measured Average Power (dBm)
0.0–30.0 –27.5 –25.0 –22.5 –20.0 –17.5 –15.0 –12.5 –10.0 –7.5 –5.0 –2.5
Generator - 20 MHz BandwidthAnalyzer - 20 MHz Bandwidth
21 Conditions: Generator = Port<n> to RF IN of NI 5646R; analyzer = Port<n> to RF OUT ofNI 5646R; 2,412 MHz; analyzer maximum power 10 dB above generator power level; EVMaveraged over 50 packets; power averaged over 10 packets; 16 OFDM data symbols; data rate =54 MBps.
WTS Specifications | 31

Figure 27. 802.11a/g RMS EVM vs. Measured Average Power22, 2,412 MHz, ChannelTracking Enabled, Typical
EV
M (
dB)
–15.0
–60.0
–55.0
–50.0
–45.0
–40.0
–35.0
–30.0
–25.0
–20.0
Measured Average Power (dBm)
0.0–30.0 –27.5 –25.0 –22.5 –20.0 –17.5 –15.0 –12.5 –10.0 –7.5 –5.0 –2.5
Generator - 20 MHz BandwidthAnalyzer - 20 MHz Bandwidth
Figure 28. 802.11a/g RMS EVM vs. Measured Average Power23, 5,810 MHz, Typical
EV
M (
dB)
–15.0
–60.0
–55.0
–50.0
–45.0
–40.0
–35.0
–30.0
–25.0
–20.0
Measured Average Power (dBm)
0.0–30.0 –27.5 –25.0 –22.5 –20.0 –17.5 –15.0 –12.5 –10.0 –7.5 –5.0 –2.5
Generator - 20 MHz BandwidthAnalyzer - 20 MHz Bandwidth
22 Conditions: Generator = Port<n> to RF IN of NI 5646R; analyzer = Port<n> to RF OUT ofNI 5646R; 2,412 MHz; analyzer maximum power 10 dB above generator power level; EVMaveraged over 50 packets; power averaged over 10 packets; 16 OFDM data symbols; data rate =54 MBps.
23 Conditions: Generator = Port<n> to RF IN of NI 5646R; analyzer = Port<n> to RF OUT ofNI 5646R; 5,810 MHz; analyzer maximum power 10 dB above generator power level; EVMaveraged over 50 packets; power averaged over 10 packets; 16 OFDM data symbols; data rate =54 MBps.
32 | WTS Specifications
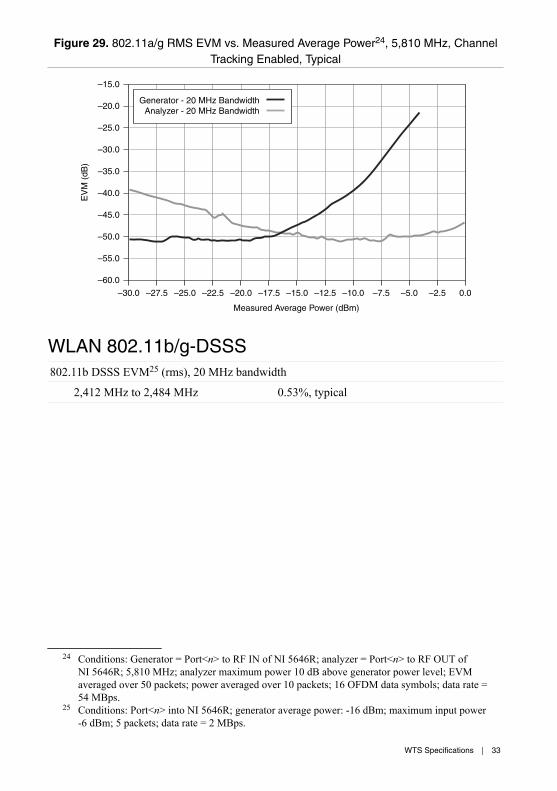
Figure 29. 802.11a/g RMS EVM vs. Measured Average Power24, 5,810 MHz, ChannelTracking Enabled, Typical
EV
M (
dB)
–15.0
–60.0
–55.0
–50.0
–45.0
–40.0
–35.0
–30.0
–25.0
–20.0
Measured Average Power (dBm)
0.0–30.0 –27.5 –25.0 –22.5 –20.0 –17.5 –15.0 –12.5 –10.0 –7.5 –5.0 –2.5
Generator - 20 MHz BandwidthAnalyzer - 20 MHz Bandwidth
WLAN 802.11b/g-DSSS802.11b DSSS EVM25 (rms), 20 MHz bandwidth
2,412 MHz to 2,484 MHz 0.53%, typical
24 Conditions: Generator = Port<n> to RF IN of NI 5646R; analyzer = Port<n> to RF OUT ofNI 5646R; 5,810 MHz; analyzer maximum power 10 dB above generator power level; EVMaveraged over 50 packets; power averaged over 10 packets; 16 OFDM data symbols; data rate =54 MBps.
25 Conditions: Port<n> into NI 5646R; generator average power: -16 dBm; maximum input power-6 dBm; 5 packets; data rate = 2 MBps.
WTS Specifications | 33

Figure 30. 802.11b RMS EVM vs. Measured Average Power, Typical
EV
M (
%)
2.0
0.0
0.2
0.4
0.6
0.8
1.0
1.2
1.4
1.6
1.8
Measured Average Power (dBm)
–30.0 –27.5 –25.0 –22.5 –20.0 –17.5 –15.0 –12.5 –10.0 –7.5 –5.0 –2.5
Generator - 4 MBpsAnalyzer - 4 MBps
Bluetooth27 (1.0, 2.0, 2.1, 3.0, 4.0, 4.2)In-band emissions (adjacent channel) -59 dBc, typical
Average DEVM RMS, enhanced data rate(EDR)
0.4%, typical
Peak DEVM (EDR) 1.2%, typical
GSMPhase error28
Peak phase error (GMSK) 0.70º, typical
RMS phase error (GMSK) 0.25º, typical
26 Conditions: Generator = Port<n> to RF IN of NI 5646R; analyzer = Port<n> to RF OUT ofNI 5646R; 2,412 MHz; analyzer maximum power 10 dB above generator power level; EVMaveraged over 50 packets; power averaged over 5 packets; 16 OFDM data symbols; data rate =2 MBps.
27 Conditions: Port<n> loopback to Port<n>; 3-DH5 packet; 2,400 MHz to 2,483.5 MHz; generatorpower level -12 dBm; analyzer maximum power level -10 dBm.
28 Conditions: Port<n> loopback to Port<n>; 380 MHz to 1.9 GHz; generator power levels -25 dBmto 0 dBm; analyzer maximum power 2 dB above generator power level.
34 | WTS Specifications
EDGE EVM29
EDGE RMS EVM 0.35º, typical
EDGE peak EVM 1.00%, typical
Table 25. GSM Output RF Spectrum (GMSK)
Frequency Residual Relative Power, Dueto Modulation (dB)
Residual Relative Power,Due to Switching (dB)
600 kHz -76, typical -71, typical
1.2 MHz -76, typical -72, typical
1.8 MHz -71, typical -72, typical
Conditions: Port<n> loopback to Port<n>; 380 MHz to 1.9 GHz; generator power levels-20 dBm to 0 dBm; analyzer maximum power 2 dB above generator power level.
Table 26. GSM Output RF Spectrum (8-PSK)
Frequency Residual Relative Power, Dueto Modulation (dB)
Residual Relative Power,Due to Switching (dB)
600 kHz -74, typical -70, typical
1.2 MHz -74, typical -70, typical
1.8 MHz -68, typical -70, typical
Conditions: Port<n> loopback to Port<n>; 380 MHz to 1.9 GHz; generator power levels-20 dBm to 0 dBm; analyzer maximum power 5 dB above generator power level.
WCDMA30
BPSK RMS EVM 0.70%, typical
BPSK maximum EVM 3.00%, typical
BPSK ACLR, 5 MHz offset 60 dB, typical
BPSK SEM worst margin -18 dB, typical
29 Conditions: Port<n> loopback to Port<n>; 380 MHz to 1.9 GHz; generator power levels -30 dBm to-10 dBm; analyzer maximum power 5 dB above generator power level.
30 Conditions: Port<n> loopback to Port<n>; 710 MHz to 3.8 GHz; generator power level -15 dBm;analyzer maximum power 6 dB above generator power level.
WTS Specifications | 35

Figure 31. WCDMA Measured Spectrum31 (ACP)
Pow
er (
dBm
)
–30
–110
–100
–90
–80
–70
–60
–50
–40
Frequency (Hz)
1.813 G1.788 G 1.790 G 1.793 G 1.795 G 1.798 G 1.800 G 1.803 G 1.805 G 1.808 G 1.810 G
CDMA2K32
Average EVM RMS, RC1 1.1%, typical
Table 27. Adjacent Channel Power (ACP)
Frequency Offset (MHz) ACP (dBc)
0.885 60, typical
1.98 61, typical
LTE33
Average composite EVM 0.8%, typical
31 Conditions: Port<n> loopback to Port<n>; BPSK; 30 averages; generator power level -16 dBm;analyzer maximum power level -10 dBm.
32 Conditions: Port<n> loopback to Port<n>; 710 MHz to 3.8 GHz; generator power levels -28 dBmto -5 dBm; analyzer maximum power 7 dB above generator power level.
33 Conditions: Port<n> loopback to Port<n>; 710 MHz to 3.8 GHz; generator power levels -28 dBmto -5 dBm; analyzer maximum power 9 dB above generator power level for TDD; analyzermaximum power 10 dB above generator power level for FDD.
36 | WTS Specifications
Table 28. Adjacent Channel Power (ACP), FDD
Frequency Offset (MHz) ACP (dBc)
7.5 -48.5, typical
10 -47, typical
12.5 -50, typical
Table 29. Adjacent Channel Power (ACP), TDD
Frequency Offset (MHz) ACP (dBc)
5.8 -51, typical
7.4 -52, typical
10 -46, typical
TD-SCDMAAverage EVM RMS34 0.9%, typical
Spectral emission mask worst margin35 -16 dB, typical
Table 30. Adjacent Channel Power (ACP), TDD
Frequency Offset (MHz) ACP (dBc)
1.6 53, typical
3.2 64, typical
4.8 64, typical
6.4 64, typical
8 64, typical
Conditions: Port<n> loopback to Port<n>; 710 MHz to 3.8 GHz; generator power levels-18 dBm to -5 dBm; analyzer maximum power 5 dB above generator power level.
34 Conditions: Port<n> loopback to Port<n>; 710 MHz to 3.8 GHz; generator power levels -28 dBmto -5 dBm; analyzer maximum power 5 dB above generator power level.
35 Conditions: Port<n> loopback to Port<n>; 710 MHz to 3.8 GHz; generator power levels -22 dBmto -5 dBm; analyzer maximum power 5 dB above generator power level.
WTS Specifications | 37

Baseband CharacteristicsAnalog-to-digital converters (ADC)
Resolution 14 bits
Sample rate36 250 MS/s
I/Q data rate37 4 kS/s to 250 MS/s
Digital-to-analog converters (DAC)
Resolution 16 bits
Sample rate38 250 MS/s
I/Q data rate39 4 kS/s to 250 MS/s
Onboard DRAMMemory size 2 banks, 256 MB/bank
Hardware Front Panel
Note The previous illustration is not representative of all WTS models. The frontpanel of your specific model may differ.
36 ADCs are dual-channel components with each channel assigned to I and Q, respectively.37 I/Q data rates lower than 250 MS/s are achieved using fractional decimation.38 DACs are dual-channel components with each channel assigned to I and Q, respectively. DAC
sample rate is internally interpolated to 1 GS/s, automatically configured.39 I/Q data rates lower than 250 MS/s are achieved using fractional interpolation.
38 | WTS Specifications
Table 31. WTS Front Panel Icon Definitions
Refer to the user documentation for required maintenance measures to ensure usersafety and/or preserve the specified EMC performance.
The signal pins of this product's input/output ports can be damaged if subjected toESD. To prevent damage, turn off power to the product before connecting cables andemploy industry-standard ESD prevention measures during installation, maintenance,and operation.
Front Panel Connectors
Ports
Table 32. Port Specifications
Specification Signal AnalyzerOperation
Signal GeneratorOperation
Connectors <0..n> N (female)
Input Impedance 50 Ω, nominal, AC coupled
Output Impedance — 50 Ω, nominal, AC coupled
Input Amplitude +30 dBm, maximum —
Output Amplitude — +18 dBm, maximum
Absolute Maximum Input Power +30 dBm, CW RMS —
Absolute Maximum ReversePower
— +30 dBm, CW RMS
Maximum Safe DC Input Voltage ± 5 VDC, nominal —
Maximum Reverse DC VoltageLevel
— ± 5 V, nominal
WTS Specifications | 39

Signal Analyzer Operation
Signal Analyzer Return Loss (Voltage Standing Wave Ratio (VSWR))
Table 33. Signal Analyzer Return Loss (dB) (VSWR)
Frequency VSWR
109 MHz ≤ f < 2.4 GHz 15.5 (1.40:1), typical
2.4 GHz ≤ f < 4 GHz 12.7 (1.60:1), typical
4 GHz ≤ f < 6 GHz 12.0 (1.67:1)
Return loss for frequencies <109 MHz is typically better than 14 dB (VSWR <1.5:1).
Figure 32. Signal Analyzer Channel Return Loss40, Typical
Ret
urn
Loss
(dB
)
–37.5
–35.0
–30.0
–25.0
–22.5
–20.0
–15.0
–12.5
–32.5
–17.5
–10.0
–40.0
–27.5
Center Frequency (Hz)0.0 500.0 M 1.0 G 1.5 G 2.0 G 2.5 G 3.0 G 3.5 G 4.5 G 6.0 G4.0 G 5.5 G5.0 G
Preamp DisabledPreamp Enabled
40 Signal generator path not generating and in default state.
40 | WTS Specifications

Isolation41
Figure 33. Signal Analyzer Channel-to-Channel and Bank-to-Bank Isolation42, Typical
Center Frequency (Hz)0.0
–100.0
–90.0
–80.0
–70.0
–50.0
–40.0
–30.0
0.0
–10.0
–20.0
–60.0
500.0 M 1.0 G 1.5 G 2.0 G 2.5 G 3.0 G 3.5 G 4.5 G 6.0 G4.0 G
Channel-to-ChannelBank-to-Bank
5.5 G5.0 G
Isol
atio
n (d
B)
Figure 34. Terminated Signal Analyzer Channel-to-Channel Isolation43, Typical
Isol
atio
n (d
B)
–100.0
–95.0
–90.0
–80.0
–70.0
–65.0
–60.0
–50.0
–45.0
–85.0
–55.0
–35.0
–30.0
–40.0
–75.0
Frequency (Hz)0.0 500.0 M 1.0 G 1.5 G 2.0 G 2.5 G 3.0 G 3.5 G 4.5 G 6.0 G4.0 G 5.5 G5.0 G
41 Measured with an aggressor at one analyzer channel and the system configured to acquire fromanother analyzer channel or bank. The isolation measurement results are limited by theinstrumentation used for testing.
42 The aggressor signal analyzer port is not terminated.43 The aggressor signal analyzer port is internally terminated to 50 Ω.
WTS Specifications | 41

Signal Generator Operation
Signal Generator Return Loss (VSWR)
Table 34. Signal Generator Return Loss (dB) (VSWR)
Frequency VSWR
109 MHz ≤ f < 2 GHz 19.0 (1.25:1), typical
2 GHz ≤ f < 5 GHz 14.0 (1.50:1), typical
5 GHz ≤ f < 6 GHz 11.0 (1.78:1)
Return loss for frequencies <109 MHz is typically better than 20 dB (VSWR <1.22:1).
Figure 35. Signal Generator Channel Return Loss44, Typical
Center Frequency (Hz)
Ret
urn
Loss
(dB
)
0.0 500.0 M 1.0 G 1.5 G 2.0 G 2.5 G 3.0 G 3.5 G 4.5 G 6.0 G4.0 G 5.5 G5.0 G–40.0
–37.5
–35.0
–30.0
–25.0
–22.5
–20.0
0.0
–15.0
–12.5
–32.5
–17.5
–27.5
44 Signal generator path not generating and in default state.
42 | WTS Specifications
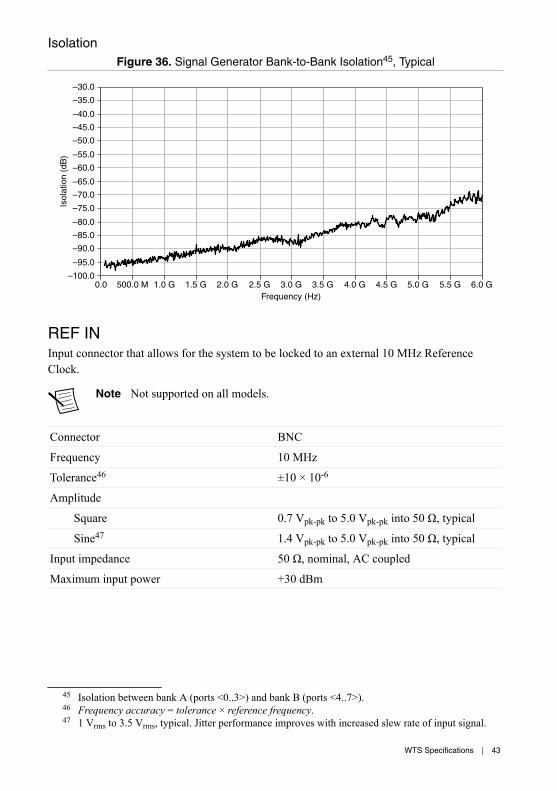
IsolationFigure 36. Signal Generator Bank-to-Bank Isolation45, Typical
Frequency (Hz)
Isol
atio
n (d
B)
0.0 500.0 M 1.0 G 1.5 G 2.0 G 2.5 G 3.0 G 3.5 G 4.5 G 6.0 G4.0 G 5.5 G5.0 G–100.0
–95.0
–90.0
–80.0
–70.0
–65.0
–60.0
–50.0
–45.0
–85.0
–55.0
–35.0
–30.0
–40.0
–75.0
REF INInput connector that allows for the system to be locked to an external 10 MHz ReferenceClock.
Note Not supported on all models.
Connector BNC
Frequency 10 MHz
Tolerance46 ±10 × 10-6
Amplitude
Square 0.7 Vpk-pk to 5.0 Vpk-pk into 50 Ω, typical
Sine47 1.4 Vpk-pk to 5.0 Vpk-pk into 50 Ω, typical
Input impedance 50 Ω, nominal, AC coupled
Maximum input power +30 dBm
45 Isolation between bank A (ports <0..3>) and bank B (ports <4..7>).46 Frequency accuracy = tolerance × reference frequency.47 1 Vrms to 3.5 Vrms, typical. Jitter performance improves with increased slew rate of input signal.
WTS Specifications | 43

REF OUTOutput connector that always exports a 10 MHz Reference Clock.
Connector BNC
Reference Clock 48 10 MHz, nominal
Amplitude 1.65 Vpk-pk into 50 Ω, nominal
Output impedance 50 Ω, nominal, AC coupled
Maximum reverse power +30 dBm
CAL OUTOutput connector that provides a signal generator local oscillator output signal of a frequencythat is specified by setting the generator output frequency. This signal can be used as acalibrated tone for system calibration.
Connector N type (female)
Frequency range49 65 MHz to 6 GHz
Power output
65 MHz to 3 GHz 3 dBm, nominal
>3 GHz to 6 GHz 0 dBm, nominal
Power
65 MHz to 3.6 GHz 0 dBm, ±2 dB, typical
>3.6 GHz to 6 GHz 3 dBm, ±2 dB, typical
Output impedance 50 Ω, nominal, AC coupled
Output return loss >11.0 dB (VSWR <1.8:1), typical, referencedto 50 Ω
Output isolation (state: disabled)
<2.5 GHz frequency -45 dBc, nominal
≥2.5 GHz frequency -35 dBc, nominal
Ethernet/LAN InterfaceConnects the WTS to a PC or LAN using an Ethernet cable.
Connectors (2) Ethernet
48 Refer to the Internal Frequency Reference section for accuracy.49 When tuning to 65 MHz to 375 MHz using the REF IN channel, the exported LO is twice the RF
frequency requested.
44 | WTS Specifications

USBConnects a keyboard and mouse to the WTS using USB cables.
Connectors (4) USB 2.0
Monitor OutputConnects a monitor to the WTS using a DisplayPort cable.
Connectors DisplayPort
Power Requirements
AC InputOutput connector that provides a signal generator local oscillator output signal of a frequencythat is specified by setting the generator output frequency. This signal can be used as acalibrated tone for system calibration.
Input voltage range 100 VAC to 240 VAC
Operating voltage range 90 VAC to 264VAC
Input frequency 50/60 Hz
Operating frequency range 47 Hz to 63 Hz
Input current range 7.3 A to 3.5 A
Line regulation
3.3 V <±0.2%
5 V <±0.1%
±12 V <±0.1%
Efficiency 70%, typical
Power disconnect The AC power cable provides main powerdisconnect.
CalibrationInterval 2 years
WTS Specifications | 45

Two Year Calibration Interval Correction Factors
Table 35. Two Year Calibration Interval Correction Factors
Center Frequency
Two Year Correction (±dB)
Signal AnalyzerAbsolute
AmplitudeAccuracy
Signal GeneratorAbsolute
AmplitudeAccuracy
Third Order OutputIntermodulationDistortion (IMD3)
65 MHz to <109 MHz 0.11 0.20 0.60
≥109 MHz to <600 MHz 0.11 0.20 0.60
≥600 MHz to <1 GHz 0.11 0.20 0.60
≥1 GHz to <1.6 GHz 0.11 0.20 0.60
≥1.6 GHz to <2.7 GHz 0.11 0.20 0.60
≥2.7 GHz to <3 GHz 0.11 0.20 0.60
≥3 GHz to <3.6 GHz 0.11 0.20 0.60
≥3.6 GHz to <4 GHz 0.11 0.30 0.90
≥4 GHz to <5 GHz 0.16 0.30 0.90
≥5 GHz to <6 GHz 0.16 0.40 1.20
Self-CalibrationSelf-calibration adjusts the WTS for variations in the environment using an onboard high-precision calibration tone. Perform a complete self-calibration after first setting up your WTSand letting it warm up for 30 minutes.
Note Warm up begins when the PXI Express has been powered on and theoperating system has completely loaded.
The WTS is calibrated at the factory; however, you should perform a self-calibration in any ofthe following situations:• After first setting up the WTS.• When the system is in an environment where the ambient temperature varies or the WTStemperature has drifted more than ±2 °C from the temperature at the last self-calibration.
• To periodically adjust for small performance drifts that occur with product aging.
Cobham recommends you perform self-calibration by sending the *CAL SCPI command.Note Self-calibration may take up to 10 minutes to complete.
46 | WTS Specifications
Physical DimensionsWireless Test System (including handles) 43.51 cm × 35.81 cm × 19.43 cm
(17.13 in. × 14.1 in. × 7.65 in.)
Weight
WTS-01 16.78 kg (37 lb)
WTS-02 18.14 kg (40 lb)
WTS-03 18.31 kg (40.38 lb)
WTS-04 17.42 kg (38.40 lb)
WTS-05 20.32 kg (44.80 lb)
EnvironmentMaximum altitude 2,000 m (800 mbar) (at 25 °C ambient
temperature)
Measurement category 2
Pollution Degree 2
Indoor use only.
Operating EnvironmentAmbient temperature range 0 °C to 50 °C (Tested in accordance with
IEC 60068-2-1 and IEC 60068-2-2. MeetsMIL-PRF-28800F Class 3 low temperaturelimit and MIL-PRF-28800F Class 2 hightemperature limit.)
Relative humidity range 10% to 90%, noncondensing (Tested inaccordance with IEC 60068-2-56.)
Storage EnvironmentAmbient temperature range -40 °C to 71 °C (Tested in accordance
with IEC 60068-2-1 and IEC 60068-2-2.Meets MIL-PRF-28800F Class 3 limits.)
Relative humidity range 10% to 90%, noncondensing (Tested inaccordance with IEC 60068-2-56.)
WTS Specifications | 47

Shock and VibrationOperating shock 30 g peak, half-sine, 11 ms pulse (Tested in
accordance with IEC 60068-2-27. MeetsMIL-PRF-28800F Class 2 limits.)
Random vibration
Operating 5 Hz to 500 Hz, 0.3 grms
Nonoperating 5 Hz to 500 Hz, 2.4 grms (Tested in accordancewith IEC 60068-2-64. Nonoperating testprofile exceeds the requirements ofMIL-PRF-28800F, Class 3.)
Compliance and Certifications
SafetyThis product is designed to meet the requirements of the following electrical equipment safetystandards for measurement, control, and laboratory use:• IEC 61010-1, EN 61010-1• UL 61010-1, CSA 61010-1
Note For UL and other safety certifications, refer to the product label or the OnlineProduct Certification section.
Electromagnetic CompatibilityThis product meets the requirements of the following EMC standards for electrical equipmentfor measurement, control, and laboratory use:• EN 61326-1 (IEC 61326-1): Class A emissions; Basic immunity• EN 55011 (CISPR 11): Group 1, Class A emissions• EN 55022 (CISPR 22): Class A emissions• EN 55024 (CISPR 24): Immunity• AS/NZS CISPR 11: Group 1, Class A emissions• AS/NZS CISPR 22: Class A emissions• FCC 47 CFR Part 15B: Class A emissions• ICES-001: Class A emissions
Note In the United States (per FCC 47 CFR), Class A equipment is intended foruse in commercial, light-industrial, and heavy-industrial locations. In Europe,Canada, Australia, and New Zealand (per CISPR 11), Class A equipment is intendedfor use only in heavy-industrial locations.
48 | WTS Specifications

Note Group 1 equipment (per CISPR 11) is any industrial, scientific, or medicalequipment that does not intentionally generate radio frequency energy for thetreatment of material or inspection/analysis purposes.
Note For EMC declarations, certifications, and additional information, refer to the Online Product Certification section.
CE Compliance This product meets the essential requirements of applicable European Directives, as follows:• 2014/35/EU; Low-Voltage Directive (safety)• 2014/30/EU; Electromagnetic Compatibility Directive (EMC)
Online Product CertificationRefer to the product Declaration of Conformity (DoC for additional regulatory compliance information. To obtain product certifications and the DoC for this product, visit ni.com/certification, search by model number or product line, and click the appropriate link in the Certification column.
Environmental ManagementCobham is committed to designing and manufacturing products in an environmentally responsible manner. Cobham recognizes that eliminating certain hazardous substances from our products is beneficial to the environment and to Cobham customers.
Waste Electrical and Electronic Equipment (WEEE)EU Customers At the end of the product life cycle, all NI products must bedisposed of according to local laws and regulations. For more information abouthow to recycle NI products in your region, visit ni.com/environment/weee.
电子信息产品污染控制管理办法(中国 RoHS)中国客户 National Instruments 符合中国电子信息产品中限制使用某些有害物
质指令(RoHS)。关于 National Instruments 中国 RoHS 合规性信息,请登录
ni.com/environment/rohs_china。(For information about China RoHScompliance, go to ni.com/environment/rohs_china.)
WTS Specifications | 49

www.cobham.com/wirelessCobham Wireless - Validation
Part No.46900/094, Issue 1, 04/16
Dallas (HQ Americas)
15950 North Dallas Parkway
Suite 400 Dallas
Texas 75248
USA
Tel: +1 972 361 8038
Headquarters (UK)
Longacres House
Six Hills Way
Stevenage
Hertfordshire SG1 2AN
United Kingdom
Tel: +44 1438 742200
Beijing (HQ Greater China)
Address: RM901, A Tower, Pacific Century Place, 2A Gong Ti Bei Lu, Chaoyang District
Beijing 100027, PR China
Tel: +86 10 65391166
RM916, A Tower, Pacific Century Place,
2A Gong Ti Bei Lu, Chaoyang District
Beijing 100027, PR China
Tel: +86 10 65391166
Singapore (HQ RoAPAC)
21 Media Circle, Infinite Studios
#06-04 & 05-01
Singapore 138562
Tel: +65 6643 4700
Cobham Wireless Regional Sales Office