Los Angeles ID~~ Department of Water & Power los Angeles ...

NI 43-101 Technical Report
Salar de los Angeles Project
Salar de Diablillos
Salta Province, Argentina
Report Date: May 2, 2016
Effective Date: April 1, 2016
Report Prepared for:
Aberdeen International Inc.
Report Prepared by:
Raymond Spanjers P.Geo

NI 43-101 Technical Report – Sal de los Angeles Project, Salar de Diablillos
VU-BCM-AMEC/thb Aberdeen_NI 43-101_Technical Report_20160501 December 22, 2011
NI 43-101 Technical Report Sal de los Angeles Project Salar de Diablillos Salta, Argentina
Aberdeen International Inc. 65 Queen Street West, 8th Floor Toronto, Ontario Canada M5H 2M5
Raymond Spanjers, MS, PG
“Original Document signed and sealed by Raymond P Spanjers, MS, PG”
May 2, 2016 (effective date April 1, 2016)

NI 43-101 Technical Report – Sal de los Angeles Project, Salar de Diablillos Page i
VU-BCM-AMEC/thb Aberdeen_NI 43-101_Technical Report_20160501 December 22, 2011
Summary (Item 1)
The Sal de los Angeles Project, that covers the vast majority of Salar de Diablillos, is a brine project that is characterized by elevated lithium, potassium and boron hosted in a high altitude salar, or evaporitic basin. On December 27, 2015 Aberdeen acquired 100% of the project and, on Feb 24, 2016 signed a Joint Venture agreement with Lithium X Energy Corp for the development of the project. The company intends to develop the project from resource through to feasibility using a combination of extraction wells and surface ponds to produce concentrated brine. The first step is to conduct reconciliation work with historical results and determine the scope of work required to state a measured and/or indicated resource for the project.
Property Description and Ownership
The Sal de los Angeles property is located in the Puna region of northwest Argentina, approximately 145 km southwest of the city of Salta, a few kilometres north of the border between the Provinces of Salta and Catamarca, Argentina. The property area lies entirely within the Province of Salta. Centroid co-ordinates for the Project are approximately 726,800 E and 7,206,050 N (Universal Transverse Mercator (UTM) system, WGS84 Zone 19 South).
The Sal de los Angeles property consists of 32 mining concessions covering 8,156.5 hectares of Salar de Diablillos evaporitic basin.
PLASA maintains active mining and exploration permits for Salar de Diablillos. There is no other owner or operator with mining or exploitation rights within the brine resource area. PLASA intends to conduct brine extraction and concentration activities at the salar.
Historical Work
Aberdeen has not completed any exploration work on the property since its acquisition of PLASA on December 27, 2015.
The bulk of the work was completed by Rodinia Lithium between 2009 and 2015, and included:
Surface sampling: Brine samples were collected from 140 shallow auger wells regularly distributed on the surface of the salar at approximately 300m by 300m spacing;
Gravity survey: Ten lines were surveyed to model basement depth;
Seismic survey: 52 km of seismic tomography profiles were completed covering most of the Project from north to south and east to west;
Reverse circulation (RC) drilling program: 21 RC drill holes were completed to develop vertical profiles of brine chemistry and to provide geological and hydrogeological data at depth in the salar;
Down-hole geophysical surveys;
Flow monitoring program: Brine flow was monitored during drilling and during the flow of the artesian well;
Diamond drilling (DD) program: 7 diamond drill holes were drilled to help evaluate aquifer geology and matrix material;
Pumping test program: a pump tests were performed on well site DPT-02; and
NI 43-101 Technical Report – Sal de los Angeles Project, Salar de Diablillos Page ii
Raymond P. Spanjers ABERDEEN INTERNATIONAL INC May 2016
Pilot Pools: on-site pilot pools were constructed and operated for metallurgical processing investigations
In 2010 Rodinia retained AMEC International Ingeniería y Construción Limitada of Chile to prepare a brine resource estimate using data gathered from the first 16 reverse circulation drill holes, downhole geophysical surveys and the gravity survey.
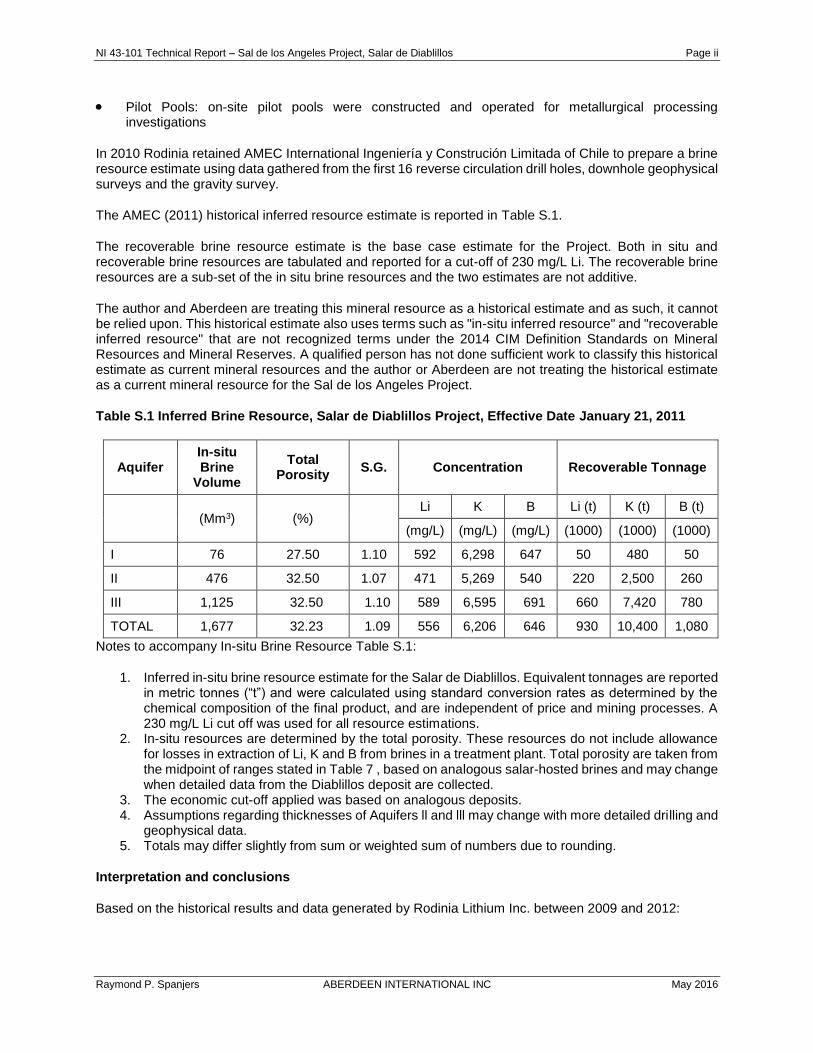
The AMEC (2011) historical inferred resource estimate is reported in Table S.1.
The recoverable brine resource estimate is the base case estimate for the Project. Both in situ and recoverable brine resources are tabulated and reported for a cut-off of 230 mg/L Li. The recoverable brine resources are a sub-set of the in situ brine resources and the two estimates are not additive.
The author and Aberdeen are treating this mineral resource as a historical estimate and as such, it cannot be relied upon. This historical estimate also uses terms such as "in-situ inferred resource" and "recoverable inferred resource" that are not recognized terms under the 2014 CIM Definition Standards on Mineral Resources and Mineral Reserves. A qualified person has not done sufficient work to classify this historical estimate as current mineral resources and the author or Aberdeen are not treating the historical estimate as a current mineral resource for the Sal de los Angeles Project.
Table S.1 Inferred Brine Resource, Salar de Diablillos Project, Effective Date January 21, 2011
Aquifer In-situ Brine
Volume
Total Porosity
S.G. Concentration Recoverable Tonnage
(Mm3) (%)
Li K B Li (t) K (t) B (t)
(mg/L) (mg/L) (mg/L) (1000) (1000) (1000)
I 76 27.50 1.10 592 6,298 647 50 480 50
II 476 32.50 1.07 471 5,269 540 220 2,500 260
III 1,125 32.50 1.10 589 6,595 691 660 7,420 780
TOTAL 1,677 32.23 1.09 556 6,206 646 930 10,400 1,080
Notes to accompany In-situ Brine Resource Table S.1:
1. Inferred in-situ brine resource estimate for the Salar de Diablillos. Equivalent tonnages are reported in metric tonnes (“t”) and were calculated using standard conversion rates as determined by the chemical composition of the final product, and are independent of price and mining processes. A 230 mg/L Li cut off was used for all resource estimations.
2. In-situ resources are determined by the total porosity. These resources do not include allowance for losses in extraction of Li, K and B from brines in a treatment plant. Total porosity are taken from the midpoint of ranges stated in Table 7 , based on analogous salar-hosted brines and may change when detailed data from the Diablillos deposit are collected.
3. The economic cut-off applied was based on analogous deposits. 4. Assumptions regarding thicknesses of Aquifers ll and lll may change with more detailed drilling and
geophysical data. 5. Totals may differ slightly from sum or weighted sum of numbers due to rounding.
Interpretation and conclusions
Based on the historical results and data generated by Rodinia Lithium Inc. between 2009 and 2012:

NI 43-101 Technical Report – Sal de los Angeles Project, Salar de Diablillos Page iii
Raymond P. Spanjers ABERDEEN INTERNATIONAL INC May 2016
The entire salar surface and a portion of the northern slope has been adequately covered by exploratory drilling on an approximate 1.5 km by 1.5km grid;
The results of the drilling of 21 reverse circulation drill holes identifies distinct brine composition and grade at specific depth intervals, showing a relatively uniform distribution of lithium bearing brines throughout the basin;
The lithium bearing brine appear to contain sufficient levels of lithium, potassium and boron to be potentially economic;
The basin appears to deepen towards the northern half of the known extents;
The deepening of the basin appears to coincide with higher grade drill intervals;
The diamond drill holes were drilled on the same sites as some of the reverse circulation drilling, which allows future correlation of stratigraphy with brine composition and indicative flow-rates gathered from the RC drilling;
The stratigraphy of the basin general consists of upper layers of sands with minor clays coarsening to gravels and rock fragments towards the basement contact;
Seismic tomography surveys confirm a uniform stratigraphy of sand and gravels throughout the basin;
Pump tests performed by SRK show indications of high effective porosity and specific yield values in typical sand aquifers;
Fresh water injection to the basin is primarily from the south east, from the Diablillos river.
All the data indicate a sizeable basin hosting lithium bearing brines within uniform aquifers with only minor clay horizons. Pump tests and geophysicial surveys indicate that these aquifers have favourable parameters for pumping using conventional wells.

NI 43-101 Technical Report – Sal de los Angeles Project, Salar de Diablillos Page iv
Raymond P. Spanjers ABERDEEN INTERNATIONAL INC May 2016
Recommendations
The following recommendations define a Phase 1 budget for 2016. The findings of the Phase 1 recommendations will inform and define the next phase.
Phase 1: Resource Estimate
The initial recommendation is to complete a NI 43-101 compliant current mineral resource update, with the objective of attaining a high percentage of resources in the measured and indicated categories. In order to do so, the author recommends:
Compiling all available data generated by Rodinia Lithium between 2009 and 2015;
Complete additional interpretation of basin stratigraphy and geometry using all available data, weighted heavily on the high quality seismic tomography sections and the drill data;
Complete additional pump tests at sites DRC-01 (DPP-01), and another site with open drill holes on the northern alluvial slope;
Characterize the hydrogeological properties of the determined stratigraphic units; and
Compile all the information into appropriate models with the purpose of estimating contained mineral resources.
The budget for Phase 1 is estimated at $500,000.
Phase 2: Pre-feasibility Study or Feasibility Study
Upon successful completion of Phase 1, and should the resultant resource be of sufficient size and quality to warrant further studies, the author recommends completing a Prefeasibility Study or a Feasibility Study, depending on the quality of the processing data made available at the time.
An estimated budget for Phase 2 is approximately $2,500,000.

NI 43-101 Technical Report – Sal de los Angeles Project, Salar de Diablillos Page v
Raymond P. Spanjers ABERDEEN INTERNATIONAL INC May 2016
Table of Contents
Summary (Item 1) .......................................................................................................................................... i
Disclaimer...................................................................................................................................................... ix
1. Introduction (Item 2) ......................................................................................................................... 1
1.1 Terms of Reference and Purpose of the Report ................................................................. 1
1.2 Qualifications of Consultants .............................................................................................. 1
1.3 Reliance on Other Experts (Item 3) .................................................................................... 1
1.4 Sources of Information and Extent of Reliance .................................................................. 1
1.5 Effective Date ...................................................................................................................... 2
1.6 Units of Measure ................................................................................................................. 2
2. Property Description and Location (Item 4) ..................................................................................... 3
2.1 Mineral Titles ....................................................................................................................... 3
2.2 Environmental Liabilities ..................................................................................................... 4
2.3 Other Significant Factors and Risks.................................................................................... 6
3. Accessibility, Climate, Local Resources, Infrastructure and Physiography (Item 5)........................ 7
3.1 Topography, Elevation and Vegetation ............................................................................... 7
3.2 Climate and Length of Operating Season ........................................................................... 7
3.3 Sufficiency of Surface Rights .............................................................................................. 8
3.4 Accessibility and Transportation to the Property ................................................................ 8
3.5 Infrastructure Availability and Sources................................................................................ 9
3.6 Power .................................................................................................................................. 9
3.7 Water ................................................................................................................................... 9
4. History (Item 6) ............................................................................................................................... 10
4.1 Rodinia Lithium Inc. Work (2009-2015) ............................................................................ 10
5. Geological Setting and Mineralization (Item 7) .............................................................................. 12
5.1 Geological and Hydrogeological Setting (AMEC 2011) .................................................... 13
5.1.1 Regional Geology ............................................................................................. 13 5.1.2 Property Geology ............................................................................................. 14 5.1.3 Hydrogeological Setting ................................................................................... 18 5.1.4 Salar de Diablillos Basin .................................................................................. 18 5.1.5 Surface Water .................................................................................................. 18
5.2 AMEC (2011) Hydrogeological Conceptual Model ........................................................... 18
5.3 Aquifer I ............................................................................................................................. 20
5.4 Aquifer II ............................................................................................................................ 20
5.5 Aquifer III ........................................................................................................................... 20
5.6 Comment on Section 5.0 .................................................................................................. 20
6. Deposit Type (Item 8) ..................................................................................................................... 21

NI 43-101 Technical Report – Sal de los Angeles Project, Salar de Diablillos Page vi
Raymond P. Spanjers ABERDEEN INTERNATIONAL INC May 2016
7. Exploration (Item 9) ........................................................................................................................ 22
7.1 Grids and Surveys............................................................................................................. 22
7.2 Geological Logging ........................................................................................................... 22
7.3 Geochemistry .................................................................................................................... 23
7.4 Geophysical Surveys ........................................................................................................ 23
7.4.1 Borehole Geophysical Logging ........................................................................ 23 7.4.2 Gravity Survey .................................................................................................. 24 7.4.3 Hydrogeology ................................................................................................... 25 7.4.4 Seismic Survey ................................................................................................ 26
8. Drilling (Item 10) ............................................................................................................................. 30
8.1 Auger Drilling ..................................................................................................................... 31
8.2 Reverse Circulation Drilling ............................................................................................... 31
8.2.1 Reverse Circulation Drill Results ..................................................................... 34
8.3 Diamond Drilling ................................................................................................................ 35
8.4 Pump Tests ....................................................................................................................... 36
8.4.1 Drilling and Well Construction .......................................................................... 36 8.4.2 Monitoring Wells ............................................................................................... 38 8.4.3 Pumping Wells ................................................................................................. 38 8.4.4 Well Development ............................................................................................ 38 8.4.5 Hydrologic Testing ........................................................................................... 40 8.4.6 Middle-Sand Pumping Test: PT-01 ................................................................. 40 8.4.7 Deep-Sand Pumping Test: PT-02 ................................................................... 41 8.4.8 Tracer Test ....................................................................................................... 41 8.4.9 Interpretation of Pumping Test Results ............................................................ 42 8.4.10 Gas Exsolution ................................................................................................. 44
9. Sample Preparation, Analysis and Security (Item 11) ................................................................... 46
9.1 Sampling Method and Approach ....................................................................................... 46
9.1.1 Auger Sampling (Rodinia 2009) ....................................................................... 46 9.1.2 Reverse Circulation Sampling (Rodinia 2010-2011) ........................................ 46 9.1.3 Sample Security ............................................................................................... 47 9.1.4 Density ............................................................................................................. 49 9.1.5 Comments on Section 9.1 ................................................................................ 49
9.2 Sample Preparation, Analyses and Security .................................................................... 50
9.2.1 Overview .......................................................................................................... 50 9.2.2 Comments on Section 9 ................................................................................... 51
10. Data Verification (Item 12) ............................................................................................................. 52
10.1 Quality Assurance/Quality Control Programs ................................................................... 52
11. Mineral Process and Metallurgical Testing (Item 13) ..................................................................... 53
11.1 Recovery Estimate Assumptions ...................................................................................... 53
11.2 Significant Factors............................................................................................................. 54
12. Mineral Resource Estimate (Item 14) ............................................................................................ 55
13. Mineral Reserve Estimates ............................................................................................................ 56
14. Mining Methods (Item 16) .............................................................................................................. 57

NI 43-101 Technical Report – Sal de los Angeles Project, Salar de Diablillos Page vii
Raymond P. Spanjers ABERDEEN INTERNATIONAL INC May 2016
15. Recovery Methods (Item 17) .......................................................................................................... 58
16. Project Infrastructure (Item 18) ...................................................................................................... 59
17. Market Studies (Item 19) ................................................................................................................ 60
18. Environmental Studies, Permitting and Social or Community Impact (Item 20) ............................ 61
19. Capital and Operating Costs (Item 21) .......................................................................................... 62
20. Economic Analysis (Item 22) ......................................................................................................... 63
21. Adjacent Properties (Item 23) ........................................................................................................ 64
22. Other Relevant Data and Information (Item 24) ............................................................................. 65
23. Interpretation and Conclusions (Item 25) ....................................................................................... 66
24. Recommendations (Item 26) .......................................................................................................... 67
24.1 Phase 1: Resource Estimate ............................................................................................ 67
24.2 Phase 2: Pre-feasibility Study or Feasibility Study ........................................................... 67
25. References (Item 27) ..................................................................................................................... 68
26. Glossary ......................................................................................................................................... 70
26.1 Abbreviations .................................................................................................................... 70
Appendix A: Certificate of Author .............................................................................................................. A-1
List of Tables
Table S.1 Inferred Brine Resource, Salar de Diablillos Project, Effective Date January 21, 2011 ............... ii
Table 2.1 Description of Land Titles ............................................................................................................. 5
Table 3.1 Climate Data for Salar de Diablillos .............................................................................................. 7
Table S.1 Inferred Brine Resource, Salar de Diablillos Project, Effective Date January 21, 2011 ............. 12
Table 5.1 Water Level Measurements (DRC-series) .................................................................................. 13
Table 5.2 Aquifer Definition (AMEC 2011) .................................................................................................. 19
Table 8.1 Drilling Summary (Rodinia 2009-2012) ....................................................................................... 30
Table 8.2 Static Water Levels in Wells at the DR-16 Test Site ................................................................... 40
Table 8.3 Summary of Test Results ............................................................................................................ 44
Table 9.1 Details of Assay Methods used by ALS ...................................................................................... 51
Table 11.1 Inflow Brine Chemistry .............................................................................................................. 53
Table 26.1 List of Abbreviations .................................................................................................................. 70
List of Figures
Figure 2.1 Location of Sal de los Angeles Property ...................................................................................... 3
Figure 2.2 Mining and Exploration Permits for Salar de Diablillos ................................................................ 6
Figure 4.1 Past Exploration Activities, Pile of Ulexite from Shallow Pit (Keast, 2010) ............................... 10

NI 43-101 Technical Report – Sal de los Angeles Project, Salar de Diablillos Page viii
Raymond P. Spanjers ABERDEEN INTERNATIONAL INC May 2016
Figure 5.1 Simplified Geological Map of the Puna Plateau, Showing the Location of the Boron-Bearing Deposits and Salar Deposits (from Kasemann et. al., 2004) .............................................. 16
Figure 7.1 Interpolation Map of Lithium Concentrations from Auger Samples ........................................... 23
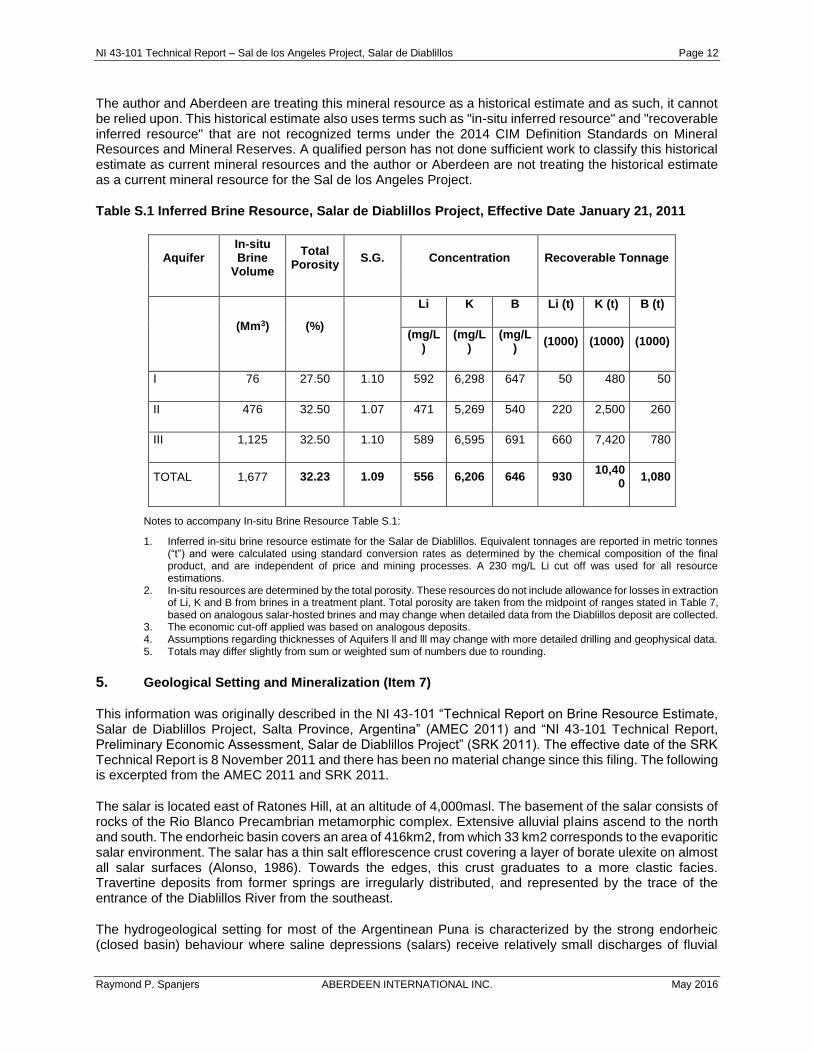
Figure 7.2 Porosity and Density Logs ......................................................................................................... 24
Figure 7.3 Gravity Model Section 7,206,500 N ........................................................................................... 26
Figure 7.4 Seismic refraction tomography lines (light green lines), DRC and DDD drill holes superimposed on satellite imagery map ........................................................................................... 27
Figure 7.5 Final WET Tomography results Seismic Line 10 and Interpretation – Salar de Diablillos (GEC 2012) ....................................................................................................................................... 29
Figure 7.6 Final WET Tomography results Seismic Line 11 and Interpretation – Salar de Diablillos (GEC 2012) ....................................................................................................................................... 29
Figure 8.1 Drill plan map for Salar de Diablillos showing reverse circulation (blue dots) ........................... 33
Figure 8.2 Auger Hole DA-03 with Plastic Casing (from Keast, 2010) ....................................................... 34
Figure 8.3 Fluorosceine Dye Standards under Black (UV) Light ................................................................ 42
Figure 8.4 Airlift Effect at DRC-16 ............................................................................................................... 45
Figure 9.1 Rock Chips/Sediments Sample Storage in the Warehouse in Salta, Argentina ....................... 47
Figure 9.2 Cyclones at RC Drilling Platform ............................................................................................... 47
Figure 9.3 Brine Sample Containers Stored at Rodinia’s Warehouse ........................................................ 48
Figure 9.4 Rock Chips Rejects Waiting for Storage at Rodinia’s Warehouse ............................................ 49

NI 43-101 Technical Report – Sal de los Angeles Project, Salar de Diablillos Page ix
Raymond P. Spanjers ABERDEEN INTERNATIONAL iNC May 2016
Disclaimer
The opinions expressed in this Report have been based on the information supplied to the author by Aberdeen International Inc. (Aberdeen). These opinions are provided in response to a specific request from Aberdeen to do so, and are subject to the contractual terms between the author and Aberdeen. The author has exercised all due care in reviewing the supplied information. While the author has compared key supplied data with expected values, the accuracy of the results and conclusions from the review are entirely reliant on the accuracy and completeness of the supplied data. The author does not accept responsibility for any errors or omissions in the supplied information and does not accept any consequential liability arising from commercial decisions or actions resulting from them. Opinions presented in this report apply to the site conditions and features as they existed at the time of investigations, and those reasonably foreseeable. These opinions do not necessarily apply to conditions and features that may arise after the date of this Report.
All data used as source material plus the text, tables, figures, and attachments of this document prepared by the author have been reviewed and prepared in accordance with generally accepted professional engineering and environmental practices.

NI 43-101 Technical Report – Sal de los Angeles Project, Salar de Diablillos Page 1
Raymond P. Spanjers ABERDEEN INTERNATIONAL iNC May 2016
1. Introduction (Item 2)
Aberdeen International Inc. (TSX.V: AAB) (Aberdeen) retained Raymond Spanjers, P.Geo. to prepare this Technical Report for the Sal de los Angeles Project (the Project), an exploration project containing lithium-bearing brines within the Salar de Diablillos basin located in the Salta Province of Argentina. The project is approximately 145kilometers (km) southwest of the city of Salta, a few kilometres north of the border of the Catamarca Province.
Aberdeen purchased 100% of Potasio y Litio de Argentina S.A. (PLASA), an Argentina based company that owns 100% of the Sal de los Angeles Property covering 8,156.5 Ha of Salar de Diablillos, from Rodinia Lithium Inc. in December 2015. On Feb 3, 2016 Aberdeen announced the signing of a binding letter agreement with Lithium X Energy Corp (TSX.V:LIX) (Lithium X), in which Lithium X could acquire up to 80% of PLASA. Pursuant to terms of the deal, in order to acquire an initial 50% stake in PLASA, Lithium X is required to issue 8,000,000 shares of Lithium X to Aberdeen. Lithium X has the option for a 26 month period to acquire an additional 30% interest by issuing common shares worth $5,000,000 to Aberdeen and fulfilling several terms, including incurring $3,000,000 in exploration and development expenditures over a two-year period and completing a feasibility study on the Project. As part of the agreement, Lithium X will be considered the initial operator of the project for as long as the Company maintains interest greater than or equal to 50% in the Joint Venture.
The transaction closed on April 21, 2016 and Aberdeen has received the initial 8,000,000 lithium X shares, such that Aberdeen now owns 50% of PLASA.
1.1 Terms of Reference and Purpose of the Report
This Technical Report was prepared in general accordance with the guidelines provided by the National Instrument 43-101 (NI 43-101) Standards of Disclosure for Mineral Projects and “Mineral Brine Projects and National Instrument 43-101 Standards of Disclosure for Mineral Projects (OSC Staff Notice 43-704).
This Technical Report is intended for the use of Aberdeen to further evaluate the Project.
1.2 Qualifications of Consultants
Raymond P. Spanjers is an independent geological consultant, a Registered Professional Geologist (SME No. 3041730) and holds a M.S. Degree in Geology. The author has 35 years of experience in the field, which includes 15 years in lithium pegmatite and lithium brine exploration and development in the US and South America. The author is independent of the Property and Aberdeen, and is a Qualified Person according to NI 43-101.
The author has visited the site on numerous occasion between 2010 and 2014 and has explicit knowledge of the Property and historical exploration as Manager of Exploration for Rodinia Lithium during the period.
1.3 Reliance on Other Experts (Item 3)
The Qualified Persons have not relied on a report, opinion or statement of a legal or other expert, who is not a qualified person for information concerning legal, environmental, political or other issues and factors relevant to this Technical Report.
1.4 Sources of Information and Extent of Reliance
The background studies and additional references for this Technical Report are listed in Section 25. The author has reviewed the project data and, where appropriate, incorporated the results into this Technical Report. The level of detail used was appropriate for this level of study.

NI 43-101 Technical Report – Sal de los Angeles Project, Salar de Diablillos Page 2
Raymond P. Spanjers ABERDEEN INTERNATIONAL INC. May 2016
In this Technical Report, the author quotes and summarizes the “Technical Report on Brine Resource Estimate, Salar de Diablillos Project” (AMEC, 2011) and “NI 43-101 Technical Report, Preliminary Economic Assessment, Salar de Diablillos Project” (SRK, 2011). This information is referenced in Sections 3, 4, 5, 6, 7, 8, 9, 10 and 11 of this Technical Report.
1.5 Effective Date
The effective date of this report is May 1, 2016.
1.6 Units of Measure
The metric (SI System) units of measure are used in this report unless otherwise noted. Analytical results are reported as a percentage of chemical element or as parts per million (ppm). A glossary of terms used in this report is provided in Section 25 of this report.

NI 43-101 Technical Report – Sal de los Angeles Project, Salar de Diablillos Page 3
Raymond P. Spanjers ABERDEEN INTERNATIONAL INC. May 2016
2. Property Description and Location (Item 4)
The Sal de los Angeles property consists of 8,156.5 hectares and is located in the Puna region of northwest Argentina (Figure 2.1), approximately 145km southwest of the city of Salta, a few kilometres north of the border between the Provinces of Salta and Catamarca, Argentina. The property area lies entirely within the Province of Salta. Centroid co-ordinates for the Project are approximately 726,800 E and 7,206,050 N (Universal Transverse Mercator (UTM) system, WGS84 Zone 19 South).
Figure 2.1 Location of Sal de los Angeles Property
Source: Argentine Military Geographic Institute
2.1 Mineral Titles
According to Argentine Law, mineral resources belong to the provinces where the resource is located. Such province has the authority to grant exploration permits and exploitation concession rights to private applicant entities. However, the Federal Congress is entitled to enact the National Mining Code and any substantive mining legislation which is similarly applicable in all of the country. Provinces have the authority to regulate the procedural aspects of the National Mining Code and to organize each enforcement authority within its territory.
In general, there are two types of mining rights that can be granted under Argentinean mining law:
• Exploration Permits (usually refer to as “Cateos”) that are limited in time and have limited obligations.
• Exploitation Concessions (usually refer to as “Minas” or “Claims”) that are unlimited in time as long as obligations set out in the National Mining Code are met by the title holders.
All concessions are granted by the regulating province either by a judicial (Salta) or administrative decision, depending on the province. An Exploration Permit can be transformed into a Mining Permit any time before

NI 43-101 Technical Report – Sal de los Angeles Project, Salar de Diablillos Page 4
Raymond P. Spanjers ABERDEEN INTERNATIONAL INC. May 2016
the expiry date of the Exploration Permit by presenting a report and paying canon rent. Tenure for exploitation concessions is indefinite providing that annual payments are made in February and July each year.
In the Salta province, all concessions are granted by a judge in the Mining Court. Each property is recorded by number in the Mining Court registry, and each property has its own judicial file. In addition, the Mining Secretariat records the property in the Registro Gráfico (“Land Register Office”) and adds the property to a digital map of the area.
Figure 2.2 presents the active mining and exploration permits for Salar de Diablillos. The author has not checked the validity and good standing of these concessions, but has relied upon Aberdeen’s legal title opinion related to recent transactions, including for environmental liabilities described in Section 2.2. The title opinion states that all concessions owned by PLASA are legally valid and in good standing with unencumbered access, including the usufruct right registered in title.
Table 2.1 presents a summary of lease agreements and legal status related to Salar de Diablillos.
2.2 Environmental Liabilities
The Salar de Diablillos is not subject to any material environmental liabilities. There has been some ulexite mining in the Project area in the past, but at shallow depth (less than 1m). Although records for these activities are not available, it is unlikely that lithium-bearing brines would have been exposed during these past activities. Now that the majority of these small-scale operations have ceased, natural reclamation is expected.
Drilling and earthworks completed by previous operators during 2011 and 2012 did incur a fine of AR$43,200 (approximately USD3000) for certain failures to comply with environmental standards and reporting. The Mining Secretary for Salta province has since resolved, after a series of administrative appeals, that there has not been any environmental damage as a result of these drilling activities, including a resultant and actively flowing artesian well, and any orders which could hinder the further advancement of the property have been removed. The fine has been maintained, as it relates to administrative charges.

NI 43-101 Technical Report – Sal de los Angeles Project, Salar de Diablillos Page 5
Raymond P. Spanjers ABERDEEN INTERNATIONAL INC. May 2016
Table 2.1 Description of Land Titles
Mine Has. Owner Licences Contract
Angélica 100,00
PLASA (100%)
Public Deed Nr. 275
San Atilio 100,00 Usufruct right on 100% of the solid borates held by Santiago Saenz S.A.
Public Deed Nr. 276
Nuestra Señora del Luján
100,00
Usufruct right on 40% of the solid borates held by Colorado S.A. and 60% held by Santiago Saenz S.A.
La Petisa 246,50
Public Deed Nr. 12 Zorro I 165,00
Zorro II 975,00
Santa Maflo 1.500,00
Ratonex II 2.170,00 PLASA (100%)
Judgment passed by Mining and Commercial Court on April 24th, 2014.
Aegyr 100,00
Borax Argentina S.A.
100% Usufruct Right over the brine resource held by PLASA as established by Diablillos Mining Licence and Diablillos Option Agreement
Chinchillas 200,00
Consuelo 100,00
Coral 100,00
Esperanza 100,00
La Entrerriana 200,00
La Pichunga 100,00
La Tosca 1 y 2 200,00
Odin y Thor 100,00
San Andrés 100,00
San Felipe 100,00
San Jorge 100,00
San José 100,00
San Juan 100,00
San Marcelo 100,00
San Martín 100,00
San Miguel 100,00
San Pablo 100,00
San Pedro 100,00
Santa Rosa 100,00
Santiago 100,00
Santo Domingo 200,00
Santo Tomás 100,00
Sol Argentino 100,00
TOTAL (Ha) 8.156,50

NI 43-101 Technical Report – Sal de los Angeles Project, Salar de Diablillos Page 6
Raymond P. Spanjers ABERDEEN INTERNATIONAL INC. May 2016
Figure 2.2 Mining and Exploration Permits for Salar de Diablillos
Source: AMEC 2011, Figure 4-2
2.3 Other Significant Factors and Risks
There are no other significant factors and risks that may affect access, title or the ability to perform work on the Salar de Diablillos.

NI 43-101 Technical Report – Sal de los Angeles Project, Salar de Diablillos Page 7
Raymond P. Spanjers ABERDEEN INTERNATIONAL INC. May 2016
3. Accessibility, Climate, Local Resources, Infrastructure and Physiography (Item 5)
The following information was originally described in the NI 43-101 “Technical Report on Brine Resource Estimate, Salar de Diablillos Project, Salta Province, Argentina” (AMEC 2011) and subsequently in “NI 43-101 Technical Report, Preliminary Economic Assessment, Salar de Diablillos Project” (SRK 2011). The effective date of the SRK Technical Report is 8 November 2011 and there has been no material change in the descriptions provided below.
3.1 Topography, Elevation and Vegetation
The Salar de Diabillos is located in the Puna region of the Andes, characterized by broad valleys separating mountain ranges which extend south from Peru and Bolivia and into northern Chile and northwestern Argentina. The region exhibits large plateaus averaging 3,500 masl surrounded by mountain ranges with heights exceeding 6,000masl. The average elevation in the project area is approximately 4,000 masl, with the nearby volcanic mountains exceeding that elevation by several hundred meters.
3.2 Climate and Length of Operating Season
The Salar de Diablillos is located in the Argentine Puna region with an extremely dry and arid climate, generally with little or no annual rainfall. Table 3.1 provides a summary of climate data for the Salar de Diablillos including temperature, precipitation, pan evaporation, and the expected brine evaporation rate calculated from the pan evaporation rate. At nearby Salar de Hombre Muerto, rainfall is reported to average 60 to 80 mm/year (Garrett 2004, in Keast, 2010), which is consistent with the value presented by Lithium One for the same salar (77.4 mm/year, presented in Table 3.1) (2011). The majority of the precipitation occurs during the months of January through March.
The Pan Evaporation Rate shown in Table 3.1 was calculated using the empirical relationship derived from several salars in the Atacama Desert presented in Houston (2006). Using this equation, (Freshwater Pan Evaporation= 4,364 - (0.59*A) where A is Altitude and equal to 4,000 m), a Pan Evaporation Rate of 2,004 mm/year is calculated. Monthly values are then calculated using monthly fractional values of annual Pan Evaporation for sites in the Atacama Desert presented by Houston (2006). Brine Pan Evaporation is calculated using the relationship between fluid density and Pan Evaporation, where it is shown that for every 0.1 kg/m3 increase in fluid density, evaporation decreases by 700 mm/year. Finally, a Net Evaporation rate for ponds is calculated by multiplying the Brine Pan Evaporation Rate by 0.7, which is a factor commonly used to convert between Pan Evaporation and Pond Evaporation Rates.
Table 3.1 Climate Data for Salar de Diablillos
Month Precipitation (mm)1
Temperature (Deg C)2
Freshwater Pan
Evaporation (mm)3
Brine Pan Evaporation
(mm)4
Net Brine Pond
Evaporation (mm)5
January 35.6 11.6 230.16 149.77 79.92
February 20 10.9 214.29 139.44 83.61
March 7.8 9.0 204.37 132.98 87.63
April 1.1 5.5 158.73 103.29 71.53
May 0.7 1.6 123.02 80.05 55.54
June 1 -0.8 107.14 69.72 48.10
July 1.2 -1.6 105.16 68.43 47.06
August 0.8 0.3 125.00 81.34 56.38

NI 43-101 Technical Report – Sal de los Angeles Project, Salar de Diablillos Page 8
Raymond P. Spanjers ABERDEEN INTERNATIONAL INC. May 2016
Month Precipitation (mm)1
Temperature (Deg C)2
Freshwater Pan
Evaporation (mm)3
Brine Pan Evaporation
(mm)4
Net Brine Pond
Evaporation (mm)5
September 1.6 2.7 144.84 94.25 64.85
October 0 5.4 186.51 121.36 84.95
November 0.4 7.4 192.46 125.24 87.38
December 7.1 9.6 212.30 138.15 91.73
Annual Total: 77.4 5.2 2004.00 1,304.00 858.62
During the winter season (July and August), temperatures average between 8°C to 10°C during the daytime and -5°C to -8°C during the night, but exhibit large daily variations commonly reaching -25°C and 15°C within 24 hours. During the summer months (December to February) temperatures average between 25°C to 30°C during the daytime and around freezing during the night. Strong northwest and west winds in excess of 45 km/h are common in the area, particularly during the winter and spring seasons (Borax Argentina, 2009).
Exploration activities are conducted throughout the year, and it is expected that future exploitation operations can be conducted year-round. Exceptions may occur in the latter half of January and early February, when summer rains may complicate access to certain portions of the salar.
It is worth noting that during the author’s tenure with Rodinia Lithium there was one episode of substantial precipitation, and subsequent flooding, which affected the Salar de Diablillos.
3.3 Sufficiency of Surface Rights
As described in Section 2.2, PLASA holds over 8,156.5 ha of mineral tenure. In the immediate vicinity of the historical exploitation area, and within the Rodinia ground holdings, there is sufficient area to support construction of conventional wells, liming plants, housing and evaporation ponds for the production of lithium rich bittern. The size and extent of these facilities are not known are not known at this time.
3.4 Accessibility and Transportation to the Property
The Diablillos property is accessible from the city of Salta through the town of San Antonio de Los Cobres via National Highway 51, and then through a secondary gravel road (all-weather provincial Route 129) via the town of Santa Rosa de Los Pastos Grandes (Figure 3.1). By road the distance from Salta to the property is approximately 320km, which is a driving time of six to seven hours.
An alternate road route exists via the town of Pocitos on Provincial Route 17, which is the main road to Antofagasta, Chile and the primary road access to the Borax Argentina Minas Tincalayu borax mine, located a few kilometres southwest of the Diablillos property on the north-eastern shore of the Salar Hombre Muerto. These secondary roads are regularly maintained, as they are used daily for transportation purposes during mining and processing of borates in the region.
The Salar de Diablillos may be accessed from the north and the south by two local roads veering off the secondary trucking road. The local roads are relatively narrow gravel roads that can be driven with regular two-wheel drive vehicles with high clearance; however, during the rainy periods between January and March, sections of the road are susceptible to flooding or small landslides, and in those months four-wheel drive vehicles are required for access within the property.
The nearest commercial airport to the Salar de Diabillos located in the city of Salta, which is serviced by regular commercial flights from major South American cities.

NI 43-101 Technical Report – Sal de los Angeles Project, Salar de Diablillos Page 9
Raymond P. Spanjers ABERDEEN INTERNATIONAL INC. May 2016
Local borate producers have established and regularly make use of trucking routes between Diablillos, Pocitos and San Antonio de los Cobres. Salta is connected to the Chilean seaport of Antofogasta by the narrow-gauge General Belgrano Railway.
3.5 Infrastructure Availability and Sources
Salta, the largest urban center in the proximity of El Salar de Diabillos, has a population of around 500,000. It is located 145km northeast in a straight line from the Project area and 320km by road. Salta is the primary commercial center for the region and most supplies, fuel and equipment may be purchased here and trucked to the project site year-round.
3.6 Power
The town of Estacion Salar de Pocitos (Pocitos), approximately 100km north of the Project area, is the closest access point to the nearest high-tension power line. A natural gas pipeline can also be accessed at Pocitos.
3.7 Water
Rodinia installed a water supply well that provides fresh water for exploration operations. The majority of freshwater enters the salar from the Diablillos River.

NI 43-101 Technical Report – Sal de los Angeles Project, Salar de Diablillos Page 10
Raymond P. Spanjers ABERDEEN INTERNATIONAL INC. May 2016
4. History (Item 6)
The early exploration and production history on the Salar de Diablillos, prior to 2009, has been restricted to minor ulexite (NaCaB5(OH)6 – 5H2O) exploitation by local miners and exploration work by Borax Argentina during the last decade. Records of this work are not available to the authors, but evidence on the field in the form of shallow (less than one metre depth) small pits were observed during the AMEC site visit. It is unlikely that lithium-bearing brines would have been exposed and/or sampled during these past activities.
Early historical information on drilling in the salar reported by the Servicio Geológico Minero Argentino indicates that a drill hole was completed in the south-eastern margin of the salar, reaching the metamorphic basement at a depth of 75 vertical metres. The reported stratigraphy consisted of a one metre layer of ulexite followed by 10 cm of caliche and more extensive, but unspecified, clays. Below the clays a sand aquifer was logged to a depth of 30m giving way to a basal conglomerate towards the bottom of the hole (AMEC, 2011).
Figure 4.1 Past Exploration Activities, Pile of Ulexite from Shallow Pit (Keast, 2010)
4.1 Rodinia Lithium Inc. Work (2009-2015)
The majority of the historical work performed on the project was conducted by Rodinia Lithium Inc. (Rodinia) between 2009 and 2015. The bulk of exploration work was undertaken between 2010 and 2012. Work completed by Rodinia during this period included:
• Surface sampling: Brine samples were collected from 140 shallow auger wells regularly distributed on the surface of the salar at approximately 300m by 300m spacing;
• Gravity survey: Ten lines were surveyed to model basement depth;
• Seismic survey: 52 km of seismic tomography profiles were completed covering most of the Project from north to south and east to west.

NI 43-101 Technical Report – Sal de los Angeles Project, Salar de Diablillos Page 11
Raymond P. Spanjers ABERDEEN INTERNATIONAL INC. May 2016
• Reverse circulation (RC) drilling program: 21 RC drill holes were completed to develop vertical profiles of brine chemistry and to provide geological and hydrogeological data at depth in the salar;
• Down-hole geophysical surveys;
• Flow monitoring program: Brine flow was monitored during drilling and during the flow of the artesian well;
• Diamond drilling (DD) program: 7 diamond drill holes were drilled to help evaluate aquifer geology and matrix material;
• Pumping test program: a pump tests were performed on well site DPT-02 (DRC-16);
• Pilot Pools: on-site pilot pools were constructed and operated for metallurgical processing investigations.
Further in-depth descriptions of these activities can be found in Sections 7 and 8 of this Technical Report.
In 2010 Rodinia retained AMEC International Ingeniería y Construción Limitada of Chile to prepare a brine resource estimate using data gathered from the first 16 reverse circulation drill holes, downhole geophysical surveys and the gravity survey. The paragraphs below are excerpts from AMEC (2011) and are meant to describe the historical brine resource.
The brine resource estimate was prepared by AMEC Principal Geostatistician, Paula Larrondo, MAusIMM, under the supervision of Dr. Harry Parker, P. Geo., and Technical Director with AMEC. Mrs. Larrondo was the Qualified Person for the estimate.
The brine estimate was developed using Vulcan® three-dimensional block modeling software. The geological model and resource estimate were based on a conceptual hydrogeological model, stratigraphic logs, geochemical profiles along the drill holes, total porosity and density from nuclear probe logs, and flow and artesian condition records obtained during drilling.
A series of spatial constraints, such as faults, sampling depth, fresh water presence, geophysical survey and stratigraphic logging were used to define the basin volume. Once this volume was defined it was divided according to the conceptual hydrogeological model into three aquifers using geological, geophysical, geochemical and flow records obtained during logging of the drill holes.
The aquifer volumes were discretized into irregular sub-blocks using a 250 m x 250 m x 6 m block size with sub blocks down to 50 m x 50 m x 2 m for Aquifers II and III. For Aquifer I, where auger sampling was done on 300 m x 300m spacing, the parent block size was reduced to 50 m x 50 m x 6 m with sub-blocks down to 25 m x 25 m x 2 m.
Block grades were calculated using inverse distance squared (“ID2”) grade estimation methodologies. All blocks were assigned an Inferred classification. At depth, estimation within the third aquifer were limited by an extrapolated surface projected 30 m below the total depth of drill holes.
Brine resources for the Project were classified using criteria consistent with industry practices for laterally continuous deposits that can be considered analogous to salar-hosted brine deposits. The effective date for the estimate is January 21, 2011.
The AMEC (2011) historical inferred resource estimate is reported in Table S.1.
The recoverable brine resource estimate is the base case estimate for the Project. Both in situ and recoverable brine resources are tabulated and reported for a cut-off of 230 mg/L Li. The recoverable brine resources are a sub-set of the in situ brine resources and the two estimates are not additive.
NI 43-101 Technical Report – Sal de los Angeles Project, Salar de Diablillos Page 12
Raymond P. Spanjers ABERDEEN INTERNATIONAL INC. May 2016
The author and Aberdeen are treating this mineral resource as a historical estimate and as such, it cannot be relied upon. This historical estimate also uses terms such as "in-situ inferred resource" and "recoverable inferred resource" that are not recognized terms under the 2014 CIM Definition Standards on Mineral Resources and Mineral Reserves. A qualified person has not done sufficient work to classify this historical estimate as current mineral resources and the author or Aberdeen are not treating the historical estimate as a current mineral resource for the Sal de los Angeles Project.
Table S.1 Inferred Brine Resource, Salar de Diablillos Project, Effective Date January 21, 2011
Aquifer In-situ Brine
Volume
Total Porosity
S.G. Concentration Recoverable Tonnage
(Mm3) (%)
Li K B Li (t) K (t) B (t)
(mg/L)
(mg/L)
(mg/L)
(1000) (1000) (1000)
I 76 27.50 1.10 592 6,298 647 50 480 50
II 476 32.50 1.07 471 5,269 540 220 2,500 260
III 1,125 32.50 1.10 589 6,595 691 660 7,420 780
TOTAL 1,677 32.23 1.09 556 6,206 646 930 10,40
0 1,080
Notes to accompany In-situ Brine Resource Table S.1:
1. Inferred in-situ brine resource estimate for the Salar de Diablillos. Equivalent tonnages are reported in metric tonnes (“t”) and were calculated using standard conversion rates as determined by the chemical composition of the final product, and are independent of price and mining processes. A 230 mg/L Li cut off was used for all resource estimations.
2. In-situ resources are determined by the total porosity. These resources do not include allowance for losses in extraction of Li, K and B from brines in a treatment plant. Total porosity are taken from the midpoint of ranges stated in Table 7, based on analogous salar-hosted brines and may change when detailed data from the Diablillos deposit are collected.
3. The economic cut-off applied was based on analogous deposits. 4. Assumptions regarding thicknesses of Aquifers ll and lll may change with more detailed drilling and geophysical data. 5. Totals may differ slightly from sum or weighted sum of numbers due to rounding.
5. Geological Setting and Mineralization (Item 7)
This information was originally described in the NI 43-101 “Technical Report on Brine Resource Estimate, Salar de Diablillos Project, Salta Province, Argentina” (AMEC 2011) and “NI 43-101 Technical Report, Preliminary Economic Assessment, Salar de Diablillos Project” (SRK 2011). The effective date of the SRK Technical Report is 8 November 2011 and there has been no material change since this filing. The following is excerpted from the AMEC 2011 and SRK 2011.
The salar is located east of Ratones Hill, at an altitude of 4,000masl. The basement of the salar consists of rocks of the Rio Blanco Precambrian metamorphic complex. Extensive alluvial plains ascend to the north and south. The endorheic basin covers an area of 416km2, from which 33 km2 corresponds to the evaporitic salar environment. The salar has a thin salt efflorescence crust covering a layer of borate ulexite on almost all salar surfaces (Alonso, 1986). Towards the edges, this crust graduates to a more clastic facies. Travertine deposits from former springs are irregularly distributed, and represented by the trace of the entrance of the Diablillos River from the southeast.
The hydrogeological setting for most of the Argentinean Puna is characterized by the strong endorheic (closed basin) behaviour where saline depressions (salars) receive relatively small discharges of fluvial

NI 43-101 Technical Report – Sal de los Angeles Project, Salar de Diablillos Page 13
Raymond P. Spanjers ABERDEEN INTERNATIONAL INC. May 2016
tributaries. In the centre of these depressions, temporal or permanent shallow closed lagoons are formed. The occasional but intense precipitations during the summer occur either in the form of snow or hail in the higher surrounding mountains. At lower altitudes, strong rains can occur.
The Salar de Diablillos is located in the southeast end of the Puna of Salta and is the endpoint of the run-off waters of the western slope of the southern peaks of the Luracatao mountain chain. The Diablillos hydrographical basin is an elongated intermountain plane with length of approximately 3 km in the north–south direction and width of 2.5 km in the east–west direction. The basin is geographically isolated since it is completely enclosed by the surrounding mountains. However, the basin receives fresh water discharge from the Diablillos River, which is one of the rivers with greater flow in the area. This stream flows from the southeast to the north–northwest following the northeastern margin of the salar.
During exploration drilling using RC methods, Rodinia’s geologists recorded the depth to groundwater level and the depths where artesian conditions were encountered. Table 5.1 summarizes this information. These measurements are an approximate indication of groundwater levels at Salar de Diablillos and were used only as a reference in the estimation of the assumed thicknesses of the aquifers in the hydrogeological conceptual model.
Table 5.1 Water Level Measurements (DRC-series)
Hole ID Water Level (m) Artesian Conditions (m)
DRC-01 5 100
DRC-02 1.5 104
DRC-03 4 52
DRC-04 1.5 96
DRC-05 4 48
DRC-06 - 81
DRC-07 15 93
DRC-08R 12 66
DRC-09 1.5 -
DRC-10 1.5 -
DRC-11 35 130
DRC-12 42 -
DRC-13 42 -
DRC-14 16 105
DRC-15 46 80
DRC-16 3 54
Source: AMEC 2011, Table 7-1
5.1 Geological and Hydrogeological Setting (AMEC 2011)
5.1.1 Regional Geology
According to Turner (1972) and Isacks (1988), the main lithium-bearing region of South America is located in the Altiplano Puna plateau, which is approximately 2,000 km long by 300 km wide with an average elevation of 3,700 m, controlling the geomorphology of the central Andes. A volcanic arc forms the western margin of the Puna/Altiplano. East of the volcanic arc, local volcanic edifices are present within the plateau. The volcanic arc and eastern volcanic centres have been active from Miocene times to the present day

NI 43-101 Technical Report – Sal de los Angeles Project, Salar de Diablillos Page 14
Raymond P. Spanjers ABERDEEN INTERNATIONAL INC. May 2016
(Jordan and Gardeweg, 1989) and they are the origin of mineralized fluids. Uplift of the plateau is the combined result of late Tertiary crustal shortening and magmatic addition (Isacks, 1988).
The climate of the Puna varies from semiarid on the eastern border to arid along the western volcanic arc. The volcanic arc marks the limits of the Puna hydrologic basin to the west and a tectonic highland area to the east (Eastern Cordillera). In the southern Puna, combinations of east-trending volcanic chains and north trending, reverse fault-bounded structural blocks bound several hydrologic sub-basins (Alonso, 1986; 1991; Vandervoort, 1995). Extensive salars cover the basin floors, which are typically surrounded by expansive alluvial systems. Thick (up to 5 km) sections of Neogene strata are present within the modern depositional basins (Jordan and Alonso, 1987; Alonso et al., 1991) containing evaporites (mainly halite, gypsum and borates) and alluvial clastic material with minor tuffaceous horizons (Alonso, 1986). Exposed Neogene strata are present in reverse fault-bounded slices along salar margins or as intrabasin uplifts within salars (Vandervoort, 1995). Waters drain towards these closed basins so that the only way of returning to the hydrological cycle is by means of evaporation, leaving behind brines enriched in various metals and salts, sometimes including anomalous levels of lithium, boron, and/or potassium. Figure 5.1 shows the simplified regional geology of the Puna Plateau and the location of the salars and borate deposits of the area.
5.1.2 Property Geology
The Salar de Diablillos is located on the western margin of the central portion of the Puna geological province (Turner, 1972) and within the Puna Austral geological sub-province defined by Alonso et al., (1984). The altitude of the saline salt flat or playa is approximately 4,000masl. The salar constitutes a typical evaporite depositional environment emplaced within an isolated depression bound by Pre-Palaeozoic, Palaeozoic and Cainozoic crystalline metamorphic basement rocks (Vinante & Alonso, 2006).
The Salar de Diablillos saline surface covers an area of approximately 3,700 ha. Although limited published literature is available describing the stratigraphy of the basin, there are various references to the large extent and grade of the ulexite mineralization within the surficial sandstone strata. The salar is generally described as a true “boratera” referring to the extent of ulexite mineralization that covers virtually the entire salar, varying from 20 cm to several metres in thickness (Alonso 1984, Alonso 1999, Alonso 2006, among others). The borate minerals are an example of chemical-evaporitic sedimentation in arid continental environments with periods of active volcanism.
The areal distribution of borates within the salar is irregular and is thought to be related to the location of the hot springs from which they are derived (Alonso 1999). In Diablillos, as well as Salares Ratones and Centenario, remains of ancient hot spring deposits have been identified so that the predominant hypothesis is that their genesis is directly related to the supply of hot boron-bearing water from vents at the margins and/or interior of the depressions (Alonso & Gutierrez, 1984; Alonso 1988). These hydrothermal fluids rose through fracture planes that structurally control the depressions during periods of relaxation, or within extensional periods in the predominantly compressive regional tectonics. As shown in Figure 5.2, the Salar de Diablillos is bound to the south by the roughly east–west-trending Ratones fault(s), to the east by a perpendicular north-south unnamed fault, and to the west by a chain of granitic-composition hills that are elongated north–south and are probably structurally-controlled.
The hydrothermal fluids that are inferred to be the source of boron to the basins have been associated with correlative levels of lithium and potassium (Viramonte, Alonso, Gutierrez & Argañaz, 1984). Examples of this are Cauchari, Ratones and Diablillos salars which exhibit high concentrations and distribution of borate minerals as well as high concentrations of lithium in sub-surface brines. The Salar de Diablillos is considered the richest borate deposit in the Puna Austral (Alonso, 1984). According to Viramonte et al (1984) it is possible to classify the salars of the region based on this association between lithium and borates in two groups: lithium-borate rich and lithium-borate deficient.
Stratigraphy below the borate layer, generally between 1m and 5m below surface, has been explored during an auger drill campaign. It is a mixed sequence that includes clays, thin evaporite facies (sodium chloride, mirabilite (Na2SO4 – 10H2O)) carbonate facies, ulexite facies and the coarse clastic sediments from alluvial

NI 43-101 Technical Report – Sal de los Angeles Project, Salar de Diablillos Page 15
Raymond P. Spanjers ABERDEEN INTERNATIONAL INC. May 2016
fans encroaching on the salars. Thinly-bedded clay, silt, sand and evaporite facies (mostly halite and scarce gypsum) continue to depth.

NI 43-101 Technical Report – Sal de los Angeles Project, Salar de Diablillos Page 16
Raymond P. Spanjers ABERDEEN INTERNATIONAL INC. May 2016
Figure 5.1 Simplified Geological Map of the Puna Plateau, Showing the Location of the Boron-Bearing Deposits and Salar Deposits (from Kasemann et. al., 2004)

NI 43-101 Technical Report – Sal de los Angeles Project, Salar de Diablillos Page 17
Raymond P. Spanjers ABERDEEN INTERNATIONAL INC. May 2016
47 – ALLUVIAL DEPOSITS AND ALLUVIAL FANS (gravels, sands and clays)
46 - INCAHUASI FORMATION (Basalts) – Quaternary-
Pleistocene
44 - CERRO GALAN VOLCANIC COMPLEX (Ignimbrites, lavas,
domes, and dacitic ignimbrites)
42 – RATONES ANDESITES
34 - INCA VIEJO FORMATION (Rhyolithic and dacitic
porphyries)
33 - SIJES FORMATION (Sands and evaporitic pelites, mainly borates of economical interest).
15/11- OIRE ERUPTIVE COMPLEX (Pegmatites, aplites and
lamprophyres )
13 – Gabbros y Diorites
12 –Granites y Granodiorites characterized by coarse grain and
megacrystals
1.- PACHAMAMA FORMATION (Schists and gneiss with
limestones and amphibolites intercalations)

NI 43-101 Technical Report – Sal de los Angeles Project, Salar de Diablillos Page 18
Raymond P. Spanjers ABERDEEN INTERNATIONAL INC. May 2016
5.1.3 Hydrogeological Setting
The hydrogeological setting for most of the Argentinean Puna is characterized by the strong endorheic (closed basin) behaviour where saline depressions (salars) received relatively small discharges of fluvial tributaries. In the centre of these depressions, temporal or permanent shallow closed lagoons are formed.
The occasional but intense precipitations during the summer occur either in the form of snow or hail in the higher mountains of the surroundings. At lower altitudes, strong rains occur.
After short-duration surface run-offs, the water from the mountains returns to the atmosphere through evaporation during the daytime, due to the high temperature and low relative humidity, or infiltrates rapidly in thick alluvial fans with high permeability. However, in certain areas where the waters reach the surface, lowlands are formed.
5.1.4 Salar de Diablillos Basin
The Diablillos Salar is located in the southeast end of the Puna of Salta and is the endpoint of the run-off waters of the western slope of the southern peaks of the Luracatao mountain chain. The basin is geographically isolated since it is completely enclosed by the surrounding mountains. However, it receives discharge from the Diablillos River, which is one of the rivers with greater flow in the area.
The salar is located east of Ratones Hill, at an approximate altitude of 4,000masl. The basement of the salar corresponds to the Rio Blanco Precambrian metamorphic complex. Extensive alluvial plains ascend to the north and south. The endorheic basin covers an area of 416 km2, from which 33 km2 corresponds to the evaporitic salar environment. The salar has a thin salt efflorescence crust covering a layer of borate ulexite on almost all salar surfaces (Alonso, 1986). Towards the edges, this crust graduates to a more clastic facies.
Travertine deposits from former springs are irregularly distributed and represented by the trace of the entrance of the Diablillos River from the southeast.
5.1.5 Surface Water
The Diablillos hydrographical basin is an elongated intermountain plane with length of approximately 3 km in the north–south direction and width of 2.5 km in the east–west direction. Fresh water enters from the southeast through the Diablillos River. This stream flows from the southeast to the north–northwest following the northeastern margin of the salar.
5.2 AMEC (2011) Hydrogeological Conceptual Model
As described in the NI 43-101 “Technical Report on Brine Resource Estimate, Salar de Diablillos Project, Salta Province, Argentina” AMEC (2011) considered the basin to be subdivided vertically into three aquifers. The paragraphs below are excerpts from this report and describe the reasoning behind this assumption.
The observation of brine surgence both in the shallow auger holes and in RC holes intersecting the deeper facies of the Salar de Diablillos basin, suggests the existence of a north–south-elongated water-bearing complex.
The spatial distribution of lithium and the other associated elements, as well as the artesian conditions found in some holes, were the most relevant aspects that led AMEC (2011) to define an hydrogeological conceptual model that apportions the water- bearing complex into, at least, three aquifers and their corresponding aquitards (impermeable clay layers with very low hydraulic conductivity).

NI 43-101 Technical Report – Sal de los Angeles Project, Salar de Diablillos Page 19
Raymond P. Spanjers ABERDEEN INTERNATIONAL INC. May 2016
The following information was used for definition of the conceptual hydrogeological model:
• Auger and RC lithological logging, in particular the grain size description
• Total porosity and density geophysical logs for six RC holes
• Basement elevation from gravity model
• Flow records profile for RC holes
• Geochemistry profiles along RC holes
Aquifer definition is outlined in Table 5.4.
Table 5.2 Aquifer Definition (AMEC 2011)
Aquifer Type Assumed average thickness (m)
Geological/Granulometric Description
D
ep
th
I Unconfined 4.5 Sand, salts, caliche, clays
II Unconfined/ Partially Confined
36 Medium to coarse sand
II Confined 55* Medium to coarse sand and gravels
* Considering the length of the drill hole as the maximum depth
Rodinia carried out a 140 hole auger drilling campaign. Prompt flooding of the auger holes for sampling occurred in almost all holes indicating the presence of water-bearing strata.
Water-table depth was registered in some RC drill holes; however, due to the sampling interval (6m) and the fact that water had to be injected in the first metre of drilling for some holes, precision of the water-table depth is considered inaccurate by AMEC (2011).
The vertical grade distribution shows average concentrations close to 650 milligram per liter (mg/L) of lithium to about 6–18m depth, after which the lithium concentration decreases to an average of 450mg/L. At depths of 42–48m in the southeast and 60–66m in the northwest, the lithium concentration increases to an approximate average concentration of 550mg/L.
While the auger holes offered a good coverage of the first four meters, the RC holes were not sampled for the first 6–12m, limiting the assessment of any possible bias between these two sources of information and, also, the understanding of the influence of surface evaporation in the differentiation of Aquifers I and II.
With the preliminary information available at the time of this Report, Aquifer I was assumed to be separated from Aquifers II and III by an interpreted 3m-thick constant clay layer across the salar.
Clay layer intercepts were logged in various RC holes. The widest intercept of 24m with a predominant clay granulometry can be found in DRC-01 at 12 m depth; however, this intercept could not be correlated with similar intercepts in neighbouring drill holes. The presence of clays reported at analogous depths is not predominant in the 6m sampling interval, which means that the interpretation of a continuous clay layer between DRC-01 and the closest drill holes was not possible.
AMEC (2011) recommends that a smaller sample interval should be tested in a few selected holes to demonstrate if 6m provides sufficient resolution for the modelling of the geological and hydrogeological

NI 43-101 Technical Report – Sal de los Angeles Project, Salar de Diablillos Page 20
Raymond P. Spanjers ABERDEEN INTERNATIONAL INC. May 2016
parameters. The current grid spacing does not allow for establishment of a stratigraphic facies correlation between drill holes.
AMEC (2011) considers that the current interpretation is appropriate for the current level of geological knowledge, but as with most geological interpretations, more complexity will be recognized with the collection of more detailed information. It is possible that, rather than the interpretation of a single impermeable layer of constant thickness, Aquifers I and II are locally separated by the cross-bedding of impermeable and permeable layers.
5.3 Aquifer I
Lithological descriptions from auger holes, and the first 6m for some RC holes, indicate the presence of sand, salt, caliche (as calcium carbonate), borates and clay for Aquifer I. Granulometric appraisal was done visually by geologists. Detailed granulometric studies should be considered in future campaigns.
Based on the presence of surface water in some portions of the salar and the brine flows observed, especially in the auger holes, AMEC assumed a shallow and unconfined aquifer with a water table at between 1.5m and 5m.
5.4 Aquifer II
The primary lithology in Aquifer II is represented by stratified sand of fine to medium grain-size with occasional coarser grain size to gravel material, in a proportion from 55% to 90%. Finer grain size fractions such as clay and silt occur as secondary lithologies in some drill holes.
5.5 Aquifer III
The lithology of Aquifer III is similar to Aquifer II; however, the gravel proportion is higher towards the lower portion of the aquifer as shown in the geological logs of several drill holes.
The thickness of Aquifer III is unknown, since only two drill holes intercept the basement. For the purposes of the geological model, the shape of the surface that limits the basement was obtained from a gravity-survey model, but the model had to be translated down 60 m to accommodate the fact that brine was recovered until the bottom of all drill holes with the exception of DRC-10 and DRC-11. The surface was locally adjusted to honour the geological logging and brine recovery of those two drill holes to their basement intercepts.
The depth intercept for DRC-10 occurred at 49.5m; this drill hole is located towards the western margin of the basin, and the depth is consistent with the topographic relief. In DRC-11, sub-angular clasts of metamorphic rock were encountered at 240m, and the hole terminated in basement at 264m.
In the northern and southern extension of the basin beyond the limits of the salar on surface, the top of Aquifer III and potentially Aquifer II, are limited by the base of the alluvial fan gravels from which no brine was recovered.
5.6 Comment on Section 5.0
A substantial amount of work has been completed since the AMEC (2011) interpretation of three vertically distinct aquifers. It is the recommendation of the author to incorporate all the available data to reinterpret the basin stratigraphy and the potential host aquifers. In particular, incorporation of the diamond drill and seismic tomography results, both of which do imply a stratigraphic gradation with depth, but may not necessarily coincide with distinct confined aquifers.

NI 43-101 Technical Report – Sal de los Angeles Project, Salar de Diablillos Page 21
Raymond P. Spanjers ABERDEEN INTERNATIONAL INC. May 2016
6. Deposit Type (Item 8)
The NI 43-101 “Technical Report on Brine Resource Estimate, Salar de Diablillos Project, Salta Province, Argentina” (AMEC 2011) describes the deposit type. The following is excerpted from the AMEC 2011 Technical Report on Brine Resource Estimate.
Brine deposits form in evaporite-terrigenous depositional environments where brines have generally obtained lithium from geothermal waters. Most active and/or recent terrigenous-evaporite-depositional environments brines contain lithium in small concentrations, of which, three brine deposits were commercially exploited as of 2011: Salar de Atacama, Chile; Salar de Hombre Muerto in Argentina; and Clayton Valley, USA. These deposits have the following features in common:
• Brines are obtained from the porous strata under the surface of the playas
• Sedimentation and evaporation occurred within enclosed basins that generally form a regional topographic low with restricted outflow
• Proximity to lithium-containing hot springs (some extinct)
• Proximity to past volcanic activity
• Comparatively high levels of lithium in brine, all above 160 ppm Li
• High-altitude areas (>1,200 masl)
• Salt flats greater than 40 km2
• Low precipitation rates and arid climates
• Extreme weather conditions, including high wind conditions and daily/seasonal temperature variation.
The variation in lithium grade exhibited by these brine deposits varies from approximately 100 parts per million (ppm) (or mg/L) to 4,000 ppm at Clayton Valley and Atacama respectively. The average production grade at Atacama is approximately 1,500ppm Li. The Salar de Hombre Muerto has an average lithium grade of 521ppm, varying between 190ppm Li and 900ppm Li.
The Salar de Diablillos is a detrital salar. Substantial sediments were deposited from the southeast and north and cover most of the salar. According to the log descriptions of the shallow pits and RC drilling done by Rodinia, the upper 3-4m of the salar consists of some calcareous sediments and clays, and at depth, sands, gravels and clays. The maximum depth was reached by DRC-11, which intercepted the metamorphic basement (gneiss) clasts at 240m and continued into the basement to a final depth of 264m.

NI 43-101 Technical Report – Sal de los Angeles Project, Salar de Diablillos Page 22
Raymond P. Spanjers ABERDEEN INTERNATIONAL INC. May 2016
7. Exploration (Item 9)
Aberdeen has not conducted any exploration at Salar de Diablillos since it closed its acquisition of PLASA which owns the Sal de los Angeles Property. All exploration activities were carried out by Rodinia Lithium Inc. between 2009 and 2015. The description of exploration work below is based on AMEC (2011), SRK (2011) for work up to December 2011. Exploration work completed after December 2011 was provided by Aberdeen and summarized below.
Historic exploration prior to 2009 at the Salar de Diablillos has been limited to informal small-scale ulexite mining by local miners, and the exploration of the top 3–5 m of the salar that was conducted by Borax Argentina S.A.
Rodinia commenced exploration in 2009 during a due diligence evaluation prior to purchase of the Project. Since then, the following exploration programs have been conducted to evaluate the lithium potential:
• Surface sampling: Brine samples were collected from 140 shallow auger wells regularly distributed on the surface of the salar at approximately 300m by 300m spacing;
• Gravity survey: Ten lines were surveyed to model basement depth;
• Seismic survey:
• Reverse circulation (RC) drilling program: RC drilling was conducted to develop vertical profiles of brine chemistry and to provide geological and hydrogeological data at depth in the salar;
• Down-hole geophysical surveys;
• Flow monitoring program: Brine flow was monitored during drilling and during the flow of the artesian well;
• Diamond drilling (DD) program: XX diamond drill holes were drilled to help evaluate aquifer geology and matrix material; and
• Pumping test program: a pump test was performed on well site DPT-02.
7.1 Grids and Surveys
Rodolfo Moreno, an accredited surveyor from Salta, was contracted in 2010 by Rodinia to survey RC collars and to provide topographic contours for the property. The survey points were established by differential GPS. Location coordinates are provided using the Universal Transverse Mercator (UTM) system, WGS84 Zone 19 South.
Topographic contours have 1m accuracy and cover the full extent of the salar surface and the majority of the Project mineral tenure.
7.2 Geological Logging
Geological logging consistent with the industry standard is only available only for eight of the auger drill holes. Where auger drill hole collars were altered, or drill holes were terminated early due to the presence of a caliche layer, this information is also available. RC holes have a complete logging procedure that involves different aspects such as, primary and secondary lithology and granulometric facies, and other observations related to brine flow.

NI 43-101 Technical Report – Sal de los Angeles Project, Salar de Diablillos Page 23
Raymond P. Spanjers ABERDEEN INTERNATIONAL INC. May 2016
7.3 Geochemistry
Chemical analyses from a regularly-spaced grid of auger holes indicate a concentric gradation of lithium grade decreasing from the salar nucleus outwards. Figure 7.1 shows the lithium concentration greater than 800 mg/L in the salar nucleus.
Figure 7.1 Interpolation Map of Lithium Concentrations from Auger Samples
7.4 Geophysical Surveys
7.4.1 Borehole Geophysical Logging
Wellfield Services Ltda (Wellfield) conducted the borehole geophysical characterization for six RC drill holes for Rodinia. Down-the-hole geophysical logging is available for drill holes DRC-07, DRC-08R, DRC-11, DRC-13, DRC-14 and DRC-16 (Figure 7.2). The figure is included because it gives an indication of the relative porosity and density changes that may be expected with drill hole depth.
Average total resistivity from the neutron–neutron logs indicates minimum and maximum values of 29% and 47% for total porosity. Density values ranged between 1.9 grams per cubic centimeter (g/cm3) and 2.7g/cm3 for the brine.
The neutron logging tool records neutron absorption which can be correlated to the hydrogen content in soil. Factors which can affect the log, and which require the instrument to be appropriately calibrated, include hole diameter, fluid characteristics, presence of chlorides or salt water, presence of hydrogen atoms in the lithologies downhole (for example in clays, gypsum). No information on the post-processing corrections applied to the logging data was available to AMEC at the effective date of this Report. AMEC notes that there were partial collapses of the walls of some of the drill holes noted during the geophysical logging, and therefore drill hole diameters may not be accurate.
As a result for the purposes of this Report, these geophysical logs can only be used in AMEC’s opinion to assess relative changes in the total porosity and density along the drill holes because the calibration documentation that typically accompanies such logging was not available to AMEC. AMEC recommends that the appropriate calibration documentation be obtained from Wellfield, the geophysical consultant used for the logging.
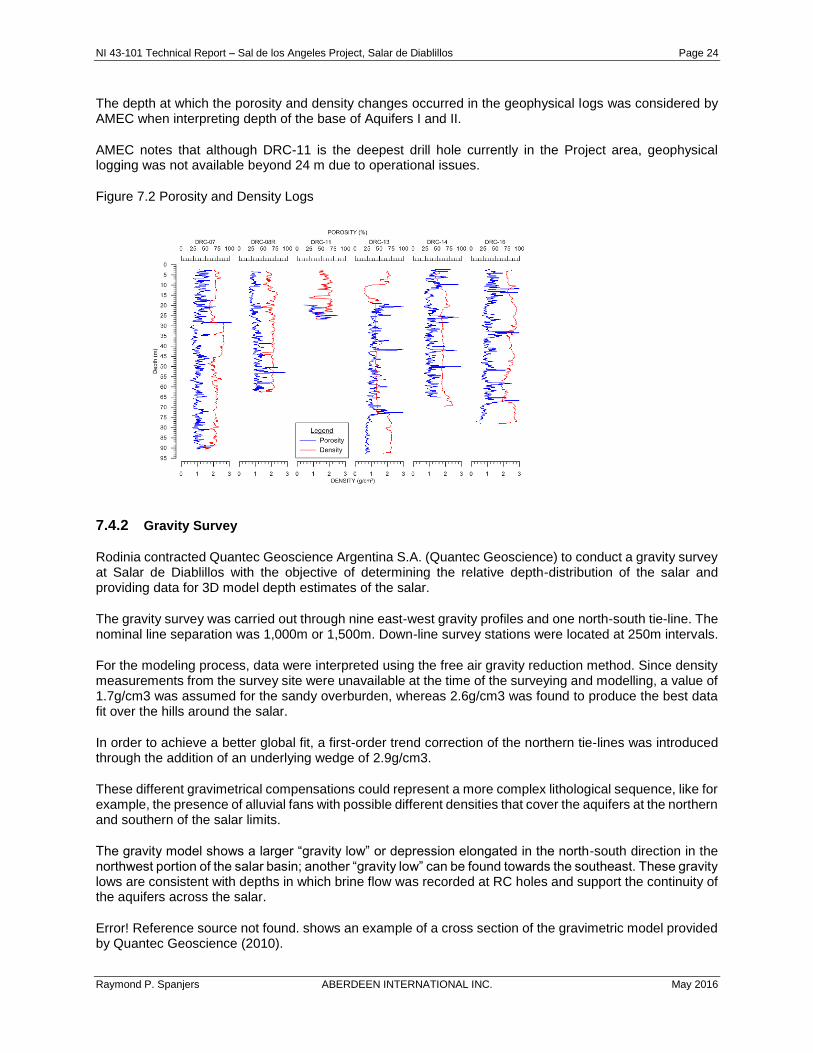
NI 43-101 Technical Report – Sal de los Angeles Project, Salar de Diablillos Page 24
Raymond P. Spanjers ABERDEEN INTERNATIONAL INC. May 2016
The depth at which the porosity and density changes occurred in the geophysical logs was considered by AMEC when interpreting depth of the base of Aquifers I and II.
AMEC notes that although DRC-11 is the deepest drill hole currently in the Project area, geophysical logging was not available beyond 24 m due to operational issues.
Figure 7.2 Porosity and Density Logs
7.4.2 Gravity Survey
Rodinia contracted Quantec Geoscience Argentina S.A. (Quantec Geoscience) to conduct a gravity survey at Salar de Diablillos with the objective of determining the relative depth-distribution of the salar and providing data for 3D model depth estimates of the salar.
The gravity survey was carried out through nine east-west gravity profiles and one north-south tie-line. The nominal line separation was 1,000m or 1,500m. Down-line survey stations were located at 250m intervals.
For the modeling process, data were interpreted using the free air gravity reduction method. Since density measurements from the survey site were unavailable at the time of the surveying and modelling, a value of 1.7g/cm3 was assumed for the sandy overburden, whereas 2.6g/cm3 was found to produce the best data fit over the hills around the salar.
In order to achieve a better global fit, a first-order trend correction of the northern tie-lines was introduced through the addition of an underlying wedge of 2.9g/cm3.
These different gravimetrical compensations could represent a more complex lithological sequence, like for example, the presence of alluvial fans with possible different densities that cover the aquifers at the northern and southern of the salar limits.
The gravity model shows a larger “gravity low” or depression elongated in the north-south direction in the northwest portion of the salar basin; another “gravity low” can be found towards the southeast. These gravity lows are consistent with depths in which brine flow was recorded at RC holes and support the continuity of the aquifers across the salar.
Error! Reference source not found. shows an example of a cross section of the gravimetric model provided by Quantec Geoscience (2010).

NI 43-101 Technical Report – Sal de los Angeles Project, Salar de Diablillos Page 25
Raymond P. Spanjers ABERDEEN INTERNATIONAL INC. May 2016
7.4.3 Hydrogeology
A surface water monitoring program was initiated in late 2010 to record the flow and chemistry of surface water in the Salar de Diablillos. Measurements were taken for each 6 m interval in the RC drilling and auger holes for pH, conductivity and temperature.
Flow rates in RC drilling at a 6 m support were quantified by Rodinia’s geologists through the record of the time of filling of 18 litre-buckets with brine from the cyclone; these measurements were taken in seconds and, then recalculated to obtain the final litres per minute flow rate figure.

NI 43-101 Technical Report – Sal de los Angeles Project, Salar de Diablillos Page 26
Raymond P. Spanjers ABERDEEN INTERNATIONAL INC. May 2016
Figure 7.3 Gravity Model Section 7,206,500 N
7.4.4 Seismic Survey
In June 2011 Rodinia contracted Geophysical & Exploration Consulting S.A. (GEC) to conduct a seismic tomography survey over the Salar de Diablillos claims. A total of 52 line km were surveyed between June 2011 and December 2011. The field survey was operated and supervised by D. Aguado (Geophysical Operator / Party Chief) / GEC and data processing and the final interpretation were carried out by S. Bölling (Senior Geophysicist) / GEC. Final reports were produced by March 2012.
The main survey objective is the identification and detailed definition of the bedrock basement boundary. Further purposes of the survey are to map geologic stratigraphy and structure relative to the occurrence of lithium brine, identify layers that are thought to be representative of lithium-bearing brine and to provide any additional information or interpretations regarding subsurface geology conditions or characteristics of surficial material (lithology, faults, weak or weathering zones, depression zones, etc.).

NI 43-101 Technical Report – Sal de los Angeles Project, Salar de Diablillos Page 27
Raymond P. Spanjers ABERDEEN INTERNATIONAL INC. May 2016
Figure 7.4 shows the locations of the 12 seismic refraction tomography lines (light green lines) superimposed upon a Goggle Professional Earth satellite map. The map also shows the gravity survey grid (light blue lines) as well as the positions of the reverse circulation holes (DRC-01 to DRC-21) and the diamond drill holes (DDD-01 – DDD-07) in the Salar de Diablillos investigation area.
Figure 7.4 Seismic refraction tomography lines (light green lines), DRC and DDD drill holes superimposed on satellite imagery map
GEC - Geophysical Exploration & Consulting S.A. used the 24-bit GEODE3 Acquisition System to carry out refraction tomography surveys. The Geode seismic recorder is a seismic recording system that combines the Geometrics' traditional seismic recorders with the flexibility and convenience of a distributed system. It's ideal for refraction or reflection tomography surveys.
The Geode seismic modules house from 3 to 24 channels each, weigh only 3.6 kg and interconnect using inexpensive digital network cable. The Geode will run all day on a small 12 Volt battery and sleeps when not in use.
For light-duty applications, Geode can be run from a laptop to view, record, and process acquired data. The software interfaces to the Geode as a simple high-speed network device, eliminating the need for special drivers and cards.
The final seismic data processing sequences were carried out in the GEC office in Mendoza, Argentina. The processing sequences included the following main steps:
• Geometry editing,
• Shot and trace edit,
• Picking of travel times FIRST BREAKS (including trigger delay corrections),
• Calculation and fixing of refracted waves,

NI 43-101 Technical Report – Sal de los Angeles Project, Salar de Diablillos Page 28
Raymond P. Spanjers ABERDEEN INTERNATIONAL INC. May 2016
• Calculation of initial Velocity model,
• Correction of FIRST BREAKS,
• Delta-TV Inversion (initial model for WET Inversion)
• WET Inversion (final model),
• Depth value correction relative to the sea level of the earth’s surface,
• Plotting of results (depth-velocity sections),
• Interpretation.
The refraction tomography data processing was carried out with the Intelligent Resources Inc. Program package RAYFRACT 32.
The final interpretation of the seismic sections was based on the WET Inversion results, the regional geology information, the available drillhole information and the technical reports (PEA Technical report on the Diablillos Property / NI 43-101 on the Diablillos Property) compiled by SRK (2011) and AMEC (2011).
Considering the seismic velocity distributions (velocity range 600 m/s to 5.600 m/s) we defined the following layers for the interpretation:
1. Surficial Layers:
(1) Dry Alluvial Sediment Layer (600 – 1.600 m/s in some parts up to 2.000 m/s) principally detected over the extensive alluvial plains ascending to the north and south.
(2) Partially saturated Salar Crust Layer (600 m/s – 1.300 m/s) covering almost the entire Salar surface.
2. Intermediate sediment Layers:
(1) Sediment Layer I (below Salar Crust Layer): Sand & Gravels & Caliche & Clays (1.300 m/s –1.600 m/s). This layer seems to disappear below the alluvial plain areas.
(2) Sediment Layer II (below the Sediment Layer I): Fine to medium Sand (1.600 m/s – 2.200 m/s in some parts up to 2.400 m/s).
(3) Sediment Layer III (overlaying the Basement): Medium to coarse Sand & Gravels (2.200 m/s – 3.200 m/s).
Finer grain size fractions such as Clay & Silt (1.800 m/s – 2.200 m/s) in between the intermediate sediment sequences were also marked in parts of the sections although the confidence in this interpretation has to be improved due to the still existing ambiguities.
3. Rock Basement Layers:
(1) Top Basement Layer: Bedrock (e.g. Gneiss / Schist) highly weathered, fractured jointed, etc. (3.200 m/s – 4.400 m/s). The top of the rock basement is characterized by a seismic velocity of 3.200 m/s (depth of bedrock boundary).
(2) Sound Bedrock Layer: Seismic velocities higher than 4.400 m/s were interpreted as sound Bedrock (e.g. Gneiss / Schist).
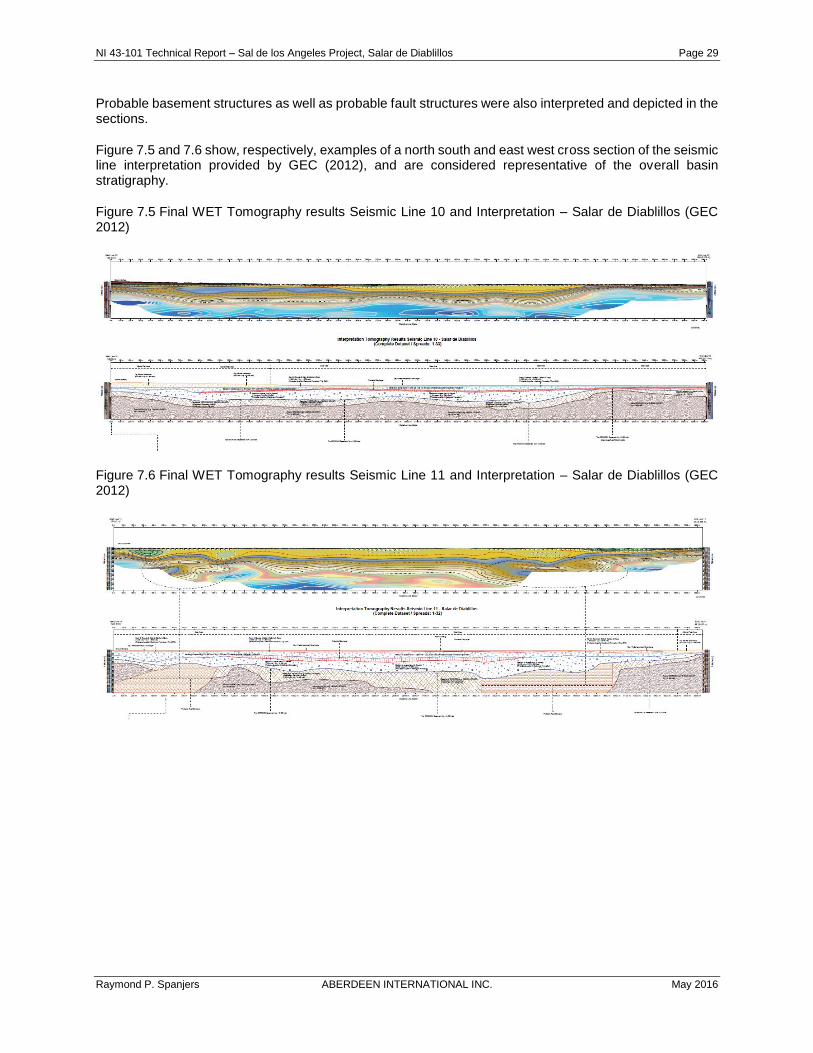
NI 43-101 Technical Report – Sal de los Angeles Project, Salar de Diablillos Page 29
Raymond P. Spanjers ABERDEEN INTERNATIONAL INC. May 2016
Probable basement structures as well as probable fault structures were also interpreted and depicted in the sections.
Figure 7.5 and 7.6 show, respectively, examples of a north south and east west cross section of the seismic line interpretation provided by GEC (2012), and are considered representative of the overall basin stratigraphy.
Figure 7.5 Final WET Tomography results Seismic Line 10 and Interpretation – Salar de Diablillos (GEC 2012)
Figure 7.6 Final WET Tomography results Seismic Line 11 and Interpretation – Salar de Diablillos (GEC 2012)

NI 43-101 Technical Report – Sal de los Angeles Project, Salar de Diablillos Page 30
Raymond P. Spanjers ABERDEEN INTERNATIONAL INC. May 2016
8. Drilling (Item 10)
Aberdeen has not conducted any drilling at Salar de Diablillos since it closed its acquisition of PLASA which owns the Sal de los Angeles Property. All drilling activities were carried out by Rodinia Lithium Inc. between 2009 and 2015. The description of exploration work below is based on AMEC (2011), SRK (2011) for the majority of work up to December 2011. The remainder of the drilling and any additional drilling completed after December 2011 was provided by Aberdeen and summarized below.
Rodinia completed several drilling campaigns on the Project between 2009 and 2012 comprising 140 auger drill, 21 reverce circulation (DRC) holes, 7 diamond drill (DDD) holes, 7 observation wells (DCO), 5 pump test wells (DPT), 1 production sized well (DPP), 2 piezometer wells (DPZ) and 1 fresh water well. A total of 6,298.45 m were drilled on the Project during the period (Table 8.1). Figure 8.1 shows the drill hole locations, with the exception of the auger drill hole locations.
Table 8.1 Drilling Summary (Rodinia 2009-2012)
Company Year Drill Hole
Coordinates (UTM WGS84) Elevation
(m) EOH (m)
Drill Type
Easting Northing
Rodinia 2009–2010
D-A-02 to 145
140 492.45 3.8 Auger
Rodinia 2010 DRC-1 726,084 7,206,359 4,037 120 RC
Rodinia 2010 DRC-2 725,298 7,206,655 4,037 155 RC
Rodinia 2010 DRC-3 727,738 7,204,214 4,039 113 RC
Rodinia 2010 DRC-4 727,211 7,207,068 4,038 114 RC
Rodinia 2010 DRC-5 728,606 7,205,378 4,039 48 RC
Rodinia 2010 DRC-6 729,408 7,204,183 4,039 81 RC
Rodinia 2010 DRC-7 728,680 7,203,155 4,039 101 RC
Rodinia 2010 DRC-8 729,066 7,202,098 4,042 N/A RC
Rodinia 2010 DRC-8R 729,165 7,202,008 4,043 71 RC
Rodinia 2010 DRC-9 725,902 7,204,243 4,039 71 RC
Rodinia 2010 DRC-10 725,062 7,204,939 4,038 60 RC
Rodinia 2010 DRC-11 725,838 7,201,651 4,060 264 RC
Rodinia 2010 DRC-12 727,412 7,208,115 4,042 71 RC
Rodinia 2010 DRC-13 727,377 7,209,553 4,058 164 RC
Rodinia 2010 DRC-14 725,885 7,208,039 4,027 125 RC
Rodinia 2010 DRC-15 725,903 7,209,408 4,053 122 RC
Rodinia 2010 DRC-16 728,387 7,207,023 4,038 106 RC
Rodinia 2011 DRC-12R 727,391 7,208,235 4,033 126 RC
Rodinia 2011 DRC-17 725,052 7,209,029 4,034 156 RC
Rodinia 2011 DRC-18 724,702 7,207,545 4,029 108 RC
Rodinia 2011 DRC-19 727,188 7,201,587 4,049 119 RC
Rodinia 2011 DRC-20 724,250 7,201,758 4,057 78 RC
Rodinia 2011 DRC-21 727,093 7,203,108 4,030 66 RC
Rodinia 2011 DDD- 01 727,682 7,208,715 4,050 206 DD
Rodinia 2011 DDD- 02 728,406 7,207,089 4,039 156 DD

NI 43-101 Technical Report – Sal de los Angeles Project, Salar de Diablillos Page 31
Raymond P. Spanjers ABERDEEN INTERNATIONAL INC. May 2016
Rodinia 2011 DDD- 03 728,382 7,207,087 4,039 102 DD
Rodinia 2011 DDD- 04 725,871 7,209,428 4,052 216 DD
Rodinia 2011 DDD- 05 725,880 7,208,068 4,038 162 DD
Rodinia 2011 DDD- 06 724,691 7,207,558 4,038 18 DD
Rodinia 2011 DDD- 07 726,078 7,206,417 4,038 252 DD
Rodinia 2011 DCO-01 728,355 7,207,086 4,039 96 RT
Rodinia 2011 DCO-02 728,382 7,207,103 4,039 89 RT
Rodinia 2011 DCO-03 726,079 7,206,434 4,038 252 RT
Rodinia 2011 DPT-01 728,357 7,207,110 4,039 54 RT
Rodinia 2011 DPT-02 728,382 7,207,112 4,039 96 RT
Rodinia 2011 DPT-03 726,077 7,206,443 4,037 252 RT
Rodinia 2012 DPT-04 728,707 7,205,455 4,038 297 RT
Rodinia 2012 DPT-04R 728,673 7,205,458 4,038 102 RT
Rodinia 2012 DPT-05 729,218 7,203,288 4,039 162 RT
Rodinia 2012 DCO-04 729,226 7,203,289 4,038 228 RT
Rodinia 2012 DCO-05 729,243 7,203,294 4,037 234 RT
Rodinia 2012 DCO-06 729,216 7,203,312 4,038 120 RT
Rodinia 2012 DCO-07 729,221 7,203,313 4,039 30 RT
Rodinia 2012 DPP-1 726,075 7,206,428 4,038 240 RT
Rodinia 2012 DPZ-1 730,830 7,201,239 4,041 102 RT
Rodinia 2012 DPZ-2 730,654 7,201,008 4,040 102 RT
TOTALS 191 holes 6,298.45 m
8.1 Auger Drilling
The auger holes were drilled by Rodinia’s own personnel. A gas-powered auger was used to drill the 2–3 m deep auger holes. A six-inch diameter auger blade was used for the first two metres of drilling and then downsized to a four-inch diameter auger blade for the final metre of drilling. A four-inch diameter plastic casing (Figure 8.2), perforated at the lower end was inserted into the hole to minimize caving of the hole prior to the water sampling.
The auger hole locations were selected on an approximately regular 300 m x 300 m grid spacing in the nucleus of the salar. Minor displacements from the theoretical grid location result from drilling difficulties caused by the presence of caliche layers. The objective of the auger campaign was to map lithium concentrations and brine chemistry near the surface, as well as subsurface water levels and surface geology.
8.2 Reverse Circulation Drilling
Compañia Argentina de Perforaciones S.A. (CAPSA), an independent drill contractor, was contracted to drill the RC holes. CAPSA used a T4W Ingersoll Rand rig with 8”, 6”, and 4½” drill pipe and tri-cone bits.
RC holes were drilled on an irregular and wider grid of approximately 1.5 x 1.5 km, with the objective of defining the margins of the salar and the depth extent of the brines. RC locations were selected to target the deeper portions of the salar based on the gravity survey results when made available.

NI 43-101 Technical Report – Sal de los Angeles Project, Salar de Diablillos Page 32
Raymond P. Spanjers ABERDEEN INTERNATIONAL INC. May 2016
The holes were located using a non-differential GPS unit, while RC holes were surveyed by Rodolfo Moreno, an accredited surveyor from Salta.
All drill holes are vertical; no down-the-hole deviations from the -90° dip were measured. No down-hole surveys were performed. Due to the shallow length of the drill holes and the fact that all drill holes are vertical, no significant deviations are expected.

NI 43-101 Technical Report – Sal de los Angeles Project, Salar de Diablillos Page 33
Raymond P. Spanjers ABERDEEN INTERNATIONAL INC. May 2016
Figure 8.1 Drill plan map for Salar de Diablillos showing reverse circulation (blue dots), diamond (red square), observation well (green diamond), pump test well (pink hexagon), piezometer wells (salmon oval), fresh water well (purple square) and production well (DPP)
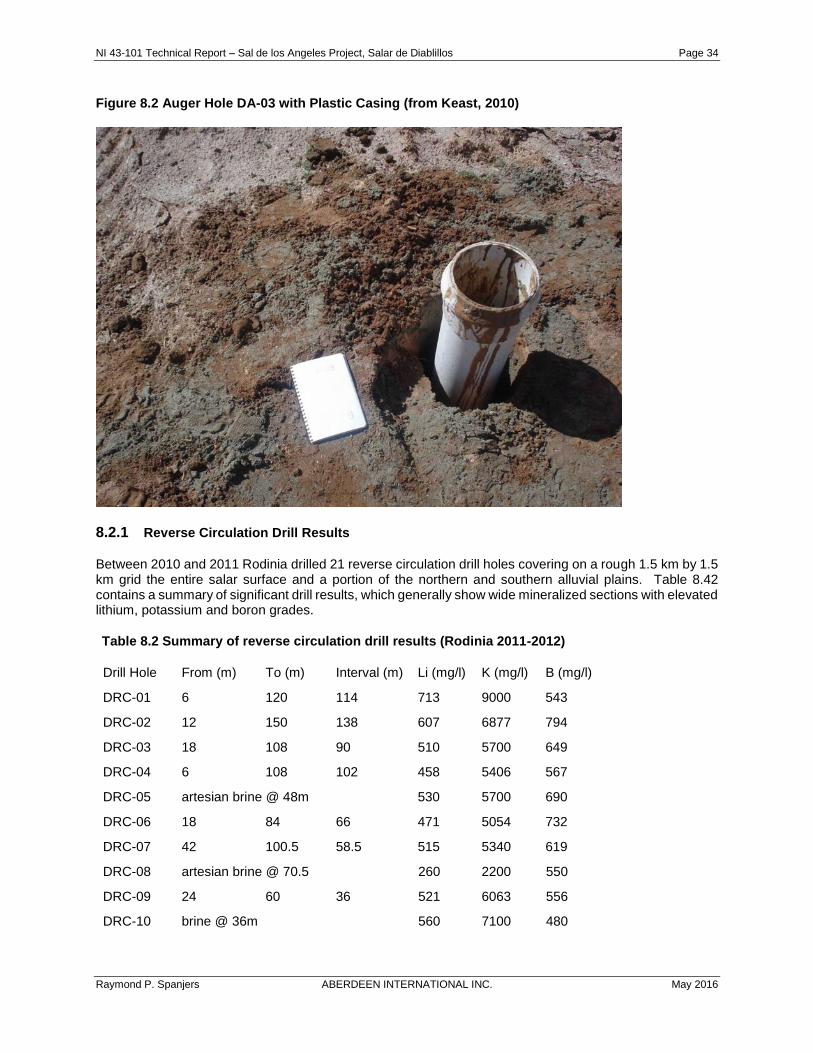
NI 43-101 Technical Report – Sal de los Angeles Project, Salar de Diablillos Page 34
Raymond P. Spanjers ABERDEEN INTERNATIONAL INC. May 2016
Figure 8.2 Auger Hole DA-03 with Plastic Casing (from Keast, 2010)
8.2.1 Reverse Circulation Drill Results
Between 2010 and 2011 Rodinia drilled 21 reverse circulation drill holes covering on a rough 1.5 km by 1.5 km grid the entire salar surface and a portion of the northern and southern alluvial plains. Table 8.42 contains a summary of significant drill results, which generally show wide mineralized sections with elevated lithium, potassium and boron grades.
Table 8.2 Summary of reverse circulation drill results (Rodinia 2011-2012)
Drill Hole From (m) To (m) Interval (m) Li (mg/l) K (mg/l) B (mg/l)
DRC-01 6 120 114 713 9000 543
DRC-02 12 150 138 607 6877 794
DRC-03 18 108 90 510 5700 649
DRC-04 6 108 102 458 5406 567
DRC-05 artesian brine @ 48m 530 5700 690
DRC-06 18 84 66 471 5054 732
DRC-07 42 100.5 58.5 515 5340 619
DRC-08 artesian brine @ 70.5 260 2200 550
DRC-09 24 60 36 521 6063 556
DRC-10 brine @ 36m 560 7100 480

NI 43-101 Technical Report – Sal de los Angeles Project, Salar de Diablillos Page 35
Raymond P. Spanjers ABERDEEN INTERNATIONAL INC. May 2016
DRC-11 60 264 204 536 5638 741
DRC-12 42 60 18 527 5867 603
DRC-12R 60 126 66 563 5810 694
DRC-13 108 163.5 55.5 649 7011 677
DRC-14 54 120 66 629 7600 491
DRC-15 60 114 54 612 6082 582
DRC-16 artesian brine @ 76m 600 6700 710
and artesian brine @ 106.5m
600 6700 700
DRC-17 48 156 108 640 6631 688
DRC-18 54 108 54 647 7056 739
DRC-19 48 54 6 350 1900 510
DRC-20 72 78 6 140 1300 410
DRC-21 No significant values
8.3 Diamond Drilling
A total of 7 diamond drill holes were drilled by Rodinia between June 2011 and September 2011. Major Drilling S.A. was contracted to perform the diamond drilling. All seven of the diamond drill holes were collared at sites used previously for reverse circulation drill holes. The purpose of this was to confirm the stratigraphy of these locations to match the indicative flow rates achieved by airlifting the brine at defined intervals, as well as the brine grade and chemical composition.
Diamond drill results were also used to aid in seismic tomography interpretation, in particular the basement contact, as two of these diamond drill holes intersected the basement lithology. In some cases, diamond drill holes also serve as observation or monitoring wells for pump tests, as is the case with DDD-02 and DDD-03, which were both drilled on the DRC-16 sites where pump tests were performed by SRK in 2011.
Diamond drilling generally shows (Table 8.3) a consistent basin fill grading from upper sandy layers, with some interbedded clays, to coarser grained gravels towards the basement contact. In some instances the basal stratigraphy is composed of abundant angular rock fragments most probably derived directly from the underlying basement rocks. Basement rocks appear to be either metamorphic schists or phyllites.
Table 8.3 Summary of diamond drilling results (Rodinia 2011)
Drill Hole From (m)
To (m) Interval (m)
Dominant Lithology
Secondary Lithology
DRC Location
DDD-01 0 84 84 Sand Gravel DFWH
DDD-01 84 157.5 73.5 Gravel Sand DFWH
DDD-01 157.5 187.5 30 Rock Fragments Gravel DFWH
DDD-01 187.5 205.5 18 Basement Schist (fractured) DFWH
DDD-02 0 36 36 Sand Clay DRC-16

NI 43-101 Technical Report – Sal de los Angeles Project, Salar de Diablillos Page 36
Raymond P. Spanjers ABERDEEN INTERNATIONAL INC. May 2016
DDD-02 36 51 15 Sand Gravel DRC-16
DDD-02 51 100.5 49.5 Gravel Sand DRC-16
DDD-02 100.5 156 55.5 Basement Schist DRC-16
DDD-03 No recovery – drilled in same drill location as DDD-03 DRC-16
DDD-04 0 136.5 136.5 Sand Gravel DRC-15
DDD-04 136.5 168 31.5 Gravel Sand DRC-15
DDD-04 168 216 48 Basement Phyllite (fractured) DRC-15
DDD-05 0 27 27 Sand Clay DRC-14
DDD-05 27 162 135 Sand Gravel DRC-14
DDD-06 0 18 18 Clay Sand DRC-18
DDD-07 0 99 99 Clay Sand DRC-01
DDD-07 99 115.5 16.5 Sand Clay DRC-01
DDD-07 115.5 177 61.5 Sand Gravel DRC-01
DDD-07 177 204 27 Gravel Sand DRC-01
DDD-07 204 237 33 Rock Fragments Gravel DRC-01
DDD-07 237 249 12 Basement Schist (fractured) DRC-01
DDD-07 249 252 3 Basement Schist (fresh) DRC-01
8.4 Pump Tests
This section is based on excerpts from “NI 43-101 Technical Report, Preliminary Economic Assessment, Salar de Diablillos Project” (SRK 2011).
SRK assisted Rodinia with drilling and construction of a set of wells near the site of DR-16 in June and July of 2011, and with testing of the wells in August and September. The goals of the drilling and the pumping test program were to:
• More precisely characterize the sedimentology and stratigraphy of the basin-fill deposits;
• Quantify hydraulic conductivity and storativity (K and S) of the basin sediments;
• Estimate K and S of the fractured upper part of bedrock;
• Estimate specific yield (Sy) of the shallow sediments (if possible with the given pumping conditions); and
• Estimate in-situ effective porosity (ne) of the aquifer sediments.
8.4.1 Drilling and Well Construction
Drilling by Rodinia through mid-2011 was mostly by RC-air (AMEC, 2011) and RC-mud drilling, and some core drilling with poor recovery. As a consequence, detailed stratigraphy has yet to be described with confidence in any hole, and very little clay, as distinct beds, has been described. Cuttings and recovered core are dominated by sand and gravel at all locations. The deepest extents of the basin have not yet been

NI 43-101 Technical Report – Sal de los Angeles Project, Salar de Diablillos Page 37
Raymond P. Spanjers ABERDEEN INTERNATIONAL INC. May 2016
drilled, although there is some indication that in general, finer sandy fill overlies coarser gravel-dominated sediments at depth. The sediments are unconsolidated and all holes tend to collapse without heavy mud to keep them open. The presence of some laterally-extensive clay beds beneath the salar surface is expected, based on the broad surficial muds occupying the current center of the salar. AMEC (2011) reported that the basin-fill sediments beneath Salar de Diablillos constitute three separate aquifers. However, their drilling results included evidence of a discontinuous aquitard only between their uppermost and middle aquifers, and no significant breaks in the sandy, gravelly stratigraphy of the middle and deep aquifers.
In June 2011 rotary drilling switched from reverse-circulation air-rotary to conventional mud rotary drilling, and this change apparently resolved many of the problems related to gas exsolution encountered in the previous campaign. The mud also helped to keep the boreholes open during drilling and well construction.
Standard wireline core drilling has not met with similar success. The diamond drillholes (through September) were PQ in size (a hole diameter of 123 mm), and a triple-tube recovery system was used in an effort to enhance core recoveries, which were nevertheless relatively low, especially in sandy and gravelly intervals. Low core recovery might be due in part to the restricted aperture of the bits used to accommodate the triple-tube coring. The gravelly portions of the sediments also impede the effective use of sand baskets to aid in recovery of loose materials.
Groundwater samples were collected during core drilling after first purging drilling fluids from the sampling interval. Groundwater sampling employed a heavy, 6m steel bailer on the wireline to purge the corehole at the various sample depths, a process observed to be slow and tedious, especially at greater depths. The bailing process also removed drilling mud from the coreholes, which, in some cases was helping to keep gas in solution. As a result, in some instances, the suction induced by pulling up the bailer caused de-gassing and consequent violent expulsion of gas, water, mud, wireline, and bailer. Recommendations were made to use a 1in PVC pipe and small air compressor to airlift-purge the coreholes.
Drilling and well construction at test site DRC-16 was based on the assumption of three semi-distinct aquifers, as described in AMEC (2011). The sedimentary sequence at DRC-16 was believed, based on interpretations of geophysical data, to be approximately 150 m deep. In fact, the basement contact was encountered at this location at a depth of 102 meters below grade (mbg – here and below, “grade” refers to the surface of a drilling pad constructed of imported fill, to a level of about 1 m above the dry lake bed); core and cuttings showed clayey sediments and caliche to a depth of 12 mbg, sand-dominated sediments to about 50 m, and sandy gravels below that depth. Based on that very general stratigraphy, SRK proceeded with tests based on an upper, or shallow, sand aquifer from surface to about 12 m; a middle sand aquifer from about 12 mbg to about 50 mbg; and a lower, or deep, sand aquifer from about 50 mbg to about 102 mbg.
Drilling for monitoring wells was done both by diamond-core and conventional mud-rotary drilling techniques. Conventional mud-rotary drilling was proceeded by pumping heavy drilling mud down the rods and up the borehole annulus. The available drillrig was not able to drive deep casing, however, this proved to be unnecessary. A blowout system was used at the wellhead to control discharges from de-gassing of the sediments; in most instances though, the heavy mud kept the gas under control.
Well construction in all drillholes was done in open holes, after the rods had been removed, relying on the mud to keep the holes open. Well screens were placed in open holes, without a filter sand, relying on the formation sands to collapse around and stabilize the well. Cement baskets were used above the screen intervals to support a solid seal of bentonite pellets. The borehole annuli were then grouted above the bentonite seal with a cement/bentonite slurry. The grout mixture contained a ratio of approximately 10 bags of clean Portland cement to 3 bags of bentonite powder and 1,800 litres of water.
SRK noted that a tremie pipe was not used for emplacement of either the bentonite chips or the cement grout; all materials were introduced into the borehole annuli from the surface, allowing gravity to work the materials into place. Although the drilling mud was more or less replaced with water before introduction of

NI 43-101 Technical Report – Sal de los Angeles Project, Salar de Diablillos Page 38
Raymond P. Spanjers ABERDEEN INTERNATIONAL INC. May 2016
the annular materials, SRK is concerned that in some instances the seals between the screen and the ground surface may have been imperfect, especially in the deeper well completions.
8.4.2 Monitoring Wells
Middle-sand monitoring well DC-01 was constructed in a nominal 6-inch rotary borehole drilled to a depth of 54 m. The well was completed with nominal 2-in, schedule-80 PVC screen from 42mbg to 12mbg. The actual length of the screen was not recorded, however, a tagline down the center of the casing encountered a solid floor at 42m. Solid 2-in, schedule-80 PVC casing extends from 12m to surface.
Deep-sand monitoring well DDD-03, was also constructed in a 6-in rotary borehole, and completed with 2-in schedule-80 box thread PVC screen from 96 to 54mbg, and solid casing from 54m to surface. Well construction, including use of a cement basket and emplacement of annular materials, as described above.
DDD-02 (deep-level, basement piezometer) was constructed in a PQ corehole. The basement piezometer was completed with 2-in schedule 80 PVC screen and casing inserted down the inside of the PQ core rods and shoe bit. A cement basket was included on the PVC sequence just above the screen interval. The screen was set from 154 to 102mbg; solid PVC extended to the surface. With the PVC string resting on the bottom of the corehole, the rods were retracted to a level above the screen interval, so that the cement basket opened into the open corehole. Bentonite pellets were gravity-fed down the PQ rods to form a seal above the cement basket. Cement grout was then pumped down the rods to fill the annular space above the seal.
A fourth monitoring well, DC-02, was drilled at site DR-16 to be used as an injection well for a tracer test in the sediments. DC-02 was drilled on a line between PT-02 and DDD-03, at a distance of 8m from PT-02. The screen interval of DC-02 was the same as that for DDD-03. The well was constructed by methods similar as those used for other monitoring wells, and airlift developed for two hours after the annular cement had set up.
8.4.3 Pumping Wells
The middle-sand pumping test well PT-01 was completed with 140 mm (4.5-inch) schedule 80 PVC screen from 52m to 12mbg. No 140 mm solid PVC casing was available at site, so additional PVC screen was run to surface, and wrapped with plastic. A cement basket was placed at 12 m, between the open screen and the sealed screen, and packed with granular bentonite upon installation. Approximately 5 more bags of granular bentonite were then poured into the annular space to fill to surface. The remaining hole around the lower, open screen was allowed to collapse around the well.
PT-02, the deep-sand pumping test well, was constructed with 162 mm (6.375-in) PVC screen and casing. Screen was emplaced from 89 to 47mbg (mechanical and hole conditions precluded a deeper screen placement). A nominal 6-in cement basket was fastened to the casing string at 47 m, and bentonite was placed around the cement basket upon installation. Thirty additional bags of bentonite chips were poured from surface around the annular space of the well, followed by the addition of cement bentonite grout to the surface.
8.4.4 Well Development
All pumping and monitoring wells were airlift developed to remove drilling mud and to help the formation materials to collapse around the well screens. Pressure transducers were used in each development to capture hydraulic data for preliminary analysis of hydraulic properties. Water samples were collected by Rodinia from the deep-sand monitoring well only. Static water levels were measured in each monitoring well one day after well development.
During development of the middle-sand monitoring well DC-01, grout was seen to be seeping out around the annular seal at the surface. Airlifting rates were high, approximately 70 liters per minute (L/min),

NI 43-101 Technical Report – Sal de los Angeles Project, Salar de Diablillos Page 39
Raymond P. Spanjers ABERDEEN INTERNATIONAL INC. May 2016
including discharge from both the well casing and from around the well annulus. The resultant airlift recovery data were used to estimate a preliminary hydraulic conductivity value of about 1.8 m/day. A static groundwater level was measured in DC-01 at 1.2m below top of casing (TOC). The casing is 0.65m above the top of grade, which in turn is about 1.0 m above the lake surface. The static water level, therefore, is just slightly above the surface of the lake bed (Table 8.54).

NI 43-101 Technical Report – Sal de los Angeles Project, Salar de Diablillos Page 40
Raymond P. Spanjers ABERDEEN INTERNATIONAL INC. May 2016
Table 8.4 Static Water Levels in Wells at the DR-16 Test Site
Basement piezometer DDD-2 was airlift developed at a rate of 5 L/min; recovery was slow. Both drawdown and recovery data collected during the airlift development were analysed. Graphical, Theis analyses yielded a K value in the fractured bedrock of about 0.01 m/day. The static water level in DD-02 is slightly higher than the top of casing; consequently there is artesian flow from the well, at a very low rate.
The deep-sand monitoring well DDD-3 was airlift developed at a sustained flow rate of about 90L/min, for 30 mins. After air was shut off, discharge of gas and water continued at about 40L/min for 45 minutes. During this process, a transducer recorded pressure changes deep in the well casing. An examination of the recovery data that were recorded after the transition from 70 L/min to 40 L/min indicated a possible K value in the range of about 4 m/day, however, subsequent numerical model results (next section) are considered much more reliable. The static water level is 2.6m below TOC, and slightly below the lake-bed surface (Table 8.54).
8.4.5 Hydrologic Testing
Two long-term pumping tests were conducted at the DRC-16 test wellfield, in the middle-sand and deep-sand pumping wells. The middle and deep tests included approximate 36- and 72-hour periods of pumping, respectively, followed by equivalent periods of recovery.
8.4.6 Middle-Sand Pumping Test: PT-01
Pumping of PT-01 was done by airlifting, using compressed air from the rotary drill rig, injected through an ad-hoq wellhead using 1-in high-pressure air hose. Air-water discharge was directed through a cyclone and then to a measuring tank via a lined ditch. The tank included a 90-degree, sharp-crested V-notch weir cut into the end, which was used to measure water discharge rates. The flow rate was also measured by stage-volume at the cyclone discharge, and averaged 8.0 L/s (127USgpm) through the 36 hour test. De-gassing of the groundwater induced by the pumping is thought to have contributed somewhat to the airlift rate.
The middle-sand pumping test was monitored in DDD-03, DDD-02, and DC-01, using data-recording transducers suspended on cables beneath the wellheads. The monitoring wells were initially sealed at the wellheads during the testing periods, in order to minimize de-gassing of groundwater in the monitoring well casings as pressures declined, which could obscure pressure changes during the tests. Midway through the pumping, the transducers were unsealed, with no unfavourable effects.
The discharge water was not channelled away from the test site, but allowed to pond on the lake bed around the well platform. It was thought that clay and caliche (logged at 12mbg) would prevent recirculation of the discharged water back into the formation. Unfortunately, drawdown in monitoring wells ceased at about 10 to 18 hours into the test, indicating that recharge was occurring at a rate equivalent to the pumping rate. It is most likely that the discharge water re-circulated to the formation, probably through unsealed boreholes and other construction-related irregularities in the hydrostratigraphy. The curve at DDD-02 “flat-lined” about

NI 43-101 Technical Report – Sal de los Angeles Project, Salar de Diablillos Page 41
Raymond P. Spanjers ABERDEEN INTERNATIONAL INC. May 2016
8 hours before the curve at DC-01, indicating that the pathway of recirculation was from the south, in the direction of DRC-16 (which did not fill with water) or at DDD-02 itself.
Drawdown curves for DC-01 and DDD-02 from the first 10 hours of the shallow pumping test were analyzed graphically, and provided preliminary K values of 3 to 12 m/day in the sediments. These values proved useful in preparing for the second pumping test and accompanying dye-tracer test.
8.4.7 Deep-Sand Pumping Test: PT-02
Pumping in PT-02 was initiated by airlifting, using compressed air from a portable air compressor, injected through a site-constructed wellhead using 1-in high-pressure air hose. The compressed air was turned off for a short time to see if the airlift pumping could continue entirely by way of degassing of the groundwater, but was re-initiated after a few hours when the discharge rate was seen to decline. Air-water discharge was directed again through a cyclone and then to a series of tanks, ending with a tank cut with a 90-degree, sharp-crested, V-notch weir (Figure 8.1). The flow rate was measured at the weir and at the cyclone discharge, and again averaged 8.0 L/s (127 USgpm) through the 76 hour pumping period.
Discharge water from the deep-sand pumping test was conveyed away from the test site using two sump pumps and a 6-in layflat hose. The water was discharged to the lake bed at a distance of 500m from the test site, and did not drain, on surface, back toward the test. Drawdown in monitoring wells showed no sign of recharge during the 76-hour pumping period.
The deep-sand pumping test was also monitored in DDD-03, DDD-02, and DC-01; and in DC-02, after injection of dye (see below). The monitoring wells were not sealed at the wellheads, except for DC-02, after dye injection. Drawdown and recovery curves for DC-01, DDD-02, and DDD-03 were analyzed numerically, as described in sections below.
8.4.8 Tracer Test
A dye-tracer test was conducted in the deep sediments during the 72-hour pumping test. The tracer test consisted of injection of a dye into a monitoring well close to the pumping well, and periodic sampling of the pumping discharge water to define the arrival time and dispersion of the dye. For the PT-02 test, a monitoring well (DC-02) was drilled specifically to inject the dye, because the existing monitoring well in the deep sediments (DDD-03), 25m away from PT-02, was too distant to ensure arrival of the dye in detectable quantities within a reasonable period of time.
The dye mixture consisted of 4.5 Kg (10 lbs) of fluoresceine powder mixed into 350 L of formation water (from DDD-03) for an initial concentration of 13,000 mg/L. From the 350 L batch of dye, standard solutions were prepared by diluting with formation water. Dye standards at concentrations of from 0.01 mg/L to 4.0 mg/L were prepared in glass vials (Figure 8.3) to be used in visual (black-light) comparison to discharge-water samples. Unfortunately, the extreme salinity of the brine caused chemical and/or surface reactions between the flouresceine and the dissolved and suspended constituents of the brine. As a result, part of the dye apparently flocculated by the second day, as seen in Figure 8.3 (the graininess in the photo is partly photographic but is also due to a physical separation of color).
A small centrifugal pump was used to inject the dye into DC-02, starting 8 hours after initiation of the pumping test. Injection took 14 minutes, after which the injection well was sealed. Samples of the discharge water were subsequently collected in glass sample bottles at regular intervals until the dye concentration obtained a steady, maximum level. The samples were evaluated visually under black light for relative concentrations of the dye; however, the actual concentrations observed were at the very low end of the range of dye-standard concentrations. Consequently, times could be estimated for initial arrival (t0), arrival of the maximum concentration (tmax), and arrival of the midpoint concentration (t50), however, the absolute concentrations could not be quantified. The arrival times for t0, tmax, and t50 were compared to type curves generated by a MODFLOW simulation of the test (see below) to estimate effective porosity and dispersivity values.
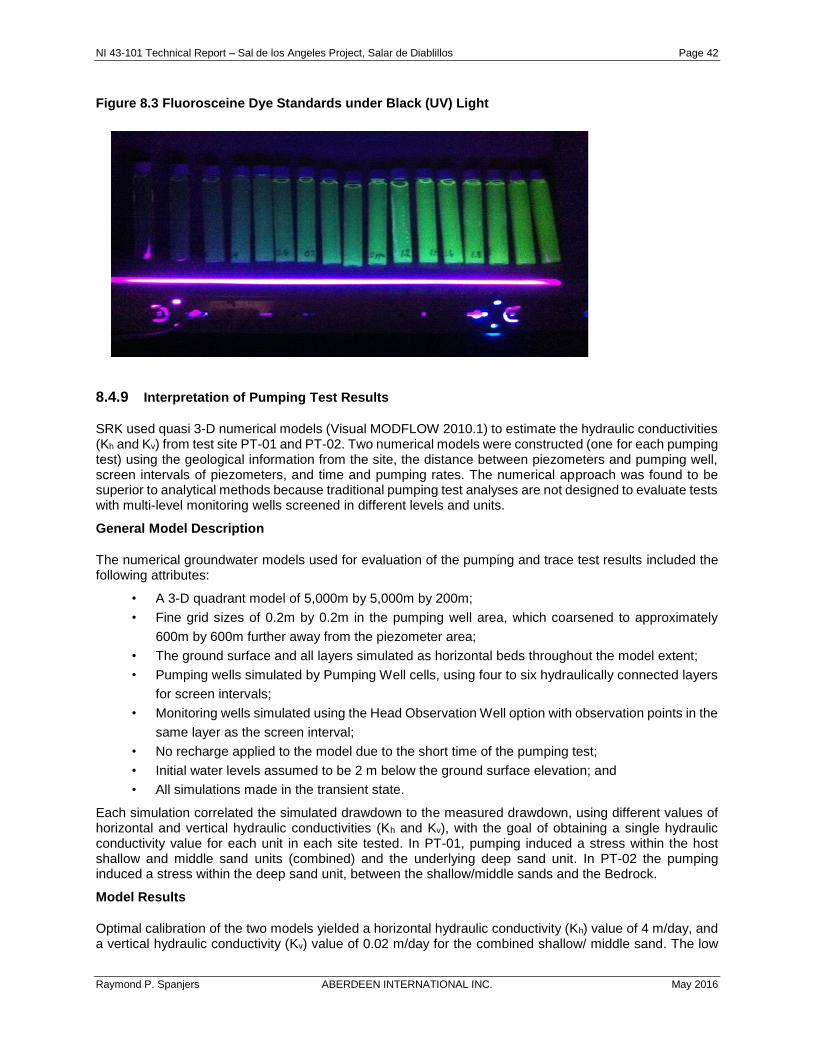
NI 43-101 Technical Report – Sal de los Angeles Project, Salar de Diablillos Page 42
Raymond P. Spanjers ABERDEEN INTERNATIONAL INC. May 2016
Figure 8.3 Fluorosceine Dye Standards under Black (UV) Light
8.4.9 Interpretation of Pumping Test Results
SRK used quasi 3-D numerical models (Visual MODFLOW 2010.1) to estimate the hydraulic conductivities (Kh and Kv) from test site PT-01 and PT-02. Two numerical models were constructed (one for each pumping test) using the geological information from the site, the distance between piezometers and pumping well, screen intervals of piezometers, and time and pumping rates. The numerical approach was found to be superior to analytical methods because traditional pumping test analyses are not designed to evaluate tests with multi-level monitoring wells screened in different levels and units.
General Model Description
The numerical groundwater models used for evaluation of the pumping and trace test results included the following attributes:
• A 3-D quadrant model of 5,000m by 5,000m by 200m;
• Fine grid sizes of 0.2m by 0.2m in the pumping well area, which coarsened to approximately
600m by 600m further away from the piezometer area;
• The ground surface and all layers simulated as horizontal beds throughout the model extent;
• Pumping wells simulated by Pumping Well cells, using four to six hydraulically connected layers
for screen intervals;
• Monitoring wells simulated using the Head Observation Well option with observation points in the
same layer as the screen interval;
• No recharge applied to the model due to the short time of the pumping test;
• Initial water levels assumed to be 2 m below the ground surface elevation; and
• All simulations made in the transient state.
Each simulation correlated the simulated drawdown to the measured drawdown, using different values of horizontal and vertical hydraulic conductivities (Kh and Kv), with the goal of obtaining a single hydraulic conductivity value for each unit in each site tested. In PT-01, pumping induced a stress within the host shallow and middle sand units (combined) and the underlying deep sand unit. In PT-02 the pumping induced a stress within the deep sand unit, between the shallow/middle sands and the Bedrock.
Model Results
Optimal calibration of the two models yielded a horizontal hydraulic conductivity (Kh) value of 4 m/day, and a vertical hydraulic conductivity (Kv) value of 0.02 m/day for the combined shallow/ middle sand. The low

NI 43-101 Technical Report – Sal de los Angeles Project, Salar de Diablillos Page 43
Raymond P. Spanjers ABERDEEN INTERNATIONAL INC. May 2016
Kv in the shallow/ middle sand in part reflects the presence of the clay/caliche aquitard at 12 mbg, which was not modeled discretely.
Deep sand values of Kh and Kv best calibrate at 4 m/day and 1 m/day, respectively. The numerical analysis of the pumping test results show the basement rocks to be of relatively low hydraulic conductivity, with calibrated Kh equal to Kv = 0.01 m/day.
Additionally, specific storage values of 1.0x10⁻⁵/m, 1.0x10⁻⁶/m, and 5.0x10⁻⁷/m were found, respectively, in the shallow/middle sand, deep sand, and basement rock units. Table 8.4 summarizes the results of the numerical analysis of the test data.
The calibrated deep-sand was used as a basis for tracer test analysis, which was carried out during the PT-02 pumping test. Because the samples collected at the recovery well contained dye in concentrations at the very low end of the range of visible dye concentrations, the goal of the analysis was to obtain dispersivity and effective porosity values using the initial arrival (t0) and arrival of the maximum concentration (tmax).
The tracer-test model simulation used the hydraulic conductivity (Kh, Kv) and specific storage (Ss) values obtained from numerical analysis of the pumping tests. Additionally, estimated specific yield (Sy) of 10% and 1% were assumed for sand units and bedrock, respectively. Results of the analysis include reasonable values of 15% for effective porosity and 15 m for dispersivity in the deep sand Unit.

NI 43-101 Technical Report – Sal de los Angeles Project, Salar de Diablillos Page 44
Raymond P. Spanjers ABERDEEN INTERNATIONAL INC. May 2016
Table 8.5 Summary of Test Results
8.4.10 Gas Exsolution
A peculiar characteristic of the Salar de Diablillos aquifer is that the groundwater locally contains a high concentration of dissolved gas. The composition of the odourless gas has not yet been analyzed; however, it is believed to be dominated by CO2. RC drilling at DRC-16 (Figure 8.4) and at several other locations encountered small amounts of exsolving gas at shallow depths, around 40 mbg. Gas exsolution increased to a violent, voluminous, and sustained outflow of gas (Figure 8.3) at depths of about 100 mbg. Early drilling, without mud, could not penetrate below that depth in some holes, due to the degassing.
It is important to note that the initial reports of very high artesian heads and strongly-flowing artesian wells were in fact describing wells and boreholes where water was being lifted out by rising gasses, as shown in Figure 8.4. Upward groundwater gradients and flowing-artesian conditions do exist at Diablillos, but much more subtly.
RC drilling (any airlift pumping) injects air at depth in the borehole; and that air rises and expands, entraining and lifting the water in the casing. As the air and water rise, it further lowers the pressure in the water column below, causing more groundwater, under hydrostatic pressure in the formation, to enter the casing and in turn to be “lifted” out of the well. In the case of the gaseous wells at Diablillos, the formation water that is drawn into the low-pressure borehole carries with it a high concentration of dissolved CO2. Upon encountering the low pressure of the borehole, the CO2 comes out of solution, forming bubbles. Just as with an engineered airlift, those bubbles rise and lift the water, causing more water to flow into the well. As long as CO2-rich groundwater is able to flow in at a rate that can keep pace with the water/gas mixture rising out of the well, the process will continue.

NI 43-101 Technical Report – Sal de los Angeles Project, Salar de Diablillos Page 45
Raymond P. Spanjers ABERDEEN INTERNATIONAL INC. May 2016
Figure 8.4 Airlift Effect at DRC-16
Source: Photo by SRK
The “gaseous zones” in DRC-16 and other wells most likely represent zones of higher hydraulic conductivity, from where groundwater can flow into the well at a high rate. In those zones, water lifted out of the well by the expanding and rising CO2 bubbles is quickly replaced by more CO2-saturated groundwater, so that a chain reaction of inflow, de-gassing, and “airlifting” becomes self-sustaining (e.g., a rapidly un-corked bottle of soda).
Lower-permeability strata above (and possibly below) may contain similar concentrations of CO2 under similar pressures, however, lower inflow rates result in less de-gassing, less airlifting, smaller decreases in water column pressure, and thus un-sustainable airlifts (comparable to a slowly un-corked bottle of soda).
Once the well is re-capped, the chain reaction described above is broken: de-gassing is suppressed under more or less hydrostatic confinement, inflow of water stops, and the well stabilizes. The reaction can also be stopped if the borehole collapses, as at DRC-8. In this case, the conduit for escaping groundwater is greatly restricted so that the de-gassing rate must also decrease.
The origin of the dissolved gas is not known, however, it does not appear to be evenly distributed beneath the Salar. Drilling in some locations has not encountered gas at concentrations high enough to be problematic. SRK currently assumes that the gas is of igneous origin, and enters the sediments through deep-seated structures cutting the floor of the basin. Consequently, greater concentrations (apparently) occur near the bedrock contact, and concentrations decrease upward as hydrostatic confining pressures decrease.

NI 43-101 Technical Report – Sal de los Angeles Project, Salar de Diablillos Page 46
Raymond P. Spanjers ABERDEEN INTERNATIONAL INC. May 2016
9. Sample Preparation, Analysis and Security (Item 11)
Aberdeen has not performed additional sampling. The sections below are taken directly from NI 43-101 “Technical Report on Brine Resource Estimate, Salar de Diablillos Project, Salta Province, Argentina” (AMEC 2011) and “NI 43-101 Technical Report, Preliminary Economic Assessment, Salar de Diablillos Project” (SRK 2011), for drilling performed by Rodinia between 2009 and 2010. The author has reviewed and confirmed the sample preparation, analysis and security described in this Section 9 and is of the opinion that procedures employed best industry practices.
9.1 Sampling Method and Approach
9.1.1 Auger Sampling (Rodinia 2009)
The auger sampling program was carried out between July–October 2009. Sampling was undertaken by Rodinia employees under the supervision of Todd Keast and William Randall. The auger holes were allowed to fill with brine for at least an hour from the upper aquifer level, and sediment to settle out, before a sample was taken.
The brine samples from the first eight auger drill holes were collected by Todd Keast during 2010, stored in tamper-proof containers, and marked with a unique sample number. The remaining 132 samples were collected by Rodinia personnel using the same procedure stated by Keast (2010). Two individual samples of 500 mL (A and B series) were collected from each site. One complete set of samples (Series A) was shipped to the ALS Laboratory Group Environmental Division (ALS), in Fort Collins Colorado, USA. The other set (Series B) was stored at Rodinia facilities in Salta, Argentina, as backup for future analysis.
9.1.2 Reverse Circulation Sampling (Rodinia 2010-2011)
RC drill sampling was more complex. A procedure established by Rodinia and TRU Group at Clayton Valley was implemented at Diablillos. The procedure establishes that brine and sediments samples are air lifted when possible. Injection of drilling fluids (water) is allowed only in the upper part of the hole until before the water table is intercepted; after that, only air was used so as to avoid dilution or contamination of the brines.
The brine (liquid) samples were taken after the drilling was stopped and the equipment lifted, allowing for the total flushing of the internal pipe until the brine appeared reasonably clean of sediment.
During AMEC’s December 2010 site visit, AMEC reviewed the site surface geology, as well as the drilling, drill-hole surveying, sampling, sample handling and procedures. Since at the time of the visit the RC drilling campaign was ongoing, not only the written procedures for previous campaign were reviewed, but also the actual sample handling and drilling for the for the latest two drill holes (RC-15 and RC-16) of the campaign in progress.
Drill holes were allowed to fill with water, and in cases where there was sufficient inflow, pumped out in order to rinse the hole and minimize the effect of material that may have fallen into the hole. The drill holes were then allowed to fill again for two hours from the aquifer below, and then a sampling device was lowered into the hole to collect the brine samples.
The unconsolidated material penetrated by the drill was recorded for each drill hole, and photographed.
For each RC drill hole, logs were completed including: lithology (primary and secondary), flow (measured as seconds per 18 litres), temperature, pH, specific gravity, electrical conductivity, decantation time, total dissolved solids (TDS) and operational conditions, among other observations such as brine colouration, and absence of flow. Brine and solids recovery were recorded.

NI 43-101 Technical Report – Sal de los Angeles Project, Salar de Diablillos Page 47
Raymond P. Spanjers ABERDEEN INTERNATIONAL INC. May 2016
Rock chips/sediments and brine were collected every 6m, or less when a noticeable change in the granulometry from visual inspection or consolidation occurred. However, if collected more frequently, the samples were combined into a 6m representative sample after geological logging. Solid samples were stored in plastic trays as shown in Figure 9.1.
Figure 9.1 Rock Chips/Sediments Sample Storage in the Warehouse in Salta, Argentina
Solids and liquid fractions were separated at the cyclone; no sieving was involved (Figure 9.2).
Figure 9.2 Cyclones at RC Drilling Platform
The liquid from the cyclone was allowed to stand for several minutes to let the small amount of sediments to settle out. The collected brine samples from the RC holes were also assayed at the Environmental Division of ALS Laboratory Group, in Fort Collins Colorado, USA.
9.1.3 Sample Security
Sample security during the drilling program relied upon the remote nature of the site and the fact that samples were locked at the warehouse at the camp and Salta.
Brine samples were stored in tamper-proof containers, which could not be opened without destroying the containers. Security seals have not been used at this point in the exploration campaign.

NI 43-101 Technical Report – Sal de los Angeles Project, Salar de Diablillos Page 48
Raymond P. Spanjers ABERDEEN INTERNATIONAL INC. May 2016
The B series samples were collected for future analysis and as a backup samples in case A series samples become damaged during transport. The B series of samples were stored at Rodinia storage facilities in Salta (Figure 9.3).
Figure 9.3 Brine Sample Containers Stored at Rodinia’s Warehouse
Solid rejects were bagged and labelled. At the time of preparation of this Report they were exposed to the open-air. AMEC recommended that they be stored at a warehouse at the Diablillos camp as soon as practicable (Figure 9.4).
AMEC did not identify any sample-security factors during the sampling process that would materially impact the accuracy and reliability of the results.

NI 43-101 Technical Report – Sal de los Angeles Project, Salar de Diablillos Page 49
Raymond P. Spanjers ABERDEEN INTERNATIONAL INC. May 2016
Figure 9.4 Rock Chips Rejects Waiting for Storage at Rodinia’s Warehouse
9.1.4 Density
Density measurements were taken in the field by Rodinia personnel using a hand-held densometer instrument. No information was available to AMEC on the procedures and quality assurance and quality control (QA/QC) measures used in this program.
Density measurements were also taken by geophysical logging. Until calibration data are available, AMEC considered that the density data were indicative only.
9.1.5 Comments on Section 9.1
In AMEC’s opinion, the sampling procedure, samples collected, and methods employed and approach were thorough, and provided sufficient information to support brine resource estimation at the time (for more information on the resource estimate refer to Section 4.1):
All collection and bagging of solid and brine samples were carried out by Rodinia personnel.
Sample collection and handling of cuttings was undertaken in accordance with industry
standard practices, with procedures to limit potential sample losses and sampling biases
No factors were identified within the drilling programs that could affect the reliability of the
sample data used for brine resource estimation.
Data was collected following industry-standard sampling protocols for brine deposits
There were no drilling or recovery factors identified that would materially impact the accuracy
and reliability of the drilling results. The samples collected were considered of sufficiently high
quality to provide unbiased results of the gross brine geochemistry
The size of the sampled areas was representative of the distribution and orientation of the
brines.
In the opinion of AMEC, the sampling methods were acceptable, met industry-standard practice, and were adequate for inferred brine resource estimation purposes.

NI 43-101 Technical Report – Sal de los Angeles Project, Salar de Diablillos Page 50
Raymond P. Spanjers ABERDEEN INTERNATIONAL INC. May 2016
AMEC recommended that:
A detailed granulometric analysis should be undertaken on the existing samples and for future
drilling campaigns
A smaller set of sample intervals at various interval spacings (1 m, 2 m, and 3 m, for example)
should be tested in a few selected drill holes and matched with corresponding 6 m sample
intervals from the same drill holes to demonstrate that the 6 m sample interval provides
sufficient resolution for the modelling of the geological and hydrogeological parameters
Documentation be collated and reviewed that can be used to support use of the density and
porosity data as collected
On selected drill holes, the down-hole geophysical log should be duplicated to provide a
measure of QA/QC on the logging performed.
9.2 Sample Preparation, Analyses and Security
9.2.1 Overview
One set of 500 mL brine samples, corresponding to 6m drill hole intervals or to the depth of an auger hole, was packaged and sent to ALS, in Fort Collins, Colorado, USA. ALS is an ISO 9001:2000-certified laboratory.
Samples were submitted to the laboratory with their drill hole identification depth. At ALS, a correlative number was provided. Because of this, control samples inserted by Rodinia as part of their QA/QC program were not blind to the analytical laboratory. ALS sample receipt records indicate the samples arrived in good condition with no apparent damage, except for some occasional leaks.
Based on the reports provided by ALS, samples were received at ambient temperature and were unpreserved. Prior to analysis, samples were filtered, but not digested.
Samples were assayed for barium, boron, calcium, iron, lithium, magnesium, potassium, silicon, silicon as SiO2, sodium, and strontium using trace inductively-coupled plasma (ICP) method 6010B and to SOP 834, Rev. 7. Details of the elements and detection limits are summarized in Table 9.1.

NI 43-101 Technical Report – Sal de los Angeles Project, Salar de Diablillos Page 51
Raymond P. Spanjers ABERDEEN INTERNATIONAL INC. May 2016
Table 9.1 Details of Assay Methods used by ALS
9.2.2 Comments on Section 9
The author is of the opinion that the sample preparation and analytical methods used by ALS are appropriate to the Project geochemistry.
NI 43-101 Technical Report – Sal de los Angeles Project, Salar de Diablillos Page 52
Raymond P. Spanjers ABERDEEN INTERNATIONAL INC. May 2016
10. Data Verification (Item 12)
This information was originally described in the NI 43-101 “Technical Report on Brine Resource Estimate, Salar de Diablillos Project, Salta Province, Argentina” (AMEC 2011). The author has reviewed the data and is of the opinion that the data collection generally followed industry best practices.
10.1 Quality Assurance/Quality Control Programs
Analytical quality was monitored through the use of blanks and two standard reference materials (SRMs). One SRM was certified, the second was not certified. QA/QC samples are typically blind-inserted into the sample stream and submitted to the analytical laboratories. However, assay certificates from ALS show that this was not originally the case, as samples were submitted to the laboratory with the drill interval marked for drill samples, and no interval if the samples were QA/QC samples. Subsequent to AMEC’s 2011 report blanks and standards were also labelled with marked drill intervals.

NI 43-101 Technical Report – Sal de los Angeles Project, Salar de Diablillos Page 53
Raymond P. Spanjers ABERDEEN INTERNATIONAL INC. May 2016
11. Mineral Process and Metallurgical Testing (Item 13)
While additional processing work has been completed, including on-site mineral processing test work related to bittern production and off-site work related to lithium carbonate production, it is beyond the scope of this report to include these results. The text below is taken from SRK (2011) and generally describes the Diablillos brine as being amenable to conventional evaporation based brine processing.
The existing process flow sheet examines the inflow brine chemistry shown in Table 11.1. This brine composition is based on brine sampling conducted during the Phase 1 drilling campaign completed by Rodinia in 2010 and 2011.
Table 11.1 Inflow Brine Chemistry
Element Parts per million (ppm)
Lithium (Li) 580
Sodium (Na) 51,000
Potassium (K) 7,200
Magnesium (Mg) 2,000
Calcium (Ca) 880
Chloride (Cl) 93,000
Sulfate (SO4) 8,600
Boron (B) 520
Carbonate (CO3) 100
Bicarbonate (HCO3) 880
Source: Rodinia, 2011
Subsequent tests have shown 10 to 20 ppm nitrogen, analyzed as nitrates and nitrites, to be present in the brine. This likely originates in nearby caliche deposits. Nitrates, for the purpose of this evaluation will be ignored because lithium nitrate is equally or more soluble than any other component in the chemistry. Nitrates do not present a problem in the production of carbonate.
11.1 Recovery Estimate Assumptions
The following constitute the principal bases and assumptions used to perform a material balance. The process described is not the only process to recover lithium values. The process has been simplified to present the understanding of the complexity and decision making needed during the operation of the solar ponds and the processing plants. Specific mineral processing assumptions include:
The brine analysis will be normalized for the purpose of the calculations;
B is treated as soluble =B2O4;
N is treated as NO3;
Cl (chloride) analysis is adjusted to make the anions equal to the cations;
After saturation of the brine, sulfate to chloride ratio is followed to determine which phase
diagram to follow;
Once saturation of the brine is reached by evaporation, halite will always be assumed to be
saturated and continue to precipitate even when a different phase diagram may be used to
follow the crystallization path;

NI 43-101 Technical Report – Sal de los Angeles Project, Salar de Diablillos Page 54
Raymond P. Spanjers ABERDEEN INTERNATIONAL INC. May 2016
During the initial brine concentration phase, magnesium carbonate is assumed to precipitate
as being the most insoluble components in the brine;
B as metaborate (=B2O4) will continue to be soluble until acidified in the boric acid recovery
phase; and
Most calculations are made as dimolar cations or anions. The majority of reference phase
diagrams are on a dimolar basis.
11.2 Significant Factors
The salar is at an elevation of approximately 4,000m (13,100 feet) with daily temperatures at night to be at or below freezing. Daytime temperatures vary in the single digits in the winter to 25 to 30 degrees Celsius in the summer. The variation of temperatures will have a serious effect on the crystallization of compounds as well as changing the dynamics of the phase diagram. Only after piloting the evaporation sequence will the process be defined.
Evaporation at the altitude of the salar is an advantage over evaporation at sea level due to the low atmospheric pressure. This will enhance evaporation at the lower diurnal temperatures at the salar.
Variation of the brine chemistry from the well field should have minimal instantaneous effect on the process and there will be significant averaging brine composition in the salt fields due to the volumes handled. Any major shift in brine chemistry will be identified by the sampling of the ponds during production and allow the operation to shift or divert flow to maximize recoveries of products as well as increase or decrease treatment flow.

NI 43-101 Technical Report – Sal de los Angeles Project, Salar de Diablillos Page 55
Raymond P. Spanjers ABERDEEN INTERNATIONAL INC. May 2016
12. Mineral Resource Estimate (Item 14)
The author is not aware of any current mineral resource estimates on the Property.

NI 43-101 Technical Report – Sal de los Angeles Project, Salar de Diablillos Page 56
Raymond P. Spanjers ABERDEEN INTERNATIONAL INC. May 2016
13. Mineral Reserve Estimates
The author is not aware of any current mineral reserve estimates on the Property.

NI 43-101 Technical Report – Sal de los Angeles Project, Salar de Diablillos Page 57
Raymond P. Spanjers ABERDEEN INTERNATIONAL INC. May 2016
14. Mining Methods (Item 16)
This section is not relevant to the Project as the author is not aware of any current mineral resource or reserve estimates.

NI 43-101 Technical Report – Sal de los Angeles Project, Salar de Diablillos Page 58
Raymond P. Spanjers ABERDEEN INTERNATIONAL INC. May 2016
15. Recovery Methods (Item 17)
This section is not relevant to the Project as the author is not aware of any current mineral resource or reserve estimates.

NI 43-101 Technical Report – Sal de los Angeles Project, Salar de Diablillos Page 59
Raymond P. Spanjers ABERDEEN INTERNATIONAL INC. May 2016
16. Project Infrastructure (Item 18)
This section is not relevant to the Project as the author is not aware of any current mineral resource or reserve estimates.

NI 43-101 Technical Report – Sal de los Angeles Project, Salar de Diablillos Page 60
Raymond P. Spanjers ABERDEEN INTERNATIONAL INC. May 2016
17. Market Studies (Item 19)
This section is not relevant to the Project as the author is not aware of any current mineral resource or reserve estimates.

NI 43-101 Technical Report – Sal de los Angeles Project, Salar de Diablillos Page 61
Raymond P. Spanjers ABERDEEN INTERNATIONAL INC. May 2016
18. Environmental Studies, Permitting and Social or Community Impact (Item 20)
This section is not relevant to the Project as the author is not aware of any current mineral resource or reserve estimates.

NI 43-101 Technical Report – Sal de los Angeles Project, Salar de Diablillos Page 62
Raymond P. Spanjers ABERDEEN INTERNATIONAL INC. May 2016
19. Capital and Operating Costs (Item 21)
This section is not relevant to the Project as the author is not aware of any current mineral resource or reserve estimates.

NI 43-101 Technical Report – Sal de los Angeles Project, Salar de Diablillos Page 63
Raymond P. Spanjers ABERDEEN INTERNATIONAL INC. May 2016
20. Economic Analysis (Item 22)
This section is not relevant to the Project as the author is not aware of any current mineral resource or reserve estimates.

NI 43-101 Technical Report – Sal de los Angeles Project, Salar de Diablillos Page 64
Raymond P. Spanjers ABERDEEN INTERNATIONAL INC. May 2016
21. Adjacent Properties (Item 23)
There are other brine-type deposits proposed for development or in production in the southern region of the Salta Province and northern region of the Catamarca Province. These brine deposits are in separate basins and not hydraulically connected to the Salar de Diablillos. There are no adjacent properties.
The Salar de Hombre Muerto is located approximately 40km west-southwest of the Salar de Diablillos. Hombre Muerto hosts the El Fenix Mine (a lithium carbonate production facility owned and operated by FMC) and the Tincalayu Mine (a sodium borate mineral mine operated by Rio Tinto Minerals). Galaxy Lithium plans development of the Sal de Vida Project, a lithium and potash extraction and recovery operation proposed in the central Salar de Hombre Muerto.

NI 43-101 Technical Report – Sal de los Angeles Project, Salar de Diablillos Page 65
Raymond P. Spanjers ABERDEEN INTERNATIONAL INC. May 2016
22. Other Relevant Data and Information (Item 24)
Lithium X is the current operator of the Sal de los Angeles Property. In order to earn an additional 30% of PLASA, for a total ownership of 80%, Lithium X is required to complete a Feasibility Study on the Property. As stated in a News Release dated March 3, 2016 Lithium X intends to complete an up-to-date mineral resource estimate and technical report done in accordance with current NI 43-101 and CIM standards within 180 days of the news release.

NI 43-101 Technical Report – Sal de los Angeles Project, Salar de Diablillos Page 66
Raymond P. Spanjers ABERDEEN INTERNATIONAL INC. May 2016
23. Interpretation and Conclusions (Item 25)
Based on the historical results and data generated by Rodinia Lithium Inc. between 2009 and 2012:
• The entire salar surface and a portion of the northern slope has been adequately covered by exploratory drilling on an approximate 1.5 km by 1.5km grid;
• The results of the drilling of 21 reverse circulation drill holes identifies distinct brine composition and grade at specific depth intervals, showing a relatively uniform distribution of lithium bearing brines throughout the basin;
• The lithium bearing brine appear to contain sufficient levels of lithium, potassium and boron to be potentially economic;
• The basin appears to deepen towards the northern half of the known extents;
• The deepening of the basin appears to coincide with higher grade drill intervals;
• The diamond drill holes were drilled on the same sites as some of the reverse circulation drilling, which allows future correlation of stratigraphy with brine composition and indicative flow-rates gathered from the RC drilling;
• The stratigraphy of the basin general consists of upper layers of sands with minor clays coarsening to gravels and rock fragments towards the basement contact;
• Seismic tomography surveys confirm a uniform stratigraphy of sand and gravels throughout the basin;
• Pump test performed by SRK show indications of high effective porosity and specific yield values in typical sand aquifers;
• Fresh water injection to the basin is primarily from the south east, from the Diablillos river;
All the data indicate a sizeable basin hosting lithium bearing brines within uniform aquifers with only minor clay horizons. Pump tests and geophysicial surveys indicate that these aquifers have favourable parameters for pumping using conventional wells.

NI 43-101 Technical Report – Sal de los Angeles Project, Salar de Diablillos Page 67
Raymond P. Spanjers ABERDEEN INTERNATIONAL INC. May 2016
24. Recommendations (Item 26)
The following recommendations define a Phase 1 budget for 2016. The findings of the Phase 1 recommendations will inform and define the next phase.
24.1 Phase 1: Resource Estimate
The initial recommendation is to complete a NI 43-101 compliant current mineral resource update, with the objective of attaining a high percentage of resources in the measured and indicated categories. In order to do so, the author recommends:
• Compiling all available data generated by Rodinia Lithium between 2009 and 2015;
• Complete additional interpretation of basin stratigraphy and geometry using all available data, weighted heavily on the high quality seismic tomography sections and the drill data;
• Complete additional pump tests at sites DRC-01, and another site with open drill holes on the northern alluvial slope;
• Characterize the hydrogeological properties of the determined stratigraphic units; and
• Compile all the information into appropriate models with the purpose of estimating contained mineral resources.
The budget for Phase 1 is estimated at $500,000.
24.2 Phase 2: Pre-feasibility Study or Feasibility Study
Upon successful completion of Phase 1, and should the resultant resource be of sufficient size and quality to warrant further studies, the author recommends completing a Prefeasibility Study or a Feasibility Study, depending on the quality of the processing data made available at the time.
An estimated budget for Phase 2 is approximately $2,500,000.

NI 43-101 Technical Report – Sal de los Angeles Project, Salar de Diablillos Page 68
Raymond P. Spanjers ABERDEEN INTERNATIONAL INC. May 2016
25. References (Item 27)
Alonso, R.N, 1986. Ocurrencia, posición estratigráfica y génesis de los depósitos de boratos de la Puna Argentina. Tesis doctoral. Universidad Nacional de Salta, 196 pp.
Alonso, R.N., 1991. Evaporitas Neógenas de los Andes Centrales. In J. J. Pueyo-Mur (ed.). Génesis de formaciones evaporíticas: modelos andinos e ibéricos, Barcelona, Universidad de Barcelona, 267-332.
Alonso, R.N., 2006. Ambientes Evaporíticos Continentales de Argentina. Temas de la Geología Argentina I (2), INSUGEO, Serie Correlación Geológica, 21:155-170
Alonso, R., Gutiérrez, R., Viramonte, J., 1984. Megacuerpos salinos cenozoicos de la Puna Argentina. IX Congr. Geol. Arg., Actas, I, 25-42.
AMEC, 2011, “Salar de Diablillos Project, NI 43-101 Technical Report on Brine Resource Estimate”, prepared for Rodinia Lithium, Inc., Project No. M40045, January 21.
Garrett, D.E., 2004. Handbook of Lithium and Natural Calcium Chloride: their deposits, processing, uses and properties. Elsevier Academic Press, 476 pp.
Groundwater Insight inc. 2010. Amended inferred resource estimation of lithium and potassium at the Cauchari and Olaroz salars, Jujuy province, Argentina,
Houston, J., 2006. “Evaporation in the Atacama Desert: An empirical study of spatio-temporal variations and their causes,” Journal of Hydrology, V 303, pp 402-412. March 30/
Houston, J., and Ehren, P., 2010. Technical report on the Olaroz project, Jujuy province, Argentina.
Houston, J et al 2011, “The Evaluation of Brine Prospects and the Requirement for Modifications to Filing Standards,” Economic Geology, V. 106, pp 1225-1239. May 30.
Isacks, B., 1988. Uplift of the Central Andes and bending of the Bolivian orocline. Jour. Geophys. Res., 284, 3211-3231.
Jordan, T., Alonso, R., 1987. Cenozoic stratigraphy and Basin Tectonics of the Andes Mountain, 20º-28º South Latitude. Am. Assoc. Petrol. Geologists, 71(1), 49-64.
Jordan, T.E., Gardeweg, M., 1989. Tectonic evolution of the late Cenozoic central Andes (20º-33ºS). In Z. Ben-Avraham (ed.). The evolution of the Pacific Ocean margins, Oxford University Press, 193-207.
Kasemann, S.A., Meixner, A., Erzinger, J., Viramonte, J.G., Alonso, R.N., and Franz, G., 2004. Boron isotope composition of geothermal fluids and borate minerals from salar deposits (central Andes/NW Argentina). Journal of South America Geosciences, 16, 685-697.
Keast, T., 2010: Technical Report on the Diablillos Property Salta Province, Argentina: technical report prepared by independent consultant Todd Keast dated March 22, 2010.
SRK, 2011: “NI 43-101 Technical Report, Preliminary Economic Assessment, Salar de Diablillos Project”, prepared for Rodinia Lithium Inc., December 22.
Turner, J.C., 1972. Puna. In A. Leanza (ed.). Geología Regional Argentina. Acad. Nac. Cien. Córdoba, 91-116.
Vandervoort, D.S., Jordan, T.E., Zeitler, P.K., Alonso, R.N., 1995. Chronology of internal drainage development and uplift, Southern Puna plateau, Argentine Central Andes. Geology, 23(2), 145-148.

NI 43-101 Technical Report – Sal de los Angeles Project, Salar de Diablillos Page 69
Raymond P. Spanjers ABERDEEN INTERNATIONAL INC. May 2016
Vázquez, N., 2011: Legal Opinion of Property Titles for Potasio y Litio de Argentina S.A. confidential letter prepared by Estudio J. Nicolas Vasquez Abogados for AMEC Internacional Ingeniería y Construcción Limitada, April 21, 2011.
Vinante, D., Alonso, R.N., 2006. Evapofacies del Salar del Hombre Muerto, Puna Argentina: Distribución y Genesis. Revista de la Asociación Geol. Arg. 61(2), 286-297.
Viramonte, J., Alonso, R., Gutiérrez, R., Argañaraz, R., 1984. Génesis del litio en los salares de la Puna Argentina. IX Congr. Geol. Arg., Actas, III, 471-481.
Worley Parsons, 2011, “ NI 43-101 Technical Report for: Preliminary Assessment and Economic Evaluation of the Sal de Vida Project, Catamarca & Salta Provinces, Argentina”, prepared for Lithium One, November 18.

NI 43-101 Technical Report – Sal de los Angeles Project, Salar de Diablillos Page 70
Raymond P. Spanjers ABERDEEN INTERNATIONAL INC. May 2016
26. Glossary
26.1 Abbreviations
The following abbreviations may be used in this report.
Table 26.1 List of Abbreviations
Abbreviation Unit or Term
A ampere
AA atomic absorption
A/m2 amperes per square meter
°C degrees Centigrade
CoG cut-off grade
cm centimeter
cm2 square centimeter
cm3 cubic centimeter
cfm cubic feet per minute
CRec core recovery
° degree (degrees)
dia. diameter
EIS Environmental Impact Statement
EMP Environmental Management Plan
g/L gram per liter
g-mol gram-mole
gpm gallons per minute
ha hectares
HDPE High Density Polyethylene
hp horsepower
ICP induced couple plasma
ID2 inverse-distance squared
ID3 inverse-distance cubed
IFC International Finance Corporation
kA kiloamperes
kg kilograms
km kilometer
km2 square kilometer
kt thousand tonnes
kt/d thousand tonnes per day
kt/y thousand tonnes per year

NI 43-101 Technical Report – Sal de los Angeles Project, Salar de Diablillos Page 71
Raymond P. Spanjers ABERDEEN INTERNATIONAL INC. May 2016
Abbreviation Unit or Term
kV kilovolt
kW kilowatt
kWh kilowatt-hour
kWh/t kilowatt-hour per metric tonne
L liter
L/sec liters per second
L/sec/m liters per second per meter
LoM Life-of-Mine
m meter
m2 square meter
m3 cubic meter
masl meters above sea level
mg/L milligrams/liter
mm millimeter
mm2 square millimeter
mm3 cubic millimeter
MW million watts
m.y. million years
NGO non-governmental organization
NI 43-101 Canadian National Instrument 43-101
OSC Ontario Securities Commission
% percent
ppm parts per million
QA/QC Quality Assurance/Quality Control
RC rotary circulation drilling
RoM Run-of-Mine
sec second
SG specific gravity
SRM Standard reference material
t tonne (metric ton) (2,204.6 pounds)
t/h tonnes per hour
t/d tonnes per day
t/y tonnes per year
W watt
XRD x-ray diffraction
y year

NI 43-101 Technical Report – Sal de los Angeles Project, Salar de Diablillos Appendices
Raymond P. Spanjers ABERDEEN INTERNATIONAL INC May 2016
Appendices
NI 43-101 Technical Report – Sal de los Angeles Project, Salar de Diablillos Appendix A-1
Raymond P. Spanjers ABERDEEN INTERNATIONAL INC May 2016
Appendix A: Certificate of Author
CERTIFICATE OF QUALIFIED PERSON
I, [Raymond Spanjers, as an author of this report entitled “NI 43-101 Technical Report – Salar de los Angeles Project – Salar de Diablillos – Salta Province, Argentina” dated May 2, 2016 and effective April 1, 2016 (the “Technical Report”), prepared for Aberdeen International Inc. (the “Issuer”) do hereby certify that:
1. I am a Consulting Geologist residing at 891 Ridge Vista Road, Gerton NC 25411
2. This certificate applies to the Technical Report.
3. I am a graduate of North Carolina State University with a M.Sc. in Geology. I am a Registered Professional Geologist in North Carolina (No.940) and Georgia (PG001875), USA. I am a Registered Member of the Society for Mining, Metallurgy and Exploration, Inc (SME) in the USA (No. 3041730RM). I have practiced my profession in mineral exploration, mining and mineral processing continuously since graduation. I have over 35 years of experience in mineral exploration, mining and mineral processing in a variety of commodities, including 15years in lithium brine and minerals.
4. I am familiar with National Instrument 43-101 – Standards of Disclosure for Mineral Projects (“NI 43-101”) and by reason of education, experience and professional registration I fulfill the requirements of a “qualified person” as defined in NI 43-101.
5. I visited the Salar de los Angeles Project on numerous occasions as Manager of Exploration for Rodinia lithium, Inc. My most recent visit in December 2012].
6. I am responsible for all sections of the Technical Report.
7. I am “independent” of the Issuer within the meaning of section 1.5 of NI 43-101. My compensation, employment or contractual relationship with the Issuer is not contingent on any aspect of the Report.
8. [I was the Manager of Exploration for Rodinia minerals , Inc. from 2010 to 2014
9. I have read NI 43-101 and the Technical Report has been prepared in compliance with NI 43-101.
10. As of the date of this certificate, to the best of my knowledge, information and belief, the Technical Report contains all scientific and technical information that is required to be disclosed to make the Technical Report not misleading.
Dated this 2nd day of May, 2016.

- A-2 -
Raymond P. Spanjers ABERDEEN INTERNATIONAL iNC May 2016
Raymond P. Spanjers [(seal/stamp)]
Raymond P. Spanjers, P.G.


![Los Angeles herald (Los Angeles, Calif. : 1900) (San ... · Los Angeles herald (Los Angeles, Calif. : 1900) (San Francisco) 1907-02-17 [p 10]](https://static.fdocuments.in/doc/165x107/5acba5097f8b9aa1518b6473/los-angeles-herald-los-angeles-calif-1900-san-angeles-herald-los-angeles.jpg)