NHTSA Light Vehicle Antilock Brake Systems Research ...
100
U.S. Department of Transportation National Highway Traffic Safety Administration August, 2000 Final Report NHTSA Light Vehicle Antilock Brake Systems Research Program Task 5, Part 1: Examination of Drivers’ Collision Avoidance Behavior Using Conventional and Antilock Brake Systems on the Iowa Driving Simulator
Transcript of NHTSA Light Vehicle Antilock Brake Systems Research ...

U.S. Department of Transportation
National Highway Traffic Safety Administration
August, 2000
Final Report
NHTSA Light Vehicle Antilock Brake Systems Research Program Task 5, Part 1:
Examination of Drivers’ Collision Avoidance Behavior Using Conventional and Antilock Brake Systems on the Iowa Driving Simulator

This publication is distributed by the U. S. Department of Transportation, National Highway Traffic Safety Administration, in the interest of information exchange. The opinions, findings, and conclusions expressed in this publication are those of the author(s) and not necessarily those of the Department of Transportation or the National Highway Traffic Safety Administration. The United States Government assumes no liability for its contents or use thereof. If trade or manufacturers’ names or products are mentioned, it is because they are considered essential to the object of the publication and should not be construed as an endorsement. The United States Government does not endorse products or manufacturers.
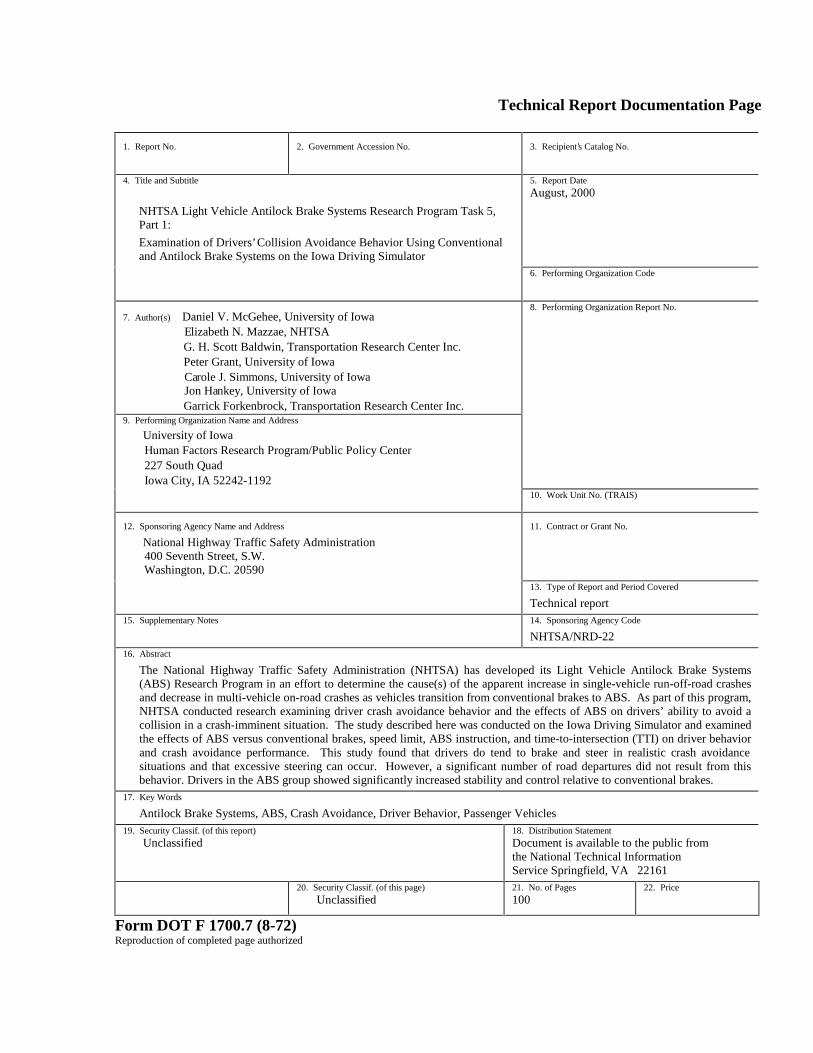
Technical Report Documentation Page
1. Report No. 2. Government Accession No. 3. Recipient’s Catalog No.
4. Title and Subtitle 5. Report Date
August, 2000
NHTSA Light Vehicle Antilock Brake Systems Research Program Task 5, Part 1:
Examination of Drivers’ Collision Avoidance Behavior Using Conventional and Antilock Brake Systems on the Iowa Driving Simulator
6. Performing Organization Code
7. Author(s) Daniel V. McGehee, University of Iowa Elizabeth N. Mazzae, NHTSA G. H. Scott Baldwin, Transportation Research Center Inc. Peter Grant, University of Iowa Carole J. Simmons, University of Iowa Jon Hankey, University of Iowa Garrick Forkenbrock, Transportation Research Center Inc.
9. Performing Organization Name and Address
University of Iowa Human Factors Research Program/Public Policy Center 227 South Quad Iowa City, IA 52242-1192
8. Performing Organization Report No.
10. Work Unit No. (TRAIS)
12. Sponsoring Agency Name and Address 11. Contract or Grant No.
National Highway Traffic Safety Administration 400 Seventh Street, S.W. Washington, D.C. 20590
13. Type of Report and Period Covered
Technical report 15. Supplementary Notes 14. Sponsoring Agency Code
NHTSA/NRD-22 16. Abstract
The National Highway Traffic Safety Administration (NHTSA) has developed its Light Vehicle Antilock Brake Systems (ABS) Research Program in an effort to determine the cause(s) of the apparent increase in single-vehicle run-off-road crashes and decrease in multi-vehicle on-road crashes as vehicles transition from conventional brakes to ABS. As part of this program, NHTSA conducted research examining driver crash avoidance behavior and the effects of ABS on drivers’ ability to avoid a collision in a crash-imminent situation. The study described here was conducted on the Iowa Driving Simulator and examined the effects of ABS versus conventional brakes, speed limit, ABS instruction, and time-to-intersection (TTI) on driver behavior and crash avoidance performance. This study found that drivers do tend to brake and steer in realistic crash avoidance situations and that excessive steering can occur. However, a significant number of road departures did not result from this behavior. Drivers in the ABS group showed significantly increased stability and control relative to conventional brakes.
17. Key Words
Antilock Brake Systems, ABS, Crash Avoidance, Driver Behavior, Passenger Vehicles 19. Security Classif. (of this report) 18. Distribution Statement
Unclassified Document is available to the public from the National Technical Information Service Springfield, VA 22161
20. Security Classif. (of this page) 21. No. of Pages 22. Price
Unclassified 100
Form DOT F 1700.7 (8-72) Reproduction of completed page authorized

TABLE OF CONTENTS
TABLE OF CONTENTS .............................................................................................................. .................................. ii
FIGURES ........................................................................................................................ ................................................ iv
TABLES......................................................................................................................... ................................................. v
1.0 INTRODUCTION.............................................................................................................. ...................................... 1
1.1 NHTSA’S LIGHT VEHICLE ABS RESEARCH PROGRAM......................................................................................... 1 1.2 HUMAN FACTORS STUDIES OF DRIVER CRASH AVOIDANCE BEHAVIOR ................................................................ 1 1.3 IOWA DRIVING SIMULATOR STUDY ....................................................................................................................... 3
2.0 LITERATURE REVIEW......................................................................................................................................... 4
2.1 MOTOR VEHICLE CRASHES ................................................................................................................................... 4 2.2 INTERSECTION CRASHES ....................................................................................................................................... 5 2.3 ANTILOCK BRAKE SYSTEMS.................................................................................................................................. 7 2.4 EMERGENCY AVOIDANCE BEHAVIOR .................................................................................................................... 9 2.5 LITERATURE REVIEW CONCLUSIONS .................................................................................................................... 23
2.5.1 Imminent Crash Avoidance Behavior .......................................................................................................... 23
3.0 METHODS AND PROCEDURE ............................................................................................................................ 26
3.1 APPARATUS ........................................................................................................................................................... 26 3.1.1 Iowa Driving Simulator ............................................................................................................................... 263.1.2 ABS Implementation ..................................................................................................................................... 263.1.3 Open Loop Bench Test................................................................................................................................. 263.1.4 Hardware Installation ................................................................................................................................. 313.1.5 Software Implementation ............................................................................................................................. 313.1.6 Video Instrumentation ................................................................................................................................. 36
3.2 SUBJECTS .............................................................................................................................................................. 38 3.3 EXPERIMENTAL DESIGN ........................................................................................................................................ 38 3.4 PROCEDURE .......................................................................................................................................................... 39 3.5 DEPENDENT VARIABLES........................................................................................................................................ 42
3.5.1 Videotape Analysis....................................................................................................................................... 43
4.0 RESULTS ................................................................................................................................................................ 44
4.1 OVERALL FINDINGS AND EFFECTS OF BRAKE SYSTEM ............................................................................................ 44 4.1.1 Initial Responses and Response Times ........................................................................................................ 444.1.2 Emergency Braking and Steering Responses............................................................................................... 454.1.3 Final Outcome ............................................................................................................................................. 48
4.2 EFFECT OF INSTRUCTION ....................................................................................................................................... 49 4.2.1 Initial Responses.......................................................................................................................................... 494.2.2 Emergency Steering and Braking Behavior................................................................................................. 494.2.3 Final Outcome ............................................................................................................................................. 49
4.3 EFFECT OF TTI ..................................................................................................................................................... 504.3.1 Initial Responses.......................................................................................................................................... 504.3.2 Emergency Braking and Steering Behavior................................................................................................. 504.3.3 Final Outcome ............................................................................................................................................. 51
4.4 EFFECT OF SPEED LIMIT ........................................................................................................................................ 51 4.4.1 Initial Responses.......................................................................................................................................... 514.4.2 Emergency Steering and Braking Behavior................................................................................................. 514.4.3 Final Outcome ............................................................................................................................................. 524.4.4 Scenario Entrance Speeds ........................................................................................................................... 52
4.5 SIMULATOR REALISM ............................................................................................................................................ 53
ii

5.0 DISCUSSION ................................................................................................................. .......................................... 56
5.1 OVERALL EFFECTS OF BRAKE SYSTEM.................................................................................................................. 56 5.1.1 Initial Responses and Response Times ......................................................................................................... 565.1.2 Emergency Steering and Braking Behavior.................................................................................................. 57
5.2 EFFECTS OF INSTRUCTION ..................................................................................................................................... 59 5.3 EFFECTS OF TTI .................................................................................................................................................... 60 5.4 EFFECTS OF SPEED LIMIT....................................................................................................................................... 60
6.0 CONCLUSIONS....................................................................................................................................................... 62
6.1 RECOMMENDATIONS FOR FUTURE STUDY............................................................................................................. 64
7.0 REFERENCES......................................................................................................................................................... 65
APPENDIX A: INFORMATION SUMMARY.............................................................................................................. 68
APPENDIX B: INFORMED CONSENT ....................................................................................................................... 70
APPENDIX C: EXPERIMENTAL PROTOCOL........................................................................................................... 71
In-Simulator Protocol............................................................................................................................................ 71In-Vehicle Experimenter Log Sheet ....................................................................................................................... 72Protocol After Evasive Maneuver.......................................................................................................................... 73Post-Drive Protocol............................................................................................................................................... 73
APPENDIX D: IN-VEHICLE SCRIPT .......................................................................................................................... 75
APPENDIX E: DEMOGRAPHIC AND DRIVING QUESTIONNAIRE ...................................................................... 77
APPENDIX F: VEHICLE INCURSION QUESTIONNAIRE ....................................................................................... 82
APPENDIX G: IDS VALIDITY QUESTIONNAIRE.................................................................................................... 87
APPENDIX H: IQC 1 POST-DRIVE DEBRIEF............................................................................................................ 90
APPENDIX I: PAYMENT RECEIPT ............................................................................................................................ 91
APPENDIX J: POST-DRIVE DEBRIEF........................................................................................................................ 92
iii

FIGURES
3–1. 1994 FORD TAURUS 0.5G SPLIT-µ STOP.......................................................................................................... 29
3–2. BENCH TEST 0.5G SPLIT-µ STOP...................................................................................................................... 29
3–3. 1994 TAURUS LOW-µ STOP................................................................................................................................ 30
3–4. BENCH TEST LOW-µ STOP ................................................................................................................................ 30
3–5. LINE-PRESSURES, SIMPLIFIED MODEL, 1000 HZ ......................................................................................... 33
3–6. LINE-PRESSURES, SIMPLIFIED MODEL, 240 HZ ........................................................................................... 34
3–7. WHEEL SPEEDS, SIMPLIFIED MODEL, 240 AND 1000 HZ............................................................................ 34
3–8. COMPARISON OF ABS DECELERATION OF 1997 CONCORDE AND SIMULATED 1992 TAURUS ....................................................................................................................... 35
3–9. BRAKE-LINE PRESSURES ABS HIGH-µ f STOP, SIMULATED 1994 TAURUS........................................ 36
3–10. BRAKE-LINE PRESSURES, ABS WET-ASPHALT TRACK, 1997 CONCORDE........................................... 36
3–11. VIDEO TAPE CONFIGURATION...................................................................................................................... 37
3–12. MAP OF THE SIMULATED DRIVE .................................................................................................................. 40
3–13. INTERSECTION INCURSION FROM THE RIGHT.......................................................................................... 41
4–1. FREQUENCY DISTRIBUTION OF SCENARIO ENTRANCE SPEEDS FORSUBJECTS IN THE 45 MPH AND 55 MPH SPEED LIMIT CONDITIONS ....................................................... 52
4–2. LANE MAINTENANCE RATING ................................................................................................... ..................... 53
4–3. STEERING TIGHTNESS RATING................................................................................................. ...................... 54
4–4. STOPPING ABILITY RATING................................................................................................... .......................... 54
4–5. BRAKE FORCE RATING........................................................................................................ .............................. 55
5–1. MAGNITUDE OF STEERING BY BRAKE TYPE ....................................................................................... ....... 58
iv

TABLES
2–1. LOCATION OF CRASHES .................................................................................................................................5
2–2. FURTHER CATEGORIZATION OF INTERSECTION CRASHES ..................................................................6
4–1. MEAN STEERING BEHAVIOR MEASURES BY BRAKE SYSTEM............................................................46
4–2. MEAN BRAKING MEASURES FOR CONVENTIONAL AND ABS BRAKE CONDITIONS.....................48
4–3. MEAN INITIAL RESPONSE TIME FOR SUBJECTS IN THE 2.5 SECOND AND 3.0 SECOND TTICONDITION....................................................................................................................................................50
4–4. MEAN BRAKE TIME FOR SUBJECTS IN THE 2.5 SECOND AND 3.0 SECOND TTI CONDITION........51
v

TECHNICAL SUMMARY
The National Highway Traffic Safety Administration (NHTSA) developed its Light Vehicle Antilock Brake Systems (ABS) Research Program in an effort to determine the cause(s) of the apparent increase in single-vehicle run-off-road crashes and decrease in multi-vehicle on-road crashes as vehicles transition from conventional brakes to ABS. As part of this program, NHTSA conducted research examining driver crash avoidance behavior and the effects of ABS on drivers’ ability to avoid a collision in a crash-imminent situation. Investigation of the hypothesized phenomenon of driver “oversteering” in obstacle avoidance scenarios was a major focus of this study.
The study described here was conducted on the Iowa Driving Simulator and examined the effects of ABS versus conventional brakes, speed limit, ABS instruction, and time-to-intersection (TTI) on driver behavior and crash avoidance performance. In this study, 120 subjects drove a simulated route for about 10 minutes until they reached an intersection where they experienced an incursion. Subjects’ reactions in response to the crash imminent situation were recorded and analyzed.
This study found that drivers do tend to brake and steer in realistic crash avoidance situations. All 120 subjects in this study both braked and steered in an effort to avoid crashing with the encroaching vehicle. Some excessive steering was observed in this study. However, a significant number of road departures did not result from this behavior with either conventional brakes or ABS. Ninety-five subjects (79 percent) applied the brakes as their initial response before steering. Five subjects (4 percent) initiated braking and steering inputs simultaneously as an initial response. Twenty subjects (17 percent) steered before applying the brakes. The results of this study indicate that for simulated intersection incursions, over-steering or other behaviors that cause a loss of control and/or rollover effects did not show a significant effect with vehicles equipped with ABS.
Evidence of inappropriate use of ABS was not seen in this study. Providing video-based instruction regarding the function and proper use of ABS was not found to be effective in reducing crashes in this experiment.
While no significant differences were found for any of the speed-related variables, individual strategies were quantified. For instance, almost all subjects tended to brake first and steer later when attempting to avoid colliding with the crossing vehicle. Speed limit did not have a significant main effect on any of the steering or braking variables. However, as the slower speed of 45 mph did show a 22 percent ABS crash rate relative to a 40 percent conventional brake crash rate, this result would likely be significant if the number of subjects in the conventional brake conditions matched the ABS condition (80 subjects were in ABS and 40 in conventional). The difference, if significant, would likely be due to the increased stability and control of ABS.
The results of this study show overwhelmingly that ABS-equipped vehicles have increased stability and control in simulated intersection incursions. Overall, drivers in the ABS group showed significantly increased stability and control relative to conventional brakes.
vi

1.0 INTRODUCTION
Antilock brake systems (ABS) have been introduced on many passenger car and light truck
make/models in recent years. In general, ABS appear to be very promising safety devices when
evaluated on a test track. Under many pavement conditions, antilock brake systems allow a
driver to stop a vehicle more rapidly and to maintain steering control even during situations of
extreme, panic braking. Brake experts anticipated that the introduction of ABS on passenger
vehicles would reduce both the number and severity of crashes. However, a number of crash data
analyses performed in recent years by NHTSA, automotive manufacturers, and others indicate
that the introduction of ABS has not reduced the number of crashes as expected.
1.1 NHTSA’S LIGHT VEHICLE ABS RESEARCH PROGRAM
In an effort to investigate possible causes of the crash-rate phenomenon, NHTSA developed its
Light Vehicle ABS Research Program. To date, NHTSA research has found no systematic
hardware deficiencies in its examination of ABS hardware performance, except for known
degradations in stopping distances on gravel. It is unknown, however, to what extent the increase
in run-off-road crashes may be due to drivers’ incorrect use of ABS or incorrect responses to
ABS activation, to incorrect instinctive driver response (e.g., over-steering), or to changes in
driver behavior (e.g., behavioral adaptation) as a result of ABS use or some other factor.
1.2 HUMAN FACTORS STUDIES OF DRIVER CRASH AVOIDANCE BEHAVIOR
To determine whether some aspect of driver behavior may be counteracting the potential benefits
of ABS in a crash-imminent situation, NHTSA embarked on a series of human factors studies.
Three of these studies, which compose Task 5 of the research program, focus on the examination
of driver crash avoidance behavior as a function of a vehicle’s brake system and various other
factors.
One of the theories Task 5 sought to address was whether the apparent increase in single-vehicle
crashes involving ABS-equipped vehicles was due to characteristics of driver steering and
braking behavior in crash-imminent situations. According to this theory, in situations of extreme,
panic braking, drivers may have a tendency to brake hard and make large steering inputs to avoid
a crash. Without four-wheel ABS, aggressive braking may lock the front wheels of the vehicle,
eliminating directional control capability and rendering a driver’s steering behavior irrelevant.
1

With four-wheel ABS the vehicle’s wheels do not lock; as a result, the vehicle does not lose
directional control capability during hard braking, and the driver’s steering inputs continue to be
effective in directing the vehicle’s motion. Such directional control could mean that drivers can
potentially avoid multi-vehicle crashes by driving off the road, thereby experiencing more
single-vehicle crashes.
To investigate this theory, Task 5 sought to determine whether:
• Drivers tend to both brake and steer (as opposed to only braking or only steering)
during crash avoidance maneuvers.
• Drivers tend to make large, potentially excessive, steering inputs during crash
avoidance maneuvers.
• Drivers’ crash avoidance maneuvers in ABS-equipped vehicles result in road
departures more often than in conventionally braked vehicles.
• Drivers avoid more crashes in ABS-equipped vehicles than in conventionally braked
vehicles.
• Speed limit has an effect on whether drivers avoid more crashes in ABS-equipped
vehicles than in conventionally braked vehicles.
Task 5 of NHTSA’s Light Vehicle ABS Research Program includes three studies. Two were
conducted on a test track (one on dry pavement, one on wet pavement) and one on the University
of Iowa’s Iowa Driving Simulator (IDS). This report describes the results of the Iowa Driving
Simulator experiments.
These studies used a right-side intersection-incursion scenario to elicit a crash-avoidance
response from drivers. This scenario was chosen as one likely to induce emergency steering and
braking behavior; however, since such circumstances are obviously not responsible for all run-
off-road crashes, the results may not be representative of driver behavior in all situations leading
to vehicle road departure. Many run-off-road crashes occur when drivers are unable to maneuver
through a curve in the roadway or when they are drowsy or under the influence of alcohol.
However, it is believed that the results of this study will be useful in determining not only the
extent to which drivers are able to maneuver a vehicle, but also drivers’ physical capacity to
supply control inputs to the vehicle. Insight into drivers’ ability to maintain vehicle control
during a panic maneuver and to avoid a collision can also be gained from this research.
2

The same scenario was involved in each of these experiments. The test track experiments
allowed for examination of driver behavior in a realistic environment at moderate speeds in real
vehicles with simulated obstacles on both dry and wet pavement. In the IDS study, driver
behavior could be examined using a highly repeatable test method in a simulated environment at
higher travel speeds and with no chance of actual physical collision or injury. This report
discusses the method and results of the study conducted on the Iowa Driving Simulator.
1.3 IOWA DRIVING SIMULATOR STUDY
Driver behavior in emergency avoidance situations must be thoroughly studied to assess the
causes of the apparent shortcomings of ABS. Both epidemiological and experimentally
controlled studies have examined driver behavior in emergency situations. The literature shows
that drivers in emergency situations resist lateral avoidance movements and prefer to brake, often
locking the brakes (Lechner and Malaterre, 1991). One study found that when a lateral
movement was attempted, the driver “reacted too late, or too violently, or tried to combine
braking with a sideways avoidance movement, which often resulted in loss of control”
(Ferrandez, Fleury, and Lepesant, 1984). If drivers often lock the brakes and steer too violently,
it may be that the increased lateral control of antilock brakes increases lateral skidding, roadway
departures, and subsequent rollovers.
To fill in some gaps in the literature and to better understand driver emergency avoidance
behavior, time to that behavior, and magnitude of that behavior, a scenario was simulated. The
scenario required an emergency maneuver to avoid colliding with another vehicle crossing the
intersection on a perpendicular path. It was hoped that this scenario could be used to determine
the following:
• Could over-steering or some other driver avoidance behavior account for the increase
in ABS-associated rollover crashes?
• How does the stability and control of either ABS or non-ABS contribute to the
control of the vehicle during crash avoidance circumstances?
• How does ABS instruction affect driver performance?
• What behaviors are associated with emergency avoidance in an intersection and what
are the associated reaction times to these behaviors?
• What effect does speed have on the stability and control of ABS and non-ABS
equipped vehicles?
3
• How is driver behavior and its associated reaction time altered by an incursion from
the left or right side of the driver?
2.0 LITERATURE REVIEW
2.1 MOTOR VEHICLE CRASHES
Since motor vehicle crashes have a significant impact on the health and well-being of this nation,
it is important to isolate and mediate the causes of these crashes. A major step toward learning
how to mediate crashes is to understand where and how they occur. Table 2–1 shows that in
1992, intersections were the second most common location for crashes. If crashes in areas
immediately surrounding intersections are included, they become the most common location,
accounting for 41.7 percent of all crashes in 1992. Pierowicz et al. (1994) derived these data
from the General Estimate System (GES) as part of an effort to determine methods for avoiding
collisions. The GES includes only police-reported crashes selected from specific areas in the
United States to provide a statistical estimate of the problem’s magnitude.
Crash and injury severity are often considered when determining where to invest limited
resources to ameliorate a transportation-related problem. The number of associated fatalities is
often used to estimate severity in considerations of injury and safety. In this case, intersection
crashes are the second most common type of fatal crash, accounting for approximately 18.5
percent of motor vehicle fatalities in 1992 (Pierowicz et al., 1994). An additional 2.9 percent
occurred in areas near intersections, or “intersection-related areas” (see Table 2–1).
It is clear from looking at both the magnitude and severity of the motor vehicle crash problem
that the majority of fatal crashes can be attributed to non-junction-and-intersection locations.
Since non-junctions comprise much more of the roadway system than intersections, it is not
surprising that more fatalities occur in these areas. It is somewhat surprising that drivers are three
times more likely to die in a non-junction crash than in an intersection crash. This may be due to
the higher speeds associated with non-junction crashes, combined with departing the road and/or
hitting fixed obstacles (e.g., barriers or trees). Although the fatality rate is higher for non-
junction crashes, intersections, which comprise a relatively small portion of the roadway system,
are nevertheless the site of a large proportion of crashes and fatalities.
4

Table 2–1. Location of Crashes
Crash Location
Non-junction
Intersection
Intersection-related
Driveway, Alley, Access, etc.
Entrance/Exit Ramp
Rail Grade Crossing
Other
Unknown Non-interchange
Interchange Areas
Unknown
Total
All Crashes
Number
41.4
1,798,904 30.0
701,179 11.7
623,247 10.4
53,028 < 1
12,225 < 1
22,859 < 1
150,777 2.52
115,642 1.93
32,073 < 1
100.0
Percent
2,483,183
5,992,937
Fatal Crashes
Number
23,689 72.0
6,102 18.5
939 2.9
490 1.5
109 < 1
520 1.6
25 < 1
7 < 1
1,004 3.1
21 < 1
32,906 100.0
Percent
2.2 INTERSECTION CRASHES
Because an intersection is, by its very definition, where automobiles must cross each other’s
path, it is a prime area for crashes to occur. In 1992, there were 2.5 million intersection or
intersection-related crashes (see Table 2-1). Ninety-four percent of these crashes occurred with
passenger vehicles (Pierowicz et al., 1994).
Over 90 percent of intersection crashes occurred on straight roadways (Pierowicz et al., 1994),
which indicates that the added workload of negotiating a curve was not a causative factor. The
majority of the crashes occurred on non-divided roadways and over 90 percent of the cases
involved no visual obstruction (Pierowicz et al., 1994). It is clear from this analysis that the
majority of these crashes were not caused by an obvious roadway configuration decrement,
though it should be noted that further analysis might indicate that redesigning roadways could
significantly reduce such crashes.
The speed limit at crossroads where crashes occurred had interesting effects on crash results.
While almost a quarter of the crashes (24.49 percent) occurred in 35-mph zones, the most severe
crashes occurred in 55 mph zones. Crashes occurring at an intersection with a 55 mph speed
limit were seven times more likely to involve fatalities than any other speed limit category
(Pierowicz et al., 1994). There is no doubt that higher speeds lead to more serious injuries.
5

However, even at 45 mph, a speed limit only 10 mph slower, more crashes were substantially
less severe.
Intersection crashes can be categorized into several types by evaluating the behavior or intended
behavior of the driver who crossed the path of the vehicle with the right-of-way. For the
remainder of this discussion, the driver with the right-of-way will be referred to as the primary
driver and the driver without the right-of-way will be designated the incursion vehicle driver.
Table 2–2 further categorizes the 2.5 million crashes that occurred in 1992 using this
classification scheme (Pierowicz et al., 1994). Considering only intersection crashes, over 80
percent could be classified as “change traffic way”,
(see Table 2–2).
“vehicle turning” or “intersecting paths”
Table 2–2. Further Categorization of Intersection Crashes
Secondary Vehicle Characteristic
Single Driver
Same Traffic Way
Same Direction
Change Traffic Way
Opposite Direction
Vehicle Turning
Change Traffic Way
Intersecting Paths
Miscellaneous
Total
Classification
Right Roadside Departure
Left Roadside Departure
Forward Impact
Rear End
Forward Impact
Sideswipe/Angle
Head On
Forward Impact
Sideswipe/Angle
Turn into Path
Turn Across Path
Straight Path
Backing etc.
Intersection Intersection
Related Intersection
Percent
385 < 1
585 < 1
37,568 22,940 3.1
133,905 242,327 11.2
279 55 < 1
24,280
5,031 2,097 < 1
376 100 < 1
5,781 4,585 < 1
256,502 17,525 21.5
259,232 8,694 21.7
446,638 1,935 37.6
27,249 38,159 2.3
1,195,941 395,337 100.0
18,397
14,276
22,409 1.9
6

Crashes classified as “intersecting paths” can be further broken down into three classifications:
• Straight-path-intersection takes place when the incursion vehicle driver attempts to
cross the intersection on a heading perpendicular to the primary driver.
• Turn-across-path happens when the incursion vehicle driver attempts to travel on the
same road as the primary driver but at an opposite heading by making a left turn from
a perpendicular intersecting road in front of the primary driver.
• Turn-into-path occurs when the incursion vehicle driver turns from a perpendicular
road to begin driving on the same path and heading as the primary driver.
2.3 ANTILOCK BRAKE SYSTEMS
Antilock brake systems (ABS) prevent drivers from locking the brakes by sensing when the
wheels are about to lock and releasing the brakes momentarily. The system reapplies the brakes
when the wheels begin to turn normally again. The goal is to modulate the brake pressure level
so that the vehicle has maximum deceleration. One side effect of this modulation is that the
brake pedal pulses or vibrates. Besides maximizing deceleration, ABS allows the driver to steer
and move laterally with the brake pedal fully depressed. Because it was designed to help drivers
avoid crashes, ABS is considered a primary safety system; because of its ability to increase
deceleration and controllability, ABS has been touted as an effective crash-avoidance
technology.
Most research has shown that people can avoid collisions more effectively with ABS. For
example, Rompe, Schindler, and Wallrich (1987) had subjects drive a Ford Escort on a test track
using both conventional brakes and antilock brakes. Subjects had to avoid unexpected projected
obstacles, brake while driving in curves, and brake on roads with different adhesion values on
the left and right sides. In all cases, “average drivers” performed better with ABS than with
conventional brakes. Robinson and Riley (1989) showed that the crash avoidance potential was
greater in four vehicles tested with ABS than in the same four models without ABS. However,
this increased avoidance potential has not been turned into reduced claims or reduced property
damage (Highway Loss Data Institute, 1994). Some authors believe that the lack of knowledge
about ABS (e.g., Williams and Wells, 1994), lack of training (e.g., Mollenhauer, Dingus, Carney,
Hankey, and Jahns, 1995), or pulsing of the pedal (e.g., Strandberg, 1991) are possible reasons
the added avoidance potential has not translated into more benefit.
7

Other authors believe that drivers with ABS might exchange this added safety for performance.
Wilde, the originator of the Risk Homeostasis Theory (1982), states that “...only those accident
countermeasures that are effective in decreasing the preferred level of risk can reduce the
accident loss per capita” (1988). Therefore, if a primary safety improvement is implemented that
does not reduce the preferred level of risk, certain types of crashes may decrease but other crash
types may increase in a compensatory fashion. For example, if drivers believe that antilock
brakes significantly increase their likelihood of being able to stop and avoid a collision, they may
feel more comfortable driving faster, at closer headways even under poorer road conditions. As a
result, the benefit derived from the increased performance of the antilock brake system is
negated by the drivers’ more risky behavior.
A study done in Munich supports this theory. Taxi drivers were randomly assigned to taxis with
ABS and taxis with conventional brakes. The taxi drivers were aware of whether their taxi had
ABS but were unaware that some passengers were judging their driving behavior. To reduce
bias, the raters judging behavior were “experimentally blinded” to which taxis had ABS. The
drivers with ABS drove significantly less cautiously (Biehl, Aschenbrenner, and Wurm, 1987). If
the Risk Homeostasis Theory has merit, it could be argued that time should not be wasted on
technological advances such as ABS. However, it is doubtful that the Risk Homeostasis Theory
alone can explain why the presence of ABS did not reduce the number of crashes.
After reviewing the literature for and against this theory, McKenna concluded there was little
support for it and that it has both theoretical and methodological inconsistencies (1988). Other
researchers have shown that the most effective safety measures impact behavior and not risk
estimates (e.g., Howarth, 1988). The fact that ABS did not reduce the number of crashes can
probably be explained by risk compensation combined with other factors (e.g., lack of
information and drivers’ ineffective use of the technology). If so, modifying these other factors
would decrease the number of ABS crashes and increase driver safety. For a more in-depth
review of the issues on Risk Homeostasis Theory and potential reasons for drivers’ risky
behavior, see Volume 4 of the 1988 Ergonomics Journal.
ABS may have reduced some types of crashes while increasing other, more costly crashes. This
could have occurred independently of Risk Homeostasis Theory or risk compensation. Kullgren
and Tingvall performed an analysis of collisions in Sweden (1987). They found that people with
ABS were more likely to be struck than to strike another vehicle in rear-end collisions. They also
found that drivers with ABS had more crashes in which the vehicle crossed the centerline to the
wrong side of the road. When the stopping advantage of ABS is considered, the discrepancy in
rear-end collisions is logical—it could simply be caused by ABS drivers’ ability to stop faster
8

than non-ABS drivers. The reason for the increase in single-vehicle crashes on the wrong side of
the road is not as clear.
Kahane (1994) found that, for passenger cars, involvements in multi-vehicle crashes on wet
roads were significantly reduced for cars equipped with ABS: fatal crashes were reduced by 24
percent, and nonfatal crashes by 14 percent. However, these reductions were offset by a
statistically significant increase in the frequency of single-vehicle, run-off-road crashes, as
compared to cars without ABS. Fatal run-off-road crashes were up by 28 percent and nonfatal
crashes by 19 percent.
“An analysis of Canadian insurance data found a 9 percent reduction in claim frequency but a 10
percent increase in claim severity [Barr and Norup, 1994]” (Evans, 1995). This lends credence to
the theory that ABS reduces the number of certain types of crashes while increasing other, more
costly crashes. For the 1992 and 1993 calendar years, Evans (1995) performed an analysis of
ABS and non-ABS crashes on seven GM passenger vehicles in Texas and Missouri. These
models had ABS in 1992, but did not have ABS in 1991, so the comparison was made between
these two model years. Although there was a reduction in most crash types, there was a 44
percent increase in rollover crashes (Evans, 1995), which are often more severe and costly.
Evans (1995) offered increased ability to steer during emergency braking as one possible reason
for the increase in rollover crashes. This could also explain the increase in single vehicle crashes
found by Kullgren and Tingvall (1987), where the vehicle crossed the center lane and the crash
occurred on the wrong side of the roadway. Increased steering ability could lead to over-steering
in emergency situations. In the past, drivers who “locked up” conventional brakes could not
significantly increase their rollover likelihood by steering. Steering, regardless of the magnitude,
had little impact on the lateral movement of the vehicle when the brakes were locked. However,
aggressive steering without locked brakes can cause a rollover crash. Therefore, if drivers have a
tendency to over-steer in emergency situations, it is feasible that ABS would increase the
likelihood of rollover crashes, both through increased lateral acceleration and roadway
departures. To determine if this theory has merit, driver behavior in emergency avoidance
situations must be thoroughly understood.
2.4 EMERGENCY AVOIDANCE BEHAVIOR
Drivers are often forced to maneuver their vehicles in certain ways to avoid collisions. Many of
these potential crashes require simple avoidance behaviors, such as releasing the accelerator to
9

allow a vehicle enough time to cross an intersection. Other situations require quick reaction time
and/or behavior combinations such as braking and steering to avoid a collision.
Rundkvist stated that Swedish drivers in 10.5 percent of all police-reported crashes had their
wheels locked (1973). Fifty percent of the drivers attempted to steer. Unfortunately, they did not
examine whether drivers who braked also steered, but it is reasonable to assume a large portion
of this 10.5 percent did attempt to steer with the brakes locked. In Sweden, the police only report
crashes when there is an injury. Therefore, most of these crashes were probably serious. In 168
of these police-reported accidents (analyzed further for this study), collisions at junctions were
the most highly represented (Rundkvist, 1973). This further supports the use of an intersection
with an encroaching vehicle to represent an emergency avoidance scenario.
Koppa and Hayes (1976) attempted to determine whether drivers use the full capability of a
vehicle in emergency or extreme vehicle maneuvers. Sixty-four drivers were matched and
assigned to four groups. Each group was assigned to drive a different-sized vehicle, ranging from
a sub-compact to a semi-luxury model. Eight subjects in each of the groups drove in “surprise”
tests where drivers avoided obstacles and performed severe maneuvers based on traffic controls.
The drivers could experience any, none, or all of the following situations in a given run:
• Sudden obstacle. A pylon suddenly appears in the subject vehicle’s path at different
distances from the vehicle.
• Late decision at a freeway exit. A “pop-up” sign indicates the subject should exit left
or right on a constant radius turn; the sign could also “pop up” blank.
• Late decision at an intersection. A “pop-up” sign indicates an upcoming 90-degree
left or right turn (e.g., as if a driver came upon an unexpected T intersection and had
to maneuver left or right).
• Blind corner. Once the subject is on the curve an obstacle appears in the vehicle’s
path.
• Sudden lane change. The driver’s lane branches into one of three adjacent lanes with
traffic signals over each lane set to amber. As the subject approaches, any or all of the
lights could turn green. Lights that were not turned green were turned red. Subjects
were instructed only to choose lanes with green lights.
The following conclusions were drawn by the Koppa and Hayes study (1976):
10

• Drivers turned the steering wheels of the vehicles approximately the same, even
though the steering wheel ratio between vehicles was different.
• The dynamic control limit of the typical driver may be approximately one second.
This was defined as the time that lapses between the first and second peak steering
inputs during the lane changes and the avoidance maneuvers.
• Transient maneuvers, such as lane changes and avoidance maneuvers, most
frequently showed differences in vehicle-driver closed-loop performance.
• When the driver lost control of the vehicle, it always occurred during the lane
maneuver or avoidance maneuver recovery phase.
• Drivers may “normalize their inputs to achieve an acceptable level of lateral
acceleration which is relatively independent of the vehicle’s capability.”
The study indicated that drivers adjust their inputs to a comfortable level of vehicle performance,
regardless of the performance capability of the vehicle. The driver, as an integral component of
the closed-loop system, limits the system’s performance to a threshold that is comfortable and
usually successful. On the other hand, these scenarios could have been designed so only limited
performance capability was required to successfully perform the maneuvers. As a result, drivers
may have used the performance capability that was comfortable but they could have increased
the system performance if it was required for success. As described previously, Koppa and
Hayes (1976) used scenarios that varied the times-to-obstacles/maneuvers, and there were
several “losses of control.” As a result, it is likely that drivers were modifying their inputs as
required to reach a high enough, but comfortable, level of vehicle performance.
Drivers attempting a severe maneuver were also capable of adjusting for different steering ratios
to obtain the desired steering magnitude. This indicates that drivers may rapidly adjust to the
different steering behavior of a new vehicle. However, it is not clear whether this adaptation was
strong enough to support the recovery phase of a severe steering maneuver. All instances where
subjects lost control occurred during this recovery phase. Also, differences between the closed-
loop vehicle and driver performance were highest in these transient maneuvers. It would be
interesting to determine whether this loss of control was due to adapting to a new system or
whether drivers in a familiar vehicle would experience the same problems. Finally, a one-second
dynamic control limit for typical driver steering has interesting implications. In a crash
avoidance situation, this delta between the first and second steering input could be the difference
between a successful avoidance and a collision. However, the emergency avoidance literature
reviewed did not discuss such differences.
11

Olson and Sivak (1986) conducted one of the few studies in the field evaluating perception-
response time (PRT), defined as the time period that elapses between when an object or stimulus
first becomes visible and when the subject responds. Sixty-four subjects from two age groups
participated in the study. Subjects were instructed to drive an instrumented vehicle in a practice
session to become accustomed with its characteristics before the experiment started. This helped
ensure that the road hazard that occurred during the drive was unexpected. Approximately six
kilometers into the drive, a piece of yellow foam rubber approximately 15 cm by 91 cm was
positioned on the left side of the driver’s lane. A counter was started just before the subject
would have been able to see the foam rubber. This counter was shut off once the accelerator was
released and a second counter was started and continued until the brake pedal was pressed. Once
subjects had stopped, they returned to the same route and told the experimenter when they were
first able to see the road hazard. This information was used to calculate perception time (i.e.,
time-to-accelerator-release), response time (i.e., transition time from accelerator-to-brake), and
PRT (i.e., time-to-brake-press). There was no evidence to indicate that older drivers required
more PRT to respond to unexpected roadway hazards. When looking at PRT (i.e., time-to-brake-
press), the average time appeared to be close to 1.1 seconds for both the young and the old
group. It also appeared that over 90 percent of subjects in both age groups braked before 1.5
seconds had transpired (Olson and Sivak, 1986).
Lerner (1993) also evaluated brake PRTs in the field for both young and old drivers. One unique
and beneficial experimental difference between this study and the many others of this type was
the use of the subject’s own vehicle for the tests. As a guise, drivers were asked to periodically
evaluate road quality. At the end of the drive, subjects merged onto a closed roadway and a large
yellow barrel, previously hidden from view, came rolling toward their vehicles. Subjects were
traveling approximately 40 mph and the barrel came into view approximately 200 feet away,
causing a time-to-collision of approximately 3.4 seconds. The barrel was prevented from going
any further than the shoulder area of the road. Valid data was obtained for 116 subjects. Eighty-
seven percent of these subjects maneuvered their vehicles in an effort to avoid the encroaching
barrel. Thirty-six percent steered only, 43 percent braked and steered, and only eight percent
braked only. Measurable brake reaction time was obtained for 56 subjects (roughly half). The
mean brake PRT was 1.5 seconds with a standard deviation of 0.4 seconds. Since valid braking
data could be obtained for only 56 of the original 200-plus subjects, Lerner stated that this
reaction time value should not be considered a precise measure. However, he stated that this
sample was sufficient to show that there were no important PRT age-related differences between
the groups evaluated. Lerner also reported a somewhat slower brake response time for the drivers
who combined braking and steering compared to those drivers who braked alone.
12

Both Lerner (1993) and Olson and Sivak (1986) indicated that differences in response time for
different age groups were minimal. Olson and Sivak also found that a time-to-collision of
approximately 3.4 seconds elicited a high percentage of steering responses. Seventy-nine percent
of the subjects in this study steered to avoid what they assumed was an encroaching barrel. Other
research has shown that steering is not a popular response, and that subjects are more likely to
choose braking when sufficient time is available.
For example, Lechner and Malaterre (1991) looked at collision avoidance driving behavior with
subjects who had no pre-warning. They used the Daimler-Benz driving simulator, which at the
time was the most advanced driving simulator in the world. Subjects were told to drive the
simulator as they usually drive (around 90–100 km/h) to become familiar with it. They were told
that they would be given new instructions after a familiarization drive. In fact, subjects never
received a new set of instructions, but were told this so they would not expect the event requiring
collision-avoidance behavior. Subjects came to a four-legged intersection approximately 10
minutes into the familiarization drive. At this intersection the subject vehicle had the right of
way. A single vehicle driving toward the intersection on a perpendicular road stopped at a stop
sign then proceeded in front of the subject vehicle. This vehicle started crossing in front of the
subject vehicle at one of three different times-to-collision (i.e., 2.0, 2.4, and 2.8 seconds). The
encroaching vehicle accelerated for 1.9 seconds and then braked to stop, blocking the subject’s
lane 2.6 seconds after starting.
Forty-nine subjects participated in the study with an approximately equal number of men and
women in each of the three time-to-collision conditions. The average time for the subjects’ first
action was 0.8 seconds for releasing the accelerator pedal (33 subjects) and 0.82 seconds for
steering (14 subjects). It took an average of one second to press the brake pedal. There was no
significant difference in the first reaction between different times-to-collision. Lechner and
Malaterre (1991) reported this was due to it being a “reflex” action. Time-to-brake was
significantly different, and appeared to vary based on the urgency of the situation. These authors
concluded that 0.8 seconds was required to react to a situation and 0.95 seconds was required to
brake or steer to avoid a situation. However, they also alluded to some drivers releasing the
accelerator prior to the incursion vehicle moving into the intersection (Lechner and Malaterre,
1991). This could have been due to defensive driving habits or subjects may have been more
suspicious than usual because of the experimental context. Since some other reaction times found
in the literature are slower (e.g., Olson and Sivak, 1986), these subjects may have reacted more
quickly to the unexpected vehicle incursion because they were overly alert to the situation.
13

In this study, improving subject reaction time by even as much as 25 percent would not have
increased braking maneuver success. In fact, two-thirds of the subjects who attempted to brake
and collided with the encroaching vehicle would have had to start braking prior to the movement
of the encroaching vehicle in order to succeed. This same 25 percent reduction in reaction time
would have allowed four subjects who collided while attempting to swerve enough time to
successfully swerve in front of the encroaching vehicle (Lechner and Malaterre, 1991).
Lechner and Malaterre (1991) also looked at the success of the different maneuvers across all
times-to-collision. Overall, only 10 of the 49 subjects successfully avoided the collision. Six
subjects avoided it by braking alone, three avoided it by swerving alone, and one subject avoided
it by swerving and braking.
If the subjects’ vehicle had been equipped with ABS, an additional seven collisions might have
been avoided. These were subjects who steered right behind the vehicle during a skid and might
have successfully avoided the encroaching vehicle if they had added steering control available to
them. ABS would have probably increased the success rate from approximately 20 percent to
approximately 35 percent (Lechner and Malaterre, 1991). This large increase could have been
achieved without altering the subjects’ behavior. Because subjects knew they were driving a
vehicle with conventional brakes, it is possible that an even higher success rate might have
occurred if subjects had known they had ABS. It would have been interesting to determine
whether any subjects who locked the brakes and steered would have had other, less successful
outcomes with ABS. For example, did any subjects over-steer to the point that ABS would have
caused them to end the scenario in a worse outcome (e.g., departing the roadway and rolling
over)?
Sixteen subjects who braked and collided with the encroaching vehicle would have avoided it if
it had continued to accelerate across the intersection at the same rate without braking. This would
have increased the success rate from approximately 20 percent to approximately 47 percent.
However, the three subjects who swerved in front of the encroaching vehicle would have been
“lightly” hit (Lechner and Malaterre, 1991). This is important because it is likely that very few
subjects understood the ultimate behavior of the encroaching vehicle. It is likely that most
drivers assumed the vehicle would continue to cross the intersection at the same velocity it was
traveling when they began to decelerate.
14

The following conclusions were drawn from the Lechner and Malaterre study (1991):
• Accelerator release is probably a reflex behavior.
• When there is enough time, braking is the avoidance response preferred by most
drivers (88 percent attempted braking).
• Drivers usually lock the brakes during avoidance maneuvers.
• The shorter the time to collision, the more likely drivers are to swerve in front of the
encroaching vehicle.
• Drivers who swerve in front of the encroaching vehicle start by swerving first.
• Drivers who swerve behind the encroaching vehicle brake prior to swerving.
• Driver reaction time is generally good, so that a device that could effectively alert
drivers to increase reaction time is not a feasible collision-avoidance deterrent in this
case.
• Drivers in this situation could have improved their ability to avoid a collision with
antilock brakes.
• Drivers did not use lateral avoidance maneuvers even though such maneuvers would
have been more successful. Fifty-seven percent of the subjects who collided could
have avoided the encroaching vehicle by swerving.
This study provided a good indication of driver behavior under conditions where time-to-
collision is between 2.0 and 2.8 seconds. It is interesting that only the 2.8 second time-to-
collision allowed the driver to witness the end behavior of the encroaching vehicle—under this
condition, if the subject vehicle did nothing, the encroaching vehicle would begin decelerating
0.9 seconds before the collision and come to rest 0.2 seconds before the collision. Of course, if
the subject slowed after the encroaching vehicle started moving, additional time would have been
available for the subject to see the ultimate behavior of this vehicle. In the other conditions,
subjects had to anticipate the encroaching vehicle’s behavior. In the 2.0 second time-to-collision,
subjects probably believed the vehicle was going to continue across the intersection at the same
rate of acceleration. Since the vehicle continued to accelerate for 1.9 seconds, it is reasonable to
assume that the braking of the encroaching vehicle did not figure into the strategy of these
subjects. In the 2.4 second time-to-collision, it is possible that subjects were able to see the
encroaching vehicle decelerate. It would be interesting to know if drivers in the 2.4 second time-
to-collision changed their behavior or strategy after the encroaching vehicle began slowing. It
15

would have been reasonable for the drivers to have developed an initial strategy based on the
vehicle’s continuing to travel across the intersection and a secondary strategy once they saw the
vehicle begin to stop. For example, the initial strategy might have been to brake; however, when
they saw the vehicle stopping, they might have attempted to swerve around the vehicle.
Driver steering behavior observed in this study was quite interesting: drivers steered in front of
the encroaching vehicle more often at shorter times-to-collision, steered in front of the vehicle as
the first maneuver, and steered in back of the vehicle after braking. The authors stated that this
could be explained by the direction of the moving obstacle and by the space available for
maneuvering (Lechner and Malaterre, 1991). Drivers could have been adjusting their strategies
based on the size or expected size of the gap. When drivers steered in front of the vehicle, they
were attempting to cross the intersection in front of the encroaching vehicle. To maximize this
gap in front and successfully avoid a collision, drivers would have had to have steered without
decelerating and driven through the intersection as quickly as possible. Some subjects in this
study maneuvered in this manner. On the other hand, drivers who attempted to steer behind the
encroaching vehicle would have wanted the gap behind the vehicle to be as large as possible. By
braking prior to steering, they could allow the encroaching vehicle to move through the
intersection, making the gap behind the vehicle bigger. Drivers who steered behind the
encroaching vehicle often braked first, indicating this may have been their strategy. Finally, in
the shorter times-to-collision the biggest gap would have been in front of the encroaching
vehicle. This study found that the shorter the time-to-collision, the greater the tendency to swerve
in front of the encroaching vehicle, further supporting the idea that subjects attempted to swerve
toward the biggest gap.
INRETS did research prior to this study to determine “why, in certain accident situations where
an emergency maneuver is possible, did the driver not make the right decision or implement the
maneuver properly” (Malaterre, Ferrandez, Fleury, Lechner, 1988). Unfortunately, many of these
studies were written in French and could not be reviewed in their original form for this
document. However, in an article written for ERGONOMICS, Malaterre et al. discussed some of
these studies and how they impacted their work. We will describe the most pertinent of these
studies.
Ferrandez, Fleury, and Lepesant (1984) observed 72 crashes in situ. Only 126 road users were
involved, however, because some of the crashes involved only a single road user. Thirty-one of
the 72 crashes could have been avoided if a feasible maneuver had been chosen by one of the
drivers. From this study, the following conclusions were derived:
16

• Two-thirds of the time, the feasible avoidance maneuver was a lateral movement
without braking.
• Braking was the preferred action.
• Lateral movements were rarely attempted at intersections unless the obstacle was
approaching from the right side.
• When lateral movements were attempted, the driver reacted “too late, or too violently,
or tried to combine braking with a sideways avoidance movement, which often
resulted in loss of control” (Ferrandez, Fleury, and Lepesant, 1984).
Lateral movements that are too violent have direct implications for the increase in ABS rollover
crashes. If some drivers over-steer in emergency avoidance situations, the added steering ability
of ABS may increase the likelihood of road departures and increased lateral acceleration. It is
also interesting that subjects resist steering to avoid an object unless it comes from the right side.
This could be due to several things including:
• Drivers expect that the left incursion object will stop prior to entering their pathway.
• Although drivers are actually steering, the steering has minimal effect because the
brakes are locked.
• Drivers have a larger escape route when the obstacle incurs from the right. When the
obstacle comes from the left and enters their lane, drivers only have their own lane
and the shoulder to move into laterally to avoid the crash. When the obstacle comes
from the right and enters their lane, drivers also have the entire left lane for
avoidance.
It is possible that all three of these factors affect a driver’s lateral movement. As part of this
research, Ferrandez and Fleury (1986) analyzed 82 crashes that occurred at intersections and
involved entry from the left or right side. The intersections were on a main road with an
intersecting secondary road. Although the secondary road user was responsible for the traffic
conflict, Ferrandez and Fleury stated that they had “very little scope of avoiding action” (1986).
Only half as many obstacles could have been successfully avoided from the left (25 percent) as
from the right (50 percent). This was due to the avoiding drivers taking longer to realize there
was a potential conflict when the obstacle entered from the left. In general, braking was the
preferred maneuver, and lateral movements were usually in the same direction as the moving
obstacle (Ferrandez and Fleury, 1986).
17

The perspective of this study differed from the perspectives of many crash-reconstruction studies
that aim at determining why the incursion vehicle pulled into the intersection and how to prevent
such incursions from happening. This study analyzed how collisions can be avoided once an
incursion has happened. From the analysis, it is apparent that a large number of these crashes
could have been avoided by the driver who had the right-of-way on the main road. Again, it is
likely that in many of these situations, successful avoidance maneuvers would have had to
include lateral movement, a maneuver avoided by many drivers. According to Malaterre et al.,
the driver must have good visibility, know the trajectory of the object in the conflict, and be a
short distance away from that object to use lateral movement as a primary response (1988).
Malaterre et al. (1988) showed subjects a video of a van on a collision course and asked subjects
how they would respond. The first response given by subjects was taken as their answer. The
authors again found that braking was overused as an avoidance maneuver. Although this study
used film and slides and required subjects to report rather than perform their reactions, it remains
likely that many subjects would use this information to determine the appropriate collision
avoidance response. Therefore, it is assumed that this approach is representative of subjects’
actions.
Malaterre, Peytavin, Jaumier, and Kleinmann (1987) tried to determine subjects’ perceptions of
how close they could get to an obstacle and still successfully avoid it by braking or by steering.
On a racing circuit, subjects were told to imagine an obstacle in the location of two pylons and to
press a button at the last moment they thought they could successfully steer around the obstacle,
and at the last moment they thought they could successfully brake to avoid the obstacle. Subjects
did not actually perform the maneuver, so they had no feedback on their success. Thirty-two
trials were taken for each of the 12 subjects. As expected, subjects believed they could still
successfully steer closer to the object than they could successfully brake. Although different
speeds were used, the time-to-collision never exceeded four seconds. This study shows that
subjects know that steering is a better option in certain situations; however, the crash statistics
and other studies show that subjects avoid steering under these circumstances.
Petit, Priez, Brigout, Tarriere, Collet, Vernet Maury, and Dittmar (1993) performed a study on a
test track to determine why antilock brakes have not been more effective at reducing crashes and
their severity. They recruited 100 male and female subjects between the ages of 21 and 56 and
18

matched subjects by age, length of time with a driver’s license, and emotionality. An equal
number of drivers were assigned to a group:
• without ABS,
• with ABS in which the drivers were not informed that the vehicle had ABS,
• with ABS in which the drivers were informed that the vehicle had it, and
• with ABS who attended a half-day training program on its use.
A course was laid out with multiple intersections. Two of the intersections had cars with drivers
in them on opposite sides of the subject vehicle. The cars were blocked from the subject’s view
until approximately one minute before the subject reached the intersection. Drivers drove by
these intersections multiple times. On the last trial, an inflated dummy vehicle replaced one of
the cars. At a braking distance approximately 15 meters too short to avoid the vehicle, the
inflated vehicle pulled out in front of the subject’s vehicle from the right. The inflated vehicle
blocked the subject’s entire lane. The left lane was available to swerve around the incursion
inflated vehicle. Drivers were told the driving speed was 100 km/h, and arrived at the obstacle’s
location at between 40–50 km/h. None of the drivers in the group without ABS were able to
avoid the collision. Approximately 20 percent of the drivers in each of the other groups that had
ABS were able to avoid the encroaching vehicle. Although not more successful than the other
groups with ABS, approximately 80 percent of the group trained in ABS performed the correct
maneuver. From this and other results, Petit et al. (1993) concluded that the correct use of ABS is
not innate; drivers with ABS-equipped vehicles performed better than drivers of non-equipped
ABS vehicles, and drivers would be more successful if they knew how to use ABS better.
Although not discussed by Petit et al. (1993), the graph in the article indicated that
approximately 50 percent of the subjects attempted to perform the correct maneuver in each of
the three untrained groups. Even though subjects were not successful in the group without ABS,
about 50 percent appeared to steer to try to avoid the vehicle. Without ABS, these subjects may
have steered with the brakes locked, reducing their ability to move laterally and ultimately
forcing them to collide even though they performed the correct avoidance maneuver. It would be
interesting to know if there were any differences in the reaction time-to-maneuver and the
magnitude of the steering angular deviation between the group of drivers who knew they had
ABS and the two groups of drivers who did not know they had ABS. It is probable that there was
no difference and that subjects without instruction performed the same actions, regardless of the
braking system. It is also reasonable to assume that in similar circumstances, approximately 50
19

percent of the subjects would tend to steer, and that some would over-steer. This over-steering
may be due to drivers having had experience attempting to steer with locked conventional brakes
and not having any lateral influence over the vehicle. Drivers may also steer with the brakes
locked because they perceive that turning the tires sideways with the skid will improve their
deceleration. Additional research is required to determine if any or all of these hypotheses are
valid.
Other researchers have looked at driver behavior when a pedestrian crosses into a vehicle’s path.
One of the first studies to do this in a simulator was conducted by Barrett, Kobayashi, and Fox
(1968). For 10 trials, 11 subjects drove a simulated vehicle with the speedometer covered by
tape. Subjects were instructed when to increase and decrease speed in an effort to maintain 25
mph. On the tenth trial, subjects were coached on speed adjustment until the driver approached a
location with a simulated pedestrian. The simulated pedestrian moved out of a shed and into the
path of the subject vehicle at a distance of 82.5 feet in front of the driver. At 25 mph this
approximates 2.25 seconds time-to-collision. Ten of the 11 subjects attempted to avoid the
collision by braking. One attempted to avoid the collision by steering. Six of the 11 subjects
avoided the simulated pedestrian or hit it at less than one mph. In this study, the dependent
variables were the number of subjects whose dominant response was steering or braking; the
reaction time; the magnitude; and the rate of the initial steering or braking behavior. Although
this study had a small sample, it is clear that here again, subjects preferred braking over steering
as an avoidance response. It appears that in this type of study, at least these four dependent
variables should be analyzed.
Araki and Matsuura (1990) used a driving simulator to study driver behavior when a pedestrian
suddenly darted across the road from the driver’s right side. The 32 subjects were told that their
response to overtaking and being overtaken by other cars on a two-lane road was being
monitored. They were also told to drive at approximately 80 km/h. After a practice drive of
approximately 20 minutes, the simulated pedestrian darted across the intersection at a rate of
approximately 10 km/hr. The simulated pedestrian was approximately 40 meters from the
subject’s vehicle when it began to move into the intersection. Subjects were not told that a
pedestrian would enter their path.
The action taken by a subject to avoid the simulated pedestrian was classified as: no steering,
steering left, steering right, no braking, light braking, or hard braking. The 32 subjects were
classified as experienced (24 subjects) and novice (eight subjects). Nine of the 32 subjects
avoided a collision with the simulated pedestrian. All but one of the novice subjects collided with
the simulated pedestrian. Eighteen of the 32 subjects braked hard, seven braked lightly, and
20

seven never braked. Of the subjects who never braked, two drove straight ahead without braking
and avoided the collision. One steered left, successfully avoiding the collision; three steered
right, with one subject successfully avoiding the collision. Of the subjects who braked hard, nine
braked alone, with one avoiding the collision; seven steered right, with three avoiding the
collision; and two steered left, with both colliding. Finally, seven subjects braked lightly; of
these, two braked alone, three steered left, and two steered right. All the subjects who braked
lightly collided, except one who steered right.
The following can be derived from this study (Araki and Matsuura, 1990):
• Most subjects attempted to brake to avoid the collision (25 of 32).
• Most subjects who attempted steering combined it with braking (14 of 18).
• Twice as many subjects attempted to steer behind the pedestrian as in front of the
pedestrian (12 and 6).
• More novice drivers (3 of 8) than experienced drivers (0 of 24) attempted to steer
behind the pedestrian without braking.
• Novice drivers were more likely (88 percent) than experienced drivers (67 percent) to
collide in this scenario.
This study places the simulated pedestrian in the vehicle’s path at approximately 1.8 seconds
time-to-collision. Subjects at this short time-to-collision still preferred braking to avoid the
pedestrian and most subjects who steered combined steering with braking maneuvers. This again
shows that drivers resist steering around an obstacle even though they would have a better
success rate. Of the subjects who attempted to steer right behind the obstacle, over 40 percent
were successful. In this case, since the pedestrian came from the right side, braking to allow the
pedestrian more time to cross the intersection then steering behind the pedestrian had merit. It is
interesting that three of the eight novice subjects attempted to steer right without slowing first.
None of the experienced subjects attempted this maneuver without braking first, indicating that
experience may have taught drivers to slow down before steering behind an object moving off
the road.
A study done by Masuda, Nagata, Kuriyama, and Sato (1992) specifically evaluated how
experienced and inexperienced drivers were affected by obstructions on both sides. Subjects
were instructed to maneuver between an obstacle on each side of a road. In some cases the
obstacles were stationary and in other cases the obstacles were moving in the same direction as
21

the subject’s vehicle. One of the objects was a pedestrian and the other was a van. These
obstructions could appear on either the left or right side of the subject vehicle but there was
always a pedestrian and van present. Several interesting conclusions were drawn from this study.
When the driving task became more difficult, subjects sampled the right side obstruction more
often than the left side obstruction. This occurred regardless of whether the van or the pedestrian
was on the right side. Also, when the driving task became more difficult, the novice drivers were
more concerned with their vehicle’s path of travel than with the obstructions. Finally, novice
drivers attempted to stay in the right lane, regardless of the obstruction in that lane (Masuda,
Nagata, Kuriyama, and Sato, 1992). It is clear from this analysis that experienced drivers behave
differently than novice drivers. It is expected that in a difficult situation, novice drivers would
have to concentrate more on their vehicle’s path. However, it is not expected that these drivers
would be more likely to stay in the right lane, regardless of the obstruction in that lane. Finally, it
would be interesting to determine whether the high sampling of the right side is a usual aspect of
driving or an artifact caused by this experimental procedure.
In a study attempting to assess the benefits of ABS, average drivers were placed in an emergency
situation that required both braking and steering to avoid a collision. Seventy-seven drivers were
instructed to drive 45 mph on a test track. They were told that when they entered an
approximately 10-foot wide lane marked with cones, something might happen that would require
them to brake or steer. When they were approximately 114 feet away, a “child-like dummy” was
projected into the drivers’ path. At 45 mph, the driver had to both steer and brake to avoid the
child dummy. Twenty-seven of the 77 subjects tried to avoid the child dummy without
attempting a steering maneuver. Of these 27, two successfully avoided the child dummy by
braking alone due to their slow entrance speed. In general, the drivers collided with or touched
the child dummy 1.2 times less frequently in the vehicle equipped with ABS (Martin and
Holding, 1987).
It is interesting that 25 of the 77 subjects unsuccessfully attempted to brake to a stop when
steering would have been a more successful maneuver. There was no chance of injury from
oncoming traffic or of hitting the cones to the left, yet one-third of the drivers attempted to brake
only. Malaterre, Peytavin, Jaumier, and Kleinmann (1987) have shown that subjects know a
lateral swerve will be more successful than braking at short times-to-collision. In this case, the
time-to-collision would have been approximately 1.73 seconds, so these subjects probably did
not resort to braking because they thought it would be more successful than steering. Some other
mechanism such as overestimating the braking ability of the vehicle or not being sure of the
ultimate behavior of the child dummy may have caused this response.
22

Prynne and Martin (1995) discuss a two-stage braking phenomenon that appears to be a
subsequent finding of this study, or of a very similar study. A high proportion of the subjects
braked to a usual point of deceleration, then paused before continuing to fully depress the brake
pedal. Drivers who performed this two-stage braking were 17 percent more likely to collide with
the child dummy. According to Prynne and Martin (1995), this two-stage braking was part of the
drivers’ decision processes. They also reported that drivers were intolerant of high deceleration
at high speeds and were unwilling to swerve even when this was the best maneuver for success.
In this case, subjects had been alerted that something could happen when they entered the 10-
foot lane. As a result, their reaction time to the event was probably very quick compared to a
similar situation with no forewarning. The reader should consider this when reviewing these
results.
2.5 LITERATURE REVIEW CONCLUSIONS
Antilock brake systems (ABS) have been shown experimentally to improve the chances of
avoiding collisions by increasing drivers’ ability to brake, steer, or perform a combination of
braking and steering. Accident statistics, however, have not demonstrated the expected
improvements in driver collision avoidance, while they do indicate a large increase in rollover
crashes. Researchers have blamed this lack of crash reduction on poor ABS knowledge, lack of
training, and compensatory risky behavior. The increase in rollovers related to ABS is thought to
be caused by an increased ability to steer. Increases in other aspects of crashes involving ABS
(e.g., collisions in which the car is in the wrong lane) support this possibility. However, none of
the controlled experimental research reviewed specifically discussed any increased chance of
ABS crashes. In fact, all the literature reviewed evaluated ABS only as a positive crash-
avoidance technology. Research must also evaluate whether drivers perform some action or
combination of actions that increase the likelihood of rollover crashes with ABS. Since
emergency avoidance situations can require drivers to push their or their vehicle’s performance
to their maximum capability, this intersection scenario provides a good mechanism to determine
what if any driver behavior(s) increases the number of crashes associated with ABS.
Specifically, it could help researchers determine whether drivers in emergency avoidance
situations have a tendency to over-steer with locked brakes.
2.5.1 Imminent Crash Avoidance Behavior
Crash statistics have shown that subjects involved in crashes resist lateral maneuvers and prefer
to brake to avoid an obstacle. At times, the most feasible maneuver may be a lateral movement
23

without braking. Lateral movements at intersections were attempted usually in the direction of
the encroaching vehicle, but were rarely attempted unless the encroaching vehicle was
approaching from the right side. It appeared that drivers had an increased chance of avoiding the
encroaching vehicle if it approached from the right rather than the left. One study found that
when a lateral movement was attempted, the driver “reacted too late, or too violently, or tried to
combine braking with a sideways avoidance movement, which often resulted in loss of control.”
(Ferrandez, Fleury, and Lepesant, 1984). Of course, if this effect is commonly true, ABS could
exacerbate the problem.
Experimentally controlled studies reflect many of the findings demonstrated by crash statistics.
Studies have been designed with times-to-collision ranging from approximately 1.75 seconds to
3.4 seconds. The obstacles have included barrels, foam blocks, simulated vehicles, and simulated
pedestrians. The results indicate that drivers usually release the accelerator first, prefer to brake,
avoid lateral maneuvers, and lock the brakes during avoidance maneuvers. When steering, they
usually steer towards the largest gap, steer first when going in front of an obstacle, and brake
first when going behind an obstacle. In many cases, collision avoidance could have been
improved if drivers had steered rather than braked. When subjects do steer, it is often combined
with braking. Subjects know they could be more successful steering than braking at shorter
times-to-collision, and are more likely to steer in shorter times-to-collision. This is true in all
cases reviewed except the 3.4 second time-to-collision with a barrel, where a surprising 79
percent attempted to steer. Thirty-six percent attempted to steer alone while only eight percent
attempted to brake alone (Lerner, 1993).
The driver research revealed that emergency perception-reaction time is not greatly impacted by
the driver’s age, and 1.1 seconds is a good estimate of the average time required to perceive and
respond. Drivers rarely use the full capability of the vehicle and obtain the same lateral
acceleration regardless of the vehicle’s capability. They also adapt to different steering wheel
control ratios to obtain the same vehicle deviation. In addition, they may have a dynamic steering
control limit of approximately 1.0 seconds and the most difficulty with the recovery phase of
transient maneuvers, such as lane changes and avoidance maneuvers.
Most of the articles reviewed analyzed driving outcome and behavior at times-to-collision of 2.8
seconds or less. All the studies that dealt with incursions analyzed driver reaction and behavior
based on an incursion from the driver’s right side. None of the studies analyzed incursions from
the left side, even though the accident literature indicates that there are differences between left-
and right-side incursions. Also, none of the studies discussed the magnitude or rate of the
steering deviation and few discussed the reaction times to individual driving behavior and the
24
transition time between driving behaviors. A detailed analysis of driving behavior in severe
avoidance scenarios at times-to-collision of greater than 2.8 seconds including incursions from
both the left and right side would enhance the existing literature on emergency avoidance
maneuvers. This analysis should include detailed magnitude, rate, and time analyses of each
driver behavior variable.
25

3.0 METHODS AND PROCEDURE
3.1 APPARATUS
3.1.1 Iowa Driving Simulator
The Iowa Driving Simulator (IDS) incorporates recent technological advances to create a highly
realistic automobile simulator. The IDS uses four multi-synch projectors to create a 190-degree
forward field-of-view and a 60-degree rear view. Motion cues are produced by a six-degree-of-
freedom motion base. The simulator dome features a fully instrumented vehicle cab. The vehicle
cab used in this study was a 1993 Saturn SL2. However, both the vehicle dynamics simulation
and the antilock brake system were modeled after a Ford Taurus, a typical mid-sized American
car. The Ford Taurus vehicle dynamics model used in this study was that developed by NHTSA
for use with the National Advanced Driving Simulator (NADS).
3.1.2 ABS Implementation
The experiments described in this report required a means of simulating the behavior of a vehicle
equipped with an antilock brake system (including the brake feel). The most accurate way of
capturing the pulsation of the brake pedal during ABS operation, as well as the proprietary
control algorithms used by manufacturers, was to develop a hardware-in-the-loop simulation
using actual antilock brake system hardware taken from a high-production passenger vehicle. An
accurate vehicle dynamic model (including the tire model) is needed to ensure that the ABS
performs correctly.
The procedure to implement ABS hardware on the Iowa Driving Simulator (IDS) was a two-part
development. First, to assess the feasibility of the proposed study, the hardware was stripped
from a vehicle and submitted to an open loop bench test. Once this task was successfully
completed, the ABS hardware was integrated with the IDS hardware, and the IDS vehicle
dynamics software was upgraded to generate the correct signals for the ABS system and to read
the correct output from the hardware.
3.1.3 Open Loop Bench Test
The open loop bench test involved playing back a set of wheel speeds recorded during an ABS
stop conducted in a 1994 Ford Taurus. As the wheel speed time histories were fixed no matter
what the ABS system did to the brake-line pressures, the control loop was not closed. This test
26

was undertaken as a first step to assess the feasibility of the proposed hardware-in-the-loop
experiment.
The entire ITT-Teves Mk IV antilock brake system was stripped from a 1992 Ford Taurus. The
ABS warning lamp, brake and pump relays, data-link connector, electronic control unit (ECU),
brake pedal position and stop light switches, engine compartment fuse panel, Hydraulic Control
Unit (HCU), front and rear brake calipers and rotors, the entire ABS wiring harness, tandem
master cylinder, vacuum brake booster, and brake pedal assembly were all removed from the
donor vehicle and mounted on a bench test platform. The rotors did not spin on the test platform,
but the calipers did push against them. The load-sensitive rear proportioning valves were not
removed from the donor vehicle; instead, two adjustable proportioning valves were installed in
each of the rear brake lines and the bias was set to the factory-specified values. Due to problems
during testing, the 1992 ECU was replaced with a compatible (but not identical) 1995 ECU.
Preliminary evaluation of the bench-mounted hardware revealed that the ABS pump and valves
would draw in excess of 30A while in operation, and that insufficient power would lead to
failure of the ABS. To prevent this from happening, the system was powered from a 12-Volt
automotive battery connected in parallel with a battery charger. A small electric vacuum pump
and a 0.5 ft3 reservoir were used to supply the necessary vacuum for the boost. The system was
able to maintain enough vacuum for two panic brake applications from 50 mph. This was
deemed sufficient for the bench testing.
Strain gauge type pressure transducers were installed on each of the four brake lines downstream
of the HCU at the flexible brake line connection point. The transducers were connected to wide-
band strain gauge amplifiers, and subsequently to a 12-bit A/D card installed in a 33 MHz
desktop PC. This system sampled the brake pressures at 100 Hz. Brake pedal force was
monitored using a load cell, however, as the bench test was run in an open-loop mode, the brake
pedal force was somewhat arbitrary. The PC also had a 12-bit D/A that was used to output four
voltages proportional to the wheel speeds.
The wheel speed data used for the bench test were recorded using a 1994 Ford Taurus. Initially, a
set of data was recorded during a straight-line stop from 50 mph on a low friction coefficient
(low-µ) surface (µmax=0.34, µsliding=0.11). A second set of data was recorded during a straight-
line stop from 50 mph on a split friction coefficient (split-µ) surface (left surface/µmax=0.34,
µsliding=0.11and right surface/µmax=0.81, µsliding =0.76). The data were only collected during the
deceleration phase of the drive, so a “ramp-up” section was pre-appended to the data. This ramp
up section gradually increased the wheel speeds from zero to 50 mph. The wheel speed data was
27
collected at 100 Hz (every 10 ms). Since the ABS ECU main loop time is 7 ms, there was
concern that the wheel speed data may have been sampled too slowly for accurate operation of
the ABS algorithm.
The ECU expects wheel speed signals in the form of an oscillatory waveform. Each wheel has a
toothed ring that passes by a stationary magnetic sensor. Since the ECU only looks at the edges
of the wheel speed signal, the exact shape of the waveform is not critical as long as the edges are
steep enough to be detected. A voltage-to-frequency converter (V-to-F) was used to simulate the
signal produced by the teeth passing by the sensor by generating a square wave whose frequency
was proportional to the applied voltage. The front and rear wheels of the 1992 Ford Taurus both
have toothed rings with 52 teeth. If the rolling radius of the tire is Re, the conversion from
velocity, V (m/s) to frequency, F (Hz) for the tire in free rolling is,
F = 52VR 2π ( 1)e
The rolling radius was determined by measuring the frequency of the wheel signal as a function
of forward speed. This was done on the Transportation Research Center Inc. high-speed test
track in East Liberty, Ohio using a 1992 Ford Taurus. The Taurus did not have rear-wheel drive,
so the back wheels were essentially free rolling. The V-to-Fs were calibrated with a set of four
capacitors to provide the correct scaling from the D/A output voltage to frequency.
Plots of brake-line pressures during an actual split-µ stop and a bench test simulated stop are
shown in Figures 3–1 and 3–2. In an attempt to emulate the brake application used by the driver
during the actual stop, an experimenter visually monitored their brake pedal force throughout the
simulation. Since this method is not extremely accurate, exact comparisons cannot be made
between the bench test and recorded data. Examination of the bench test and recorded brake-line
pressures and wheel speeds did show very similar trends.
Results for the low-µ stop are shown in Figures 3–3 and 3–4. The comparisons are similar to the
split-µ test. Note that in Figure 3-3, the LR and RR traces are not meaningful. The testing
which produced these traces was performed for another research program using a 1994 Ford
Taurus whose rear load-sensing proportioning valve had been disabled. As a result, this
vehicle’s brake system was not operating within manufacturer specifications. The increased
front-bias state prohibited the rear line pressures from building to the extent they would have
otherwise been expected to.
28

1100
Bra
ke L
ine
Pre
ssur
e (p
si)
Bra
ke L
ine
Pre
ssur
e (p
si)
1000
900
800
700
600
500
400
300
200
100
0
LF RF LR RR
0 1 2 3 4 5 6 7 8 9 10 11
Figure 3–1. 1994 Ford Taurus 0.5 g split-µ stop
1100
1000
900
800
700
600
500
400
300
LF RF LR RR
200
100
0
0 1 2 3 4 5 6 7 8 9 10 11
Figure 3–2. Bench test 0.5 g split-µ stop
29

600
500
LF RF LR RR
Bra
ke L
ine
Pre
ssur
e (p
si)
Bra
ke L
ine
Pre
ssur
e (p
si)
400
300
200
100
0
0 2 4 6 8 10
Figure 3–3. 1994 Ford Taurus low-µ stop
800
700
600
500
400
300
200
LF RF LR RR
100
0
0 2 4 6 8 10
Figure 3–4. Bench test low-µ stop
30

Based on Figures 3-1 through 3-4, the behavior of the ABS hardware during the bench test and
the in-vehicle ABS operation was similar enough to warrant development of the hardware-in-the-
loop simulation.
3.1.4 Hardware Installation
The cab used for the current experiment was a 1993 Saturn. The 1992 Taurus ABS hardware,
including the 1995 ECU, was integrated into the 1993 Saturn cab. The Taurus master cylinder
was mounted to the Saturn firewall using an extremely stiff adapter plate. The brake pedal
assembly from the Saturn was modified to match the mechanical advantage between the pedal
end and master cylinder push rod pin in the Taurus by moving the master cylinder rod pin
location on the pedal assembly. This ensured that the Saturn pedal geometry would be
maintained yet provided the appropriate scaling of applied force and displacement to match the
Taurus system. An adjustable-length master cylinder push rod was manufactured and adjusted to
give proper vacuum booster operation. The Taurus brake pedal travel switch, used by the ABS
system to prevent excessive pedal displacement during ABS operation, was fitted to the Saturn
pedal. The standard Saturn brake light switch was used in place of the Taurus switch. A separate
40 A power supply with a large external capacitance was used to power the HCU. A large-
capacity vacuum pump with a regulator was used to supply 20 inches of mercury to the vacuum
boost canister.
The ignition switch was wired into a digital output channel of the Saturn cab I/O system. This
digital line was used to turn the ABS system on and off. The ABS status light signal from the
ECU was connected to a digital input line on the Saturn cab I/O system. This line was connected
to allow the simulation software to detect ABS failures. Twisted pair shielded cables were used
to connect four channels of an analog input board mounted in the real-time host (Concurrent
Nighthawk 6800) to the brake line pressure transducers. Twisted pair shielded cables were also
used to connect four channels from an analog output board mounted in the real-time host to the
inputs of the V-to-Fs. Care was taken to ensure maximal noise rejection on all cabling. The
Saturn I/O system analog input and analog output boards were not used because the data transfer
rates from the Saturn I/O system to the real-time host were too slow to support proper ABS
operation.
The entire Taurus ABS hardware was mounted in an enclosure bolted to the floor of the IDS
motion system next to the Saturn cab passenger door. A long rubber hose was used to connect
the master cylinder reservoir with the HPU reservoir. The hose was routed to ensure there would
31

be no entrapped air bubbles. The entire system was filled with hydraulic fluid and bled to remove
all air.
3.1.5 Software Implementation
The NADS Vehicle Dynamics Simulation, Release 4.0, software was integrated into the IDS
real-time system for this project. The 1994 Taurus model described by Salaani et al. (1997) was
used. The NADSdyna code uses the STI tire model modified by Salaani et al. (1998) and the
Iowa State tire dynamics described by Bernard and Clover (1995), and Clover and Bernard
(1998). A couple of modifications were made to the NADSdyna software. First, the integration
scheme was changed from 3rd order Adams Bashforth to 2nd order Adams Bashforth, and the
time step was changed from 2 ms to 4.166 ms. The larger time step was required to meet the
real-time constraint on the Concurrent Nighthawk 6800. Because this larger time step is near a
stability boundary for the 3rd order integration method, the accuracy of the solution was poor.
The 2nd order Adams Bashforth integration method has a larger stability boundary than the 3rd
order method, and therefore produced more accurate results for this time step.
NADSdyna has a kinematic model of the steering system hardware from the wheel hub to the
steering rack. A rudimentary model of the steering system from the rack to the steering wheel
was added to the NADSdyna code to calculate the torque at the steering wheel. This torque was
used to drive the Saturn cab control loader. The simple steering model included a saturated
viscous damper (to simulate coulomb friction in the system) and a non-linear steady-state boost
function. The boost function was given by,
2Kboost = −3.37x10⁻⁸ Frack − 8.57x10⁻⁵ Frack + 0.3 ( 2)
The torque applied to the steering wheel is equal to the force on the rack multiplied by Kboost. The
coulomb friction force added onto the rack was defined to be,
Ffric = 300 if vrack > 0.8
Ffric = 300 vrack otherwise
( 3)
0.8
where Ffric is the friction force in Newtons and vrack is the velocity of the rack in m/s.
The ITT-Teves ABS algorithms are proprietary and details regarding the potential time stamping
of edges could not be ascertained. It was known however, that the main loop executed every 7
ms. Given the lack of information regarding the controller, an experiment was run to determine if
32

33
a vehicle dynamics model time step of 4.166 ms would result in accurate ABS behavior. For this
experiment a simplified vehicle model was combined with the previously described tire model.
This simplified model took less than 1ms to execute on the Nighthawk 6800. To keep the time
delays associated with brake-line pressure sampling and wheel speed output to a minimum, a
separate program was used to sample the brake line pressures and output the wheel speeds. This
program always ran at 1 ms intervals. The pressure data was put into global memory and the
wheel speeds were read out of global memory for each iteration. A spring-loaded actuator was
used to load the brake pedal in a consistent manner. The actuator load was always on the brake
pedal, but the software ignored the brake-line pressures until a specified speed was reached. At
this speed, the throttle was disconnected (in the software), and the brake pressures were applied
to the vehicle model. It was found that time steps as large as 4.166 ms could be used without a
noticeable change in ABS performance (at least for the surface friction coefficients tested). Very
low coefficient surfaces may require higher update rates to deal with the larger wheel
accelerations that can occur on these surfaces. Figures 3–5 to 3–7 compare the wheel speeds and
brake-line pressures for this simplified model running at 1000 Hz and 240 Hz on a high-µ
surface.
7x10⁶
6
5
4
3
2
1
0
Line
Pre
ssur
e (M
Pa)
0.80.60.40.20.0(s)
front-left rear-left rear-right front-right
1000Hz
Figure 3–5. Line pressures, simplified model, 1000 Hz
Bra
ke L
ine
Pre
ssur
e (P
a)

34
7x10⁶
6
5
4
3
2
1
0
Line
Pre
ssur
e (M
Pa)
0.80.60.40.20.0(s)
front-left rear-left rear-right front-right
240Hz
Figure 3–6. Line pressures, simplified model, 240 Hz
80
70
60
50
Whe
el S
peed
(ra
d/s)
0.80.60.40.20.0(s)
240Hz 1000Hz
Figure 3–7. Wheel speeds, simplified model, 240 and 1000 Hz
Based on these experiments, and the computational constraints, the vehicle dynamic model was
evaluated every 4.166 ms. The program that outputs the wheel speeds and reads the line
pressures was run at 1ms intervals and always used the most recent data available. The
accelerations and brake line pressures of simulated high-µ ABS stops for the fully integrated
NADSdyna Taurus model (running at 240 Hz) and the sampling program (running at 1000 Hz)
are shown in Figures 3-8 and 3-9. S was operating correctly, and that the
Bra
ke L
ine
Pre
ssur
e (P
a)
Whe
el S
peed
(ra
d/s)
To confirm the AB

35
simulated braking responses were accurate, acceleration and brake line pressures were recorded
during an ABS stop on wet asphalt using a 1997 Chrysler Concorde.
shown in Figures 3-8 and 3-10. V controller as
the 1992-95 Taurus. h the tuning of the controller may not be exactly the same in the
two vehicles, it was expected to be similar, an assumption verified by comparison. According to
NHTSA data, the wet asphalt skid-pad number was roughly 90% of the dry asphalt skid-pad on
the same test surface.
-1.0
-0.8
-0.6
-0.4
-0.2
0.0
0.2
0.4
g’s
6s5432(s)
X Accel - sim. X Accel - veh.
Figure 3–8. Comparison of ABS deceleration of 1997 Concorde and simulated 1994 Taurus
Long
itudi
nal A
ccel
erat
ion
(g)
The results of this test are
The 1997 Concorde uses the same Teves Mark I
Althoug

36
1500
1000
500
0
Line
Pre
ssur
e (p
si)
10s8642(s)
front-left rear-left rear-right front-right
Figure 3–9. Brake line pressures, ABS, high-µ, simulated, 1994 Ford Taurus
1500
1000
500
0
Line
Pre
ssur
e (p
si)
8s642(s)
front-left front-right rear-left rear-right
Figure 3–10. Brake line pressures, ABS, wet asphalt, track, 1997 Chrysler Concorde
The simulated Taurus with the ABS hardware and the 1997 Chrysler Concorde show very
similar ABS braking performance. er since the deceleration run was
Bra
ke L
ine
Pre
ssur
e (p
si)
Bra
ke L
ine
Pre
ssur
e (p
si)
The Taurus stop is long

started at 65 mph, while the Concorde deceleration run was started at 50 mph. Although the
1997 Concorde braking data was not corrected to remove potential pitch effects, the similarity of
the decelerations suggests that either the Taurus tire testing used to fit the NADSdyna tire model
was done on a surface with a skid pad number close to the wet asphalt track, or the Taurus tire is
a harder compound tire with less traction than the tire used on the 1997 Concorde. Based on
these results, we concluded the ABS hardware and Taurus simulation were functioning correctly
on high-µ surfaces. All experiments in this study were performed on a simulated high-µ surface.
3.1.6 Video Instrumentation
In addition to data that objectively quantified subjects’ vehicle control inputs, four video cameras
recorded the events on videotape for later analysis (see Figure 3–11). The first view was shot
from just above the passenger’s seat next to the passenger door. This view over the driver’s right
shoulder showed the right side of the driver, all steering wheel movement, and the vehicle’s
instrument panel. The second view was shot from the dash near the driver’s door and showed the
driver’s face and all eye and head movement. The third view was shot from under the dashboard
and directed towards the driver’s feet. This view was designed to obtain any movement of the
driver’s foot between the gas and brake pedals. The fourth and final view was the forward view
of the driving environment that was being projected onto the screen.
Figure 3–11. Video Tape Configuration
37

An overlay of linked real-time data from the drive was superimposed on each video view. Both
sensor data and video data were collected at a rate of 30 Hz. Figure 3–11 also shows how the
following data was located on each of the views:
• the speed the subject was driving in miles per hour
• the steering wheel position in degrees from center, ranging from + 480 degrees (steering input to the left) to -480 degrees (steering input to the right)
• the normalized accelerator pedal position in proportion deviated from 0 (fully released) to 1 (fully depressed)
• the normalized brake pedal position in proportion deviated from 0 (fully released) to 1 (fully depressed)
• the distance to the center of the intersection in feet
• the frame number linking this data with all the data collected and stored on the computer (See section 3.5 on dependent variables for a description of all the data.)
3.2 SUBJECTS
Sixty females and 60 males between the ages of 25 and 55 participated in this study. Subjects
were recruited using advertisements placed in local newspapers and flyers distributed throughout
eastern Iowa. To be eligible, subjects had to have a valid driver’s license, pass the IDS health-
screening criteria, and not have previously participated in an IDS driving study.
3.3 EXPERIMENTAL DESIGN
The study used a 2 x 2 x 2 x 2 experimental design. The between-subjects factors were brake
type (ABS or conventional), speed limit (45 or 55 mph), TTI (2.5 or 3.0 seconds), and instruction
(ABS-specific or safety-only video).
Eighty subjects were assigned the ABS condition and 40 were assigned the conventional brake
system condition. To address the question of whether drivers are more likely to crash in an ABS-
equipped vehicle due to lack of knowledge about ABS, ABS instruction was included as an
independent variable. Of the 80 subjects in the ABS condition, 40 received ABS instruction and
40 received no ABS instruction. ABS instruction consisted of a short video with two parts—a
segment describing the nature of the IDS and safety precautions, and a segment illustrating ABS
operation and use taken from an original equipment manufacturer video designed for purchasers
of new vehicles. For the non-ABS control condition, subjects viewed only the IDS and safety
section of the video.
38

To assess whether drivers are more likely to have unsuccessful crash avoidance maneuvers in
ABS-equipped vehicles while traveling at higher speeds, a speed limit independent variable was
included in this study. The speeds chosen were 45 and 55 miles per hour (mph). Results for the
45 mph condition could be compared to results for the dry test-track study for the same speed.
TTI was defined as the time it took subjects to reach the intersection at their current velocity as
measured from a trigger point in the road. The purpose of this independent variable was to
examine whether subjects altered their collision avoidance strategy based on the time available to
respond to the event. TTI values of 2.5 and 3.0 seconds were selected for comparability with the
ABS test track study.
A counterbalance scheme was used to ensure that each condition accommodated for differences
in days, time of day, and gender differences.
The experiment took four and a half days to conduct. In general, each subject spent less than one
hour completing the experiment—about 15 minutes were spent in preparing for the drive
(consent forms, briefing and video), 15 minutes were spent in the simulator, and 30 minutes were
spent filling out a post-drive questionnaire.
3.4 PROCEDURE
To help ensure that subjects would not anticipate the intersection-incursion event, subjects were
informed that they would be driving for approximately 30 minutes. In actuality, the drive was
approximately 15 minutes in length, the scenario taking place along a fifteen-mile-long stretch of
two-lane rural roadway. In addition, subjects were told that their task was to assess the looks and
feel of the simulator and that they would be given a questionnaire to collect their impressions on
this topic after their drive.
When subjects entered the simulator, an experimenter seated inside the vehicle instructed them to
adjust the seat and mirrors. The subject was then told to begin driving. During an initial portion
of the drive during which no data were collected, the experimenter allowed the subject to get
comfortable with the feel of the simulator. The subject started the five-mile practice portion of
the drive on the roadway shoulder. After two vehicles passed from behind, the subject was
instructed to merge and practice steering and braking and accelerating. This was to ensure that
the subject had experience controlling the vehicle prior to the intersection incursion.
Approximately five minutes into the drive, subjects were asked to begin to drive normally and to
assess the simulator.
39

Red and white stripes on the roadway indicated the beginning of the actual drive and the
beginning of data collection. The speed limit was either 45 or 55 mph throughout the drive.
Seven miles into the actual drive, subjects came upon a slow-moving semi tractor-trailer (i.e.,
truck) driving 40 mph (see Figure 3–12). The truck approached a hill and slowed to 25 mph,
maintaining this speed while climbing the hill. Thus, subjects driving behind the truck were also
required to reduce their speed to approximately 25 mph. Oncoming traffic was spaced at six
vehicles per mile in order to eliminate the possibility of passing. Once the subject had crested the
hill, the truck pulled over and stopped on the shoulder of the roadway and the subject was able to
return to driving at the posted speed limit.
Intersecting vehicle
Slow truck on hill
Start of data collection
Practice drive
15 miles
End of scenario
Speed limit 45 or 55 mph throughout drive
Figure 3–12. Map of the simulated drive
Shortly thereafter, another vehicle called the lead vehicle appeared 400 feet ahead of the subject
vehicle traveling 40 mph. As the subject moved closer to the vehicle, it accelerated to maintain a
headway of 6 seconds. The purpose of the lead vehicle was to encourage the subject to feel that
there was no need to slow down or stop at the intersection ahead, and that nothing out of the
ordinary would occur. As the subject vehicle approached the intersection where the incursion
would take place, the lead vehicle could be seen by the subject as it drove through the
40
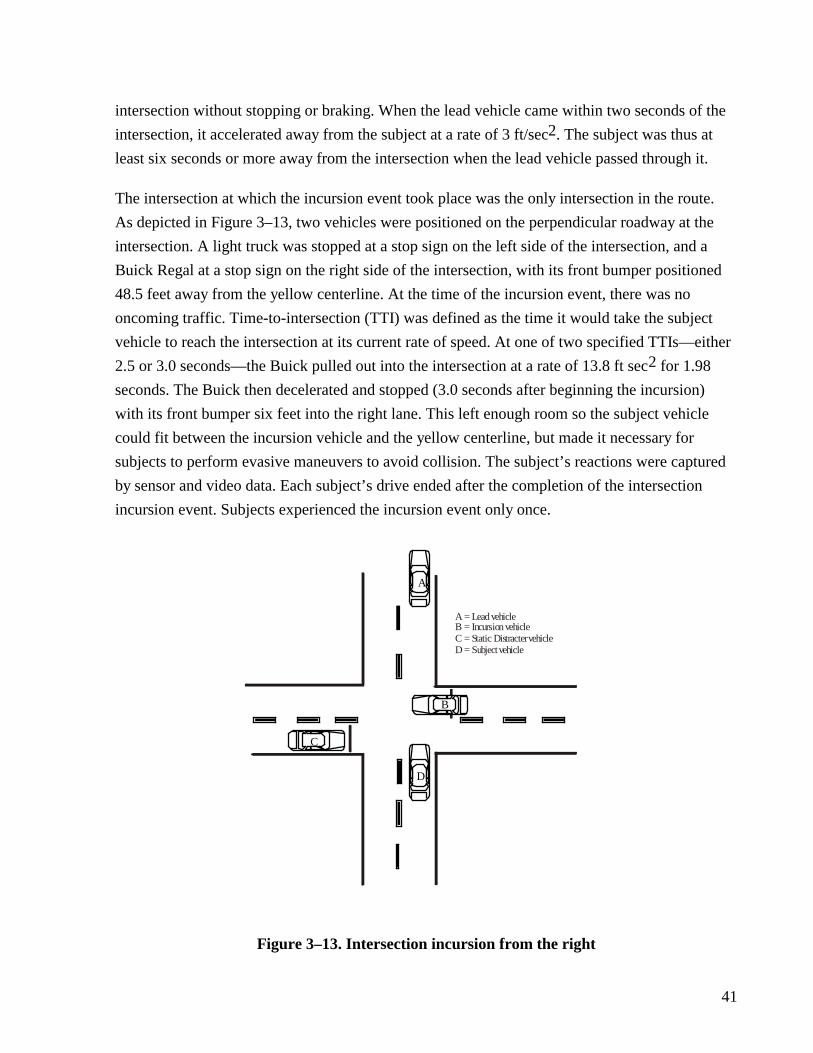
intersection without stopping or braking. When the lead vehicle came within two seconds of the
intersection, it accelerated away from the subject at a rate of 3 ft/sec2. The subject was thus at
least six seconds or more away from the intersection when the lead vehicle passed through it.
The intersection at which the incursion event took place was the only intersection in the route.
As depicted in Figure 3–13, two vehicles were positioned on the perpendicular roadway at the
intersection. A light truck was stopped at a stop sign on the left side of the intersection, and a
Buick Regal at a stop sign on the right side of the intersection, with its front bumper positioned
48.5 feet away from the yellow centerline. At the time of the incursion event, there was no
oncoming traffic. Time-to-intersection (TTI) was defined as the time it would take the subject
vehicle to reach the intersection at its current rate of speed. At one of two specified TTIs—either
2.5 or 3.0 seconds—the Buick pulled out into the intersection at a rate of 13.8 ft sec2 for 1.98
seconds. The Buick then decelerated and stopped (3.0 seconds after beginning the incursion)
with its front bumper six feet into the right lane. This left enough room so the subject vehicle
could fit between the incursion vehicle and the yellow centerline, but made it necessary for
subjects to perform evasive maneuvers to avoid collision. The subject’s reactions were captured
by sensor and video data. Each subject’s drive ended after the completion of the intersection
incursion event. Subjects experienced the incursion event only once.
A = Lead vehicle B = Incursion vehicle C = Static Distractervehicle D = Subject vehicle
B
A
C
D
Figure 3–13. Intersection incursion from the right
41

3.5 DEPENDENT VARIABLES
To isolate driver behavior, a number of variables were captured and recorded to a data file at 30
hertz. These variables were:
• subject number
• gender
• condition subject was assigned
• simulator frame number associated with this data stream
• absolute time from approximately 7500 feet from the intersection
• distance-to-intersection in feet
• time-to-intersection in hundredths of a second
• speed the subject was driving in miles per hour
• steering wheel position in degrees from center ranging from + 480 degrees (steering
input to the left) to -480 degrees (steering input to the right)
• accelerator pedal position normalized from 0 (fully released) to 1 (fully deviated)
• brake pedal position normalized from 0 (fully released) to 1 (fully deviated)
• lane position in meters deviated from the center of the lane
• longitudinal acceleration in feet per second squared
• lateral acceleration in feet per second squared
• brake pedal force in pounds
• whether there was a collision with the encroaching vehicle
• when the encroaching vehicle started to move in absolute time
• distance the encroaching vehicle moved in feet
• center of gravity of subject vehicle in lane
In addition to these data, subjects filled out several questionnaires that asked specific questions
about their driving experience (see Appendixes F and G for these questionnaires). The in-vehicle
experimenter log sheets and the videotape analysis were also used to determine driver behavior
when a collision occurred, and the circumstances surrounding the collision.
42

3.5.1 Videotape Analysis
All the videotapes were analyzed in detail to verify the results found in the in-vehicle log sheets
and to determine driver behavior before and after the vehicle incursion. The following in-vehicle
log sheet information was verified: subject avoidance behaviors, subject vehicle position in the
lane and on the roadway, whether the subject collided with the encroaching vehicle, and the
impact location on the encroaching vehicle. During this verification analysis, the final outcome
for successful maneuvers was also noted. Subjects could avoid the encroaching vehicle by
swerving around it to the right, swerving left around it, or braking to a stop prior to reaching the
intersection.
The videotapes were also used to determine time-to-driver behavior and transition time between
driver behaviors. All times were defined from the point at which the encroaching vehicle began
to move. Driver behaviors of interest included releasing or pressing the accelerator, releasing or
pressing the brake pedal, and turning the steering wheel. The videotapes were viewed frame by
frame to determine the point at which subjects began to perform each of these behaviors. The
four primary time-to-driver behaviors were accelerator release, brake press, full brake, and
steering. Accelerator release was defined as the point at which the subject’s foot started to
release the accelerator; brake press occurred when the subject’s foot was over the brake pedal;
full brake was defined as the point at which the brake pedal was fully depressed as determined
using the on-screen value of brake pedal position normalized from 0 (fully released) to 1 (fully
applied); and steering was said to occur when the subject initiated a steering input of at least six
degrees at a rate of at least 0.5 degrees every 0.033 seconds. These definitions were also used to
determine all transition times between the release of the accelerator and full depression of the
brake pedal. For example, transition time from accelerator release to brake press was defined as
the time between when the subject began to release the accelerator to the subject’s foot being
over the brake pedal.
43

4.0 RESULTS
The wide array of dependent measures recorded for this study (see Methods section) were
grouped into three categories: initial responses, emergency steering/braking measures, and final
outcome (crash, impact speed, road departure, etc.). A separate analysis of variance (ANOVA)
was conducted for each measure (initial response time, steering, and braking), using a 2 (brake
system) x 2 (instruction) x 2 (TTI of 2.5 or 3.0 seconds) x 2 (speed limit 45 or 55 mph) between-
subjects model to test for significant differences in each of the experimental factors. In addition,
crash outcome was analyzed using logistic regression.
The experimental results are presented in the following order:
• overall effects of brake system
• effects of instruction
• effects of TTI
• effects of speed limit
4.1 OVERALL FINDINGS AND EFFECTS OF BRAKE SYSTEM
4.1.1 Initial Responses and Response Times
Driver crash-avoidance behavior was examined relative to the initial movement of the
encroaching vehicle. Time-to-accelerator-release, time-to-brake-press, and time-to-first-steering
were analyzed along with transition times between these behaviors.
Time-to-accelerator-release. Almost all of the 120 subjects released the accelerator as their
initial response to the vehicle incursion (one subject steered > 6 degrees first). The overall mean
accelerator release time in response to the incursion event was 0.97 seconds. Seven subjects
released the accelerator prior to the incursion event and were not included in this particular
analysis. No significant differences were found between brake response times for subjects in the
two brake conditions.
Time-to-brake-press. Brake press was defined as the point at which a subject’s foot was located
over the brake pedal. The overall mean brake response time was 1.14 seconds. The two brake
system types were not found to have a significant effect on brake response times.
44

Time-to-first-steering. First steering was defined as the point at which the subject had made a
steering input of 6 degrees. The overall average steering response time was 1.65 seconds. No
significant differences were found between the response times to first steering.
Transition times. Overall average transition times were calculated between these initial
responses, as well as between the initial responses themselves and their respective maximum
reactions. The mean accelerator-to-brake transition time was 0.17 seconds, while the mean
brake-to-full-brake transition time was 1.06 seconds. The mean accelerator-to-steering transition
time was 0.68 seconds, and the steering-to-full-steering transition time was 1.74 seconds.
4.1.2 Emergency Braking and Steering Responses
Crash Avoidance Strategy. All 120 subjects used some form of steering and braking input in an
attempt to avoid colliding with the scenario vehicle as it encroached into their lane. Ninety-five
subjects (79 percent) applied the brakes before steering. Five subjects (4 percent) initiated
braking and steering inputs simultaneously. Twenty subjects (17 percent) steered before applying
the brakes.
Initial steering input was defined as the first steering input of a magnitude greater than six
degrees made after the encroaching vehicle had begun to move. In this study, 72 subjects (60
percent) steered to the left for their initial steering input, and 48 (40 percent) steered to the right.
The measure “avoidance steering input” was defined to identify that steering input which the
subject attempted in order to maneuver around the crossing vehicle. This measure was
operationally defined as the steering input that was in progress as the subject vehicle passed
through the plane of motion of the encroaching vehicle. This input was not necessarily the
subject’s first steering input in response to the incursion. During the collision avoidance
maneuver, 103 subjects (86 percent) attempted to steer left of the encroaching vehicle and 17 (14
percent) attempted to steer right to avoid a collision. Thirty-seven of the subjects who steered left
crashed (35.9 percent), while five of those who steered right crashed (29.4 percent).
Steering Behavior. Maximum steering input was measured in three ways: 1) “maximum steering
input” was defined as the greatest magnitude in degrees that the steering wheel deviated from the
zero degree midpoint, with a maximum of 480 degrees in either direction; 2) “maximum steering
range” summed the angular displacement from the greatest deviation to the left to the greatest
deviation to the right, and could produce a result as high as 960 degrees if the subject steered to
the “lock” on the left and the “lock” on the right while attempting to avoid the encroaching
45

vehicle; 3) “maximum steering rate” measured the maximum acceleration at which the steering
wheel was turned to obtain an estimate of the maneuver severity. To qualify for a single steering
wheel input, the rate could not drop below 0.5 degrees every 0.033 seconds and the input had to
be at least six degrees in magnitude.
The average magnitude of avoidance steering input observed was 148 degrees. The highest
observed avoidance steering input from an individual subject in this study was 540 degrees.
The average maximum steering rate obtained during the avoidance maneuver was 514 degrees
per second. The highest observed steering rate achieved by a single subject in this study was
1416 degrees per second. Ninety-five percent of steering rates observed were less than 981
degrees per second.
Table 4–1 presents mean emergency steering measures by brake system. As can be seen, brake
system type had a strong effect on steering in this study, with more severe steering generally
seen for subjects with conventional brakes than for those with ABS.
Table 4–1. Mean steering behavior measures by brake system (significant results in bold text)
Conventional ABS F RATIO P-Value Steering Behavior Brake System
Magnitude of avoidance steering 192 125 7.74 0.0064 input (degrees)
Maximum left steering input (degrees) 176 121 4.64 0.0334
Maximum right steering input 131 105 1.28 0.2615 (degrees)
Maximum steering input, right or left 212 131 10.87 0.0013 (degrees)
Maximum steering input rate 595 473 3.85 0.0524 (degrees per second)
Time to maximum steering input 3.687 3.239 8.14 0.0052 (seconds)
Maximum steering range (degrees) 284 222 2.66 0.1057
46
Brake type had a significant effect on the average magnitude of the avoidance steering input,
with an average of 125 degrees for ABS subjects compared to 192 degrees for conventional
brake subjects.
As described previously, a majority of subjects steered left for the avoidance maneuver. Of those
steering left, ABS subjects steered a significantly smaller magnitude (121 degrees) than did
subjects with conventional brakes (176 degrees). The maximum right-steering measure was also
greater for the conventional brake condition, but the difference was not statistically significant.
The “maximum steering input, right or left” measure again reflected these differences, with
means of 212 degrees for conventional brakes versus 131 degrees for ABS.
The average maximum steering rate of subjects’ avoidance maneuvers showed an almost
significant effect from the brake system, with the ABS subjects steering at a lower rate (473
degrees per second) than subjects in the conventional brake system condition (595 degrees per
second).
The time-to-maximum-steering input was likewise significantly affected by brake condition. On
average, subjects in the ABS condition reached their maximum steering 448 ms faster than those
with conventional brakes.
Maximum steering range was the only steering measure besides the maximum right steering
measure that did not show a nearly statistically significant effect due to brake type. Nevertheless,
here again, what differences did appear were in the direction of greater steering for conventional
brakes than for ABS.
Braking Behavior. The overall average maximum brake pedal force obtained was 90 pounds.
The highest observed brake pedal force input generated by a subject in this study was 278
pounds. Ninety-six percent of the subjects either activated ABS or locked the vehicle’s wheels
with conventional brakes during the avoidance maneuver.
Table 4–2 presents braking measure data for the two brake system types. A t-test found a
significant difference in brake pedal duration, with longer duration for conventional brakes (3.12
seconds) than for ABS (2.69 seconds).
47

Table 4–2. Mean braking measures for conventional and ABS brake conditions
Braking Measure
Brake pedal duration (seconds)
Maximum Pedal Force (pounds)
Time to maximum pedal force (seconds)
Mean for conventional Mean for ABS
brake condition condition F-Ratio P-Value
3.12 2.69 4.18 0.0435
98.2 85.8 2.85 0.0944
2.115 2.246 0.38 0.5365
The other braking measures—maximum brake pedal force and time-to-maximum-braking—did
not show a main effect for brake system type.
4.1.3 Final Outcome
Road Departures. Eight people completely departed the roadway during the collision avoidance
maneuver. Six subjects made steering inputs severe enough to cause yaw rates resulting in some
degree of vehicle spin. In four of these six cases, the vehicle spun off the road.
The eight subjects who departed the roadway completely during collision avoidance were evenly
divided between the two brake conditions. Four of the 80 subjects in the ABS condition (5
percent) drove off the road totally; in each case the ABS was activated during the crash
avoidance maneuver. Four of the 40 subjects who had conventional brakes (10 percent) also left
the road completely.
All four instances of full road departure with ABS were at the 45 mph speed limit, whereas each
of the four road departures with conventional brakes was in the 55 mph speed limit condition.
Unfortunately, due to the small number of road departures observed in this test, it is difficult to
determine whether there is a significant brake-system-by-speed-limit interaction.
Six partial (two-wheel) road departures were also observed in this study. One of the cases
involved a subject driving with ABS, while the other five involved conventional brakes.
Crashes. Overall, 42 of the 120 subjects, or 35 percent, collided with the scenario vehicle as it
encroached into their lane. Subjects with ABS crashed less frequently (31 percent) than those in
the conventional brake system condition (43 percent), but this difference was not found to be
48

statistically significant by the ANOVA using the dichotomous “speed limit” variable. However,
since subjects did not always drive exactly 45 or 55 mph as instructed, it was felt that a more
predictive variable would be the “scenario entrance speed” (i.e., the speed at which a subject was
driving when the Buick began its incursion into the intersection). Therefore, a logistic regression
was carried out using dummy variables for TTI, brake type, and instruction, and a continuous
variable for scenario entrance speed. This logistic regression analysis did find a significant main
effect for brake type (p = 0.03).
4.2 EFFECT OF INSTRUCTION
Forty of the ABS subjects viewed videotaped ABS usage instructions; the other 40 subjects in
the ABS condition, and the 40 subjects in the conventional-brake condition, viewed a general
driver-safety video with no ABS instruction. Instruction was balanced throughout the ABS
conditions.
4.2.1 Initial Responses
The ANOVA found no significant differences between the group of 40 ABS subjects who
received ABS instruction and the other 40 ABS subjects who received no instruction.
4.2.2 Emergency Steering and Braking Behavior
Steering behavior. When tested with an ANOVA, none of the steering measures were found to
show a significant effect of instruction.
Braking measures. Separate ANOVAs were run for the braking variables of maximum brake
pedal pressure, maximum brake duration, and time-to-maximum braking. None of these showed
a significant effect of instruction.
4.2.3 Final Outcome
Roadway departures. As stated earlier, four of the 80 ABS subjects had all four wheels depart
the roadway during the avoidance maneuver. This number was divided equally between the
instruction and non-instruction conditions.
Crashes. Also as stated earlier, 31 percent or 25 of the 80 ABS subjects crashed into the
encroaching vehicle. Of the 40 subjects who received ABS instruction, 33 percent or 13 of 40
subjects crashed into the encroaching vehicle, while 30 percent or 12 of the 40 subjects who
49

were in the ABS condition but did not receive ABS instruction crashed into the encroaching
vehicle. This difference was not statistically significant.
Impact speed. No significant results were found for impact speed by instruction. The ABS
instruction group was found to have a significantly higher impact speed when compared ABS
subjects who did not receive instruction. The mean impact speed for ABS subjects who received
instruction was 32.5 mph versus 27.5 mph for ABS subjects who did not receive instruction.
4.3 EFFECT OF TTI
4.3.1 Initial Responses
Separate ANOVAs were run for the performance measures of time-to-accelerator-release, time-
to-brake-application, and time-to-first-steering. Several small but statistically significant main
effects for TTI were found for these initial-response time measures. On average, subjects in the
shorter (2.5 second) TTI condition were 78 ms slower to release the accelerator and 90 ms
slower to apply the brake than subjects in the longer (3.0 second) TTI condition. However, the
shorter-TTI subjects were 240 ms faster than the longer-TTI subjects on the time-to-first-steer
measure (see Table 4–3).
Table 4–3. Mean initial response time for subjects in the 2.5 second and 3.0 second TTI condition
Mean for shorter TTI Mean for longer TTI Response condition (2.5 seconds) condition (3.0 seconds) F-Ratio P-Value
Time-to-accelerator 1.014 0.936 3.7 0.0572 release
Time-to-brake- 1.183 1.093 6.45 0.0125 application
Time-to-first-steering 1.527 1.767 7.42 0.0075
4.3.2 Emergency Braking and Steering Behavior
Steering behavior. The ANOVA found no statistically significant main effects of TTI on steering
measures.
Braking behavior. Table 4–4 shows mean brake time by braking force for the two TTI groups.
The ANOVA revealed a significant effect of TTI on time-to-maximum-brake-pedal-force. The
50

average time was 321 ms faster for the shorter TTI group than for the longer. (This was despite
the slower initial time-to-brake-application seen for the shorter TTI group.)
Table 4–4. Mean brake time for subjects in the 2.5 second and 3.0 second TTI condition
Braking Measure Mean for shorter TTI Mean for longer F Ratio P-value
Maximum Pedal Force (pounds)
Time to maximum pedal force (seconds)
4.3.3 Final Outcome
condition TTI condition
90.9 89.0 0.04 0.8452
2.042 2.363 9.65 0.0024
Road departures. As noted above, there were too few road departures to analyze statistically.
Crashes. TTI was found to exert a strong effect on crash outcome. A logistic regression found a
statistically significant main effect for TTI (p<0.0001). Only 10 percent (6 of 60 subjects) in the
3.0 second TTI group crashed, as compared with 60 percent (36 of 60) in the 2.5 second TTI
group.
4.4 EFFECT OF SPEED LIMIT
4.4.1 Initial Responses
The ANOVA found no main effects of speed limit on the means for any of the following
variables: time-of-first-action, time-to-throttle-release, time-to-brake-application, and time-to-
first-steering.
4.4.2 Emergency Steering and Braking Behavior
Regardless of speed limit, subjects tended to brake first and steer later when attempting to avoid
colliding with the crossing vehicle. Speed limit did not have a significant main effect on any of
the steering or braking variables.
51

4.4.3 Final Outcome
Road departures. Four instances of road departure were observed for the 45 mph speed limit and
all of these involved the ABS-equipped condition. Each of the four road departures in the 55
mph condition involved subjects in the conventional brake condition.
Crashes. Forty two percent (40 percent ABS, 45 percent non-ABS) of those driving in the 55
mph speed limit collided with the encroaching vehicle. Only 28 percent (22 percent ABS, 40
percent non-ABS) crashed in the 45 mph condition. No differences were statistically significant.
4.4.4 Scenario Entrance Speeds
While subjects were instructed to drive at either 45 or 55 mph, they were free to vary their actual
speed from these values. The speed at which subjects were driving at the point just prior to the
intersection incursion was recorded as the “scenario entrance speed.” Figure 4–1 shows the
frequency distribution of scenario entrance speeds for subjects in the 45 and 55 mph speed limit
conditions. The differences in the two distributions demonstrate that subjects complied with the
speed limit to a large extent. The average scenario entrance speed for the 45 mph speed limit
condition was 45.6 mph; the average scenario entrance speed for the 55 mph condition was 53.2
mph.
��
��
�
�
�
�
� �� �� �� �� �� �� �� �� �� �� �� �� �� �� �� �� �� �� �� �� �� �� �� �� ��
�� ��� ����� ����� �� ��� ����� �����
�������� �������� ����� �����
Figure 4–1. Frequency distribution of scenario entrance speeds for subjects in the 45 mph and 55 mph speed limit conditions
������ �� ��������
52

4.5 SIMULATOR REALISM
A standard IDS post-drive questionnaire was used to assess subjects’ perceptions of the
simulator’s realism. Four questions were of particular interest for the present study—two
concerning the realism of the steering and two concerning the realism of the braking.
Lane maintenance. Figure 4–2 shows the distribution of subjects’ ratings when asked how
frequently they needed to make steering adjustments to stay in the lane in the simulator,
compared to their own vehicle. As can been seen, subjects tended to report needing to steer more
frequently in the simulator. Actually, since the simulated roadway was straight and smooth,
subjects were rarely required to steer to maintain their lane position. Therefore, reported
difficulties in maintaining lane position were self-induced and possibly affected by lack of
sufficient road feel.
��
��
��
��
��
��
��
��
�
� � ���� ����� � � � ���� � � � ���� �����
Figure 4–2. Lane maintenance rating
Steering tightness, stopping ability, and brake force ratings. Figures 4–3 through 4–5 depict the
distribution of subjects’ ratings for steering tightness, stopping ability, and required brake force
in the simulator, as compared to driving their own vehicle. As can be seen, most subjects found
the simulator was “just right” or nearly so for these three parameters.
������
��
��������
53

��
�� ������
��
��������
������
��
��������
��
��
��
��
�
� � ������ ��� ���������
��
��
��
��
��
��
��
�
� � ���� ������
� � � ���� ����� � � � ��� ������ ���������
Figure 4–3. Steering tightness rating
� � � ���� ���� � � � ���� ������
Figure 4–4. Stopping ability rating
54

��
������
��
��������
��
��
��
��
��
��
��
��
� � ��� ���� � � � ���� ����� � � � ���
���������
Figure 4–5. Brake force rating
55
5.0 DISCUSSION
This study was designed to assess driver behavior and associated reaction time using ABS and
conventional brakes in a crash avoidance scenario. The braking and steering behaviors of drivers
presented with an intersection incursion were of primary interest. Scenarios used an incursion
vehicle that started moving into an intersection at either 2.5 or 3.0 seconds time-to-intersection
(TTI). The vehicle intersected from the driver’s right side and blocked one-half of the driver’s
lane. These scenarios were designed to be surprise events in an effort to elicit emergency
avoidance behaviors. This research was designed to provide information on the following
research questions:
• Could over-steering or some other driver avoidance behavior account for the increase
in ABS-associated rollover crashes?
• How does the stability and control of either ABS or non-ABS contribute to the
control of a vehicle during crash avoidance circumstances?
• How does ABS instruction affect driver performance?
• What behaviors are associated with emergency avoidance in an intersection, and what
are the associated reaction times to these behaviors?
• What effect does speed have on the stability and control of ABS and non-ABS
equipped vehicles?
5.1 OVERALL EFFECTS OF BRAKE SYSTEM
5.1.1 Initial Responses and Response Times
Subjects’ braking, steering, and acceleration were monitored prior to their approach to the
intersection. Driver crash-avoidance behavior was examined relative to the initial movement of
the incursion vehicle. Time-to-accelerator-release, time-to-brake-press, and time-to-first-steering
were analyzed along with transition times between these behaviors. Nearly all of the 120 subjects
released the accelerator as their initial response to the vehicle incursion. The overall mean
accelerator-release time in response to the incursion event was 0.97 seconds. No significant
differences were found between initial brake and steering-response times for subjects in the two
brake conditions. This result was consistent with expectations, since brake type should not affect
initial response. Steering response times also did not vary by brake system type.
56

The questionnaires used to assess subjects’ opinions on the intersection scenario and the
simulator indicated that the incursion was an unanticipated event. Almost all subjects reported
that they approached the intersection as they usually would have in the real world. The
intersection incursion appeared to be a surprise event and subject interaction with the
encroaching vehicle appeared to be realistic and unbiased by suspicion. The videotape analysis
of the intersection incursion confirmed that most subjects were surprised by the encroaching
vehicle’s behavior. This indicates that the ruse protocol was effective. Furthermore, the lead
vehicle ahead of the subject was successful in ensuring that the subject would not anticipate that
the encroaching vehicle was a threat.
Finally, there was some concern that subjects would be distressed by being placed in an
emergency avoidance situation that often ended in collision. Most subjects, however, rated this
study as a positive experience. Facial expressions and verbal comments recorded on videotape
seem to indicate that the experience, although compelling, was not overly stressful.
5.1.2 Emergency Steering and Braking Behavior
All 120 subjects used some form of steering and braking input in an attempt to avoid colliding
with the scenario vehicle as it encroached into their lane. Ninety-five subjects (79 percent)
applied the brakes before steering. Five subjects (4 percent) initiated braking and steering inputs
simultaneously. Twenty subjects (17 percent) steered before applying the brakes. This
unanimous tendency to both brake and steer to avoid a crash was not seen in any studies
reviewed as background for this research. For example, Araki and Matsuura (1990) showed that
only 44 percent of subjects both braked and steered in response to a simulated pedestrian darting
into their path. Olson and Sivak (1986) found that 79 percent of subjects steered at some point
during their maneuver to avoid a crash with a piece of yellow foam rubber that appeared in their
lane. It is possible that the nature of the obstacle (degree of danger it presents to the driver) as
well as the perceived amount of time in which to avoid crashing into it may have an effect on
drivers strategy to avoid a collision in this type of scenario.
Initial steering input was defined as the first steering input of a magnitude greater than six
degrees made after the incursion vehicle had begun to move. In this study, 72 subjects (60
percent) steered to the left for their initial steering input, and 48 (40 percent) steered to the right.
Braking and steering responses by brake system type are important since the ultimate outcome of
a crash avoidance event is to successfully maneuver around the hazard (in this case the
encroaching vehicle). Successful avoidance is also affected by the time at which such incursions
57

occur—relative to the distance in time from the event. This study examined two different times
to intersection, 2.5 and 3.0 seconds. Subjects in the shorter TTI reacted significantly slower
overall relative to those subjects in the longer TTI condition in both the accelerator release (78
ms slower) and initial brake press (90 ms). This same effect was also found in previous braking
studies on the IDS (McGehee et al 1996). This suggests that there may be a “point of no return”
at which drivers are committed to an action. Subjects may have dismissed the likelihood of the
vehicle encroaching and shifted their attention to the forward roadway and thus had a larger
delay in reacting.
The measure “avoidance steering input” was defined to identify that steering the subject
attempted in order to maneuver around the crossing vehicle. This measure was operationally
defined as the steering input that was in progress as the subject vehicle passed through the plane
of motion of the incursion vehicle. This input was not necessarily the subject’s first steering
input in response to the incursion. During the collision avoidance maneuver, 103 subjects (86
percent) attempted to steer left of the encroaching vehicle and 17 (14 percent) attempted to steer
right to avoid a collision. Thirty-seven of the subjects who steered left crashed (35.9 percent),
while five of those who steered right crashed (29.4 percent). It should be noted that there was no
oncoming traffic so subjects were able to clear the encroaching vehicle without risking a head-on
crash.
250
200
150
100
50
0
Magnitude of Avoidance Steering Inputs (degs)
125
192
ABS Conventional
Figure 5–1. Magnitude of steering by brake type
58

In perhaps the strongest results of this study, subjects with ABS clearly demonstrated
significantly greater stability and control in regard to steering relative to those with conventional
brakes. Subjects with ABS did not have such large steering inputs as shown in Figure 5-1.
The large steering inputs seen in the conventional brake condition indicate less control relative to
the ABS condition. Large differences were also found for steering in the maximum steering to
the left, maximum steering rate and time-to-maximum steering rate.
5.2 EFFECTS OF INSTRUCTION
The effect of instruction was a key issue in this study since it is widely believed that drivers lack
instruction in 1) how ABS operates mechanically, and 2) how ABS affects the “feel” of braking
when activated. With ABS, the brake pedal back pressure paired with the vibration may startle
some drivers into releasing the brake pedal. It should be noted that this study did not examine
the effect of different brake pedal back pressures. However, the Taurus brake model back
pressure used for this study can be compared to the NHTSA VRTC test track study that was
conducted in parallel.
The instruction results showed no significant effects. The ABS instruction group was found to
have a somewhat (not significant) higher impact speed when compared to the result for ABS
subjects who did not receive instruction. The mean impact speed for ABS subjects who had
received instruction was 32.5 mph, while subjects who did not receive instruction had a mean
impact speed of 27.5 mph. As there was no statistical difference in the number of crashes
between instruction and non-instruction groups, this must be viewed as a detrimental result.
One limitation of this study was that subjects were instructed passively on ABS. In other words,
they had no direct experience of ABS in their instruction, and were not given the opportunity to
practice using the ABS prior to the emergency maneuver. This was done in order to protect the
ruse, and points to the challenge of this type of experimental measure. It is difficult to train
subjects completely in the proper use of systems such as ABS in crash avoidance without giving
away the fact that you are interested in crash avoidance behavior and thus exposing the
“evaluation of simulator fidelity” ruse. It may not be possible to truly examine this factor
accurately without doing longer, field-based studies. Again, the VRTC test track study should
provide more information relating to this effect.
Since lack of training seems to be a factor in terms of early brake release due to pedal feedback,
a second analysis was conducted to examine whether subjects released their feet when the brake
59

pedal began to vibrate. None of the subjects released the brake at vibration onset; thus, this did
not seem to be an effect. Nor did the questionnaire data flag any anomalies in the ABS feel
relative to the conventional brakes.
5.3 EFFECTS OF TTI
To determine at what point in time an encroaching vehicle became a threat to the subject driver,
time-to-intersection was included in this study. When a driver must react to a threat affects the
driver’s strategy in avoiding a crash, as well as the ensuing stability and control of the vehicle.
Generally, the farther back a driver begins an avoidance maneuver the more the brakes will be
used, and the closer the driver is to a collision threat the more he or she will steer (McGehee et
al., 1996). ABS-equipped vehicles are likely to show a benefit in cases where the driver requires
both steering and braking, that is, at the midpoint of these extremes.
This study examined two different times-to-intersection—2.5 and 3.0 seconds. These values
were based on a VRTC test track study. Subjects in the shorter TTI reacted significantly slower
than those who had more time to react in the longer TTI condition in both the accelerator release
(78 ms slower) and initial brake press (90 ms). This same effect was found in previous braking
studies on the IDS (McGehee et al., 1996). As mentioned previously, this suggests that there may
be a “point of no return” at which drivers are committed to going through an intersection.
Subjects may have dismissed the likelihood of the vehicle encroaching and shifted their attention
to the forward roadway, thus delaying their reaction.
Time-to-steering behavior showed an opposite result in terms of driver reaction. While subjects
in the short TTI released the accelerator later, their steering reaction was significantly faster than
that of subjects in the longer TTI. This is consistent with previous hypotheses that drivers’
steering is the more important factor in extreme avoidance actions.
5.4 EFFECTS OF SPEED LIMIT
Because speed is also related to driver collision avoidance strategy and the stability and control
of the vehicle, multiple speed limits were used as a factor for this study. While no significant
differences were found for any of the speed-related variables, individual strategies were
quantified. For instance, almost all subjects tended to brake first and steer later when attempting
to avoid colliding with the crossing vehicle. Speed limit did not have a significant main effect on
any of the steering or braking variables. However, as the slower speed of 45 mph did show a 22
percent ABS crash rate relative to a 40 percent conventional brake crash rate, this result would
60

likely be significant if the number of subjects in the conventional brake conditions matched the
ABS condition (80 subjects were in ABS and 40 in conventional). A significant difference in
this case would likely be due to the increased stability and control of ABS. Since there was no
statistical difference in the two speed groups, a separate analysis was conducted that attempted to
pair actual intersection entrance speeds. The analysis determined that the two distributions
demonstrate that subjects complied with the speed limit to a large extent.
61

6.0 CONCLUSIONS
To determine whether some aspect of driver behavior may be counteracting the potential benefits
of ABS in a crash-imminent situation, this study examined driver crash avoidance behavior as a
function of a vehicle’s brake system and various other factors.
One of the theories that this study sought to address was whether the apparent increase in single-
vehicle crashes involving ABS-equipped vehicles was due to characteristics of driver steering
and braking behavior in crash-imminent situations. According to this theory, in situations of
extreme, panic braking, drivers may have a tendency to brake hard and make large steering
inputs to avoid a crash. Without four-wheel ABS, aggressive braking may lock the front wheels
of the vehicle, eliminating directional control capability and rendering a driver’s steering
behavior irrelevant. With four-wheel ABS, the vehicle’s wheels do not lock; as a result, the
vehicle does not lose directional control capability during hard braking, and the driver’s steering
inputs continue to be effective in directing the vehicle’s motion. Such directional control could
mean that drivers gain the potential to avoid multi-vehicle crashes by driving off the road and
experiencing single-vehicle crashes.
Towards this end, the following questions were asked:
1. Could over-steering or some other driver avoidance behavior account for the increase in
ABS-associated rollover crashes?
The results of this study indicate that for simulated intersection incursions, over-steering or other
behaviors that cause a loss of control and/or rollover effects did not show a significant effect
with vehicles equipped with ABS.
2. How does the stability and control of either ABS or non-ABS contribute to the control of the
vehicle during crash avoidance circumstances?
The results of this study show overwhelmingly that ABS-equipped vehicles have increased
stability and control in simulated intersection incursions.
3. How does ABS video taped based instruction affect driver performance?
Overall, video taped based instruction was not found to be effective in this experiment.
4. What behaviors are associated with emergency avoidance in an intersection incursion and
what are the associated reaction times to these behaviors?
62

All 120 subjects used some form of steering and braking input in an attempt to avoid colliding
with the scenario vehicle as it encroached into their lane. Ninety-five subjects (79 percent)
applied the brakes as their initial response before steering. Five subjects (4 percent) initiated
braking and steering inputs simultaneously as an initial response. Twenty subjects (17 percent)
steered before applying the brakes. Furthermore:
• The overall mean accelerator release time in response to the incursion event was 0.97
seconds.
• The overall mean brake response time was 1.14 seconds.
• The overall average steering response time was 1.65 seconds.
• The mean accelerator-to-brake transition time was 0.17 seconds, while the mean brake-
to-full-brake transition time was 1.06 seconds. The mean accelerator-to-steering
transition time was 0.68 seconds, and the steering-to-full-steering transition time was
1.74 seconds.
5. What effect does speed have on the stability and control of ABS and non-ABS equipped
vehicles?
While no significant differences were found for any of the speed-related variables, individual
strategies were quantified. For instance, almost all subjects tended to brake first and steer later
when attempting to avoid colliding with the crossing vehicle. Speed limit did not have a
significant main effect on any of the steering or braking variables. However, as the slower speed
of 45 mph did show a 22 percent ABS crash rate relative to a 40 percent conventional brake
crash rate, this result would likely be significant if the number of subjects in the conventional
brake conditions matched the ABS condition (80 subjects were in ABS and 40 in conventional).
The difference, if significant, would likely be due to the increased stability and control of ABS.
63

6.1 RECOMMENDATIONS FOR FUTURE STUDY
The intersection incursion scenario for this study proved effective in testing extreme crash
avoidance reactions by drivers. The scenario captured true, unalerted driver reaction time
because of the sophisticated ruse and secondary scenarios that were set in place. These have been
proven effective in a number of crash avoidance studies conducted for NHTSA, and should be
continued for the NADS.
The one experimental design tradeoff made for this study due to budget considerations was
having an unbalanced design in terms of baseline drivers. While having 40 drivers was adequate
for direct experimental comparisons, as soon as variables like brake instruction were collapsed,
an imbalance occurred.
A future study for the NADS would be one that examined run-off-road crash scenarios. This
would provide additional data towards the goals of the overall NHTSA research program.
64

7.0 REFERENCES
Araki, K., Matsuura, Y. (1990). Driver’s response and behavior on being confronted with a pedestrian or a vehicle suddenly darting across the road (SAE Technical Paper 900144). Detroit, Michigan: International Congress and Exposition.
Barr, A, Norup, H. (1994). Anti-lock braking systems study. Markham, Ontario, Canada: Vehicle Information Center of Canada. In Evans, L. (1995). ABS and relative risk under different roadway, weather, and other conditions (SAE Technical Paper 950353).
Barrett, G., Kobayashi, M., & Fox, B. (1968). Feasibility of studying driver reaction to sudden pedestrian emergencies in an automobile simulator. Human Factors, 10(1), 19–26.
Beno J. (1992). An observational study of driver selection of gaps at intersections in urban areas. Washington, D.C.: AAA Foundation for Traffic Safety.
Bernard, J. E., & Clover, C. L. (1995). Tire modeling for low-speed and high-speed calculations (SAE Technical Paper 950311).
Chovan, J. D., Tijerina, L., Pierowicz, J. A., & Hendricks, D. L. (1994). Examination of unsignalized intersection, straight crossing path crashes and potential IVHS countermeasures.
Clover, C. L., & Bernard, J.E. (1998). Longitudinal Tire Dynamics. Vehicle System Dynamics, 29(4), 231–259.
Evans, L. (1995). ABS and relative risk under different roadway, weather, and other conditions (SAE Technical Paper 950353).
Ferrandez, F., & Fleury, D.. In Malaterre, G, Ferrandez, F, Fleury, D., & Lechner, D. (1988). Decision making in emergency situations. Ergonomics, 31(4), 643–655.
Ferrandez, F., Fleury, D., & Lepesant, C. (1984). Analyse typologique des manoeuvers d’urgence. Rapport ONSER. As cited in Malaterre, G; Ferrandez, F; Fleury, D.; Lechner, D.; (1988). Decision making in emergency situations. Ergonomics, 31(4), 643–655.
Highway Loss Data Institute. (1994). Insurance Special Report: Collision and property damage liability losses of passenger cars with and without anti-lock brakes. (January) A-41.
Howarth, C. (1988). The relationship between objective risk, subjective risk, and behaviour. Ergonomics, 31(4), 527–535.
Huguenin, R. (1988). The concept of risk and behaviour models in traffic psychology. Ergonomics, 31(4), 557–569.
65

Karpf, Williams (1983). as cited in. Baker, S. P.; O’Neill, B.; Ginsburg, M. J.; Li, G. (1992). The Injury Fact Book Second Edition. Oxford University Press. New York, New York.
Knipling, R., Hendricks, D., Koziol, J., Allen, J., Tijerina L., & Wilson, C. (1992). A front-end analysis of rear-end crashes. NHTSA technical report.
Koppa, R. & Hayes, G. (1976). Driver inputs during emergency or extreme vehicle maneuvers. Human Factors 18(4), 361–370.
Kullgren, A., & Tingvall, C. (1994). The effectiveness of ABS in real life accidents (No. 94 S4 O 07). Paper presented at the 14th International Technical Conference on the Enhanced Safety of Vehicles, Experimental Safety Vehicles Conference, München, Germany.
Lechner, D., & Malaterre, G. (1991). Emergency maneuver experimentation using a driving simulator (SAE Report No 910016). Presented at Autotechnologies 5th Conference and Exposition, Monte Carlo, Monaco.
Lerner, N. (1993, October). Brake perception reaction times of older and younger drivers. Proceedings of the Human Factors and Ergonomics Society 37th Annual Meeting, 206– 210.
Malaterre, G, Ferrandez, F., Fleury, D., & Lechner, D. (1988). Decision making in emergency situations. Ergonomics, 31(4), 643–655.
Malaterre, G.; Peytavin, J. F. (1986). L’analyse de la tache appliquee a Petude detaillee d’accidents. Revue RTS, no 9-10, 21-26. As cited in Malaterre, G; Ferrandez, F; Fleury, D.; Lechner, D. (1988). Decision making in emergency situations. Ergonomics, 31(4), 643-655.
Malaterre, G.; Peytavin, J. F.; Jaumier, F.; Kleinmann, A. (1987). L’estimation des manoeuvers realisables en situation d’urgence au voalnt d’une automobile. Rapport Inrets No. 46. As cited in Malaterre, G; Ferrandez, F; Fleury, D.; Lechner, D. (1988). Decision making in emergency situations. Ergonomics, 31(4), 643-655.
Masuda, K., Nagata, M., Kuriyama, H., & Sato, T. (1992). Driver behavior as affected by obstructions on both sides (SAE Technical Paper 920834). Detroit, Michigan: International Congress & Exposition.
McKenna, F. (1988). What role should the concept of risk play in theories of accident involvement. Ergonomics, 31(4), 469–484.
Mollenhauer M., Dingus T., Carney C., Hankey, J., & Jahns, S. (submitted). Anti-lock brake systems: An assessment of training on driver effectiveness. Accident Analysis and Prevention.
66

Olson, P., & Sivak, M. (1986). Perception-response time to unexpected roadway hazards. Human Factors, 28(1), 91–96.
Petit, C., Priez, A., Brigout, C., Tarriere, C., Collet C., Vernet Maury, E., & Dittmar, A. (1993). Driver’s uses of ABS in a emergency: A physiological and behavioral trial (Report 93SFO36). 26th International Symposium on Automotive Technology and Automation Dedicated Conference on Road and Vehicle Safety. Aachen, Germany (September).
Prynne, K., & Martin, P. (1995). Braking behaviour in emergencies (SAE Report No. 950969). Detroit, Michigan: International Congress & Exposition.
Robinson, B., & Riley, B. (1989). Braking and stability performance of cars fitted with various types of anti-lock braking systems. Proceedings of the 12th International Technical Conference on Experimental Safety Vehicles. Götenborg, Sweden.
Rompe, K., Schindler, A., & Wallrich, M. (1987). Advantages of an anti-wheel lock system (ABS) for the average driver in driving situations. Proceedings of the 11th Experimental Safety Vehicles Conference, Washington, DC.
Rundkvist, S. (1973). Steerability during emergency braking. Report on the Fourth International Technical Conference on Experimental Safety Vehicles, Kyoto, Japan.
Salanni, M.K., Chrstos, J.P., & Guenther, D.A. (1997). Parameter measurement and development of a NADSdyna validation data set for a 1994 Ford Taurus (SAE Technical Paper 970564).
Salanni, M.K., & Heydinger, G. J. (1998). Powertrain and brake modeling of the 1994 Ford Taurus for the National Advanced Driving Simulator (SAE Technical Paper 981190).
Strandberg, L. (1991). Crash avoidance capability of 50 drivers in different cars on ice. Proceedings of the Thirteenth International Technical Conference on Experimental Safety Vehicles. Paris, France.
Wallrich, M. & Schindler, A. (1987). The benefit of an Anti-Lock Braking System (SCS) for Average Drivers in Critical Driving Situations.
Wilde, G. J. S. (1982). The theory of risk homeostasis theory: implications for safety and health. Risk Analysis, 31(2) 209–258.
Wilde, G. J. S. (1988). Risk homeostasis theory and traffic accidents: Propositions, deduction, and discussion of dissension in recent reactions. Ergonomics, 31(4) 441-468.
Williams, A. & Wells, J. (1994). Driver experience with antilock brake systems. Accident analysis and Prevention, 26: 807–811.
67

APPENDIX A: INFORMATION SUMMARY
INFORMATION SUMMARY 5/20/98 Project Title: CPO #5 - A (IQC1) Principal Researchers: Dan McGehee
Peter Grant Liz Mazzae
Background: The purpose of the study you are participating in is to evaluate the realism of the Iowa Driving Simulator. From time to time we bring in drivers from the community to assess the simulator’s feel, looks, and actions. We are particularly interested in evaluating the visual scenes and the feel of the steering, accelerating, and braking. The information gathered today will help us understand how devices of this kind are perceived by drivers and the usefulness of these simulators as research tools.
If you agree to participate, you will be asked to sign an Informed Consent Form indicating that you have read and understand the goals of this study.
Study Description: Driver responses to the realism of an automotive simulation are influenced by their unique capabilities and background. To help calibrate your responses, prior to driving the simulator, we will ask you to make a series of responses to four calibration tasks on a touch screen. These calibration tasks include a basic reaction-time task, a choice task, a tracking task, and a sequencing task. The calibration tasks should require only 5 to 10 minutes altogether. Following the touch-screen task, you will view a video tape on the driving simulator. You will then be asked to drive for approximately 20 minutes in the driving simulator and complete questionnaires that describe your reactions to the simulator’s fidelity. Your total participation time will be about one hour.
Compensation: Should you agree to participate in this study, your compensation will be $30.
Risks: You should know that a small number of people experience something similar to motion sickness when operating simulators. The effects are typically slight and usually consist of an odd feeling or warmth which lasts only 10–15 minutes. If you feel uncomfortable, you can ask to stop at any time. Most people enjoy driving the simulator and do not experience any discomfort.
You should understand that in the event of physical injury resulting directly from the research procedures, no compensation will be available in the absence of negligence by a state employee. Medical treatment is available at the University Hospitals and Clinics, but you will be responsible for making arrangements for payment of the expenses of such treatment. Further information may be obtained from the Human Subjects Office, (319) 335-6564.
Benefits: This study will provide the University of Iowa with information on how members of the public perceive the fidelity of the Iowa Driving Simulator and will also provide the National Highway Traffic Safety Administration (NHTSA) with data on driver performance while driving in the simulator. The data may be used for educational purposes or in research on driver behavior and performance.
Informed Consent: By signing this form, you agree that your participation is voluntary. You may discontinue participation at any time without any penalty or loss of benefits to which you are entitled. You should understand that you have the right to ask questions at any time and that you can contact the principal investigator of this project Dan McGehee at (319) 335-6819 for information about the study and your rights as a participant in this research.
Confidentiality: A record of your driving performance on the simulator will be collected and the data recorded will be analyzed along with data gathered from other participants in this study. All engineering data will be stored and analyzed without reference to your name. Your name will not be associated with any data in the final report, publications, or other media that might arise from this study. By signing the
68

informed consent statement below, you agree that NHTSA shall have unrestricted use of engineering data collected during participation without reference to your personal identity for scientific, educational outreach and research purposes in perpetuity.
Additional use of video images: Your video images (continuous or single framed) may be used for scientific, educational, and outreach purposes. By signing the permission statement below, you agree that the National Highway Traffic Safety Administration shall have unrestricted use of the video recording of your drive, which may contain images of your face.
I have discussed the above points, including the information required by the Iowa Fair Information Practices Act, with the research participant or the legally authorized representative, using a translator when necessary. It is my opinion that the subject understands the risks, benefits, and obligations involved with participation in this project.
__________________________________ Investigator Date
69

APPENDIX B: INFORMED CONSENT
INFORMED CONSENT
I certify that I have been informed about the study in which I am about to participate. I have been told the procedures to be followed and how much time and compensation is involved. I have been given adequate time to read the information summary. I understand that my participation is voluntary and that I may refuse to participate, or withdraw my consent, or stop taking part in the study at any time without penalty or loss of benefits to which I may be entitled. I understand the possible risks to me that may result from my participation in the research. I understand that I have the right to ask questions at any time and that I can contact Dan McGehee at (319) 335-6819 for information about the research and my rights.
I understand that for scientific, educational, and outreach purposes, the engineering data collected during my participation may be used without reference to my personal identity by the National Highway Traffic Safety Administration or the University of Iowa, in perpetuity.
I, ______________________________, UNDERSTAND THE TERMS OF THIS AGREEMENT AND VOLUNTARILY CONSENT TO PARTICIPATE.
___________________________________ Signature Date
Permission for NHTSA to use video images
I, _______________________________, grant permission, in perpetuity, to the National Highway Traffic Safety Administration to use, publish, or otherwise disseminate the video images with engineering data (including still photo formats derived from the video images without reference to my name) collected during my participation in this study for educational, outreach, and research purposes. I understand that such use may involve presentation of the video at professional technical society meetings and in NHTSA outreach campaigns and may involve dissemination of my likeness in videotape or still photo formats, but will not result in release of my name or other identifying personal information.
I grant NHTSA permission to use my video images.
___________________________________ Signature Date
70

APPENDIX C: EXPERIMENTAL PROTOCOL
Upon arriving at the IDS facility, subjects reported to the briefing room. The briefing
experimenter welcomed subjects as they entered. The subject was then given the information
summary and the informed consent (see Appendix A) to read. After answering the subject’s
questions, the briefing experimenter co-signed the information summary and the subject signed
the informed consent. A second experimenter witnessed the information summary.
If the simulator queue was running behind schedule, the subject was then asked to fill out the
questionnaire containing demographic and basic driving information. Subjects were informed
that the survey was voluntary and that they could leave any portion of it blank. When the
simulator queue was on schedule, this survey was filled out after the simulator drive (see Post-
Drive Protocol for further discussion). Current magazines and newspapers were available to
subjects in the briefing room, although the wait was generally only a few minutes.
In-Simulator Protocol
When it was time to bring the subject downstairs to the simulator, the simulator operator
contacted the briefing experimenter by phone or via two-way radio. One of two possible in-
vehicle experimenters escorted the subject to the simulation bay. The subject and in-vehicle
experimenter waited outside the bay until the previous subject and in-vehicle experimenter
exited. The in-vehicle experimenter then proceeded into the bay and gave the IDS operator a
videotape with the subject’s number and condition written on it. The in-vehicle experimenter
gave the subject a brief introduction to the IDS system, then escorted the subject into the dome.
The experimenter, with hands on the railing, followed behind the subject to help ensure the
subject did not slip and fall on the stairs.
Once in the simulator dome, the experimenter asked the subject to go around the back of the
vehicle and sit in the driver’s seat. The experimenter helped subjects adjust their seat and
provided a safety briefing. In addition, the experimenter made sure the subject knew the location
of the speedometer, gearshift, and air conditioning controls. The subject was asked to make sure
the rear-view and side-view mirrors were adjusted appropriately. After shutting the door and
securing the subject in the vehicle, the experimenter sat down in the passenger-side back seat and
inserted the communication earpiece.
Since this study had a reaction-time component that needed to be accurate to a fraction of a
second, the in-vehicle experimenters were told to minimize discussion with the participant
71

during the driving portion of the experiment. Also, no comments were made to the simulation
operator during the actual drive. To help with this and to maintain consistency between the two
in-vehicle experimenters, a written script was used during the simulation.
In-Vehicle Experimenter Log Sheet
The in-vehicle experimenter used an in-vehicle log sheet to obtain critical information about the
drive. It was thought that having a perspective from inside the vehicle might provide the in-
vehicle experimenter with some unique insights. All the information used in this study was later
verified using videotapes of the drives. The in-vehicle experimenter obtained the following types
of information:
• The speed of subjects prior to the movement of the encroaching vehicle at the intersection.
• Whether the experimenter felt subjects anticipated that the encroaching vehicle was going to
cross. This was a judgment made on the part of the in-vehicle experimenters. They were
asked to note any anticipation that seemed to exceed the fact that the subject was coming to
an unfamiliar intersection.
• Which of seven possible behaviors subjects attempted to avoid the encroaching vehicle.
Subjects could: do nothing, brake, brake hard enough to lock the wheels, accelerate, steer to
the left, steer to the right, or perform a combination of these reactions such as braking and
steering to left. The in-vehicle experimenter circled all reactions elicited in response to the
encroaching vehicle. Once subjects had collided with the vehicle, subsequent reactions were
not recorded.
• For subjects in the conventional brake condition, experimenters noted which of four possible
skidding behaviors described the subject vehicle during the evasive maneuver. The vehicle
could: not skid, skid but rotate less than 30 degrees, skid and rotate more than 30 degrees
clockwise, skid and rotate more than 30 degrees counter-clockwise. The in-vehicle
experimenter marked which outcome best described the vehicle’s behavior in trying to avoid
the encroaching vehicle. Once the subject had collided with the vehicle, subsequent outcomes
were not recorded.
• Which of seven possible outcomes best described the subject’s vehicle position in the lane
and on the roadway: 1) the vehicle could depart the roadway to the left 2) or depart the
roadway to the right, 3) the vehicle could stay in the right lane, 4) have up to one-half of the
vehicle in the left lane, 5) have over one-half the vehicle in the left lane, 6) have up to one-
72

half of the vehicle in the right shoulder, 7) or have over one-half of the vehicle in the right
shoulder. The in-vehicle experimenter marked which outcome occurred when subjects
attempted to avoid the encroaching vehicle. Once subjects had collided with the vehicle,
subsequent outcomes were not recorded.
• Whether subjects collided with the encroaching vehicle at the intersection was also recorded
on the log sheet. At times, it was difficult to determine if there was a collision. If in-vehicle
experimenters were unsure whether or not a collision had occurred, they recorded a question
mark. Subsequent analyses were then used to determine if there had been a collision. These
included the videotape analysis and the 30-hertz simulator data stream.
• If there had been a collision, the in-vehicle experimenter shaded the area of the scenario
vehicle that was hit. This information was used to help determine the specifics and severity
of the collision.
• A space was also provided for the in-vehicle experimenter to write down any additional
information that might influence the results of the experiment.
Protocol After Evasive Maneuver
After completing the evasive maneuver to avoid the encroaching vehicle, the subject was told
that this was always where the drive ended. This was to help reassure the subject that their
behavior had not caused the simulation to end (i.e., they did nothing wrong). Subjects were then
asked to place the vehicle in park and to stay in the vehicle with their seat belts on until the
operator opened the door to the dome.
After the operator opened the door, the experimenter guided the subject to the debriefing room.
If at any point after the drive, subjects commented about their driving ability, they were
reassured that they had done fine. They were also told that after they filled out the questionnaires
they would be given a debriefing that would provide them with more information about the
experiment. If they appeared upset about their performance or the drive in general, the researcher
in charge of the study was contacted to discuss the situation with the subject.
Post-Drive Protocol
Upon arriving at the debriefing room, subjects were asked if they would like to use the restroom
or have a cool beverage. Once subjects were comfortable, they were asked to fill out four
questionnaires. The questionnaires were always presented individually and in the same order,
73

and subjects had to finish each questionnaire before the next questionnaire was given. This was
to ensure that the questions most important to the study were answered first and that subject’s
answers would not be biased by some of the other questions. The first questionnaire was the
most important and was designed to extract specific information about the collision avoidance
maneuver at the intersection (see Appendix F). Most of the questions required yes/no responses,
along with requests for descriptive narratives about why “yes” or “no” was chosen. The second
questionnaire was designed to extract information about the simulator’s validity compared to the
real world from the subject’s perspective (see Appendix G). If it had not already been given
while the subject waited in the simulator queue, the final questionnaire obtained basic
demographic and driving information (see Appendix E). Subjects were told that information on
the demographic questionnaire was strictly voluntary and they could leave any portion blank.
After all questionnaires had been filled out, the subject was given a debriefing sheet to read and
take home. As shown in Appendix H, the sheet explained the following information:
• The importance of this research to improving traffic safety.
• That collision with the encroaching vehicle was almost impossible to avoid.
• That collision with this vehicle was in no way a reflection on the subject’s ability to drive or
avoid a collision.
• That the encroaching vehicle must be a surprise event in this study, and that the subject
should not discuss this event with other people who would be participating in the study.
The debriefing experimenter reiterated and pointed out on the sheet for each subject that the
crash was almost impossible to avoid and the importance of not discussing the study with others
who might participate.
After the debriefing, subjects were paid a minimum of $30.00 for their time. Some subjects were
paid an additional amount if they had to wait longer than expected prior to participation. Subjects
filled out a payment receipt with their name, address, social security number, and the amount
paid. Subjects then signed the document signifying that they had received payment. If subjects
were paid an additional amount beyond the typical ten dollars, it was explained by the post-drive
experimenter under the comments section on the payment receipt.
Typically, subjects left the debriefing room at this point, unless one of the experimenters felt an
additional interview would provide more insight.
74

APPENDIX D: IN-VEHICLE SCRIPT
The in-vehicle script was designed to be read after specific behaviors or actions occurred. The
underlined information is the behavior or action that occurred prior to the in-vehicle
experimenter speaking from the script. The script used was as follows:
After inserting the ear-piece:
“The operator is able to hear everything in the vehicle. I have an ear-piece so that I can hear the
operator. If at any time you feel uncomfortable, just say so and I will have the operator stop the
simulator. If for any reason there is an emergency, don’t touch it now, but that red button on the
IDS box is an emergency stop button. The best way to stop the simulator though is to tell me and
I will have the operator stop it.”
Prior to the simulator being ready:
“The first part of this drive is a practice drive to let you get comfortable with the way the vehicle
drives. You should practice accelerating, braking, and steering to get a good feel for the vehicle.
I will tell you when the actual drive starts. During the actual drive I cannot talk to you because I
want you to concentrate on driving and assessing the simulator. Remember, after the drive you
will fill out a questionnaire assessing the looks, controls, and actions of the simulator. It is
important to tell me though, at any point, if you want to stop the simulator or when you start
feeling uncomfortable. Also, the stairs have been removed from the simulator so you should not
try to get out of the vehicle until the operator comes and gets us. Are there any questions before
we get started? Just so you know, when the simulator starts you will feel a kind of rumbling. This
is just the simulator raising up on its legs. This is normal and you will feel it each time a drive is
started or stopped.” [It should be noted that sometimes the simulator moved prior to this
statement. In those cases, the statement was inserted into the script at the closest reasonable point
after the simulator moved.]
After the simulator is ready:
“Before we start driving we need to let two vehicles pass from behind you.” [It should be noted
in some cases the vehicles passed during the pre-drive script. In those cases the prior statement
was skipped.]
75

After the vehicles pass:
“Okay, go ahead and merge onto the road. The speed limit is 45 [or 55] mph. Go ahead and
practice accelerating, braking, and getting a feel for the steering.” [Most subjects attempted
braking with this suggestion. However, when subjects did not attempt braking they were told
again to:]“go ahead and try the brakes so you can get a feel for them.” [This ensured that all
subjects had used the brakes prior to the interaction with the truck].
Prior to the actual drive:
“Are you feeling okay? These red and white stripes coming up on the road signify the start of the
actual drive. The speed limit is 45 mph [or 55 mph] throughout the drive. Remember, let me
know at any time if you start feeling uncomfortable. Once again, I cannot talk to you during the
drive.”
If participants did try to talk during the actual drive, the in-vehicle experimenter would remain
quiet or answer this when applicable.
“Make a mental note of that and I will talk to you about it after the drive.” Or “ I am sorry, I can’t
talk to you during the actual drive.”
76

APPENDIX E: DEMOGRAPHIC AND DRIVING QUESTIONNAIRE
Subject #_________ Study NADS CPO 5 IQC1 Study Date
IDS Driving Survey
As part of this study, it is useful to collect information describing each participant. The following questions ask about you, your personal vehicle and your driving patterns. Please read each question carefully, marking only one response unless otherwise indicated. If something is unclear, ask the research host for help. Your participation is voluntary and you have the right to omit ANY question.
1) What is your birth date? / / Month / Date / Year
2) What is your gender?
Male Female
3) What is your marital status? (Check only one)
Married Separated or Divorced Widowed Single
4) What was you and your spouse’s (if married) total annual income last year? (Check only one)
0-$4,999 $5,000 - $9,999 $10,000 - $14,999 $15,000 - $19,999 $20,000 - $29,999 $30,000 - $39,999 $40,000 - $49,999 $50,000 or more
5) Of which ethnic origin do you consider yourself? (Check only one)
Afro-American (not of Hispanic origin) Caucasian (not of Hispanic origin) Hispanic (Mexican, Cuban, or other Spanish culture, regardless of race) Native American Indian, Eskimo, Aleut Oriental, Asian-American Other __________________________
77
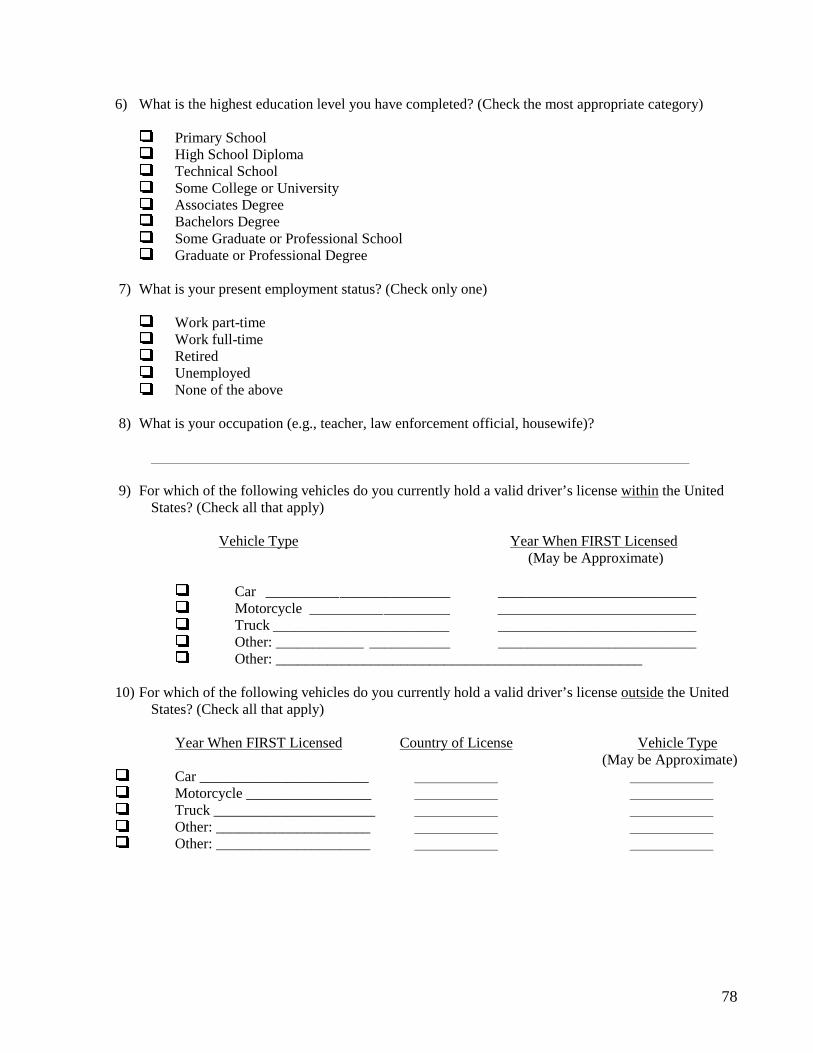
6) What is the highest education level you have completed? (Check the most appropriate category)
Primary School High School Diploma Technical School Some College or UniversityAssociates Degree Bachelors Degree Some Graduate or Professional School Graduate or Professional Degree
7) What is your present employment status? (Check only one)
Work part-time Work full-time Retired Unemployed None of the above
8) What is your occupation (e.g., teacher, law enforcement official, housewife)?
9) For which of the following vehicles do you currently hold a valid driver’s license within the United States? (Check all that apply)
Vehicle Type Year When FIRST Licensed (May be Approximate)
Car _________________________ ___________________________ Motorcycle ___________________ ___________________________ Truck ________________________ ___________________________ Other: ____________ ___________ ___________________________ Other: __________________________________________________
10) For which of the following vehicles do you currently hold a valid driver’s license outside the United States? (Check all that apply)
Year When FIRST Licensed
Car _______________________ Motorcycle _________________ Truck ______________________ Other: _____________________ Other: _____________________
Country of License Vehicle Type (May be Approximate)
78

11) Approximately how many miles do you drive per year in each vehicle type? (Check only one for each vehicle)
Car
Under 2,000 2,000 - 7,999 8,000 - 12,999 13,000 - 19,999 20,000 or more Do not drive
Other: __________
Under 2,000 2,000 - 7,999 8,000 - 12,999 13,000 - 19,999 20,000 or more
Motorcycle
Under 2,000 2,000 - 7,999 8,000 - 12,999 13,000 - 19,999 20,000 or more Do not drive
Other: __________
Under 2,000 2,000 - 7,999 8,000 - 12,999 13,000 - 19,999 20,000 or more
Truck
Under 2,000 2,000 - 7,999 8,000 - 12,999 13,000 - 19,999 20,000 or more Do not drive
Other: __________
Under 2,000 2,000 - 7,999 8,000 - 12,999 13,000 - 19,999 20,000 or more
12) How often do you drive? (Check the most appropriate category)
At least once daily At least once weekly Less than once weekly Do not drive
13) Is any driving you do work related? This does not include traveling to and from work. (Check only one)
Yes No (skip to question #15)
14) If you answered yes to question #13, how many work related miles do you drive per year? (Check only one)
Under 2,000 2,000 - 7,999 8,000 - 12,999 13,000 - 19,999 20,000 or more
15) In which environment do you most typically drive? (Check only one)
Rural highway (e.g., Route 1, Route 6, or Route 218) Small town (e.g., Solon, West Branch) Suburban (e.g., Iowa City, Cedar Rapids) City (e.g., Des Moines, Davenport) High density city (e.g., Chicago, Los Angeles) Highway/freeway (e.g., Interstate 80) Do not drive
79

16) What speed do you typically drive on the freeway when the speed limit is 55? 65?
17) When the following conditions or situations occur, how frequently do they keep you from driving? (Check the most appropriate answer for each condition)
Frequently Occasionally Rarely Never Not Applicable At night In fog In rain In snow or sleet During rush hour On highway/freeway While smoking After drinking alcohol With children
18) How comfortable do you feel when you drive in the following conditions or perform the following maneuvers? (Check the most appropriate answer for each condition)
At night
In fog
In rain
In snow or sleet
During rush hour
On highway/freeway
While smoking
After drinking alcohol
With children
In high density traffic
Very Slightly Comfortable Comfortable
Slightly Very Uncomfortable Uncomfortable
Not Applicable
When passing other cars
When changing lanes
When making left turns at uncontrolled intersections
19) How did you learn to drive? (Check all that apply)
Formal instruction (e.g., driver’s education class) Informal instruction (e.g., from a relative or friend)
80

20) Have you ever participated in any special driving schools (e.g., AARP or insurance courses, racing school, or as part of law enforcement training)?
Yes (Please describe) No
21) What type of automobile do you drive most often?
Make (e.g., Ford, Toyota): Model (e.g., Escort, Celica): Year:
22) Which of the following features does this automobile have? (Check all that apply)
Air BagAntilock Brakes Automatic Transmission CB Radio Cellular phone Manual Transmission Power Brakes Power SteeringRadar Detector Other technologies (e.g., trip computer, moving-map display, vehicle information center)Please list these: ______________________________________________________________
_________________________________________________________________________________ None of these
23) How many vehicles have you driven on a regular basis over the last 5 years? (Check only one)
1 2 3 4 5 or more
81

APPENDIX F: VEHICLE INCURSION QUESTIONNAIRE
VEHICLE INCURSION QUESTIONNAIRE IQC 1
Vehicle Incursion Questionnaire Subject #: ______ Post Drive Questionnaire 1 Date: ______
1) What do you think the purpose of today’s drive was?
____________________________________________________________________________
____________________________________________________________________________
____________________________________________________________________________
____________________________________________________________________________
____________________________________________________________________________
____________________________________________________________________________
2) At any point during the simulation did you begin to drive more carefully than you normally would in typical daily driving?
Yes No
If yes, describe what happened to make you start driving more cautiously?
3) While driving the simulator, did you feel that the slow moving truck on the hill behaved the way you would expect it to in the real world?
Yes No
If not, how was it different?
82

4) When you came upon the slow moving truck, was your reaction to the truck typical of how you would behave in the real world?
Yes No
If not, why not?
___________________________________________________________________________
___________________________________________________________________________
___________________________________________________________________________
5) Remember when you approached the intersection and the vehicle pulled out in front of you. Did this sequence of events seem realistic?
Yes No
If not, why not?
6) When the vehicle pulled out in front of you, describe your reaction in as much detail as possible. (When did you decide to react? What did you do to try to avoid a collision?)
7) When you approached the intersection, did you anticipate or expect that the car may pullout in front of you? Yes No
Please explain
83

8) Did anything about the vehicle which pulled out in front of you seem strange or unrealistic?
Yes No
If yes, please explain
9) Were you startled by the vehicle pulling out in front of you?
Yes No
Please explain
10) When you tried to avoid hitting the car, do you feel that you reacted as you would have in the real world?
Yes No
If not, what would you have done differently?
84
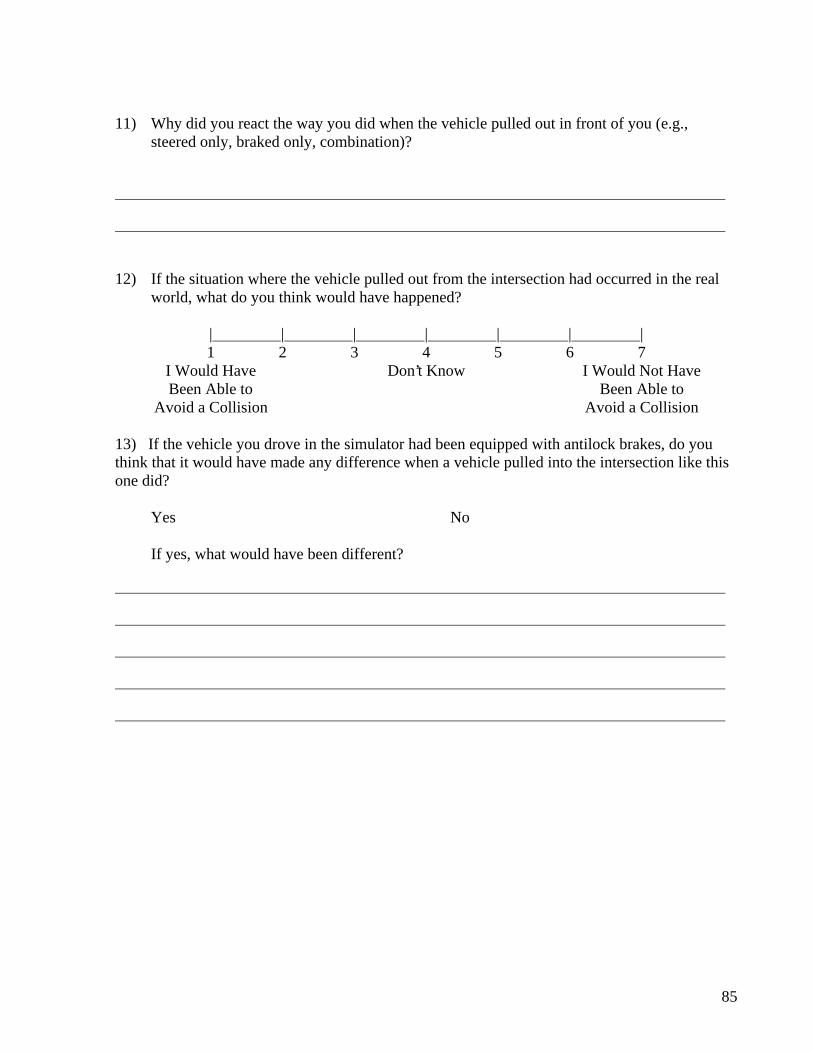
11) Why did you react the way you did when the vehicle pulled out in front of you (e.g., steered only, braked only, combination)?
12) If the situation where the vehicle pulled out from the intersection had occurred in the real world, what do you think would have happened?
| | | | | | | 1 2 3 4 5 6 7
I Would Have Don’t Know I Would Not Have Been Able to Been Able to
Avoid a Collision Avoid a Collision
13) If the vehicle you drove in the simulator had been equipped with antilock brakes, do you think that it would have made any difference when a vehicle pulled into the intersection like this one did?
Yes No
If yes, what would have been different?
85

14) If the situation where the vehicle pulled out from the intersection had occurred in the real world, what would you have done? Please circle the best answer.
I would have just steered to the right
I would have just steered to the left
I would have just braked in a straight line
I would have braked and steered to the right
I would have braked and steered to the left
I would have accelerated and steered to the right
I would have accelerated and steered to the left
I would not have done anything
I wouldn’t have steered or braked
I am not sure
15) Have you ever activated antilock brakes before?
Yes No
If yes, please describe the circumstances
86

APPENDIX G: IDS VALIDITY QUESTIONNAIRE
IDS Validity Questionnaire
Subject #: ______ Post Drive Questionnaire 2 Date: ______
1) How did driving in the simulator compare to driving your vehicle?
| | | | | | | 1 2 3 4 5 6 7
Easier Same Harder
2) Rate your ability to see out of the windshield in the simulator as compared to the real world.
| | | | | | | 1 2 3 4 5 6 7
Could not Could see Could see see as far as the same as further than
normal normal normal
3) Rate the feeling of motion in the simulator as compared to motion in the real world (i.e., responsiveness of the simulator).
| | | | | | | 1 2 3 4 5 6 7
Moved too Moved Moved too Slow Just right Fast
4) Rate how often you had to steer to stay in your lane as compared to the real world.
| | | | | | | 1 2 3 4 5 6 7
Steered Steered Steered less often the same more often
5) Rate the steering of the simulator as compared to the real world.
| | | | | | | 1 2 3 4 5 6 7
Too loose or Just Too tight or Not sensitive right Not sensitive enough
87

6) Rate your ability to stop the car as compared to the real world.
| | | | | | | 1 2 3 4 5 6 7
Stopped Stopped Stopped slower the same faster
7) Rate moving the brake pedal compared to the real world.
| | | | | | | 1 2 3 4 5 6 7
Too Just Too Hard right sensitive
8) Rate moving the gas pedal compared to the real world.
| | | | | | | 1 2 3 4 5 6 7
Too Just Too Hard right sensitive
9) When comparing the speed viewed on the speedometer to the speed you felt you were driving, did you feel you were traveling slower or faster than the speedometer stated?
| | | | | | | 1 2 3 4 5 6 7
Felt slower than Felt the same as Felt faster than the speedometer the speedometer the speedometer
indicated indicated indicated
10) As you approached the intersection, did you expect the vehicle to pull out in front of you?
| | | | | | | 1 2 3 4 5 6 7
Did not expect Not sure Expected the the car to pull out car to pull out
88

11) Rate your personal feeling about driving the simulator.
| | | | | | | 1 2 3 4 5 6 7
Had a Had a bad time good time
12) In what ways can the Iowa Driving Simulator be improved?
Thank you very much for participating!
We hope that you enjoyed the experience.
89

APPENDIX H: IQC 1 POST-DRIVE DEBRIEF
As described in the information summary, the purpose of this study is to assess the simulator.
Beyond the standard validity checks, we are interested in using the simulator to assess severe
maneuvering scenarios. This is why we included the last event where the car came suddenly into
the intersection and stopped in the middle of the road. The simulator offers a controlled and safe
environment to study an otherwise unsafe act. This type of research is the first step to
understanding severe maneuvering events and developing methods to avoid serious accidents in
the future.
This event was designed to require an extremely severe braking and/or steering response. It was
expected that very few people, if any, would be able to avoid colliding with this car. This event
was designed so it would be almost impossible to avoid the accident. This should in no way be
considered a reflection of your ability to drive or avoid an accident.
If you know other people who are participating in this study, please do not discuss any of the
details of the drive with them until after they have driven the simulator. It is important that they
see and drive the simulator without any advance information about the drive. This is particularly
true of the last event which was designed to be a surprise event and requires that participants do
not have any advanced knowledge of the drive.
We would like to again thank you for coming in and helping us today. If you have any questions,
please discuss them with the research host. Also, remember that you can call Dan McGehee,
Principal Investigator, at 335-6402 if you have any further questions.
90

APPENDIX I: PAYMENT RECEIPT
Payment Form for IQC 1 Principal Investigator: Dan McGehee
Telephone: (319) 335-6819 ________________________________________________________________________
DOCUMENTATION OF PARTICIPATION AND PAYMENT
Participant Information
Participant’s Name: _______________________
Address: ______________________________
City: ________________ State: ____ Zip Code _________
Phone Number: ______– ____________
Social Security Number: ________– _____– ________
Acknowledgment
I have received cash in the amount of $ _______ for participation in the Cooperative Project
Order 5 (IQC1) as stated above.
_______________________________ Signature of Participant ______________________________________________________________________________
For Research Staff Only
Payment Information
Date: ______________ Amount Paid $ _________
Payment Certification
I certify that all information has been completed by the participant and the above payment had
been received.
Research Host Authorizing: ______________________________
(full name required) Comments:
91

APPENDIX J: POST-DRIVE DEBRIEF
As described in the information summary, the purpose of this study is to assess the simulator.
Beyond the standard validity checks, we are interested in using the simulator to assess severe
maneuvering scenarios. This is why we included the last event where the car came suddenly into
the intersection and stopped in the middle of the road. The simulator offers a controlled and safe
environment to study an otherwise unsafe act. This type of research is the first step to
understanding severe maneuvering events and developing methods to avoid serious accidents in
the future.
This event was designed to require an extremely severe braking and/or steering response. It was
expected that very few people, if any, would be able to avoid colliding with this car. This event
was designed so it would be almost impossible to avoid the accident. This should in no way be
considered a reflection of your ability to drive or avoid an accident.
If you know other people who are participating in this study, please do not discuss any of the
details of the drive with them until after they have driven the simulator. It is important that they
see and drive the simulator without any advance information about the drive. This is particularly
true of the last event, which was designed to be a surprise event and requires that participants do
not have any advance knowledge of the drive.
We would like to again thank you for coming in and helping us today. If you have any questions,
please discuss them with the research host. Also, remember that you can call Dan McGehee,
Principal Investigator, at 335-6402 if you have any further questions.
92