NHSScotland New Build Health Buildings DSM … NHSScotland... · 2.4.1.1 Consulting Exam Room: ......
126
13416 NHSScotland New Build Health Buildings DSM Modelling – MAIN REPORT Design Exemplars: Health Centre/ OPD & Ward For: Health Facilities Scotland (HFS) part of NHS National Services Scotland Final Report v1 Consultant: Colin Rees Consultancy Manager Checker: David McEwan Director Prepared in partnership with Mabbett & Associates Ltd Reviewer: Andrew Lee Director, Engineering 20 December 2017 (title update re-issue of 03 Sept 2017)
Transcript of NHSScotland New Build Health Buildings DSM … NHSScotland... · 2.4.1.1 Consulting Exam Room: ......
13416
NHSScotland New Build Health Buildings DSM Modelling – MAIN REPORT Design Exemplars: Health Centre/ OPD & Ward For: Health Facilities Scotland (HFS) part of NHS National Services Scotland
Final Report v1
Consultant: Colin Rees Consultancy Manager Checker: David McEwan Director
Prepared in partnership with Mabbett & Associates Ltd
Reviewer: Andrew Lee Director, Engineering
20 December 2017 (title update re-issue of 03 Sept 2017)

NHS Scotland Design Exemplars – Health Centre & Hospital
2
Contents
1 Executive Summary .............................................................................................................................. 4
2 Health Centre ....................................................................................................................................... 6
2.1 Introduction ............................................................................................................................................. 6
2.2 Modelling Scenarios ................................................................................................................................. 6 2.2.1 NCM Base Case ............................................................................................................................................... 6 2.2.2 Corrected Base Case ....................................................................................................................................... 7 2.2.3 Sensitivity Analysis .......................................................................................................................................... 7
2.3 Health Centre Geometry.......................................................................................................................... 8
2.4 Sensitivity Analysis ................................................................................................................................... 9 2.4.1 Corrected Base Case Comparison ................................................................................................................... 9
2.4.1.1 Consulting Exam Room: Equipment Gain ................................................................................................... 9 2.4.1.2 Consulting Exam Room: Lighting Gain ...................................................................................................... 10 2.4.1.3 Consulting Exam Room: People Gain ........................................................................................................ 11 2.4.1.4 Consulting Exam Room: Heating Energy ................................................................................................... 12 2.4.1.5 Consulting Exam Room - Ceiling Void: Lighting Gain ................................................................................ 13 2.4.1.6 Consulting Exam Room NBC v CBC Summary View .................................................................................. 14
2.4.2 Potential Optimisation Scenarios ................................................................................................................. 15 2.4.2.1 Overheating .............................................................................................................................................. 16 2.4.2.2 Heating Energy .......................................................................................................................................... 29
2.4.3 Optimised Approach ..................................................................................................................................... 33 2.4.3.1 Consulting Exam Room Overheating ........................................................................................................ 34 2.4.3.2 Consulting Exam Room Heating Energy .................................................................................................... 35 2.4.3.3 Consulting Exam Room Heating Loads ..................................................................................................... 41 2.4.3.4 Consulting Exam Room Case-04 v CBC Summary View ............................................................................ 42
2.5 Solar Energy Impact ............................................................................................................................... 43 2.5.1 South ............................................................................................................................................................. 44 2.5.2 East ................................................................................................................................................................ 45 2.5.3 North ............................................................................................................................................................. 46 2.5.4 West .............................................................................................................................................................. 47
3 Hospital .............................................................................................................................................. 48
3.1 Introduction ........................................................................................................................................... 48
3.2 Modelling Scenarios ............................................................................................................................... 48 3.2.1 NCM Base Case ............................................................................................................................................. 48 3.2.2 Corrected Base Case ..................................................................................................................................... 49 3.2.3 Sensitivity Analysis ........................................................................................................................................ 49
3.3 Hospital Geometry ................................................................................................................................. 50
3.4 Sensitivity Analysis ................................................................................................................................. 52 3.4.1 Corrected Base Case Comparison ................................................................................................................. 52
3.4.1.1 Bedroom: Equipment Gain ....................................................................................................................... 52 3.4.1.2 Bedroom: Lighting Gain ............................................................................................................................ 53 3.4.1.3 Bedroom: People Gain .............................................................................................................................. 54 3.4.1.4 Bedroom: Heating Energy ......................................................................................................................... 55 3.4.1.5 Bedroom - Ceiling Void: Equipment Gain ................................................................................................. 56 3.4.1.6 Bedroom - Ceiling Void: Lighting Gain ...................................................................................................... 57 3.4.1.7 Bedroom NBC v CBC Summary View ........................................................................................................ 58 3.4.1.8 Ward Circulation: Equipment Gain ........................................................................................................... 59 3.4.1.9 Ward Circulation: Lighting Gain ................................................................................................................ 60 3.4.1.10 Ward Circulation: People Gain .............................................................................................................. 61
3.4.2 Potential Optimisation Scenarios ................................................................................................................. 62
NHS Scotland Design Exemplars – Health Centre & Hospital
3
3.4.2.1 Overheating .............................................................................................................................................. 63 3.4.2.2 Heating Energy .......................................................................................................................................... 75
3.5 Optimised Approach .............................................................................................................................. 79 3.5.1.1 Bedroom Overheating .............................................................................................................................. 80 3.5.1.2 Bedroom Lighting Energy .......................................................................................................................... 81 3.5.1.3 Bedroom Heating Energy .......................................................................................................................... 82 3.5.1.4 Bedroom Heating Loads ............................................................................................................................ 88 3.5.1.5 Bedroom Case-04 v CBC Summary View .................................................................................................. 89
3.6 Daylight Impact ...................................................................................................................................... 90
4 Appendix A: Bedroom Heating Design Approach - CFD Analysis: Wall Radiator v Ceiling Radiant Panel 93
5 Appendix B: Room Data Sheets – Health Centre .................................................................................. 97
6 Appendix C: Room Data Sheets – Hospital ......................................................................................... 101

NHS Scotland Design Exemplars – Health Centre & Hospital
(1) The National Calculation Method for the EPBD (Energy Performance of Buildings Directive) is defined by the Department for Communities
and Local Government (DCLG) in consultation with the Devolved Administrations (DAs).
www.uk-ncm.org.uk
4
1 Executive Summary The overall objectives of this study were to investigate the implication of various approaches to dynamic simulation
modelling scenarios, plus complimentary solar and daylighting assessments, for use in the design of new build Health
Centres and Hospitals in Scotland.
An ‘exemplar’ approach was used, illustrated with appropriate examples of building analysis models for both Health
Centre and Hospital buildings. The approach was to use two recent and typical NHS Scotland developments, constructed
in IES’s market leading VE software as exemplar study models. The approach taken and comparison of results could be
expected from any similar simulation software.
Health Centres and Hospitals have very different operational needs and one of the objectives was to use practical
examples to help provide briefing information that would assist designers in understanding underlying issues that
enable them to maximise the benefits derived from their analysis and improve performance in these two types of new
healthcare facilities.
The following design aspects were considered and included where agreed in the approach to these works in close
cooperation between IES and Mabbett & Associates Ltd (M&A) who researched and provided realistic input data for IES
to model.
The analysis work was mostly focussed towards representative areas so to concentrate where the effort could have
maximum impact.
Analysis framework for a typical health care building in Scotland – based on exemplar Health Centre &
Hospital models.
Thermal comfort.
Energy usage.
Compliance vs ‘Real’ building models based on standardised ‘NCM’(1) data and realistic input data. This
demonstrates the importance of accurate room data templates and the need for realistic analysis to allow
testing of design and ensure ‘fit-for-purpose’.
Mitigation of Mechanical solutions – by considering passive design solutions such as natural ventilation with
no mechanical cooling.
Effect of different occupancy patterns and operational hours – the Health Centres and Hospital have very
different utilisation profiles.
Construction types – effect of increasing insulation thermal insulation and air-tightness of building
envelopes. Note that the baseline simulations assumed the current 2015 version of Section 6 regulations
which already has much improved insulation levels and reduced permeability compared to previous
versions of Section 6. For example wall U-value has reduced by about a third.
Alternative ventilation of spaces – to demonstrate the importance of correct window design.
Interconnection between the occupied spaces and adjacent ceiling voids and service voids.
The study concentrates on areas which have proven and recorded risks, are in frequently repeated spaces
and are heavily occupied by patients and staff, i.e. single bedroom and consulting exam room in either
hospitals or health centres. This includes an awareness of patient needs and human nature, e.g. isolation
and vulnerability to temperatures of bed-bound patients.

NHS Scotland Design Exemplars – Health Centre & Hospital
5
Future weather files (future weather for Glasgow using CIBSE data to indicate how energy
and overheating demands will alter).
Consideration of ‘nearly zero energy’ design options.
Artificial lighting / daylighting / shading issues.
Orientation of wings / wards and in particular bedroom & consulting exam rooms.

NHS Scotland Design Exemplars – Health Centre
6
2 Health Centre
2.1 Introduction This simulation report details the modelling investigation of a recent and typical health centre development, that we
used as an exemplar study model. The study focused on a typical GP or out-patient wing, containing typical and
representative consulting exam rooms and support spaces. Modelling is used to predict building performance, it helps
design teams reduce risk and produce the best possible building for its occupants and the environment. Models are
critically dependent on the quality of the data selected to go into their calculation, with poor data will come a poor
representation and therefore misdirection for the design path. Past cases exist where model outputs have been
criticised but instead this is the result of poorly selected inputs. Successful models are built by competent modellers
working with their design teams who together have selected the most appropriate inputs.
This report details the use of a Dynamic Simulation Model (DSM) which is a sub-hourly time based simulation utilising
hourly weather data and test building attributes including building form, fabric, internal gains, ventilation air exchanges,
operation profiles and building HVAC systems. The simulation then produces hourly data for energy and environmental
metrics from which modellers can produce statistical reports to detail exactly how the building is predicted to perform.
The use of a model at the design stage is only the first step in its life as a companion to the building. The model can
continue to be used during the operational stage by calibrating the model using metered data. This calibrated evolution
can then be used to check building performance and identify if the building is moving outside of its intended parameters
and exactly which of these are vulnerable. This is an ongoing process as buildings are currently under the strain of the
environment and their operational use which requires specific maintenance. A high performance building is one that
continues this for its life and not simply on the first opening of its doors.
The analysis has been undertaken based on the backdrop of the latest Section 6 Scottish Building Regulations from
2015. These regulations have guided aspects such as fabric within the tested models. It is worth noting the latest NHS
Scotland buildings constructed would have been built to the inferior 2010 standards and that performance detailed by
this analysis to 2015 will only be more pressured when the regulations evolve again in the near future. There are
definite diminishing returns in aspects of building design previously identified as being key factors. Indeed these may
soon be dead ends and therefore the remaining factors not previously under the spotlight now become crucial in
continued performance improvement. Only a full sub-hourly analysis under a structured assessment will provide this
opportunity.
2.2 Modelling Scenarios
2.2.1 NCM Base Case
The NCM Base Case is a representation of health centre models presented to NHS Scotland for newly designed
developments. It is based around the deployment of a Section 6 Building Regulations model where the primary
modelling objective is compliance. The National Calculation Methodology was created by the UK government for the
purposes of a like for like operational comparison so to assess the performance of fabric, HVAC system efficiencies,
lighting and other such building performance factors. The NCM approach would maintain no change in operation hours,
room set-points, ventilation flowrates or illuminance levels. However with this comes clear its intention to serve
compliance as a limited number of building type and activities are available to select and assign to the model’s spaces.
This is not a problem for compliance as the space will use the same operation in both compliance Actual and Notional
models but it if modellers are actively trying to use this minimal list to represent their real building design then
NHS Scotland Design Exemplars – Health Centre
7
straightaway a limit has been introduced to correctly represent the true building activities and
operation. Examples include room set-points being lower than are intended for the design and using lower ventilation
airflow rates to meet comfort conditions. Both of these examples would result in significant differences to the
calculated and operational energy use.
As the modelling objective is primarily compliance then it results in a poor representation for a detailed investigation
into real building energy use and occupant comfort needs. This leads to mismanaged findings, which negatively
influence the final design and handicap the building throughout its operational life.
2.2.2 Corrected Base Case
The Corrected Base Case model is specified to better represent the true operation of a health centre based on
experience with similar developments and learning outcomes involved. Room Data Sheets (RDS) were produced (see
Appendix B) which specify the health centre activity and define the following:
Room heating set-point
Infiltration rate
Fixed air exchange rate (supply or extract)
Internal gains - occupancy, lighting and equipment
Time based operating schedules
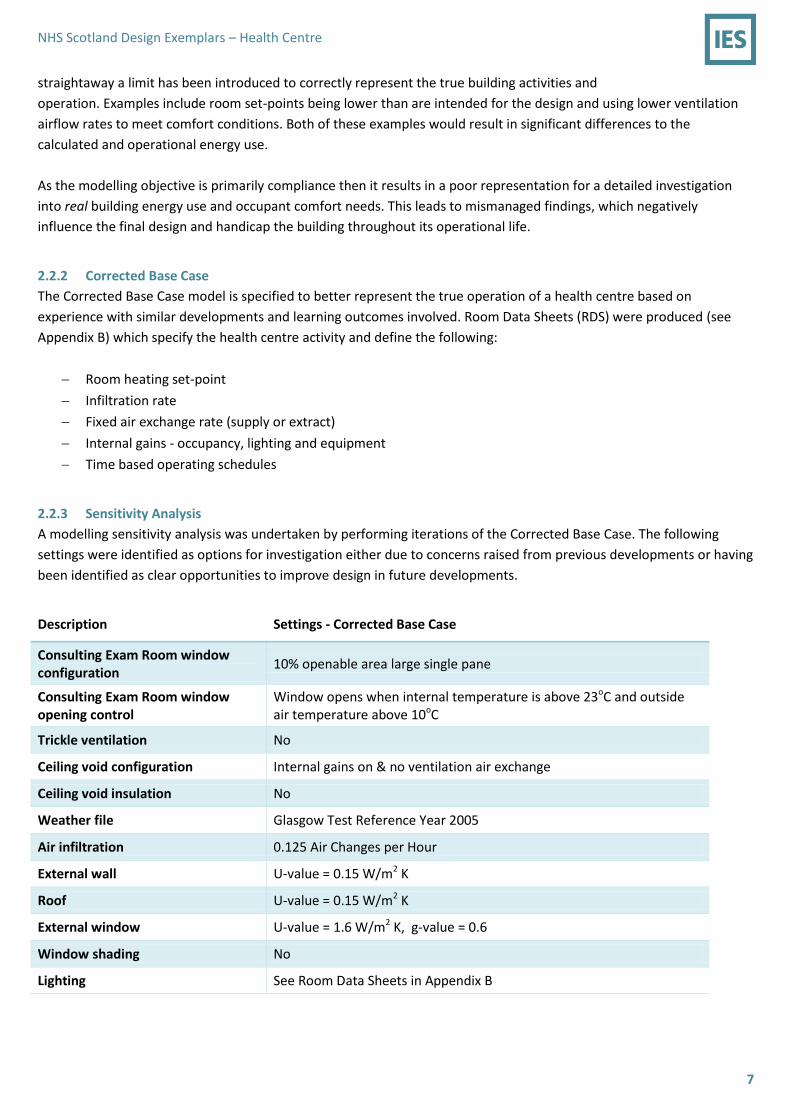
2.2.3 Sensitivity Analysis
A modelling sensitivity analysis was undertaken by performing iterations of the Corrected Base Case. The following
settings were identified as options for investigation either due to concerns raised from previous developments or having
been identified as clear opportunities to improve design in future developments.
Description Settings - Corrected Base Case
Consulting Exam Room window configuration
10% openable area large single pane
Consulting Exam Room window opening control
Window opens when internal temperature is above 23oC and outside air temperature above 10oC
Trickle ventilation No
Ceiling void configuration Internal gains on & no ventilation air exchange
Ceiling void insulation No
Weather file Glasgow Test Reference Year 2005
Air infiltration 0.125 Air Changes per Hour
External wall U-value = 0.15 W/m2 K
Roof U-value = 0.15 W/m2 K
External window U-value = 1.6 W/m2 K, g-value = 0.6
Window shading No
Lighting See Room Data Sheets in Appendix B

NHS Scotland Exemplars – Health Centre
8
2.3 Health Centre Geometry
Health Centre consulting exam rooms under analysis

NHS Scotland Design Exemplars - Health Centre
9
2.4 Sensitivity Analysis
2.4.1 Corrected Base Case Comparison
2.4.1.1 Consulting Exam Room: Equipment Gain
Time Period NCM Base Case (kW)
Time Period Corrected Base Case (kW)
Significant difference in the total annual equipment energy use.
The NBC equipment gain peaks at approximately 0.17kW but without any background load outside of the daytime period.
The CBC employs a profile which represents the true operations of the Consulting Exam Room’s equipment in which the gain peaks at 0.10kW
for daytime period and then a residual load is in place across evening and night.
NHS Scotland Design Exemplars - Health Centre
10
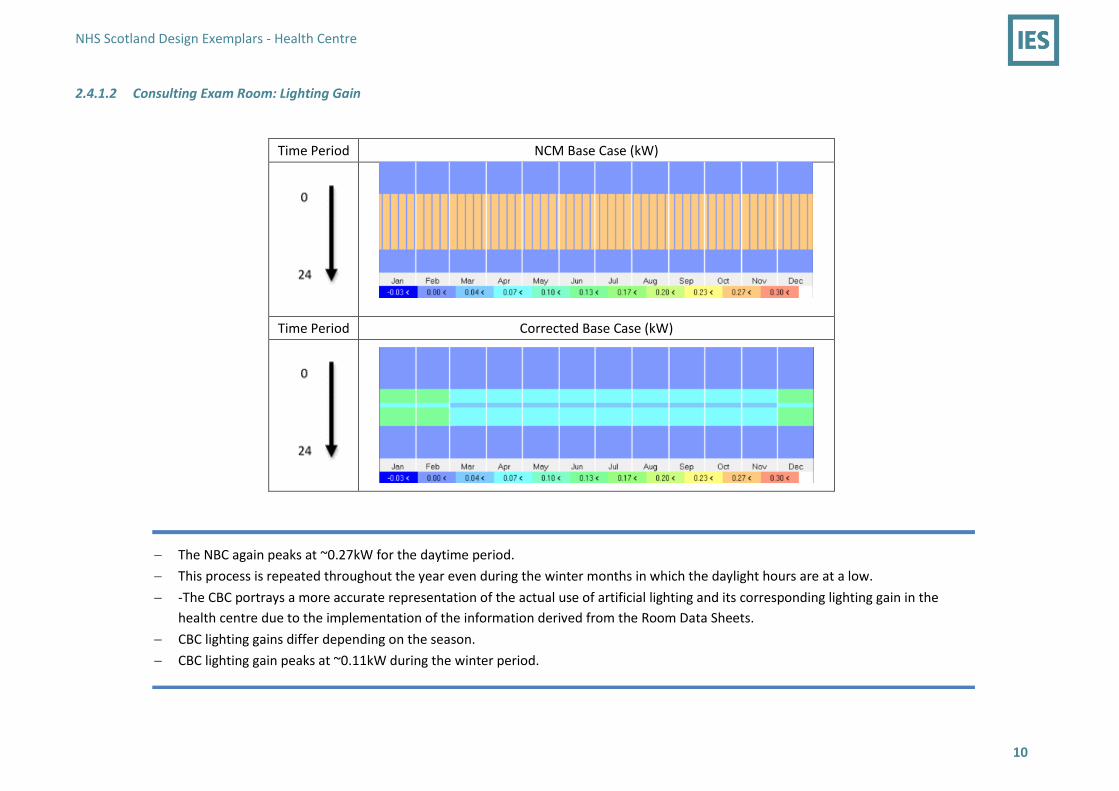
2.4.1.2 Consulting Exam Room: Lighting Gain
Time Period NCM Base Case (kW)
Time Period Corrected Base Case (kW)
The NBC again peaks at ~0.27kW for the daytime period.
This process is repeated throughout the year even during the winter months in which the daylight hours are at a low.
-The CBC portrays a more accurate representation of the actual use of artificial lighting and its corresponding lighting gain in the
health centre due to the implementation of the information derived from the Room Data Sheets.
CBC lighting gains differ depending on the season.
CBC lighting gain peaks at ~0.11kW during the winter period.

NHS Scotland Design Exemplars - Health Centre
11
2.4.1.3 Consulting Exam Room: People Gain
Time Period NCM Base Case (kW)
Time Period Corrected Base Case (kW)
NBC profile specifies a peak in people gain day at ~0.11kW.
CBC utilised RDS to represent the occupancy levels in the Consulting Exam Room throughout the day and peaks at ~0.045kW.

NHS Scotland Design Exemplars - Health Centre
12
2.4.1.4 Consulting Exam Room: Heating Energy
Note the different magnitude of scale for the Internal and External views.
Time Period NCM Base Case (kW) – Internal Conduction NCM Base Case (kW) – External Conduction
Time Period Corrected Base Case (kW) - Internal Conduction Corrected Base Case (kW) - External Conduction
The heating energy of the cumulated 6 Consulting Exam Rooms is substantially lower in the CBC, 0.0164 MWh, that there is almost no point is
displaying compared to the NBC, 7.4667 MWh.
The primary reason is the substantial difference due to internal conduction in the CBC which is in the region of an 8.6 MWh gain compared to a loss of
4.4 MWh in the NBC. The following heat map charts show the annual variance in heat gain to the Consulting Exam Room from internal conduction. The
large contingent of yellow area in the CBC identifies the space is being warmed by the well-sealed ceiling void space which remember is not present in
the NBC.
Note external conduction is similar in both still but is an order of magnitude less than the internal conduction the CBC receives.
NHS Scotland Design Exemplars - Health Centre
13
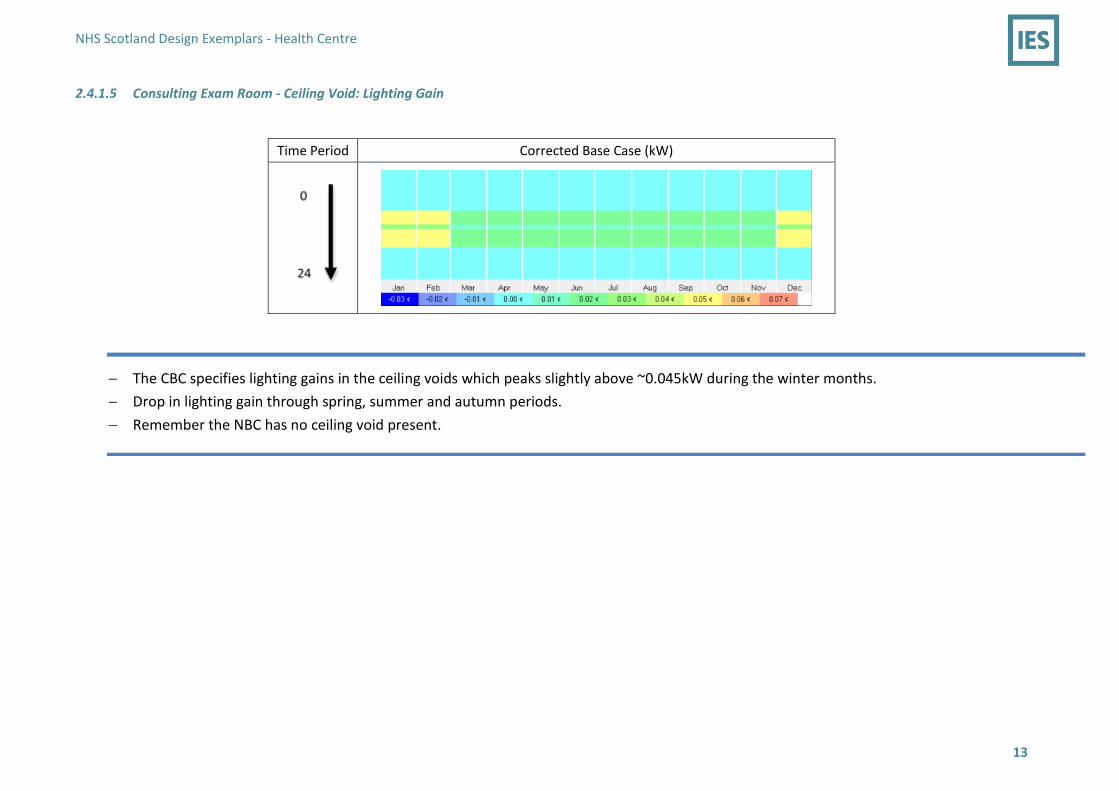
2.4.1.5 Consulting Exam Room - Ceiling Void: Lighting Gain
Time Period Corrected Base Case (kW)
The CBC specifies lighting gains in the ceiling voids which peaks slightly above ~0.045kW during the winter months.
Drop in lighting gain through spring, summer and autumn periods.
Remember the NBC has no ceiling void present.

NHS Scotland Design Exemplars - Health Centre
14
2.4.1.6 Consulting Exam Room NBC v CBC Summary View
NBC does not model a ceiling
void so no accumulation of gains
is present.
CBC accounts for heat gains in
the sealed ceiling void therefore
representing a build-up of heat.
NBC defines the health centre’s
internal gains and profiles from
NCM activities.
CBC specifies the health centre’s
operations using data from past
experiences to define the space
activities and internal gains.
NBC maintains no change in
operation hours of the health
centre.
CBC represents the true
operation of the health centre by
specifying the time based
operating schedule per activity
NBC models minimum supply airflow
from assigned space activity plus an
idealised approach of introducing
outside air to prevent heat build-up.
CBC models a variable airflow rate
based on a bulk airflow exchange
through a window strategy for
opening area and opening control.
NBC (Heating set point
varies with time) = 12oC and
22oC
CBC = 21oC and represents
actual design specifications.

NHS Scotland Design Exemplars - Health Centre
15
2.4.2 Potential Optimisation Scenarios
Optimisation scenarios were run across the following attributes identified as being key aspects of current performance where there is a need to investigate
toward enhancing thermal comfort and reviewing the subsequent impact on energy use.
Window configuration
Window opening control
Ceiling void gain and ventilation
Future weather files
Infiltration
Fabric
Façade glass transmittance and shading
Lighting
Trickle ventilation
Ceiling void configuration
The charts detail the permutations assessed for number of hours through the year operative temperature statistics exceed 26oC, 28oC and 30oC.
The red box highlights the assessed measure carried forth to a combined optimisation scenario.

NHS Scotland Design Exemplars - Health Centre
16
2.4.2.1 Overheating
162
113
410
910
1099
3374
411
523
1101
3375
872
564
458
272
60
32
153
410
495
1961
153
212
496
1964
398
243
180
93
21
2
50
177
215
966
51
83
215
966
174
98
66
23
0 500 1000 1500 2000 2500 3000 3500 4000
Corrected Base Case
NCM Base Case
Window 0.64m2 Opening, 4.1% of Floor Area
Window 0.36m2 Opening, 2.3% of Floor Area
Window 0.32m2 Opening, 2.1% of Floor Area
Window 0.16m2 Opening, 1.0% of Floor Area
Window 0.64m2 Split opening, 8.2% of Floor Area
Window 0.52m2 Split opening , 4.6% of Floor Area
Window 0.32m2 Split opening, 4.2% of Floor Area
Window 0.16m2 Split opening, 2% of Floor Area
Window 0.08m2(Bottom) 0.32m2 (Top) Split opening, 2.6% of Floor Area
Window 0.18m2(Bottom) 0.32m2 (Top) Split opening , 3.2% of Floor Area
Window 0.26m2(Bottom) 0.32m2 (Top) Split opening, 3.7% of Floor Area
Window 0.16m2(Bottom) 0.80m2 (Top) Split opening, 6.1% of Floor Area
Window Configuration - Consulting Exam Room-02 Overheating - Hours Above 26oC, 28oC, 30oC
> 30⁰C > 28⁰C > 26⁰C This option compares window area
performance, either as a single opening or
split openings which can generate more flow.
No trickle is run as to influence the window
airflow performance.

NHS Scotland Design Exemplars - Health Centre
17

NHS Scotland Design Exemplars - Health Centre
18
162
113
162
5009
3630
1326
390
5292
4028
1749
239
5009
3631
1330
391
5294
4030
1744
60
32
60
4369
2722
753
101
4507
2987
869
79
4369
2724
753
101
4508
2989
869
21
2
21
3890
1680
472
29
4000
1897
503
22
3890
1680
472
29
4000
1900
503
0 1000 2000 3000 4000 5000 6000
Corrected Base Case
NCM Base Case
Window Open at 23C
Window Open at 23C & Outside 10C
Window Open at 23C & Outside 8C
Window Open at 23C & Outside 5C
Window Open at 24C
Window Open at 24C & Outside 10C
Window Open at 24C & Outside 8C
Window Open at 24C & Outside 5C
Split Window Open 23C
Split Window Open 23C & Outside 10C
Split Window Open 23C & Outside 8C
Split Window Open 23C & Outside 5C
Split Window Open 24C
Split Window Open 24C & Outside 10C
Split Window Open 24C & Outside 8C
Split Window Open 24C & Outside 5C
Window Opening Control - Consulting Exam Room-02 Overheating - Hours Above 26oC, 28oC, 30oC
> 30⁰C > 28⁰C > 26⁰C This option assess when
the window is expected
to open, mirroring
manual or auto opening
control. Here the big
influence is a limit on
the outside air
temperature in
preventing unwanted
cold draughts
undesirable in winter
and transition seasons.
This control however
demonstrates the
damage that can have
on reducing internal air
temperatures. It shows
how the lack of cooler
air is a big hindrance
and that some form of
supply is needed if no
other options are
changed.
No trickle is run as to
influence the window
airflow performance.

NHS Scotland Design Exemplars - Health Centre
19
162
113
99
95
162
158
154
148
143
127
102
74
60
32
32
30
60
59
58
57
50
43
35
20
21
2
0
0
21
19
17
15
11
8
2
0
0 20 40 60 80 100 120 140 160 180
Corrected Base Case
NCM Base Case
Ceiling Void No Gain No Vent
Ceiling Void No Gain 0.125ACH Vent
Ceiling Void Gain No Vent
Ceiling Void Gain 0.06 Vent
Ceiling Void Gain 0.125 Vent
Ceiling Void Gain 0.25 Vent
Ceiling Void Gain 0.5 Vent
Ceiling Void Gain 1ACH
Ceiling Void Gain 2ACH
Ceiling Void Gain 4ACH
Ceiling Void Ventilation - Consulting Exam Room-02 Overheating - Hours Above 26oC, 28oC, 30oC
> 30⁰C > 28⁰C > 26⁰C Ceiling void gains are acting as a large
internal conduction gain to the
occupied space because of the heat
build-up. The unventilated ceiling void is
worst but large ventilation is still not
enough compared to no gain at all.
Prevention is better than cure in this
case if possible.

NHS Scotland Design Exemplars - Health Centre
20

NHS Scotland Design Exemplars - Health Centre
21
162
113
129
253
185
490
200
189
292
218
584
232
179
309
226
529
245
178
290
224
510
236
60
32
46
79
56
232
58
87
150
110
249
123
72
133
90
283
97
98
152
116
282
122
21
2
5
28
16
95
18
24
58
33
148
33
34
59
43
140
44
56
88
72
157
74
0 100 200 300 400 500 600 700
Corrected Base Case
NCM Base Case
Glasgow-TRY-2020
Glasgow-TRY-2050 (High)
Glasgow-TRY-2050 (Medium)
Glasgow-TRY-2080 (High)
Glasgow-TRY-2080 (Low)
Glasgow-DSY1-2020
Glasgow-DSY1-2050 (High)
Glasgow-DSY1-2050 (Medium)
Glasgow-DSY1-2080 (High)
Glasgow-DSY2-2080 (lLow)
Glasgow-DSY2-2020
Glasgow-DSY2-2050 (High)
Glasgow-DSY2-2050 (Medium)
Glasgow-DSY2-2080 (High)
Glasgow-DSY2-2080 (Low)
Glasgow-DSY3-2020
Glasgow-DSY3-2050 (High)
Glasgow-DSY3-2050 (Medium)
Glasgow-DSY3-2080 (High)
Glasgow-DSY3-2080 (Low)
Future Weather Files - Consulting Exam Room-02 Overheating - Hours Above 26oC, 28oC, 30oC
> 30⁰C > 28⁰C > 26⁰C Future weather files
generally indicate warmer
conditions are anticipated.
However it is important to
note the type of file to be
expected in these sims.
DSY’s should be run for
overheating and TRY for
energy performance.
Using the wrong file could
mask conditions.
The next point is what era
a building is expected to
exist in, performance on
opening is great but what
is the considered life of the
building? It should be
tested against the future
period to ensure resilience
against those expected
conditions to avoid a
growing risk of
overheating still occurring.

NHS Scotland Design Exemplars - Health Centre
22
162
113
136
139
153
162
60
32
44
46
57
60
21
2
10
11
16
21
0 20 40 60 80 100 120 140 160 180
Corrected Base Case
NCM Base Case
Infiltration 0.60ACH
Infiltration 0.50ACH
Infiltration 0.25ACH
Infiltration 0.125ACH
Infiltration - Consulting Exam Room-02 Overheating - Hours Above 26C, 28C, 30C
> 30⁰C > 28⁰C > 26⁰C
Growing air tightness is bad news
for overheating as it is reducing
ventilation heat loss. It is a positive
for heating energy consumption
but to maintain thermal comfort
then other means must be
available to bring in the cool air
required. Measures can be
assessed clearly to limit what this
airflow would need to be.

NHS Scotland Design Exemplars - Health Centre
23
162
113
167
172
179
185
197
60
32
62
65
69
73
77
21
2
22
24
24
24
26
0 50 100 150 200 250
Corrected Base Case
NCM Base Case
Fabric U-Value -10%
Fabric U-Value -20%
Fabric U-Value -30%
Fabric U-Value -40%
Fabric U-Value -50%
Fabric Performance - Consulting Exam Room-02 Overheating - Hours Above 26oC, 28oC, 30oC
> 30⁰C > 28⁰C > 26⁰C
Constructions are an easy target
for building regulations
improvement but also seal heat in
which is a threat to overheating
risk. The balance of energy and
overheating from fabric
performance is not so clear cut any
longer.

NHS Scotland Design Exemplars - Health Centre
24
162
113
124
24
33
49
57
67
76
14
17
23
35
43
60
32
38
0
0
2
3
7
14
0
0
0
1
2
21
2
5
0
0
0
0
0
0
0
0
0
0
0
0 20 40 60 80 100 120 140 160 180
Corrected Base Case
NCM Base Case
G-Value 0.50 No Ext. Shade
G-Value 0.50 Ext. Shade 0.2
G-Value 0.50 Ext. Shade 0.3
G-Value 0.50 Ext. Shade 0.4
G-Value 0.50 Ext. Shade 0.5
G-Value 0.50 Ext. Shade 0.6
G-Value 0.37 No Ext.Shade
G-Value 0.37 Ext. Shade 0.2
G-Value 0.37 Ext. Shade 0.3
G-Value 0.37 Ext. Shade 0.4
G-Value 0.37 Ext. Shade 0.5
G-Value 0.37 Ext. Shade 0.6
Facade Performance - Consulting Exam Room-02 Overheating - Hours Above 26oC, 28oC, 30oC
> 30⁰C > 28⁰C > 26⁰C
Managing solar gains is a crucial factor in
appreciating the energy balance a
building must experience. Is a space
influenced by solar or internal gain? This
must be answered and then an accurate
investigation of glass and external
shading performance can be undertaken.
Is it better to have shades and block gains
in summer but capture in winter
compared to just adding a glass type
which will reduce by the same factor all
year? This is an easy approach to model.

NHS Scotland Design Exemplars - Health Centre
25
0.000 0.200 0.400 0.600 0.800 1.000 1.200 1.400 1.600
Corrected Base Case
NCM Base Case
G-Value 0.50 No Ext. Shade
G-Value 0.50 Ext. Shade 0.2
G-Value 0.50 Ext. Shade 0.3
G-Value 0.50 Ext. Shade 0.4
G-Value 0.50 Ext. Shade 0.5
G-Value 0.50 Ext. Shade 0.6
G-Value 0.37 No Ext.Shade
G-Value 0.37 Ext. Shade 0.2
G-Value 0.37 Ext. Shade 0.3
G-Value 0.37 Ext. Shade 0.4
G-Value 0.37 Ext. Shade 0.5
G-Value 0.37 Ext. Shade 0.6
South Bedroom Annual Solar Gain (MWh)
Following on from the above chart, this
view details the captured solar gain in a
south consulting exam room across
variations in glass and shade. Adding
some external shade can reduce the
need to specify high solar performing
glass.

NHS Scotland Design Exemplars - Health Centre
26
162
113
156
154
149
147
144
60
32
59
57
55
54
52
21
2
19
17
15
14
13
0 20 40 60 80 100 120 140 160 180
Corrected Base Case
NCM Base Case
Lighting -10%
Lighting -20%
Lighting -30%
Lighting -40%
Lighting -50%
Internal Lighting Gain - Consulting Exam Room-02 Overheating - Hours Above 26oC, 28oC, 30oC
> 30⁰C > 28⁰C > 26⁰C Lighting gain is seeing a
revolution through the
introduction of LED’s and
daylight diming technologies.
Clearly being able to maintain
the same illuminance at a
lower energy is a win-win
when adding in the potential
to reduce the risk of
overheating.
NHS Scotland Design Exemplars - Health Centre
27
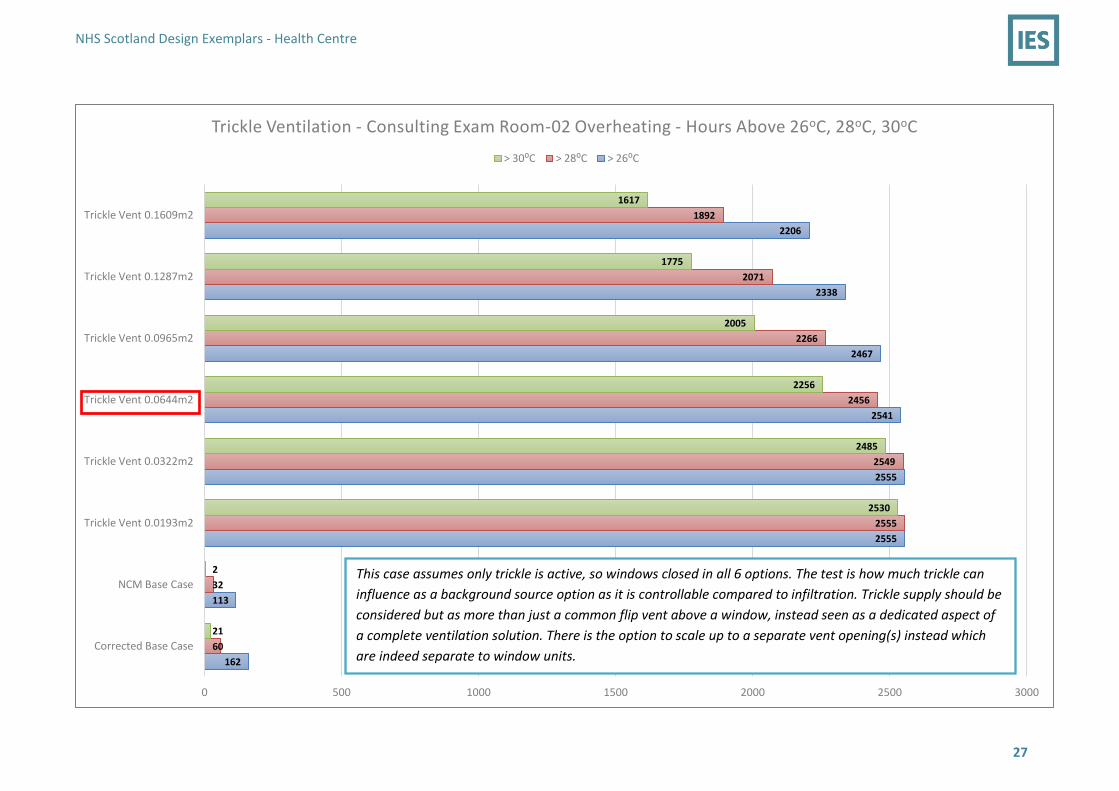
162
113
2555
2555
2541
2467
2338
2206
60
32
2555
2549
2456
2266
2071
1892
21
2
2530
2485
2256
2005
1775
1617
0 500 1000 1500 2000 2500 3000
Corrected Base Case
NCM Base Case
Trickle Vent 0.0193m2
Trickle Vent 0.0322m2
Trickle Vent 0.0644m2
Trickle Vent 0.0965m2
Trickle Vent 0.1287m2
Trickle Vent 0.1609m2
Trickle Ventilation - Consulting Exam Room-02 Overheating - Hours Above 26oC, 28oC, 30oC
> 30⁰C > 28⁰C > 26⁰C
This case assumes only trickle is active, so windows closed in all 6 options. The test is how much trickle can
influence as a background source option as it is controllable compared to infiltration. Trickle supply should be
considered but as more than just a common flip vent above a window, instead seen as a dedicated aspect of
a complete ventilation solution. There is the option to scale up to a separate vent opening(s) instead which
are indeed separate to window units.

NHS Scotland Design Exemplars - Health Centre
28
162
104
180
182
60
33
77
77
21
2
28
29
0 20 40 60 80 100 120 140 160 180 200
Corrected Base Case
NCM Base Case
Ceiling Void Insulation 25mm
Ceiling Void Insulation 50mm
Void Configuration - Consulting Exam Room-02 Overheating - Hours Above 26oC, 28oC, 30oC
> 30⁰C > 28⁰C > 26⁰C
These cases looked at other void related
measures at managing the risk. The possibility
of adding insulation to contain ceiling void gain
but this approach does not away from the fact
it is still an attempt to cure and not prevent the
gain occurring.

NHS Scotland Design Exemplars - Health Centre
29
2.4.2.2 Heating Energy
The NBC setup means it is not at as much risk of
overheating as the other cases so heating consumption
is higher even though it has a lower heating set point.
This is primarily due to its lower level of internal gains
and the fact a ceiling void does not need to be included
in the way the CBC has attempted to accurately
portray.

NHS Scotland Design Exemplars - Health Centre
30
0.2
0.1
2.1
0.7
0.1
0.2
0.0 0.5 1.0 1.5 2.0 2.5
Corrected Base Case
NCM Base Case
Infiltration 0.60ACH
Infiltration 0.50ACH
Infiltration 0.25ACH
Infiltration 0.125ACH
Infiltration - Consulting Exam Room-02 Heating kWh/m2
More ventilation heat loss from infiltration
requires a corresponding heat input to meet set-
point.
With lower rates as specified by the building
regulations then yes heating is proven to be
reduce.
Note infiltration loss is a seasonal variation due to
internal and external air temperature difference.
NHS Scotland Design Exemplars - Health Centre
31
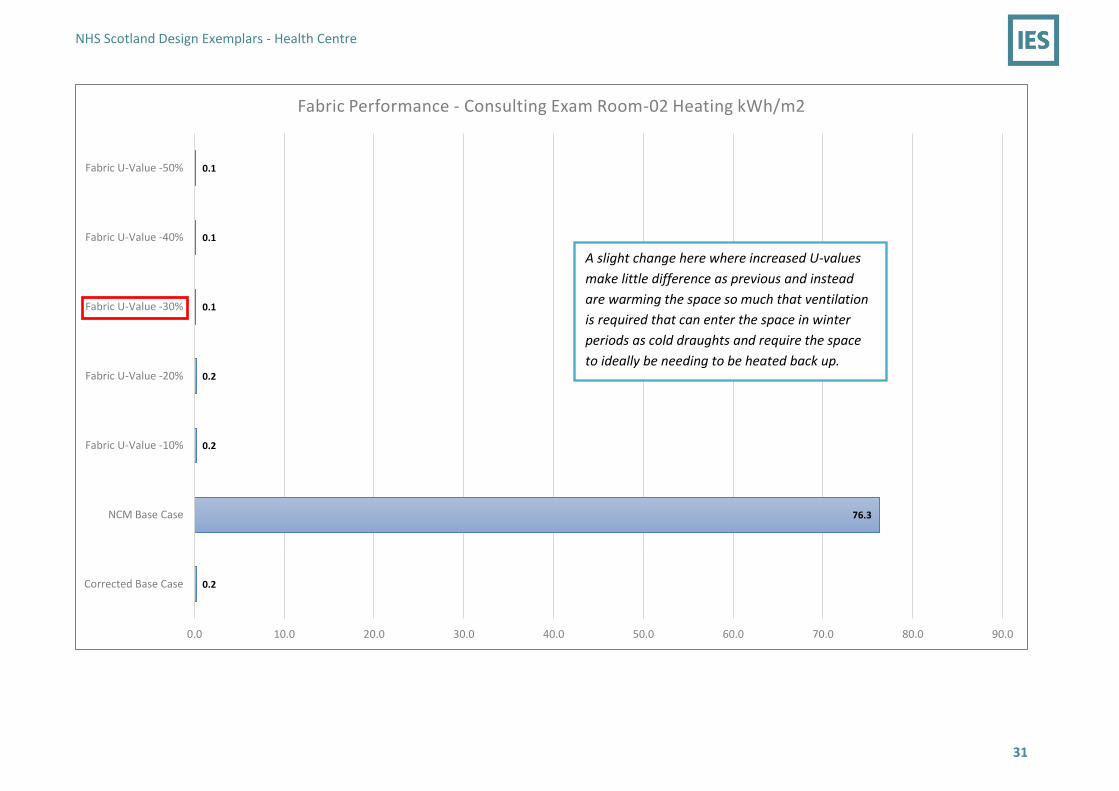
0.2
76.3
0.2
0.2
0.1
0.1
0.1
0.0 10.0 20.0 30.0 40.0 50.0 60.0 70.0 80.0 90.0
Corrected Base Case
NCM Base Case
Fabric U-Value -10%
Fabric U-Value -20%
Fabric U-Value -30%
Fabric U-Value -40%
Fabric U-Value -50%
Fabric Performance - Consulting Exam Room-02 Heating kWh/m2
A slight change here where increased U-values
make little difference as previous and instead
are warming the space so much that ventilation
is required that can enter the space in winter
periods as cold draughts and require the space
to ideally be needing to be heated back up.

NHS Scotland Design Exemplars - Health Centre
32
The NBC dwarfs the options
reviewed for the glass and shade
analysis.

NHS Scotland Design Exemplars - Health Centre
33
2.4.3 Optimised Approach
Utilising the modelling sensitivity scenarios tested against the Corrected Base Case, a total of five optimised scenarios were modelled.
Case-01 combines a series of optimisation solutions with Cases-02 to 04 introducing further enhancement on each step.
Case-05 then tests the complete optimised model against a future weather scenario to assess the potential for regression back toward overheating.
Optimised Combined Scenario
Window 0.64m2 Split Opening, Opening 8.2% of Floor Area,
Window Open at 23oC, Ceiling Void Air Exchange 4ACH,
Infiltration 0.125ACH, Fabric -30%,
Lighting -50%
Trickle vent opening Area of
0.0644m2
Ceiling Void insulation 25mm
External window g-value of 0.37, external shade 0.40
Use of the future weather file Glasgow-DSY2-2050 (High)
Case-01
Case-02
Case-03
Case-04
Case-05

NHS Scotland Design Exemplars - Health Centre
34
2.4.3.1 Consulting Exam Room Overheating
All of the optimised cases demonstrate lower risk of overheating compared to the NCM Base Case and
Corrected Base Case models.

NHS Scotland Design Exemplars - Health Centre
35
2.4.3.2 Consulting Exam Room Heating Energy
Case-01:
7.5
0.0
4.3
0.0 1.0 2.0 3.0 4.0 5.0 6.0 7.0 8.0
NCM BASE CASE
CORRECTED BASE CASE
CASE-01
Heating Annual Energy (MWh)
Case 01 proposes the installation of windows with split openings of an area of 0.64m2, 8.2% of the floor area and to open at 23oC. The Ceiling void
is ventilated to 4ACH, the infiltration rate is 0.125ACH whilst also improving the building fabric u-value by 30% and reducing lighting by 50%.
The Case-01 heating consumption is clearly larger than the Corrected Base Case due to a reduction in impact from the ceiling void gain to the
occupied space. The heating for the CBC is negligible in comparison to the other models.

NHS Scotland Design Exemplars - Health Centre
36
Case-02:
7.5
0.0
4.3
0.0 1.0 2.0 3.0 4.0 5.0 6.0 7.0 8.0
NCM BASE CASE
CORRECTED BASE CASE
CASE-02
Heating Annual Energy (MWh)
In addition to the installations proposed in Case 01, Case 02 proposed the application of trickle vents of an area of 0.0644m2.
Trickle vents introduce cool air in the form of natural ventilation and minimise the risk of spaces overheating.
No noticeable change in heating alongside the minimal assistance to overheating.

NHS Scotland Design Exemplars - Health Centre
37
Case-03:
7.5
0.0
3.2
0.0 1.0 2.0 3.0 4.0 5.0 6.0 7.0 8.0
NCM BASE CASE
CORRECTED BASE CASE
CASE-03
Heating Annual Energy (MWh)
In addition to installations proposed in Case 02, Case 03 proposes a 25mm insulation around the ceiling void.
This actually reduces the heating load because the heat loss to the void is reduced which is now acceptable to consider as ceiling void gain is
less and is being controlled through the void’s purge ventilation.

NHS Scotland Design Exemplars - Health Centre
38
Case-04:
7.5
0.0
3.6
0.0 1.0 2.0 3.0 4.0 5.0 6.0 7.0 8.0
NCM BASE CASE
CORRECTED BASE CASE
CASE-04
Heating Annual Energy (MWh)
In addition to installations proposed in Case 03, Case 04 proposes the installation of external windows with a g-value of 0.37 and external shading factor
of 0.4.
The reduction in solar gain to assist with internal comfort has reduced the beneficial offset to heating energy consumption through the year.
NHS Scotland Design Exemplars - Health Centre
39
Case-05:
7.5
0.0
2.5
0.0 1.0 2.0 3.0 4.0 5.0 6.0 7.0 8.0
NCM BASE CASE
CORRECTED BASE CASE
CASE-05
Heating Annual Energy (MWh)
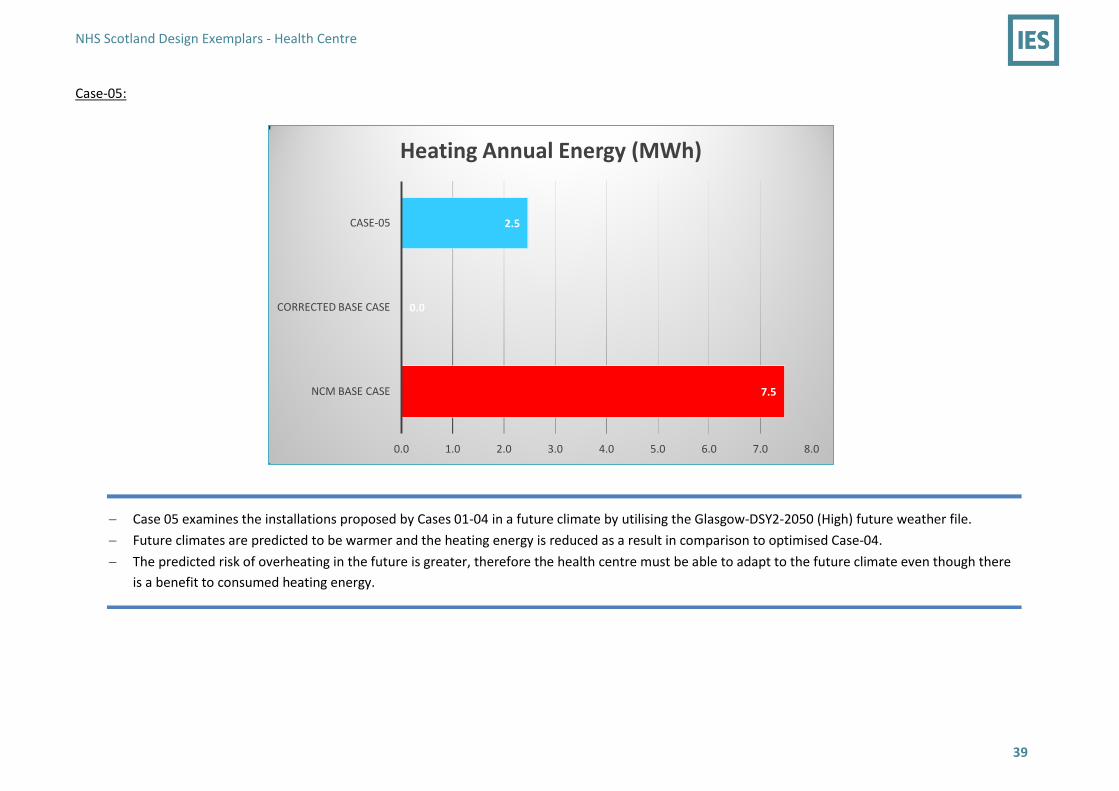
Case 05 examines the installations proposed by Cases 01-04 in a future climate by utilising the Glasgow-DSY2-2050 (High) future weather file.
Future climates are predicted to be warmer and the heating energy is reduced as a result in comparison to optimised Case-04.
The predicted risk of overheating in the future is greater, therefore the health centre must be able to adapt to the future climate even though there
is a benefit to consumed heating energy.

NHS Scotland Design Exemplars - Health Centre
40
Energy consumption increases from the optimised measures when compared to the Corrected Base Case but is still in the region of 50% less compared to the
NBC.
7.5
0.0
4.3
4.3
3.2
3.6
2.5
0.0 1.0 2.0 3.0 4.0 5.0 6.0 7.0 8.0
NCM BASE CASE
CORRECTED BASE CASE
CASE-01
CASE-02
CASE-03
CASE-04
CASE-05
Heating Annual Energy (MWh)

NHS Scotland Design Exemplars - Health Centre
41
2.4.3.3 Consulting Exam Room Heating Loads
The peak heating load has been compared for the base building models and Case-04. Within this is a comparison of a static heating load calculated through the
CIBSE Loads approach against the dynamic simulation route. With the static approach a number of factors are not included which may improperly influence the
selection of plant equipment. For example internal gain heat loads are not included, profile variation is inherently not a factor due to the static nature of CIBSE
Loads and this also means variation in natural ventilation heat loss cannot be accounted for.
Heating Load (kW)
Dynamic Simulation Dynamic Simulation [Zero Gains] CIBSE Loads
NBC 1.53 1.68 0.903
CBC 0.225 0.296 0.305
Optimised 04 0.453 0.58 0.556
1.53
0.225
0.453
1.68
0.296
0.58
0.903
0.305
0.556
0 0.2 0.4 0.6 0.8 1 1.2 1.4 1.6 1.8
NBC
CBC
Optimised 04
Consulting Exam Room 3 - Peak Heating Load (kW)
CIBSE Loads Dynamic Simulation [Zero Gains] Dynamic Simulation
In the NBC model the static load assessment is noted to significantly underestimate the heating load compared to both DSM representations. Closer
approximation is noted in the smaller load cases of the CBC and Case-04. Note the static load external design temperature is normally a set characteristic of
the site but the dynamic weather file can show a larger difference and in many occasions a cooler temperature which may require a greater load. Fabric load
effects are modelled very differently between static and dynamic models. Case-04 has a compensatory need for greater heat input during the coolest season
compared to CBC due to its overheating risk significantly lessened.

NHS Scotland Design Exemplars - Health Centre
42
2.4.3.4 Consulting Exam Room Case-04 v CBC Summary View
The CBC large single pane of 10% openable
area bedroom window configuration is
optimised in Case-04 by the employment of
0.64m2 Split Opening Windows of
Opening 8.2% of Floor Area
Optimised Case -04 Ceiling voids are
infused with 4ACH of air and 25mm
of insulation are installed on the
void surfaces whereas the CBC
ceiling voids lack ventilation and
are uninsulated.
Optimised Case-04 hospital’s external
building fabric is due to a 30%
improvement in performance in
comparison with the CBC model
CBC does not include any form of window
shading although the façade performance is
improved in Optimised Case-04 by the
incorporation of window and external shading
of g-values of 0.37 and 0.40 respectively.
Increase in trickle ventilation
opening area in Case-04 from
0.0196m2 as included within
the CBC to 0.0.0644m2.
In Case 04, Lighting System is
further improved by 50% in
comparison with the CBC
model
In the CBC, windows are configured to
open when internal air temperature
reaches 23oC and when outside air
temperature is above 10oC
In Optimised Case-04 the window opens
when the internal air temperature
reaches 23oC

NHS Scotland Design Exemplars - Health Centre
43
2.5 Solar Energy Impact Using the SunCast solar visualisation simulation we have assessed the accumulated annual solar energy on the façade where the Consulting Exam Rooms are
located and which faces predominantly South. We have then modelled East, North and West to compare the cumulative difference.
There is a clear variation in solar energy with this approach which provides invaluable details for early stage design on the façade surfaces most at risk to direct
solar gain through glazing and transient external conduction gain. This data can be used for space activity planning to position occupied spaces where thermal
and visual comfort can be suitably managed, identifying external shading needs and positioning photovoltaics for maximum energy generation.
It is important to note that analysis of façade solar gain capture and activity planning needs to consider profiles of operation. For example the South and West
orientations do not have a significant difference but certainly west facing solar gain will be at lower angle and later in the day so what issue would this have for
spaces with long day usage patterns.
All figures are in kWh/m2:
South East North West
750 450 375 700
The following visualisations show the captured solar energy variation across the façade.

NHS Scotland Design Exemplars - Health Centre
44
2.5.1 South
When set as a west facing façade the solar energy impact is in the region of ~750 kWh/m2.
NORTH
N

NHS Scotland Design Exemplars - Health Centre
45
2.5.2 East
When set as a west facing façade the solar energy impact is in the region of ~450 kWh/m2.
NORTH
N

NHS Scotland Design Exemplars - Health Centre
46
2.5.3 North
When set as a west facing façade the solar energy impact is in the region of ~375 kWh/m2.
NORTH
N

NHS Scotland Design Exemplars - Health Centre
47
2.5.4 West
When set as a west facing façade the solar energy impact is in the region of ~700 kWh/m2.
N
O
R
T
H N

NHS Scotland Design Exemplars - Hospital
48
3 Hospital
3.1 Introduction This report details the modelling investigation of a recent and typical hospital development that we used as an exemplar
study model. The study focused on the predicted performance of a typical hospital wing containing a typical,
representative ward with 100% single bedroom suites and support spaces. Modelling is used to predict building
performance, and when successful helps design teams make better, more assured decisions based on evidence, reduce
risk and result in the best possible building for its occupants and the environment. Models are critically dependent on
the quality of the data selected to go into their calculation, with poor data will come a poor representation and
therefore risks misdirection for the design path. Past cases exist where model outputs have been criticised but instead
this is the result of poorly selected inputs. Successful models are built by competent modellers working with their design
teams who together have selected the most appropriate inputs to meet the needs at each stage in the project.
This report details the use of a Dynamic Simulation Model (DSM) which is a sub-hourly time based simulation utilising
hourly weather data and test building attributes including building form, fabric, internal gains, ventilation air exchanges,
operation profiles and building HVAC systems. The simulation then produces hourly data for energy and environmental
metrics from which modellers can produce statistical reports to detail exactly how the building is predicted to perform.
The use of a model at the design stage is only the first step in its life as a companion to the building. The model can
continue to be used during the operational stage by calibrating the model using metered data. This calibrated evolution
can then both be used to predict the effects of retrofit works and also to check building performance and identify if the
building is moving outside of its intended parameters and exactly which of these are vulnerable.
The analysis has been undertaken based on the backdrop of the latest Section 6 Scottish Building Regulations from
2015. These regulations have guided aspects such as fabric within the tested models. It is worth noting the latest NHS
Scotland buildings constructed would have been built to the pre-existing 2010 standards and that performance detailed
by this analysis to 2015 requires higher standards of thermal insulation and air tightness. There are definite diminishing
returns in aspects of building design, such as thermal insulation, which were previously identified as being key factors as
overheating of buildings becomes more prevalent. Other factors not previously under the spotlight, such as shading,
are now become crucial in striving for continued performance improvement. As the regulations and building standards
become higher it is clear that only a full sub-hourly analysis provides the opportunity to quantify the improvements
being made.
3.2 Modelling Scenarios
3.2.1 NCM Base Case
The NCM Base Case is a representation of the hospital models most frequently presented to NHS Scotland for newly
designed developments. These involve the deployment of a Section 6 Building Regulations model where the primary
modelling objective is compliance. The ‘National Calculation Methodology’ (NCM), was created by the UK government
for the purposes of a ‘like for like’ operational comparison so to assess the performance of fabric, HVAC system
efficiencies, lighting and other such building performance factors across all buildings with a similar use, e.g. hospitals.
The NCM provides set input data including operation hours, room set-points, ventilation flowrates and illuminance
levels. However with this comes clear its intention to serve as a benchmark compliance as there is a very limited number
of building type and activities available to select and assign to the model’s spaces. This is not a problem for compliance
as all similar spaces will use the same operational data in their models. However, if modellers are actively trying to use
NHS Scotland Design Exemplars - Hospital
49
this minimal list to represent their ‘real’ building design then straightaway a limit has been introduced
to correctly represent the true building activities and operation. Examples include NCM room set-points being lower
than are intended for the design and using lower ventilation airflow rates to meet comfort conditions. Both of these
examples would result in significant differences to the calculated and operational energy use. This gap is frequently
referred to as the ‘performance gap’ and this can be reduced or eliminated by using more site specific and accurate
input data in the real building model simulations.
It is known that designers frequently use NCM data in their design calculations and as the modelling objective is
primarily compliance then it results in a poor representation for a detailed investigation into real building energy use
and occupant comfort needs. This leads to mismanaged findings, which negatively influence the final design and
handicap the building throughout its operational life.
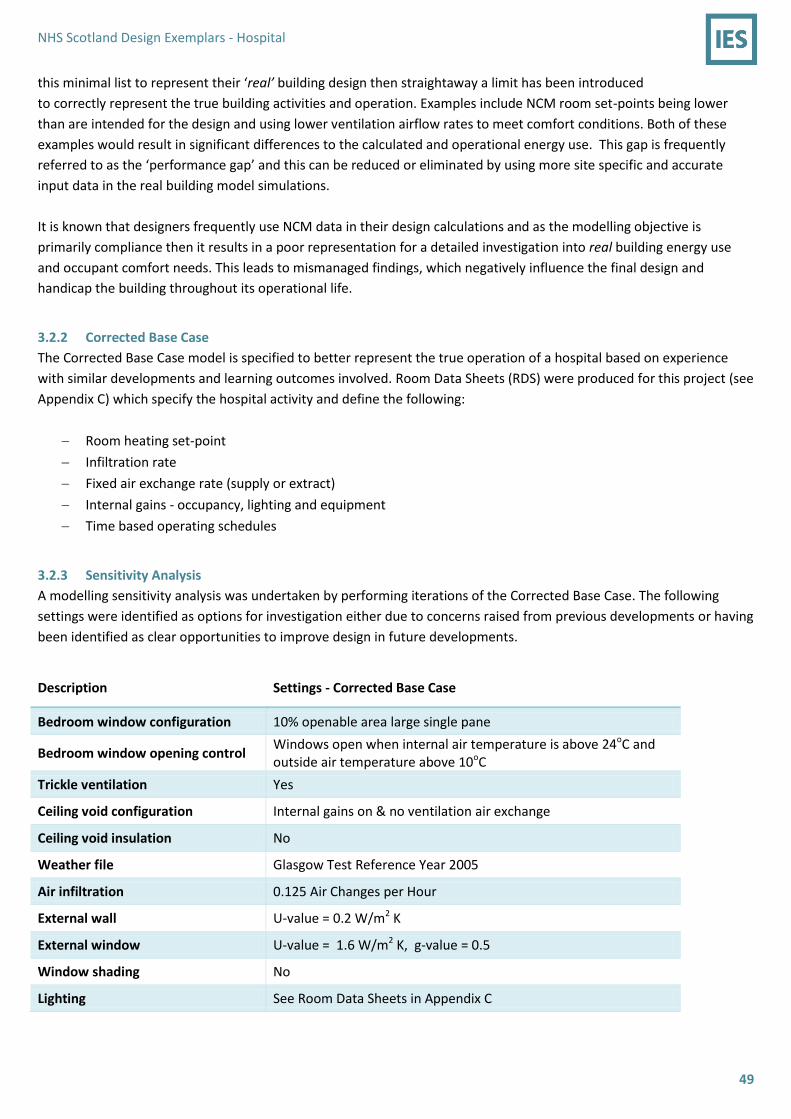
3.2.2 Corrected Base Case
The Corrected Base Case model is specified to better represent the true operation of a hospital based on experience
with similar developments and learning outcomes involved. Room Data Sheets (RDS) were produced for this project (see
Appendix C) which specify the hospital activity and define the following:
Room heating set-point
Infiltration rate
Fixed air exchange rate (supply or extract)
Internal gains - occupancy, lighting and equipment
Time based operating schedules
3.2.3 Sensitivity Analysis
A modelling sensitivity analysis was undertaken by performing iterations of the Corrected Base Case. The following
settings were identified as options for investigation either due to concerns raised from previous developments or having
been identified as clear opportunities to improve design in future developments.
Description Settings - Corrected Base Case
Bedroom window configuration 10% openable area large single pane
Bedroom window opening control Windows open when internal air temperature is above 24oC and outside air temperature above 10oC
Trickle ventilation Yes
Ceiling void configuration Internal gains on & no ventilation air exchange
Ceiling void insulation No
Weather file Glasgow Test Reference Year 2005
Air infiltration 0.125 Air Changes per Hour
External wall U-value = 0.2 W/m2 K
External window U-value = 1.6 W/m2 K, g-value = 0.5
Window shading No
Lighting See Room Data Sheets in Appendix C

NHS Scotland Design Exemplars - Hospital
50
3.3 Hospital Geometry
South facing bedroom under analysis

NHS Scotland Design Exemplars - Hospital
51
North facing bedroom under analysis

NHS Scotland Design Exemplars - Hospital
52
3.4 Sensitivity Analysis
3.4.1 Corrected Base Case Comparison
The following charts assess the cumulative annual energy for the 20 bedrooms within the ward alongside a yearly time period profile indicating when the load
in a bedroom occurs.
3.4.1.1 Bedroom: Equipment Gain
Time Period NCM Base Case (kW)
Time Period Corrected Base Case (kW)
Substantial difference in the accumulated equipment annual energy for the 20 ward bedrooms and the peak value for exemplar bedroom.
NBC utilises operating profiles based on the deployment of a Section 6 Building regulation model, the equipment gain peaks at ~0.08kW for two
instances per day which are more representative of a residential activity.
The CBC employs profiles which represents a more continuous use of bedroom equipment in which the gain peaks at ~0.14kW for the bulk of
the day.
As a result, the CBC has a significantly greater equipment annual energy.
NHS Scotland Design Exemplars - Hospital
53
3.4.1.2 Bedroom: Lighting Gain
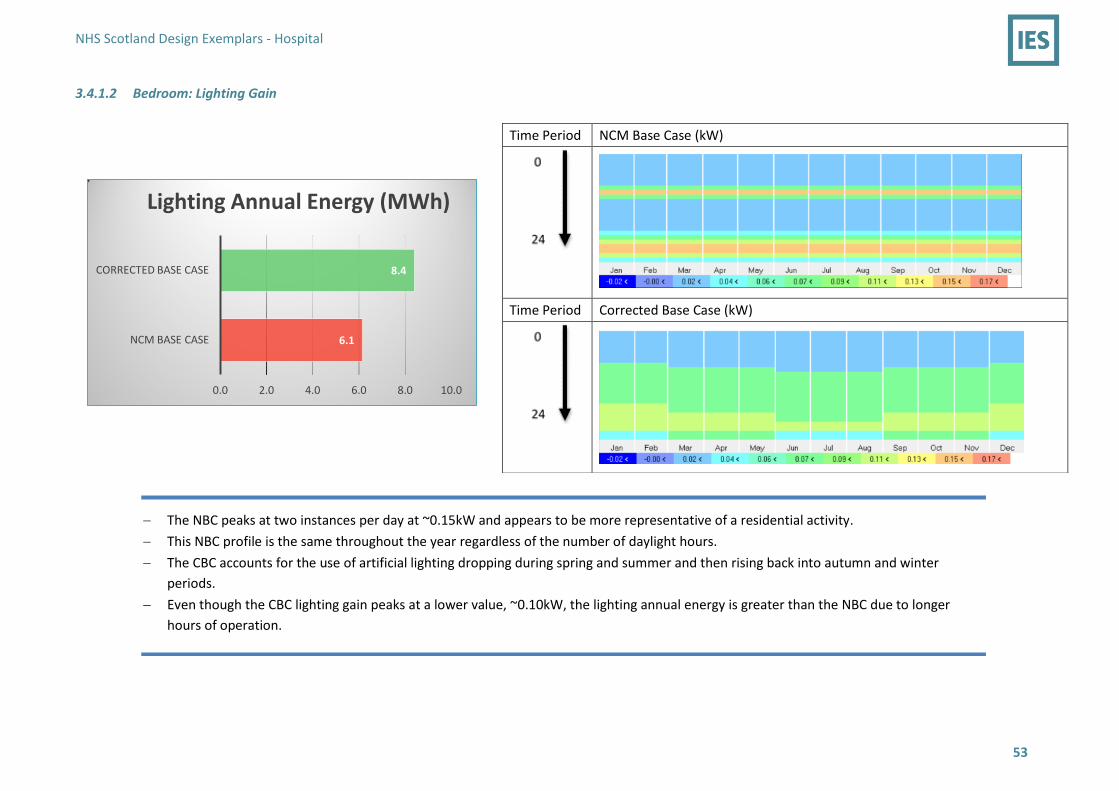
6.1
8.4
0.0 2.0 4.0 6.0 8.0 10.0
NCM BASE CASE
CORRECTED BASE CASE
Lighting Annual Energy (MWh)
Time Period NCM Base Case (kW)
Time Period Corrected Base Case (kW)
The NBC peaks at two instances per day at ~0.15kW and appears to be more representative of a residential activity.
This NBC profile is the same throughout the year regardless of the number of daylight hours.
The CBC accounts for the use of artificial lighting dropping during spring and summer and then rising back into autumn and winter
periods.
Even though the CBC lighting gain peaks at a lower value, ~0.10kW, the lighting annual energy is greater than the NBC due to longer
hours of operation.

NHS Scotland Design Exemplars - Hospital
54
3.4.1.3 Bedroom: People Gain
36.5
19.7
0.0 10.0 20.0 30.0 40.0
NCM BASE CASE
CORRECTED BASE CASE
People Annual Gain (MWh)
Time Period NCM Base Case (kW)
Time Period Corrected Base Case (kW)
NBC profile specifies a continuous occupancy gain throughout the day at ~0.23kW, note how different this is to the lighting and equipment
profiles employed by the same model.
CBC has three occupancy spikes in the bedroom throughout the day peaking at ~0.19kW and these represent medical experts and visiting
hours.
NBC people annual gain is far greater than the CBC annual people gain due to the continuous occupancy level.
NHS Scotland Design Exemplars - Hospital
55
3.4.1.4 Bedroom: Heating Energy
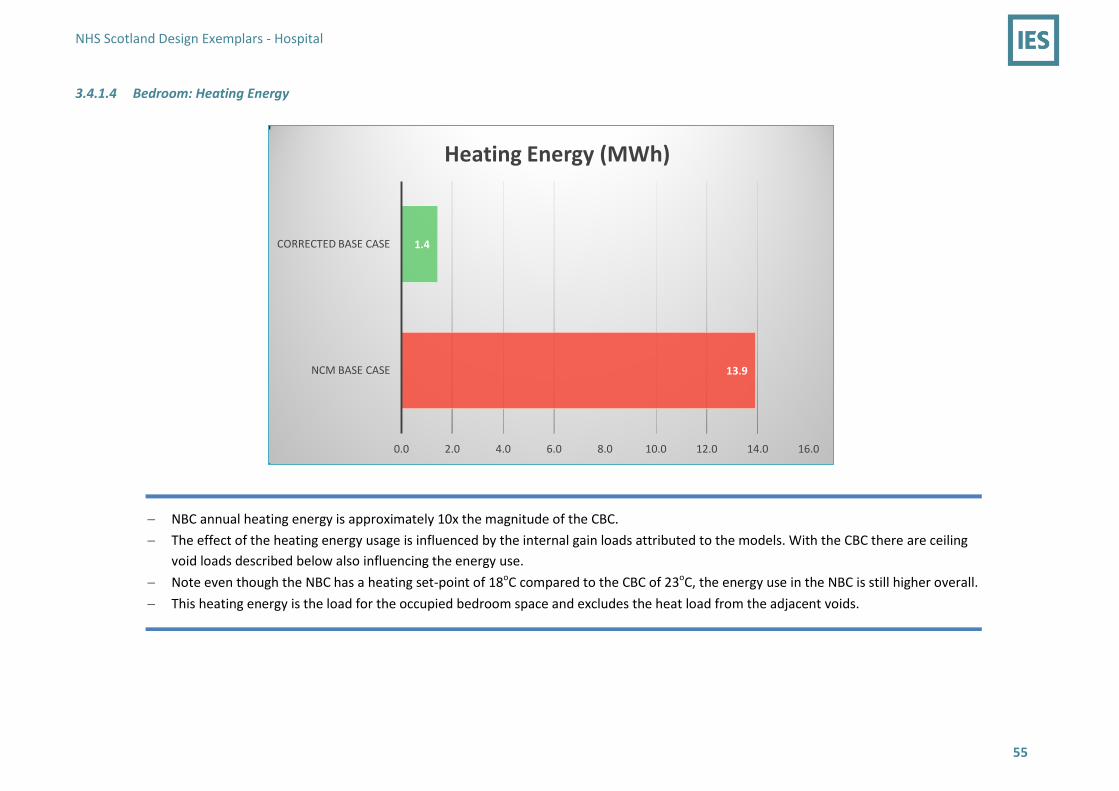
13.9
1.4
0.0 2.0 4.0 6.0 8.0 10.0 12.0 14.0 16.0
NCM BASE CASE
CORRECTED BASE CASE
Heating Energy (MWh)
NBC annual heating energy is approximately 10x the magnitude of the CBC.
The effect of the heating energy usage is influenced by the internal gain loads attributed to the models. With the CBC there are ceiling
void loads described below also influencing the energy use.
Note even though the NBC has a heating set-point of 18oC compared to the CBC of 23oC, the energy use in the NBC is still higher overall.
This heating energy is the load for the occupied bedroom space and excludes the heat load from the adjacent voids.

NHS Scotland Design Exemplars - Hospital
56
3.4.1.5 Bedroom - Ceiling Void: Equipment Gain
Time Period Corrected Base Case (kW)
The NBC model does not model ceiling voids so no gain is included.
The CBC specifies equipment gains in the ceiling voids which peak at ~0.1 kW.
There is a continuous background equipment load overnight and ramps up to a peak constant during daytime
hours.

NHS Scotland Design Exemplars - Hospital
57
3.4.1.6 Bedroom - Ceiling Void: Lighting Gain
Time Period Corrected Base Case (kW)
The NBC model does not model ceiling voids so no gain is included.
The CBC specifies lighting gains in the ceiling voids which detail a peak of ~0.04 kW.
Lighting gains run as per the bedroom usage with a seasonal drop in summer.
Lighting daily profile follows the same usage as the bedroom.

NHS Scotland Design Exemplars - Hospital
58
3.4.1.7 Bedroom NBC v CBC Summary View
NBC does not model a ceiling
void so no accumulation of gains
is present.
CBC accounts for heat gains in
the sealed ceiling void therefore
representing a build-up of heat.
NBC defines the health centre’s internal
gains and profiles from NCM activities.
CBC specifies the health centre’s
operations using data from past
experiences to define the space
activities and internal gains.
NBC maintains no change in
operation hours of the health centre.
CBC represents the true operations of
the health centre by specifying the
time based operating schedule per
activity.
NBC models minimum supply airflow from
assigned space activity plus an idealised
approach of introducing outside air to prevent
heat build-up.
CBC models a variable airflow rate based on
bulk airflow exchange through a window
strategy for opening area and opening control.
NBC = 18oC
CBC = 23oC and represents actual
design specifications.

NHS Scotland Design Exemplars - Hospital
59
3.4.1.8 Ward Circulation: Equipment Gain
Time Period NCM Base Case (kW)
Time Period Corrected Base Case (kW)
The NBC runs with a constant equipment gain of ~0.22 kW.
The CBC runs with a lower constant equipment gain of ~0.15 kW.
NHS Scotland Design Exemplars - Hospital
60
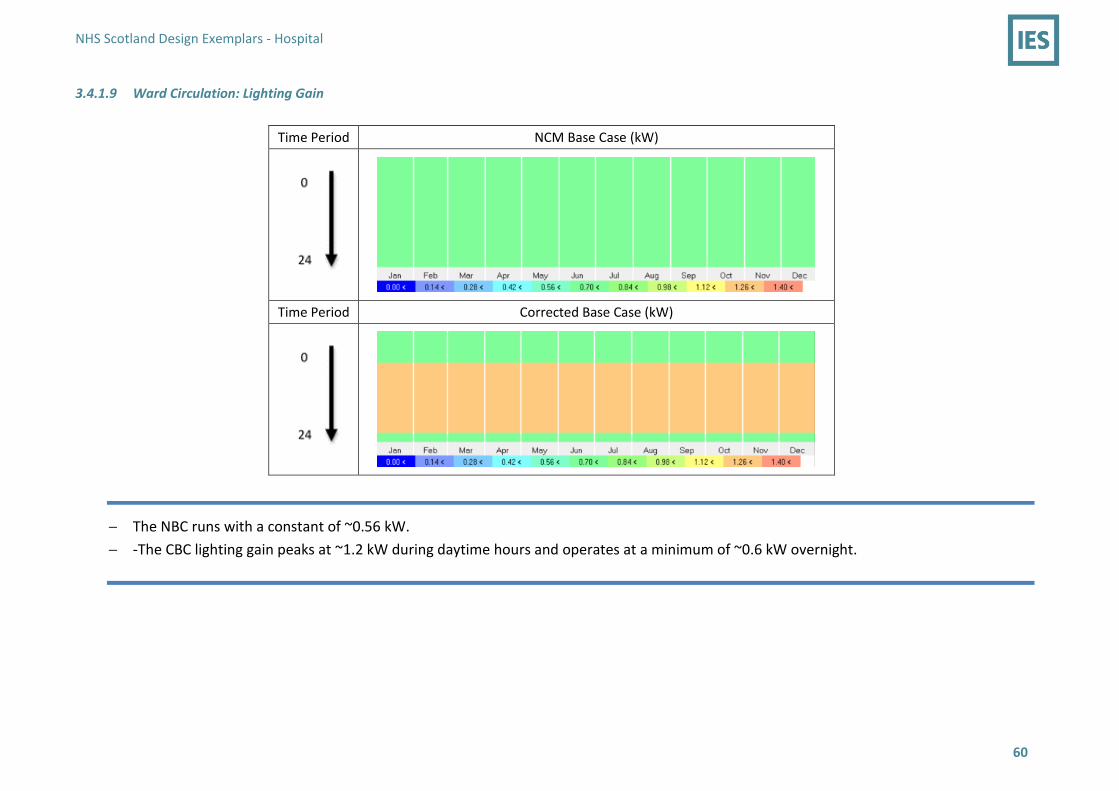
3.4.1.9 Ward Circulation: Lighting Gain
Time Period NCM Base Case (kW)
Time Period Corrected Base Case (kW)
The NBC runs with a constant of ~0.56 kW.
-The CBC lighting gain peaks at ~1.2 kW during daytime hours and operates at a minimum of ~0.6 kW overnight.

NHS Scotland Design Exemplars - Hospital
61
3.4.1.10 Ward Circulation: People Gain
Time Period NCM Base Case (kW)
Time Period Corrected Base Case (kW)
NBC profile specifies a large daytime peak in people gain at ~0.86 kW.
CBC peaks at ~0.45 kW for short periods with a lower backdrop throughout the day.
The NBC has A minimum of 0 whereas the CBC has a minimum of ~0.09 kW.

NHS Scotland Design Exemplars - Hospital
62
3.4.2 Potential Optimisation Scenarios
Optimisation scenarios were run across the following attributes identified as being key aspects of current performance where there is a need to investigate
toward enhancing thermal comfort and reviewing the subsequent impact on energy use.
Window configuration
Window opening control
Ceiling void gain and ventilation
Future weather files
Infiltration
Fabric
Façade glass transmittance and shading
Lighting
Trickle ventilation
Ceiling void configuration
The charts detail for an exemplar bedroom space for the permutations assessed with operative temperature statistics exceeding 26oC, 28oC and 30oC.
The red box highlights the assessed measure carried forth to a combined optimisation scenario.

NHS Scotland Design Exemplars - Hospital
63
3.4.2.1 Overheating
4962
237
6552
6973
7651
8591
6537
6952
7666
8598
7438
7011
6737
6022
1911
48
3396
4143
5254
7124
3390
4139
5224
7128
4886
4231
3770
2620
633
3
1227
1621
2249
3578
1175
1560
2189
3492
1988
1617
1369
877
0 1000 2000 3000 4000 5000 6000 7000 8000 9000 10000
Corrected Base Case
NCM Base Case
Window 1.12m2 Opening, 5.3% of Floor Area
Window 0.84m2 Opening, 4% of Floor Area
Window 0.56m2 Opening, 2.6% of Floor Area
Window 0.28m2 Opening, 1.3% of Floor Area
Window 1.12m2 Split opening, 10.6% of Floor Area
Window 0.83m2 Split opening , 7.9% of Floor Area
Window 0.56m2 Split opening, 5.2% of Floor Area
Window 0.28m2 Split opening, 2.6% of Floor Area
Window 0.14m2(Bottom) 0.56m2 (Top) Split opening, 3.3% of Floor Area
Window 0.28m2(Bottom) 0.56m2 (Top) Split opening , 4% of Floor Area
Window 0.42m2(Bottom) 0.56m2 (Top) Split opening, 4.6% of Floor Area
Window 0.28m2(Bottom) 1.4m2 (Top) Split opening, 7.9% of Floor Area
Window Configuration - South Facing Bedroom Overheating - Hours Above 26oC, 28oC, 30oC
> 30⁰C > 28⁰C > 26⁰C This option compares
window area
performance, either as a
single opening or split
openings which can
generate more flow.
The NBC does not
include void heat gains
which is a key reason
for the lower reported
hours.
No trickle is run as to
influence the window
airflow performance.
NHS Scotland Design Exemplars - Hospital
64
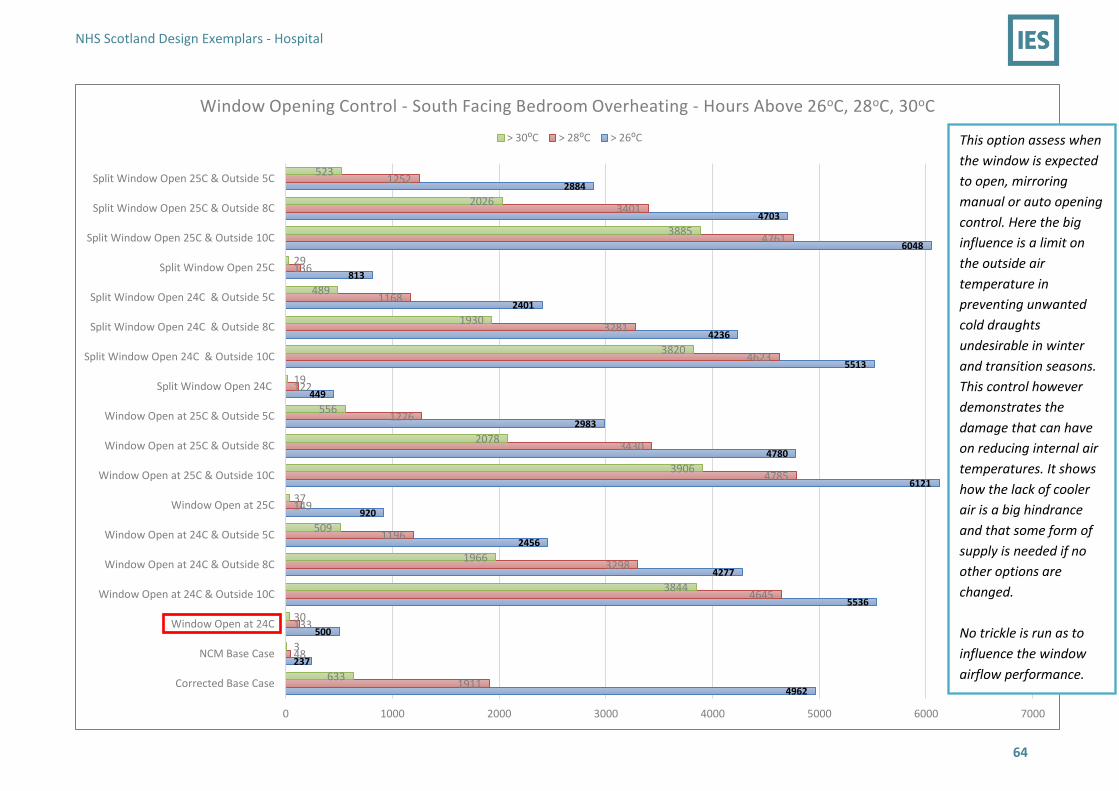
4962
237
500
5536
4277
2456
920
6121
4780
2983
449
5513
4236
2401
813
6048
4703
2884
1911
48
133
4645
3298
1196
149
4785
3430
1276
122
4623
3281
1168
136
4761
3401
1252
633
3
30
3844
1966
509
37
3906
2078
556
19
3820
1930
489
29
3885
2026
523
0 1000 2000 3000 4000 5000 6000 7000
Corrected Base Case
NCM Base Case
Window Open at 24C
Window Open at 24C & Outside 10C
Window Open at 24C & Outside 8C
Window Open at 24C & Outside 5C
Window Open at 25C
Window Open at 25C & Outside 10C
Window Open at 25C & Outside 8C
Window Open at 25C & Outside 5C
Split Window Open 24C
Split Window Open 24C & Outside 10C
Split Window Open 24C & Outside 8C
Split Window Open 24C & Outside 5C
Split Window Open 25C
Split Window Open 25C & Outside 10C
Split Window Open 25C & Outside 8C
Split Window Open 25C & Outside 5C
Window Opening Control - South Facing Bedroom Overheating - Hours Above 26oC, 28oC, 30oC
> 30⁰C > 28⁰C > 26⁰C This option assess when
the window is expected
to open, mirroring
manual or auto opening
control. Here the big
influence is a limit on
the outside air
temperature in
preventing unwanted
cold draughts
undesirable in winter
and transition seasons.
This control however
demonstrates the
damage that can have
on reducing internal air
temperatures. It shows
how the lack of cooler
air is a big hindrance
and that some form of
supply is needed if no
other options are
changed.
No trickle is run as to
influence the window
airflow performance.

NHS Scotland Design Exemplars - Hospital
65

NHS Scotland Design Exemplars - Hospital
66
4962
237
2685
2664
4428
4402
4368
4337
4244
4082
3771
3186
1911
48
849
838
1582
1570
1555
1528
1486
1392
1233
1021
633
3
307
304
536
533
531
523
502
467
426
355
0 1000 2000 3000 4000 5000 6000
Corrected Base Case
NCM Base Case
Ceiling Void No Gain No Vent
Ceiling Void No Gain 0.125ACH Vent
Ceiling Void Gain No Vent
Ceiling Void Gain 0.06 Vent
Ceiling Void Gain 0.125 Vent
Ceiling Void Gain 0.25 Vent
Ceiling Void Gain 0.5 Vent
Ceiling Void Gain 1ACH
Ceiling Void Gain 2ACH
Ceiling Void Gain 4ACH
Ceiling Void Ventilation - South Facing Bedroom Overheating - Hours Above 26oC, 28oC, 30oC
> 30⁰C > 28⁰C > 26⁰C
Ceiling void gains are acting as a
large internal conduction gain to
the occupied space because of the
heat build-up. The unventilated
ceiling void is worst but large
ventilation is still not enough
compared to no gain at all.
Prevention is better than cure in
this case if possible.

NHS Scotland Design Exemplars - Hospital
67
4962
237
459
744
4899
4583
4865
5226
923
5028
4530
4965
5323
913
5133
4641
5072
4811
925
4690
4453
4612
1911
48
94
245
1595
1647
1592
1937
336
1800
1521
1716
1819
406
1811
1753
1749
1709
430
1540
1744
1518
633
3
26
71
454
529
453
649
155
585
619
558
598
184
610
692
599
587
248
540
694
535
0 1000 2000 3000 4000 5000 6000
Corrected Base Case
NCM Base Case
Glasgow-TRY-2020
Glasgow-TRY-2050 (High)
Glasgow-TRY-2050 (Medium)
Glasgow-TRY-2080 (High)
Glasgow-TRY-2080 (Low)
Glasgow-DSY1-2020
Glasgow-DSY1-2050 (High)
Glasgow-DSY1-2050 (Medium)
Glasgow-DSY1-2080 (High)
Glasgow-DSY2-2080 (lLow)
Glasgow-DSY2-2020
Glasgow-DSY2-2050 (High)
Glasgow-DSY2-2050 (Medium)
Glasgow-DSY2-2080 (High)
Glasgow-DSY2-2080 (Low)
Glasgow-DSY3-2020
Glasgow-DSY3-2050 (High)
Glasgow-DSY3-2050 (Medium)
Glasgow-DSY3-2080 (High)
Glasgow-DSY3-2080 (Low)
Future Weather Files - South Facing Bedroom Overheating - Hours Above 26oC, 28oC, 30oC
> 30⁰C > 28⁰C > 26⁰C Future weather files
generally indicate warmer
conditions are
anticipated. However it is
important to note the
type of file to be expected
in these sims. DSY’s should
be run for overheating
and TRY for energy
performance. Using the
wrong file could mask
conditions.
The next point is what era
a building is expected to
exist in, performance on
opening is great but what
is the considered life of
the building? It should be
tested against the future
period to ensure resilience
against those expected
conditions to avoid a
growing risk of
overheating still
occurring.

NHS Scotland Design Exemplars - Hospital
68
4966
237
1219
1606
3465
4966
1987
48
360
474
1094
1987
678
3
118
165
375
678
0 1000 2000 3000 4000 5000 6000
Corrected Base Case
NCM Base Case
Infiltration 0.60ACH
Infiltration 0.50ACH
Infiltration 0.25ACH
Infiltration 0.125ACH
Infiltration - South Facing Bedroom Overheating - Hours Above 26oC, 28oC, 30oC
> 30⁰C > 28⁰C > 26⁰C
Growing air tightness is bad news
for overheating as it is reducing
ventilation heat loss. It is a positive
for heating energy consumption
but to maintain thermal comfort
then other means must be
available to bring in the cool air
required. Measures can be
assessed clearly to limit what this
airflow would need to be.

NHS Scotland Design Exemplars - Hospital
69
4962
237
5404
5711
5926
6082
6183
1911
48
2286
2775
3304
3815
4253
633
3
787
1011
1283
1640
2084
0 1000 2000 3000 4000 5000 6000 7000
Corrected Base Case
NCM Base Case
Fabric U-Value -10%
Fabric U-Value -20%
Fabric U-Value -30%
Fabric U-Value -40%
Fabric U-Value -50%
Fabric Performance - South Facing Bedroom Overheating - Hours Above 26oC, 28oC, 30oC
> 30⁰C > 28⁰C > 26⁰C
Constructions are an easy target for
building regulations improvement but also
seal heat in which is a threat to
overheating risk. The balance of energy
and overheating from fabric performance
is not so clear cut any longer.

NHS Scotland Design Exemplars - Hospital
70
4962
237
3523
3651
3758
3884
3991
4362
3966
4109
4265
4423
4555
4962
4735
4971
5152
5318
5417
5745
1911
48
777
872
967
1060
1143
1418
1156
1285
1385
1472
1585
1911
1683
1805
1933
2043
2156
2692
633
3
19
22
42
80
138
339
107
161
247
320
406
633
447
549
668
764
848
1166
0 1000 2000 3000 4000 5000 6000 7000
Corrected Base Case
NCM Base Case
G-Value 0.37 Ext. Shade 0.2
G-Value 0.37 Ext. Shade 0.3
G-Value 0.37 Ext. Shade 0.4
G-Value 0.37 Ext. Shade 0.5
G-Value 0.37 Ext. Shade 0.6
G-Value 0.37 No Ext. Shade
G-Value 0.50 Ext. Shade 0.2
G-Value 0.50 Ext. Shade 0.3
G-Value 0.50 Ext. Shade 0.4
G-Value 0.50 Ext. Shade 0.5
G-Value 0.50 Ext. Shade 0.6
G-Value 0.50 No Ext. Shade
G-Value 0.70 Ext. Shade 0.2
G-Value 0.70 Ext. Shade 0.3
G-Value 0.70 Ext. Shade 0.4
G-Value 0.70 Ext. Shade 0.5
G-Value 0.70 Ext. Shade 0.6
G-Value 0.70 No Ext. Shade
Facade Performance - South Facing Bedroom Overheating - Hours Above 26oC, 28oC, 30oC
> 30⁰C > 28⁰C > 26⁰C
Managing solar gains is a crucial factor
in appreciating the energy balance a
building must experience. Is a space
influenced by solar or internal gain? This
must be answered and then an accurate
investigation of glass and external
shading performance can be
undertaken. Is it better to have shades
and block gains in summer but capture
in winter compared to just adding a
glass type which will reduce by the same
factor all year? This is an approach that
can certainly be analysed.
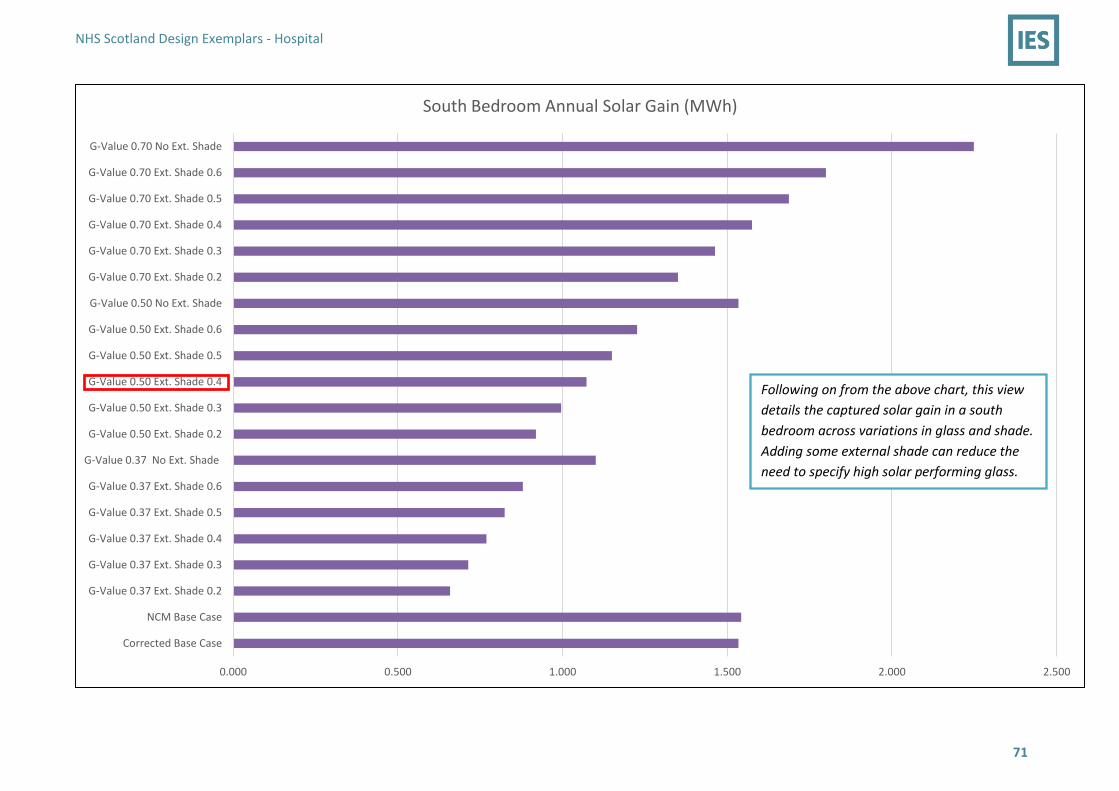
NHS Scotland Design Exemplars - Hospital
71
0.000 0.500 1.000 1.500 2.000 2.500
Corrected Base Case
NCM Base Case
G-Value 0.37 Ext. Shade 0.2
G-Value 0.37 Ext. Shade 0.3
G-Value 0.37 Ext. Shade 0.4
G-Value 0.37 Ext. Shade 0.5
G-Value 0.37 Ext. Shade 0.6
G-Value 0.37 No Ext. Shade
G-Value 0.50 Ext. Shade 0.2
G-Value 0.50 Ext. Shade 0.3
G-Value 0.50 Ext. Shade 0.4
G-Value 0.50 Ext. Shade 0.5
G-Value 0.50 Ext. Shade 0.6
G-Value 0.50 No Ext. Shade
G-Value 0.70 Ext. Shade 0.2
G-Value 0.70 Ext. Shade 0.3
G-Value 0.70 Ext. Shade 0.4
G-Value 0.70 Ext. Shade 0.5
G-Value 0.70 Ext. Shade 0.6
G-Value 0.70 No Ext. Shade
South Bedroom Annual Solar Gain (MWh)
Following on from the above chart, this view
details the captured solar gain in a south
bedroom across variations in glass and shade.
Adding some external shade can reduce the
need to specify high solar performing glass.

NHS Scotland Design Exemplars - Hospital
72
4962
237
4615
4217
3798
3350
2901
1911
48
1629
1371
1158
993
851
633
3
556
461
403
357
311
0 1000 2000 3000 4000 5000 6000
Corrected Base Case
NCM Base Case
Lighting -10%
Lighting -20%
Lighting -30%
Lighting -40%
Lighting -50%
Internal Lighting Gain - South Facing Bedroom Overheating - Hours Above 26oC, 28oC, 30oC
> 30⁰C > 28⁰C > 26⁰C
Lighting gain is seeing a revolution
through the introduction of LED’s
and daylight diming technologies.
Clearly being able to maintain the
same illuminance at a lower energy
is a win-win when adding in the
potential to reduce the risk of
overheating.

NHS Scotland Design Exemplars - Hospital
73
4962
237
8760
8760
8752
8569
8135
7680
1911
48
8760
8751
8422
7466
6497
5632
633
3
8387
8115
6449
4613
3497
2764
0 1000 2000 3000 4000 5000 6000 7000 8000 9000 10000
Corrected Base Case
NCM Base Case
Trickle Vent 0.00336m2
Trickle Vent 0.056m2
Trickle Vent 0.112m2
Trickle Vent 0.168m2
Trickle Vent 0.224m2
Trickle Vent 0.28m2
Trickle Ventilation - South Facing Bedroom Overheating - Hours Above 26oC, 28oC, 30oC
> 30⁰C > 28⁰C > 26⁰C
This case assumes only trickle is active, so windows closed in the 6 options. The test is how much trickle can influence as a
background source option as it is controllable compared to infiltration. Trickle supply should be considered but as more
than just a common flip vent above a window, instead seen as a dedicated aspect of a complete ventilation solution.
There is the option to scale up to a separate vent opening(s) instead which are indeed separate to window units.

NHS Scotland Design Exemplars - Hospital
74
4962
237
4726
1563
1429
1911
48
1881
490
466
633
3
684
171
157
0 1000 2000 3000 4000 5000 6000
Corrected Base Case
NCM Base Case
Bedroom Height +3.5m
Ceiling Void Insulation 25mm
Ceiling Void Insulation 50mm
Void Configuration - South Facing Bedroom Overheating - Hours Above 26oC, 28oC, 30oC
> 30⁰C > 28⁰C > 26⁰C
These cases looked at other void related measures at
managing the risk. The possibility of adding insulation
to contain ceiling void gain but this approach does not
away from the fact it is still an attempt to cure and not
prevent the gain occurring.
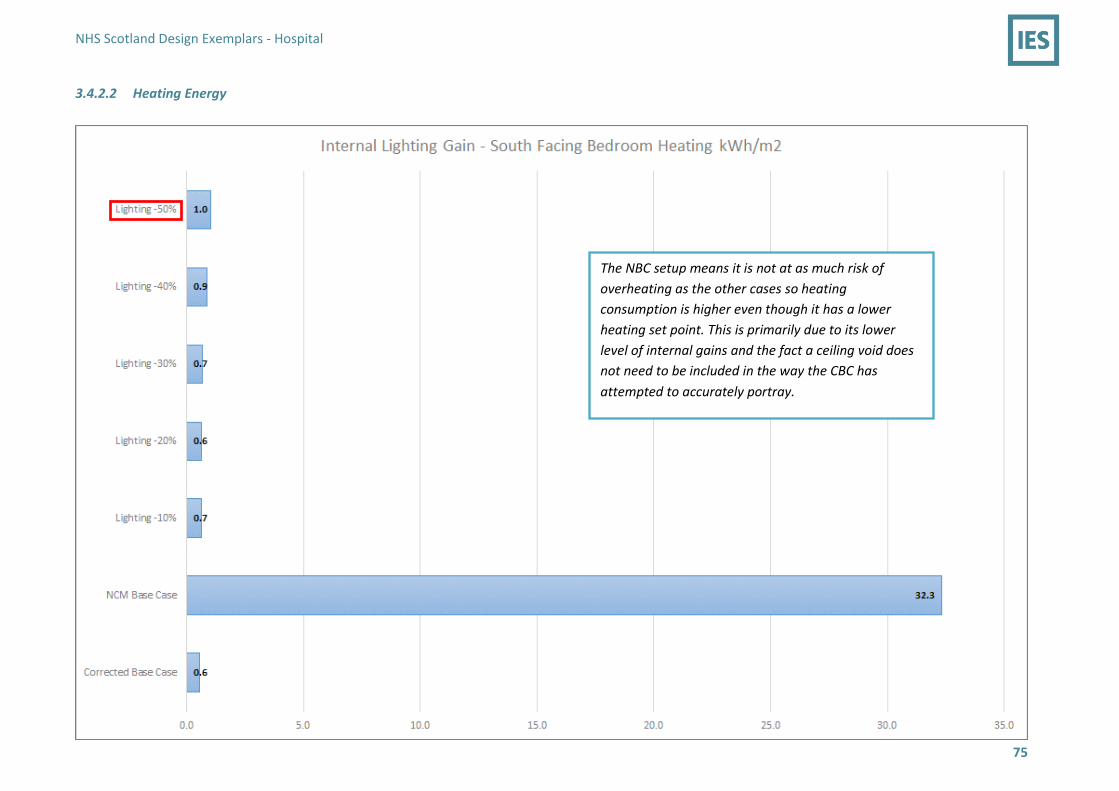
NHS Scotland Design Exemplars - Hospital
75
3.4.2.2 Heating Energy
The NBC setup means it is not at as much risk of
overheating as the other cases so heating
consumption is higher even though it has a lower
heating set point. This is primarily due to its lower
level of internal gains and the fact a ceiling void does
not need to be included in the way the CBC has
attempted to accurately portray.

NHS Scotland Design Exemplars - Hospital
76
Clearly more ventilation heat loss
from infiltration means a heat
balance needs made up.
With lower rates as requested by
the building regulations then yes
heating is proven to be less.
Infiltration loss is felt as a seasonal
issue but not as much of a factor to
gain on as previous.

NHS Scotland Design Exemplars - Hospital
77
A slight change here where increased U-values make
little difference as previous and instead are warming
the space so much that ventilation is required that can
enter the space in winter periods as cold draughts and
require the space to ideally be needing to be heated
back up.

NHS Scotland Design Exemplars - Hospital
78
The NBC dwarfs the options reviewed for the glass and shade analysis.

NHS Scotland Design Exemplars - Hospital
79
3.5 Optimised Approach Utilising the modelling sensitivity scenarios tested against the CBC, a total of five optimised scenarios were modelled. The solutions forming these were selected
based on their performance during the sensitivity tests and determined to be ideal candidates toward forming an optimised design.
Case-01 combines a series of optimisation solutions with Cases-02 to 04 introducing further enhancement on each step.
Case-05 then tests the complete optimised model against a future weather scenario to assess the potential for a regression back toward overheating.
Optimised Scenario
Window 1.12m2 Split Opening, Opening 10.6% of Floor Area,
Window Open at 24oC, Ceiling Void Air Exchange 4ACH,
Infiltration 0.125ACH, Fabric -30%,
Lighting -50%
Trickle vent opening Area of 0.112m2
Ceiling Void insulation 25mm
External window g-value of 0.50,
external shade 0.40
Use of the future weather file Glasgow-
DSY2-2050 (High)
Case-01
Case-02
Case-03
Case-04
Case-05

NHS Scotland Design Exemplars - Hospital
80
3.5.1.1 Bedroom Overheating
Following the optimisation case runs the modelling has demonstrated a substantial reduction and management
of the overheating potential in the space to similar levels reported by the NBC.
At the same time the energy is managed to be similar to the CBC, described in the following sections.
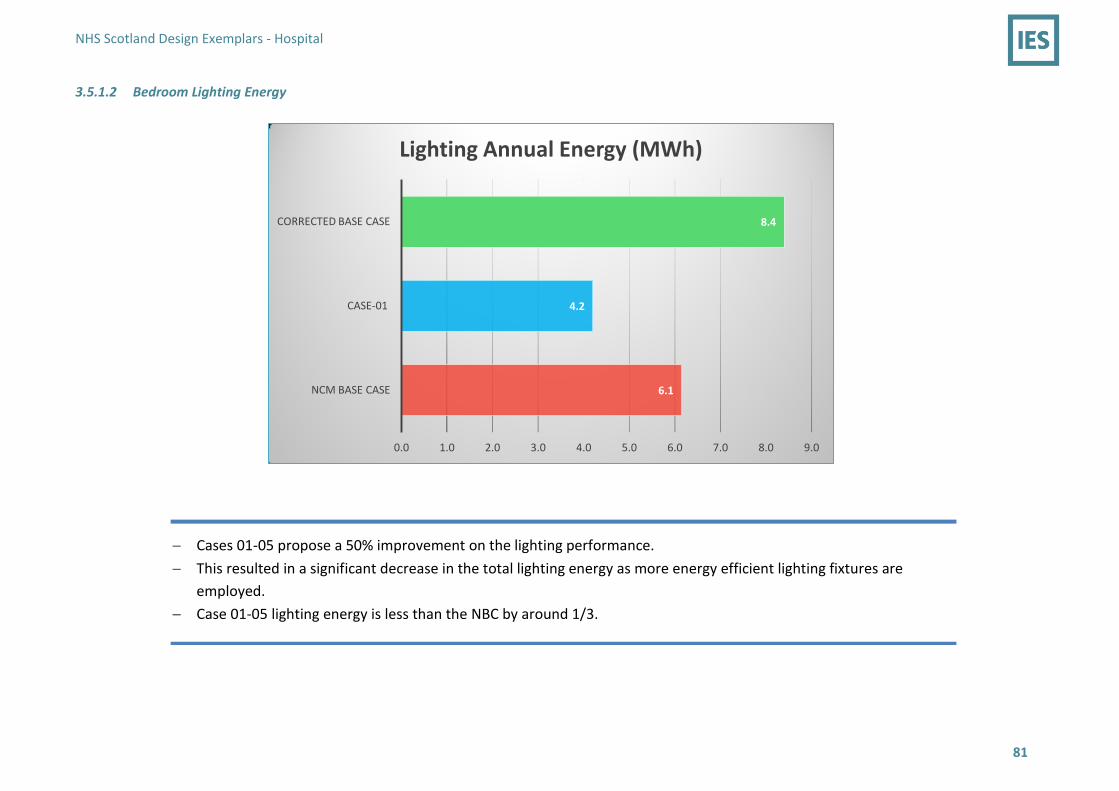
NHS Scotland Design Exemplars - Hospital
81
3.5.1.2 Bedroom Lighting Energy
6.1
4.2
8.4
0.0 1.0 2.0 3.0 4.0 5.0 6.0 7.0 8.0 9.0
NCM BASE CASE
CASE-01
CORRECTED BASE CASE
Lighting Annual Energy (MWh)
Cases 01-05 propose a 50% improvement on the lighting performance.
This resulted in a significant decrease in the total lighting energy as more energy efficient lighting fixtures are
employed.
Case 01-05 lighting energy is less than the NBC by around 1/3.

NHS Scotland Design Exemplars - Hospital
82
3.5.1.3 Bedroom Heating Energy
Case 01:
13.9
2.2
1.4
0.0 2.0 4.0 6.0 8.0 10.0 12.0 14.0 16.0
NCM BASE CASE
CASE-01
CORRECTED BASE CASE
Heating Annual Energy (MWh)
Case 01 proposes the installation of windows with split openings of an area of 0.64m2, 10.6% of the floor area and to open at 24C. The
Ceiling void is to gain 4ACH, the infiltration rate the bedrooms is to be 0.125ACH whilst also improving the building fabric U-value by
30%.
With the benefit of enhanced thermal comfort which reduces overheating then additional heating is required compared to the CBC to
supplement.
The heating energy is still substantially less than the predicted energy from an NBC scenario.

NHS Scotland Design Exemplars - Hospital
83
Case 02:
13.9
3.1
1.4
0.0 2.0 4.0 6.0 8.0 10.0 12.0 14.0 16.0
NCM BASE CASE
CASE-02
CORRECTED BASE CASE
Heating Annual Energy (MWh)
In addition to the installations proposed in Case 01, Case 02 proposed the application of trickle vents of an area of 0.112m2.
Trickle vents introduces cool air in the form of natural ventilation and minimising the risk of spaces overheating which has been evidenced.
The drawback is a small heating energy increase across the year which is still substantially less than the NBC.
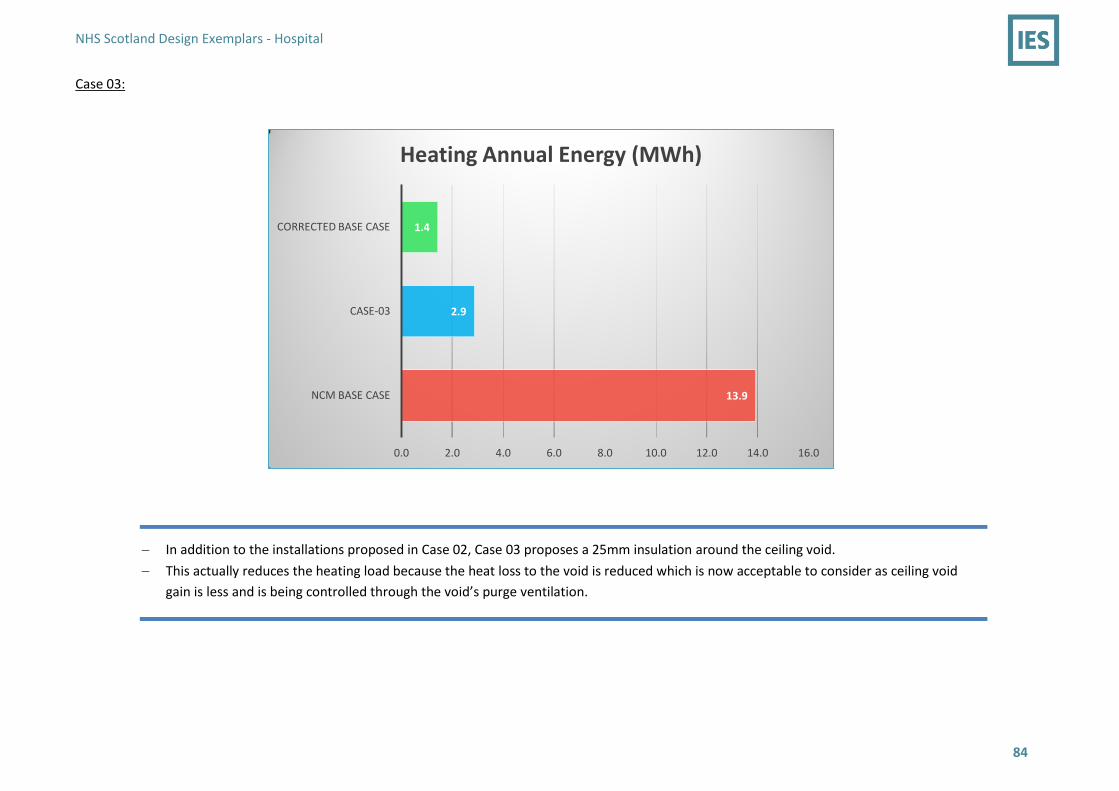
NHS Scotland Design Exemplars - Hospital
84
Case 03:
13.9
2.9
1.4
0.0 2.0 4.0 6.0 8.0 10.0 12.0 14.0 16.0
NCM BASE CASE
CASE-03
CORRECTED BASE CASE
Heating Annual Energy (MWh)
In addition to the installations proposed in Case 02, Case 03 proposes a 25mm insulation around the ceiling void.
This actually reduces the heating load because the heat loss to the void is reduced which is now acceptable to consider as ceiling void
gain is less and is being controlled through the void’s purge ventilation.

NHS Scotland Design Exemplars - Hospital
85
Case 04:
13.9
2.9
1.4
0.0 2.0 4.0 6.0 8.0 10.0 12.0 14.0 16.0
NCM BASE CASE
CASE-04
CORRECTED BASE CASE
Heating Annual Energy (MWh)
In addition to installations proposed in Case 03, Case 04 proposes the installation of external windows of a g-value of 0.5 and external
shading factor of 0.4
This case proposes to limit solar gain during the summer period and therefore improves overheating performance.
The drop in solar gain during the winter period is not significant for a change in the heating annual energy performance.
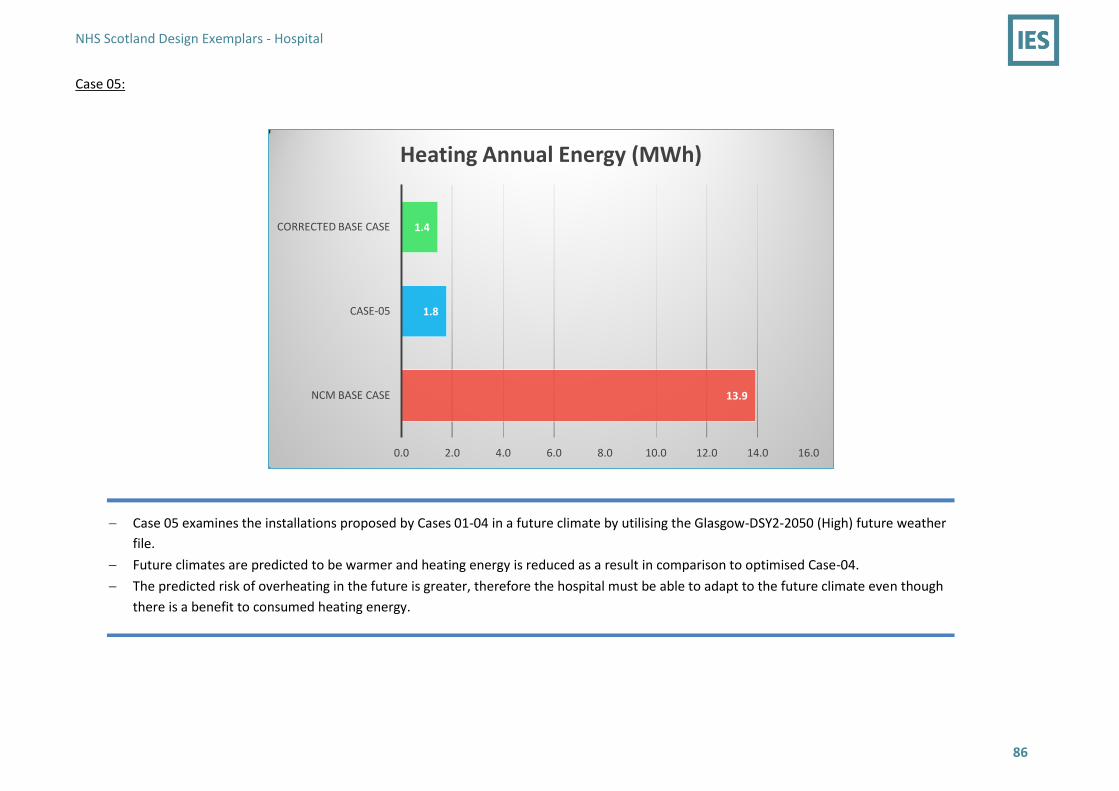
NHS Scotland Design Exemplars - Hospital
86
Case 05:
13.9
1.8
1.4
0.0 2.0 4.0 6.0 8.0 10.0 12.0 14.0 16.0
NCM BASE CASE
CASE-05
CORRECTED BASE CASE
Heating Annual Energy (MWh)
Case 05 examines the installations proposed by Cases 01-04 in a future climate by utilising the Glasgow-DSY2-2050 (High) future weather
file.
Future climates are predicted to be warmer and heating energy is reduced as a result in comparison to optimised Case-04.
The predicted risk of overheating in the future is greater, therefore the hospital must be able to adapt to the future climate even though
there is a benefit to consumed heating energy.

NHS Scotland Design Exemplars - Hospital
87
The graph below shows the impact of the optimised cases on heating side by side. There is however very little difference between the cases when
compared to the NBC.
13.9
1.4
2.2
3.1
2.9
2.9
1.8
0.0 2.0 4.0 6.0 8.0 10.0 12.0 14.0 16.0
NCM BASE CASE
CORRECTED BASE CASE
CASE-01
CASE-02
CASE-03
CASE-04
CASE-05
Heating Annual Energy (MWh)

NHS Scotland Design Exemplars - Hospital
88
3.5.1.4 Bedroom Heating Loads
The peak heating load has been compared for the base building models and Case-04. Within this is a comparison of a static heating load calculated through the
CIBSE Loads approach against the dynamic simulation route. With the static approach a number of factors are not included which may improperly influence the
selection of plant equipment. For example internal gain heat loads are not included, profile variation is inherently not a factor due to the static nature of CIBSE
Loads and this also means variation in natural ventilation heat loss cannot be accounted for. Additionally the comparison of the dynamic peak load with and
without internal gains is noted.
Heating Load (kW)
Dynamic Simulation Dynamic Simulation [Zero Gains] CIBSE Loads
NBC 0.889 1.156 1.025
CBC 0 0.597 0.462
Optimised 04 0.109 0.678 0.402
0.889
0
0.109
1.156
0.597
0.678
1.025
0.462
0.402
0 0.2 0.4 0.6 0.8 1 1.2 1.4
NBC
CBC
Optimised 04
South Facing Bedroom Peak Heating Load (kW)
CIBSE Loads Dynamic Simulation [Zero Gains] Dynamic Simulation
The same external design condition predicament between static model and dynamic model exists where the external design condition assumption can be
different to the weather file used in the dynamic simulations.
The accumulation of load differences could lead to a significant difference in the plant size design requirement for the building.

NHS Scotland Design Exemplars - Hospital
89
3.5.1.5 Bedroom Case-04 v CBC Summary View
Optimised Case -04 Ceiling voids are
infused with 4ACH of air and 25mm of
insulation are installed on the void
surfaces whereas the CBC ceiling voids
lack ventilation and are uninsulated. Optimised Case-04 hospital’s external
building fabric is due to a 30%
improvement in performance in
comparison with the CBC model.
CBC does not include any form of window
shading although the façade performance is
improved in Optimised Case-04 by the
incorporation of window and external shading
of g-values of 0.50 and 0.40 respectively.
Increase in trickle ventilation opening
area is increased in Case-04 from
0.02152m2 as included within the CBC
to 0.112m2.
In Case 04, the Lighting
System is further improved
by 50% in comparison with
the CBC model.
In the CBC, windows are configured to
open when internal air temperature
reaches 24oC and when outside air
temperature is above 10oC
In Optimised Case-04 the window
opens when the internal air
temperature reaches 25oC.

NHS Scotland Design Exemplars - Hospital
90
3.6 Daylight Impact Daylight capture was assessed for the bedroom space against the 4 standard orientations to test the sensitivity of harnessing natural daylight. A Climate Based
Daylighting Modelling (CBDM) approach was employed, also known as dynamic daylighting, which models the annual illuminance performance and includes the
impact of seasonal solar position, solar intensity, cloud cover from the weather file and building form. Modellers can assess attributes such as shades,
surrounding topography, adjacent buildings, window layout including recesses and glass type are all factors that can be tested with this approach.
This is a more considered and accurate representation on the annual variation in daylight available and captured by building spaces, compared to say Daylight
Factor (DF). Modellers can utilise CBDM from concept stage onwards to test sunlight performance and compare potential façade designs and space layouts for
the captured illuminance. Using CBDM will provide modellers accurate feedback on how sunlight is not a constant for similar rooms on different orientations
indicating bespoke approaches would need to be considered to optimise a space for its energy and environmental performance.
Alongside we have compared to DF, which has been the industry standard daylight metric. DF is calculated for an overcast sky and does not include for direct
sunlight which is a significant limiting factor when testing true performance. The CBDM approach details the clear differences between each orientation
whereas DF shows little change.
CBDM should be strongly considered as the daylight modelling approach to measure daylight capture and this extends to its ability to filter the hours of
analysis. In the table below by filtering for the hours of occupancy usage this means the earlier and later hours of the day can be filtered which is when daylight
levels are at their lowest. This approach is now assessing when daylight is actually being used and analysis can define more accurate benchmarks when
assessing design scenarios. Designers can use CBDM to test their sunlight capture alongside their solar analysis performance which reports on the impact to the
external façade.
Glass Transmittance at 70% North South East West
DF average 3.64 % 3.46 % 3.64 % 3.47 %
Annual Average Illuminance for Daylight Autonomy (all sunlight hours)
274 lux 817 lux 655 lux 579 lux
Annual Average Illuminance for Daylight Autonomy (only occupied hours)
296 lux 978 lux 658 lux 616 lux
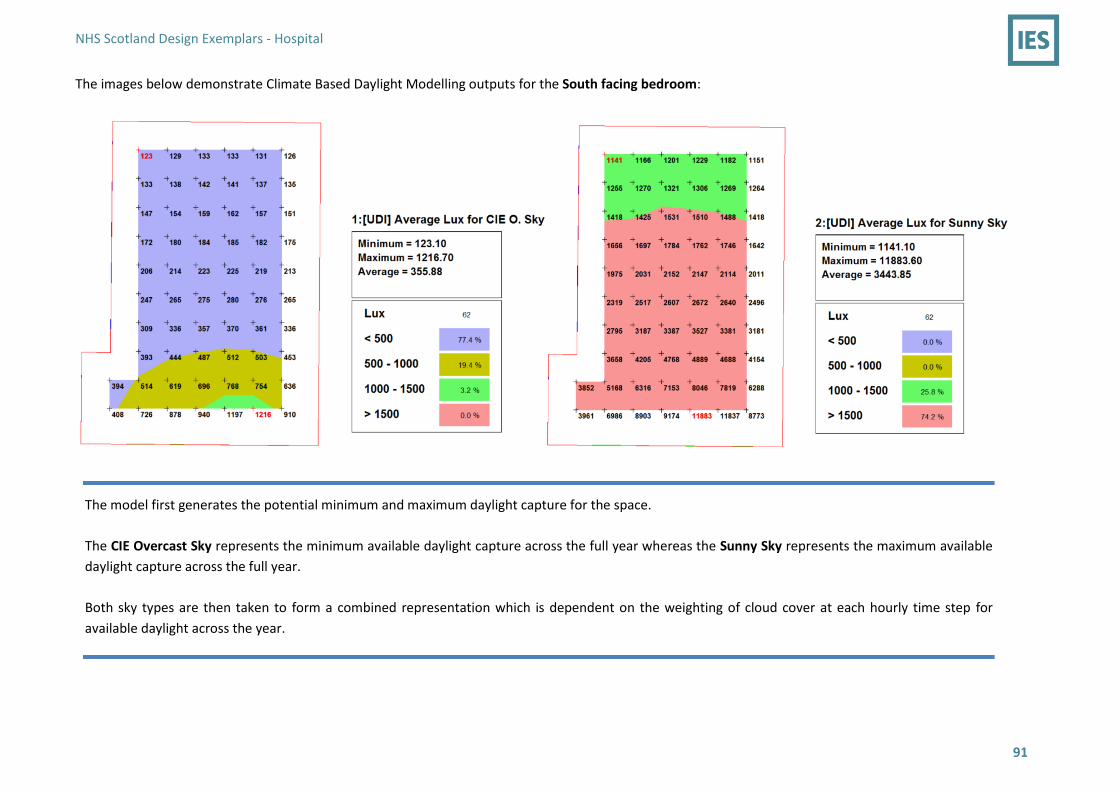
NHS Scotland Design Exemplars - Hospital
91
The images below demonstrate Climate Based Daylight Modelling outputs for the South facing bedroom:
The model first generates the potential minimum and maximum daylight capture for the space.
The CIE Overcast Sky represents the minimum available daylight capture across the full year whereas the Sunny Sky represents the maximum available
daylight capture across the full year.
Both sky types are then taken to form a combined representation which is dependent on the weighting of cloud cover at each hourly time step for
available daylight across the year.

NHS Scotland Design Exemplars - Hospital
92
The true annual illuminance performance is demonstrated by the Average Lux for Daylight Autonomy across the space at a working plane height. This
Daylight Autonomy view is the mix of the two sky types previously described. Good and poorly performing illuminated areas of the space are then easily
identifiable using the annual statistics, either in points or contours mode. The contours demonstrate illuminance bandings and can be configured to
match the design illuminance for the space activity.
Assessing Daylight Autonomy during ‘occupied hours only’ then filters the hours where poorer sunlight levels are available during morning and evening.
The space is then assessed for its usable sunlight capture, which typically demonstrates an enhanced average daylight performance compared to the DA
across the full sunlight period.

NHS Scotland Design Exemplars – Appendix A: Bedroom Heating Design Approach - CFD Analysis: Wall Radiator v Ceiling Radiant Panel
93
4 Appendix A: Bedroom Heating Design Approach - CFD Analysis: Wall Radiator v Ceiling Radiant Panel A CFD analysis was performed to compare the air temperature pattern in a typical ward single bedroom for a wall positioned radiator against a ceiling mounted
radiant panel. The simulations were performed on a typical winter day assuming a heating load of 340W, an internal air temperature of 23oC and an average
wall temperature of 22.5oC.
The following images show an airflow pattern comparison for installations of a wall positioned radiator and a ceiling mounted radiant panel.
Air Temperature:
Wall Radiator Ceiling Radiant Panel
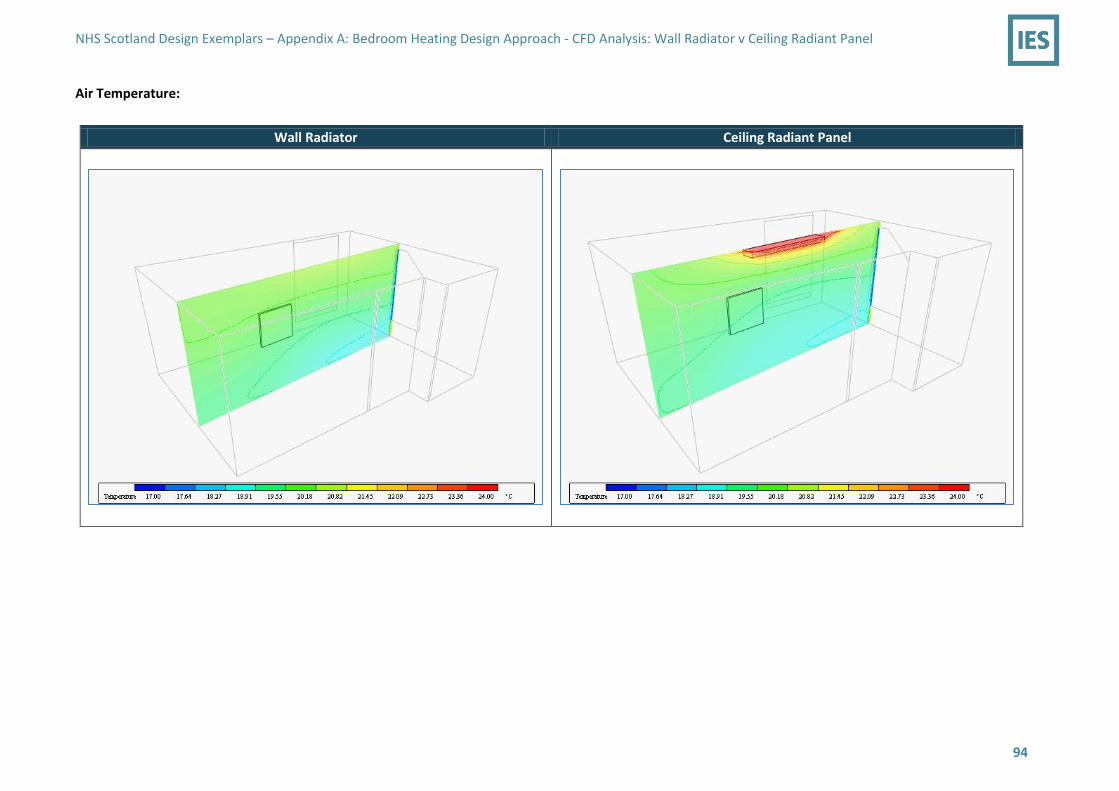
NHS Scotland Design Exemplars – Appendix A: Bedroom Heating Design Approach - CFD Analysis: Wall Radiator v Ceiling Radiant Panel
94
Air Temperature:
Wall Radiator Ceiling Radiant Panel

NHS Scotland Design Exemplars – Appendix A: Bedroom Heating Design Approach - CFD Analysis: Wall Radiator v Ceiling Radiant Panel
95
Operative Temperature:
Wall Radiator Ceiling Radiant Panel

NHS Scotland Design Exemplars – Appendix A: Bedroom Heating Design Approach - CFD Analysis: Wall Radiator v Ceiling Radiant Panel
96
Operative Temperature:
Wall Radiator Ceiling Radiant Panel
In the radiator case, the thermal plume rises and distributes warm air across the room by traversing across the ceiling. The central volume of the room was
observed to be between 18-20°C whereas near the walls was warmer at 22°C.
With the radiant panel, the entire room showed a defined vertical thermal gradient. With radiant panel the air is warmed near the ceiling and stays there due to
natural buoyancy effects. Strong air movement was observed in the radiator case but not in the radiant panel case, instead heat transfer occurred by diffusion
from the higher level rather than air movement.
Overall, the radiator cases performs better at mixing air across the room.

NHS Scotland Design Exemplars – Appendix B: Room Data Sheets – Health Centre
97
5 Appendix B: Room Data Sheets – Health Centre
Room Data Sheet RDS01
Project Typical Health Centre
Room Type Consulting Exam Room
Area
Space Data Area 16 m2 Height 2.4 m
Occupation Time Number of Occupants
0000 - 0900 0
0900 – 1200 1 inactive, 0.5 active
1200 - 1300 0
1300 – 1700 1 inactive, 0.5 active
1700 - 2400 0
Note: Some rooms may be occupied by 1 occupant between 07:00 and 09:00 and between 17:00 and 20:00
Temperature Heating Season 21 °C
Non-heating season Maximum of 50 hours above 28°C
Ventilation Type Natural
Infiltration Rate 5 m3/h/m
2
Maximum required 1.9 ACH*
Trickle Vent 19,588 mm2
Normally required 1.4 ACH*
Pressurisation -
Lighting Summer/Spring/Autumn
0000 - 0900 0 W
0900 – 1230 53 W
1230 - 1300 0 W
1300 - 1700 53 W
1700 - 2400 0 W
Winter
0000 - 0900 0 W
0900 – 1230 106 W
1230 - 1300 0 W
1300 - 1700 106 W
1700 - 2400 0 W
Equipment & Other 0000 - 0700 34 W
0900 – 1700 102 W
1800 - 2400 34 W
*Based on 10l/s/p for 2 people.
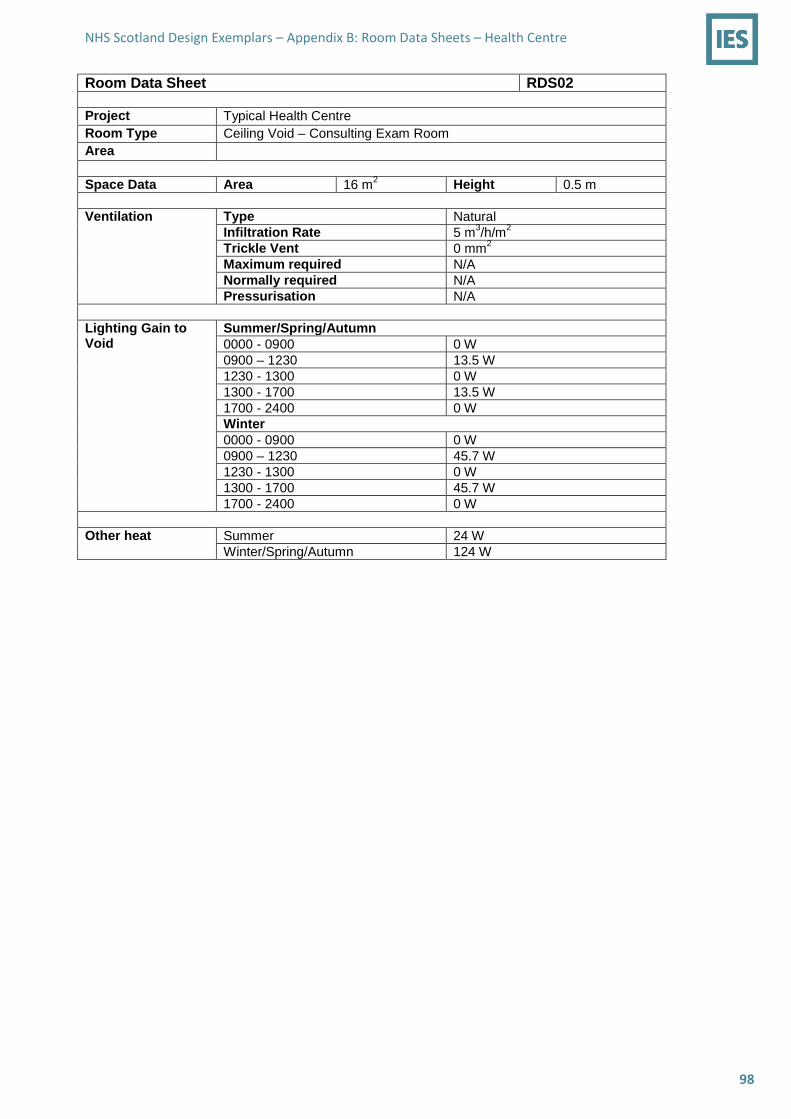
NHS Scotland Design Exemplars – Appendix B: Room Data Sheets – Health Centre
98
Room Data Sheet RDS02
Project Typical Health Centre
Room Type Ceiling Void – Consulting Exam Room
Area
Space Data Area 16 m2 Height 0.5 m
Ventilation Type Natural
Infiltration Rate 5 m3/h/m
2
Trickle Vent 0 mm2
Maximum required N/A
Normally required N/A
Pressurisation N/A
Lighting Gain to Void
Summer/Spring/Autumn
0000 - 0900 0 W
0900 – 1230 13.5 W
1230 - 1300 0 W
1300 - 1700 13.5 W
1700 - 2400 0 W
Winter
0000 - 0900 0 W
0900 – 1230 45.7 W
1230 - 1300 0 W
1300 - 1700 45.7 W
1700 - 2400 0 W
Other heat Summer 24 W
Winter/Spring/Autumn 124 W

NHS Scotland Design Exemplars – Appendix B: Room Data Sheets – Health Centre
99
Room Data Sheet RDS03
Project Typical Health Centre
Room Type Corridor
Area
Space Data Area Height 2.4 m
Ventilation Type Natural
Infiltration Rate 0 m3/h/m
2
Trickle Vent 0 mm2
Maximum required N/A
Normally required N/A
Pressurisation N/A
Lighting 0000 - 0800 0 W
0800 – 2000 3.7 W/m2
2000- 2400 0 W

NHS Scotland Design Exemplars – Appendix B: Room Data Sheets – Health Centre
100
Room Data Sheet RDS04
Project Typical Health Centre
Room Type Ceiling Void – Corridor
Area
Space Data Area Height 0.5 m
Ventilation Type Natural
Infiltration Rate 0 m3/h/m
2
Trickle Vent 0 mm2
Maximum required N/A
Normally required N/A
Pressurisation N/A
Lighting 0000 - 0800 0 W
0800 – 2000 1.6 W/m2
2000- 2400 0 W
Other heat Summer
0000 - 2400 197 W
Winter/Spring/Autumn
0000 - 0800 197 W
0800 – 2000 469 W
2000- 2400 197 W

NHS Scotland Design Exemplars – Appendix C: Room Data Sheets – Hospital
101
6 Appendix C: Room Data Sheets – Hospital
Room Data Sheet RDS01
Project Typical Hospital Ward Block
Room Type Bedroom - Single
Area First Floor, Inpatient Ward 3
Space Data Area 19 m2 Height 2.7 m
Occupation Time Number of Occupants
0000 - 0800 1 inactive
0800 – 1000 2 inactive
1000 - 1200 1 inactive
1200 - 1500 2 inactive
1500 - 1800 1 inactive
1800 - 1900 2 inactive
1900 - 2400 1 inactive
Temperature Heating Season 22 – 24 °C
Non-heating season Maximum of 50 hours above 28°C
Ventilation Type Natural
Infiltration Rate 5 m3/h/m
2
Trickle Vent 21,520 mm2
Maximum required 3.5 ACH
Normally required 1.4 ACH
Pressurisation 0 or negative
Lighting Summer
0000 - 0900 1.5 W
0900 - 2000 73.5 W
2000 - 2200 99 W
2200 - 2400 56 W
Winter
0000 - 0700 1.5 W
0700 - 1600 73.5 W
1600 - 2200 99 W
2200 - 2400 56 W
Spring/Autumn
0000 - 0800 1.5 W
0800 - 1800 73.5 W
1800 - 2200 99 W
2200 - 2400 56 W
Equipment & Other Time Heat Gain
0000 - 0700 90 W
0700 – 2300 140 W
2300 - 2400 90W

NHS Scotland Design Exemplars – Appendix C: Room Data Sheets – Hospital
102
Room Data Sheet RDS02
Project Typical Hospital Ward Block
Room Type Ceiling Void – Bedroom - Single
Area First Floor, Inpatient Ward 3
Space Data Area 19 m2 Height 0.5 m
Ventilation Type Natural
Infiltration Rate 5 m3/h/m
2
Trickle Vent 0 mm2
Maximum required N/A
Normally required N/A
Pressurisation N/A
Lighting loss to void
Summer
0000 - 0900 0.7 W
0900 - 2000 31 W
2000 - 2200 43 W
2200 - 2400 24 W
Winter
0000 - 0700 0.7 W
0700 - 1600 31 W
1600 - 2200 43 W
2200 - 2400 24 W
Spring/Autumn
0000 - 0800 0.7 W
0800 - 1800 31 W
1800 - 2200 43 W
2200 - 2400 24 W
Other heat Summer 0 W
Winter/Spring/Autumn 104 W
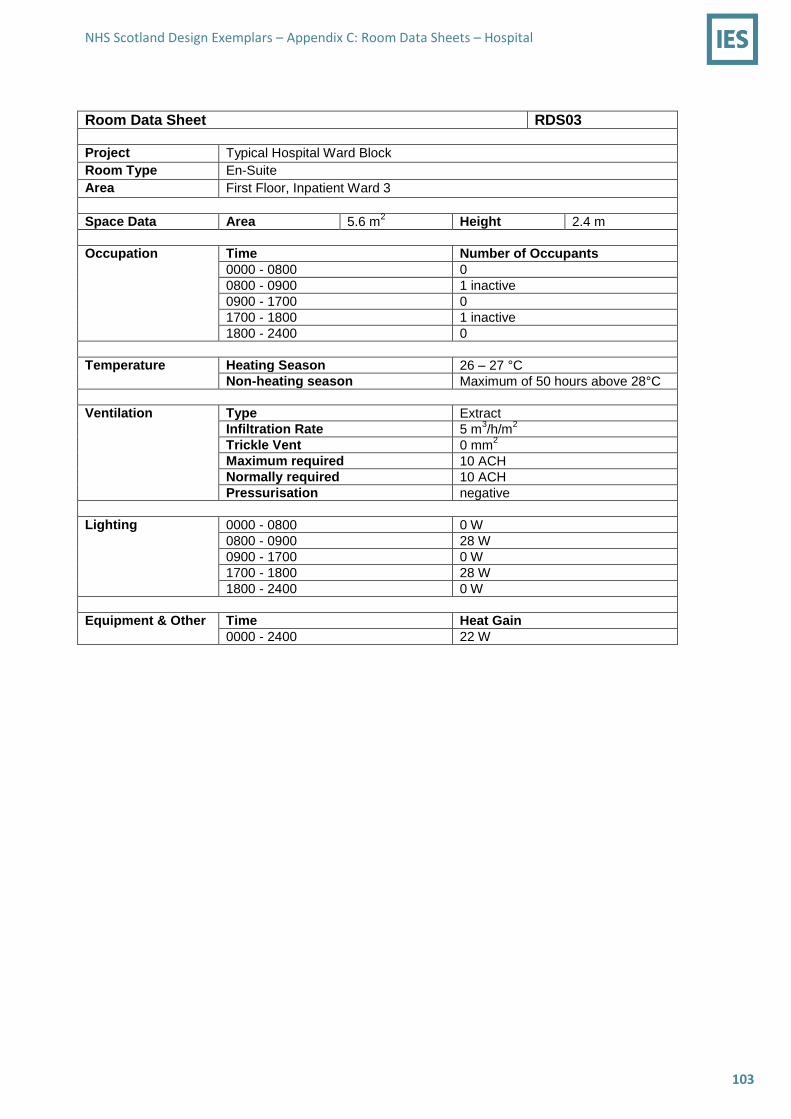
NHS Scotland Design Exemplars – Appendix C: Room Data Sheets – Hospital
103
Room Data Sheet RDS03
Project Typical Hospital Ward Block
Room Type En-Suite
Area First Floor, Inpatient Ward 3
Space Data Area 5.6 m2 Height 2.4 m
Occupation Time Number of Occupants
0000 - 0800 0
0800 - 0900 1 inactive
0900 - 1700 0
1700 - 1800 1 inactive
1800 - 2400 0
Temperature Heating Season 26 – 27 °C
Non-heating season Maximum of 50 hours above 28°C
Ventilation Type Extract
Infiltration Rate 5 m3/h/m
2
Trickle Vent 0 mm2
Maximum required 10 ACH
Normally required 10 ACH
Pressurisation negative
Lighting 0000 - 0800 0 W
0800 - 0900 28 W
0900 - 1700 0 W
1700 - 1800 28 W
1800 - 2400 0 W
Equipment & Other Time Heat Gain
0000 - 2400 22 W

NHS Scotland Design Exemplars – Appendix C: Room Data Sheets – Hospital
104
Room Data Sheet RDS04
Project Typical Hospital Ward Block
Room Type Ceiling Void – En-Suite
Area First Floor, Inpatient Ward 3
Space Data Area 5.6 m2 Height 0.8 m
Ventilation Type Natural
Infiltration Rate 5 m3/h/m
2
Trickle Vent 0 mm2
Maximum required N/A
Normally required N/A
Pressurisation N/A
Lighting loss to void
0000 - 0800 0 W
0800 - 0900 12.1 W
0900 - 0000 0 W
Other heat 22 W
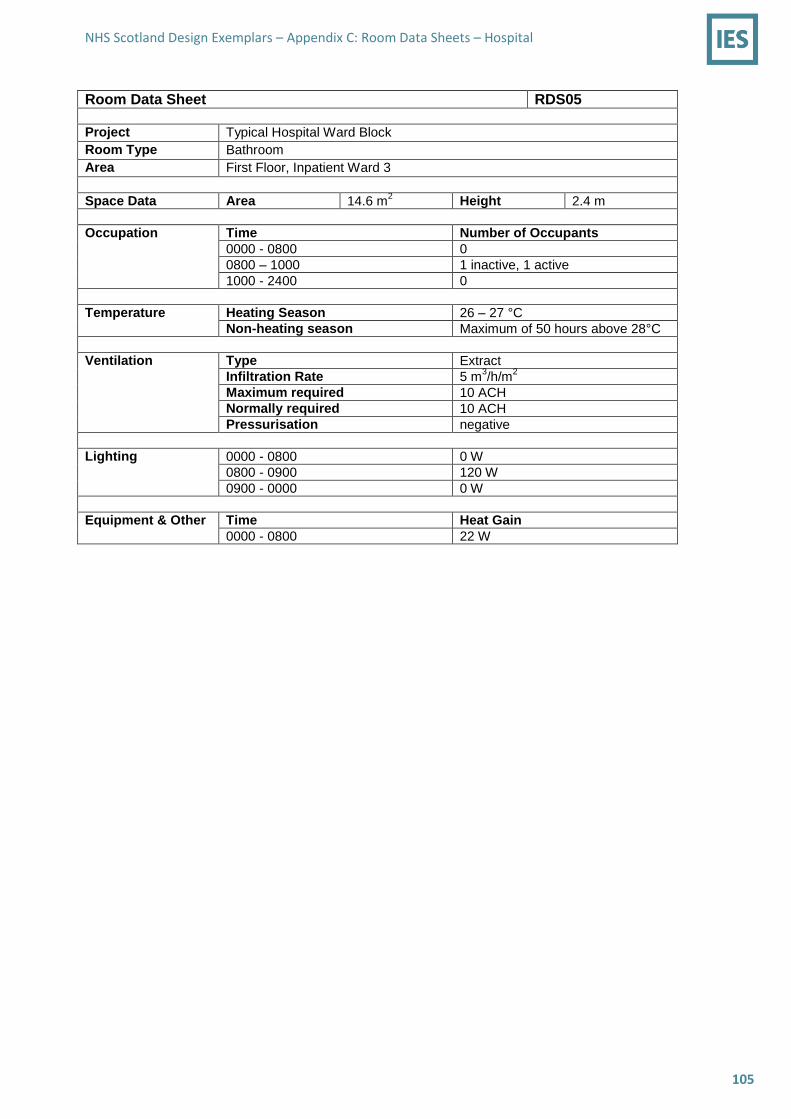
NHS Scotland Design Exemplars – Appendix C: Room Data Sheets – Hospital
105
Room Data Sheet RDS05
Project Typical Hospital Ward Block
Room Type Bathroom
Area First Floor, Inpatient Ward 3
Space Data Area 14.6 m2 Height 2.4 m
Occupation Time Number of Occupants
0000 - 0800 0
0800 – 1000 1 inactive, 1 active
1000 - 2400 0
Temperature Heating Season 26 – 27 °C
Non-heating season Maximum of 50 hours above 28°C
Ventilation Type Extract
Infiltration Rate 5 m3/h/m
2
Maximum required 10 ACH
Normally required 10 ACH
Pressurisation negative
Lighting 0000 - 0800 0 W
0800 - 0900 120 W
0900 - 0000 0 W
Equipment & Other Time Heat Gain
0000 - 0800 22 W

NHS Scotland Design Exemplars – Appendix C: Room Data Sheets – Hospital
106
Room Data Sheet RDS06
Project Typical Hospital Ward Block
Room Type Clean Utility
Area First Floor, Inpatient Ward 3
Space Data Area 11.6 m2 Height 2.7 m
Occupation Time Number of Occupants
0000 - 0800 0
0800 – 1200 1 active
1200 - 1300 0
1300 - 1700 1 active
1700 - 1800 0
1800 - 2100 1 active
2100 - 2400 0
Temperature Heating Season 18-20 °C
Non-heating season Maximum of 50 hours above 28°C
Ventilation Type Extract
Infiltration Rate 5 m3/h/m
2
Maximum required 6 ACH
Normally required 6 ACH
Pressurisation negative
Lighting 0000 - 0800 0 W
0800 – 1200 60 W
1200 - 1300 0 W
1300 - 1700 60 W
1700 - 1800 0 W
1800 - 2100 60 W
2100 - 2400 0 W
Equipment & Other Time Heat Gain
0000 - 2400 22 W

NHS Scotland Design Exemplars – Appendix C: Room Data Sheets – Hospital
107
Room Data Sheet RDS07
Project Typical Hospital Ward Block
Room Type Communal Toilet
Area First Floor, Inpatient Ward 3
Space Data Average Area 12 m2 Height 2.4 m
Occupation Time Number of Occupants
0000 - 0800 0
0800 - 1700 0.5 (average)
1700 - 2400 0
Temperature Heating Season 19 – 21 °C
Non-heating season Maximum of 50 hours above 28°C
Ventilation Type Extract
Infiltration Rate 5 m3/h/m
2
Trickle Vent 0 mm2
Maximum required 10 ACH
Normally required 10 ACH
Pressurisation negative
Lighting 0000 - 0800 0 W
0800 - 1700 42 W
1700 - 2400 0 W
Equipment & Other Time Heat Gain
0000 - 2400 22 W
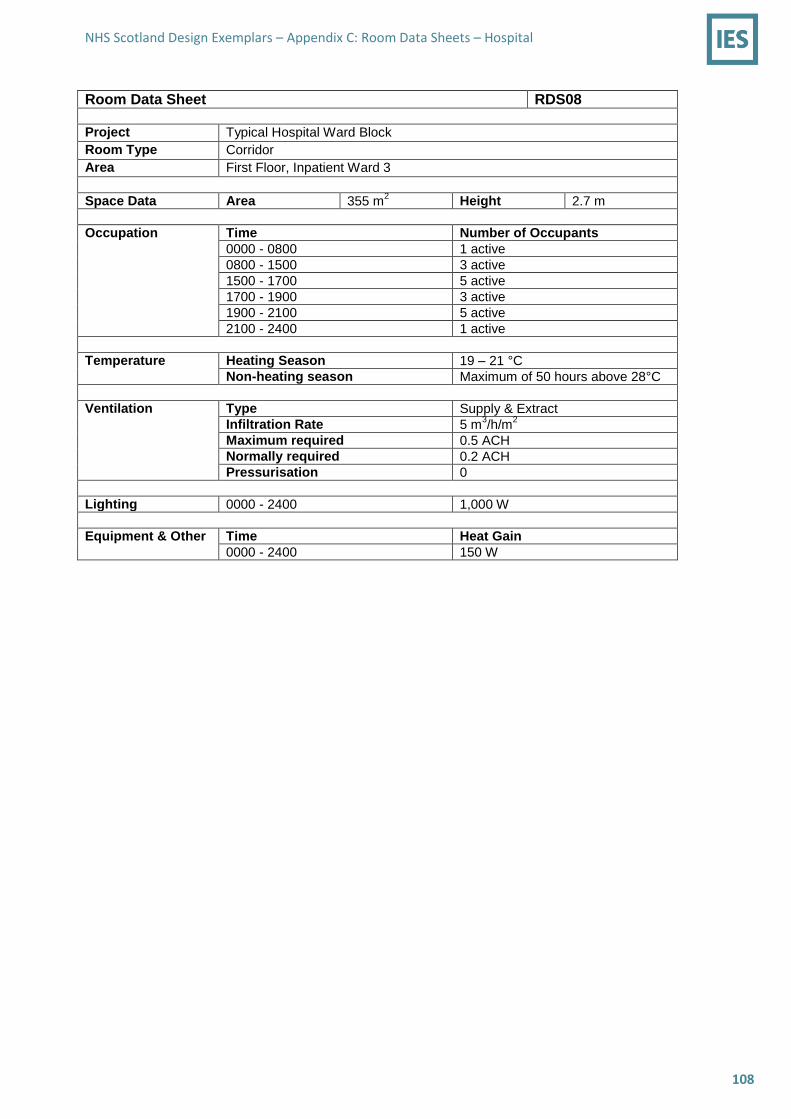
NHS Scotland Design Exemplars – Appendix C: Room Data Sheets – Hospital
108
Room Data Sheet RDS08
Project Typical Hospital Ward Block
Room Type Corridor
Area First Floor, Inpatient Ward 3
Space Data Area 355 m2 Height 2.7 m
Occupation Time Number of Occupants
0000 - 0800 1 active
0800 - 1500 3 active
1500 - 1700 5 active
1700 - 1900 3 active
1900 - 2100 5 active
2100 - 2400 1 active
Temperature Heating Season 19 – 21 °C
Non-heating season Maximum of 50 hours above 28°C
Ventilation Type Supply & Extract
Infiltration Rate 5 m3/h/m
2
Maximum required 0.5 ACH
Normally required 0.2 ACH
Pressurisation 0
Lighting 0000 - 2400 1,000 W
Equipment & Other Time Heat Gain
0000 - 2400 150 W

NHS Scotland Design Exemplars – Appendix C: Room Data Sheets – Hospital
109
Room Data Sheet RDS09
Project Typical Hospital Ward Block
Room Type Dirty Utility
Area First Floor, Inpatient Ward 3
Space Data Area 11.6 m2 Height 2.7 m
Occupation Time Number of Occupants
0000 - 0800 0
0800 – 1200 1 active
1200 - 1300 0
1300 - 1700 1 active
1700 - 1800 0
1800 - 2100 1 active
2100 - 2400 0
Temperature Heating Season 18-20 °C
Non-heating season Maximum of 50 hours above 28°C
Ventilation Type Extract
Infiltration Rate 5 m3/h/m
2
Maximum required 6 ACH
Normally required 6 ACH
Pressurisation negative
Lighting 0000 - 0800 0 W
0800 – 1200 60 W
1200 - 1300 0 W
1300 - 1700 60 W
1700 - 1800 0 W
1800 - 2100 60 W
2100 - 2400 0 W
Equipment & Other Time Heat Gain
0000 - 0800 44 W
0800 – 1200 1,044 W
1200 - 1300 44 W
1300 - 1700 1,044 W
1700 - 1800 44 W
1800 - 2100 1,044 W
2100 - 2400 44 W

NHS Scotland Design Exemplars – Appendix C: Room Data Sheets – Hospital
110
Room Data Sheet RDS10
Project Typical Hospital Ward Block
Room Type DSR
Area First Floor, Inpatient Ward 3
Space Data Area 7 m2 Height 2.4 m
Occupation Time Number of Occupants
0000 - 0600 0
0600 – 0800 1 active
0800 - 2400 0
Temperature Heating Season 15-18 °C
Non-heating season Maximum of 50 hours above 28°C
Ventilation Type Extract
Infiltration Rate 5 m3/h/m
2
Maximum required 6 ACH
Normally required 6 ACH
Pressurisation 0 or negative
Lighting 0000 - 0600 0 W
0600 – 0800 28 W
0800 - 2400 0 W
Equipment & Other Time Heat Gain
0000 - 0700 66 W
0700 – 2300 66 W
2300 - 2400 66 W

NHS Scotland Design Exemplars – Appendix C: Room Data Sheets – Hospital
111
Room Data Sheet RDS11
Project Typical Hospital Ward Block
Room Type Interview Room
Area First Floor, Inpatient Ward 3
Space Data Area 8.4 m2 Height 2.4 m
Occupation Time Number of Occupants
0000 - 0800 0
0800 – 1700 1 inactive
1700 - 2400 0
Temperature Heating Season 19 – 22 °C
Non-heating season Maximum of 50 hours above 28°C
Ventilation Type Natural
Infiltration Rate 5 m3/h/m
2
Maximum required 1.4 ACH
Normally required 1.4 ACH
Pressurisation 0 or negative
Lighting 0000 - 0800 0 W
0800 – 1700 60 W
1700 - 2400 0 W
Equipment & Other Time Heat Gain
0000 - 0800 0 W
0800 – 1700 20 W
1700 - 2400 0W
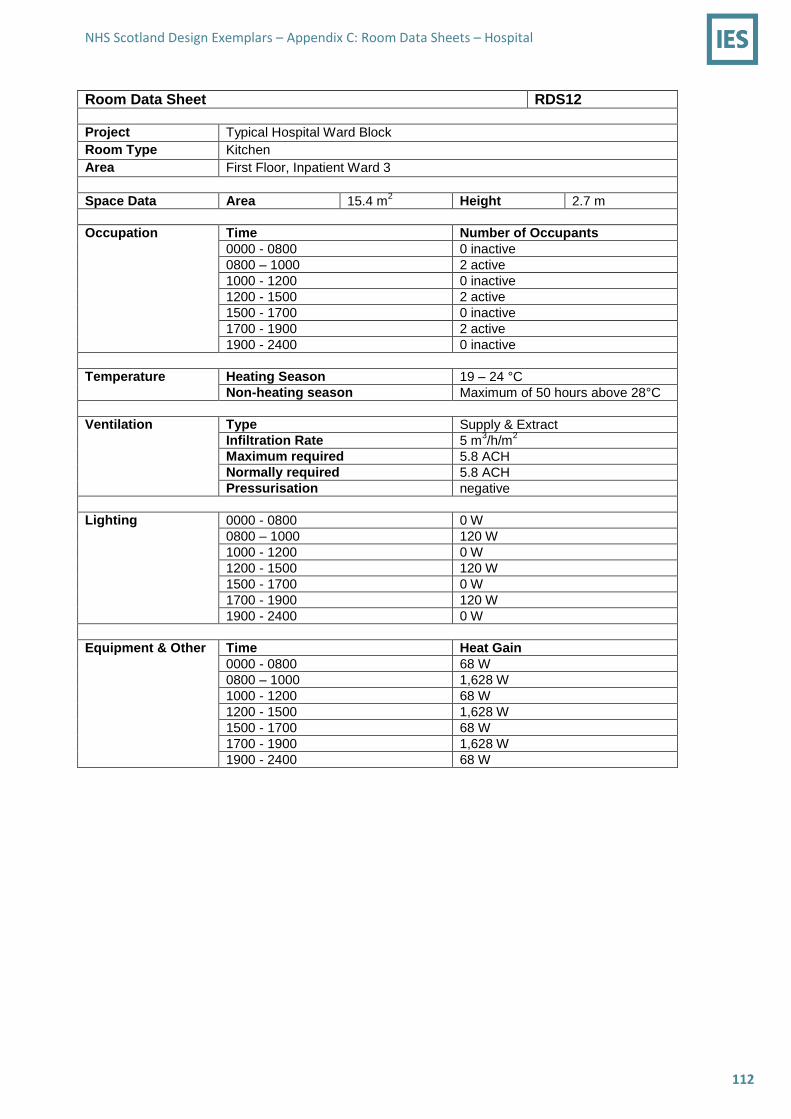
NHS Scotland Design Exemplars – Appendix C: Room Data Sheets – Hospital
112
Room Data Sheet RDS12
Project Typical Hospital Ward Block
Room Type Kitchen
Area First Floor, Inpatient Ward 3
Space Data Area 15.4 m2 Height 2.7 m
Occupation Time Number of Occupants
0000 - 0800 0 inactive
0800 – 1000 2 active
1000 - 1200 0 inactive
1200 - 1500 2 active
1500 - 1700 0 inactive
1700 - 1900 2 active
1900 - 2400 0 inactive
Temperature Heating Season 19 – 24 °C
Non-heating season Maximum of 50 hours above 28°C
Ventilation Type Supply & Extract
Infiltration Rate 5 m3/h/m
2
Maximum required 5.8 ACH
Normally required 5.8 ACH
Pressurisation negative
Lighting 0000 - 0800 0 W
0800 – 1000 120 W
1000 - 1200 0 W
1200 - 1500 120 W
1500 - 1700 0 W
1700 - 1900 120 W
1900 - 2400 0 W
Equipment & Other Time Heat Gain
0000 - 0800 68 W
0800 – 1000 1,628 W
1000 - 1200 68 W
1200 - 1500 1,628 W
1500 - 1700 68 W
1700 - 1900 1,628 W
1900 - 2400 68 W

NHS Scotland Design Exemplars – Appendix C: Room Data Sheets – Hospital
113
Room Data Sheet RDS13
Project Typical Hospital Ward Block
Room Type Kitchen Table & Circulation
Area First Floor, Inpatient Ward 3
Space Data Area 73.4 m2 Height 2.7 m
Occupation Time Number of Occupants
0000 - 0800 0
0800 – 1000 4 inactive
1000 - 1200 1 inactive
1200 - 1400 4 inactive
1400 - 1700 1 inactive
1700 - 1900 2 inactive
1900 - 2400 0
Temperature Heating Season 22 – 24 °C
Non-heating season Maximum of 50 hours above 28°C
Ventilation Type Natural
Infiltration Rate 5 m3/h/m
2
Trickle Vent 54,040 mm2
Maximum required 1.9 ACH
Normally required 1.9 ACH
Pressurisation 0
Lighting Summer
0000 - 0900 300 W
0900 - 2100 150 W
2100 - 2400 300 W
Winter
0000 - 0700 300 W
0700 - 1600 150 W
1600 - 2400 300 W
Spring/Autumn
0000 - 0800 300 W
0800 - 1800 150 W
1800 - 2400 300 W
Equipment & Other Time Heat Gain
0000 - 0700 0 W
0700 – 2300 100 W
2300 - 2400 0 W
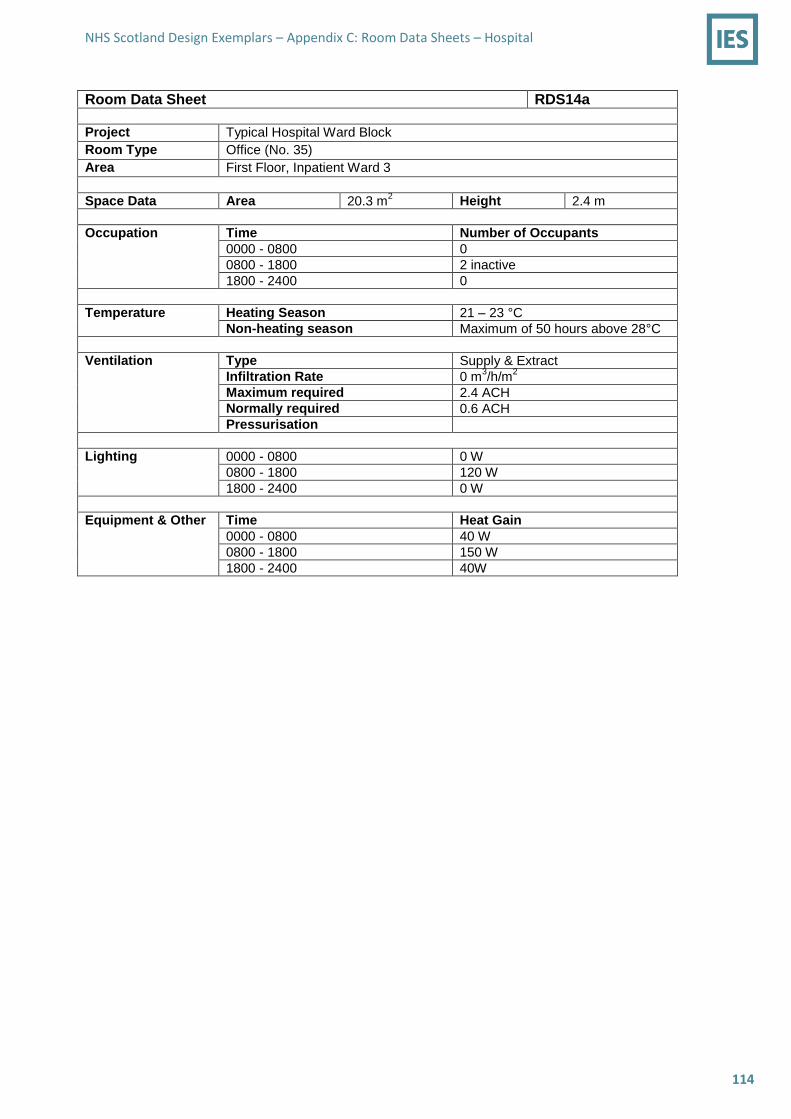
NHS Scotland Design Exemplars – Appendix C: Room Data Sheets – Hospital
114
Room Data Sheet RDS14a
Project Typical Hospital Ward Block
Room Type Office (No. 35)
Area First Floor, Inpatient Ward 3
Space Data Area 20.3 m2 Height 2.4 m
Occupation Time Number of Occupants
0000 - 0800 0
0800 - 1800 2 inactive
1800 - 2400 0
Temperature Heating Season 21 – 23 °C
Non-heating season Maximum of 50 hours above 28°C
Ventilation Type Supply & Extract
Infiltration Rate 0 m3/h/m
2
Maximum required 2.4 ACH
Normally required 0.6 ACH
Pressurisation
Lighting 0000 - 0800 0 W
0800 - 1800 120 W
1800 - 2400 0 W
Equipment & Other Time Heat Gain
0000 - 0800 40 W
0800 - 1800 150 W
1800 - 2400 40W

NHS Scotland Design Exemplars – Appendix C: Room Data Sheets – Hospital
115
Room Data Sheet RDS14b
Project Typical Hospital Ward Block
Room Type Office (No. 68)
Area First Floor, Inpatient Ward 3
Space Data Area 13 m2 Height 2.4 m
Occupation Time Number of Occupants
0000 - 0800 0
0800 - 1800 1 inactive
1800 - 2400 0
Temperature Heating Season 21 – 23 °C
Non-heating season Maximum of 50 hours above 28°C
Ventilation Type Natural
Infiltration Rate 5 m3/h/m
2
Trickle Vent 17,800 mm2
Maximum required 0.9 ACH
Normally required 0.9 ACH
Pressurisation
Lighting 0000 - 0800 0 W
0800 - 1800 120 W
1800 - 2400 0 W
Equipment & Other Time Heat Gain
0000 - 0800 40 W
0800 - 1800 100 W
1800 - 2400 40W

NHS Scotland Design Exemplars – Appendix C: Room Data Sheets – Hospital
116
Room Data Sheet RDS15
Project Typical Hospital Ward Block
Room Type Plant Room
Area First Floor, Inpatient Ward 3
Space Data Area 2.5 m2 Height 2.7 m
Occupation Time Number of Occupants
0000 - 2400 0
Temperature Heating Season Unconditioned
Non-heating season Unconditioned
Ventilation Type Natural
Infiltration Rate 5 m3/h/m
2
Maximum required 0 ACH
Normally required 0 ACH
Pressurisation 0
Lighting 0000 - 2400 0 W
Equipment & Other Time Heat Gain
0000 - 2400 133 W
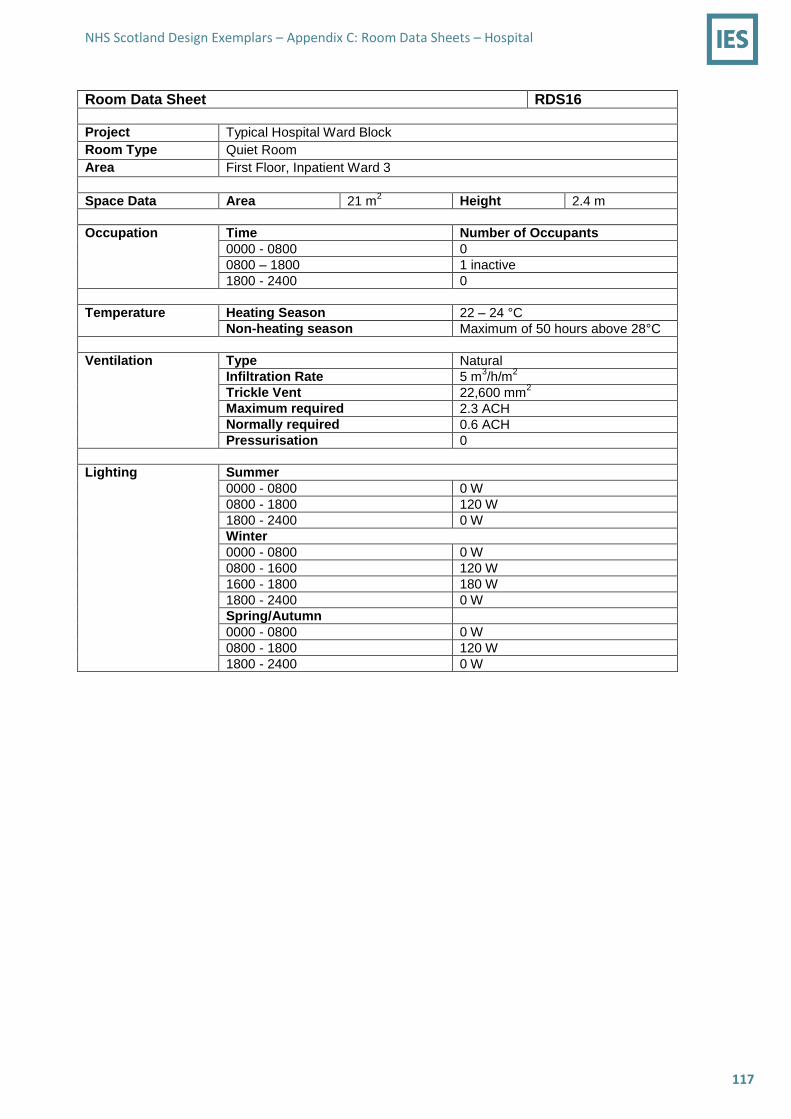
NHS Scotland Design Exemplars – Appendix C: Room Data Sheets – Hospital
117
Room Data Sheet RDS16
Project Typical Hospital Ward Block
Room Type Quiet Room
Area First Floor, Inpatient Ward 3
Space Data Area 21 m2 Height 2.4 m
Occupation Time Number of Occupants
0000 - 0800 0
0800 – 1800 1 inactive
1800 - 2400 0
Temperature Heating Season 22 – 24 °C
Non-heating season Maximum of 50 hours above 28°C
Ventilation Type Natural
Infiltration Rate 5 m3/h/m
2
Trickle Vent 22,600 mm2
Maximum required 2.3 ACH
Normally required 0.6 ACH
Pressurisation 0
Lighting Summer
0000 - 0800 0 W
0800 - 1800 120 W
1800 - 2400 0 W
Winter
0000 - 0800 0 W
0800 - 1600 120 W
1600 - 1800 180 W
1800 - 2400 0 W
Spring/Autumn
0000 - 0800 0 W
0800 - 1800 120 W
1800 - 2400 0 W
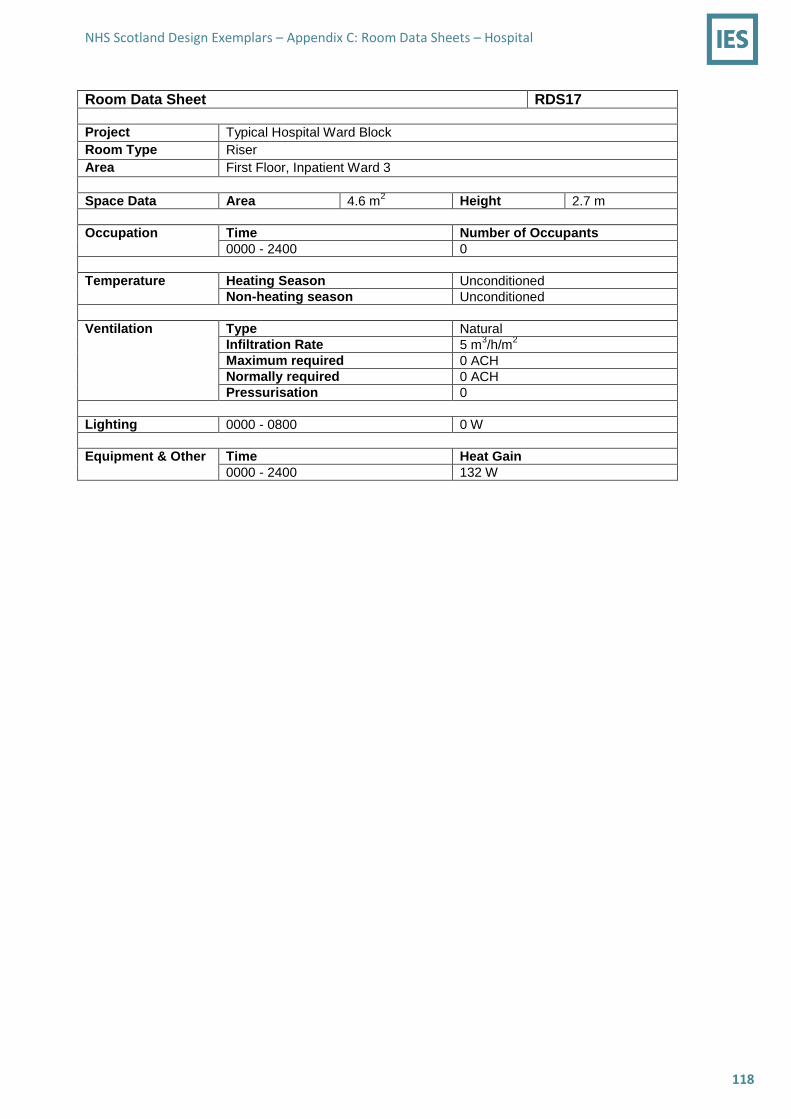
NHS Scotland Design Exemplars – Appendix C: Room Data Sheets – Hospital
118
Room Data Sheet RDS17
Project Typical Hospital Ward Block
Room Type Riser
Area First Floor, Inpatient Ward 3
Space Data Area 4.6 m2 Height 2.7 m
Occupation Time Number of Occupants
0000 - 2400 0
Temperature Heating Season Unconditioned
Non-heating season Unconditioned
Ventilation Type Natural
Infiltration Rate 5 m3/h/m
2
Maximum required 0 ACH
Normally required 0 ACH
Pressurisation 0
Lighting 0000 - 0800 0 W
Equipment & Other Time Heat Gain
0000 - 2400 132 W

NHS Scotland Design Exemplars – Appendix C: Room Data Sheets – Hospital
119
Room Data Sheet RDS18
Project Typical Hospital Ward Block
Room Type Servery
Area First Floor, Inpatient Ward 3
Space Data Area 13.5 m2 Height 2.4 m
Occupation Time Number of Occupants
0000 - 0800 0
0800 – 1000 2 active
1000 - 1200 0
1200 - 1500 2 active
1500 - 1700 0
1700 - 1900 2 active
1900 - 2400 0
Temperature Heating Season 15-18 °C
Non-heating season Maximum of 50 hours above 28°C
Ventilation Type Extract
Infiltration Rate 5 m3/h/m
2
Maximum required 12 ACH
Normally required 12 ACH
Pressurisation negative
Lighting 0000 - 0800 0 W
0800 – 1000 120 W
1000 - 1200 0 W
1200 - 1500 120 W
1500 - 1700 0 W
1700 - 1900 120 W
1900 - 2400 0 W
Equipment & Other Time Heat Gain
0000 - 0800 34 W
0800 – 1000 4,034 W
1000 - 1200 34 W
1200 - 1500 4,034 W
1500 - 1700 34 W
1700 - 1900 4,034 W
1900 - 2400 34 W

NHS Scotland Design Exemplars – Appendix C: Room Data Sheets – Hospital
120
Room Data Sheet RDS19
Project Typical Hospital Ward Block
Room Type Servery Utility
Area First Floor, Inpatient Ward 3
Space Data Area 8.3 m2 Height 2.4 m
Occupation Time Number of Occupants
0000 - 0800 0
0800 – 1000 1 active
1000 - 1200 0
1200 - 1500 1 active
1500 - 1700 0
1700 - 1900 1 active
1900 - 2400 0
Temperature Heating Season 15-18 °C
Non-heating season Maximum of 50 hours above 28°C
Ventilation Type Extract
Infiltration Rate 5 m3/h/m
2
Maximum required 6 ACH
Normally required 6 ACH
Pressurisation negative
Lighting 0000 - 0800 0 W
0800 – 1000 60 W
1000 - 1200 0 W
1200 - 1500 60 W
1500 - 1700 0 W
1700 - 1900 60 W
1900 - 2400 0 W
Equipment & Other Time Heat Gain
0000 - 0800 94 W
0800 – 1000 3,214 W
1000 - 1200 94 W
1200 - 1500 3,214 W
1500 - 1700 94 W
1700 - 1900 3,214 W
1900 - 2400 94 W

NHS Scotland Design Exemplars – Appendix C: Room Data Sheets – Hospital
121
Room Data Sheet RDS20
Project Typical Hospital Ward Block
Room Type Stair
Area First Floor, Inpatient Ward 3
Space Data Area 27.8 m2 Height 13 m
Occupation Time Number of Occupants
0000 - 0800 0
0800 - 2100 0
2100 - 2400 0
Temperature Heating Season 19 – 24 °C
Non-heating season Maximum of 50 hours above 28°C
Ventilation Type Natural
Infiltration Rate 5 m3/h/m
2
Maximum required 0 ACH
Normally required 0 ACH
Pressurisation 0
Lighting 0000 - 2400 168 W
Equipment & Other Time Heat Gain
0000 - 2400 0 W

NHS Scotland Design Exemplars – Appendix C: Room Data Sheets – Hospital
122
Room Data Sheet RDS21
Project Typical Hospital Ward Block
Room Type Stair Lobby
Area First Floor, Inpatient Ward 3
Space Data Area 9.4 m2 Height 2.7 m
Occupation Time Number of Occupants
0000 - 0800 0
0800 - 2100 0
2100 - 2400 0
Temperature Heating Season 19 – 24 °C
Non-heating season Maximum of 50 hours above 28°C
Ventilation Type Natural
Infiltration Rate 5 m3/h/m
2
Maximum required 0 ACH
Normally required 0 ACH
Pressurisation 0
Lighting 0000 - 2400 56 W
Equipment & Other Time Heat Gain
0000 - 2400 0 W

NHS Scotland Design Exemplars – Appendix C: Room Data Sheets – Hospital
123
Room Data Sheet RDS22
Project Typical Hospital Ward Block
Room Type Store
Area First Floor, Inpatient Ward 3
Space Data Area 11 m2 Height 2.4 m
Occupation Time Number of Occupants
0000 - 2400 0
Temperature Heating Season Unconditioned
Non-heating season Unconditioned
Ventilation Type Natural
Infiltration Rate 5 m3/h/m
2
Maximum required 0 ACH
Normally required 0 ACH
Pressurisation 0
Lighting 0000 - 2400 0 W
Equipment & Other Time Heat Gain
0000 - 2400 0 W

NHS Scotland Design Exemplars – Appendix C: Room Data Sheets – Hospital
124
Room Data Sheet RDS23
Project Typical Hospital Ward Block
Room Type Therapy
Area First Floor, Inpatient Ward 3
Space Data Area 45.8 m2 Height 2.7 m
Occupation Time Number of Occupants
0000 - 0900 0
0900 – 1700 2 active
1700 - 2400 0
Temperature Heating Season 16 -18 °C
Non-heating season < 20°C
Ventilation Type Supply/Extract
Infiltration Rate 5 m3/h/m
2
Trickle Vent 37,480 mm2
Maximum required 10 ACH
Normally required 10 ACH
Pressurisation positive
Lighting Summer
0000 - 1000 0 W
1000 - 1600 458 W
1600 - 2400 0 W
Winter/Spring/Autumn
0000 - 0900 0 W
0900 - 1700 458 W
1700 - 2400 0 W
Equipment & Other Time Heat Gain
0000 - 0700 50 W
0700 – 2300 500 W
2300 - 2400 50 W

NHS Scotland Design Exemplars – Appendix C: Room Data Sheets – Hospital
125
Room Data Sheet RDS24
Project Typical Hospital Ward Block
Room Type Treatment Room
Area First Floor, Inpatient Ward 3
Space Data Area 15.5 m2 Height 2.7 m
Occupation Time Number of Occupants
0000 - 0800 0
0800 – 1200 1 inactive, 1 active
1200 - 1300 0
1300 - 1630 1 inactive, 1 active
1630 - 2400 0
Temperature Heating Season 22 – 24 °C
Non-heating season Maximum of 50 hours above 28°C
Ventilation Type Mechanical
Infiltration Rate 0 m3/h/m
2
Maximum required 10 ACH
Normally required 10 ACH
Pressurisation Positive
Lighting 0000 - 0800 0 W
0800 – 1200 120 W
1200 - 1300 0 W
1300 - 1630 120 W
1630 - 2400 0 W
Equipment & Other Time Heat Gain
0000 - 0700 58 W
0700 – 2300 78 W
2300 - 2400 58 W