Trust, honesty and communication – outcomes from the nhs staff survey

1 Copyright © 2014, Health and Social Care Information Centre.
NHS Outcomes Framework 2014/15:
Domain 2
Enhancing quality of life for people with long-term conditions
Indicator specifications
Version: 1.2
Date: August 2014
Author: Clinical Indicators Team

NHS Outcomes Framework 2014/15: Domain 2 – Enhancing quality of life for people with long-term conditions
2
Contents
2 Health-related quality of life for people with long-term conditions 3
2.1 Proportion of people feeling supported to manage their condition 11
2.2 Employment of people with long-term conditions 18
2.3.i Unplanned hospitalisation for chronic ambulatory care sensitive conditions 23
2.3.ii Unplanned hospitalisation for asthma, diabetes and epilepsy in under 19s 31
2.4 Health-related quality of life for carers 38
2.5 Employment of people with mental illness 46
2.6.i Estimated diagnosis rate for people with dementia 51
Domain 2 Appendices 56

NHS Outcomes Framework 2014/15: 2 – Health related quality of life for people with long-term conditions
3
2 Health-related quality of life for people with long-term conditions
Revision history
Version Date Summary of Changes
1.0 September 2013 First release
1.1 December 2013 Contextual indicator (health related quality of life for all GP Patient Survey respondents) published
2.0 February 2014 Release of indicator values based on new calculation methodology (direct standardisation)
2.1 August 2014 Release with 2013/14 data and addition of long-term condition breakdown
Indicator assurance
Status Date
Methodology Review Group assured
July 2013, January 2014 (assurance based on direct standardisation methodology)
Overview
Indicator title
2 Health-related quality of life for people with long-term conditions
Indicator family name
NHS Outcomes Framework – Domain 2: Enhancing quality of life for people with long-term conditions
Overarching indicator
Health and Social Care Information Centre Indicator Portal code
I00705
Outcome sought
Improved health-related quality of life for people with long-term conditions.

NHS Outcomes Framework 2014/15: 2 – Health related quality of life for people with long-term conditions
4
Detailed Descriptor
Plain English description
This indicator measures health-related quality of life for people who identify themselves as having one or more long-standing health conditions. Health-related quality of life refers to the extent to which people:
1. have problems walking about;
2. have problems performing self-care activities (washing or dressing themselves);
3. have problems performing their usual activities (work, study etc.);
4. have pain or discomfort; and feel anxious or depressed.
Technical description
The directly standardised average (mean) EQ-5D™ score for people self-reporting one or more long-term condition.
Alignment with other Outcome Frameworks
Complementary with Adult Social Care Outcomes Framework Indicator 1A
Data sources
GP Patient Survey (GPPS) from Ipsos MORI (http://www.gp-patient.co.uk/).
Published annually (two waves per year, July – September and January – March) as a financial year data set.
Data available 3 – 4 months after the end of the financial year.
Construction
Calculation methodology
Introduction
Indicator 2 is the overarching indicator for domain 2 of the NHS Outcomes Framework.
The indicator is based on a very large survey of adults registered with a GP Practice in England. The GP Patient Survey is commissioned by NHS England and is conducted by the independent survey organisation Ipsos MORI. Current and previous years’ survey questionnaires are available at the following link: http://www.gp-patient.co.uk/questionnaires/
Patients are eligible for the survey if they have a valid NHS number, they have been registered with a GP in England continuously for six months or longer before the questionnaire is received, and they are at least 18 years old six months before the questionnaire is received. Additionally, to reduce survey fatigue, patients are not to receive more than one GP Patient Survey in any 12-month period. Details regarding eligibility, participation and sampling for the survey is available in a technical annex: http://gp-survey-

NHS Outcomes Framework 2014/15: 2 – Health related quality of life for people with long-term conditions
5
production.s3.amazonaws.com/archive/2014/July/1301375001_Technical%20Annex%202013-2014_FINAL%20v1.pdf
Data filters
Data are filtered based on questions 30 and 31 of the GP Patient Survey, to isolate those who report one or more long-term conditions. Respondents are identified as having a long-term condition if they answer ‘Yes’ to question 30 of the GPPS (based on the latest survey for which field work was carried out between January and March 2014).
Question 30: Do you have a long-standing health condition?
• Yes
• No
• Don’t know/can’t say
If respondents fail to acknowledge their long-term condition in question 30 (those who answer ‘No’ or ‘Don’t know/can’t say’) but tick a condition in question 31 they are recoded to a ‘Yes’ in question 30.
Question 31: Which, if any, of the following medical conditions do you have? Please x all the boxes that apply to you
Alzheimer’s disease or dementia
Angina or long-term heart problem
Arthritis or long-term joint problem
Asthma or long-term chest problem
Blindness or severe visual impairment
Cancer in the last 5 years
Deafness or severe hearing impairment
Diabetes
Epilepsy
High blood pressure
Kidney or liver disease
Learning difficulty
Long-term back problem
Long-term mental health problem
Long-term neurological problem
Another long-term condition
None of these conditions
I would prefer not to say

NHS Outcomes Framework 2014/15: 2 – Health related quality of life for people with long-term conditions
6
All invalid responses (where there is no value for gender or age or any other of the breakdown variables) are excluded from the calculation. Gender and age of a respondent are derived from questions 51 and 52 of the GPPS (2013/14).
Further, only people resident in an English region are included in the indicator (only includes records where GOR_Name <> Wales).
Calculation
Denominator
The denominator is the weighted count of responses from all people who identify themselves as having a long-term condition.
( )
where k = 1, …, p are respondents with a long-term condition identified by questions 30 or
31 of the GP Patient Survey.
Numerator
Health-related quality of life for people who identify themselves as having a long-term condition is measured using the EQ-5D™ instrument, included as question 34 of the GPPS.
Question 34: By placing an (×) in one box in each group below, please indicate which statements best describe your own health state today.
The possible responses are:
Mobility
( ) I have no problems in walking about
( ) I have some problems in walking about
( ) I am confined to bed
Self-Care
( ) I have no problems with self-care
( ) I have some problems washing or dressing myself
( ) I am unable to wash or dress myself
Usual Activities (e.g. work, study, housework, family or leisure activities)
( ) I have no problems with performing my usual activities
( ) I have some problems with performing my usual activities
( ) I am unable to perform my usual activities
Pain / Discomfort
( ) I have no pain or discomfort
( ) I have moderate pain or discomfort
( ) I have extreme pain or discomfort
Anxiety / Depression

NHS Outcomes Framework 2014/15: 2 – Health related quality of life for people with long-term conditions
7
( ) I am not anxious or depressed
( ) I am moderately anxious or depressed
( ) I am extremely anxious or depressed
Answers to question 34 are described in terms of EQ-5D™ health states. For example, if a person selected the best state for each domain, their EQ-5D™ health state would be described as 11111. Assuming all else is equal, if the same person answered that they were ‘extremely anxious or depressed’, their health state would instead be 11113.
EQ-5D™ health states are then converted into an index by applying a formula that attaches values (also called weights) to each of the levels in each dimension. These weights are based on an empirical study, which asked people whether they prefer (i) a state of imperfect health for a given period of time, or (ii) a state of perfect health for a shorter period of time followed by death (see Dolan et al1 and Szende, Oppe and Devlin2 for details).
The EQ-5D™ index has a maximum value of 1, which is assigned to patients who report the best possible health state for each of the five domains. Negative values imply a state of health worse than death.
The numerator is the sum of the weighted EQ-5D™ index values for all responses from people who identify themselves as having a long-term condition.
This is calculated as:
( )
where i = 1, …, m are respondents who identify themselves as having a long-term condition.
2011/12 data are based on the EQ-5D-3L™ instrument set out above, which provides the respondent with three possible answers under each of the five domains (three levels). From 2012/13, however, the EQ-5D-3L™ has been replaced with the EQ-5D-5L™ instrument which provides respondents with five possible answers.
Whilst preference weights for the new instrument are under development, a crosswalk to translate 3L index values into 5L index values has been devised. Details of the crosswalk methodology and results can be found on the EuroQol website http://www.euroqol.org/fileadmin/user_upload/Documenten/PDF/Crosswalk_5L/EQ-5D™-5L_Crosswalk_model_and__methodology.pdf.
Note: EQ-5D™ is a registered trademark of EuroQol. Further details are available from http://www.euroqol.org. EuroQol Group gave written permission to the Department of Health
1 Dolan P et al. 1995. A social tariff for EuroQol: Results from a UK general population survey. Discussion
Paper No 138. Centre for Health Economics, University of York, York. 2 Szende, A., Oppe, M., and Devlin, N. 2006. EQ-5D
TM value sets: Inventory, comparative review and user
guide. Eds. EuroQol Group Monographs Volume 2. Springer, 2006.

NHS Outcomes Framework 2014/15: 2 – Health related quality of life for people with long-term conditions
8
on 2 May 2011 to use the EQ-5D™ questions only in this format (without the visual analogue scale) for the GP Patient Survey and are happy for it to be referred to as EQ-5D™.
Weighting
A weight is applied to construct the indicator. The GP Patient Survey includes a weight for non-response bias (wt_new). This adjusts the data to account for potential differences between the demographic profile of all eligible patients in a practice and the patients who actually complete the questionnaire. The non-response weighting scheme has been developed by Ipsos MORI, incorporating elements such as age and gender of the survey respondent as well as factors from the area where the respondent lives such as level of deprivation, ethnicity profile, ACORN classification and so on, which have been shown to impact on non-response bias within the GP Patient Survey. Ipsos MORI are also investigating whether respondents have systematically different outcomes to non-respondents, even after the non-response bias weighting has been applied.
Further information on the current weighting scheme can be found in the survey’s technical annex http://gp-survey-production.s3.amazonaws.com/archive/2014/July/1301375001_Technical%20Annex%202013-2014_FINAL%20v1.pdf
and the weighting strategy:
http://gp-survey-production.s3.amazonaws.com/faq/Summary%20of%20weighting%20Strategy%20for%20Year%202011-2012.pdf
Standardisation
The indicator values are directly standardised. The directly age- and gender-standardised mean EQ-5DTM score is the score a standard population would have if that population were to experience the age- and gender specific scores of the subject population.
The directly standardised score (DSS) is given by:
where:
Oi is the observed number of events in the local or subject population in age and gender group i (Sum of weighted EQ-5DTM scores in the respective age and gender group for all respondents who identify themselves as having a long-term condition)
ni is the number of individuals in the local or subject denominator population in age and gender group i (Sum of all weighted responses (wt_new) in the respective age and gender group for all respondents who identify themselves as having a long-term condition)
wi is the number (or proportion) of individuals in the reference or standard population in age and gender group i (Sum of all weighted responses (wt_new) in the respective age and gender group for all respondents to the GPPS)
i i
ii
i
in
Ow
wDSS
1

NHS Outcomes Framework 2014/15: 2 – Health related quality of life for people with long-term conditions
9
The standard population used for the direct method are all persons who responded to the GP Patient Survey in the respective financial year. The age groups used in the calculation are derived from question 52 of the survey (2013/14): 18 to 24, 25 to 34, 35 to 44, 45 to 54, 55 to 64, 65 to 74, 75 to 84, 85+.
Contextual Information
A contextual indicator showing the average health status score for all GP Patient Survey respondents at national level and for each of the breakdowns is calculated. This information aims to aid the interpretation by providing comparison of the health-related quality of life for people who identify themselves as having a long-term condition to the whole GP Patient Survey population.
Presentation
Breakdowns
Time periods
Annual data from 2011/12
Demographic
Gender: Male and female (from 2011/12)
Age: 10-year age bands from 18-24 to 85 and over (from 2011/12)
Ethnicity: Ethnicity breakdowns (from 2011/12)
Sexual orientation: From 2011/12
Religion: Religion level breakdown (from 2011/12)
Deprivation: Deprivation deciles from ‘1- Most deprived’ to ’10 – Least deprived’ (from 2011/12)
Number of long-term One long-term condition to four+ long-term conditions conditions:
Geographic
England: England level data from (2011/12)
Lower tier local authority: Lower tier local authority level data (from 2011/12)
Upper tier local authority: Upper tier local authority level data (from 2011/12)
Region: Region level data (from 2011/12)
Disclosure control
Due to the uncertainty around the validity of direct standardisation where there are zero cells a conservative approach to suppression has been taken. Where there are zero cells (at least 1) for any of the categories within a breakdown the indicator value is suppressed for the category in question.
NHS Outcomes Framework 2014/15: 2 – Health related quality of life for people with long-term conditions
10
Further, where the numerator for a breakdown category is less than 25 the indicator values are suppressed.
Where fewer than 10 people answered a question the indicator values, numerators and denominators are suppressed.
Excel and CSV output
Column name Output
Year Respective financial year
Period of coverage July to September of previous year and January to March of following year for the respective financial year
Breakdown England, gender, age, ethnicity, sexual orientation, religion, deprivation, lower tier local authority, upper tier local authority, region, number of long-term conditions
Level Level of breakdown
Level description Description of level of breakdown
Indicator value Directly standardised mean health status score for individuals who are reporting that they have a long-term condition
Numerator Sum of weighted EQ-5DTM value
Denominator Sum of weighted response (wt_new)
Average health status Directly standardised mean health status score for all GP Patient score for all GP Patient Survey respondents Survey respondents

NHS Outcomes Framework 2014/15: 2.1 – Proportion of people feeling supported to manage their condition
11
2.1 Proportion of people feeling supported to manage their condition
Revision history
Version Date Summary of Changes
1.0 September 2013 First release
2.0 February 2014 Release of indicator values based on new calculation methodology (direct standardisation)
2.1 August 2014 Release with 2013/14 data and addition of long-term condition breakdown
Indicator assurance
Status Date
Methodology Review Group assured
July 2013, January 2014 (assurance based on direct standardisation methodology)
Overview
Indicator title
2.1 Proportion of people feeling supported to manage their long-term condition
Indicator family name
NHS Outcomes Framework – Domain 2: Enhancing quality of life for people with long-term conditions
Improvement area – Ensuring people feel supported to manage their condition
Health and Social Care Information Centre Indicator Portal code
I00706
Outcome sought
People with long-term conditions feel supported to manage their condition.

NHS Outcomes Framework 2014/15: 2.1 – Proportion of people feeling supported to manage their condition
12
Detailed Descriptor
Plain English description
This indicator measures the degree to which people with health conditions that are expected to last for a significant period of time feel they have had sufficient support from relevant services and organisations to manage their condition. Patients are encouraged to consider all services and organisations, which support them in managing their condition, and not just health services.
Technical description
The directly standardised proportion of people with a long-term health condition who report having had enough support from local services or organisations to help manage their condition, in the last six months. Patients are asked to consider all services and organisations, not just health services.
Data sources
GP Patient Survey (GPPS) from Ipsos MORI (http://www.gp-patient.co.uk).
Published annually (two waves per year, July – September and January – March) as a financial year data set.
Data available 3 – 4 months after the end of the financial year.
Construction
Calculation methodology
Introduction
Indicator 2.1 measures the proportion of people with long-term conditions who feel supported to manage their condition. The indicator is based on a very large survey of adults registered with a GP Practice in England. The GP Patient Survey is commissioned by NHS England and is conducted by the independent survey organisation Ipsos MORI. Current and previous years’ survey questionnaires are available at: http://www.gp-patient.co.uk/questionnaires/
Patients are eligible for the survey if they have a valid NHS number, they have been registered with a GP in England continuously for six months or longer before the questionnaire is received, and they are at least 18 years old six months before the questionnaire is received. Additionally, to reduce survey fatigue, patients are not to receive more than one GP Patient Survey in any 12-month period. Details regarding eligibility, participation and sampling for the survey is available in a technical annex: http://gp-survey-production.s3.amazonaws.com/archive/2014/July/1301375001_Technical%20Annex%202013-2014_FINAL%20v1.pdf
NHS Outcomes Framework 2014/15: 2.1 – Proportion of people feeling supported to manage their condition
13
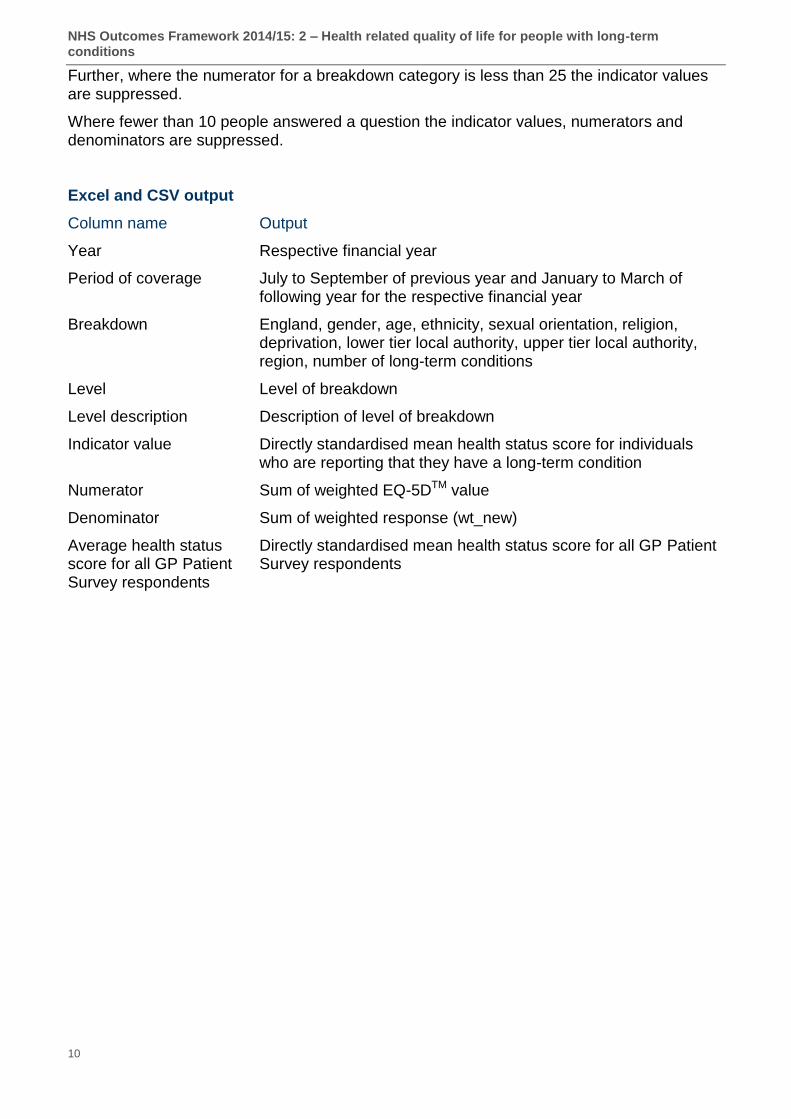
Data filters
Data are filtered based on questions 30 and 31 of the GP Patient Survey, to isolate those who report one or more long-term conditions. Respondents are identified as having a long-term condition if they answer ‘Yes’ to question 30 of the GP Patient Survey (based on the latest survey for which field work was carried out between January and March 2014).
Question 30: Do you have a long-standing health condition?
Yes
No
Don’t know/can’t say
If respondents fail to acknowledge their long-term condition in question 30 (those who answer ‘No’ or ‘Don’t know/can’t say’) but tick a condition in question 31 they are recoded to a ‘Yes’ in question 30.
Question 31: Which, if any, of the following medical conditions do you have? Please x all the boxes that apply to you
Alzheimer’s disease or dementia
Angina or long-term heart problem
Arthritis or long-term joint problem
Asthma or long-term chest problem
Blindness or severe visual impairment
Cancer in the last 5 years
Deafness or severe hearing impairment
Diabetes
Epilepsy
High blood pressure
Kidney or liver disease
Learning difficulty
Long-term back problem
Long-term mental health problem
Long-term neurological problem
Another long-term condition
None of these conditions
I would prefer not to say
All invalid responses (where there is no value for gender or age or any other of the breakdown variables) are excluded from the calculation. Gender and age of a respondent are derived from questions 51 and 52 of the GP Patient Survey (2013/14).

NHS Outcomes Framework 2014/15: 2.1 – Proportion of people feeling supported to manage their condition
14
Further only people resident in an English region are included in the indicator (only includes records where GOR_Name <> Wales).
Calculation
Denominator
The denominator is the weighted count of respondents who answer ‘Yes, definitely’ OR ‘Yes, to some extent’ OR ‘No’ to question 32:
( )
where k = 1, …, p are respondents with a long-term condition who answer ‘Yes, definitely’ OR ‘Yes, to some extent’ OR ‘No’.
Numerator
The numerator is based on answers to Question 32 of the GP Patient Survey (2013/14).
Question 32 – In the last 6 months, have you had enough support from local services or organisations to help you to manage your long-term health condition(s)? Please think about all services and organisations, not just health services.
The possible responses to the question are:
Yes, definitely
Yes, to some extent
No
I have not needed such support
Don’t know/can’t say
Respondents who answer ‘Yes, to some extent’ are deemed to feel half as supported as respondents who answer ‘Yes, definitely’. Therefore, this group of responses is weighted by 0.5 when calculating the numerator.
Given the data filter above, the numerator is therefore calculated as:
( ) ( )
where i = 1, …, m are respondents with a long-term condition who answer ‘Yes, definitely’; and j = 1, …, n are respondents with a long-term condition who answer Yes, to some extent’.
Weighting
A weight is applied to construct the indicator. The GP Patient Survey includes a weight for non-response bias (wt_new). This adjusts the data to account for potential differences between the demographic profile of all eligible patients in a practice and the patients who actually complete the questionnaire. The non-response weighting scheme has been developed by Ipsos MORI, incorporating elements such as age and gender of the survey respondent as well as factors from the area where the respondent lives such as level of

NHS Outcomes Framework 2014/15: 2.1 – Proportion of people feeling supported to manage their condition
15
deprivation, ethnicity profile, ACORN classification and so on, which have been shown to impact on non-response bias within the GP Patient Survey. Ipsos MORI are also investigating whether respondents have systematically different outcomes to non-respondents, even after the non-response bias weighting has been applied.
Further information on the current weighting scheme can be found in the survey’s technical annex
http://gp-survey-production.s3.amazonaws.com/archive/2014/July/1301375001_Technical%20Annex%202013-2014_FINAL%20v1.pdf
and the weighting strategy:
http://gp-survey-production.s3.amazonaws.com/faq/Summary%20of%20weighting%20Strategy%20for%20Year%202011-2012.pdf
Standardisation
The indicator values are directly standardised. The directly age- and gender-standardised value is the value a standard population would have if that population were to experience the age- and gender specific values of the subject population.
The directly standardised proportion (DSP) is given by:
where:
Oi is the observed number of events in the local or subject population in age and gender group i
ni is the number of individuals in the local or subject denominator population in age and gender group i
wi is the number (or proportion) of individuals in the reference or standard population in age and gender group i
The standard population used for the direct method are all persons who responded to the GP Patient Survey in the respective financial year. The age groups used in the calculation are derived from question 52 of the survey (2013/14): 18 to 24, 25 to 34, 35 to 44, 45 to 54, 55 to 64, 65 to 74, 75 to 84, 85+.
100*1
i i
ii
i
i n
Ow
wDSP

NHS Outcomes Framework 2014/15: 2.1 – Proportion of people feeling supported to manage their condition
16
Presentation
Breakdowns
Time periods
Annual data from 2011/12
Demographic
Age: 10-year age bands from 18 - 24 to 85 and over and unknown age (from 2011/12)
Gender: Males, females and unknown gender (from 2011/12)
Ethnicity: Ethnicity level breakdowns from 2011/12
Sexual orientation: Sexual orientation from 2011/12
Religion: Religion level breakdowns from 2011/12
Deprivation: Deprivation deciles from 1 – most deprived to 10 – least deprived
Number of long-term One long-term condition to four+ long-term conditions conditions:
Geographic
England: England level data from 2011/12
Lower tier local authority: Lower tier local authority level data from 2011/12
Upper tier local authority: Upper tier local authority level data from 2011/12
Region: Region level data from 2011/12
Disclosure control
Due to the uncertainty around the validity of direct standardisation where there are zero cells a conservative approach to suppression has been taken. Where there are zero cells (at least 1) for any of the categories within a breakdown the indicator value is suppressed for the category in question.
Further, where the numerator for a breakdown category is less than 25 the indicator values are suppressed.
Where fewer than 10 people answered a question the indicator values, numerators and denominators are suppressed.

NHS Outcomes Framework 2014/15: 2.1 – Proportion of people feeling supported to manage their condition
17
Excel and CSV output
Column name Output
Year Respective financial year
Period of coverage July to September of the previous year and January to March of following year for the respective financial year
Breakdown England, gender, age, ethnicity, sexual orientation, religion, deprivation, lower tier local authority, upper tier local authority, region, number of long-term conditions
Level Level of breakdown
Level description Description of level of breakdown
Indicator value Weighted percentage of people who feel supported to manage their long-term condition
Numerator Sum of weighted count of respondents with a long-term condition who answer ‘Yes, to some extent’ to Q32 multiplied by 0.5 and sum of weighted count of respondents with a long-term condition who answer ‘Yes, definitely’ to Q32 multiplied by 1
Denominator Sum of weighted count of respondents with a long-term condition who answer ‘Yes, definitely’ or ‘Yes, to some extent’ or ‘No’ to Q32

NHS Outcomes Framework 2014/15: 2.2 – Employment of people with long-term conditions
18
2.2 Employment of people with long-term conditions
Revision history
Version Date Summary of Changes
1.0 November 2011 First release
1.1 November 2011 Minor changes following comments
1.2 March 2012 Breakdown details added
1.3 September 2012 Further breakdowns details added
1.4 September 2013 Additional data points added
1.5 February 2014 Additional data points added
1.6 May 2014 Release with latest data
1.7 August 2014 Release with latest data
Indicator assurance
Status Date
Methodology Review Group assured
June 2011
Overview
Indicator title
2.2 Employment of people with long-term conditions
Indicator family name NHS Outcomes Framework – Domain 2: Enhancing quality of life for people with long-term conditions
Improvement area – Improving functional ability in people with long-term conditions
Health and Social Care Information Centre Indicator Portal code
I00707
Outcome sought
Improved employment rates for people with long-term conditions.

NHS Outcomes Framework 2014/15: 2.2 – Employment of people with long-term conditions
19
Detailed Descriptor
Plain English description
By looking at levels of employment, this indicator measures the extent to which people of working age in England who have a health problem which they believe will last for over a year, are able to live as normal a life as possible. In particular, the indicator measures the difference between:
a) the proportion of people in the general working age population who are in employment, and
b) the proportion of people of working age with a long-term condition who are in employment.
Technical description
The percentage point difference between the rate of employment in the general working age population (aged 16-64) and the rate of employment amongst those working age adults self-reporting a long-term condition. Both component employment rates are reported alongside the indicator.
Alignment with other Outcome Frameworks
Shared with Public Health Outcomes Framework Indicator 1.8
Complementary with Adult Social Care Outcomes Framework Indicator 1E
Data sources
Labour Force Survey (LFS), published by the Office for National Statistics (ONS).
Data are released quarterly approximately six months after the end of the relevant quarter.
Construction
Calculation methodology
Introduction
The indicator is given by the difference between the employment rate for all people of working age in England and the employment rate for people of working age who report a long-term condition. Three figures will be reported:
1. The employment rate for all people;
2. The employment rate for people with a long-term condition;
3. The gap in employment rates between those with a long-term condition and the total population (1 – 2).
Indicator 2.2 is the last of these three figures.
Details of LFS Variables are provided in volume 3 of the user guidance: http://www.ons.gov.uk/ons/guide-method/method-quality/specific/labour-market/labour-market-statistics/volume-3---2014.pdf

NHS Outcomes Framework 2014/15: 2.2 – Employment of people with long-term conditions
20
Please note that the definition of each LFS variable used to construct Indicator 2.2 is set out in appendix 1. For clarity, LFS variable names are written in upper case throughout. All LFS data are weighted by person-level weights (PWT11).
Data filters
Data are filtered out if the respondent’s country of residence is not England (COUNTRY≠1).
Calculation
Employment rate in the general working age population
Denominator
Number of people who are of working age:
MF1664 = 1 (respondent is of working age)
Numerator
Number of people who are of working age:
MF1664 = 1 (respondent is of working age)
AND
INECAC05=1, 2, 3, or 4 (Respondent is either Employee (1), Self-employed (2), Government employment & training programmes (3), or Unpaid family worker (4) – This is the International Labour Organisation (ILO) definition of Basic economic activity)
Employment rate in the general working age population
Denominator
Number of people with a long-term condition of working age:
LNGLST = 1 (the respondent has a health problem or disabilities that they expect will last for more than a year)
Note: LNGLIM was used prior to 2013 Q2
AND
MF1664 = 1 (respondent is of working age)
Numerator
Number of people with a long-term condition in employment and of working age:
LNGLST = 1 (the respondent has a health problem or disabilities that they expect will last for more than a year)
Note: LNGLIM was used prior to 2013 Q2

NHS Outcomes Framework 2014/15: 2.2 – Employment of people with long-term conditions
21
AND
INECAC05=1, 2, 3, or 4 (Respondent is either Employee (1), Self-employed (2), Government employment & training programmes (3), or Unpaid family worker (4) – This is the ILO definition of Basic economic activity)
AND
MF1664 = 1 (respondent is of working age)
Presentation
Breakdowns
Time periods
Quarterly data (calendar years) from 2006
Demographic
Gender: Male and female from 2006
Age: 16 to 19 then 5-year age band from 20 to 24 to 60 to 64 from 2006
Ethnicity: Ethnicity breakdown from 2006
NS-SEC category: NS-SEC category breakdown from 2006
Religion: Religion breakdown from 2006
Geographic
England: England level from 2006
Region: Region level breakdown from 2006
Unitary Authority/ Unitary authority/local area level breakdown from 2006 Local Area:
Disclosure control
Statistical disclosure control is applied to the LFS data where small numbers are an issue (e.g. LA or NS-SEC breakdowns). Suppression is carried out by the data provider (ONS) before the data are received.

NHS Outcomes Framework 2014/15: 2.2 – Employment of people with long-term conditions
22
Excel and CSV output
Column name Output
Year Year of coverage
Quarter Quarter of coverage
Period of coverage Period of coverage
Breakdown England, gender, age, ethnicity, region, unitary authority/local area, NS-SEC category, religion
Level A further description of breakdown
Level description Description of more detailed breakdown
Employment rate of See definition in calculation people with long-term conditions
Employment rate of See definition in calculation population
Indicator value The difference in employment rate between England population and people with a long-term condition
Long-term condition Number of people with long-term conditions in employment numerator
Long-term condition Total number of people with long-term conditions denominator
Population numerator Total number of people in employment
Population denominator Total number of people in the group

NHS Outcomes Framework 2014/15: 2.3.i – Unplanned hospitalisation for chronic ambulatory care sensitive conditions
23
2.3.i Unplanned hospitalisation for chronic ambulatory care sensitive conditions
Revision history
Version Date Summary of Changes
1.0 November 2011 First release
1.1 March 2012 Breakdown details added
2.0 June 2012 Indicator now indirectly standardised
2.1 September 2012 Further disaggregations published
2.2 December 2012 Indicator standardised to 2011/12 using 2011 mid-year population estimates
3.0 March 2013 Indicator now includes children
3.1 September 2013 Additional data point for deprivation breakdown added
3.2 December 2013 Release with 2012/13 data. Data indirectly standardised to the 2012 mid-year population estimates
3.3 February 2014 Release of data for all years with revised ONS population estimates based on the 2011 Census
3.4 May 2014 Further disaggregations published (upper tier local authority, region and annual figures)
3.5 August 2014 Update of specification to refine HES filters and include an additional ADMIMETH filter
Indicator assurance
Status Date
Methodology Review Group assured
September 2011
Overview
Indicator title
2.3.i Unplanned hospitalisation for chronic ambulatory care sensitive conditions
Indicator family name
NHS Outcomes Framework - Domain 2: Enhancing quality of life for people with long-term conditions
Improvement area – Reducing time spent in hospital by people with long-term conditions
Health and Social Care Information Centre Indicator Portal code
I00708
NHS Outcomes Framework 2014/15: 2.3.i – Unplanned hospitalisation for chronic ambulatory care sensitive conditions
24
Outcome sought
Improved health status for people with chronic ambulatory care sensitive conditions.
Detailed Descriptor
Plain English description
Indicator 2.3.i measures how many people with specific long-term conditions, which should not normally require hospitalisation, are admitted to hospital in an emergency. These conditions include, for example, diabetes, convulsions and epilepsy, and high blood pressure.
Technical description
The indirectly standardised rate, per 100,000 population, of emergency admissions for chronic ambulatory care sensitive conditions in the respective quarter of the financial year for people of all ages.
Data sources
Denominator
Mid-year population estimates for England published by the Office for National Statistics (ONS) annually.
Available in the following summer
Numerator
Hospital Episode Statistics (HES) Admitted Patient Care (APC), provided by the Health and Social Care Information Centre (HSCIC).
Final annual and quarterly HES data are released in the November following the financial year-end.
Construction
Calculation methodology
Introduction
This indicator measures the rate of emergency hospitalisation per 100,000 population for patients with long-term ambulatory care sensitive conditions. The data include emergency admissions for patients of all ages. A data period of 3 months is used to produce each of the quarterly outputs. The rate is indirectly standardised to the reference year (2012/13).

NHS Outcomes Framework 2014/15: 2.3.i – Unplanned hospitalisation for chronic ambulatory care sensitive conditions
25
Data filters
See appendix 2 for conditions included in indicator 2.3.i.
The data fields and filters that are used are as follows. Details of HES fields and classifications are available in the HES Data Dictionary (see http://www.hscic.gov.uk/hesdatadictionary).
1. Field Name: DIAG_3_01, DIAG_4_01, DIAG_3_CONCAT
Conditions: Any of (a) to (i) are true. Defined as follows:
a) DIAG_4_01 is equal to either: B18.0, B18.1 AND DIAG_3_CONCAT does not contain: D57
[where DIAG_3_CONCAT is a concatenated field containing the values of all 20 diagnosis fields separated by commas. This condition excludes episodes with a subsequent diagnosis of D57 (Sickle-cell disorders)].
b) DIAG_3_01 is equal to J45 OR DIAG_4_01 is equal to J46X.
c) (DIAG_4_01 is equal to any of: I11.0, J81X, I13.0 OR DIAG_3_01 is equal to I50) AND (OPERTN_3_CONCAT does not contain any of: K0, K1, K2, K3, K4 AND OPERTN_3_CONCAT does not contain any of: K50, K52, K55, K56, K57, K60, K61, K66, K67, K68, K69, K71)
[where OPERTN_3_CONCAT is a concatenated field containing the values of all 24 operation/procedure fields, separated by commas]
d) DIAG_3_01 is equal to any of: E10, E11, E12, E13, E14.
e) DIAG_3_01 is equal to any of: J20, J41, J43, J44 OR DIAG_4_01 is equal to either of: J42X, J47X OR (DIAG_3_01 is equal to J20 AND DIAG_3_CONCAT contains (J41, J42, J43, J44, J47)
f) DIAG_3_01 is equal to either of: I20, I25 AND OPERTN_3_CONCAT does not contain (‘A’, ‘B’, ‘C’, ‘D’, ‘E’, ‘F’, ‘G’, ‘H’,

NHS Outcomes Framework 2014/15: 2.3.i – Unplanned hospitalisation for chronic ambulatory care sensitive conditions
26
‘I’, ‘J’, ‘K’, ‘L’, ‘M’, ‘N’, ‘O’, ‘P’, ‘Q’, ‘R’, ‘S’, ‘T’, ‘V’, ‘W’, ‘X0’, ‘X1’, ‘X2’, ‘X4’, ‘X5’)
g) DIAG_3_01 is equal to either of: D51, D52 OR DIAG_4_01 is equal to any of: D50.1, D50.8, D50.9.
h) DIAG_4_01 is equal to either of: I10X, I11.9 AND OPERTN_3_CONCAT does not contain (‘K0’, ‘K1’, ‘K2’, ‘K3’, ‘K4’, ‘K50’, ‘K52’, ‘K55’, ‘K56’, ‘K57’, ‘K60’, ‘K61’, ‘K66’, ‘K67’, ‘K68’, ‘K69’, ‘K71’)
i) DIAG_3_01 is equal to any of: G40, G41, F00, F01, F02, F03 OR DIAG_4_01 is equal to I48X.
Rationale: These fields give the primary diagnosis of the patient in the episode of interest.
2. Field Name: STARTAGE
Conditions: Is between (inclusive): 0 and 120 OR Is between (inclusive): 7001 and 7007 (for babies)
Rationale: This field describes the age of the patient at the start of their episode of care. For this indicator all ages are considered.
3. Field Name: ADMIMETH
Conditions: Is equal to any of: 21, 22, 23, 24, 25, 28, 2A, 2B, 2C or 2D (25, 2A, 2B, 2C and 2D are valid from April 2013 and replace 28)
Rationale: This restricts the data to emergency admissions only.
4. Field Name: EPISTAT
Conditions: Is equal to either of: 1 or 3
Rationale: This includes both finished and unfinished hospital episodes.
5. Field Name: ADMIDATE
Conditions: Limited to admissions within the current financial year split by quarter. Quarter 1: 1st April to 30th June; Quarter 2: 1st July to 30th September; Quarter 3: 1st October to 31st December; Quarter 4: 1st January to 31st March.
Rationale: Data are presented quarterly with an admission date within the

NHS Outcomes Framework 2014/15: 2.3.i – Unplanned hospitalisation for chronic ambulatory care sensitive conditions
27
quarter of interest.
6. Field Name: SEX
Conditions: Is equal to either of: 1 or 2
Rationale: Data are shown for males and females separately. Data for persons represent the sum of males and females and exclude the small number of records where sex was unknown or unspecified.
7. Field Name: EPIORDER
Conditions: Is equal to: 1
Rationale: This restricts the data to the first episode in a hospital spell.
8. Field Name: ADMISORC
Conditions: Is not equal to any of: 51, 52, 53
Rationale: This excludes transfers.
9. Field Name: EPITYPE
Conditions: Is equal to: 1
Rationale: This restricts the data to general episodes (excludes birth, delivery and mental health episodes).
10. Field Name: CLASSPAT
Conditions: Is equal to: 1
Rationale: This restricts the data to ordinary admissions (excludes day case, regular day/night attenders and mothers/babies using only delivery facilities).
11. Field Name: RESLADST (2003/04 to 2010/11)
RESLADST_ONS (2011/12 onwards)
Conditions: Is equal to a valid English Local Authority or equal to ‘U’
Rationale: This restricts the data to patients resident in England. ‘U’ represents ‘England unspecified’.
Calculation
The rate is indirectly standardised to the reference year 2012/13.
Denominator
ONS mid-year population estimates (based on the 2011 Census)

NHS Outcomes Framework 2014/15: 2.3.i – Unplanned hospitalisation for chronic ambulatory care sensitive conditions
28
Numerator
The number of finished and unfinished admission episodes, excluding transfers, for patients with an emergency method of admission and with a primary diagnosis of a chronic ambulatory care sensitive condition as shown in appendix 2.
Standardisation
The rate is indirectly standardised by age and gender to the reference year (2012/13). The age groups used are 0-4, 5-9, 10-14, 15-18, 19-24, 25-29, 30-34, 35-39, 40-44, 45-49, 50-54, 55-59, 60-64, 65-69, 70-74, 75-79, 80-84, 85-89 and 90+. A standardised admission ratio (SAR) is calculated and converted into a rate by multiplying it by the overall event rate of patients in England in the reference year. The SAR is calculated as:
100100100
iii
ii
ii
ii
n
O
E
O
E
OSAR
where:
Oi is the observed number of events in the subject population in age- and gender group i (i.e. the number of admissions for that group in a given year or quarter)
Ei is the expected number of events in the subject population in age- and gender group i, that is, the expected number of events in that age- and gender group if the population in that year/quarter had the same distribution as the reference population (2012). It is calculated by multiplying the number of individuals in that group (ni) by the crude age-and gender-specific
rate in the reference population (i). This figure is then multiplied by 100 (for presentational purposes):
ni is the number of individuals in the subject population in age- and gender group i (i.e. the number of individuals in that group in a given year or quarter)
i is the crude age- and gender specific rate in the standard population in age-and gender group i (i.e. the crude age- and gender specific rate for that age- and gender group in 2012, which is the reference year)
The indirectly standardised rate is the crude rate for the reference year multiplied by the SAR.
When the indicator is broken down by gender, the value is indirectly standardised by age only. Similarly, when the indicator is broken down by age, the value is indirectly standardised by gender only.
Confidence Intervals
When calculating 95% confidence intervals for indirectly standardised ratios, it is assumed that the standard rates come from a population sufficiently large as to assume their sampling variance is negligible, and that the observed number of events O follows a Poisson distribution. Where the number of observed events is less than 500, the exact upper and lower limits for O are found from a look-up table and used to calculate the respective limits of the ratio. Where the number of observed events is 500 or more, confidence intervals are

NHS Outcomes Framework 2014/15: 2.3.i – Unplanned hospitalisation for chronic ambulatory care sensitive conditions
29
calculated using the method described by Goldblatt and Jones3. The lower and upper confidence limits for the SAR are denoted by SAR_LL and SAR_UL
For O < 500:
where:
OLL/UL are the exact lower and upper 95% confidence limits from a standard Poisson distribution table for the total number of observed events O in the subject population.
E is the total expected number of events in the subject population.
For O >= 500:
for O < 900
for O >= 900
The indirectly standardised rate upper and lower confidence intervals are calculated by multiplying the SAR upper and lower limits by the crude rate for the reference year.
Presentation
Breakdowns
Time periods
Quarterly and annual data from 2003/04 Q1 for all breakdowns
Demographic
By gender and by 5-year age band
Geographic
By lower tier local authority, upper tier local authority and region
3 Goldblatt P and Jones D. Methods. In Longitudinal Study: Mortality and Social Organisation, ed P Goldblatt. London: Her
Majesty’s Stationery Office, 1990.
100E
OLL_SMR LL 100
E
OUL_SMR UL
100
110961960
E
.O.O.LL_SAR
100960219620
E
O.O.LL_SAR
100960961941
E
.O.O.UL_SAR

NHS Outcomes Framework 2014/15: 2.3.i – Unplanned hospitalisation for chronic ambulatory care sensitive conditions
30
Other
By condition
Disclosure control
This indicator is calculated using HES data, following the HES Analysis Guide on suppression of small numbers. Where the indicator is calculated from a numerator of between one and five (inclusive), the value is suppressed and replaced with ‘*’. This is in order to protect against the potential for disclosing the identity of an individual. Secondary suppression is carried out where only one rate is suppressed for a certain breakdown and time period and this value could be calculated by differencing. This is to reduce the risk of one suppressed number being identifiable in isolation.
http://www.hscic.gov.uk/media/1592/HES-analysis-guide/pdf/HES_Analysis_Guide_Jan_2014.pdf
As ONS population data were used for the denominator the values were rounded to the nearest 100. The rounding was carried out after the indicator value was calculated.
Excel and CSV output
Column name Output
Year Financial year
Quarter Annual, quarter
Period of coverage Actual time period the data cover
Breakdown England, gender, age band, local authority (lower and upper tier), region, condition
Level Detailed breakdown of each split - breakdown code
Level description Further description of level/breakdown
Indicator value Indirectly standardised rate (ISR) per 100,000 population
Lower CI ISR lower 95% confidence interval
Upper CI ISR upper 95% confidence interval
Standardised ratio Standardised admission ratio
Standardised ratio lower CI Standardised admission ratio lower confidence interval
Standardised ratio upper CI Standardised admission ratio upper confidence interval
Observed Number of observed events (numerator)
Population Population count (denominator)
Expected Number of expected events
Percent unclassified The percentage of records where there is no LSOA recorded – displayed for breakdowns by lower and upper tier local authority and region
NHS Outcomes Framework 2014/15: 2.3.ii – Unplanned hospitalisation for asthma, diabetes and epilepsy in under 19s
31
2.3.ii Unplanned hospitalisation for asthma, diabetes and epilepsy in under 19s
Revision history
Version Date Summary of Changes
1.0 May 2011 First release
1.1 March 2012 Breakdown details added
2.0 June 2012 Indicator now indirectly standardised
2.1 September 2012 Further disaggregations published
2.2 December 2012 Indicator standardised to 2011/12
2.3 September 2012 Additional data point for deprivation breakdown added
2.4 December 2013 Release with 2012/13 data. Data indirectly standardised to the 2012 mid-year population estimates
2.5 February 2014 Release of data for all years with revised ONS population estimates based on the 2011 Census
2.6 May 2014 Further disaggregations published (upper tier local authority, region and annual figures)
2.7 August 2014 Update of specification to refine HES filters and include an additional ADMIMETH filter
Indicator assurance
Status Date
Methodology Review Group assured
April 2011
Overview
Indicator title
2.3.ii Unplanned hospitalisation for asthma, diabetes and epilepsy in under 19s
Indicator family name
NHS Outcomes Framework - Domain 2: Enhancing quality of life for people with long-term conditions
Improvement area – Reducing time spent in hospital by people with long-term conditions
Health and Social Care Information Centre Indicator Portal code
I00671

NHS Outcomes Framework 2014/15: 2.3.ii – Unplanned hospitalisation for asthma, diabetes and epilepsy in under 19s
32
Outcome sought
Improving the health status of those aged 0 to 18 who have asthma, diabetes or epilepsy.
Detailed Descriptor
Plain English description
This indicator measures how many young people (aged 0-18 inclusive) who have asthma, diabetes or epilepsy are admitted to hospital in an emergency.
Technical description
The indirectly standardised rate, per 100,000 population, of emergency hospital admissions for young people with a primary diagnosis of asthma, diabetes or epilepsy in the respective quarter of the financial year and annually.
Data sources
Denominator
Mid-year population estimates for England published by the Office for National Statistics (ONS) annually.
Available in the following summer
Numerator
Hospital Episode Statistics (HES) Admitted Patient Care (APC), provided by the Health and Social Care Information Centre (HSCIC).
Final annual and quarterly HES data are released in the November following the financial year-end.
Construction
Calculation methodology
Introduction
This indicator measures the rate of emergency hospital admissions per 100,000 population amongst young people with asthma, diabetes and epilepsy. The numerator is given by the number of finished and unfinished admission episodes, excluding transfers, for patients under 19 (0 to 18 years inclusive) with an emergency method of admission and with a primary diagnosis of asthma, diabetes or epilepsy as shown below. The data are filtered to include emergency admissions only for patients aged under 19 years. A data period of 3 months is used to produce each of the quarterly outputs. The rate is indirectly standardised to the most recently complete financial year’s data.

NHS Outcomes Framework 2014/15: 2.3.ii – Unplanned hospitalisation for asthma, diabetes and epilepsy in under 19s
33
Data filters
See appendix 3 for conditions included in indicator 2.3.ii.
The data fields and filters that are used are as follows. Details of HES fields and classifications are available in the HES Data Dictionary (see http://www.hscic.gov.uk/hesdatadictionary).
1. Field Name: DIAG_3_01
Conditions: Is equal to any of: J45, J46, E10, G40, G41
Rationale: This gives the primary diagnosis of the patient.
2. Field Name: STARTAGE
Conditions: Is between (inclusive): 0 and 18 OR Is between (inclusive): 7001 and 7007 (for babies)
Rationale: This field describes the age of the patient at the start of their episode of care. For this indicator only patients under the age of 19 are considered.
3. Field Name: ADMIMETH
Conditions: Is equal to any of: 21, 22, 23, 24, 25, 28, 2A, 2B, 2C or 2D (25, 2A, 2B, 2C and 2D are valid from April 2013 and replace 28)
Rationale: This restricts the data to emergency admissions only.
4. Field Name: EPISTAT
Conditions: Is equal to either of: 1 or 3
Rationale: This includes both finished and unfinished hospital episodes.
5. Field Name: ADMIDATE
Conditions: Limited to admissions within the current financial year split by quarter.
Quarter 1: 1st April to 30th June; Quarter 2: 1st July to 30th September; Quarter 3: 1st October to 31st December; Quarter 4: 1st January to 31st March.
Rationale: Data are presented quarterly with an admission date within the quarter of interest.

NHS Outcomes Framework 2014/15: 2.3.ii – Unplanned hospitalisation for asthma, diabetes and epilepsy in under 19s
34
6. Field Name SEX
Conditions: Is equal to either of: 1 or 2
Rationale: Data are shown for males and females separately. Data for persons are the sum of males and females and exclude the small number of records where sex was unknown or unspecified.
7. Field Name: EPIORDER
Conditions: Is equal to: 1
Rationale: This restricts the data to the first episode in a hospital spell.
8. Field Name: ADMISORC
Conditions: Is not equal to any of: 51, 52, 53
Rationale: This excludes transfers
9. Field Name: EPITYPE
Conditions: Is equal to: 1
Rationale: This restricts the data to general episodes (excludes birth, delivery and mental health episodes).
10. Field Name: CLASSPAT
Conditions: Is equal to: 1
Rationale: This restricts the data to ordinary admissions (excludes day case, regular day/night attenders and mothers/babies using only delivery facilities).
11. Field Name: RESLADST (2003/04 to 2010/11)
RESLADST_ONS (2011/12 onwards)
Conditions: Is equal to a valid English local authority or equal to ‘U’
Rationale: This restricts the data to patients resident in England. ‘U’ represents
‘England unspecified’.
Calculation
The rate is indirectly standardised to the reference year 2012/13.
Denominator
Resident population in England aged 0 to 18 inclusive, based on ONS mid-year population estimates (based on the 2011 Census).

NHS Outcomes Framework 2014/15: 2.3.ii – Unplanned hospitalisation for asthma, diabetes and epilepsy in under 19s
35
Numerator
The number of finished and unfinished admission episodes, excluding transfers, for patients aged under 19 with an emergency method of admission and where asthma, diabetes or epilepsy was the primary diagnosis.
Standardisation
The rate is indirectly standardised by age and gender to the reference year (2012/13). The age groups used are single years of age 0 to 18. A standardised admission ratio (SAR) is calculated and converted into a rate by multiplying it by the overall event rate of patients in England in the reference year.
The SAR is calculated as:
100100100
iii
ii
ii
ii
n
O
E
O
E
OSAR
where:
Oi is the observed number of events in the subject population in age- and gender group i (i.e. the number of admissions for that group in a given year or quarter)
Ei is the expected number of events in the subject population in age- and gender group i, that is, the expected number of events in that age- and gender group if the population in that year/quarter had the same distribution as the reference population (2012). It is calculated by multiplying the number of individuals in that group (ni) by the crude age-and gender-specific
rate in the reference population (i). This figure is then multiplied by 100 (for presentational purposes):
ni is the number of individuals in the subject population in age- and gender group i (i.e. the number of individuals in that group in a given year or quarter)
i is the crude age- and gender specific rate in the standard population in age-and gender group i (i.e. the crude age- and gender specific rate for that age- and gender group in 2012, which is the reference year)
The indirectly standardised rate is the crude rate for the reference year multiplied by the SAR.
When the indicator is broken down by gender, the value is indirectly standardised by age only. Similarly, when the indicator is broken down by age, the value is indirectly standardised by gender only.
Confidence Intervals
When calculating 95% confidence intervals for indirectly standardised ratios, it is assumed that the standard rates come from a population sufficiently large as to assume their sampling variance is negligible, and that the observed number of events O follows a Poisson distribution. Where the number of observed events is less than 500, the exact upper and lower limits for O are found from a look-up table and used to calculate the respective limits of

NHS Outcomes Framework 2014/15: 2.3.ii – Unplanned hospitalisation for asthma, diabetes and epilepsy in under 19s
36
the ratio. Where the number of observed events is 500 or more, confidence intervals are calculated using the method described by Goldblatt and Jones4. The lower and upper confidence limits for the SAR are denoted by SAR_LL and SAR_UL
For O < 500:
100
E
OLL_SMR LL
100
E
OUL_SMR UL
where:
OLL/UL are the exact lower and upper 95% confidence limits from a standard Poisson distribution table for the total number of observed events O in the subject population.
E is the total expected number of events in the subject population.
For O >= 500:
100110961960
E
.O.O.LL_SAR for O < 900
100960219620
E
O.O.LL_SAR for O >= 900
100960961941
E
.O.O.UL_SAR
The indirectly standardised rate upper and lower confidence intervals are calculated by multiplying the SAR upper and lower limits by the crude rate for the reference year.
Presentation
Breakdowns
Time periods
Quarterly and annual data from Q1 2003/04 for all breakdowns
Demographic
By gender and by single year of age
Geographic
By lower tier local authority, upper tier local authority and region
4 Goldblatt P and Jones D. Methods. In Longitudinal Study: Mortality and Social Organisation, ed P Goldblatt. London: Her
Majesty’s Stationery Office, 1990.

NHS Outcomes Framework 2014/15: 2.3.ii – Unplanned hospitalisation for asthma, diabetes and epilepsy in under 19s
37
Other
By condition
Disclosure control
This indicator is calculated using HES data, following the HES Analysis Guide on suppression of small numbers. Where the indicator is calculated from a numerator of between one and five (inclusive), the value is suppressed and replaced with ‘*’. This is in order to protect against the potential for disclosing the identity of an individual. Secondary suppression is carried out where only one rate is suppressed for a certain breakdown and time period and this value could be calculated by differencing. This is to reduce the risk of one suppressed number being identifiable in isolation.
http://www.hscic.gov.uk/media/1592/HES-analysis-guide/pdf/HES_Analysis_Guide_Jan_2014.pdf
As ONS population data were used for the denominator the values were rounded to the nearest 100. The rounding was carried out after the indicator value was calculated.
Excel and CSV output
Column name Output
Year Financial year
Quarter Annual, quarter
Period of coverage Actual time period the data covers
Breakdown England, gender, age band, local authority (lower and upper tier), region, condition
Level Detailed breakdown of each split - breakdown code
Level description Further description of level/breakdown
Indicator value Indirectly standardised rate (ISR) per 100,000 population
Lower CI ISR lower 95% confidence interval
Upper CI ISR upper 95% confidence interval
Standardised ratio Standardised admission ratio
Standardised ratio lower CI Standardised admission ratio lower confidence interval
Standardised ratio upper CI Standardised admission ratio upper confidence interval
Observed Number of observed events (numerator)
Population Population count (denominator)
Expected Number of expected events
Percent unclassified The percentage of records where there is no LSOA recorded – displayed for breakdowns by lower and upper tier local authority and region

NHS Outcomes Framework 2014/15: 2.4 Health-related quality of life for carers
38
2.4 Health-related quality of life for carers
Revision history
Version Date Summary of Changes
1.0 September 2013 First release
1.1 December 2013 Contextual indicator (health related quality of life for all GPPS respondents) published
2.0 February 2014 Release of indicator values based on new calculation methodology (direct standardisation)
2.1 August 2014 Release with 2013/14 data
Indicator assurance
Status Date
Methodology Review Group assured
July 2013, January 2014 (assurance based on direct standardisation methodology)
Overview
Indicator title
2.4 Health-related quality of life for carers
Indicator family name
NHS Outcomes Framework – Domain 2: Enhancing quality of life for people with long-term conditions
Improvement area – Enhancing quality of life for carers
Health and Social Care Information Centre Indicator Portal code
I00709
Outcome sought
Improved health-related quality of life for carers.
Detailed Descriptor
Plain English description
This indicator measures health-related quality of life for people who identify themselves as helping or supporting family members, friends, neighbours or others with their long-term

NHS Outcomes Framework 2014/15: 2.4 Health-related quality of life for carers
39
physical or mental ill health/disability or because of problems related to old age. By health-related quality of life, we mean the extent to which people:
1. have problems walking about;
2. have problems performing self-care activities (washing or dressing themselves);
3. have problems performing their usual activities (work, study etc.);
4. have pain or discomfort; and
5. feel anxious or depressed.
Technical description
The directly standardised average (mean) EQ-5DTM score for individuals reporting that they are carers, measured based on responses to the GP Patient Survey.
Alignment with other Outcomes Frameworks
Complementary with Adult Social Care Outcomes Framework Indicator 1D
Data sources
GP Patient Survey (GPPS) from Ipsos MORI (http://www.gp-patient.co.uk).
Annual (two waves per year July to September and January to March published as a financial year data set)
Data available 3 – 4 months after the end of the financial year
Construction
Calculation methodology
Introduction
Indicator 2.4 measures health-related quality of life for people reporting that they are carers. The indicator is based on a very large survey of adults registered with a GP Practice in England. The GP Patient Survey is commissioned by NHS England and is conducted by the independent survey organisation Ipsos MORI. Current and previous years’ survey questionnaires are available at the following link: http://www.gp-patient.co.uk/questionnaires/
Patients are eligible for the survey if they have a valid NHS number, they have been registered with a GP in England continuously for six months or longer before the questionnaire is received. Additionally, to reduce survey fatigue, patients are not to receive more than one GP Patient Survey in any 12-month period. Details regarding eligibility, participation and sampling for the survey is available in a technical annex: http://gp-survey-production.s3.amazonaws.com/archive/2014/July/1301375001_Technical%20Annex%202013-2014_FINAL%20v1.pdf

NHS Outcomes Framework 2014/15: 2.4 Health-related quality of life for carers
40
Data filters
Data are filtered based on question 60 of the GP Patient Survey, to isolate those who identify themselves as a carer (based on the latest survey for which field work was carried out between January and March 2014).
Question 60: Do you look after, or give any help or support to family members, friends, neighbours or others because of either:
-long-term physical or mental health/disability, or
-problems related to old age?
Do not count anything you do as part of your paid employment
The possible responses are:
a) No
b) Yes, 1-9 hours a week
c) Yes, 20-34 hours a week
d) Yes, 35-49 hours a week
e) Yes, 50+ hours a week
People who answer ‘Yes …’ are assumed a carer, regardless of how many hours of care they provide. Those who answer otherwise are not considered in the calculation.
All invalid responses (where there is no value for gender or age or any other of the breakdown variables) are excluded from the calculation. Gender and age of a respondent are derived from questions 51 and 52 of the GP Patient Survey dataset.
Further only people resident in an English region are included in the indicator (only includes records where GOR_Name <> Wales).
Calculation
Denominator
The denominator is the weighted count of responses from people who identify themselves as carers.
( )
where k = 1, …, p are respondents who identify themselves as carers in question 60 of the GP Patient Survey.
Numerator
Health-related quality of life for people who identify themselves as carers is measured using the EQ-5D™ instrument, included as question 34 of the GP Patient Survey.
Question 34: By placing an (×) in one box in each group below, please indicate which statements best describe your own health state today.

NHS Outcomes Framework 2014/15: 2.4 Health-related quality of life for carers
41
The possible responses are:
Mobility
( ) I have no problems in walking about
( ) I have some problems in walking about
( ) I am confined to bed
Self-Care
( ) I have no problems with self-care
( ) I have some problems washing or dressing myself
( ) I am unable to wash or dress myself
Usual Activities (e.g. work, study, housework, family or leisure activities)
( ) I have no problems with performing my usual activities
( ) I have some problems with performing my usual activities
( ) I am unable to perform my usual activities
Pain / Discomfort
( ) I have no pain or discomfort
( ) I have moderate pain or discomfort
( ) I have extreme pain or discomfort
Anxiety / Depression
( ) I am not anxious or depressed
( ) I am moderately anxious or depressed
( ) I am extremely anxious or depressed
Answers to question 34 are described in terms of EQ-5D™ health states. For example, if a person selected the best state for each domain, their EQ-5D™ health state would be described as 11111. Assuming all else is equal, if the same person answered that they were ‘extremely anxious or depressed’, their health state would instead be 11113.
EQ-5D™ health states are then converted into an index by applying a formula that attaches values (also called weights) to each of the levels in each dimension. These weights are based on an empirical study, which asked people whether they prefer (i) a state of imperfect health for a given period of time, or (ii) a state of perfect health for a shorter period of time followed by death (see Dolan et al5 and Szende, Oppe and Devlin6 for details).
The EQ-5D™ index has a maximum value of 1, which is assigned to patients who report the best possible health state for each of the five domains. Negative values imply a state of health worse than death.
5 Dolan P et al. 1995. A social tariff for EuroQol: Results from a UK general population survey. Discussion
Paper No. 138. Centre for Health Economics, University of York, York. 6 Szende, A., Oppe, M., and Devlin, N. 2006. EQ-5D™™ value sets: Inventory, comparative review and user
guide. Eds. EuroQol Group Monographs Volume 2. Springer, 2006.

NHS Outcomes Framework 2014/15: 2.4 Health-related quality of life for carers
42
The numerator is the sum of the weighted EQ-5D™ index values for all responses from people who identify themselves as carers.
This is calculated as: ( )
where i = 1, …, m are respondents who identify themselves as carers.
2011/12 data are based on the EQ-5D-3L™ instrument set out above, which provides the respondent with three possible answers under each of the five domains (three levels). From 2012/13, however, the EQ-5D-3L™ has been replaced with the EQ-5D-5L™ instrument which provides respondents with five possible answers.
Whilst preference weights for the new instrument are under development, a crosswalk to translate 3L index values into 5L index values has been devised. Details of the crosswalk methodology and results can be found on the EuroQol website http://www.euroqol.org/fileadmin/user_upload/Documenten/PDF/Crosswalk_5L/EQ-5D™-5L_Crosswalk_model_and__methodology.pdf.
Note: EQ-5D™ is a registered trademark of EuroQol. Further details are available from http://www.euroqol.org. EuroQol Group gave written permission to the Department of Health on 2 May 2011 to use the EQ-5D™ questions only in this format (without the visual analogue scale) for the GP patient survey and are happy for it to be referred to as EQ-5D™.
Weighting
A weight is applied to construct the indicator. The GP Patient Survey includes a weight for non-response bias (wt_new). This adjusts the data to account for potential differences between the demographic profile of all eligible patients in a practice and the patients who actually complete the questionnaire. The non-response weighting scheme has been developed by Ipsos MORI, incorporating elements such as age and gender of the survey respondent as well as factors from the area where the respondent lives such as level of deprivation, ethnicity profile, ACORN classification and so on, which have been shown to impact on non-response bias within the GP Patient Survey. Ipsos MORI are also investigating whether respondents have systematically different outcomes to non-respondents, even after the non-response bias weighting has been applied.
Further information on the current weighting scheme can be found in the survey’s technical annex
http://gp-survey-production.s3.amazonaws.com/archive/2014/July/1301375001_Technical%20Annex%202013-2014_FINAL%20v1.pdf
and the weighting strategy:
http://gp-survey-production.s3.amazonaws.com/faq/Summary%20of%20weighting%20Strategy%20for%20Year%202011-2012.pdf

NHS Outcomes Framework 2014/15: 2.4 Health-related quality of life for carers
43
Standardisation
The indicator values are directly standardised. The directly age- and gender-standardised mean EQ-5DTM score is the score a standard population would have if that population were to experience the age- and gender specific scores of the subject population.
The directly standardised score (DSS) is given by:
where:
Oi is the observed number of events in the local or subject population in age and gender group i (Sum of weighted EQ-5DTM scores in the respective age and gender group for all respondents who identify themselves as carers)
ni is the number of individuals in the local or subject denominator population in age and gender group i (Sum of all weighted responses (wt_new) in the respective age and gender group for all respondents who identify themselves as carers)
wi is the number (or proportion) of individuals in the reference or standard population in age and gender group i (Sum of all weighted responses (wt_new) in the respective age and gender group for all respondents to the GP patient survey)
The standard population used for the direct method are all persons who responded to the GP Patient survey in the respective financial year. The age groups used in the calculation are derived from question 52 of the survey: 18 to 24, 25 to 34, 35 to 44, 45 to 54, 55 to 64, 65 to 74, 75 to 84, 85+.
Contextual Information
A contextual indicator showing the average health status score for all GP Patient Survey respondents at national level and for each of the breakdowns is calculated. This information aims to aid the interpretation by providing comparison of the health-related quality of life for people who identify themselves as carers to the whole GP Patient Survey population.
Additionally the distribution of carers by age and gender and the number of hours cared are shown for each of the survey periods where data are available.
Presentation
Breakdowns
Time periods
Annual data from 2011/12 for England
i i
ii
i
in
Ow
wDSS
1

NHS Outcomes Framework 2014/15: 2.4 Health-related quality of life for carers
44
Demographic
Age: Age bands 18 to 24 then 10-year bands from 25 to 85+ from 2011/12
Gender: Male, female from 2011/12
Ethnicity: Ethnicity breakdowns from 2011/12
Sexual orientation: From 2011/12
Religion: Religion level data from 2011/12
Deprivation: Deprivation deciles from 1 – most deprived to 10 – least deprived from 2011/12
Geographic
England: England level data from 2011/12
Lower tier local authority: Lower tier local authority level data from 2011/12
Upper tier local authority: Upper tier local authority level data from 2011/12
Region: Region level data from 2011/12
Disclosure control
Due to the uncertainty around the validity of direct standardisation where there are zero cells a conservative approach to suppression has been taken. Where there are zero cells (at least 1) for any of the categories within a breakdown the indicator value is suppressed for the category in question.
Further, where the numerator for a breakdown category is less than 25 the indicator values are suppressed.
Where fewer than 10 people answered a question the indicator values, numerators and denominators are suppressed.

NHS Outcomes Framework 2014/15: 2.4 Health-related quality of life for carers
45
Excel and CSV output
Column name Output
Year Respective financial year
Period of coverage July to September of previous year and January to March of following year for the respective financial year
Breakdown England, gender, age, ethnicity, sexual orientation, religion, deprivation, lower tier local authority, upper tier local authority, region
Level Level of breakdown
Level description Description of level of breakdown
Indicator value Weighted average health status score for individuals who are reporting that they have a long-term condition
Numerator Sum of weighted EQ-5DTM values
Denominator Sum of weighted responses (wt_new)
Average health status Weighted average health status score for all GP Patient score for all GP Patient Survey respondents Survey respondents

NHS Outcomes Framework 2014/15: 2.5 – Employment of people with mental illness
46
2.5 Employment of people with mental illness
Revision history
Version Date Summary of Changes
1.0 November 2011 First release
1.1 March 2012 Breakdown details added
1.2 September 2012 Further breakdown details added
1.3 September 2013 Additional data points added
1.4 February 2014 Additional data points added
1.5 May 2014 Release with latest data
1.6 August 2014 Release with latest data
Indicator assurance
Status Date
Methodology Review Group assured
June 2011
Overview
Indicator title
2.5 Employment of people with mental illness
Indicator family name
NHS Outcomes Framework - Domain 2: Enhancing quality of life for people with long-term conditions
Improvement area – Enhancing quality of life for people with mental illness
Health and Social Care Information Centre Indicator Portal code
I00710
Outcome sought
Improved employment rates for people with mental illness.

NHS Outcomes Framework 2014/15: 2.5 – Employment of people with mental illness
47
Detailed Descriptor
Plain English description
This indicator measures the extent to which people with mental illness in England are able to live as normal a life as possible, by looking at their levels of employment. In particular, the indicator measures the difference between:
a) the proportion of people in the general working age population who are in employment, and
b) the proportion of people of working age with a mental illness who are in employment.
Technical description
The percentage point difference between the rate of employment in the general working age population (aged 16-64) and the rate of employment amongst those working age adults self-reporting a mental illness. Both component employment rates are reported alongside the indicator.
Alignment with other Outcomes Frameworks
Complementary with Adult Social Care Outcomes Framework Indicators 1E and 1F and Public Health Outcomes Framework Indicator 1.8
Data sources
Labour Force Survey (LFS), provided by the Office for National Statistics (ONS). Published quarterly and available six months after the end of the relevant quarter.
Construction
Calculation methodology
Introduction
The indicator is given by the difference between the employment rate for all people of working age in England and the employment rate for people of working age who report a mental illness. Three figures will be reported:
1. The employment rate for all people in England;
2. The employment rate for people with mental illness in England;
3. The gap in employment rates between those with mental illness and the total population (1 – 2).
Indicator 2.5 is the last of these three figures.
Please note that the definition of each LFS variable used to construct Indicator 2.5 is set out in Annex A. For clarity, LFS variable names are written in upper case throughout. All LFS data are weighted by person-level weights (PWT10).

NHS Outcomes Framework 2014/15: 2.5 – Employment of people with mental illness
48
Data filters
Data are filtered out if the respondent’s country of residence is not England (COUNTRY≠1).
Calculation
Employment rate in the general working age population
Denominator
Number of people who are of working age. An LFS respondent is included in the denominator if:
• MF1664 = 1 (respondent is of working age)
Numerator
Number of people of working age who are in employment. An LFS respondent is included in the numerator if:
• INECAC05 = 1, 2, 3 or 4 (Respondent is either Employee (1), Self-employed (2), Government employment & training programmes (3), or Unpaid family worker (4) – This is the ILO definition of Basic economic activity)
AND
• MF1664 = 1 (respondent is of working age)
Employment rate of people with mental illness
Denominator
Number of people with a mental illness of working age. An LFS respondent is included in the denominator if:
• LNGLST = 1 (the respondent has a health problem or disabilities that they expect will last for more than a year)
Note: LNGLIM was used prior to 2013 Q2
AND
• HEAL = 12, 14 or 15 (the respondent has Depression, bad nerves or anxiety (12) Severe or specific learning difficulties (mental handicap) (14) or Mental illness, or suffer from phobia, panics or other nervous disorders (15))
AND
• MF1664 = 1 (respondent is of working age)
Numerator
Number of people with a mental illness in employment and of working age. An LFS respondent is included in the numerator if:
• LNGLST = 1 (the respondent has a health problem or disabilities that they expect will last for more than a year)
Note: LNGLIM was used prior to 2013 Q2 – see comment in 2.2 about time series.

NHS Outcomes Framework 2014/15: 2.5 – Employment of people with mental illness
49
AND
• HEAL = 12, 14 or15 (the respondent has Depression, bad nerves or anxiety (12) Severe or specific learning difficulties (mental handicap) (14) or Mental illness, or suffer from phobia, panics or other nervous disorders (15))
AND
• INECAC05=1, 2, 3, or 4 (Respondent is either Employee (1), Self-employed (2), Government employment & training programmes (3), or Unpaid family worker (4) – This is the ILO definition of Basic economic activity)
AND
• MF1664 = 1 (respondent is of working age)
Difference between employment rate of the general working age population and employment rate of people with mental illness
Employment rate of population - Employment rate of people with mental illness
Breakdown variables
The following LFS variables were used to disaggregate the England-level figures:
1. Breakdown Age (banded)
Field Name AGE
2. Breakdown Sex
Field Name SEX
3. Breakdown Unitary Authority/Local Area
Field Name UALA
4. Breakdown Government Office Regions
Field Name GOVTOF
6. Breakdown Ethnicity
Field Name ETH01 to end 2010 and then replaced by ETH11EW
7. Breakdown Religion
Field Name RELIG to end 2010 and then replaced by RELIGE
8. Breakdown Illness
Field Name Learning difficulty / disability: HEAL = 14 (Severe or specific learning difficulties (mental handicap))
Mental illness: HEAL = 12 or 15 (the respondent has Depression, bad nerves or anxiety (12) or Mental illness, or suffer from phobia, panics or other nervous disorders (15))

NHS Outcomes Framework 2014/15: 2.5 – Employment of people with mental illness
50
Presentation
Breakdowns
Time periods
Quarterly data from 2006 for England
Demographic
Breakdowns by gender and 5-year age band, religion, NS-SEC category and ethnicity
Geographic
Breakdowns by region and local authority
Other
Breakdowns by condition (learning disability and mental illness)
Excel and CSV output
Column name Output
Year Year of coverage
Quarter Quarter of coverage
Period of coverage Period of coverage
Breakdown Gender, age, ethnicity, region, local authority, NS-SEC, religion, illness
Level Further description of breakdown
Employment rate of population Rate calculated from the population numerator and denominator
Employment rate of people with Rate calculated from the mental illness numerator and denominator
Indicator value Difference between employment rate of population and employment rate of people with mental illness
Population numerator Number of people who are in employment and of working age
Population denominator Number of people who are of working age
Mental illness numerator Number of people with a mental illness in employment and of working age
Mental illness denominator Number of people with a mental illness of working age

NHS Outcomes Framework 2014/15: 2.6.i – Estimated diagnosis rate for people with dementia
51
2.6.i Estimated diagnosis rate for people with dementia
Revision history
Version Date Summary of Changes
1.0 September 2012 First release
1.1 June 2013 Second release
1.2 December 2013 Release with latest data
Indicator assurance
Status Date
Methodology Review Group assured
Failed assurance at IGB (last presented November 2012)
Overview
Indicator title
2.6.i Estimated diagnosis rate for people with dementia
Indicator family name
NHS Outcomes Framework – Domain 2: Enhancing quality of life for people with long-term conditions
Improvement area – Enhancing quality of life for people with dementia
Health and Social Care Information Centre Indicator Portal code
I00744
Outcome sought
Enhancing quality of life for people with dementia.
Detailed Descriptor
Plain English description
Not all people who have dementia are diagnosed with the condition. This indicator measures the number of people that have been diagnosed with dementia as a proportion of the number who are estimated to have the condition.
NHS Outcomes Framework 2014/15: 2.6.i – Estimated diagnosis rate for people with dementia
52
Technical description
Estimated diagnosis rate for dementia. The estimate of the number of people with dementia is based on published research.
Alignment with other Outcomes Frameworks
Shared with Public Health Outcomes Framework Indicator 4.16
Data sources
Denominator:
Annual England mid-year population estimates up to age 89 and England population estimates for the very eldery (90+) provided by the Office for National Statistics (ONS), available approximately six months after the end of the financial year (November).
http://www.ons.gov.uk/ons/rel/pop-estimate/population-estimates-for-england-and-wales/mid-2012/index.html
http://www.ons.gov.uk/ons/publications/re-reference-tables.html?edition=tcm%3A77-223697
Estimated prevalence rates for dementia from the age of 40 by 5-year age group and gender sourced from the Dementia UK report (2007)
http://alzheimers.org.uk/site/scripts/download.php?fileID=2 (pages 13 and 39).
The prevalence rates are based on published research and are not updated regularly.
Numerator:
The number of people diagnosed with dementia is from the HSCIC Quality and Outcomes Framework dataset (QOF)
http://www.hscic.gov.uk/qof (England level: Prevalence data tables [.xls]). Available annually.
1. QOF prevalence data are available annually.
2. ONS population estimates are available annually.
3. Prevalence rates are based on published research and are not updated regularly.
Construction
Calculation methodology
Introduction
Not everyone with dementia has a clinical diagnosis. This indicator measures the number of people with a diagnosis of dementia as a proportion of the number estimated to have the condition.

NHS Outcomes Framework 2014/15: 2.6.i – Estimated diagnosis rate for people with dementia
53
Numerator
The numerator is given by the number of people who are on their GP Practice’s dementia register, as recorded in QOF. People are likely to enter the dementia register after a secondary care episode or as a result of their GP’s clinical judgement. It is possible, however, that a patient has a clinical diagnosis of dementia but this has not been captured in the condition register. The following table shows the number of people diagnosed with dementia, based on QOF data:
Denominator
The denominator is based on estimated prevalence rates for dementia, published by the Alzheimer’s Society in 2007, and ONS population estimates. Estimated prevalence rates are based on a Delphi consensus exercise, and are viewed as the most authoritative to date (see the Dementia UK report). The prevalence rates from the age of 40 to 95+ are applied to England population figures by 5-year age-band to derive an estimate of the total number of people with dementia in England. Although prevalence rates for age groups 30-34 and 35-39 are available these are excluded from the calculation of the indicator values. This is based on the original calculation proposal as presented to the Methodology Review Group (MRG) in August 2012.
The prevalence rates used are set out in the following table:
Age Population Prevalence (%)
40-44 0.0140
45-49 0.0304
50-54 0.0583
55-59 0.1368
60-64 0.1557
65-69 1.3
70-74 2.9
7 Knapp et al (2007) Dementia UK: The Full Report. Alzheimer’s Society. Available online at:
http://www.alzheimers.org.uk/site/scripts/download_info.php?fileID=2
Year Number of people with a dementia diagnosis
2007/08 220,246
2008/09 232,430
2009/10 249,463
2010/11 266,697
2011/12 293,738
2012/13 318,669

NHS Outcomes Framework 2014/15: 2.6.i – Estimated diagnosis rate for people with dementia
54
Age Population Prevalence (%)
75-79 5.9
80-84 12.2
85-89 20.3
90-94 28.6
95+ 32.5
Recent and on-going research into dementia prevalence (for example, findings from the CFAS II study8) will be analysed, and where a more authoritative estimate is identified, prevalence rates will be updated in due course.
Calculation
Numerator
( )
Where i = 1, …, 8245 is the GP Practice
Denominator
( )
Where j = 40-44, 45-49, 50-54, …, 90-94, 95+ is the age group
Presentation
Breakdowns
Time periods
Annual data from 2007/08 for England
8 Matthews F et al. (2013) A two-decade comparison of prevalence of dementia in individuals aged 65 years
and older from three geographical areas of England: results of the Cognitive Function and Ageing Study I and II. July, Lancet.

NHS Outcomes Framework 2014/15: 2.6.i – Estimated diagnosis rate for people with dementia
55
Excel and CSV output
Column name Output
Year Year of coverage
Period of coverage The exact dates of coverage
Breakdown National level only
Level Further description of breakdown (currently not applicable as national level only)
Indicator value Estimated diagnosis rate (number of people diagnosed/estimated prevalence)
Notes where applicable

NHS Outcomes Framework 2014/15: Domain 2 Appendices
56
Domain 2 Appendices
Appendix 1 - Definition of each LFS variable used to construct indicator 2.2
LFS Variable Name LFS Variable Definition
COUNTRY Residential details – country within UK
MF1664 Males and females aged 16-64
INECAC05 Basic economic activity (ILO definition) (reported)
LNGLIM Whether health problem lasting more than 12 months
HEAL Lists the respondent’s health problems
AGE Age of respondent
SEX Sex of respondent
UALA Unitary Authority/Local Authority
GOVTOF Government Office Regions – Summary
ETH01 Ethnic Group
ETH11EW
Based on the question: ‘What is your ethnic group? I will read out the options. Please choose one option that best describes your ethnic group or background.’
RELIG Religion
RELIGE Based on the question: ‘What is your religion?’
PWT10 Person weight

NHS Outcomes Framework 2014/15: Domain 2 Appendices
57
Appendix 2 - Primary diagnoses for chronic ambulatory care sensitive conditions for indicator 2.3.i
ICD–10 codes Condition group and cause
Infections
B18.0, B18.1 Chronic viral hepatitis B without delta-agent (B18.0) and with delta-agent (B18.1) (excluding people with a secondary diagnosis of D57 (sickle-cell disorders)
Nutritional, endocrine and metabolic
E10, E11, E12, E13, E14 Diabetes
Diseases of the blood
D50.1, D50.8, D50.9, D51, D52
Iron deficiency anaemia: D50.1 Sideropenic dysphagia, D50.8 Other iron deficiency anaemias, D50.9 Iron deficiency anaemia, unspecified, D51 Vitamin B12 deficiency anaemia, D52 Folate deficiency anaemia
Mental and behavioural disorders
F00, F01, F02, F03 Dementia
Neurological disorders
G40, G41 Convulsions and Epilepsy
Cardiovascular diseases
I11.0, I50, J81X, I13.0. (excluding OPCS4 codes: K0, K1, K2, K3, K4, K50, K52, K55, K56, K57, K60, K61, K66, K67, K68, K69, K71).
Congestive heart failure: I11.0 Hypertensive heart disease with (congestive) heart failure, I50 Heart failure, J81X Pulmonary oedema, I13.0 Hypertensive heart and renal disease with (congestive) heart failure.
I20, I25. OPCS4 codes excluded: A, B, C, D, E, F, G, H, I, J, K, L, M, N, O, P, Q, R, S, T, V, W, X0, X1, X2, X4, X5
Angina
I10X, I11.9. OPCS4 codes excluded: K0, K1, K2, K3, K4, K50, K52, K55, K56, K57, K60, K61, K66, K67, K68, K69, K71
Hypertension
148X Atrial fibrillation and flutter

NHS Outcomes Framework 2014/15: Domain 2 Appendices
58
ICD–10 codes Condition group and cause
Respiratory diseases
J20, J41, J42X, J43, J44, J47X. J20 only with second diagnosis of J41, J42, J43, J44, J47
Chronic obstructive pulmonary disease
J45, J46X Asthma (J45) and Status asthmaticus (J46)

NHS Outcomes Framework 2014/15: Domain 2 Appendices
59
Appendix 3 – ICD-10 codes for indicator 2.3.ii
ICD–10 codes Condition group and cause
Nutritional, endocrine and metabolic
E10 Diabetes
Neurological disorders
G40, G41 Convulsions and Epilepsy
Respiratory diseases
J45, J46X Asthma (J45) and Status asthmaticus (J46)