
NHS Expenditure Since 1948
11
NHS funding and expenditure Standard Note: SN/SG/724 Last updated: 03 April 2012 Author: Rachael Harker, Social and General Statistics Expenditure on the NHS has risen rapidly and consistently since it was established on 5 th July 1948. In the first full year of its operation, the Government spent £11.4bn on health in the UK. In 2010/11, the figure was over ten times that amount: £121bn. Growth in health expenditure has far outpaced the rise in both GDP and total public expenditure: each increased by a factor of around 4.8 over this period. Responsibility for health services is devolved to the Scottish, Welsh and Northern Irish administrations. Per head, Northern Ireland spends the most on health services (£2,106 per head in 2010/11) and England spends the least (£1,900 per head). The focus of this note is on the structure, funding process and expenditure of the NHS in England. The structure and expenditure of the UK NHS is described briefly in Section 1. Expenditure in England is dealt with in Section 2. Currently, around 80% of NHS funding in England is allocated to 151 Primary Care Trusts, according to a population and needs-based formula. From this money, PCTs are free to commission health services to meet local needs. Though most commissioning still takes place within the NHS, PCTs are increasingly purchasing services from the independent and voluntary sectors, and from local authorities. Information about the determination of PCTs’ allocations and local variation in funding levels can be found in the Library Standard Note Primary Care Trusts: funding and expenditure . The structural reorganisation proposed in the Department of Health White Paper Equity and Excellence means that the funding system looks set to change. PCTs are to be abolished, with responsibility for local commissioning , and hence the bulk of the NHS budget, passed to groups of GPs. Section 3 gives more detail about the current structure of the NHS in England and the relationship between the different organisations within it. The largest categories of NHS expenditure are mental health services, circulation problems and cancer treatment, which together account for almost a third total expenditure. Section 2.2 gives a detailed breakdown of expenditure by category. For detailed figures showing health expenditure year-by- year in the UK and England, refer to the tables at the end of this note. Headline expenditur e figures are updated on a quarterly basis in the Social Indicators page Health expenditure . Some details of expenditure in each of the devolved assemblies can be found in Table 3 at the end of this note.;
-
Upload
jay-reasty -
Category
Documents
-
view
214 -
download
0
Transcript of NHS Expenditure Since 1948
8/2/2019 NHS Expenditure Since 1948
http://slidepdf.com/reader/full/nhs-expenditure-since-1948 1/11
NHS funding and expenditure
Standard Note: SN/SG/724
Last updated: 03 April 2012
Author: Rachael Harker, Social and General Statistics
Expenditure on the NHS has risen rapidly and consistently since it was established on 5 th July 1948. In the first full year of its operation, the Government spent £11.4bn on health inthe UK. In 2010/11, the figure was over ten times that amount: £121bn. Growth in healthexpenditure has far outpaced the rise in both GDP and total public expenditure: eachincreased by a factor of around 4.8 over this period.
Responsibility for health services is devolved to the Scottish, Welsh and Northern Irishadministrations. Per head, Northern Ireland spends the most on health services (£2,106 perhead in 2010/11) and England spends the least (£1,900 per head).
The focus of this note is on the structure, funding process and expenditure of the NHS inEngland. The structure and expenditure of the UK NHS is described briefly in Section 1.Expenditure in England is dealt with in Section 2.
Currently, around 80% of NHS funding in England is allocated to 151 Primary Care Trusts,according to a population and needs-based formula. From this money, PCTs are free to
commission health services to meet local needs. Though most commissioning still takesplace within the NHS, PCTs are increasingly purchasing services from the independent andvoluntary sectors, and from local authorities. Information about the determination of PCTs’allocations and local variation in funding levels can be found in the Library Standard NotePrimary Care Trusts: funding and expenditure .
The structural reorganisation proposed in the Department of Health White Paper Equity and Excellence means that the funding system looks set to change. PCTs are to be abolished,with responsibility for local commissioning, and hence the bulk of the NHS budget, passed togroups of GPs. Section 3 gives more detail about the current structure of the NHS inEngland and the relationship between the different organisations within it.
The largest categories of NHS expenditure are mental health services, circulation problemsand cancer treatment, which together account for almost a third total expenditure. Section2.2 gives a detailed breakdown of expenditure by category.
For detailed figures showing health expenditure year-by-year in the UK and England, refer tothe tables at the end of this note. Headline expenditure figures are updated on a quarterlybasis in the Social Indicators page Health expenditure . Some details of expenditure in eachof the devolved assemblies can be found in Table 3 at the end of this note.;
8/2/2019 NHS Expenditure Since 1948
http://slidepdf.com/reader/full/nhs-expenditure-since-1948 2/11
Contents
1 The UK NHS 3 1.1 Structure 3 1.2 Sources of funding 3 1.1 Total expenditure 4
2 NHS England - expenditure 5 2.1 Total expenditure 5 2.2 Expenditure by category 6 2.3 Private Finance Initiative (PFI) 7
3 NHS England – funding process 8 4 Tables 9
Table 1: Net government expenditure on the UK NHS: 1950/51 to 2010/11 9 Table 2: NHS net expenditure in England: 1974/75 to 2014/15 10 Table 3: Programme Budgeting estimated England level gross expenditure for all
programmes,2010/11 11 Table 4: NHS net expenditure, £m and per head, UK countries, 2006/07 to 2010/11 11
8/2/2019 NHS Expenditure Since 1948
http://slidepdf.com/reader/full/nhs-expenditure-since-1948 3/11
1 The UK NHS
1.1 Structure
The NHS was established on 5 July 1948, with the aim of providing a comprehensive rangeof health services to all UK citizens, financed by general taxation and free at the point of use.
The responsibility for the provision and development of health services lies ultimately withthe Secretary of State for Health in England, the Minister for Health and Community Care forScotland, the Minister for Health and Social Services for Wales and the Minister for Health,Social Services and Public Safety for Northern Ireland. They are supported by theDepartment of Health in England, the Scottish Executive Department of Health in Scotland,the NHS Directorate in Wales and the Department of Health, Social Services and PublicSafety in Northern Ireland. The Scottish Parliament has competence over health and theNational Assembly for Wales (NAW) has powers to shape the delivery of health services.However, unlike the Scottish Parliament, the NAW does not have law-making power over the
running of the NHS. The Northern Ireland Assembly is intended to take an active role inshaping health services in the Province.
Each country has chosen to structure its National Health Service differently. The structure ofthe NHS in England is described in detail in Section 3. A common theme of NHS fundingacross the countries is the allocation of a significant proportion of the NHS budget to localorganisations (Primary Care Trusts or Health Boards), which are responsible for meetinglocal need. Another common strand is for allocations to these organisations to be informed(but not entirely determined) by a needs-based funding formula, on the principle that it isdesirable to achieve equal access to healthcare for people at equal risk across the country
The key difference between the countries lies in the role of the internal market. England andNorthern Ireland have a ‘purchaser/provider split’, whereby one part of the health service(the purchaser) is responsible for contracting with the NHS and independent-sectororganisations (the providers) to supply services for patients. Scotland and Wales havemoved away from these market-orientated models since devolution: they dismantled thepurchaser-provider split in 2004 and 2009 respectively. Local health boards in thesecountries are now responsible for both funding and provision of NHS services.
1.2 Sources of funding
The vast majority of NHS funding ultimately derives from central (UK) taxation. Within theblock grant allocated to each devolved administration (via the Barnett formula), each country
is free to decide how much to spend on the NHS.
The NHS can also raise income from patient charges, sometimes known as ‘co-payments’.Devolved administrations have control over the level at which these are set.
Prescription charging In England, eligible patients pay a prescription charge of £7.20 per item (or alternatively‘subscription’-type charges). Wales, Scotland and Northern Ireland have abolishedprescription charging. In 2010/11, England raised £450m through the prescription charge(0.5% of the NHS resource budget)1
1Department of Health Resource Accounts 2010/11

8/2/2019 NHS Expenditure Since 1948
http://slidepdf.com/reader/full/nhs-expenditure-since-1948 4/11
Dental Charging All the devolved administrations charge for NHS dental treatment (although exemptionsdiffer). In England, patients pay between £17.50 and £209 depending on the complexity ofwork performed.2 In Wales, the range is £12 to £177. 3 In Northern Ireland, patients pay 80%of the cost of treatment, up to £384; Scotland operates a similar system.
4 Income raisedthrough dental charges amounted to £614.3m in England in 2009/10 5; in Wales, the figurewas £27.3m6.
Other sources of income Other, less significant sources of income are earned, for example, through chargingoverseas visitors and their insurers for the cost of NHS treatment. Hospitals can also raiserevenue through car parking charges, patient telephone services etc. In addition, NHS Trustscan earn income through treating patients privately: in England, NHS Trusts generate 0.6%7
of core revenues from private patients,whereas the proportion remains muchlower in the rest of the UK (0.2% inWales, and 0.1% in Scotland and
Northern Ireland).
1.1 Total expenditure
Chart 1 (also see Table 1) showsexpenditure by central government onhealth8 in the UK, net of receipts frompatients, as a percentage of GDP (topline) and in 2010/11 prices (bottom line).Figures are presented from 1949onwards, although some changes in theresponsibilities of the NHS mean that theseries is not fully consistent over theperiod. In 1950/51 spending amounted to£11.7 billion in 2010/11 prices, or 3.5% ofGDP. By 2010/11, spending hadincreased more than tenfold in real termsto reach £121bn, or 8.2% of GDP.Although it has risen consistently over theperiod, spending has accelerated inrecent years. Between 1999/00 and2009/10, real-terms expenditure rose by92%.
0%
1%
2%
3%
4%
5%
6%
7%
8%
9%
2UK Statutory Instrument 2009/407 The National Health Service (Dental Charges) Amendment Regulations 2009
3Wales Statutory Instrument 2006/491 The National Health Service (Dental Charges) (Wales) Amendment Regulations 2006
4Northern Ireland Statutory Rule 2005/72 and Scotland Statutory Instrument 2005/121/
5NHS Information Centre NHS Dental Services for England 2010/11
6Welsh Assembly Government NHS Dental Services 2010/11
7Figures on income from private patients taken from the NHS Summarised Accounts for England and Wales. In Scotland theyare taken from the NHS Board Operating Costs and Capital Expenditure and in Northern Ireland from the Health and SocialCare Board Annual Accounts.
949
/ 50
952
/ 53
955
/ 56
958
/ 59
961
/ 62
964
/ 65
967
/ 68
970
/ 71
973
/ 74
976
/ 77
979
/ 80
982
/ 83
985
/ 86
988
/ 89
991
/ 92
994
/ 95
997
/ 98
000
/ 01
003
/ 04
006
/ 07
009
/ 10
As% ofGDP
Some local authority services transferred
to central govt
Some health services transferred to personal
social services
0
20
40
60
80
100
120
950 / 51
954 / 55
958 / 59
962 / 63
966 / 67
970 / 71
974 / 75
978 / 79
982 / 83
986 / 87
990 / 91
994 / 95
998 / 99
002 / 03
006 / 07
010 / 11
£bn,2010/11prices
Chart 1 General government expenditure on UK Health
Services: 1950/51 to 2010/11
8/2/2019 NHS Expenditure Since 1948
http://slidepdf.com/reader/full/nhs-expenditure-since-1948 5/11
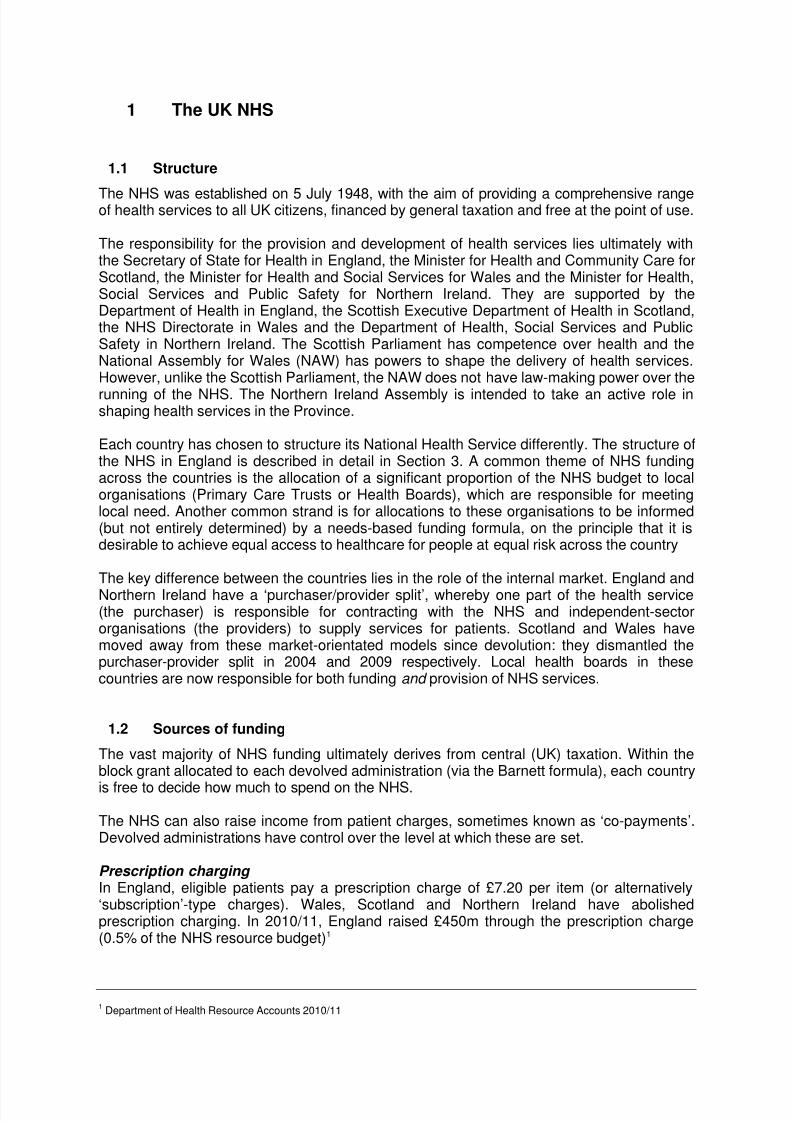
Chart 2 shows the annual percentage changes in real terms central government expenditureNegative change has occurred on just seven occasions; with the largest decreases (-6.3%)occurring in 1953/54. Since 1956/57, the five-year moving average has always beenpositive. The average annual expenditure increase since 1950/51 is 3.8%. However,between 2000/01 and 2004/05 average annual spending growth was 8.8% which is higherthan at any other time in the history of the NHS.
Some health servic es transferred to personal social
services
Some local authority services transferred to central government
-8%
-6%
-4%
-2%
+2%
+4%
+6%
+8%
+10%
+12%
+14%
+16%
1 9 5 0 / 5 1
1 9 5 2 / 5 3
1 9 5 4 / 5 5
1 9 5 6 / 5 7
1 9 5 8 / 5 9
1 9 6 0 / 6 1
1 9 6 2 / 6 3
1 9 6 4 / 6 5
1 9 6 6 / 6 7
1 9 6 8 / 6 9
1 9 7 0 / 7 1
1 9 7 2 / 7 3
1 9 7 4 / 7 5
1 9 7 6 / 7 7
1 9 7 8 / 7 9
1 9 8 0 / 8 1
1 9 8 2 / 8 3
1 9 8 4 / 8 5
1 9 8 6 / 8 7
1 9 8 8 / 8 9
1 9 9 0 / 9 1
1 9 9 2 / 9 3
1 9 9 4 / 9 5
1 9 9 6 / 9 7
1 9 9 8 / 9 9
2 0 0 0 / 0 1
2 0 0 2 / 0 3
2 0 0 4 / 0 5
2 0 0 6 / 0 7
2 0 0 9 / 1 0
2 0 1 0 / 1 1
Five-year moving average
Average 1950/51 - 2010/11
Chart 2: Annual change in real terms general government expenditure on the UK NHS: 1950/51 to 2010/11
2 NHS England - expenditure
2.1 Total expenditure
Table 2 at the end of this note shows NHS public spending and planned expenditure inEngland from 1974/75 to 2014/15, net of patient charges and receipts. Earlier data is notavailable on a consistent basis.
Although real-terms expenditure has risen from £23.7 billion in 1974/75 to £105.0 billion inthe current 2011/12 financial year, changes in accounting procedures preclude consistentcomparisons of spending over long periods. However, year-on-year real-term increases canbe quoted on a consistent basis:
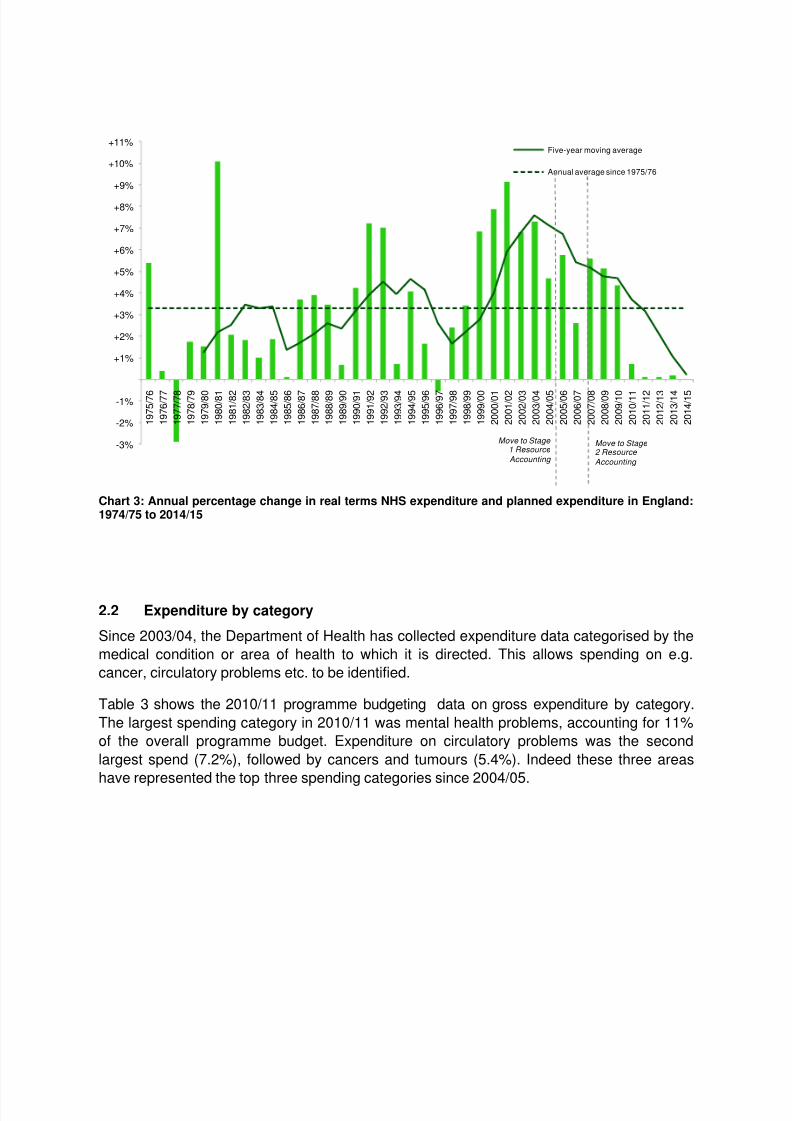
Chart 3 shows the annual real-term increases along with a moving five-year average. Thelargest five-year moving average (+7.6%) occurred over the period 1999/2000 to 2003/04.Based on inflation figures published in the March 2012 Budget, the lowest five-year movingaverage is set to occur over the 2010/11 to 2014/15 period.
8/2/2019 NHS Expenditure Since 1948
http://slidepdf.com/reader/full/nhs-expenditure-since-1948 6/11
-3%
-2%
-1%
+1%
+2%
+3%
+4%
+5%
+6%
+7%
+8%
+9%
+10%
+11%
1 9 7 5 / 7 6
1 9 7 6 / 7 7
1 9 7 7 / 7 8
1 9 7 8 / 7 9
1 9 7 9 / 8 0
1 9 8 0 / 8 1
1 9 8 1 / 8 2
1 9 8 2 / 8 3
1 9 8 3 / 8 4
1 9 8 4 / 8 5
1 9 8 5 / 8 6
1 9 8 6 / 8 7
1 9 8 7 / 8 8
1 9 8 8 / 8 9
1 9 8 9 / 9 0
1 9 9 0 / 9 1
1 9 9 1 / 9 2
1 9 9 2 / 9 3
1 9 9 3 / 9 4
1 9 9 4 / 9 5
1 9 9 5 / 9 6
1 9 9 6 / 9 7
1 9 9 7 / 9 8
1 9 9 8 / 9 9
1 9 9 9 / 0 0
2 0 0 0 / 0 1
2 0 0 1 / 0 2
2 0 0 2 / 0 3
2 0 0 3 / 0 4
2 0 0 4 / 0 5
2 0 0 5 / 0 6
2 0 0 6 / 0 7
2 0 0 7 / 0 8
2 0 0 8 / 0 9
2 0 0 9 / 1 0
2 0 1 0 / 1 1
2 0 1 1 / 1 2
2 0 1 2 / 1 3
2 0 1 3 / 1 4
2 0 1 4 / 1 5
Five-year moving average
Annual average since 1975/76
Move to Stage 1 Resource
Accounting
Move to Stage 2 Resource
Accounting
Chart 3: Annual percentage change in real terms NHS expenditure and planned expenditure in England:1974/75 to 2014/15
2.2 Expenditure by category
Since 2003/04, the Department of Health has collected expenditure data categorised by the
medical condition or area of health to which it is directed. This allows spending on e.g.
cancer, circulatory problems etc. to be identified.
Table 3 shows the 2010/11 programme budgeting data on gross expenditure by category.
The largest spending category in 2010/11 was mental health problems, accounting for 11%
of the overall programme budget. Expenditure on circulatory problems was the second
largest spend (7.2%), followed by cancers and tumours (5.4%). Indeed these three areas
have represented the top three spending categories since 2004/05.

8/2/2019 NHS Expenditure Since 1948
http://slidepdf.com/reader/full/nhs-expenditure-since-1948 7/11

8/2/2019 NHS Expenditure Since 1948
http://slidepdf.com/reader/full/nhs-expenditure-since-1948 8/11
3 NHS England – funding process
The NHS England revenue and capital budgets are announced in the Department ofHealth’s expenditure plans, published as part of each Spending Review. Around 80% of
NHS funding (£89bn in 2011/12) is allocated to the 151 Primary Care Trusts (PCTs), whichare responsible for commissioning (i.e. purchasing) health services to meet local need. Themoney PCTs receive is non-ringfenced, though some constraints exist, such as therequirement to fund drugs that the National Institute for Health and Clinical Excellence(NICE) has endorsed, and the achievement of centrally determined policy objectives such asthe reduction of health inequalities. Allocations to PCTs are usually announced in the NHSOperating Framework to cover the Spending Review period. They are informed, but notentirely determined by, a needs-based formula which aims to provide equal levels of accessto health services for people at equal risk, and reduce avoidable health inequalities. Thedetermination PCT allocations is described in more detail in the Library Standard Note <><>.
Funds flow from PCTs to NHS hospitals and other providers either via contracts, or through
a system known as Payment by Results, which uses a “tariff” based on national averagecosts for each type of treatment. More details on the commissioning role of PCTs can befound in the Library Standard Note NHS Commissioning .
The remaining 20% of the NHS budget comprises capital spending, and funds distributed todeliver regional and national programmes and services. For instance, Strategic HealthAuthorities receive around £6bn for local management of national programmes (e.g. theNational Screening Programme) and for delivery of education and training for the NHSworkforce. Separately, funding is also provided to some Special Health Authorities providingnational-level services (e.g. the NHS Blood and Transplant authority; the NHS LitigationAuthority).
Capital resources are allocated to PCTs and directly to NHS Trusts each year based onfinancial plan returns. Other budgets, such as those for Strategic Health Authorities, Arm’sLength Bodies etc. are centrally determined each year by the Department of Health.
8/2/2019 NHS Expenditure Since 1948
http://slidepdf.com/reader/full/nhs-expenditure-since-1948 9/11
4 Tables
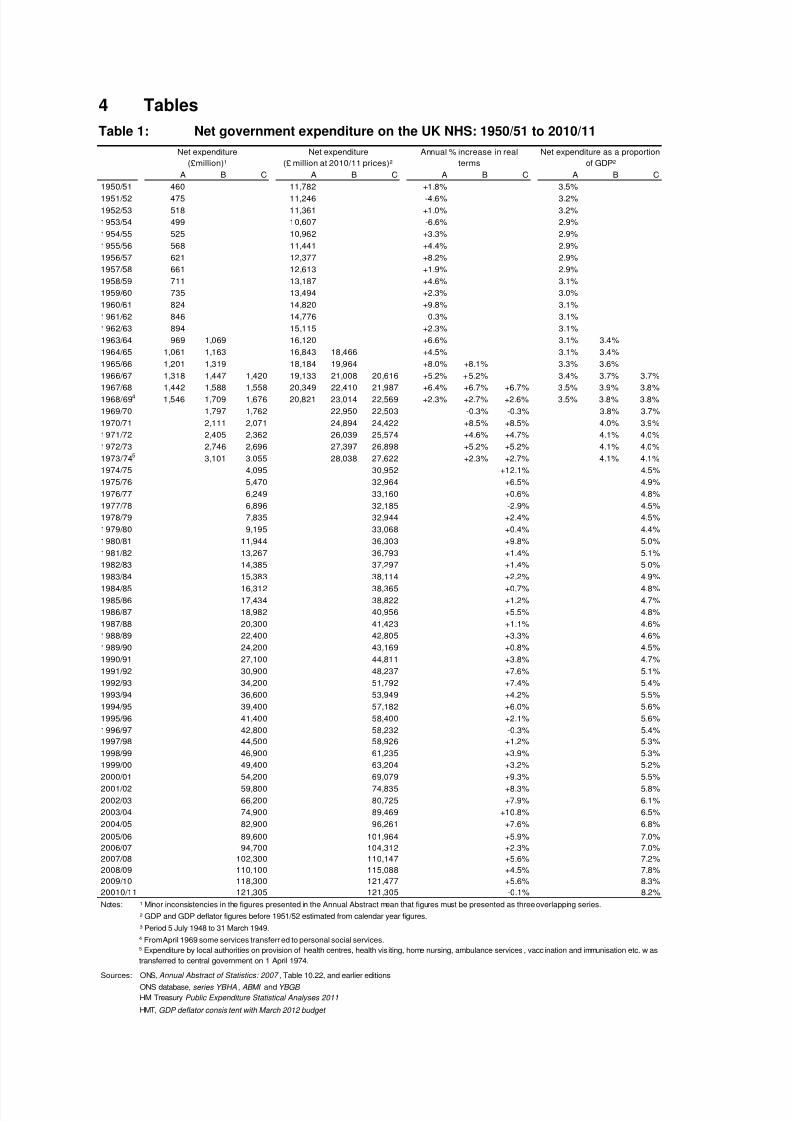
Table 1: Net government expenditure on the UK NHS: 1950/51 to 2010/11
A B C A B C A B C A B C
1950/51 460 11,782 +1.8% 3.5%
1951/52 475 11,246 -4.6% 3.2%
1952/53 518 11,361 +1.0% 3.2%
1953/54 499 10,607 -6.6% 2.9%
1954/55 525 10,962 +3.3% 2.9%
1955/56 568 11,441 +4.4% 2.9%
1956/57 621 12,377 +8.2% 2.9%
1957/58 661 12,613 +1.9% 2.9%
1958/59 711 13,187 +4.6% 3.1%
1959/60 735 13,494 +2.3% 3.0%
1960/61 824 14,820 +9.8% 3.1%
1961/62 846 14,776 -0.3% 3.1%
1962/63 894 15,115 +2.3% 3.1%
1963/64 969 1,069 16,120 +6.6% 3.1% 3.4%
1964/65 1,061 1,163 16,843 18,466 +4.5% 3.1% 3.4%
1965/66 1,201 1,319 18,184 19,964 +8.0% +8.1% 3.3% 3.6%
1966/67 1,318 1,447 1,420 19,133 21,008 20,616 +5.2% +5.2% 3.4% 3.7% 3.7%
1967/68 1,442 1,588 1,558 20,349 22,410 21,987 +6.4% +6.7% +6.7% 3.5% 3.9% 3.8%
1968/694 1,546 1,709 1,676 20,821 23,014 22,569 +2.3% +2.7% +2.6% 3.5% 3.8% 3.8%
1969/70 1,797 1,762 22,950 22,503 -0.3% -0.3% 3.8% 3.7%
1970/71 2,111 2,071 24,894 24,422 +8.5% +8.5% 4.0% 3.9%
1971/72 2,405 2,362 26,039 25,574 +4.6% +4.7% 4.1% 4.0%
1972/73 2,746 2,696 27,397 26,898 +5.2% +5.2% 4.1% 4.0%
1973/745
3,101 3,055 28,038 27,622 +2.3% +2.7% 4.1% 4.1%
1974/75 4,095 30,952 +12.1% 4.5%
1975/76 5,470 32,964 +6.5% 4.9%
1976/77 6,249 33,160 +0.6% 4.8%
1977/78 6,896 32,185 -2.9% 4.5%
1978/79 7,835 32,944 +2.4% 4.5%
1979/80 9,195 33,068 +0.4% 4.4%
1980/81 11,944 36,303 +9.8% 5.0%
1981/82 13,267 36,793 +1.4% 5.1%
1982/83 14,385 37,297 +1.4% 5.0%
1983/84 15,383 38,114 +2.2% 4.9%
1984/85 16,312 38,365 +0.7% 4.8%1985/86 17,434 38,822 +1.2% 4.7%
1986/87 18,982 40,956 +5.5% 4.8%
1987/88 20,300 41,423 +1.1% 4.6%
1988/89 22,400 42,805 +3.3% 4.6%
1989/90 24,200 43,169 +0.8% 4.5%
1990/91 27,100 44,811 +3.8% 4.7%
1991/92 30,900 48,237 +7.6% 5.1%
1992/93 34,200 51,792 +7.4% 5.4%
1993/94 36,600 53,949 +4.2% 5.5%
1994/95 39,400 57,182 +6.0% 5.6%
1995/96 41,400 58,400 +2.1% 5.6%
1996/97 42,800 58,232 -0.3% 5.4%
1997/98 44,500 58,926 +1.2% 5.3%
1998/99 46,900 61,235 +3.9% 5.3%
1999/00 49,400 63,204 +3.2% 5.2%
2000/01 54,200 69,079 +9.3% 5.5%
2001/02 59,800 74,835 +8.3% 5.8%
2002/03 66,200 80,725 +7.9% 6.1%
2003/04 74,900 89,469 +10.8% 6.5%
2004/05 82,900 96,261 +7.6% 6.8%
2005/06 89,600 101,964 +5.9% 7.0%
2006/07 94,700 104,312 +2.3% 7.0%
2007/08 102,300 110,147 +5.6% 7.2%
2008/09 110,100 115,088 +4.5% 7.8%
2009/10 118,300 121,477 +5.6% 8.3%
20010/11 121,305 121,305 -0.1% 8.2%
Notes: ¹ Minor inconsistencies in the figures presented in the Annual Abstract mean that figures must be presented as three overlapping series.
² GDP and GDP deflator figures before 1951/52 estimated from calendar year figures.
³ Period 5 July 1948 to 31 March 1949.
4 From April 1969 some services transferred to personal social services.
Sources: ONS, Annual Abstract of Statistics: 2007 , Table 10.22, and earlier editions
ONS database, series YBHA , ABMI and YBGB
HMT, GDP deflator consis tent with March 2012 budget
HM Treasury Public Expenditure Statistical Analyses 2011
5 Expenditure by local authorities on provision of health centres, health vis iting, home nursing, ambulance services , vacc ination and immunisation etc. w as
transferred to central government on 1 April 1974.
Net expenditure
(£million)¹
Net expenditure
(£ million at 2010/11 prices)²
Annual % increase in real
terms
Net expenditure as a proportion
of GDP²

8/2/2019 NHS Expenditure Since 1948
http://slidepdf.com/reader/full/nhs-expenditure-since-1948 10/11
Table 2: NHS net expenditure in England: 1974/75 to 2014/15
2010/11 prices
(£billions)
Real terms change
(%)
Cash prices
(£)
2010/11 prices
(£)
Cash
1974/75 25.2 11.3% 204 1,5431975/76 26.6 5.4% 268 1,616
1976/77 26.7 0.4% 304 1,612
1977/78 25.9 -2.9% 333 1,554
1978/79 26.4 1.7% 373 1,570
1979/80 26.8 1.5% 440 1,582
1980/81 29.5 10.1% 568 1,727
1981/82 30.1 2.1% 625 1,734
1982/83 30.6 1.8% 677 1,756
1983/84 31.0 1.0% 710 1,760
1984/85 31.5 1.9% 755 1,776
1985/86 31.6 0.1% 790 1,759
1986/87 32.7 3.7% 837 1,806
1987/88 34.0 3.9% 909 1,855
1988/89 35.2 3.5% 993 1,8971989/90 35.4 0.7% 1,058 1,886
1990/91 36.9 4.2% 1,177 1,946
1991/92 39.6 7.2% 1,323 2,065
1992/93 42.4 7.0% 1,450 2,196
1993/94 42.7 0.7% 1,492 2,200
1994/95 44.4 4.1% 1,568 2,276
1995/96 45.1 1.6% 1,630 2,300
1996-97 44.9 -0.5% 1,673 2,276
1997/98 45.9 2.2% 1,749 2,316
1998/99 47.8 4.1% 1,837 2,399
1999/00 51.0 6.8% 1,989 2,545
Stage 1 Resource Basis
1999/00 51.4 - 2,005 2,565
2000/01 56.0 8.9% 2,172 2,769
2001/02 61.3 9.6% 2,389 2,989
2002/03 65.9 7.4% 2,608 3,180
Stage 2 Resource Basis
2002/03 69.6 - 2,753 3,357
2003/04¹ 76.7 10.2% 3,070 3,667
2004/05 80.2 4.6% 3,278 3,807
2005/06 84.7 5.6% 3,494 3,976
2006/07 86.9 2.7% 3,667 4,039
2007/08 92.4 6.3% 3,945 4,247
2008/09 96.6 4.6% 4,209 4,400
2009/10 102.5 6.1% 4,511 4,511
2010/11 102.0 102.0 -0.5% 4,618 4,488
2011/122 105.0 102.7 0.7% 4,656 4,440
2012/132 108.8 103.7 0.9% 4,710 4,391
2013/142 111.4 103.5 -0.1% 4,784 4,347
2014/152 103.7 0.2% 4,856 4,297
Notes:
2 Plan.
Sources: 1974/75 - 1984/85: HMT, The Government's Expenditure Plans , various years
1985/86 - 1992/93: Department of Health, Departmental Reports , various years
1993/94 - 2003/04:
2004/05 - 2010/11: HM Treasury Public Expenditure Statistical Analyses 2011, Table 1.8
2011/12 - 2014/15: HM Treasury Budget March 2012
HMT, GDP deflator consistent with March 2012 budget
Health Committee, Public Expenditure on Health and Personal Social Services 2006: Memorandum
received from the Department of Health containing Replies to a Written Questionnaire from the
Committee , HC 1692-I, 26 October 2006, Table 1a
69.1
74.4
78.9
85.8
¹ The diff erence betw een 2002-03 and 2003-04 is artif icially high ow ing to HMT classification changes. How ever, the real terms
increase is adjusted for this.
92.4
114.4
99.8
49.0
54.0
57.0
64.2
36.6
39.9
40.2
43.9
30.6
32.0
33.0
34.7
28.9
28.0
19.9
14.2
10.9
11.8
12.5
13.4
15.2
16.7
18.4
22.3
25.4
Net NHS expenditure per household
Cash prices
(£billions)
Net NHS expenditure
6.3
7.4
9.7
3.34.4
5.0
5.6

8/2/2019 NHS Expenditure Since 1948
http://slidepdf.com/reader/full/nhs-expenditure-since-1948 11/11
Table 3: Programme Budgeting estimated England level gross expenditure for allprogrammes,2010/11
£ billions
2010/11
% of programme
budget
Infectious Diseases 1.80 1.7%
Cancers & Tumours 5.81 5.4%
Disorders of Blood 1.36 1.3%
Endocrine, Nutritional and Metabolic Problems 3.00 2.8%
Mental Health Disorders 11.91 11.1%
Problems of Learning Disability 2.90 2.7%
Neurological 4.30 4.0%
Problems of Vision 2.14 2.0%
Problems of Hearing 0.45 0.4%
Problems of Circulation 7.72 7.2%
Problems of the Respiratory System 4.43 4.1%
Dental Problems 3.31 3.1%
Problems of the Gastro Intestinal System 4.43 4.1%Problems of the Skin 2.13 2.0%
Problems of the Musculoskeletal System 5.06 4.7%
Problems due to Trauma and Injuries 3.75 3.5%
Problems of the Genito Urinary System 4.78 4.5%
Maternity and Reproductive Health 3.44 3.2%
Conditions of Neonates 1.05 1.0%
Adverse Effects and Poisoning 0.96 0.9%
Healthy Individuals 2.15 2.0%
Social Care Needs 4.18 3.9%
Other Areas of Spend/Conditions 25.95 24.3%
Total 107.00 100.0%
Source: Department of Health:Programme Budget National Level Expenditure Data 2010/11
Table 4: NHS net expenditure, £m and per head, UK countries, 2006/07 to 2010/11
England Wales Scotland N. Ireland England Wales Scotland N. Ireland
2006/07 76,926 5,000 9,035 2,961 1,515 1,688 1,766 1,700
2007/08 83,335 5,273 9,727 3,055 1,631 1,772 1,891 1,736
2008/09 90,035 5,562 10,179 3,299 1,749 1,860 1,969 1,859
2009/10 97,272 5,917 10,593 3,443 1,877 1,973 2,040 1,924
2010/11 99,249 6,065 10,821 3,790 1,900 2,017 2,072 2,106
Source: Public Expenditure Statistical Analyses, October 2011 update
Total expenditure, £m Expenditure per head, £Year
Note: figures for England may not be consistent with those in Table 2 because they are calculated on a different basis (HMTTotal Expenditure on Services aggregate, rather than Resource Accounting basis)


![The Employees State Insurance Act 1948 - ... State Insurance Act 1948... · THE EMPLOYEES' STATE INSURANCE ACT, 1948 ACT NO. 34 OF 1948 1* [19th April, 1948.] An Act to provide for](https://static.fdocuments.in/doc/165x107/5aa59b087f8b9ab4788d5d44/the-employees-state-insurance-act-1948-state-insurance-act-1948the-employees.jpg)


