NHS Eastern and Coastal Kent Health investment slide pack July 2010 QIPP Right Care.
42
NHS Eastern and Coastal Kent Health investment slide pack July 2010 QIPP Right Care
-
Upload
cory-jackson -
Category
Documents
-
view
215 -
download
1
Transcript of NHS Eastern and Coastal Kent Health investment slide pack July 2010 QIPP Right Care.
NHS Eastern and Coastal Kent Health investment slide pack
July 2010
QIPP Right Care
2
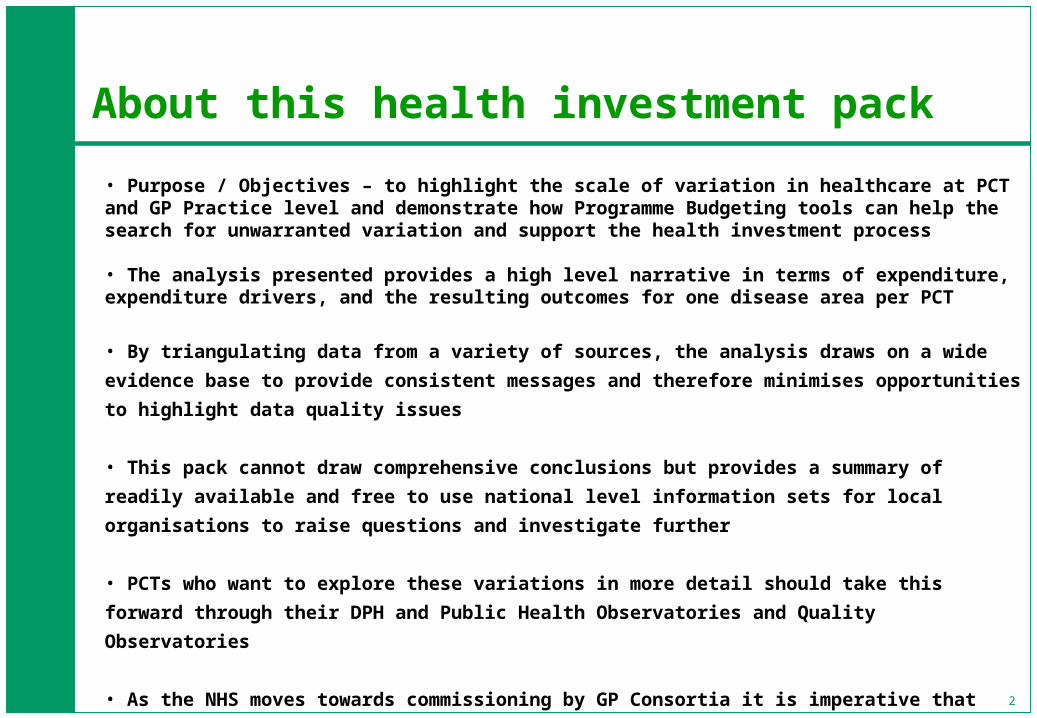
About this health investment pack
• Purpose / Objectives – to highlight the scale of variation in healthcare at PCT and GP Practice level and demonstrate how Programme Budgeting tools can help the search for unwarranted variation and support the health investment process
• The analysis presented provides a high level narrative in terms of expenditure, expenditure drivers, and the resulting outcomes for one disease area per PCT
• By triangulating data from a variety of sources, the analysis draws on a wide evidence base to provide
consistent messages and therefore minimises opportunities to highlight data quality issues
• This pack cannot draw comprehensive conclusions but provides a summary of readily available and
free to use national level information sets for local organisations to raise questions and investigate
further
• PCTs who want to explore these variations in more detail should take this forward through their DPH
and Public Health Observatories and Quality Observatories
• As the NHS moves towards commissioning by GP Consortia it is imperative that PCTs establish a
clear framework and evidence base for making and evaluating health investment decisions

3
Summary
These slides use Programme Budgeting tools to show that
Eastern and Coastal Kent PCT has;
• Increased expenditure on Respiratory problems in the last three years but relatively low inpatient spend
• High Mortality rates from COPD
• Low Prescribing expenditure on Respiratory system problems
• High Prevalence of COPD in QOF
• High Non elective admissions with low spell length of stay
• Large variations in Respiratory admissions at practice level.

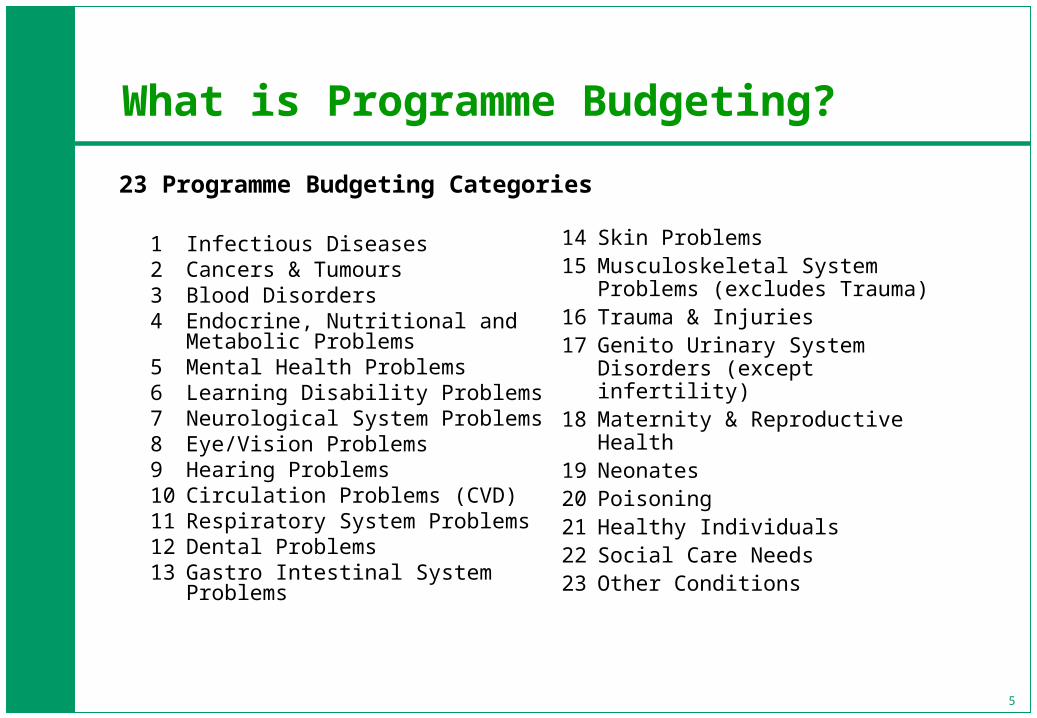
What is Programme Budgeting?
Programme Budgeting:- Outlines how PCTs cut their cake in terms of 23 ICD 10 defined programme
budgeting categories; hence is a
- a retrospective appraisal of resource allocation broken down into ‘programmes’ - with a view to influencing and tracking future expenditure in those same programmes.
- Allows for cross sectional and time series comparisons, at England, SHA, PCT and increasingly, practice Level.
Marginal Analysis
- An appraisal of the added costs and added benefits when the resources in programmes are increased, or deployed in new ways.
- Programme Budgeting and Marginal Analysis provides a framework to help commissioners make, track and evaluate health investment decisions.
5
23 Programme Budgeting Categories
1 Infectious Diseases2 Cancers & Tumours3 Blood Disorders4 Endocrine, Nutritional and Metabolic
Problems5 Mental Health Problems6 Learning Disability Problems7 Neurological System Problems8 Eye/Vision Problems9 Hearing Problems10 Circulation Problems (CVD)11 Respiratory System Problems12 Dental Problems13 Gastro Intestinal System Problems
14 Skin Problems15 Musculoskeletal System Problems
(excludes Trauma)16 Trauma & Injuries17 Genito Urinary System Disorders
(except infertility)18 Maternity & Reproductive Health19 Neonates20 Poisoning21 Healthy Individuals22 Social Care Needs23 Other Conditions
What is Programme Budgeting?

6
2007/08 and 2008/09 Programme Level Expenditure for England
Information Available for PCTs
This pack will provide an update on the products available to commissioners including:
• Programme Budgeting Spreadsheet;• SPOT (Spend & Outcome Tool);• Programme Budgeting Atlas;• NHS Comparators.• Inpatient Variation Expenditure Tool (IVET)
These tools allow commissioners to compare expenditure and outcomes at disease level.
To access these tools visit;
www.networks.nhs.uk/nhs-networks/health-investment-network/key-tools
These tools are a starting point for the process of making health investment decisions.
8
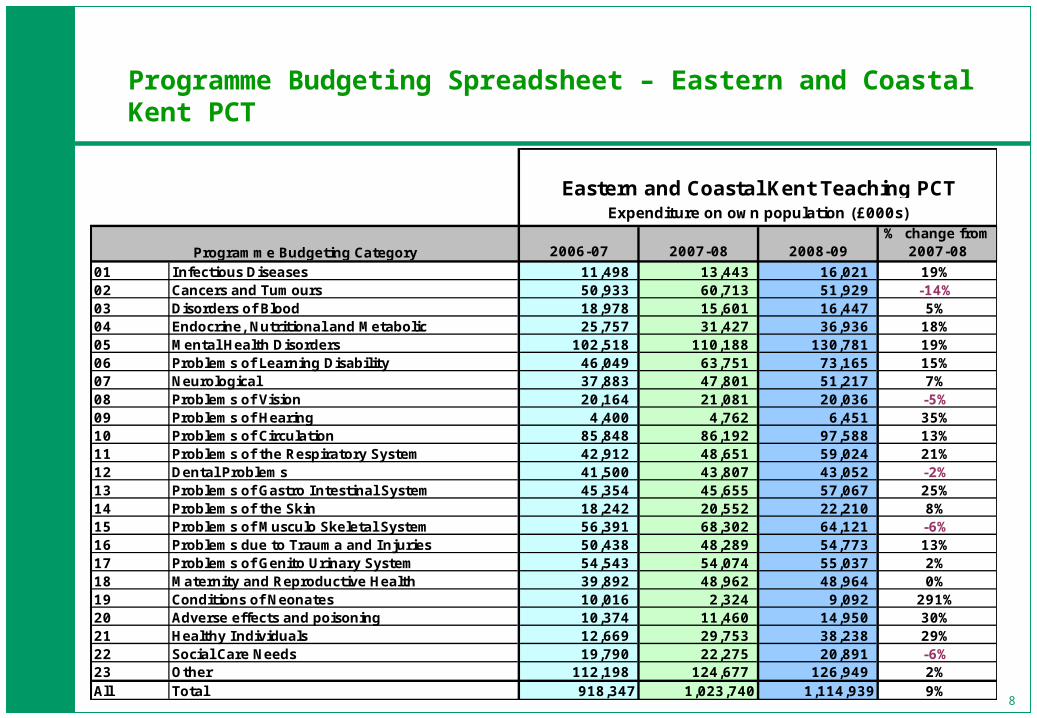
Programme Budgeting Spreadsheet – Eastern and Coastal Kent PCT
2006-07 2007-08 2008-09% change from
2007-08
01 Infectious Diseases 11,498 13,443 16,021 19%02 Cancers and Tumours 50,933 60,713 51,929 -14%03 Disorders of Blood 18,978 15,601 16,447 5%04 Endocrine, Nutritional and Metabolic 25,757 31,427 36,936 18%05 Mental Health Disorders 102,518 110,188 130,781 19%06 Problems of Learning Disability 46,049 63,751 73,165 15%07 Neurological 37,883 47,801 51,217 7%08 Problems of Vision 20,164 21,081 20,036 -5%09 Problems of Hearing 4,400 4,762 6,451 35%10 Problems of Circulation 85,848 86,192 97,588 13%11 Problems of the Respiratory System 42,912 48,651 59,024 21%12 Dental Problems 41,500 43,807 43,052 -2%13 Problems of Gastro Intestinal System 45,354 45,655 57,067 25%14 Problems of the Skin 18,242 20,552 22,210 8%15 Problems of Musculo Skeletal System 56,391 68,302 64,121 -6%16 Problems due to Trauma and Injuries 50,438 48,289 54,773 13%17 Problems of Genito Urinary System 54,543 54,074 55,037 2%18 Maternity and Reproductive Health 39,892 48,962 48,964 0%19 Conditions of Neonates 10,016 2,324 9,092 291%20 Adverse effects and poisoning 10,374 11,460 14,950 30%21 Healthy Individuals 12,669 29,753 38,238 29%22 Social Care Needs 19,790 22,275 20,891 -6%23 Other 112,198 124,677 126,949 2%All Total 918,347 1,023,740 1,114,939 9%
Programme Budgeting Category
Expenditure on own population (£000s)
Eastern and Coastal Kent Teaching PCT

9
2008-09 Programme Budgeting Spreadsheet –Expenditure per 100,000 population (weighted by age, sex and need)
Eastern and Coastal Kent PCT has a high rank nationally for Learning Disability problems. Respiratory system problems ranking has increased from 107 to 69 since 2006/07
PCT Selected
Selected Cluster details
Population (as per Allocations)
Dist from Target £'000 (Under/ Over)Dist from Target % (Under/ Over)
2006-07 Rank 2007-08 Rank 2008-09 Rank % Change
01 Infectious Diseases 1,581,337 99 1,832,233 67 2,161,244 53 18%
02 Cancers and Tumours 7,004,889 119 8,274,967 102 7,005,256 143 -15%
03 Disorders of Blood 2,610,072 7 2,126,361 52 2,218,711 45 4%
04 Endocrine, Nutritional and Metabolic 3,542,397 83 4,283,389 41 4,982,691 23 16%
05 Mental Health Disorders 14,099,448 119 15,018,234 124 17,642,443 95 17%
06 Problems of Learning Disability 6,333,185 21 8,689,035 7 9,870,007 5 14%
07 Neurological 5,210,104 88 6,515,107 64 6,909,207 63 6%
08 Problems of Vision 2,773,184 63 2,873,266 92 2,702,870 126 -6%
09 Problems of Hearing 605,138 85 649,044 96 870,244 67 34%
10 Problems of Circulation 11,806,799 83 11,747,664 101 13,164,686 66 12%
11 Problems of the Respiratory System 5,901,749 107 6,630,959 86 7,962,377 69 20%
12 Dental Problems 5,707,555 53 5,970,739 77 5,807,743 101 -3%
13 Problems of Gastro Intestinal System 6,237,601 125 6,222,615 130 7,698,376 84 24%
14 Problems of the Skin 2,508,849 99 2,801,165 90 2,996,144 98 7%
15 Problems of Musculo Skeletal System 7,755,536 28 9,309,320 26 8,649,965 47 -7%
16 Problems due to Trauma and Injuries 6,936,811 36 6,581,619 37 7,388,914 28 12%
17 Problems of Genito Urinary System 7,501,377 44 7,370,094 47 7,424,528 68 1%
18 Maternity and Reproductive Health 5,486,404 86 6,673,347 43 6,605,276 53 -1%
19 Conditions of Neonates 1,377,515 73 316,753 147 1,226,517 123 287%
20 Adverse effects and poisoning 1,426,751 71 1,561,957 72 2,016,765 49 29%
21 Healthy Individuals 1,742,386 115 4,055,228 30 5,158,332 22 27%
22 Social Care Needs 2,721,747 57 3,036,004 69 2,818,210 80 -7%
23 Other 15,430,753 129 16,993,033 129 17,125,504 132 1%
All Total 126,301,587 139,532,132 150,406,009 8%
Eastern and Coastal Kent Teaching PCT
Prospering UK1 SUPER (7 groups)
727,106 733,695 741,286
(12,178) (8,957) (9,446)
2008/ 09
-0.88%
Programme Budgeting Category
-1.31% -0.88%
£ per 100,000 population
EXPENDITURE ON OWN POPULATION
2006/ 07 2007/ 08
10
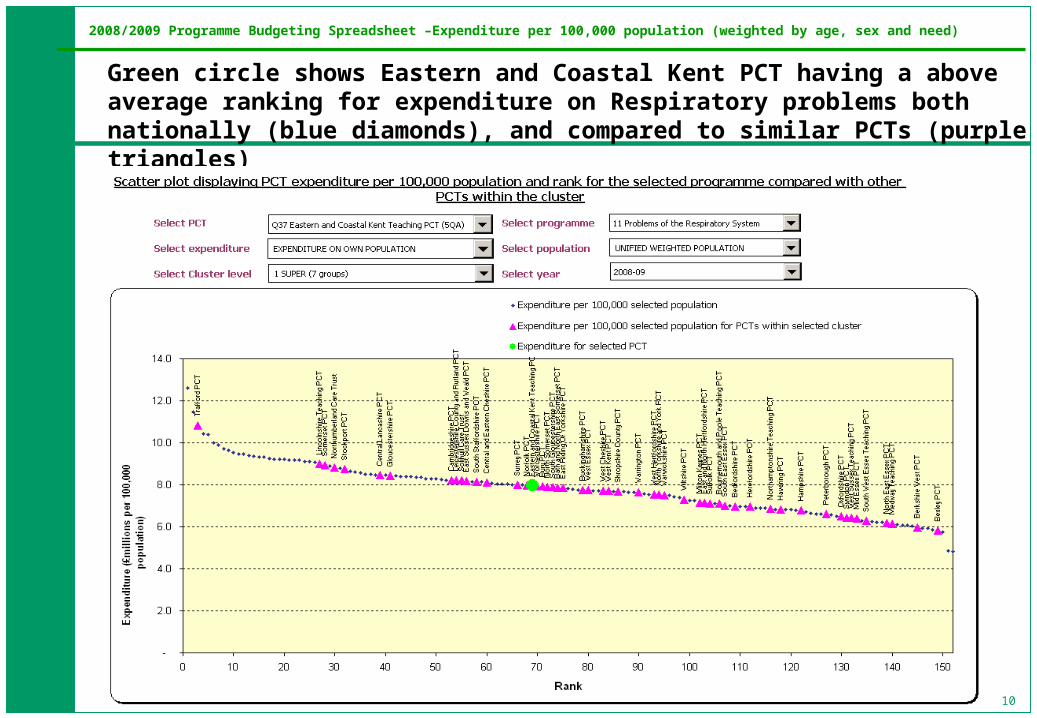
2008/2009 Programme Budgeting Spreadsheet –Expenditure per 100,000 population (weighted by age, sex and need)
Green circle shows Eastern and Coastal Kent PCT having a above average ranking for expenditure on Respiratory problems both nationally (blue diamonds), and compared to similar PCTs (purple triangles)
11
APHO Spend and Outcomes tool (SPOT)
• The Spend and Outcomes tool has been developed by the Association of Public Health Observatories.
• The tool allows PCTs to compare their expenditure and outcome data for each of the 23 Programme Budget disease categories on a single page.
• The tool is interactive and allows PCTs to select different outcome measures and different views of the data – including a comparison with any other selected PCT.
• A very useful tool that quickly allows PCTs to identify areas of expenditure that warrant further investigation.

12
2008/2009 APHO ONS Cluster Average – Each diamond represents a disease category and shows spend and outcomes compared to the ONS Cluster group
Eastern and Coastal Kent PCT has higher than average spend and a worse outcome for Respiratory problems when compared to PCTs within the same cluster.
Mortality from
bronchitis Under 75s

13
Programme Budgeting Atlases
• Provided on our behalf by the National Centre for Health Outcomes Development, under contract to the NHS Information Centre.
• The Atlas links programme budgeting expenditure data, as presented in the programme budgeting spreadsheet with an array of outcome data.
• By using mapping software, bar charts and correlation plots, the Atlases provides an illuminating and user-friendly way of analysing and presenting data.
• Atlases available via an NHS Net connection from:
nww.nchod.nhs.uk
14
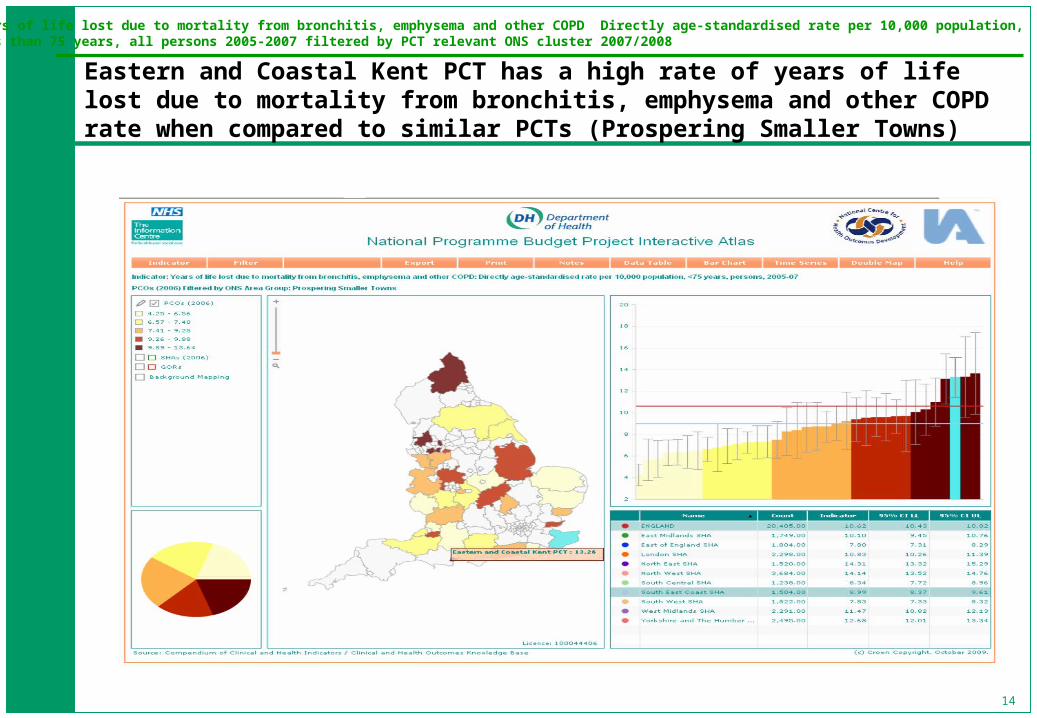
Years of life lost due to mortality from bronchitis, emphysema and other COPD Directly age-standardised rate per 10,000 population, less than 75 years, all persons 2005-2007 filtered by PCT relevant ONS cluster 2007/2008
Eastern and Coastal Kent PCT has a high rate of years of life lost due to mortality from bronchitis, emphysema and other COPD rate when compared to similar PCTs (Prospering Smaller Towns)
15
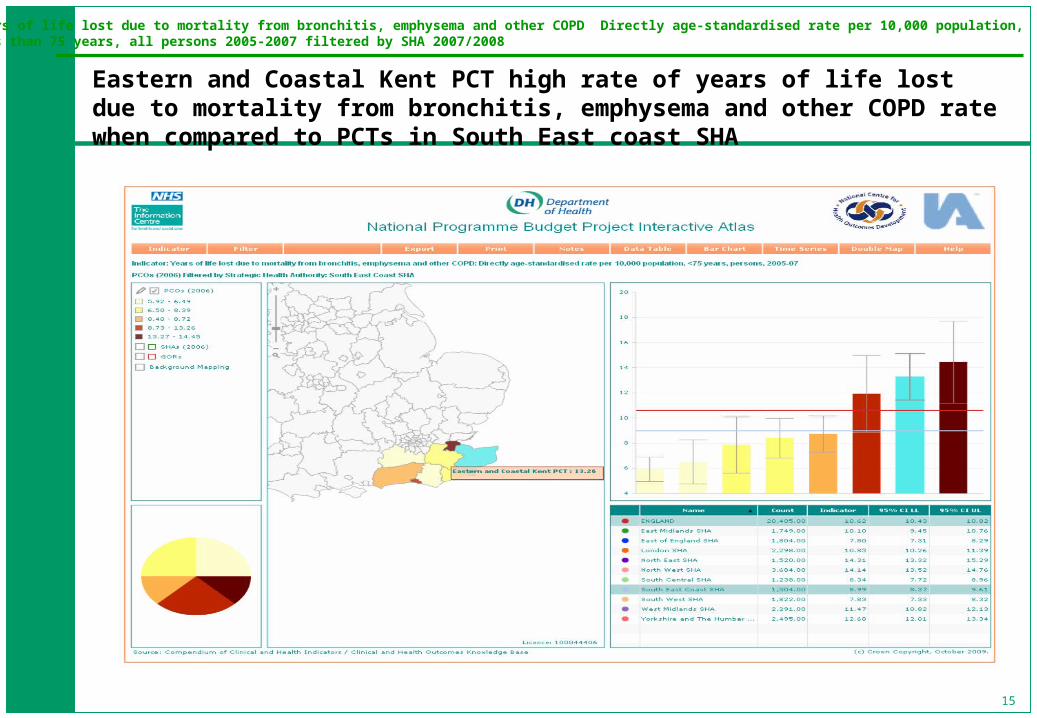
Years of life lost due to mortality from bronchitis, emphysema and other COPD Directly age-standardised rate per 10,000 population, less than 75 years, all persons 2005-2007 filtered by SHA 2007/2008
Eastern and Coastal Kent PCT high rate of years of life lost due to mortality from bronchitis, emphysema and other COPD rate when compared to PCTs in South East coast SHA
16
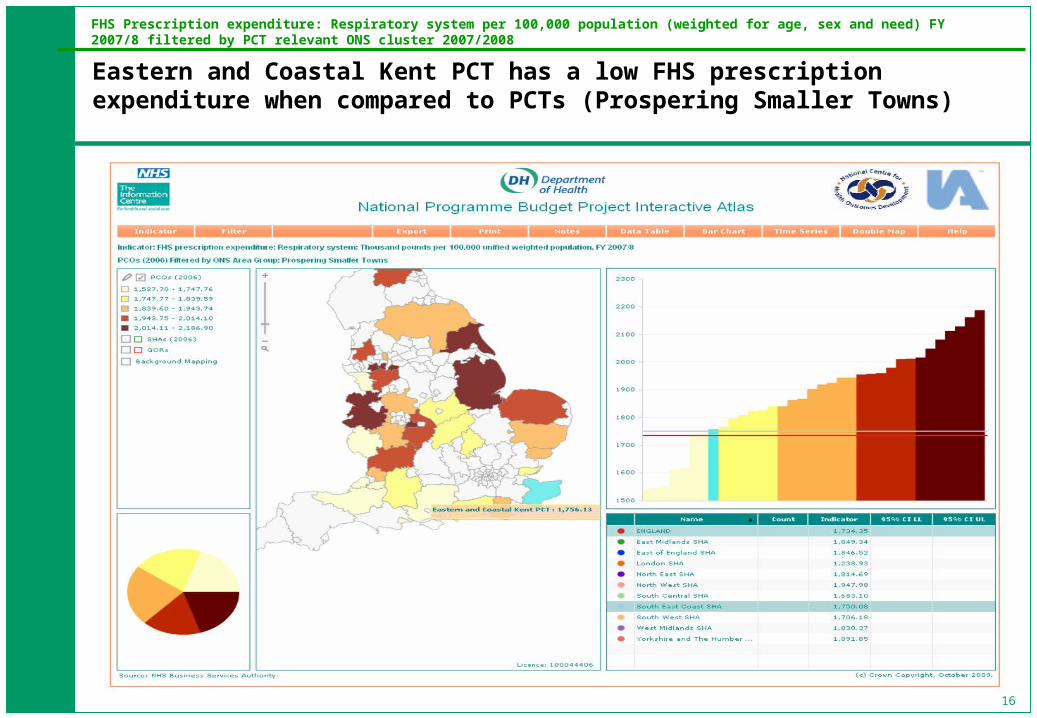
FHS Prescription expenditure: Respiratory system per 100,000 population (weighted for age, sex and need) FY 2007/8 filtered by PCT relevant ONS cluster 2007/2008
Eastern and Coastal Kent PCT has a low FHS prescription expenditure when compared to PCTs (Prospering Smaller Towns)

17
FHS Prescription Volume: Respiratory system per 100,000 population (weighted for age, sex and need) FY 2007/8 filtered by PCT relevant ONS cluster 2007/2008
Eastern and Coastal Kent PCT has a low FHS prescription volume when compared to similar PCTs (Prospering Smaller Towns)

18
Prevalence of COPD (QOF); Percent, all ages: FY 2007/8 filtered by PCT relevant ONS cluster 2007/2008
Eastern and Coastal Kent PCT has an above average prevalence of COPD when compared to similar PCTs (Prospering Smaller Towns)

19
Prevalence of COPD (QOF); Percent, all ages: FY 2007/8 filtered by SHA 2007/2008
Eastern and Coastal Kent PCT has an above average prevalence of COPD when compared to PCTs in South East coast SHA

20
Fev1 checks for patients with COPD (QOF); Percent, all ages, FY 2007/8 filtered by PCT relevant ONS cluster 2007/2008
Eastern and Coastal Kent PCT has a slightly above average number of Fev1 checks for patients with COPD when compared to similar PCTs (Prospering Smaller Towns)
21
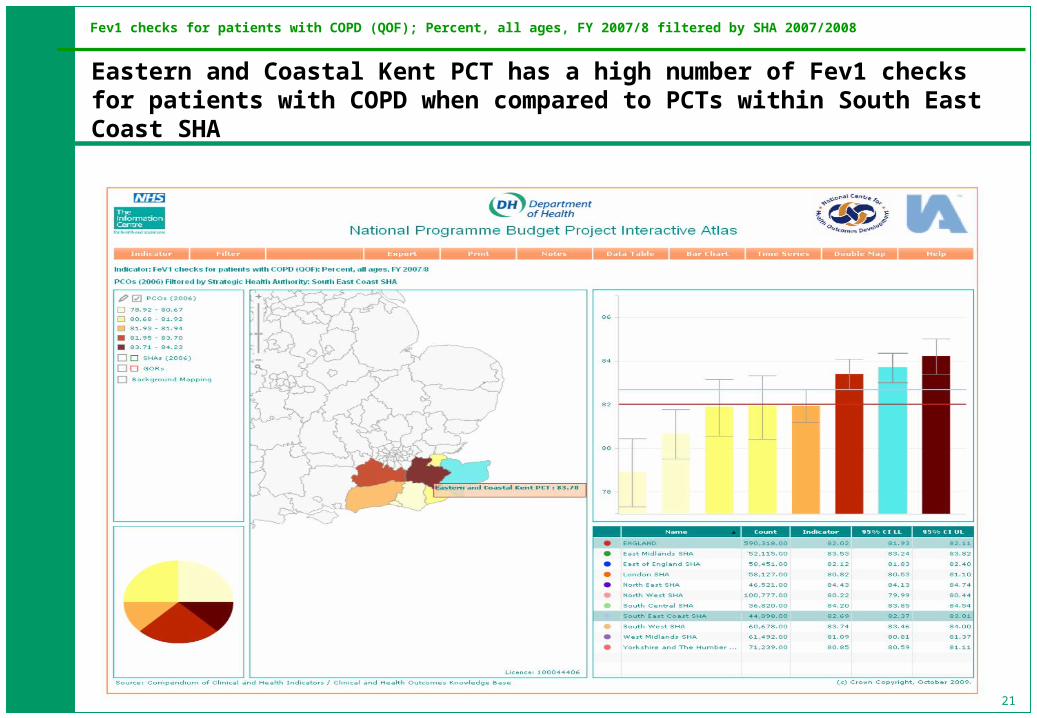
Fev1 checks for patients with COPD (QOF); Percent, all ages, FY 2007/8 filtered by SHA 2007/2008
Eastern and Coastal Kent PCT has a high number of Fev1 checks for patients with COPD when compared to PCTs within South East Coast SHA
22
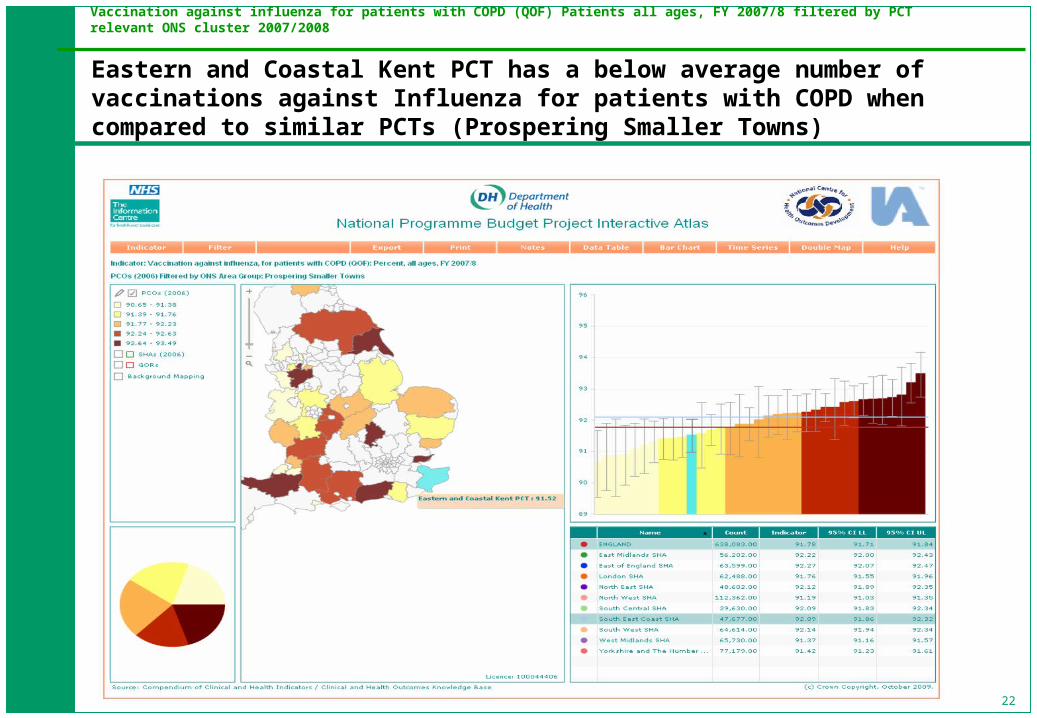
Vaccination against influenza for patients with COPD (QOF) Patients all ages, FY 2007/8 filtered by PCT relevant ONS cluster 2007/2008
Eastern and Coastal Kent PCT has a below average number of vaccinations against Influenza for patients with COPD when compared to similar PCTs (Prospering Smaller Towns)
23
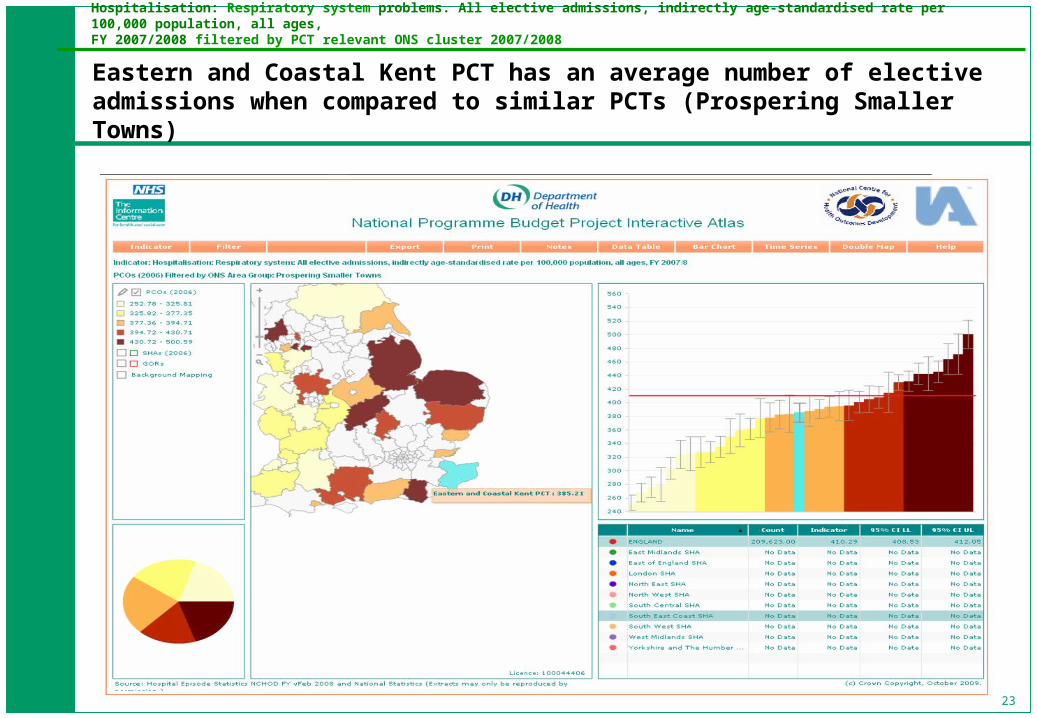
Hospitalisation: Respiratory system problems. All elective admissions, indirectly age-standardised rate per 100,000 population, all ages, FY 2007/2008 filtered by PCT relevant ONS cluster 2007/2008
Eastern and Coastal Kent PCT has an average number of elective admissions when compared to similar PCTs (Prospering Smaller Towns)
24
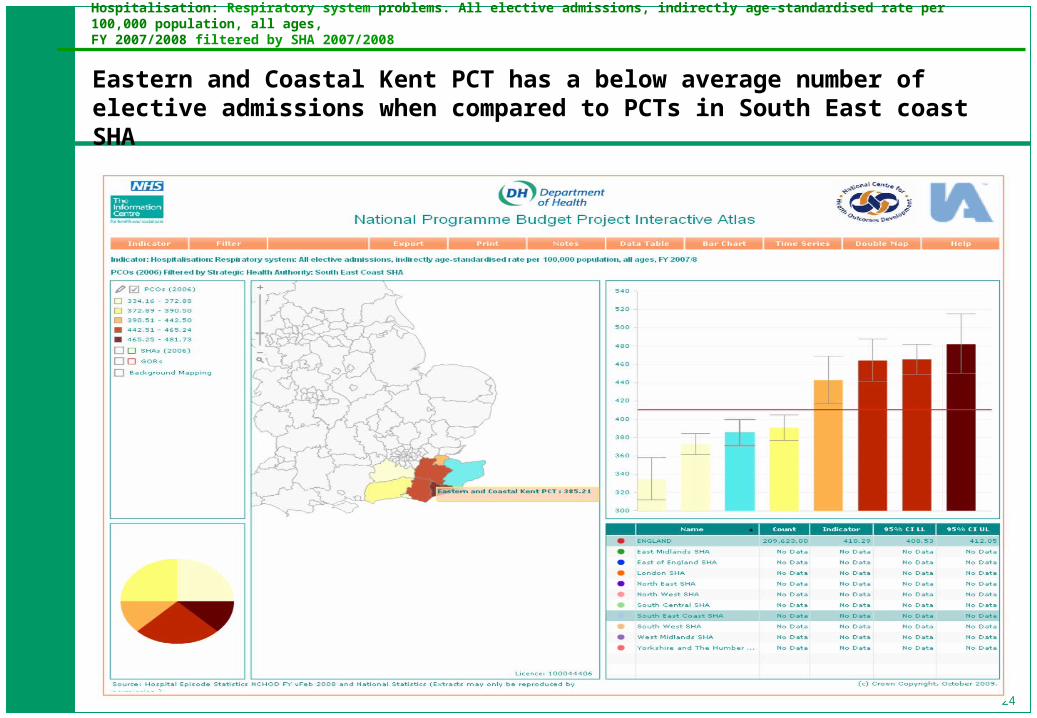
Hospitalisation: Respiratory system problems. All elective admissions, indirectly age-standardised rate per 100,000 population, all ages, FY 2007/2008 filtered by SHA 2007/2008
Eastern and Coastal Kent PCT has a below average number of elective admissions when compared to PCTs in South East coast SHA
25
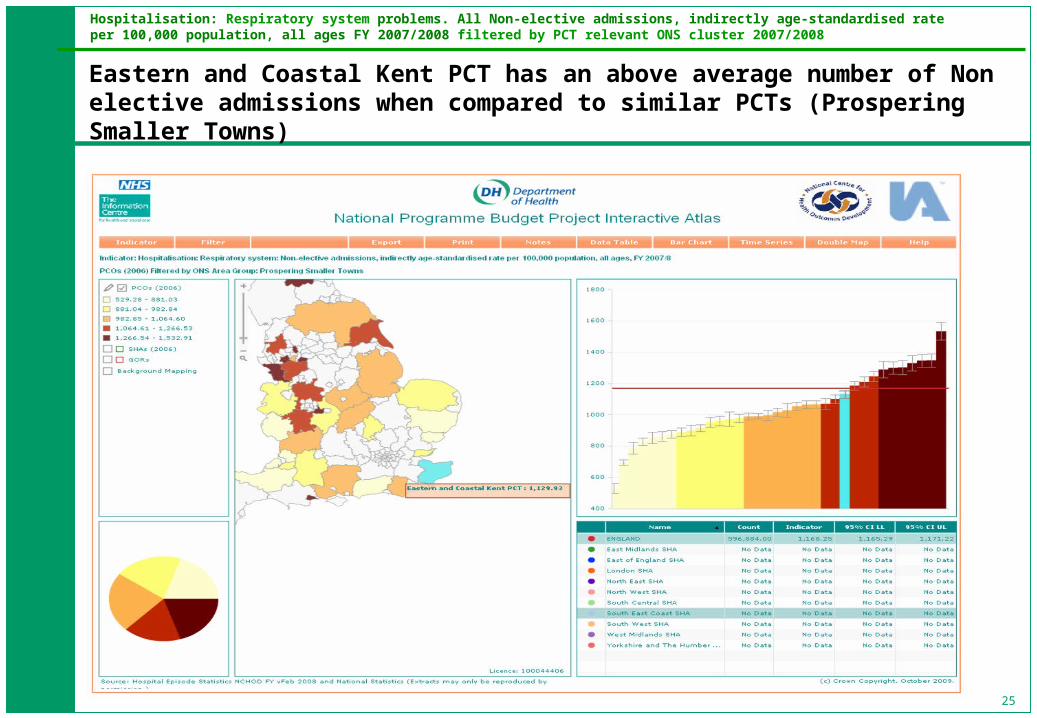
Hospitalisation: Respiratory system problems. All Non-elective admissions, indirectly age-standardised rate per 100,000 population, all ages FY 2007/2008 filtered by PCT relevant ONS cluster 2007/2008
Eastern and Coastal Kent PCT has an above average number of Non elective admissions when compared to similar PCTs (Prospering Smaller Towns)
26
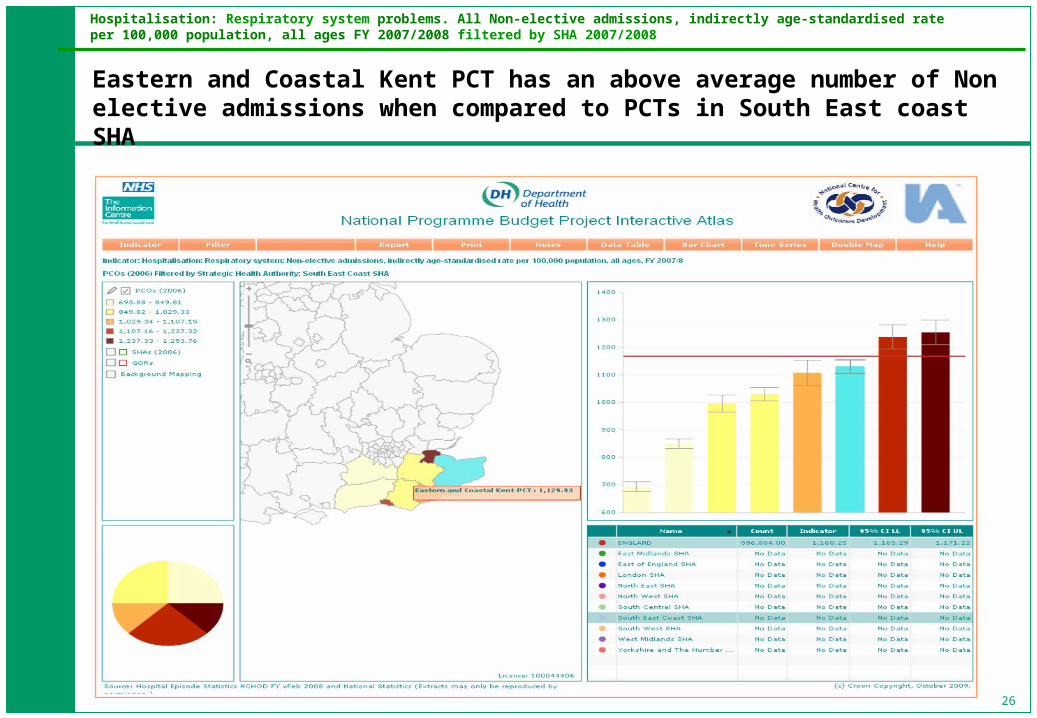
Hospitalisation: Respiratory system problems. All Non-elective admissions, indirectly age-standardised rate per 100,000 population, all ages FY 2007/2008 filtered by SHA 2007/2008
Eastern and Coastal Kent PCT has an above average number of Non elective admissions when compared to PCTs in South East coast SHA
27
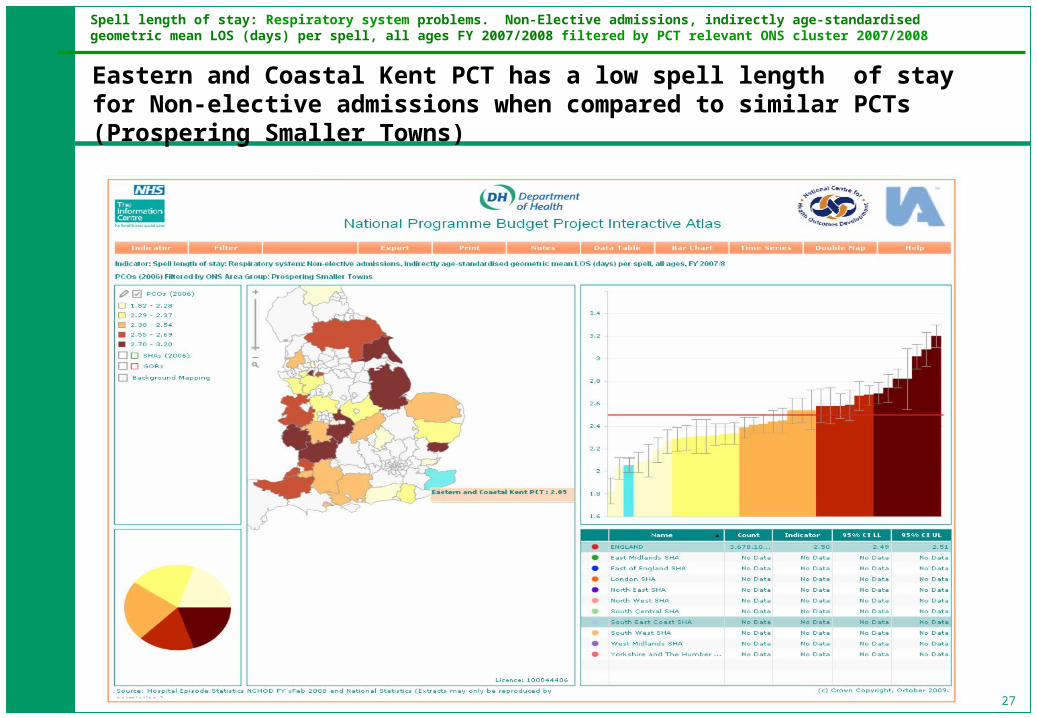
Spell length of stay: Respiratory system problems. Non-Elective admissions, indirectly age-standardised geometric mean LOS (days) per spell, all ages FY 2007/2008 filtered by PCT relevant ONS cluster 2007/2008
Eastern and Coastal Kent PCT has a low spell length of stay for Non-elective admissions when compared to similar PCTs (Prospering Smaller Towns)

28
Spell length of stay: Respiratory system problems. Non-Elective admissions, indirectly age-standardised geometric mean LOS (days) per spell, all ages FY 2007/2008 filtered by SHA 2007/2008
Eastern and Coastal Kent PCT has a low spell length of stay for Non-elective admissions when compared to PCTs in South East Coast SHA
29
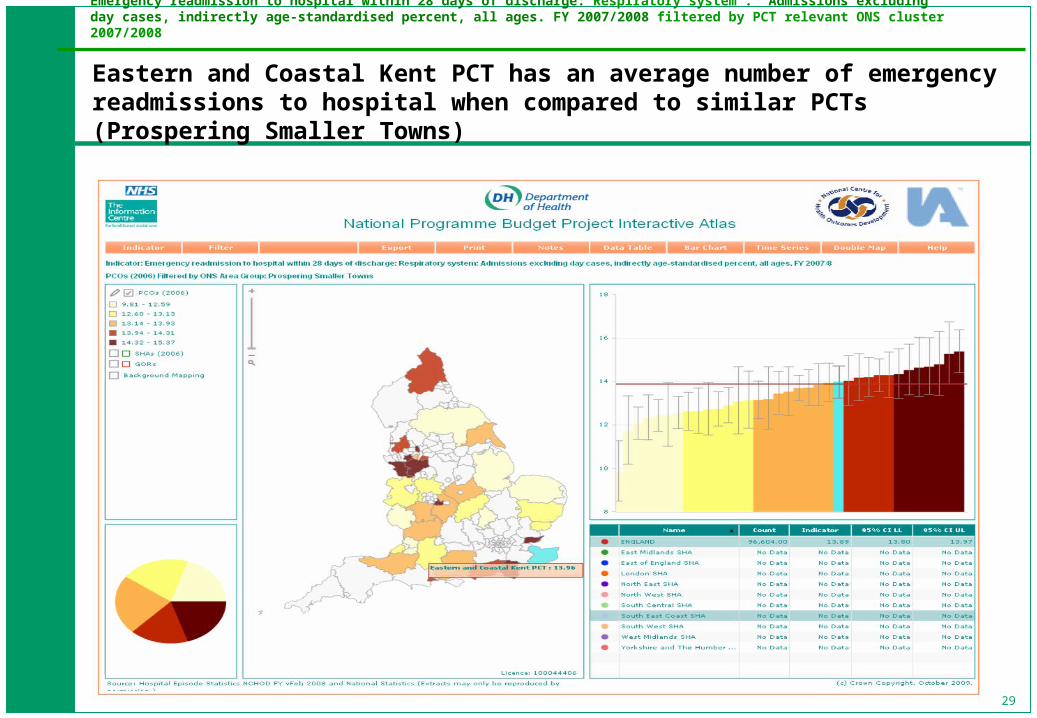
Emergency readmission to hospital within 28 days of discharge: Respiratory system . Admissions excluding day cases, indirectly age-standardised percent, all ages. FY 2007/2008 filtered by PCT relevant ONS cluster 2007/2008
Eastern and Coastal Kent PCT has an average number of emergency readmissions to hospital when compared to similar PCTs (Prospering Smaller Towns)
30
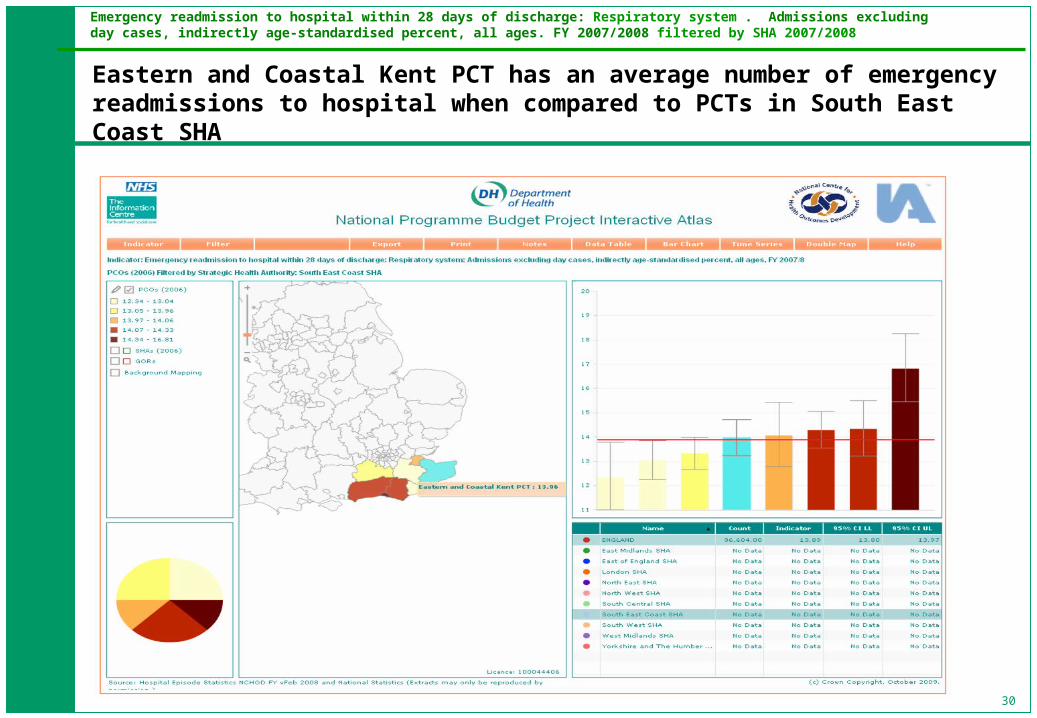
Emergency readmission to hospital within 28 days of discharge: Respiratory system . Admissions excluding day cases, indirectly age-standardised percent, all ages. FY 2007/2008 filtered by SHA 2007/2008
Eastern and Coastal Kent PCT has an average number of emergency readmissions to hospital when compared to PCTs in South East Coast SHA

31
Scatter plot: Prevalence of COPD (QOF) All ages FY 2007/08 VS Years of life lost due to mortality from Emphysema, Bronchitis and Other COPD filtered by PCT relevant ONS cluster 2005-2007
Eastern and Coastal Kent PCT has a higher mortality rate than most similar PCTs with the same Prevalence of COPD (Prospering Smaller Towns)
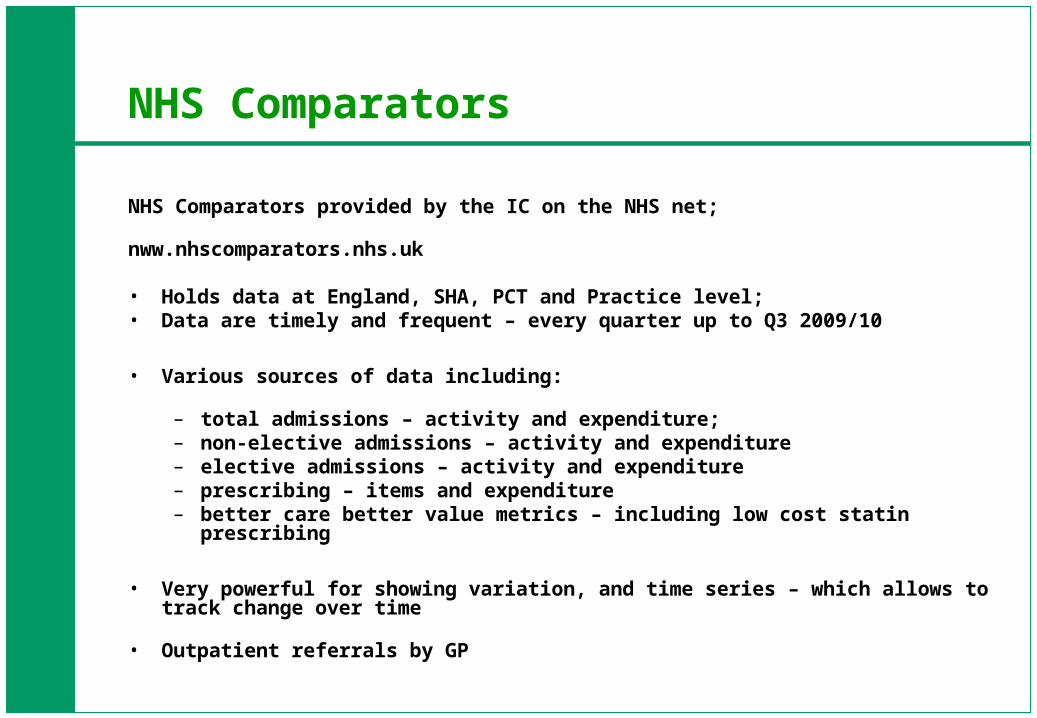
NHS Comparators
NHS Comparators provided by the IC on the NHS net;
nww.nhscomparators.nhs.uk
• Holds data at England, SHA, PCT and Practice level;• Data are timely and frequent – every quarter up to Q3 2009/10
• Various sources of data including:
– total admissions – activity and expenditure;– non-elective admissions – activity and expenditure– elective admissions – activity and expenditure– prescribing – items and expenditure– better care better value metrics – including low cost statin prescribing
• Very powerful for showing variation, and time series – which allows to track change over time
• Outpatient referrals by GP

33
NHS Comparators - Expenditure on all admissions covered by PBR tariff (age and sex adjusted rate) - Comparison with other PCTs
Drill down to disease level
Table shows activity, expected activity based on national averages, and the resulting % difference, for PCT and SHA
2009/2010 Quarter 1-3: Eastern and Coastal Kent PCT is below the national average for total Respiratory admissions (adjusted for age and sex)
34
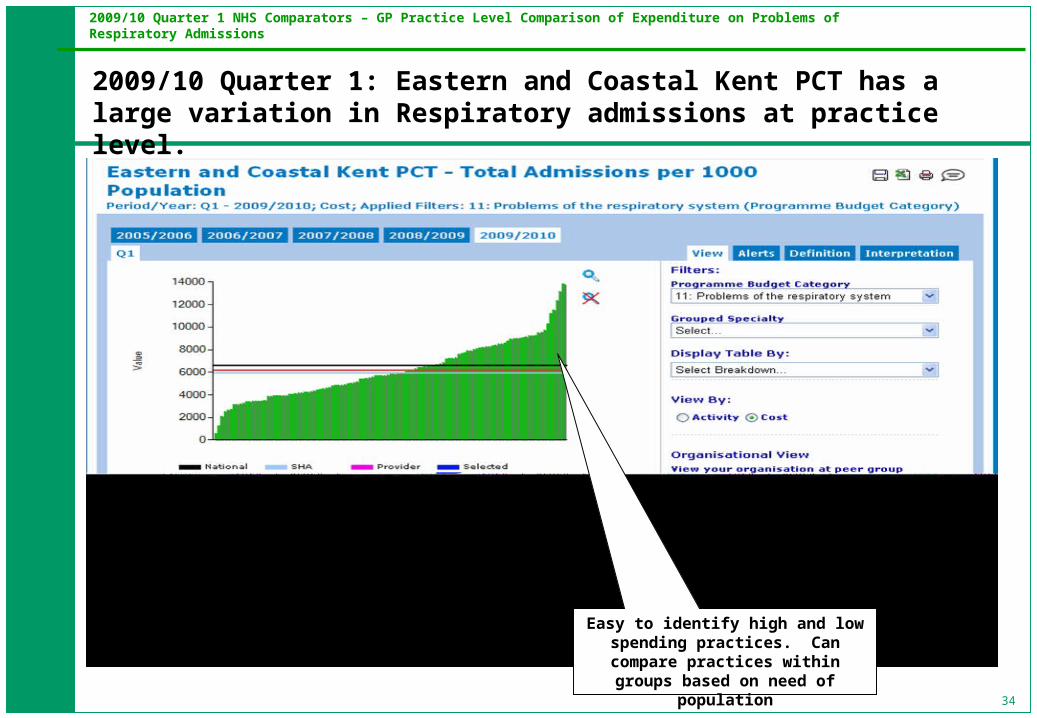
2009/10 Quarter 1 NHS Comparators – GP Practice Level Comparison of Expenditure on Problems of Respiratory Admissions
Easy to identify high and low spending practices. Can compare practices within groups based on
need of population
2009/10 Quarter 1: Eastern and Coastal Kent PCT has a large variation in Respiratory admissions at practice level.

35
NHS Comparators - Quarterly Time Series of Outpatient First Attendances
Since 2006/07 Eastern and Coastal Kent PCT has a consistently higher spend on Thoracic medicine outpatient first attendances compared to PCTs within South East Coast SHA
36
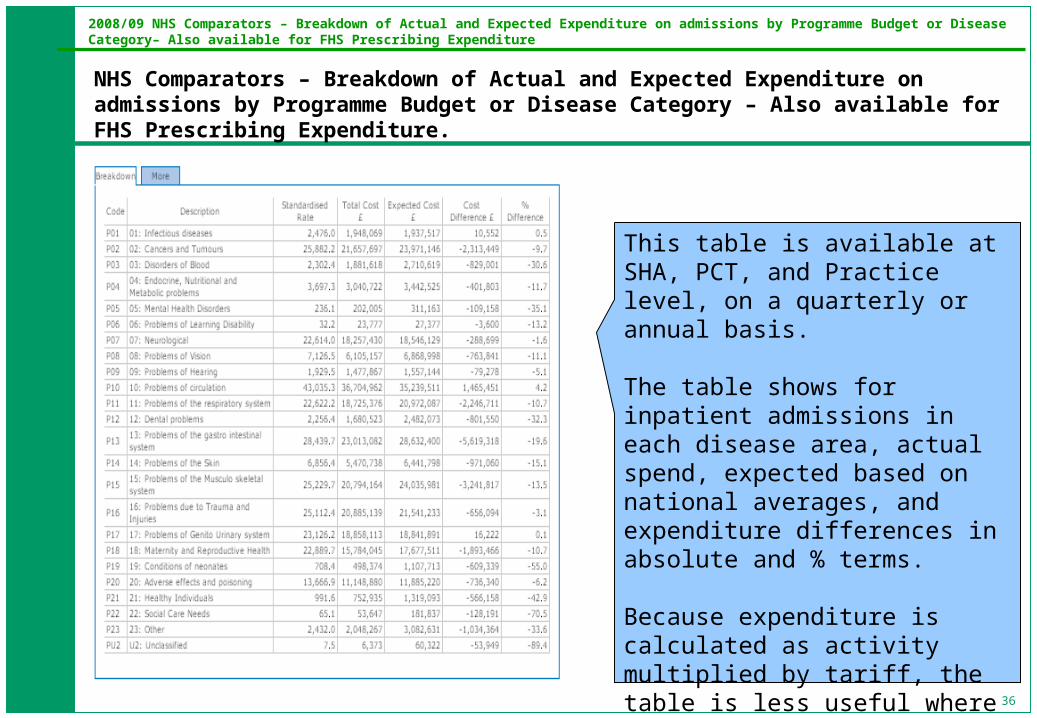
2008/09 NHS Comparators – Breakdown of Actual and Expected Expenditure on admissions by Programme Budget or Disease Category– Also available for FHS Prescribing Expenditure
This table is available at SHA, PCT, and Practice level, on a quarterly or annual basis.
The table shows for inpatient admissions in each disease area, actual spend, expected based on national averages, and expenditure differences in absolute and % terms.
Because expenditure is calculated as activity multiplied by tariff, the table is less useful where tariff is less well developed – e.g. Mental Health.
NHS Comparators – Breakdown of Actual and Expected Expenditure on admissions by Programme Budget or Disease Category – Also available for FHS Prescribing Expenditure.
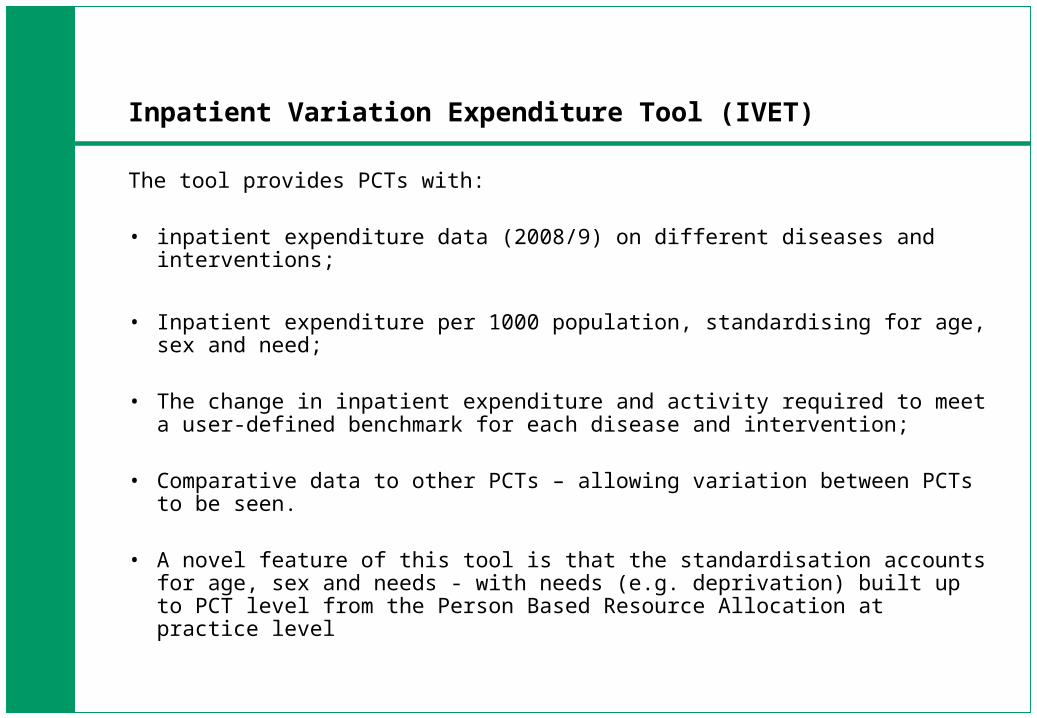
Inpatient Variation Expenditure Tool (IVET)
The tool provides PCTs with:
• inpatient expenditure data (2008/9) on different diseases and interventions;
• Inpatient expenditure per 1000 population, standardising for age, sex and need;
• The change in inpatient expenditure and activity required to meet a user-defined benchmark for each disease and intervention;
• Comparative data to other PCTs – allowing variation between PCTs to be seen.
• A novel feature of this tool is that the standardisation accounts for age, sex and needs - with needs (e.g. deprivation) built up to PCT level from the Person Based Resource Allocation at practice level
38
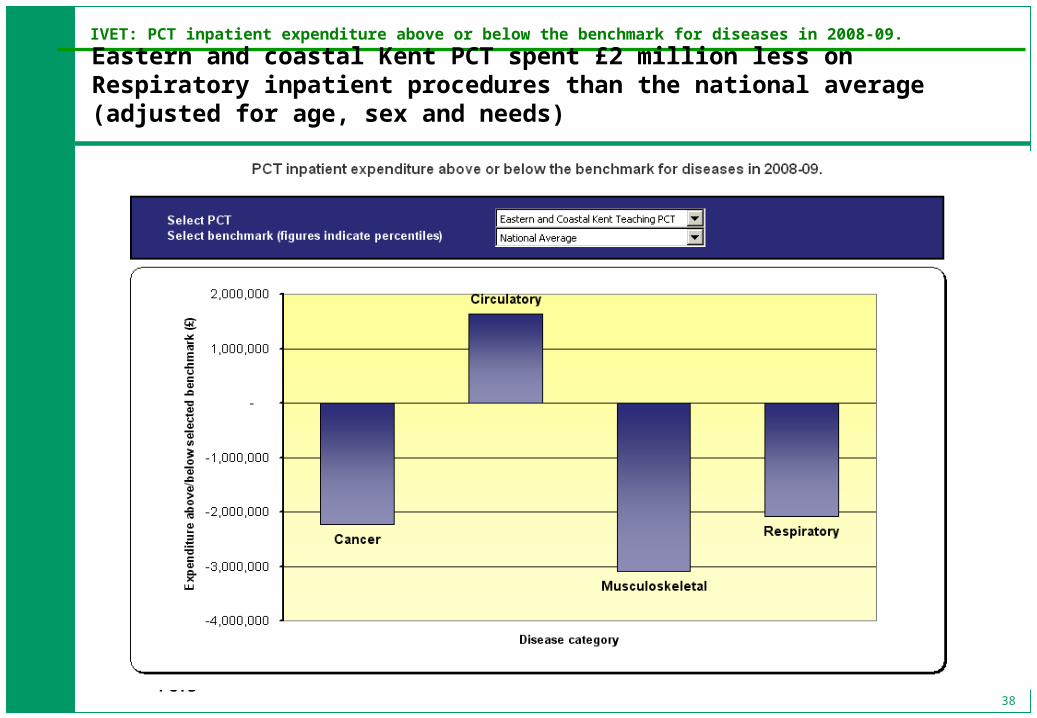
IVET: PCT inpatient expenditure above or below the benchmark for diseases in 2008-09.
Eastern and coastal Kent PCT spent £2 million less on Respiratory inpatient procedures than the national average (adjusted for age, sex and needs)
Further diseases and interventions will be added subsequent to feedback from PCTs

IVET: PCT inpatient expenditure above or below the benchmark for Respiratory diseases and interventions in 2008-09.
Eastern and Coastal Kent PCT spend £2 million less than the National Average on Respiratory inpatients and £0.5 million more than the national average on HRG D99

40
IVET: Eastern and Coastal Kent PCT inpatient expenditure for selected disease/intervention compared to a user defined benchmark.
Eastern and Coastal Kent are spending below the national average on Respiratory Inpatients compared to PCTs Nationally.
41
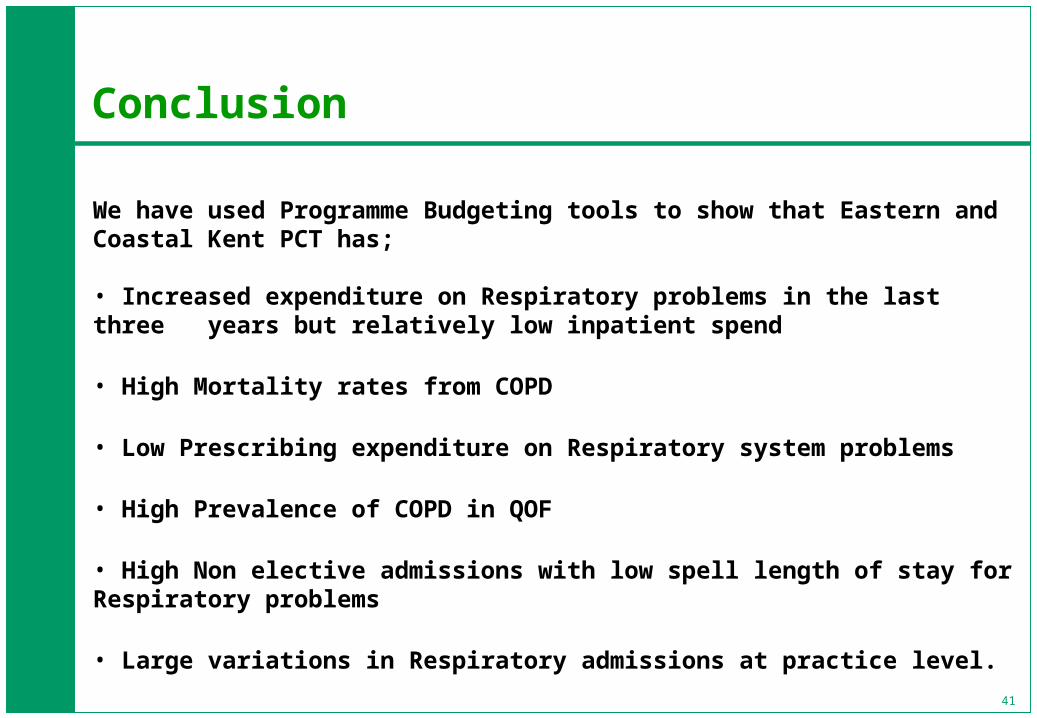
Conclusion
We have used Programme Budgeting tools to show that Eastern and Coastal Kent PCT has;
• Increased expenditure on Respiratory problems in the last three years but relatively low inpatient spend
• High Mortality rates from COPD
• Low Prescribing expenditure on Respiratory system problems
• High Prevalence of COPD in QOF
• High Non elective admissions with low spell length of stay for Respiratory problems
• Large variations in Respiratory admissions at practice level.
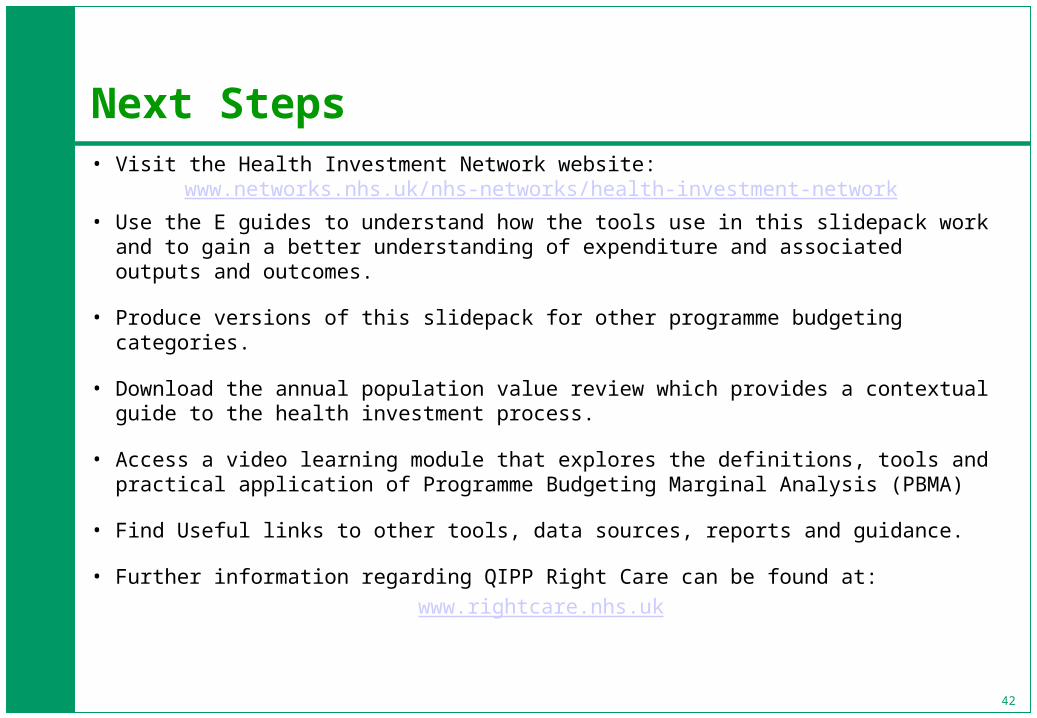
Next Steps• Visit the Health Investment Network website:
www.networks.nhs.uk/nhs-networks/health-investment-network
• Use the E guides to understand how the tools use in this slidepack work and to gain a better understanding of expenditure and associated outputs and outcomes.
• Produce versions of this slidepack for other programme budgeting categories.
• Download the annual population value review which provides a contextual guide to the health investment process.
• Access a video learning module that explores the definitions, tools and practical application of Programme Budgeting Marginal Analysis (PBMA)
• Find Useful links to other tools, data sources, reports and guidance.
• Further information regarding QIPP Right Care can be found at:
www.rightcare.nhs.uk
42