NHS Dental Statistics for England: 2015-16 - CB12.co.uk · PDF fileNHS Dental Statistics for...
20
NHS Dental Statistics for England: 2015-16 First Quarterly Report Published 26 November 2015
Transcript of NHS Dental Statistics for England: 2015-16 - CB12.co.uk · PDF fileNHS Dental Statistics for...

NHS Dental Statistics for England: 2015-16
First Quarterly Report
Published 26 November 2015
NHS Dental Statistics for England: 2015-16, Quarter 1
2 Copyright © 2015, Health and Social Care Information Centre. All rights reserved.
We are the trusted national provider of high-quality information, data and IT systems for
health and social care.
www.hscic.gov.uk
@hscic
Author: Primary Care Domain, Health and Social Care Information Centre
Responsible statistician: Gemma Ramsay, Section Head
Version: V1.0
Date of publication:
26 November 2015
This publication may be of interest to members of the public and other stakeholders to make local and national comparisons and gain a picture of NHS dental provisions for adults and children in England.
NHS Dental Statistics for England: 2015-16, Quarter 1
Copyright © 2015, Health and Social Care Information Centre. All rights reserved. 3
Contents
Contents
Executive Summary 4
Key Facts 4
Further Information 4
Introduction 5
Feedback 6
Activity 7
Courses of Treatment 7
Units of Dental Activity 11
Patients Seen 15
Annex 1 – Report tables and charts (Excel workbook) 18
Annex 2 – CCG, AT, Region and LA level data (Excel workbook) 18
Annex 3 – Technical Information (.pdf file) 18
Annex 4 – Source Data (csv files) 18
Other Annexes 18
Other Publications 19
NHS Dental Statistics for England: 2015-16, Quarter 1
4 Copyright © 2015, Health and Social Care Information Centre. All rights reserved.
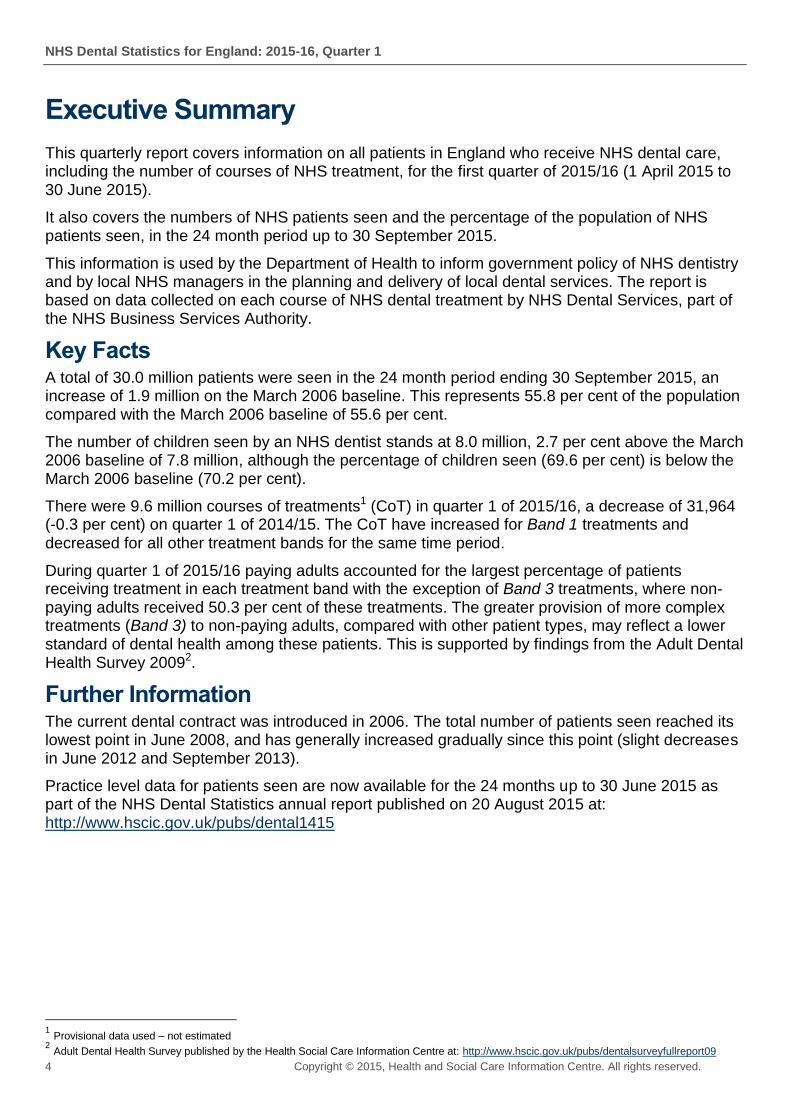
Executive Summary
This quarterly report covers information on all patients in England who receive NHS dental care, including the number of courses of NHS treatment, for the first quarter of 2015/16 (1 April 2015 to 30 June 2015).
It also covers the numbers of NHS patients seen and the percentage of the population of NHS patients seen, in the 24 month period up to 30 September 2015.
This information is used by the Department of Health to inform government policy of NHS dentistry and by local NHS managers in the planning and delivery of local dental services. The report is based on data collected on each course of NHS dental treatment by NHS Dental Services, part of the NHS Business Services Authority.
Key Facts A total of 30.0 million patients were seen in the 24 month period ending 30 September 2015, an increase of 1.9 million on the March 2006 baseline. This represents 55.8 per cent of the population compared with the March 2006 baseline of 55.6 per cent.
The number of children seen by an NHS dentist stands at 8.0 million, 2.7 per cent above the March 2006 baseline of 7.8 million, although the percentage of children seen (69.6 per cent) is below the March 2006 baseline (70.2 per cent).
There were 9.6 million courses of treatments1 (CoT) in quarter 1 of 2015/16, a decrease of 31,964 (-0.3 per cent) on quarter 1 of 2014/15. The CoT have increased for Band 1 treatments and decreased for all other treatment bands for the same time period.
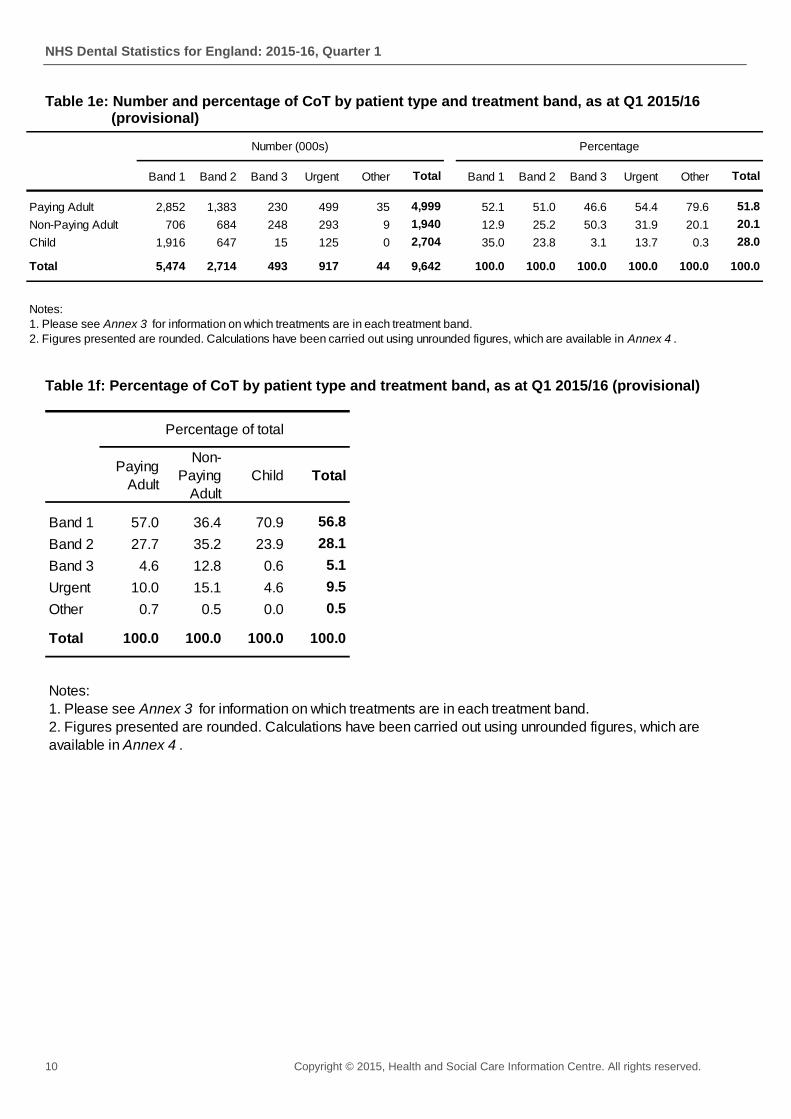
During quarter 1 of 2015/16 paying adults accounted for the largest percentage of patients receiving treatment in each treatment band with the exception of Band 3 treatments, where non-paying adults received 50.3 per cent of these treatments. The greater provision of more complex treatments (Band 3) to non-paying adults, compared with other patient types, may reflect a lower standard of dental health among these patients. This is supported by findings from the Adult Dental Health Survey 20092.
Further Information The current dental contract was introduced in 2006. The total number of patients seen reached its lowest point in June 2008, and has generally increased gradually since this point (slight decreases in June 2012 and September 2013).
Practice level data for patients seen are now available for the 24 months up to 30 June 2015 as part of the NHS Dental Statistics annual report published on 20 August 2015 at: http://www.hscic.gov.uk/pubs/dental1415
1 Provisional data used – not estimated
2 Adult Dental Health Survey published by the Health Social Care Information Centre at: http://www.hscic.gov.uk/pubs/dentalsurveyfullreport09
NHS Dental Statistics for England: 2015-16, Quarter 1
Copyright © 2015, Health and Social Care Information Centre. All rights reserved. 5
Introduction
This quarterly report brings together information on NHS dental activity3 and workforce in England. This information is used by the Department of Health (DoH) to inform government policy on NHS dentistry and by local NHS managers in the planning and delivery of local dental services.
More specifically, this report includes information on:
Courses of Treatment (CoT)
Units of Dental Activity (UDA)
Patients Seen
This report covers dental activity carried out by ‘high street dentists’ including work undertaken by dentists under vocational training. It does not, however, cover dental treatment carried out in hospital under ‘Hospital Dental Services’, nor services provided privately.
Users should be aware of the Data Quality Statement that accompanies this report, and is available at: http://www.hscic.gov.uk/pubs/dental1516q1
For an introduction to the terms and measures used in this report, we recommend reading our Guide to Dental Publications available at: http://www.hscic.gov.uk/pubs/dental1516q1
In addition, full technical information is available in Annex 3 of this report.
This report covers activity data under the current dental contract arrangements, including data (provisional and estimated) at specified dates from 2006/07 to the end of the first quarter of 2015/16 (30 June 2015). Numbers of patients seen by NHS dentists are slightly more up-to-date, including figures for the 24 month period to the end of the second quarter of 2015/16 (30 September 2015).
Dental activity data are provisional each quarter until final figures are available at the end of the year. The Health and Social Care Information Centre (HSCIC) provides national estimates for each quarter available based on these provisional data.
Population based measures use population estimates provided by the Office of National Statistics (ONS). Revisions to estimates4 dating back to pre-2000 mean historic ‘percentage of the population’ figures appearing in publications released since quarter 1 of 2013/14 (patients seen during the 24 months up to 30 September 2013) will differ to those figures appearing in publications prior to that. Annex 5 of the quarter 3 2013/145 publication shows revised figures for patients seen as a percentage of the population at England level.
Due to changes in NHS structure from April 2015, data at Area Team level will not be shown from Q1 2015/16 in any report or annexes, the new NHS Commissioning Regions will be shown in Annex 2 of this report.
Please note the changes to Tables 1b and 2b, which now show provisional data rather than the estimated data shown in previous publications.
Neither CCGs nor LAs are directly accountable for commissioning NHS primary care dental services, however, in order to provide a suitable level of geographic granularity and relevance to the health services we have opted to provide these data at CCG level. In addition, local authorities
3 This data is collected through FP17 forms processed by the NHS Dental Services, part of the NHS Business Services Authority (BSA).
4 http://www.ons.gov.uk/ons/dcp171778_345500.pdf
5 http://www.hscic.gov.uk/catalogue/PUB14142
NHS Dental Statistics for England: 2015-16, Quarter 1
6 Copyright © 2015, Health and Social Care Information Centre. All rights reserved.
have responsibility for commissioning public health services, which includes dental and oral health programmes; so we have also presented data at this level.
We have changed the way we aggregate our source data to a geographical area. The postcode in the source data is used to determine its corresponding CCG, NHS Geography Region, NHS Commissioning Region and Local Authority. This has not changed. However, where we are unable to map a postcode to a geography region, we no longer used the codes provided in the source data as they are no longer valid. The result of this is that we have unallocated data at NHS Geography Regions and NHS Commissioning Regions.
In addition, processes dating back to Q1 2013/14 mapped a postcode to a geographical area each time we published. This meant that all historic mappings were updated each time we published and were true at the time of the current publication but not true as at the original publication. This is no longer the case. All data up to and including Q4 of 2014/15 for activity data and Q1 of 2015/16 for patients seen data have been mapped to new geographies which are true at the time of this publication, due to the new NHS geographies. Going forward, these will not be updated.
The following annexes are available within this report;
Annex 1 includes all report tables and charts in Excel format. This annex also contains patient seen tables by adult/child at sub-region and region level.
Annex 2 shows patients seen figures, both absolute numbers and as a percentage of the population, at region, sub-region, CCG and LA levels in Excel format.
Annex 3 includes full technical information on the measures and definitions used in the report.
Annex 4 contains ‘flat’ csv files of unformatted activity and patients seen data, suitable for further analysis. Annex 4 (Patients Seen) contains patient seen data for the most recent quarter. The population estimates in this annex allow users to calculate patients seen as a percentage of the population.
Feedback
We welcome any feedback on this report, as well as suggestions for future reports. Comments can be submitted via the ‘Have Your Say’ link on the following webpage: http://www.hscic.gov.uk/pubs/dental1516q1 or by email to: [email protected]

NHS Dental Statistics for England: 2015-16, Quarter 1
Copyright © 2015, Health and Social Care Information Centre. All rights reserved. 7
Activity
Courses of Treatment Dental activity is measured through the number of Courses of Treatment (CoT) delivered. For a full definition of CoT and treatment bands, please refer to Annex 3.
There were 9.6 million CoT carried out in quarter 1 of 2015/16 (provisionally), (Table 1a), a decrease of 31,964 (-0.3 per cent) on quarter 1 of 2014/15.
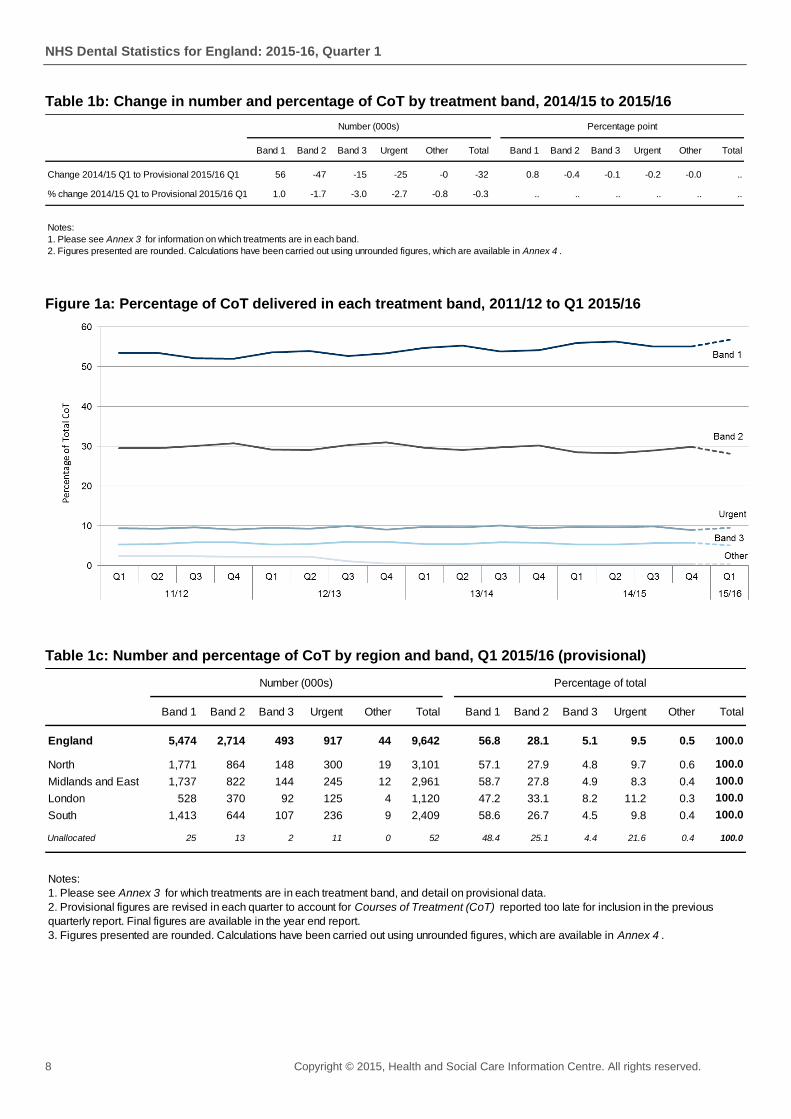
In absolute terms, Band 1 CoT had the largest absolute change from quarter 1 last year (Table 1b) with an increase of 55,652 (1.0 per cent). In relative terms, Band 3 treatments experienced the greatest change compared with the same quarter in the previous year; a decrease of 3.0 per cent.
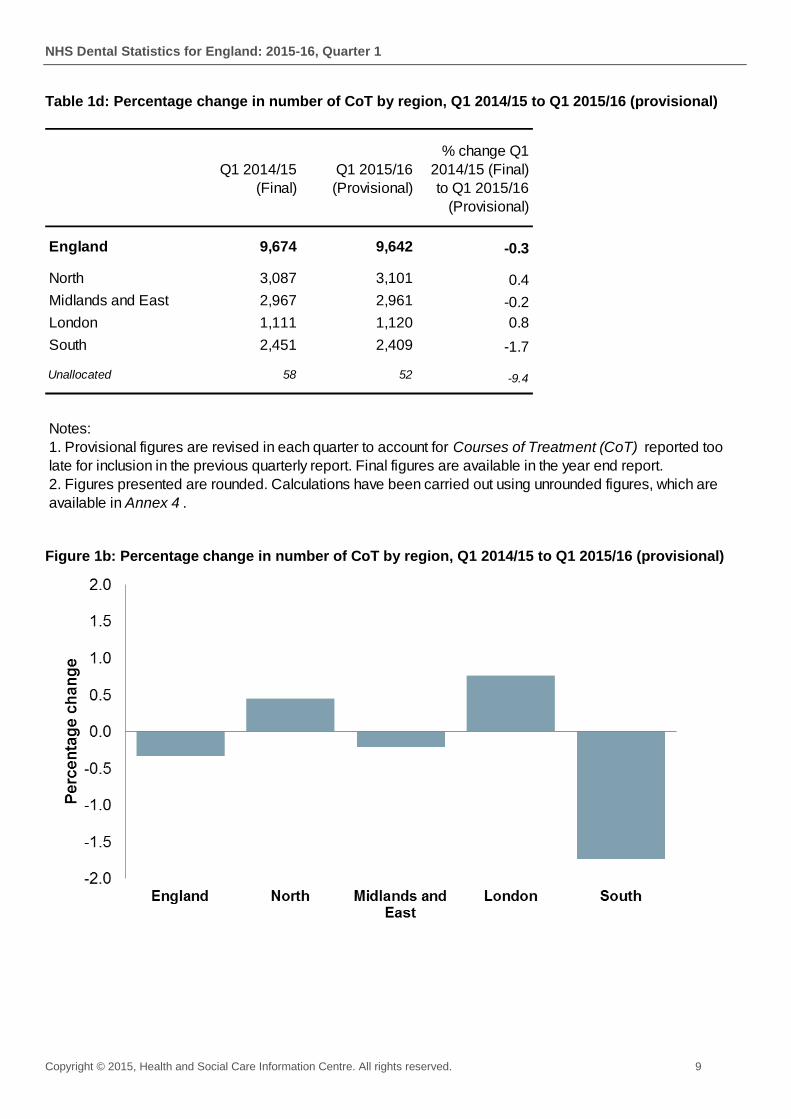
Table 1d indicates that when compared to the corresponding quarter in 2014/15, the number of CoT increased in the North and London regions and decreased in the Midlands and East and the South regions. The largest decrease was seen in the South of England, with a decrease of 1.7 per cent; with an overall decrease of 0.3 per cent at England level.
The North region delivers the most CoT overall in England. Band 1 treatments are more numerous in the North, whilst London carries out a higher proportion of Band 2, Band 3 and Urgent treatments.
Table 1a: Number and percentage of CoT by treatment band, as at specified dates
Band 1 Band 2 Band 3 Urgent Other Total Band 1 Band 2 Band 3 Urgent Other Total
2006-07
FinalQuarter 19,013 10,688 1,529 2,881 940 35,051 54.2 30.5 4.4 8.2 2.7 100.0
1 5,441 2,949 538 965 49 9,942 54.7 29.7 5.4 9.7 0.5 100.0
2 5,495 2,889 544 960 47 9,935 55.3 29.1 5.5 9.7 0.5 100.0
3 5,284 2,924 571 984 46 9,809 53.9 29.8 5.8 10.0 0.5 100.0
4 5,465 3,040 579 943 48 10,075 54.2 30.2 5.7 9.4 0.5 100.0
Total 21,685 11,801 2,232 3,852 190 39,762 54.5 29.7 5.6 9.7 0.5 100.0
1 5,419 2,761 509 942 44 9,674 56.0 28.5 5.3 9.7 0.5 100.0
2 5,553 2,782 520 954 45 9,854 56.4 28.2 5.3 9.7 0.5 100.0
3 5,370 2,825 553 964 43 9,755 55.1 29.0 5.7 9.9 0.4 100.0
4 5,686 3,079 596 920 47 10,329 55.0 29.8 5.8 8.9 0.5 100.0
Total 22,028 11,447 2,178 3,780 179 39,612 55.6 28.9 5.5 9.5 0.5 100.0
1 5,490 2,722 495 920 44 9,670 56.8 28.1 5.1 9.5 0.5 100.0
2 .. .. .. .. .. .. .. .. .. .. .. ..
3 .. .. .. .. .. .. .. .. .. .. .. ..
4 .. .. .. .. .. .. .. .. .. .. .. ..
1 5,474 2,714 493 917 44 9,642 56.8 28.1 5.1 9.5 0.5 100.0
2 .. .. .. .. .. .. .. .. .. .. .. ..
3 .. .. .. .. .. .. .. .. .. .. .. ..
4 .. .. .. .. .. .. .. .. .. .. .. ..
Notes:
1. Please see Annex 3 for information on which treatments are in each treatment band, and detail on provisional data and the estimation method.
2. Figures presented are rounded. Calculations have been carried out using unrounded figures, which are available in Annex 4 .
2015-16
Provisional
2015-16
Estimated
2014-15
Final
Percentage of total
2013-14
Final
Number
(000s)
NHS Dental Statistics for England: 2015-16, Quarter 1
8 Copyright © 2015, Health and Social Care Information Centre. All rights reserved.
Table 1b: Change in number and percentage of CoT by treatment band, 2014/15 to 2015/16
Figure 1a: Percentage of CoT delivered in each treatment band, 2011/12 to Q1 2015/16
Table 1c: Number and percentage of CoT by region and band, Q1 2015/16 (provisional)
Band 1 Band 2 Band 3 Urgent Other Total Band 1 Band 2 Band 3 Urgent Other Total
Change 2014/15 Q1 to Provisional 2015/16 Q1 56 -47 -15 -25 -0 -32 0.8 -0.4 -0.1 -0.2 -0.0 ..
% change 2014/15 Q1 to Provisional 2015/16 Q1 1.0 -1.7 -3.0 -2.7 -0.8 -0.3 .. .. .. .. .. ..
Number (000s)
Notes:
1. Please see Annex 3 for information on which treatments are in each band.
2. Figures presented are rounded. Calculations have been carried out using unrounded figures, which are available in Annex 4 .
Percentage point
Band 1 Band 2 Band 3 Urgent Other Total Band 1 Band 2 Band 3 Urgent Other Total
England 5,474 2,714 493 917 44 9,642 56.8 28.1 5.1 9.5 0.5 100.0
North 1,771 864 148 300 19 3,101 57.1 27.9 4.8 9.7 0.6 100.0
Midlands and East 1,737 822 144 245 12 2,961 58.7 27.8 4.9 8.3 0.4 100.0
London 528 370 92 125 4 1,120 47.2 33.1 8.2 11.2 0.3 100.0
South 1,413 644 107 236 9 2,409 58.6 26.7 4.5 9.8 0.4 100.0
Unallocated 25 13 2 11 0 52 48.4 25.1 4.4 21.6 0.4 100.0
Notes:
1. Please see Annex 3 for which treatments are in each treatment band, and detail on provisional data.
2. Provisional figures are revised in each quarter to account for Courses of Treatment (CoT) reported too late for inclusion in the previous
quarterly report. Final figures are available in the year end report.
3. Figures presented are rounded. Calculations have been carried out using unrounded figures, which are available in Annex 4 .
Number (000s) Percentage of total
NHS Dental Statistics for England: 2015-16, Quarter 1
Copyright © 2015, Health and Social Care Information Centre. All rights reserved. 9
Table 1d: Percentage change in number of CoT by region, Q1 2014/15 to Q1 2015/16 (provisional)
Figure 1b: Percentage change in number of CoT by region, Q1 2014/15 to Q1 2015/16 (provisional)
Q1 2014/15
(Final)
Q1 2015/16
(Provisional)
% change Q1
2014/15 (Final)
to Q1 2015/16
(Provisional)
England 9,674 9,642 -0.3
North 3,087 3,101 0.4
Midlands and East 2,967 2,961 -0.2
London 1,111 1,120 0.8
South 2,451 2,409 -1.7
Unallocated 58 52 -9.4
Notes:
1. Provisional figures are revised in each quarter to account for Courses of Treatment (CoT) reported too
late for inclusion in the previous quarterly report. Final figures are available in the year end report.
2. Figures presented are rounded. Calculations have been carried out using unrounded figures, which are
available in Annex 4 .
NHS Dental Statistics for England: 2015-16, Quarter 1
10 Copyright © 2015, Health and Social Care Information Centre. All rights reserved.
Table 1e: Number and percentage of CoT by patient type and treatment band, as at Q1 2015/16 (provisional)
Table 1f: Percentage of CoT by patient type and treatment band, as at Q1 2015/16 (provisional)
Band 1 Band 2 Band 3 Urgent Other Total Band 1 Band 2 Band 3 Urgent Other Total
Paying Adult 2,852 1,383 230 499 35 4,999 52.1 51.0 46.6 54.4 79.6 51.8
Non-Paying Adult 706 684 248 293 9 1,940 12.9 25.2 50.3 31.9 20.1 20.1
Child 1,916 647 15 125 0 2,704 35.0 23.8 3.1 13.7 0.3 28.0
Total 5,474 2,714 493 917 44 9,642 100.0 100.0 100.0 100.0 100.0 100.0
Number (000s) Percentage
Notes:
1. Please see Annex 3 for information on which treatments are in each treatment band.
2. Figures presented are rounded. Calculations have been carried out using unrounded figures, which are available in Annex 4 .
Paying
Adult
Non-
Paying
Adult
Child Total
Band 1 57.0 36.4 70.9 56.8
Band 2 27.7 35.2 23.9 28.1
Band 3 4.6 12.8 0.6 5.1
Urgent 10.0 15.1 4.6 9.5
Other 0.7 0.5 0.0 0.5
Total 100.0 100.0 100.0 100.0
Notes:
1. Please see Annex 3 for information on which treatments are in each treatment band.
2. Figures presented are rounded. Calculations have been carried out using unrounded figures, which are
available in Annex 4 .
Percentage of total
NHS Dental Statistics for England: 2015-16, Quarter 1
Copyright © 2015, Health and Social Care Information Centre. All rights reserved. 11
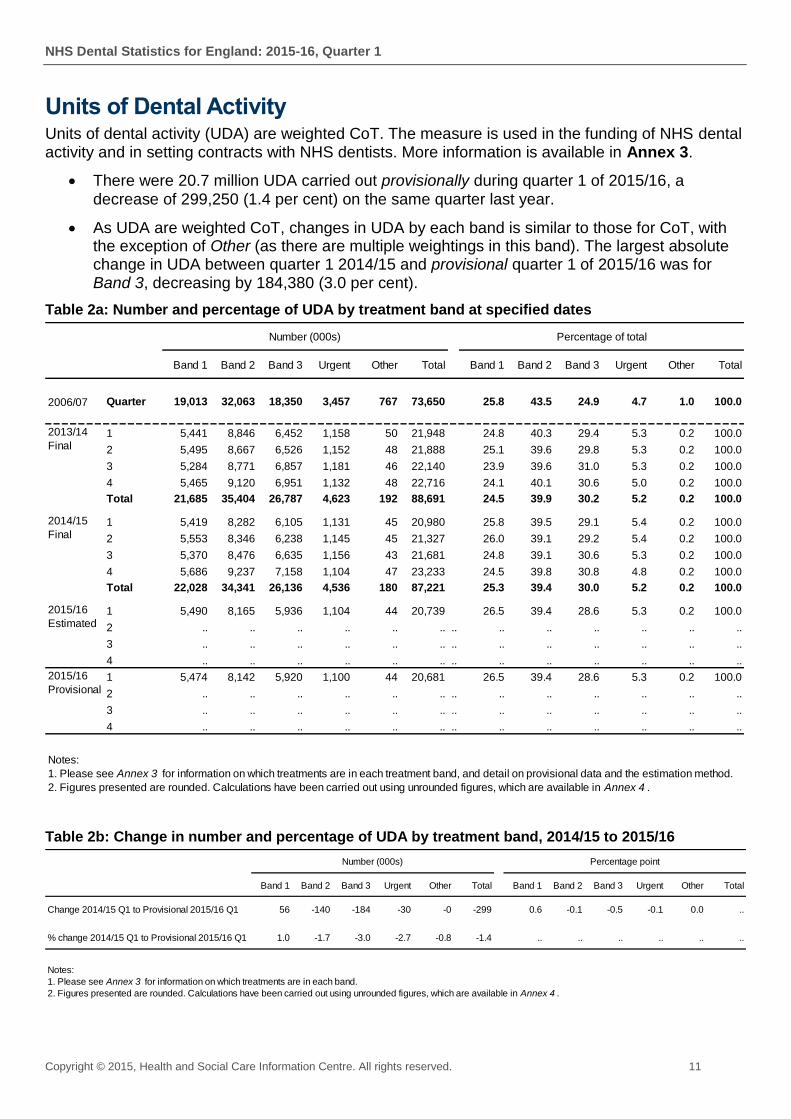
Units of Dental Activity Units of dental activity (UDA) are weighted CoT. The measure is used in the funding of NHS dental activity and in setting contracts with NHS dentists. More information is available in Annex 3.
There were 20.7 million UDA carried out provisionally during quarter 1 of 2015/16, a decrease of 299,250 (1.4 per cent) on the same quarter last year.
As UDA are weighted CoT, changes in UDA by each band is similar to those for CoT, with the exception of Other (as there are multiple weightings in this band). The largest absolute change in UDA between quarter 1 2014/15 and provisional quarter 1 of 2015/16 was for Band 3, decreasing by 184,380 (3.0 per cent).
Table 2a: Number and percentage of UDA by treatment band at specified dates
Table 2b: Change in number and percentage of UDA by treatment band, 2014/15 to 2015/16
Band 1 Band 2 Band 3 Urgent Other Total Band 1 Band 2 Band 3 Urgent Other Total
2006/07 Quarter 19,013 32,063 18,350 3,457 767 73,650 25.8 43.5 24.9 4.7 1.0 100.0
1 5,441 8,846 6,452 1,158 50 21,948 24.8 40.3 29.4 5.3 0.2 100.0
2 5,495 8,667 6,526 1,152 48 21,888 25.1 39.6 29.8 5.3 0.2 100.0
3 5,284 8,771 6,857 1,181 46 22,140 23.9 39.6 31.0 5.3 0.2 100.0
4 5,465 9,120 6,951 1,132 48 22,716 24.1 40.1 30.6 5.0 0.2 100.0
Total 21,685 35,404 26,787 4,623 192 88,691 24.5 39.9 30.2 5.2 0.2 100.0
1 5,419 8,282 6,105 1,131 45 20,980 25.8 39.5 29.1 5.4 0.2 100.0
2 5,553 8,346 6,238 1,145 45 21,327 26.0 39.1 29.2 5.4 0.2 100.0
3 5,370 8,476 6,635 1,156 43 21,681 24.8 39.1 30.6 5.3 0.2 100.0
4 5,686 9,237 7,158 1,104 47 23,233 24.5 39.8 30.8 4.8 0.2 100.0
Total 22,028 34,341 26,136 4,536 180 87,221 25.3 39.4 30.0 5.2 0.2 100.0
1 5,490 8,165 5,936 1,104 44 20,739 26.5 39.4 28.6 5.3 0.2 100.0
2 .. .. .. .. .. .. .. .. .. .. .. .. ..
3 .. .. .. .. .. .. .. .. .. .. .. .. ..
4 .. .. .. .. .. .. .. .. .. .. .. .. ..
1 5,474 8,142 5,920 1,100 44 20,681 26.5 39.4 28.6 5.3 0.2 100.0
2 .. .. .. .. .. .. .. .. .. .. .. .. ..
3 .. .. .. .. .. .. .. .. .. .. .. .. ..
4 .. .. .. .. .. .. .. .. .. .. .. .. ..
2015/16
Provisional
Notes:
1. Please see Annex 3 for information on which treatments are in each treatment band, and detail on provisional data and the estimation method.
2. Figures presented are rounded. Calculations have been carried out using unrounded figures, which are available in Annex 4 .
Number (000s) Percentage of total
2013/14
Final
2014/15
Final
2015/16
Estimated
Band 1 Band 2 Band 3 Urgent Other Total Band 1 Band 2 Band 3 Urgent Other Total
Change 2014/15 Q1 to Provisional 2015/16 Q1 56 -140 -184 -30 -0 -299 0.6 -0.1 -0.5 -0.1 0.0 ..
% change 2014/15 Q1 to Provisional 2015/16 Q1 1.0 -1.7 -3.0 -2.7 -0.8 -1.4 .. .. .. .. .. ..
Percentage pointNumber (000s)
Notes:
1. Please see Annex 3 for information on which treatments are in each band.
2. Figures presented are rounded. Calculations have been carried out using unrounded figures, which are available in Annex 4 .
NHS Dental Statistics for England: 2015-16, Quarter 1
12 Copyright © 2015, Health and Social Care Information Centre. All rights reserved.
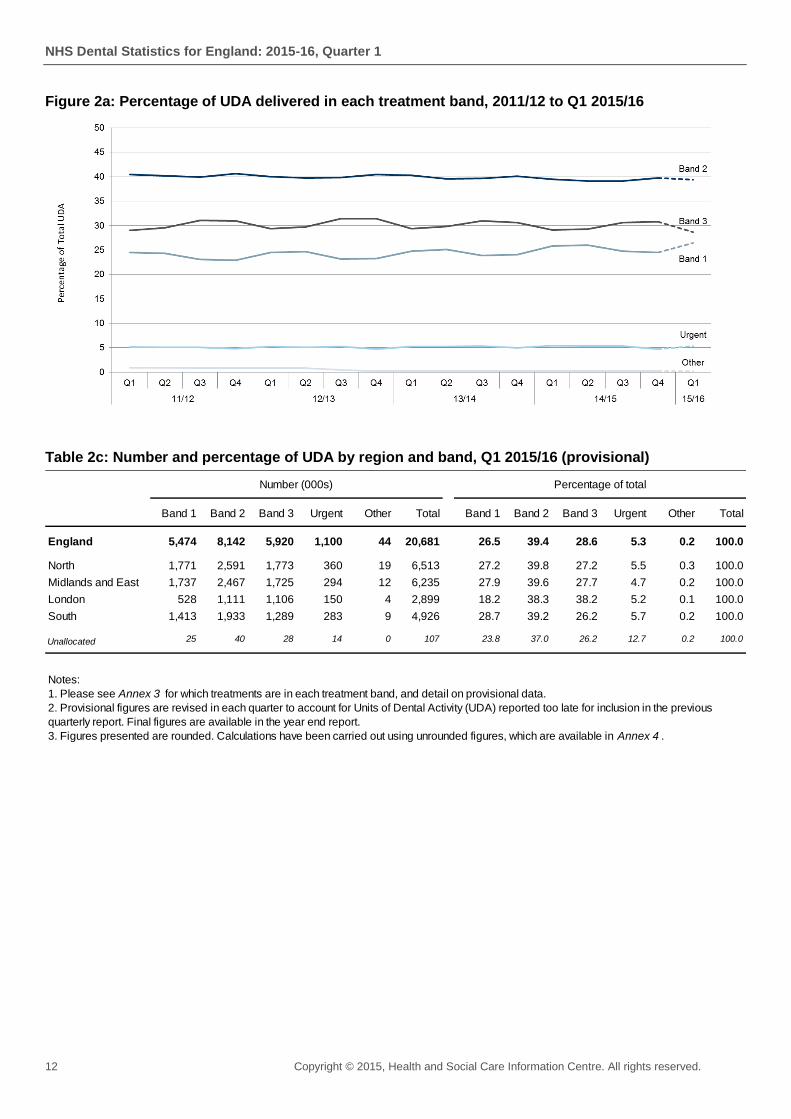
Figure 2a: Percentage of UDA delivered in each treatment band, 2011/12 to Q1 2015/16
Table 2c: Number and percentage of UDA by region and band, Q1 2015/16 (provisional)
Band 1 Band 2 Band 3 Urgent Other Total Band 1 Band 2 Band 3 Urgent Other Total
England 5,474 8,142 5,920 1,100 44 20,681 26.5 39.4 28.6 5.3 0.2 100.0
North 1,771 2,591 1,773 360 19 6,513 27.2 39.8 27.2 5.5 0.3 100.0
Midlands and East 1,737 2,467 1,725 294 12 6,235 27.9 39.6 27.7 4.7 0.2 100.0
London 528 1,111 1,106 150 4 2,899 18.2 38.3 38.2 5.2 0.1 100.0
South 1,413 1,933 1,289 283 9 4,926 28.7 39.2 26.2 5.7 0.2 100.0
Unallocated 25 40 28 14 0 107 23.8 37.0 26.2 12.7 0.2 100.0
Number (000s) Percentage of total
Notes:
1. Please see Annex 3 for which treatments are in each treatment band, and detail on provisional data.
2. Provisional figures are revised in each quarter to account for Units of Dental Activity (UDA) reported too late for inclusion in the previous
quarterly report. Final figures are available in the year end report.
3. Figures presented are rounded. Calculations have been carried out using unrounded figures, which are available in Annex 4 .
NHS Dental Statistics for England: 2015-16, Quarter 1
Copyright © 2015, Health and Social Care Information Centre. All rights reserved. 13
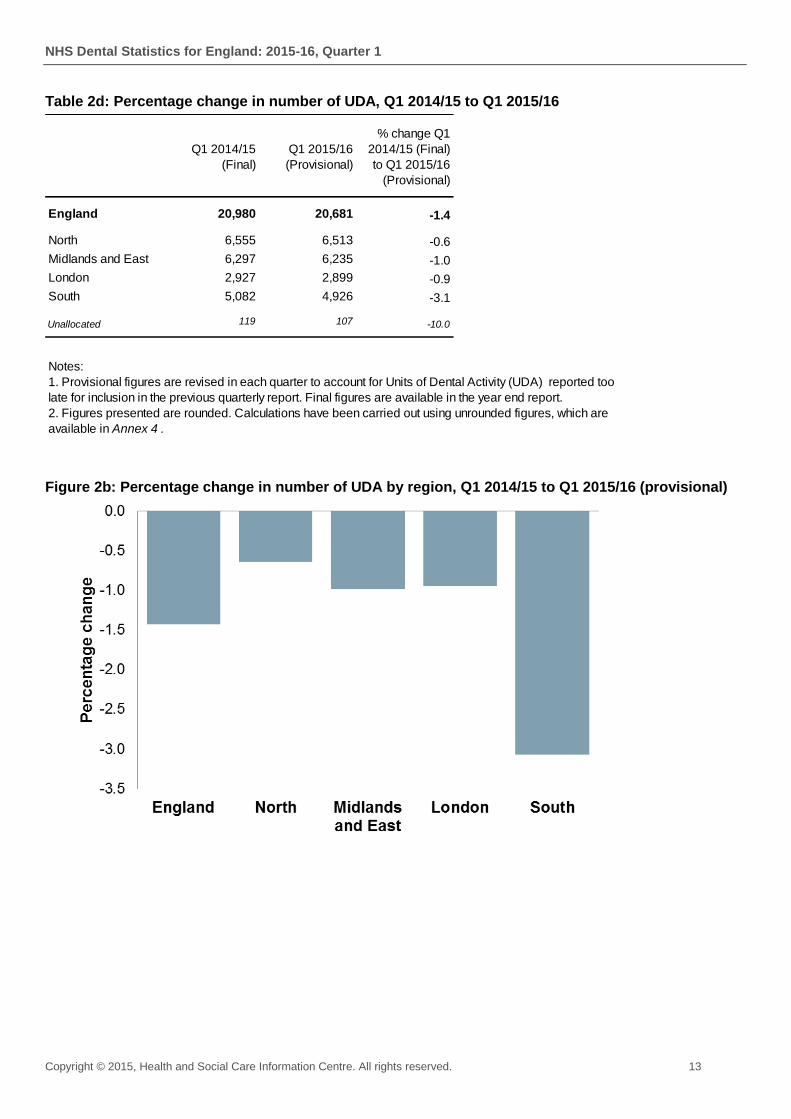
Table 2d: Percentage change in number of UDA, Q1 2014/15 to Q1 2015/16
Figure 2b: Percentage change in number of UDA by region, Q1 2014/15 to Q1 2015/16 (provisional)
Q1 2014/15
(Final)
Q1 2015/16
(Provisional)
% change Q1
2014/15 (Final)
to Q1 2015/16
(Provisional)
England 20,980 20,681 -1.4
North 6,555 6,513 -0.6
Midlands and East 6,297 6,235 -1.0
London 2,927 2,899 -0.9
South 5,082 4,926 -3.1
Unallocated 119 107 -10.0
Notes:
1. Provisional figures are revised in each quarter to account for Units of Dental Activity (UDA) reported too
late for inclusion in the previous quarterly report. Final figures are available in the year end report.
2. Figures presented are rounded. Calculations have been carried out using unrounded figures, which are
available in Annex 4 .

NHS Dental Statistics for England: 2015-16, Quarter 1
14 Copyright © 2015, Health and Social Care Information Centre. All rights reserved.
Table 2e: Number and percentage of UDA by patient type and treatment band, as at Q1 2015/16 (provisional)
Table 2f: Percentage of UDA by patient type and treatment band, as at Q1 2015/16 (provisional)
Band 1 Band 2 Band 3 Urgent Other Total Band 1 Band 2 Band 3 Urgent Other Total
Paying Adult 2,852 4,149 2,758 599 35 10,393 52.1 51.0 46.6 54.4 79.6 50.3
Non-Paying Adult 706 2,051 2,978 351 9 6,095 12.9 25.2 50.3 31.9 20.1 29.5
Child 1,916 1,942 185 150 0 4,193 35.0 23.8 3.1 13.7 0.3 20.3
Total 5,474 8,142 5,920 1,100 44 20,681 100.0 100.0 100.0 100.0 100.0 100.0
Number (000s) Percentage
Notes:
1. Please see Annex 3 for information on which treatments are in each treatment band.
2. Figures presented are rounded. Calculations have been carried out using unrounded figures, which are available in Annex 4 .
Paying
Adult
Non-
Paying
Adult
Child Total
Band 1 27.4 11.6 45.7 26.5
Band 2 39.9 33.6 46.3 39.4
Band 3 26.5 48.9 4.4 28.6
Urgent 5.8 5.8 3.6 5.3
Other 0.3 0.1 0.0 0.2
Total 100.0 100.0 100.0 100.0
Notes:
1. Please see Annex 3 for information on which treatments are in each treatment band.
2. Figures presented are rounded. Calculations have been carried out using unrounded figures, which are
available in Annex 4 .
Percentage of total
NHS Dental Statistics for England: 2015-16, Quarter 1
Copyright © 2015, Health and Social Care Information Centre. All rights reserved. 15
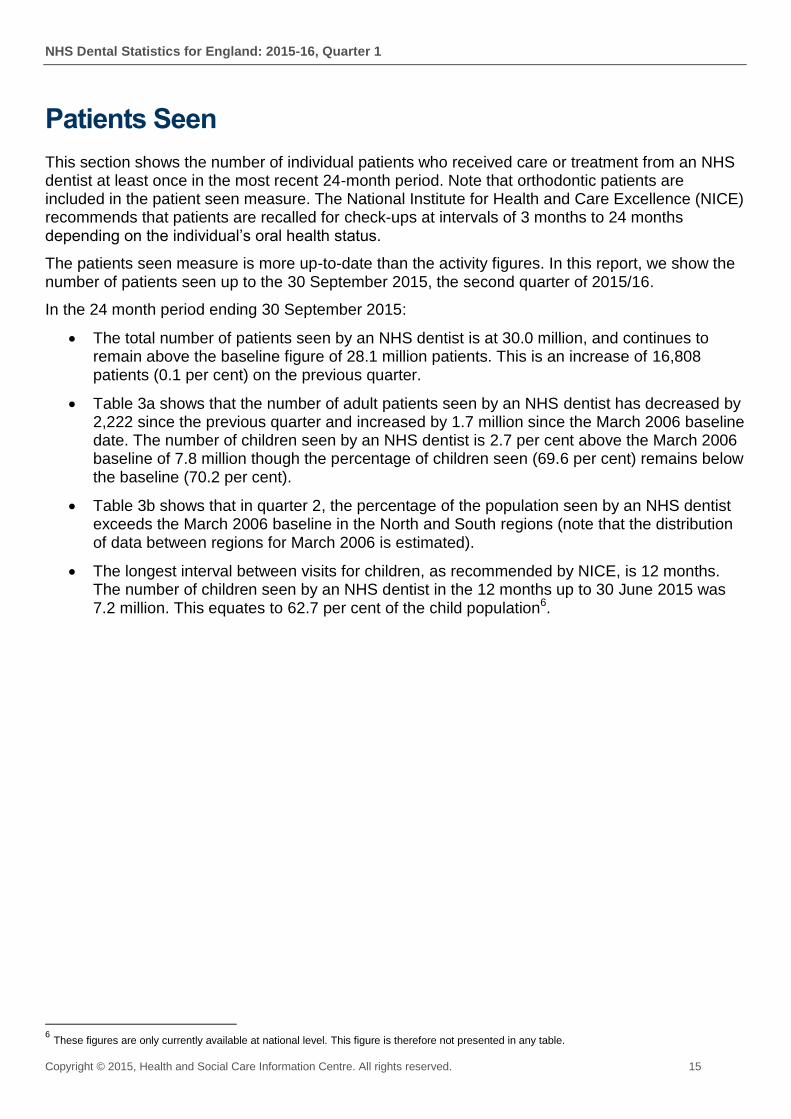
Patients Seen
This section shows the number of individual patients who received care or treatment from an NHS dentist at least once in the most recent 24-month period. Note that orthodontic patients are included in the patient seen measure. The National Institute for Health and Care Excellence (NICE) recommends that patients are recalled for check-ups at intervals of 3 months to 24 months depending on the individual’s oral health status.
The patients seen measure is more up-to-date than the activity figures. In this report, we show the number of patients seen up to the 30 September 2015, the second quarter of 2015/16.
In the 24 month period ending 30 September 2015:
The total number of patients seen by an NHS dentist is at 30.0 million, and continues to remain above the baseline figure of 28.1 million patients. This is an increase of 16,808 patients (0.1 per cent) on the previous quarter.
Table 3a shows that the number of adult patients seen by an NHS dentist has decreased by 2,222 since the previous quarter and increased by 1.7 million since the March 2006 baseline date. The number of children seen by an NHS dentist is 2.7 per cent above the March 2006 baseline of 7.8 million though the percentage of children seen (69.6 per cent) remains below the baseline (70.2 per cent).
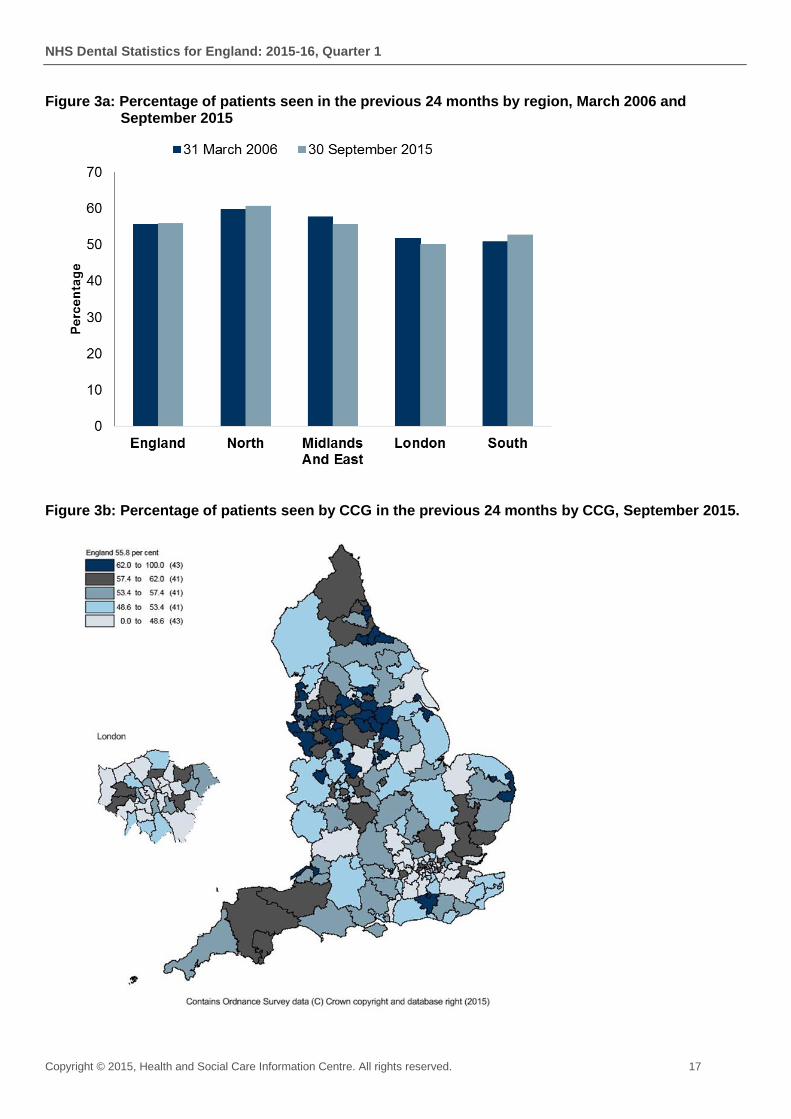
Table 3b shows that in quarter 2, the percentage of the population seen by an NHS dentist exceeds the March 2006 baseline in the North and South regions (note that the distribution of data between regions for March 2006 is estimated).
The longest interval between visits for children, as recommended by NICE, is 12 months. The number of children seen by an NHS dentist in the 12 months up to 30 June 2015 was 7.2 million. This equates to 62.7 per cent of the child population6.
6 These figures are only currently available at national level. This figure is therefore not presented in any table.

NHS Dental Statistics for England: 2015-16, Quarter 1
16 Copyright © 2015, Health and Social Care Information Centre. All rights reserved.
Table 3a: Number of patient seen and the percentage of the population seen in the previous 24 months at specified dates
Table 3b: Number and percentage of patient seen in the previous 24 months by region, at specified dates
Adults Child Total Adult Child Total
31 Mar 2006 20,348 7,797 28,145 51.5 70.2 55.6
30 Jun 2012 21,761 7,813 29,574 52.1 68.9 55.7
30 Sep 2012 21,772 7,811 29,583 52.1 68.9 55.7
31 Dec 2012 21,888 7,830 29,718 52.4 69.0 56.0
31 Mar 2013 21,938 7,838 29,776 52.1 68.6 55.7
30 Jun 2013 21,962 7,851 29,813 52.2 68.7 55.7
30 Sep 2013 21,947 7,855 29,802 52.2 68.8 55.7
31 Dec 2013 22,033 7,876 29,909 52.4 68.9 55.9
31 Mar 2014 22,024 7,892 29,916 52.0 68.6 55.5
30 Jun 2014 22,009 7,907 29,916 52.0 68.7 55.5
30 Sep 2014 22,004 7,927 29,931 51.9 68.9 55.6
31 Dec 2014 22,055 7,950 30,005 52.1 69.1 55.7
31 Mar 2015 22,096 7,987 30,083 52.2 69.4 55.8
30 Jun 2015 22,032 7,992 30,024 52.0 69.5 55.7
30 Sep 2015 22,030 8,011 30,041 52.0 69.6 55.8
Change Mar 2006 to Sep 2015 1,682 214 1,897 0.5 -0.5 0.2
Change Jun 2015 to Sep 2015 -2 19 17 0.0 0.2 0.0
% Change Mar 2006 to Sep 2015 8.3 2.7 6.7 .. .. ..
% Change Jun 2015 to Sep 2015 0.0 0.2 0.1 .. .. ..
Number (000s) Percentage of population
Notes:
1. Figures presented are rounded. Calculations have been carried out using unrounded figures, which are available in Annex 4 .
31 Mar 06
(baseline)30 June 15 30 Sept 15
Mar 06 to
Sept 15
June 15 to
Sept 15
Mar 06 to
Sept 15
June 15 to
Sept 15
31 Mar 06
(baseline)30 June 15 30 Sept 15
Mar 06 to
Sept 15
June 15 to
Sept 15
England 28,145 30,024 30,041 1,897 17 6.7 0.1 55.6 55.7 55.8 0.2 0.0
North 8,751 9,211 9,220 469 9 5.4 0.1 59.7 60.6 60.7 1.0 0.1
Midlands And East 8,872 9,103 9,098 227 -5 2.6 -0.1 57.8 55.7 55.7 -2.1 -0.0
London 3,890 4,199 4,209 320 11 8.2 0.3 51.7 49.9 50.0 -1.7 0.1
South 6,632 7,331 7,336 704 5 10.6 0.1 50.8 52.7 52.7 2.0 0.0
Unallocated .. 181 177 .. -4 .. -1.9 .. .. .. .. ..
Percentage point
change
Notes:
1. Figures presented are rounded. Calculations have been carried out using unrounded figures, which are available in Annex 4 .
2. Please see Annex 3 for information on the population figures used in calculations.
3. Data prior to 2013/14 have been mapped to the new structure, and are therefore an estimate.
4. Numbers in previous quarters may change due to updated postcode allocation.
Number (000s) Change (000s) Percentage change Percentage of population
NHS Dental Statistics for England: 2015-16, Quarter 1
Copyright © 2015, Health and Social Care Information Centre. All rights reserved. 17
Figure 3a: Percentage of patients seen in the previous 24 months by region, March 2006 and September 2015
Figure 3b: Percentage of patients seen by CCG in the previous 24 months by CCG, September 2015.

NHS Dental Statistics for England: 2015-16, Quarter 1
18 Copyright © 2015, Health and Social Care Information Centre. All rights reserved.
Annexes
The annexes that accompany this report are available at:
http://www.hscic.gov.uk/pubs/dental1516q1
Annex 1 – Report tables and charts (Excel workbook)
All tables and charts presented in this report in Excel format.
Annex 2 – CCG, AT, Region and LA level data (Excel workbook)
Sub-national level, patients seen data
Annex 3 – Technical Information (.pdf file)
This contains in-depth information regarding the use and interpretation of the data and historical changes to the population and methodologies.
Annex 4 – Source Data (csv files)
There are two source data files
These files contain CCG and Local Authority (LA) level data for the specified data sets. Parent_Code1 and Parent_Code2 relate to NHS Geography Regions and NHS Commissioning Regions respectively. Parent codes are only provided for CCG level data and therefore these columns for LA data are purposely left blank. NHS Dental Statistics for England - 2014/15: Annex 4 (Activity) NHS Dental Statistics for England - 2014/15: Annex 4 (PatientsSeen)
Other Annexes
We also publish a guide to our NHS dental publications and a data quality statement

NHS Dental Statistics for England: 2015-16, Quarter 1
Copyright © 2015, Health and Social Care Information Centre. All rights reserved. 19
Other Publications
A full list of Health and Social Care Information Centre (HSCIC) reports produced on dentistry can be found within the dentistry link at: http://www.hscic.gov.uk/primary-care
For information on other data related to the dental sector, please see our Guide to NHS Dental Publications available at: http://www.hscic.gov.uk/pubs/dental1516q1
Information on the commissioning arrangements for the primary care services is available from NHS England at: http://www.england.nhs.uk/ourwork/d-com/primary-care-comm/
NHS England publishes regular information on dental commissioning. Note that these data are not directly comparable with the activity statistics presented in this report. Figures are available via: http://www.england.nhs.uk/statistics/
The Department of Health’s ‘Delivering Better Oral Health’ toolkit is available at: http://webarchive.nationalarchives.gov.uk/+/www.dh.gov.uk/en/Publicationsandstatistics/Publications/PublicationsPolicyAndGuidance/DH_078742
Dental activity data for other UK countries are available as follows:
Scotland – http://www.isdscotland.org/Health-Topics/Dental-Care/
Wales – https://statswales.wales.gov.uk/Catalogue/Health-and-Social-Care/General-Dental-Services/Current-Contract
Northern Ireland – http://www.hscbusiness.hscni.net/services/1805.htm
NHS Dental Statistics for England: 2015-16, Quarter 1
20 Copyright © 2015, Health and Social Care Information Centre. All rights reserved.
Published by the Health and Social Care Information Centre
Part of the Government Statistical Service
Responsible Statistician
Gemma Ramsay, Section Head
ISBN 978-1-78386-550-5
This publication may be requested in large print or other formats.
For further information
www.hscic.gov.uk
0300 303 5678
Copyright © 2015 Health and Social Care Information Centre. All rights reserved.
This work remains the sole and exclusive property of the Health and Social Care Information Centre and may only be reproduced where there is explicit reference to the ownership of the Health and Social Care Information Centre.
This work may be re-used by NHS and government organisations without permission.