NHS Atlas of Variation in Diagnostic Services Prof Erika Denton NCD Diagnostics.
16
NHS Atlas of Variation in Diagnostic Services Prof Erika Denton NCD Diagnostics
Transcript of NHS Atlas of Variation in Diagnostic Services Prof Erika Denton NCD Diagnostics.

NHS Atlas of Variation in
Diagnostic Services
Prof Erika DentonNCD Diagnostics

Projected Rate Of Population Growth By Age Last Birthday
Graph showing projected rate of growth of Projected populations at mid-years by age last birthday (under 60 years and over 60 years) over the next 8 years.
Source: Government's actuarial department
0%
2%
4%
6%
8%
10%
12%
14%
16%
Year
Projected Population Increase from 2004 %
Under 60 (% increase from 2004)Over 60 (% increase from 2004)
Under 60 (% increase from 2004) 0.0% 0.5% 0.8% 0.8% 0.7% 0.9% 1.0% 1.3% 1.5%
Over 60 (% increase from 2004) 0.0% 1.4% 2.8% 5.6% 7.9% 9.8% 11.5% 13.1% 14.6%
2004 2005 2006 2007 2008 2009 2010 2011 2012
The vast majority of increase in population over the next 6 years is predicted to be in the 60+ age bracket.
The vast majority of increase in population over the next 6 years is predicted to be in the 60+ age bracket.
(Source: Government’s actuarial department).
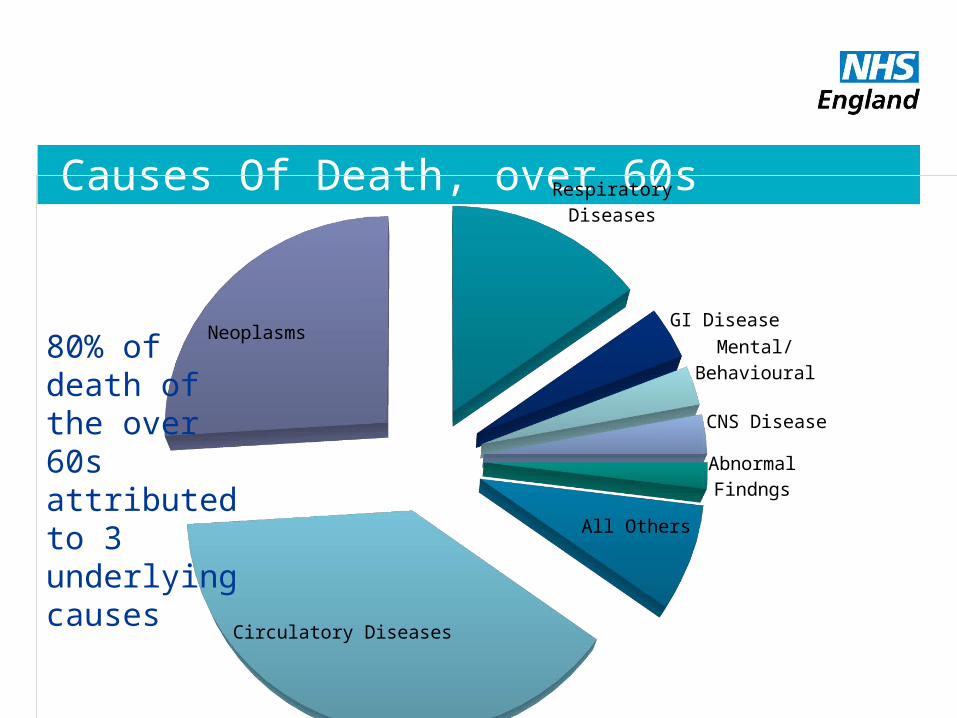
Causes Of Death, over 60s Respiratory Diseases
GI DiseaseMental/
Be-havioural
CNS DiseaseAbnormal Findngs
All Others
Circulatory Diseases
Neoplasms80% of death of the over 60s attributed to 3 underlying causes
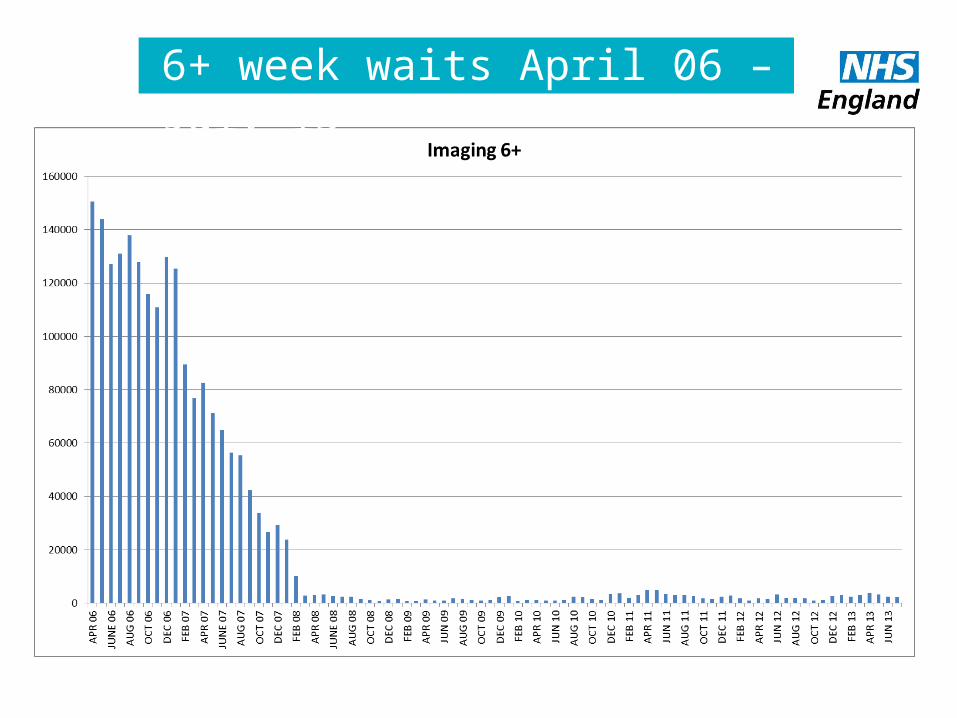
6+ week waits April 06 – July 13
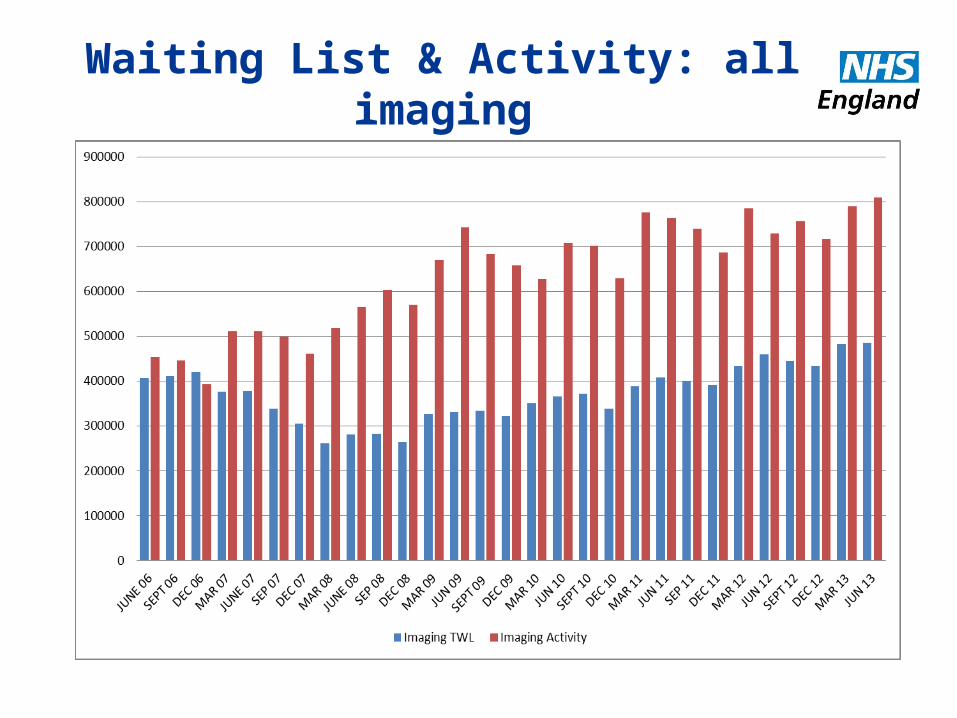
Waiting List & Activity: all imaging
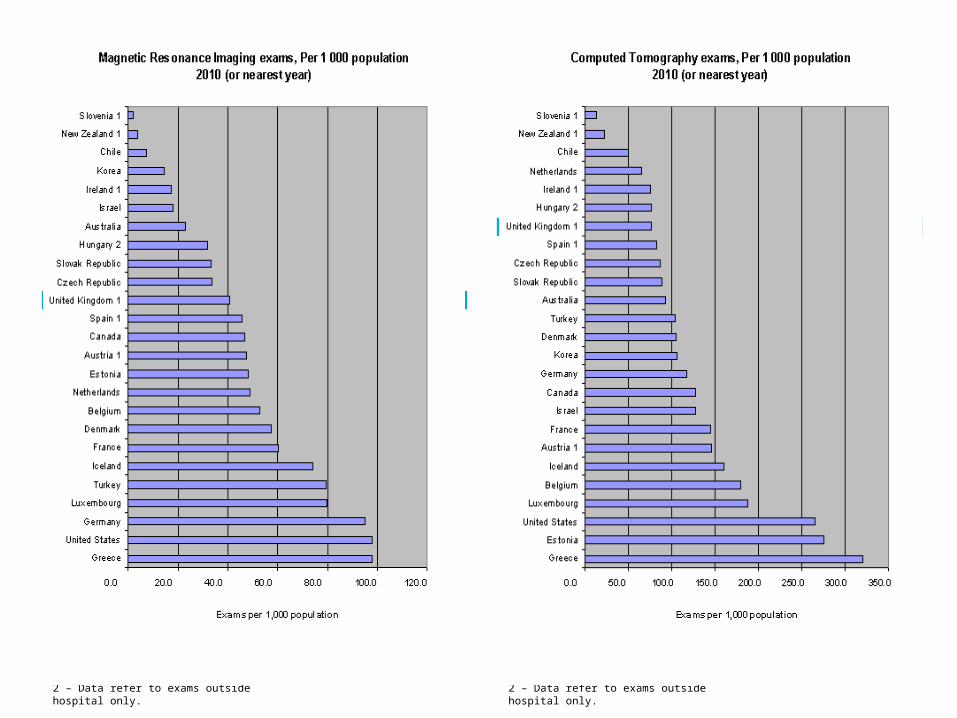
1 – Data refer to exams in hospital only.
2 – Data refer to exams outside hospital only.
1 – Data refer to exams in hospital only.
2 – Data refer to exams outside hospital only.

1 – Data include equipment in hospital only.
1 – Data include equipment in hospital only.
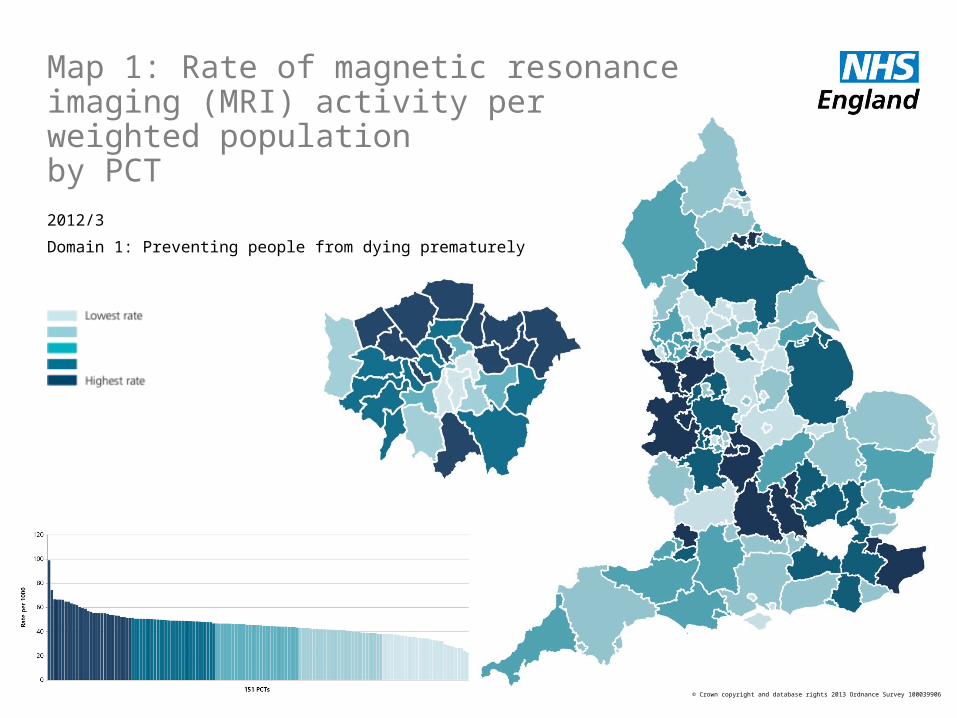
Map 1: Rate of magnetic resonance imaging (MRI) activity per weighted population by PCT
2012/3
Domain 1: Preventing people from dying prematurely
© Crown copyright and database rights 2013 Ordnance Survey 100039906
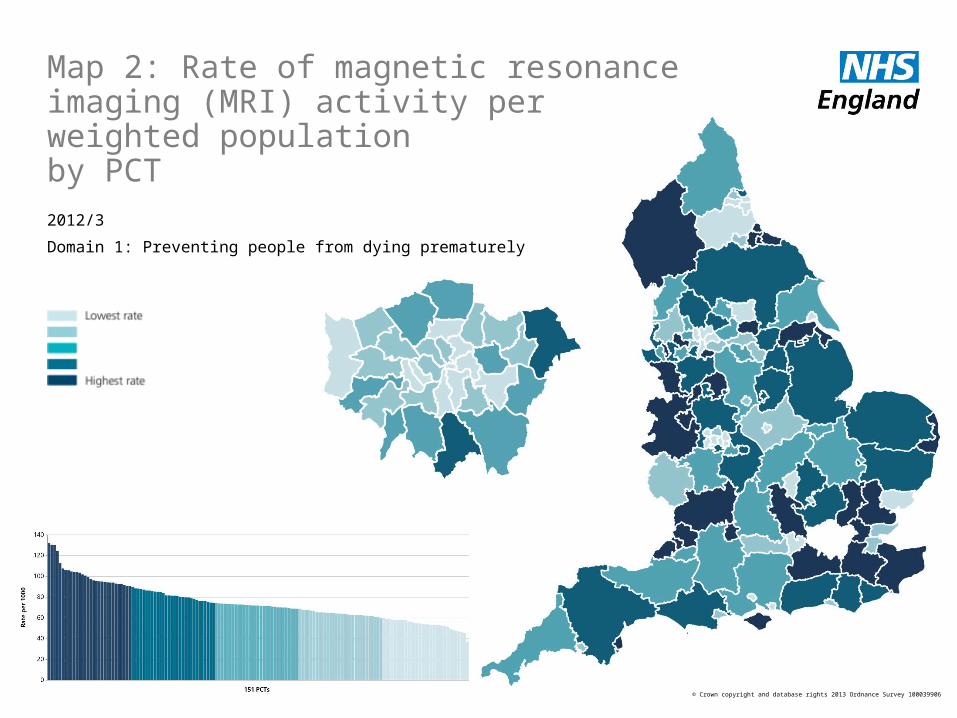
Map 2: Rate of magnetic resonance imaging (MRI) activity per weighted population by PCT
2012/3
Domain 1: Preventing people from dying prematurely
© Crown copyright and database rights 2013 Ordnance Survey 100039906

Map 3: Rate of non-obstetric ultrasound activity per weighted population by PCT
2012/3
Domain 1: Preventing people from dying prematurely
© Crown copyright and database rights 2013 Ordnance Survey 100039906

Map 6: Median time (minutes) from arrival at hospital to brain imaging for stroke patients by hospital
October–December 2012
Domain 1: Preventing people from dying prematurely
Domain 2: Enhancing quality of life for people with long-term conditions
Domain 3: Helping people to recover from episodes of ill health or following injury
© Crown copyright and database rights 2013 Ordnance Survey 100039906

Map 7: Proportion (%) of stroke patients undergoing brain imaging within 1 hour of arrival at hospital by hospital
October–December 2012
Domain 1: Preventing people from dying prematurely
Domain 2: Enhancing quality of life for people with long-term conditions
Domain 3: Helping people to recover from episodes of ill health or following injury
© Crown copyright and database rights 2013 Ordnance Survey 100039906
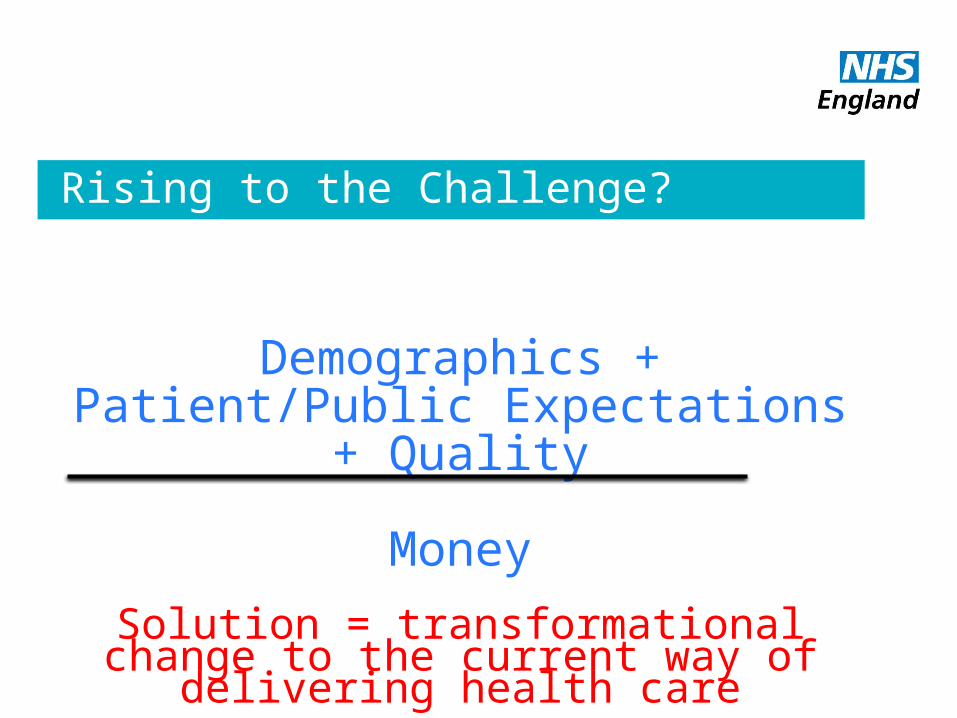
Rising to the Challenge?
Demographics + Patient/Public Expectations + Quality
Money
Solution = transformational change to the current way of delivering health care

Traditional vs ‘New’ change methodology
Transactional change:
Doing things better
Transformational change:
Doing better things

Tools to effect change
• Accurate diagnostic data: activity, capacity, reporting times
• Published evidence
• Guidelines: NICE, collegiate etc
• Official reports: NAO, NCEPOD, CQC, Francis etc
• Policy drivers, eg: Commissioning changes, Stroke Strategy, Cardiac networks, Cancer reform,
• Predictable demographic changes
• Communication: clinical, managerial & with commissioners

‘You can’t solve a problem by using the same thinking that created it’
Albert Einstein