Nha Renewables Mann
29
National Renewable Energy Laboratory Renewable Hydrogen: The Potential Resource Potential National Hydrogen Association Renewables to Hydrogen Forum October 4-5, 2006 Albuquerque, NM Margaret K. Mann, Anelia Milbrandt National Renewable Energy Laboratory
-
Upload
debbi-smith -
Category
Business
-
view
286 -
download
0
Transcript of Nha Renewables Mann

National Renewable Energy Laboratory
Renewable Hydrogen: The Potential Resource Potential
National Hydrogen AssociationRenewables to Hydrogen Forum
October 4-5, 2006Albuquerque, NM
Margaret K. Mann, Anelia MilbrandtNational Renewable Energy Laboratory

Preview
• Raw Resource Base– Wind– Solar– Biomass
• How Much Hydrogen?– Wind– Solar– Biomass– Total
• Context– Population– Gasoline Consumption– Are there Gaps? (HINT: There’s a happy ending)
• Analysis: H2A

Resource: Wind
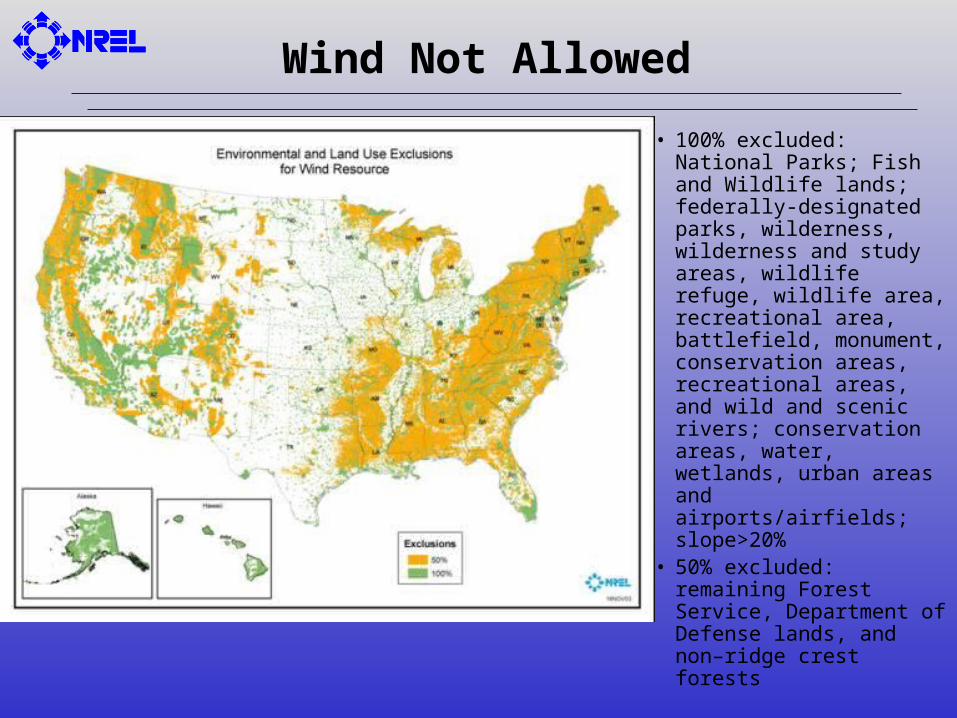
Wind Not Allowed
• 100% excluded: National Parks; Fish and Wildlife lands; federally-designated parks, wilderness, wilderness and study areas, wildlife refuge, wildlife area, recreational area, battlefield, monument, conservation areas, recreational areas, and wild and scenic rivers; conservation areas, water, wetlands, urban areas and airports/airfields; slope>20%
• 50% excluded: remaining Forest Service, Department of Defense lands, and non–ridge crest forests

When the Wind Blows….
Class Capacity Factor Hours/Year
3 20% 1,752
4 25.1% 2,199
5 32.25% 2,825
6 39.4% 3,451
7 39.4% 3,451
Source: Power Technologies Energy Data Book, http://www.nrel.gov/analysis/power_databook/
Implications: Cost of capital, Utility applications (e.g., peak shaving), Storage, Delivery

Aggregate Wind Power
Xcel Aggregate Wind
PonnequinPeetzLamar
Aggregate Wind
Can increase capacity factor to 95%

Resource: Solar
Min: 2.2 kWh/m2/day in portions of Alaska
Max: 7.0 kWh/m2/day in the Southwestern U.S.

Solar Not Allowed

Resource: Biomass
• Ag crop residues
• Animal manure
• Forest residues
• Mill residues• Urban wood
waste• Landfill gas• Wastewater
treatment• Dedicated
energy crops on CRP Land

Where We Live

Making Hydrogen From Renewables
Multitude of ways to make hydrogen from renewables; representative technologies were studied here
Assumptions for this analysis:• Wind
– Electrolysis: 58.8 kWh/kg hydrogen (66.3% efficient)– Terrain exposure factor: 5% for ridge-crests, 35% for slight hills, 65% for hilly
areas, and 90% for generally flat terrain– Minimum density criteria of 5 km2 per 100 km2 (eliminates small, isolated wind
resource areas)• Solar
– PV– Max 10% of land developed; 30% of this covered with panels -> 3% of total non-
excluded land covered with PV panels– Electrical efficiency of PV : 10%– Electrolysis: 58.8 kWh/kg hydrogen (66.3% efficient)
• Biomass– Lignocellulosics via gasification/reforming: 13.8 kg H2/kg bone dry biomass– Gaseous (methane-producing) feedstocks 2.34 kg methane/kg H2

Hydrogen from WindPer County

Hydrogen from WindPer Person

Hydrogen from SolarPer County

Hydrogen from SolarPer Person

Hydrogen from BiomassPer County

Hydrogen from BiomassPer Person

Total Renewable HydrogenPer County

Total Renewable HydrogenPer Person

Dominant Resource for Hydrogen

State of Being
What’s one State’s biomass is another State’s windHydrogen Potential from Renewable Resources
0%
20%
40%
60%
80%
100%
WindSolarBiomas
MTNENVNHNJ
U.S. Total
% of Total Resource Per State
Biomass Solar Wind

Gasoline Consumption

Is There Enough?
On a gge basis (no advantage given for fuel cell efficiency)

State of IndependenceRenewable Hydrogen Potential Relative to Gasoline Consumption by State
0
20,000
40,000
60,000
80,000
100,000
120,000
Hydrogen from Renew able Resources (kg) 2002 Gasoline Consumption (gallons)
Energy equivalent basis (gge): no advantage given to hydrogen for higher fuel cell efficiency
NJ NM NY
U.S. total: H2 / gasoline = 7.4Max: AK (203), MT (120), WY (120), ND (115), SD (114)Min: DC (0.1), NJ (0.4), RI (0.5), MA (0.6), CT (0.6)

Proximity to Resources
East Coast
San FranciscoLos Angeles
Seattle

Determining the Cost of Utilizing Renewable Resources: H2A
Improve the transparency and consistency of analysis, improve the understanding of the differences among analyses, and seek better validation from industry.

H2A Model
Category Cost Contributions
$0.9
$0.7
$0.0
$0.2
$0.1
-$0.1
-$0.2
$0.0
$0.2
$0.4
$0.6
$0.8
$1.0
Capital Cost Feedstock Cost Other Raw Material Fixed O&M Cost Other Variable O&MCost
Byproduct CreditCost
Category
Cont
ribut
ion
to R
equi
red
Hyd
roge
n Se
lling
Pr
ice
($/k
g)
R esults - P rice of H 2
Cash F low Analysis
R eplacem ent C apita l
Cost Inputs
F inancing Inputs
P rocess F lowsheet &S tream Sum m ary
Technology Perform anceAssum ptions
Feedstock & U tility Prices
Process D escription
Base Case H2A Guidelines
Reference $ Year (in half-decade increments) 2000 2000
Assumed Start-up Year 2005 2005, 2015, 2030
After-Tax Real IRR (%) 10% 10%Depreciation Type (MACRS, Straight Line) MACRS MACRS
Depreciation Schedule Length (No. of Years) 20 20Analysis Period (years) 40 40
Plant Life (years) 40 40Assumed Inflation Rate (%) 1.90% 1.90%
State Income Taxes (%) 6.0% 6%Federal Income Taxes (%) 35.0% 35%
Effective Tax Rate (%) 38.9%Design Capacity at 100% Capacity (kg of H2/day) -
Operating Capacity Factor (%) 90% Varies according to case
Plant Output (kg H2/day) - Plant Output (kg H2/year) -
% Equity Financing 100% 100%% Debt Financing 0% 0%
VARIABLE PRODUCTION COSTS (at 100% capacity, startup year dollars)Base Case:
Feedstock CostsType of electricity used none
Escalating electricity cost? (Enter yes or no) Yes
Enter electricity cost if NO is selected above ($/kWh)Electricity consumption (kWh/kg H2)
Electricity cost in startup year ($/kWh)
Electricity cost ($/year, startup year dollars) $0
Type of natural gas used None
Natural gas energy content, LHV, if standard H2A value is not desired (GJ/Nm3) 0.038
Escalating natural gas cost? (Enter yes or no) Yes
Enter natural gas cost if NO is selected above ($/Nm3)Natural gas consumption (Nm3/kg of H2) 0
Hydrogen Selling Price and Cost Contributions (Year 2000 $) Required Hydrogen Selling Price ($(Year 2000)/kg of H2) $1.886
Capital Cost Contribution ($/kg of H2) $0.779 Feedstock cost contribution ($/kg of H2) $0.642
Fixed O&M (labor etc.) cost contribution ($/kg of H2) $0.217Other Variable O&M cost contribution ($/kg of H2) $0.248
Byproduct credit cost contribution ($/kg of H2) $0.000
Solve Cash Flow for Desired IRR

H2A Website
www.hydrogen.energy.gov/h2a_analysis.html
Visits Modeling Tools: Unique Users
Modeling Tools: Total Downloads
Oct. 2005 1,004 566 283
Nov. 2005 1,973 1,098 535
Dec. 2005 1,110 369 227
Jan. 2006 1,172 183 135
Feb. 2006 853 227 154
March 2006 812 467 271
April 2006 1,080 334 188
May 2006 1,164 334 249
TOTAL 9,168 3,578 2,042

Wrap-up
• Renewable resource potential in U.S. is very large, even with conservative land exclusions
• Wind and solar dominate (electrolysis not an optional technology)
• Resources don’t always line up with population• Even large population centers are close to significant
resources• Hydrogen technologies & infrastructure cannot be averaged
across country• Hydrogen delivery and storage, and interaction with electric
utility sector vitally important• Analysis begins with a solid understanding of the potential,
followed by consistent approach