NGS Data Analysis Using Partek Software Workshop_NGS Data Analysis Overview.pdf · NGS Data...
53
NGS Data Analysis Using Partek ® Software Xiaowen Wang Field Application Specialist
Transcript of NGS Data Analysis Using Partek Software Workshop_NGS Data Analysis Overview.pdf · NGS Data...
NGS Data Analysis Using
Partek® Software
Xiaowen Wang
Field Application Specialist
Who is Partek?
• Founded in 1993
• Building tools for statistics & visualization
• Focused on genomics
• Thousands of customers worldwide
• Worldwide, world-class customer support
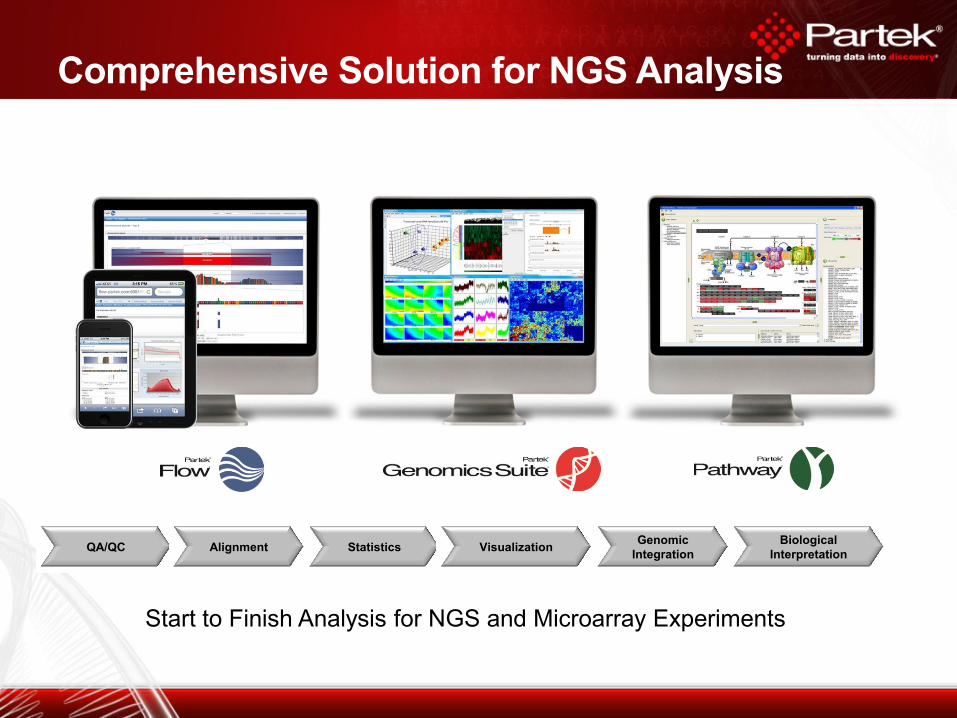
Comprehensive Solution for NGS Analysis
QA/QC Alignment Statistics Visualization Genomic
Integration
Biological
Interpretation
Start to Finish Analysis for NGS and Microarray Experiments
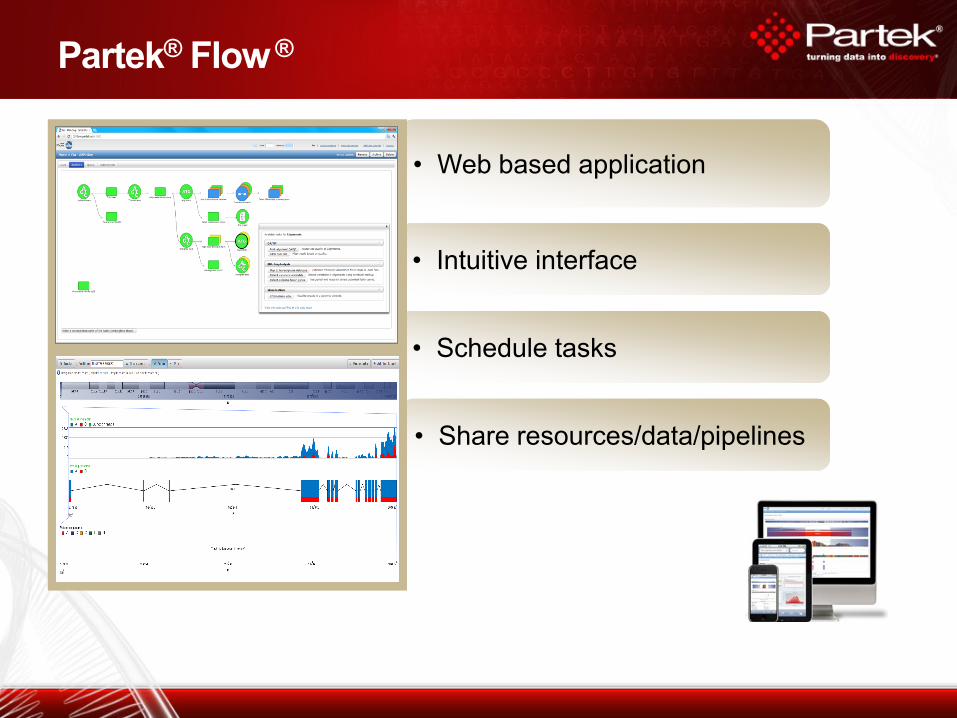
Partek® Flow ®
• Web based application • Web based application
• Schedule tasks • Schedule tasks
• Share resources/data/pipelines • Share resources/data/pipelines
• Intuitive interface • Intuitive interface
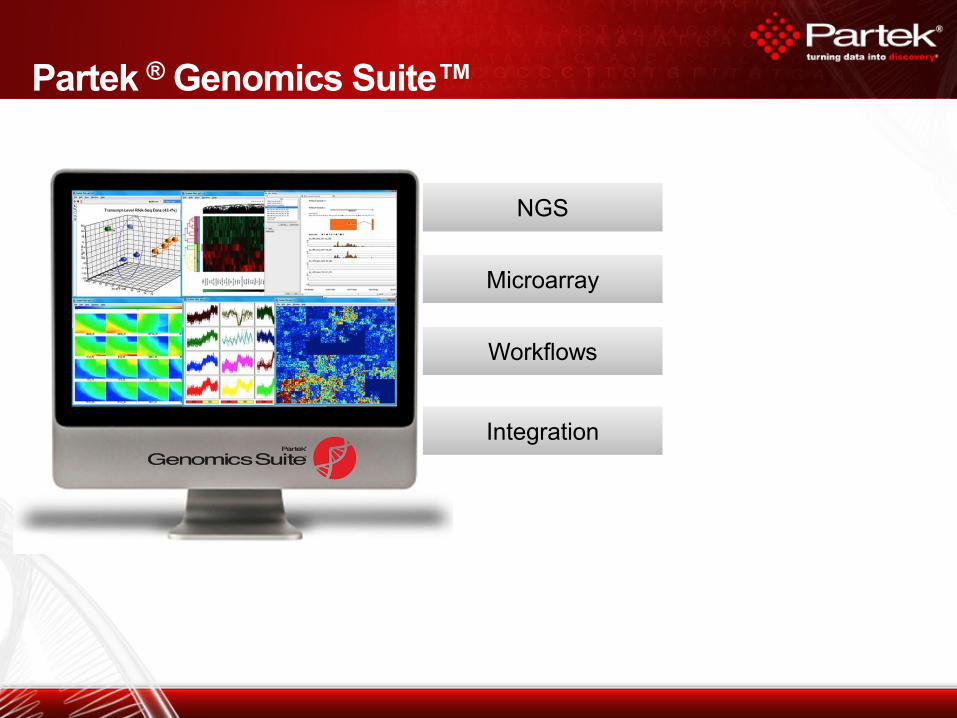
Partek ® Genomics Suite™
NGS NGS
Microarray Microarray
Workflows Workflows
Integration Integration

RNA-Seq Analysis
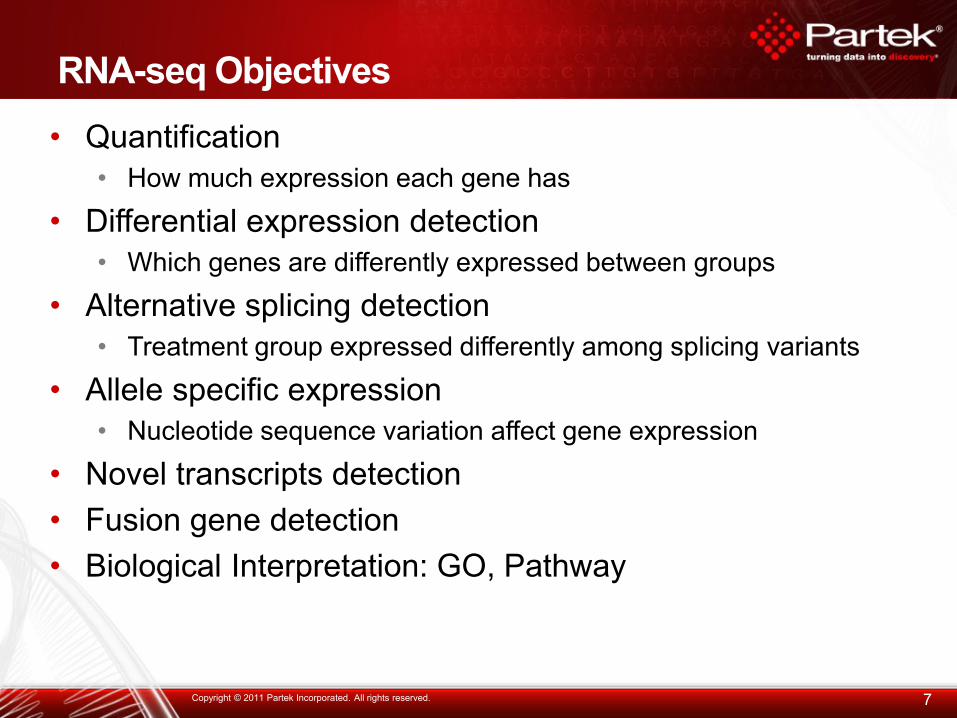
RNA-seq Objectives
• Quantification
• How much expression each gene has
• Differential expression detection
• Which genes are differently expressed between groups
• Alternative splicing detection
• Treatment group expressed differently among splicing variants
• Allele specific expression
• Nucleotide sequence variation affect gene expression
• Novel transcripts detection
• Fusion gene detection
• Biological Interpretation: GO, Pathway
7 Copyright © 2011 Partek Incorporated. All rights reserved.
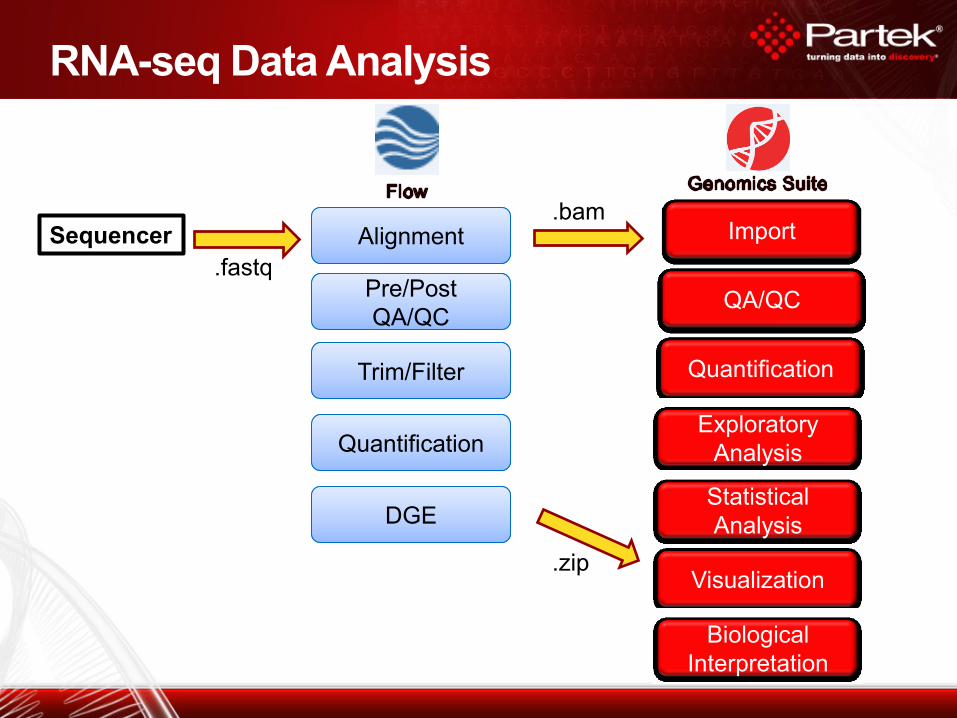
RNA-seq Data Analysis
Alignment
Quantification
Exploratory
Analysis
Visualization
Statistical
Analysis
Biological
Interpretation
Import
Pre/Post
QA/QC
Pre/Post
QA/QC
Trim/Filter
QA/QC
.fastq
.bam
.zip
Sequencer
Quantification
DGE
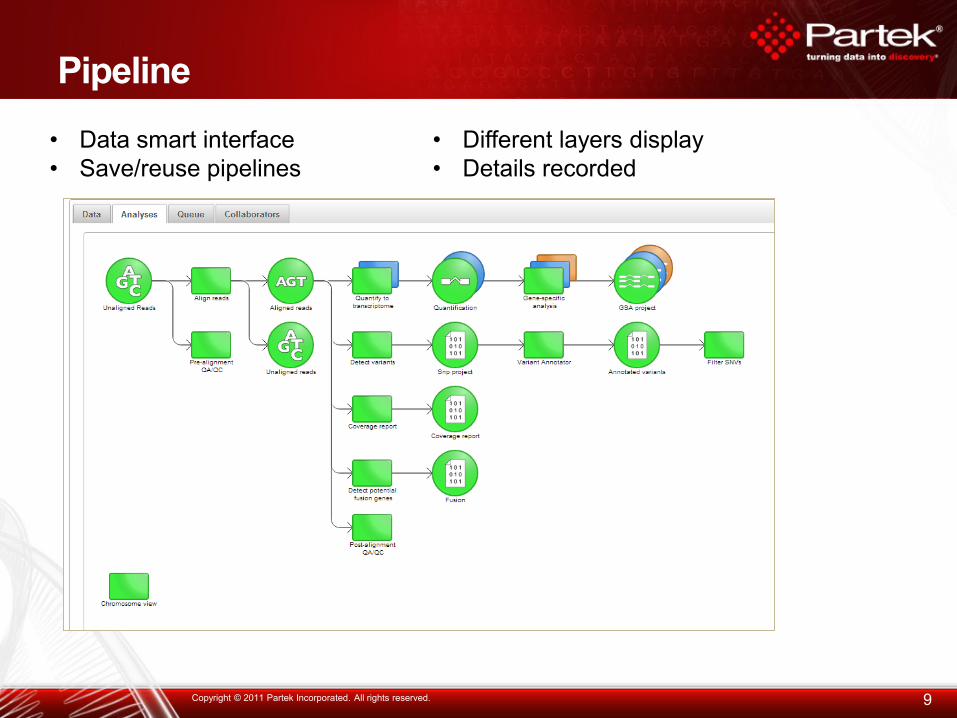
Pipeline
9 Copyright © 2011 Partek Incorporated. All rights reserved.
• Data smart interface
• Save/reuse pipelines
• Different layers display
• Details recorded
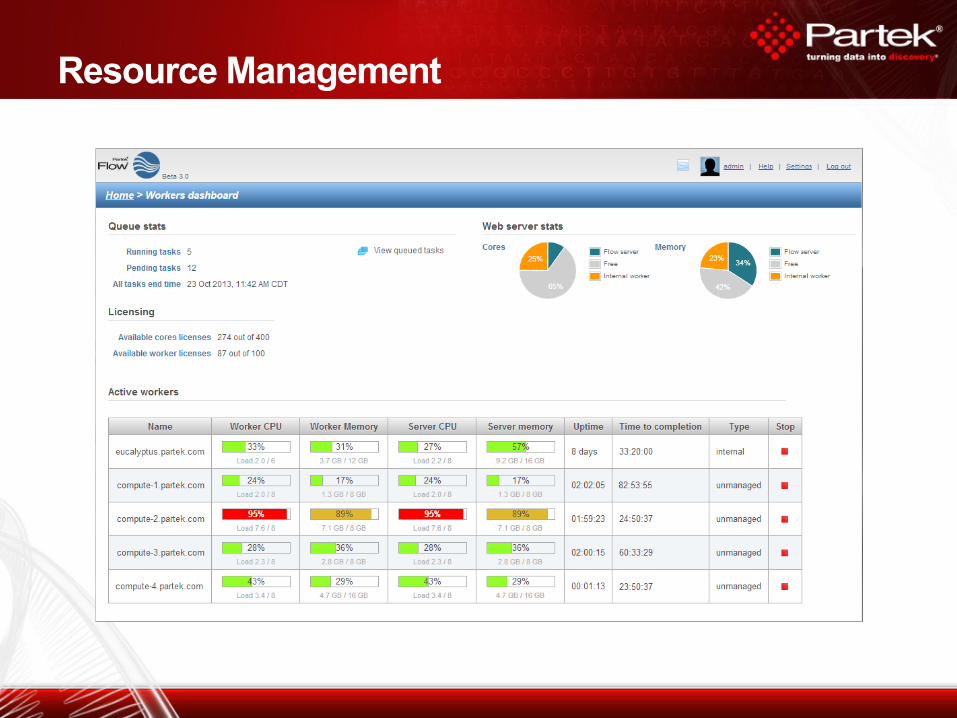
Resource Management
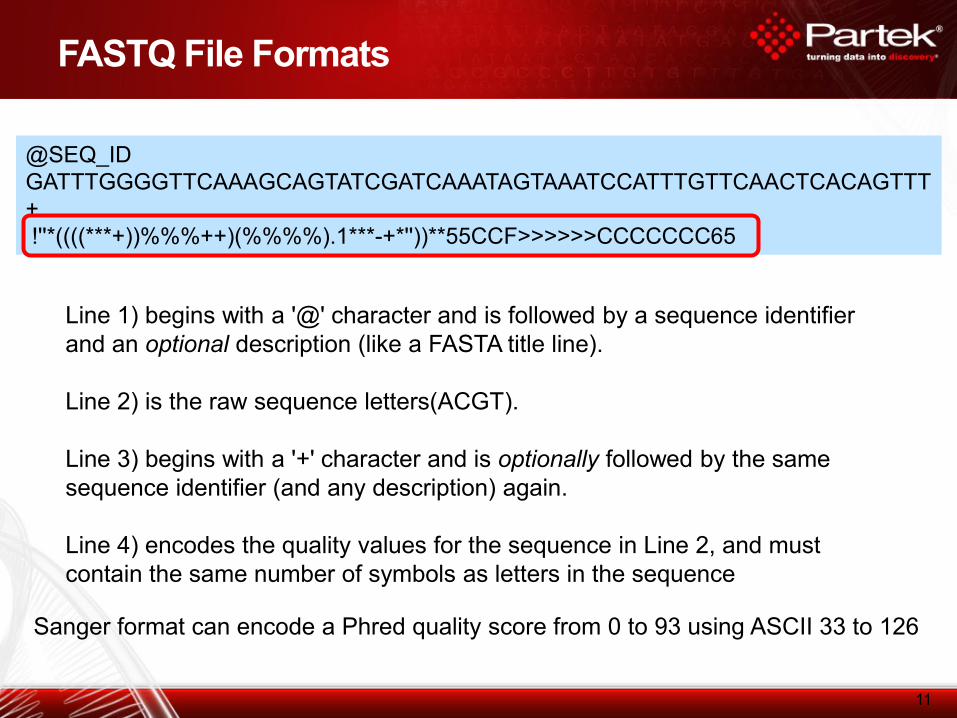
FASTQ File Formats
11
@SEQ_ID
GATTTGGGGTTCAAAGCAGTATCGATCAAATAGTAAATCCATTTGTTCAACTCACAGTTT
+
!''*((((***+))%%%++)(%%%%).1***-+*''))**55CCF>>>>>>CCCCCCC65
Line 1) begins with a '@' character and is followed by a sequence identifier
and an optional description (like a FASTA title line).
Line 2) is the raw sequence letters(ACGT).
Line 3) begins with a '+' character and is optionally followed by the same
sequence identifier (and any description) again.
Line 4) encodes the quality values for the sequence in Line 2, and must
contain the same number of symbols as letters in the sequence
Sanger format can encode a Phred quality score from 0 to 93 using ASCII 33 to 126
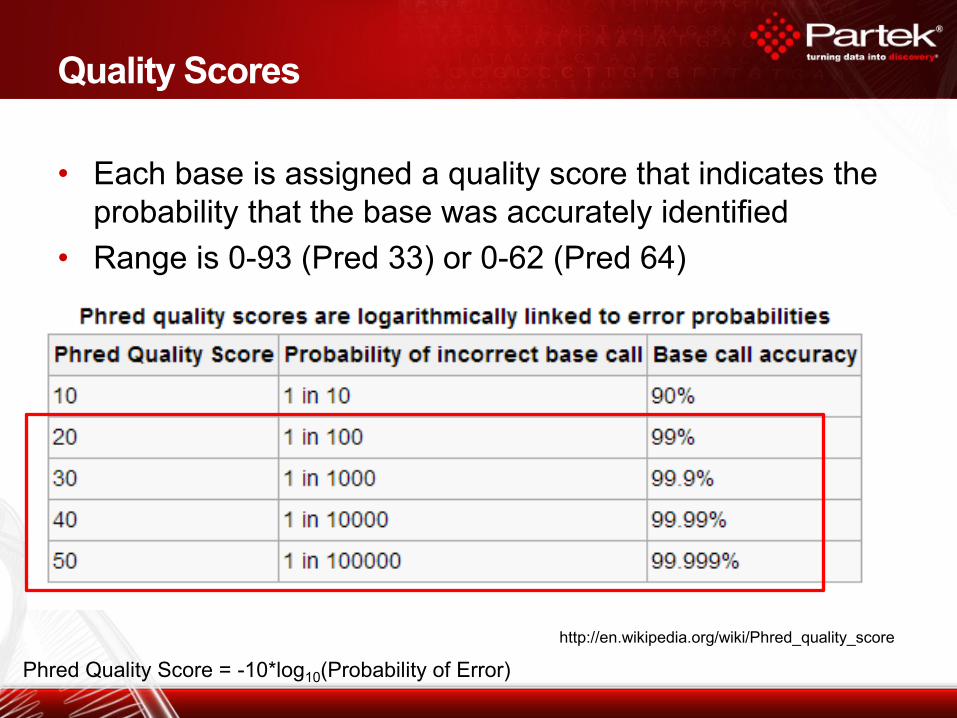
• Each base is assigned a quality score that indicates the
probability that the base was accurately identified
• Range is 0-93 (Pred 33) or 0-62 (Pred 64)
Quality Scores
http://en.wikipedia.org/wiki/Phred_quality_score
Phred Quality Score = -10*log10(Probability of Error)
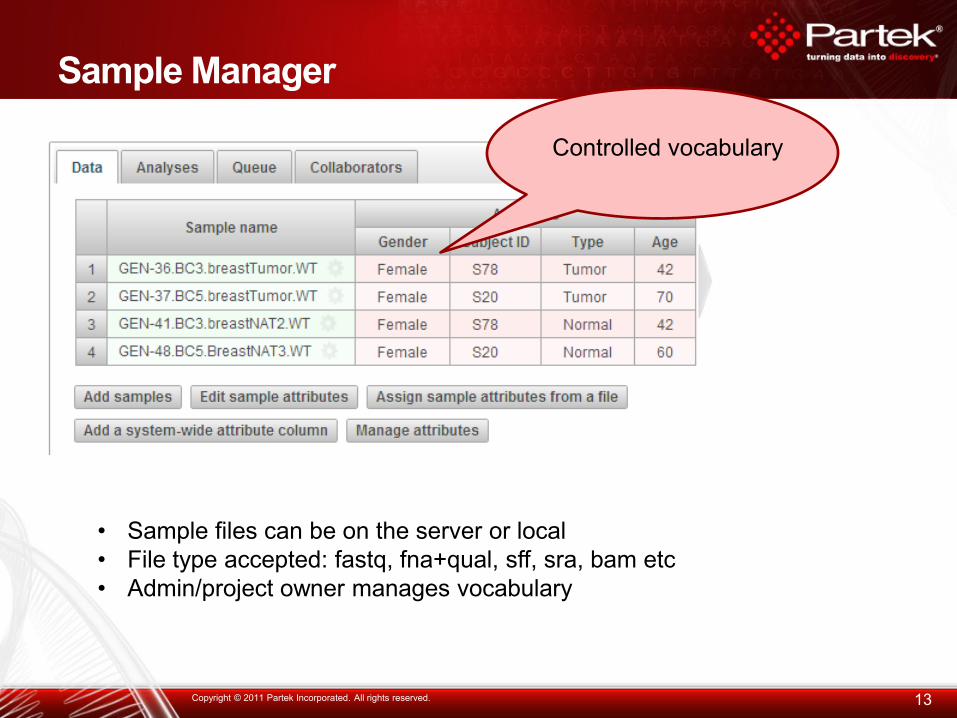
Sample Manager
13 Copyright © 2011 Partek Incorporated. All rights reserved.
• Sample files can be on the server or local
• File type accepted: fastq, fna+qual, sff, sra, bam etc
• Admin/project owner manages vocabulary
Controlled vocabulary
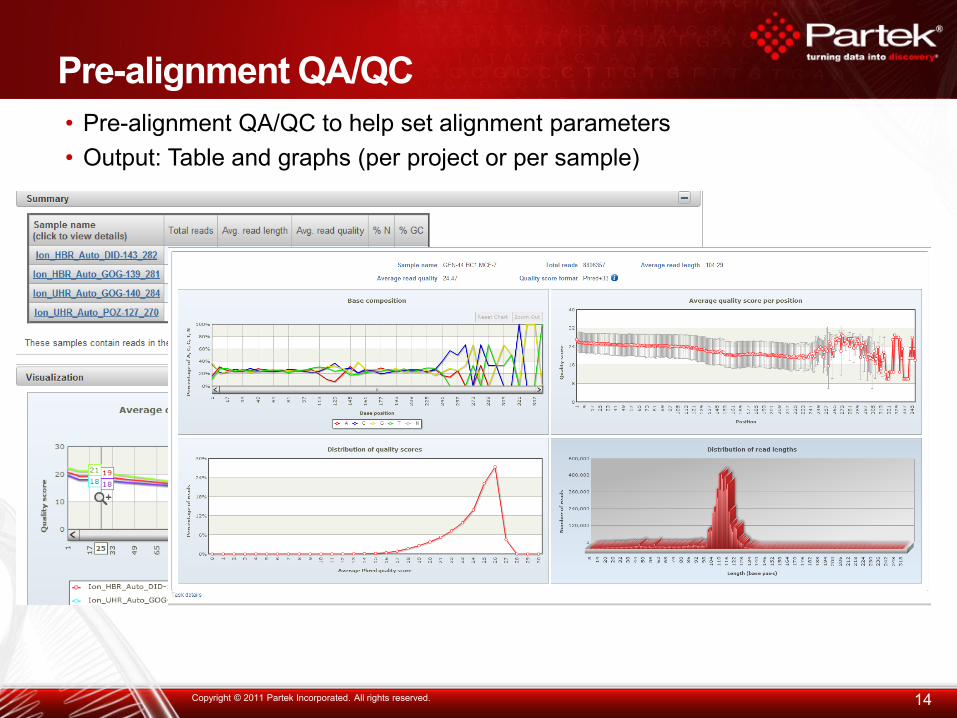
Pre-alignment QA/QC
14 Copyright © 2011 Partek Incorporated. All rights reserved.
• Pre-alignment QA/QC to help set alignment parameters
• Output: Table and graphs (per project or per sample)
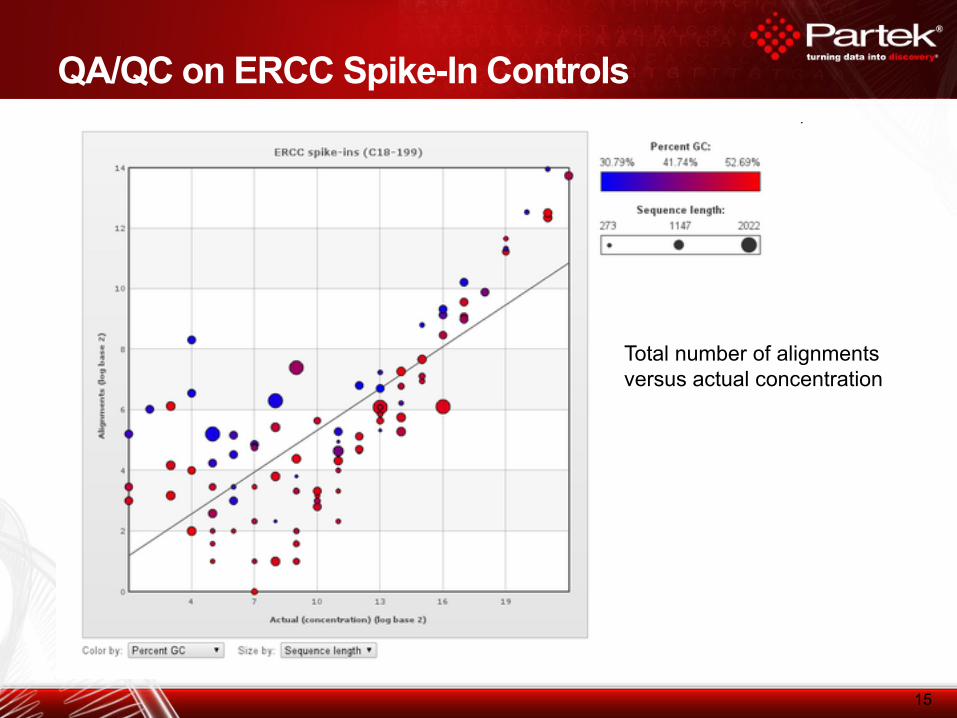
QA/QC on ERCC Spike-In Controls
15
Total number of alignments
versus actual concentration
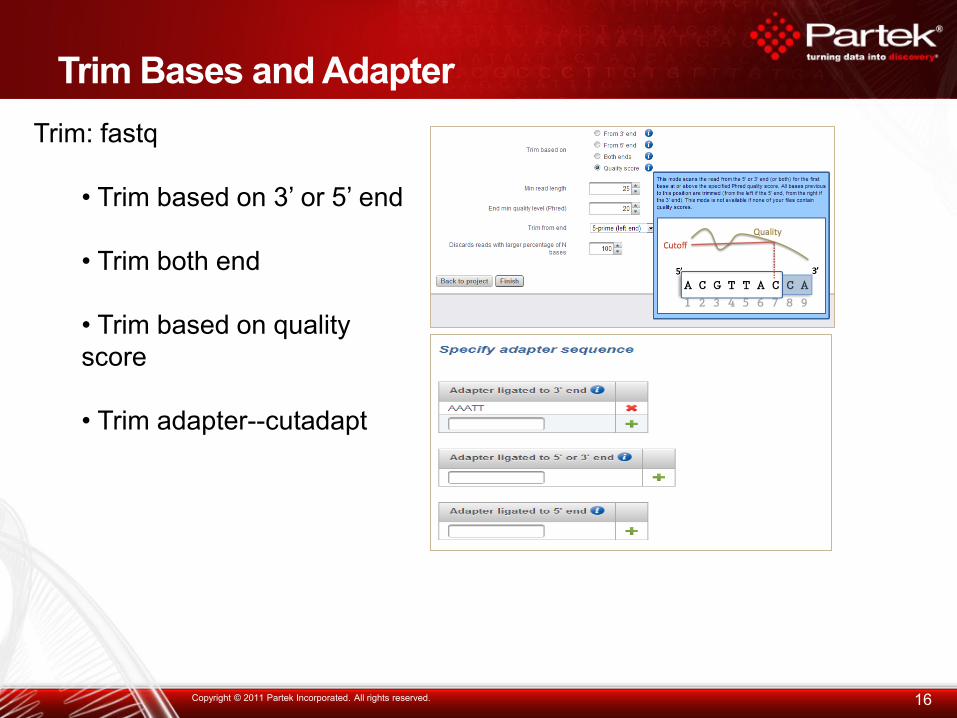
Trim Bases and Adapter
16 Copyright © 2011 Partek Incorporated. All rights reserved.
Trim: fastq
• Trim based on 3’ or 5’ end
• Trim both end
• Trim based on quality
score
• Trim adapter--cutadapt
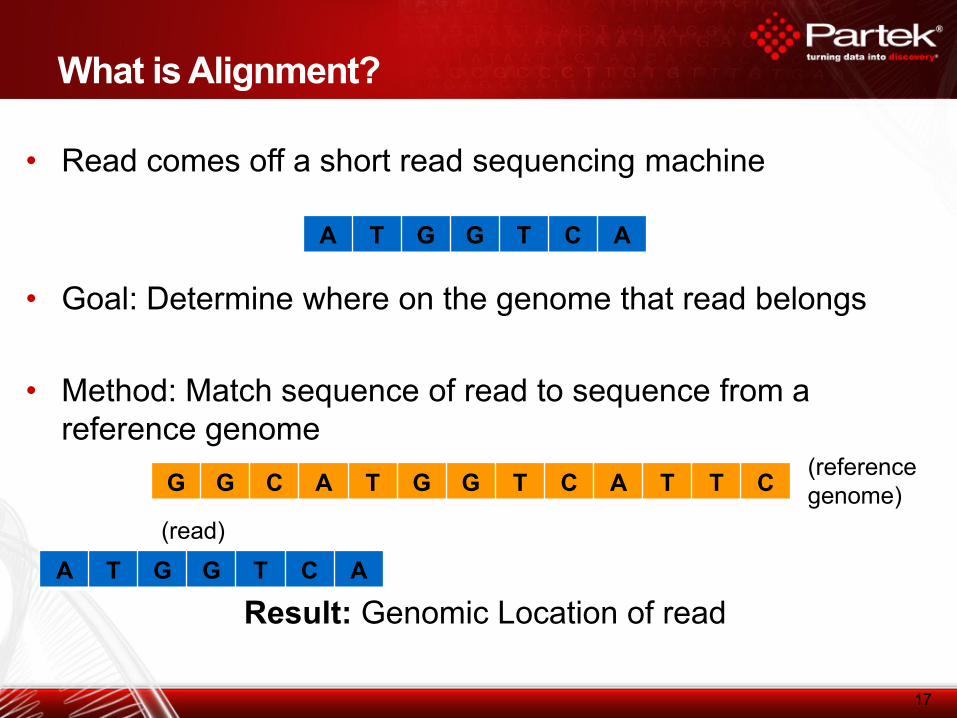
What is Alignment?
• Read comes off a short read sequencing machine
• Goal: Determine where on the genome that read belongs
• Method: Match sequence of read to sequence from a
reference genome
Result: Genomic Location of read
17
A T G G T C A
A T G G T C A
G G C A T G G T C A T T C (reference
genome)
(read)
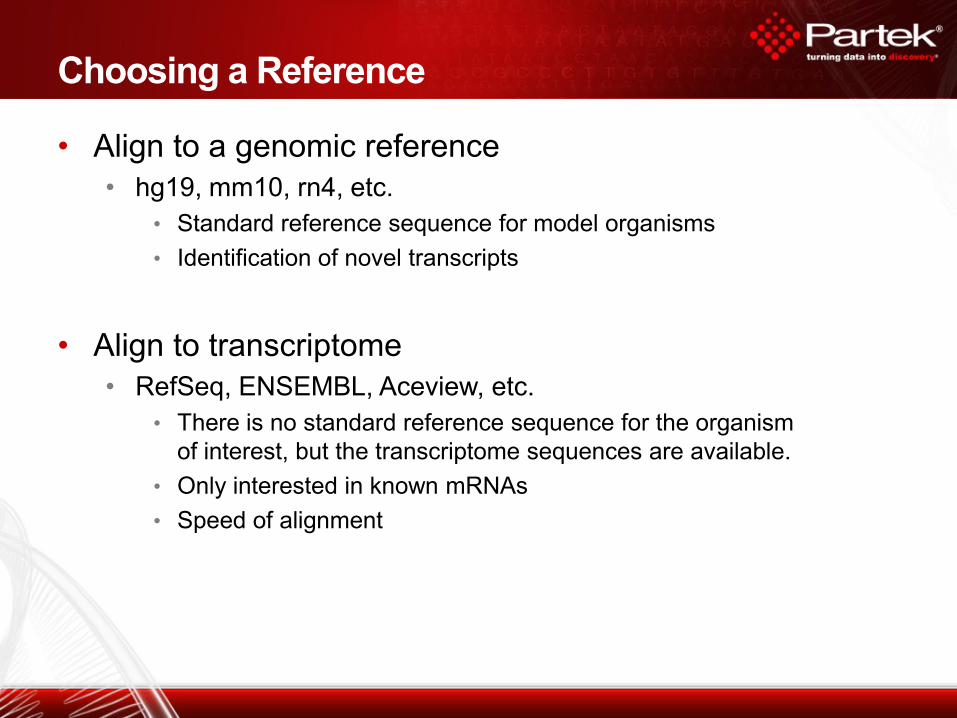
• Align to a genomic reference
• hg19, mm10, rn4, etc.
• Standard reference sequence for model organisms
• Identification of novel transcripts
• Align to transcriptome
• RefSeq, ENSEMBL, Aceview, etc.
• There is no standard reference sequence for the organism
of interest, but the transcriptome sequences are available.
• Only interested in known mRNAs
• Speed of alignment
Choosing a Reference
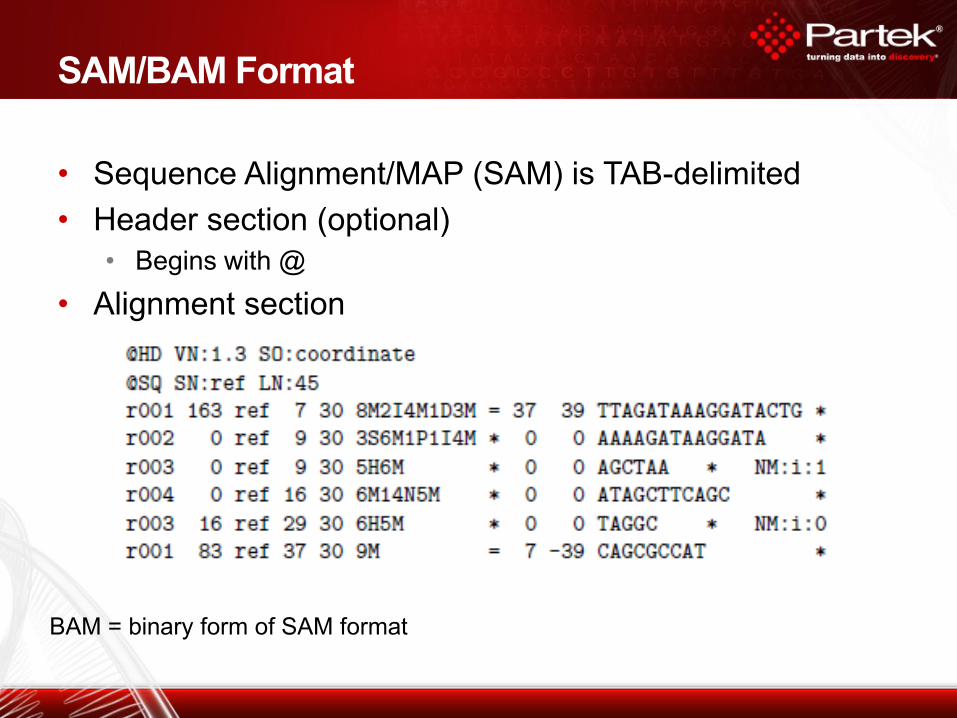
SAM/BAM Format
• Sequence Alignment/MAP (SAM) is TAB-delimited
• Header section (optional)
• Begins with @
• Alignment section
BAM = binary form of SAM format
Alignment -- Methods
20
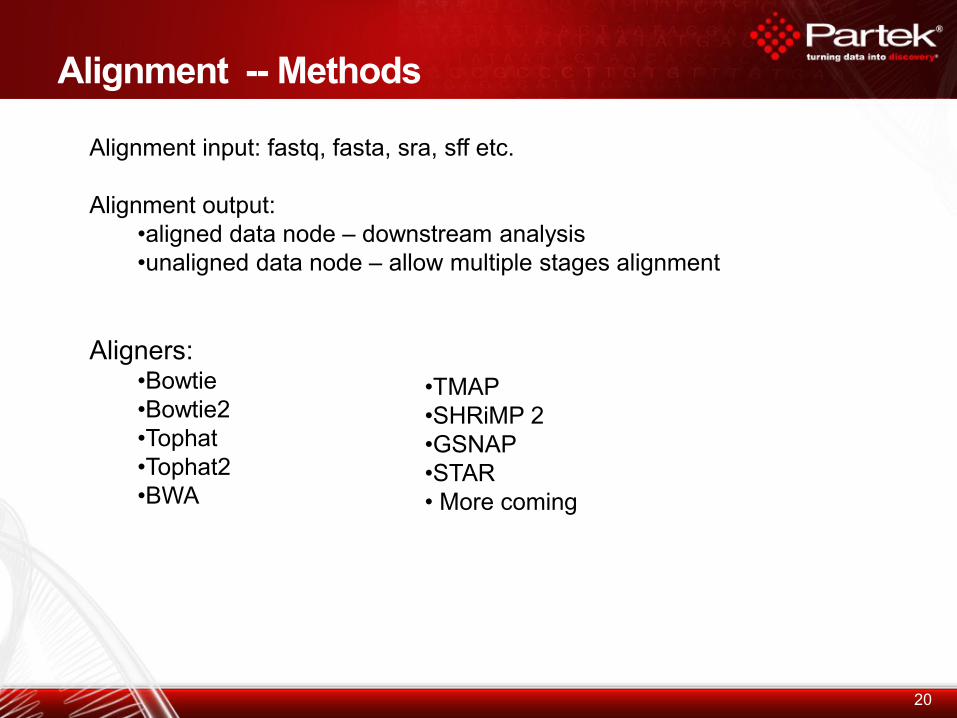
Alignment input: fastq, fasta, sra, sff etc.
Alignment output:
•aligned data node – downstream analysis
•unaligned data node – allow multiple stages alignment
Aligners: •Bowtie
•Bowtie2
•Tophat
•Tophat2
•BWA
•TMAP
•SHRiMP 2
•GSNAP
•STAR
• More coming
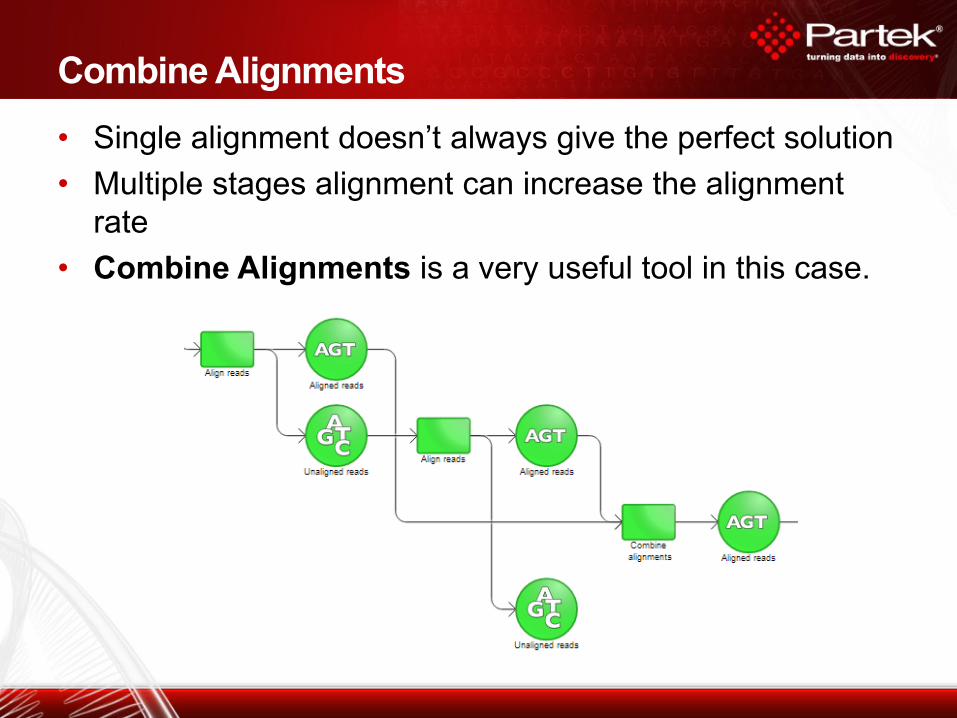
• Single alignment doesn’t always give the perfect solution
• Multiple stages alignment can increase the alignment
rate
• Combine Alignments is a very useful tool in this case.
Combine Alignments
Post -alignment QA/QC in Flow
32
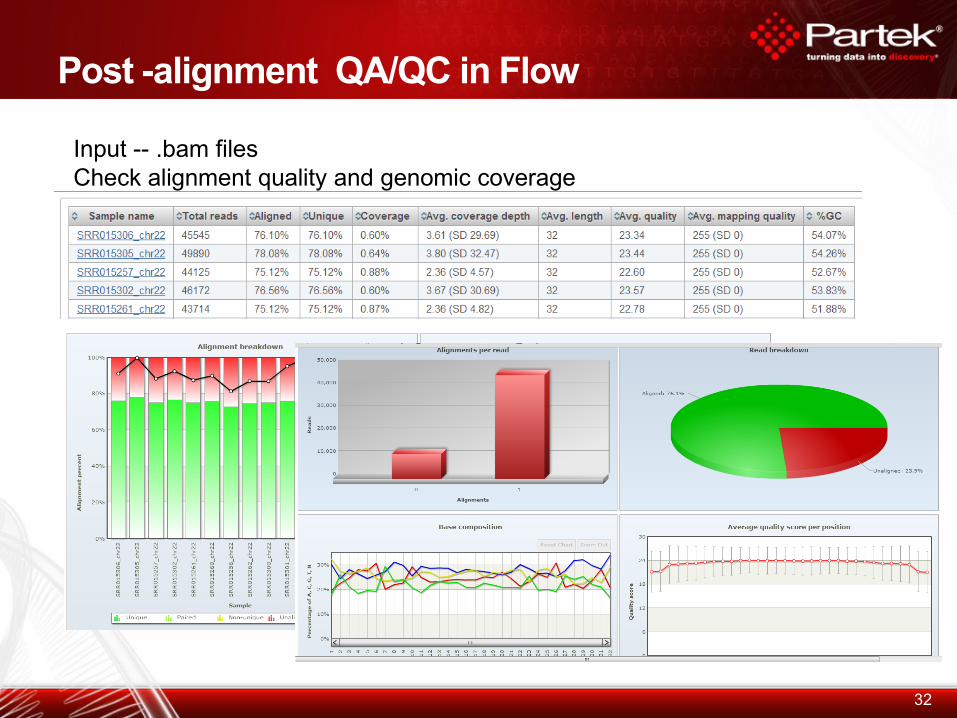
Input -- .bam files
Check alignment quality and genomic coverage
Coverage Report
33 Copyright © 2011 Partek Incorporated. All rights reserved.
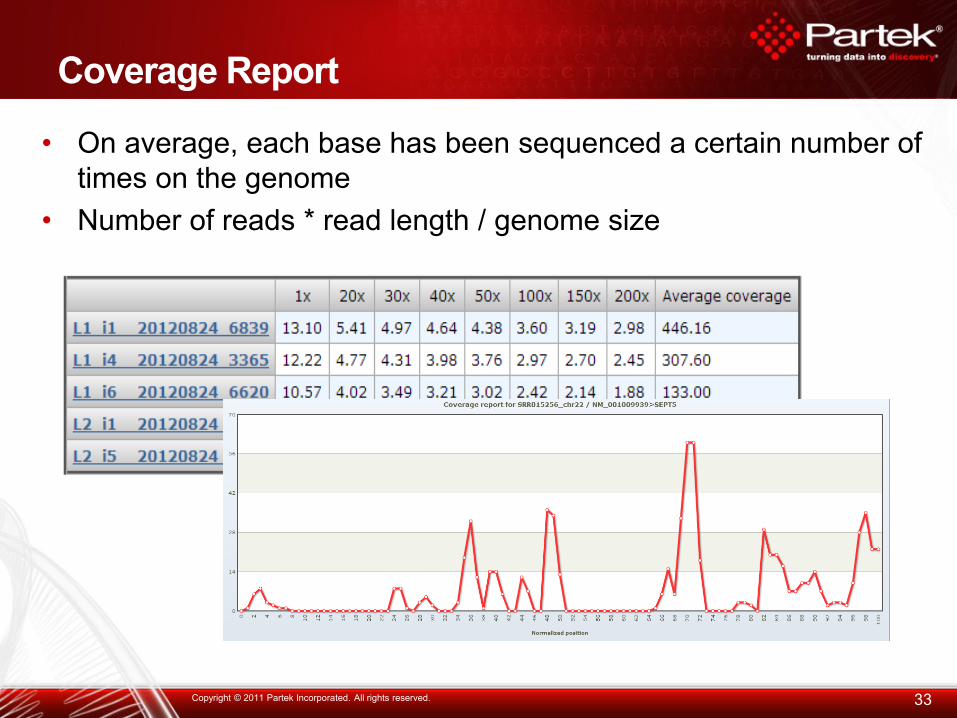
• On average, each base has been sequenced a certain number of
times on the genome
• Number of reads * read length / genome size
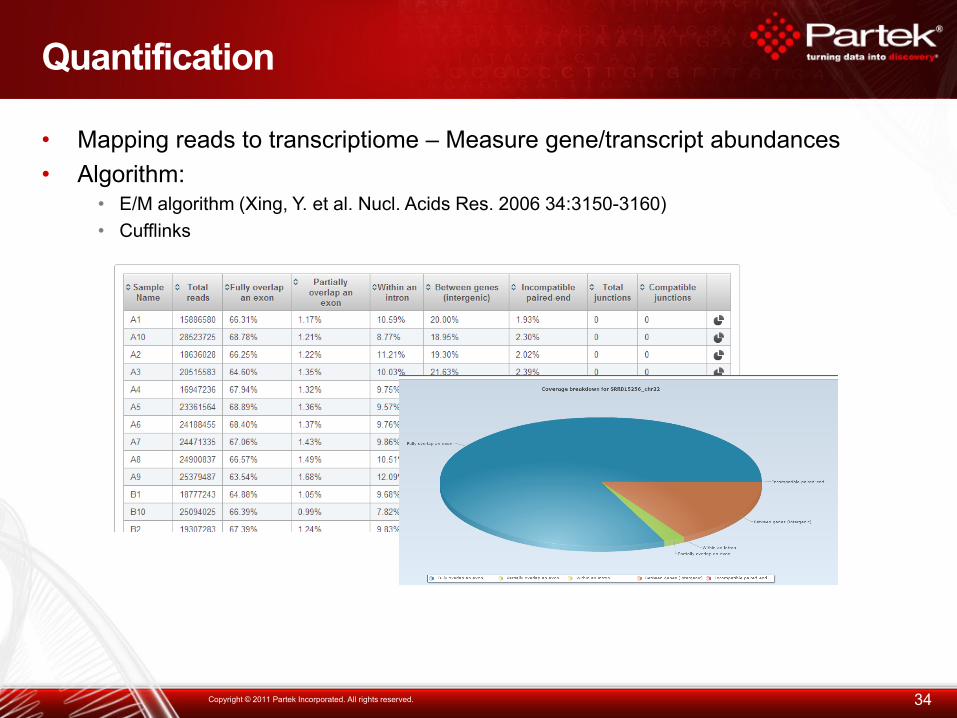
• Mapping reads to transcriptiome – Measure gene/transcript abundances
• Algorithm: • E/M algorithm (Xing, Y. et al. Nucl. Acids Res. 2006 34:3150-3160)
• Cufflinks
Quantification
34 Copyright © 2011 Partek Incorporated. All rights reserved.
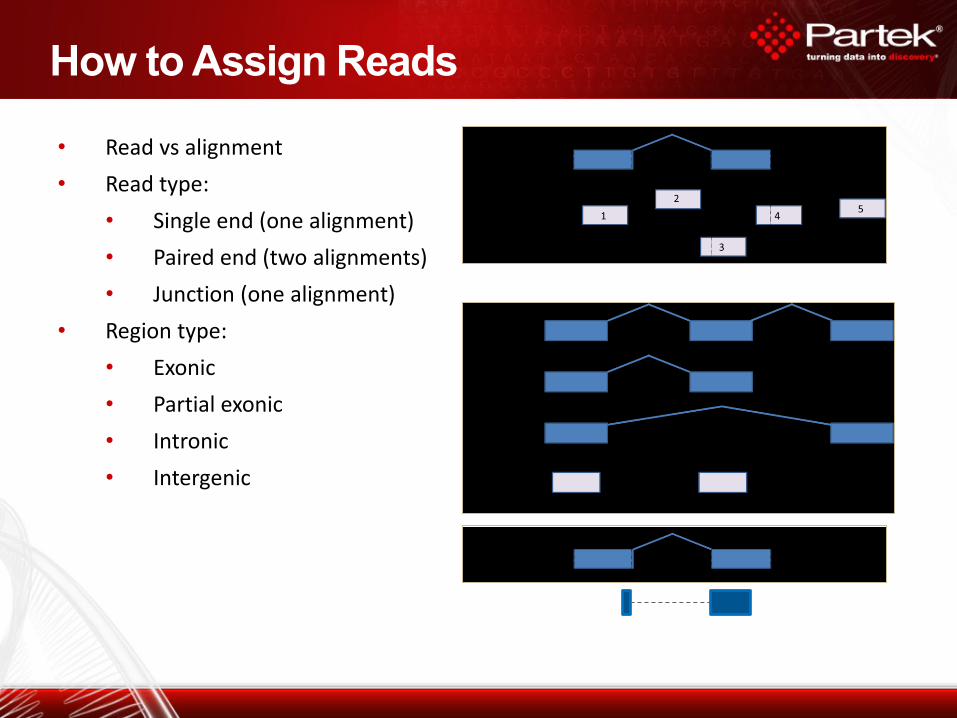
How to Assign Reads
• Read vs alignment
• Read type:
• Single end (one alignment)
• Paired end (two alignments)
• Junction (one alignment)
• Region type:
• Exonic
• Partial exonic
• Intronic
• Intergenic
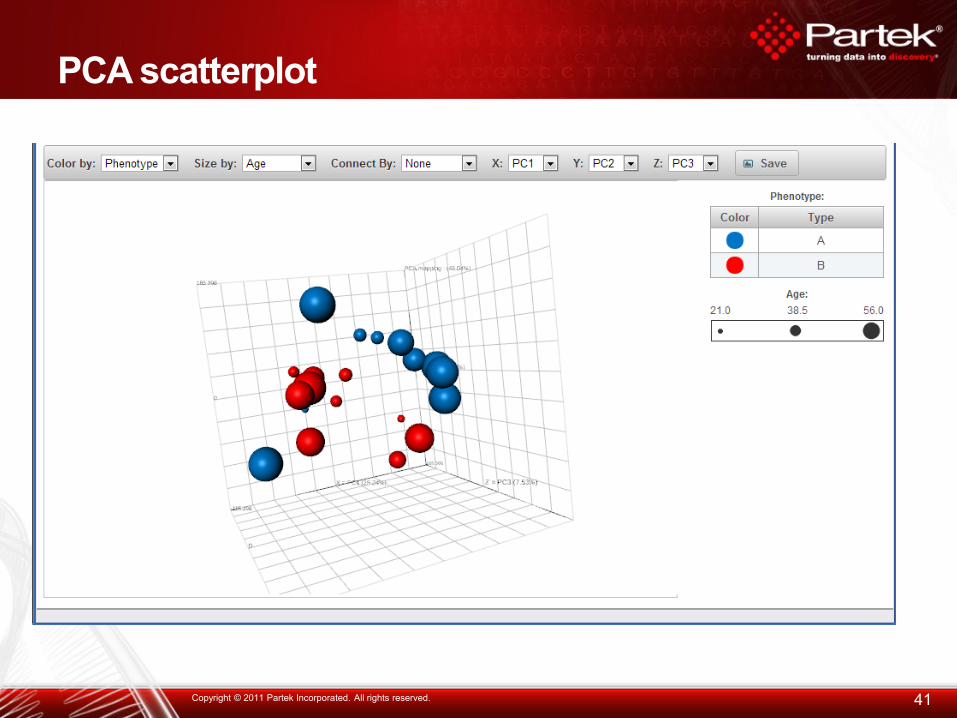
PCA scatterplot
41 Copyright © 2011 Partek Incorporated. All rights reserved.
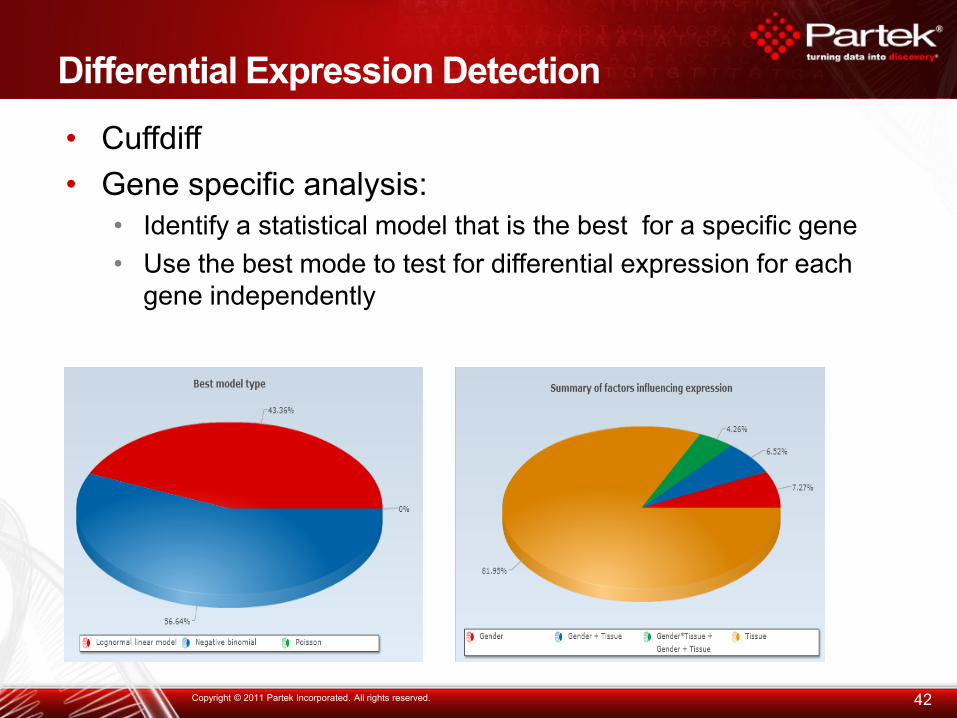
Differential Expression Detection
• Cuffdiff
• Gene specific analysis:
• Identify a statistical model that is the best for a specific gene
• Use the best mode to test for differential expression for each
gene independently
42 Copyright © 2011 Partek Incorporated. All rights reserved.
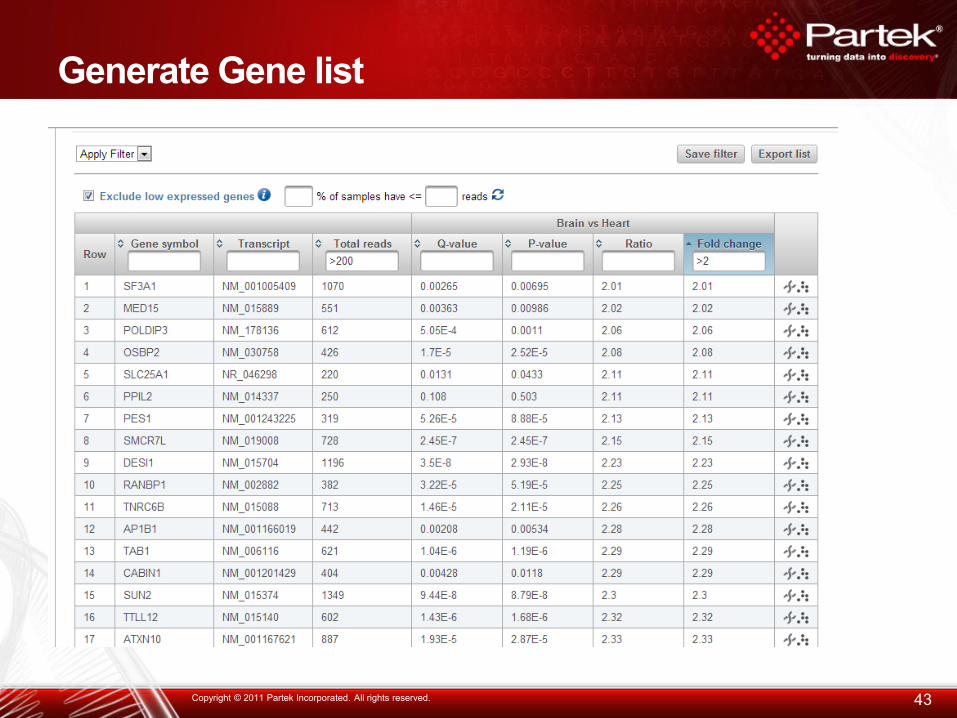
Generate Gene list
43 Copyright © 2011 Partek Incorporated. All rights reserved.
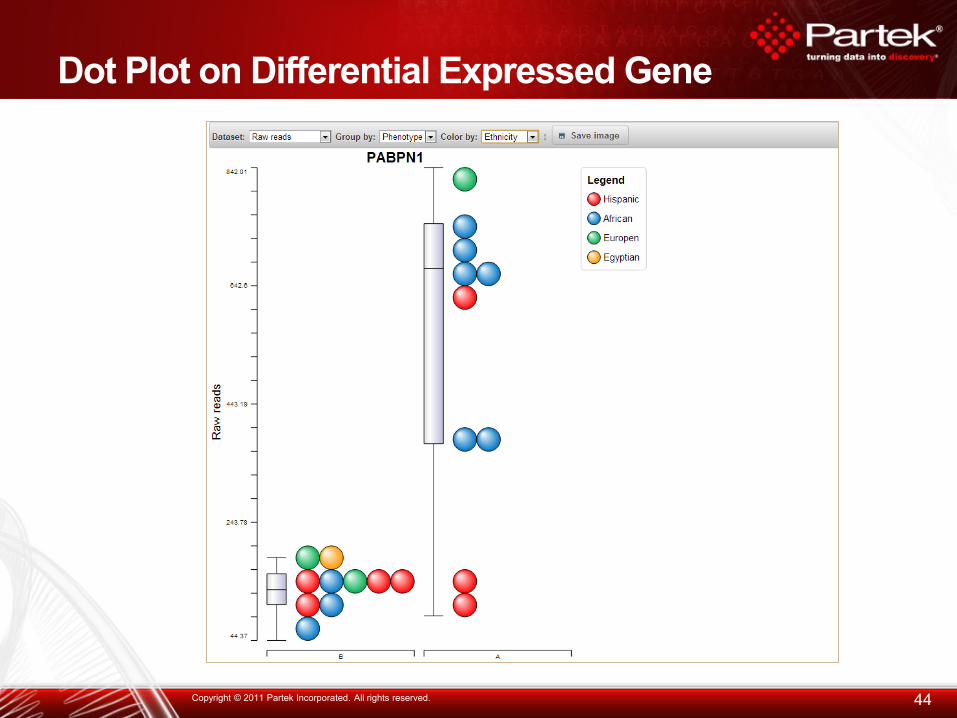
Dot Plot on Differential Expressed Gene
44 Copyright © 2011 Partek Incorporated. All rights reserved.
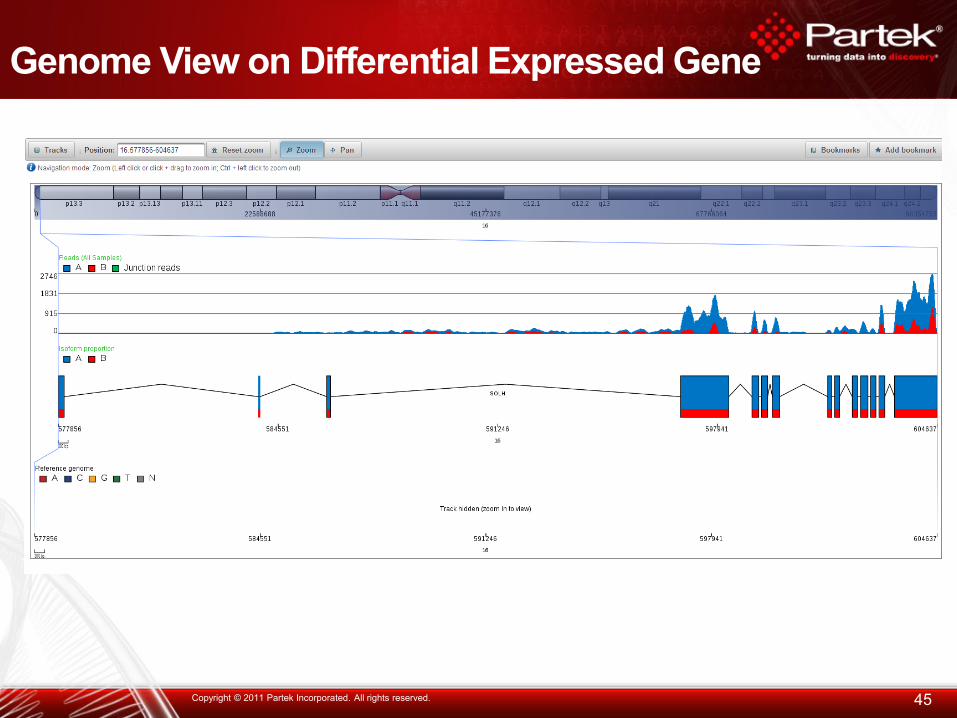
Genome View on Differential Expressed Gene
45 Copyright © 2011 Partek Incorporated. All rights reserved.
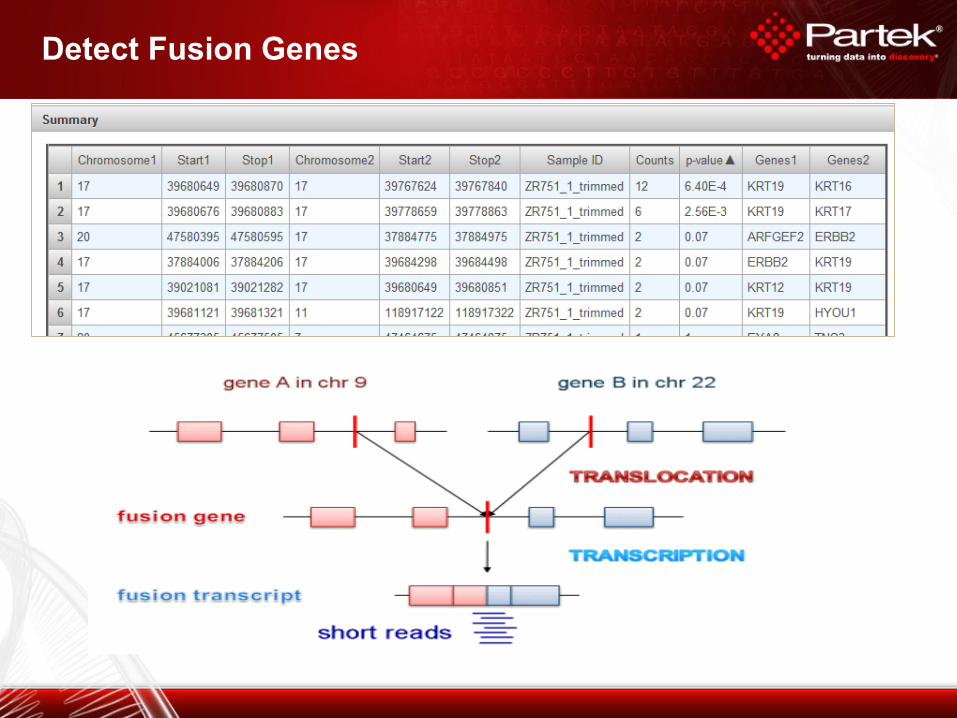
Detect Fusion Genes
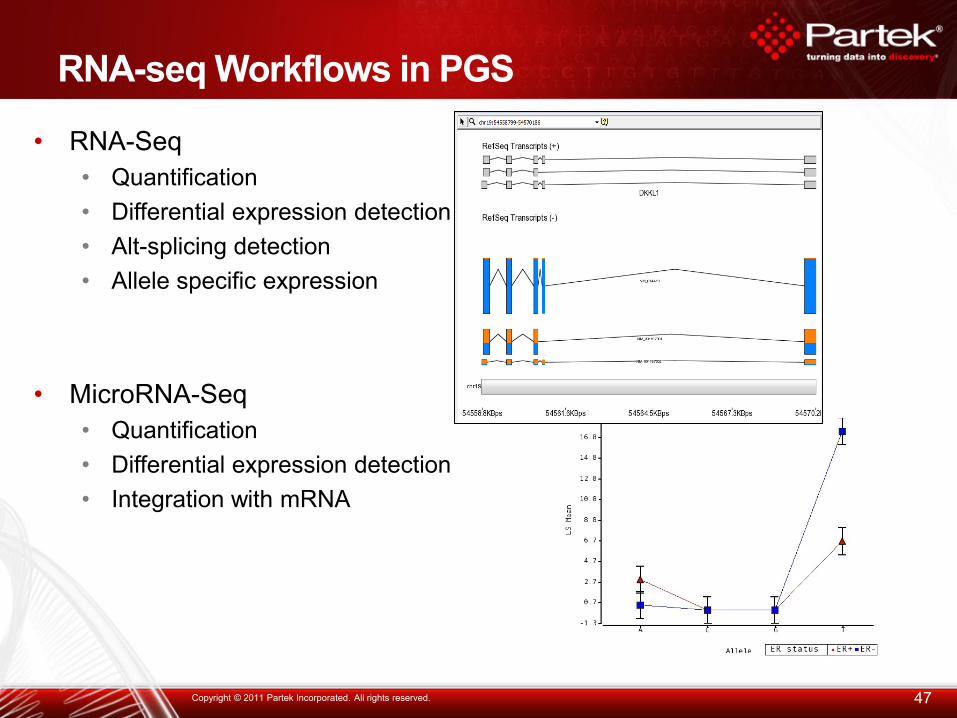
RNA-seq Workflows in PGS
• RNA-Seq
• Quantification
• Differential expression detection
• Alt-splicing detection
• Allele specific expression
• MicroRNA-Seq
• Quantification
• Differential expression detection
• Integration with mRNA
47 Copyright © 2011 Partek Incorporated. All rights reserved.
DNA-seq Analysis
• Variant calling – find variants that are statistically significant
• Variant annotation:
• Known SNP? (dbSNP)
• Population specific (1000 Genome)
• Gene section annotation
• Exonic, intronic, promoter
• Functional annotation
• Amino acid change
• Comparing SNVs across samples
• How man samples share this change? Only in disease samples?
• Structural variation: copy number, chromosomal translocation
• De novo assembly
DNA-seq Objectives
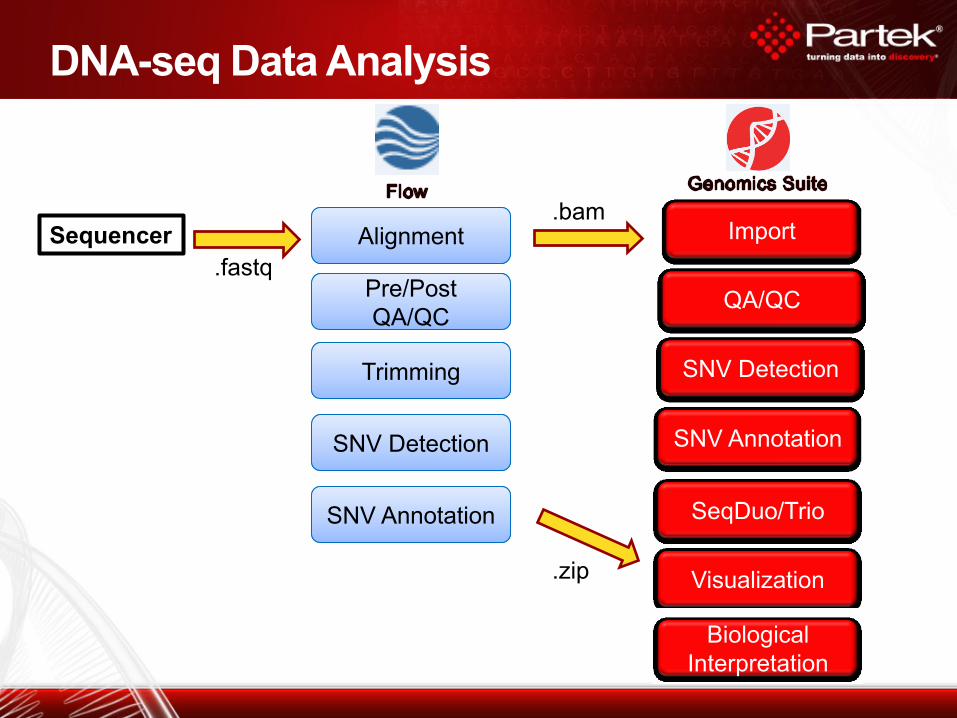
DNA-seq Data Analysis
Alignment
SNV Detection
SNV Annotation
Visualization
SeqDuo/Trio
Biological
Interpretation
Import
Pre/Post
QA/QC
Pre/Post
QA/QC
Trimming
QA/QC
.fastq
.bam
.zip
Sequencer
SNV Detection
SNV Annotation
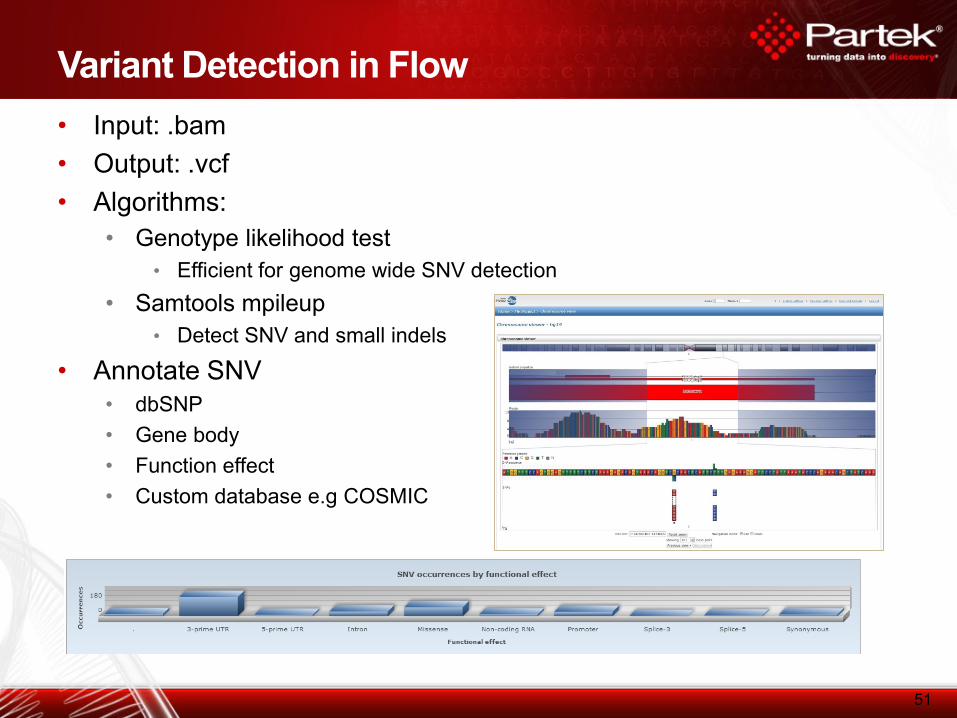
Variant Detection in Flow
• Input: .bam
• Output: .vcf
• Algorithms:
• Genotype likelihood test
• Efficient for genome wide SNV detection
• Samtools mpileup
• Detect SNV and small indels
• Annotate SNV
• dbSNP
• Gene body
• Function effect
• Custom database e.g COSMIC
51
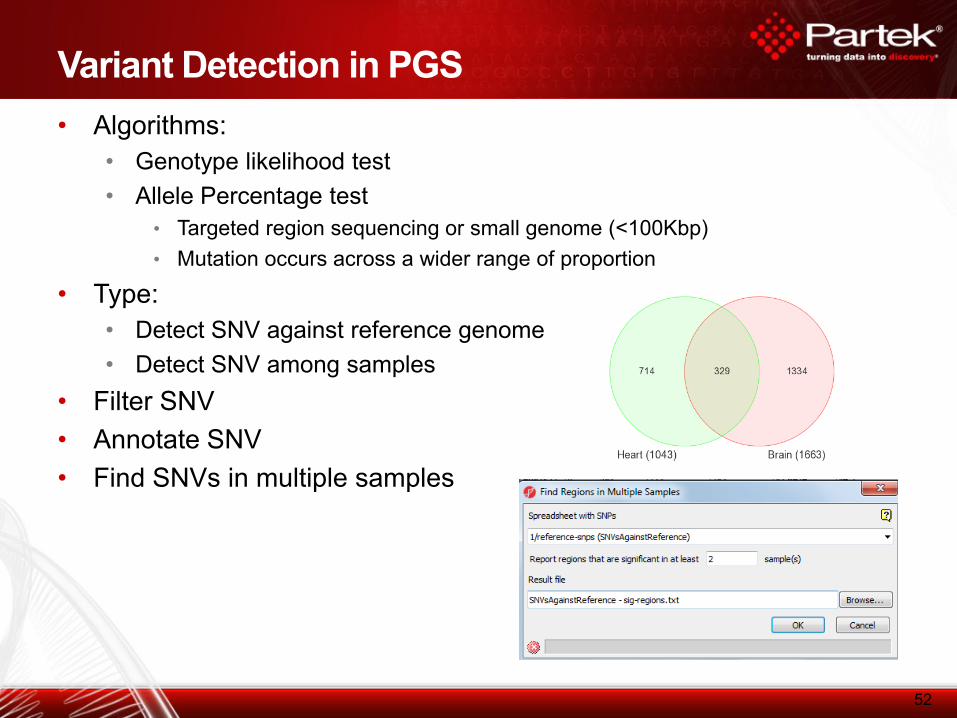
Variant Detection in PGS
• Algorithms:
• Genotype likelihood test
• Allele Percentage test
• Targeted region sequencing or small genome (<100Kbp)
• Mutation occurs across a wider range of proportion
• Type:
• Detect SNV against reference genome
• Detect SNV among samples
• Filter SNV
• Annotate SNV
• Find SNVs in multiple samples
52
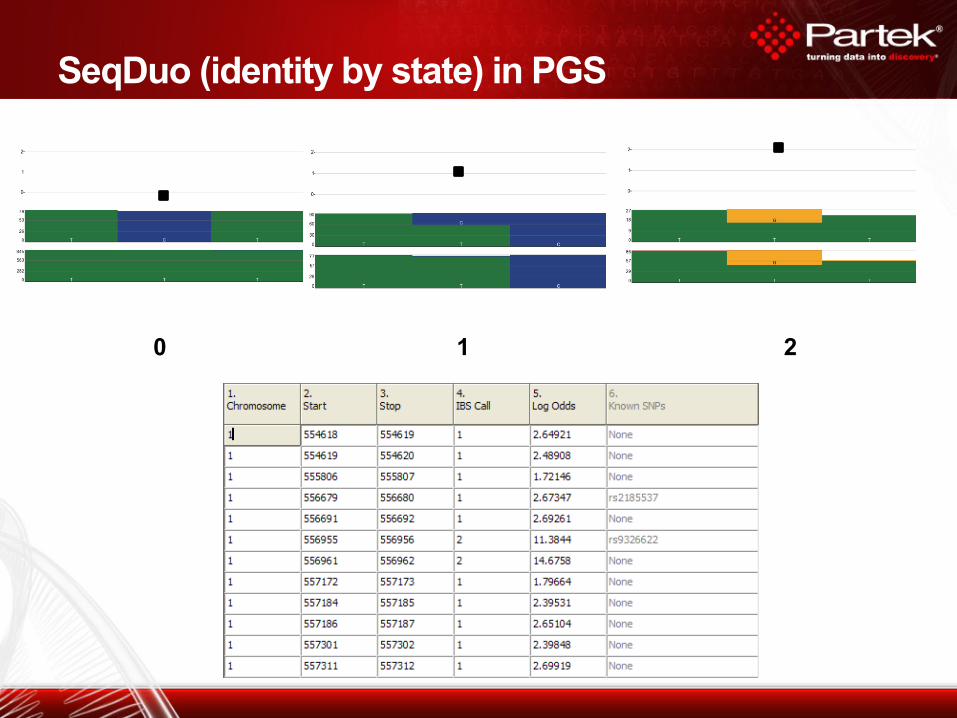
SeqDuo (identity by state) in PGS
0 1 2
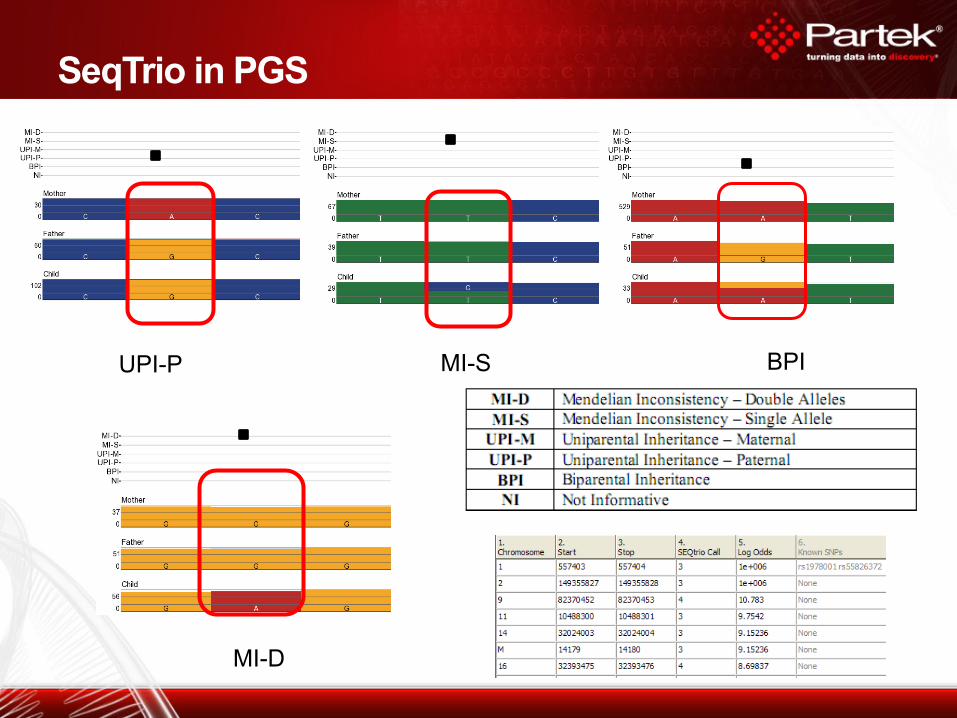
SeqTrio in PGS
UPI-P MI-S BPI
MI-D
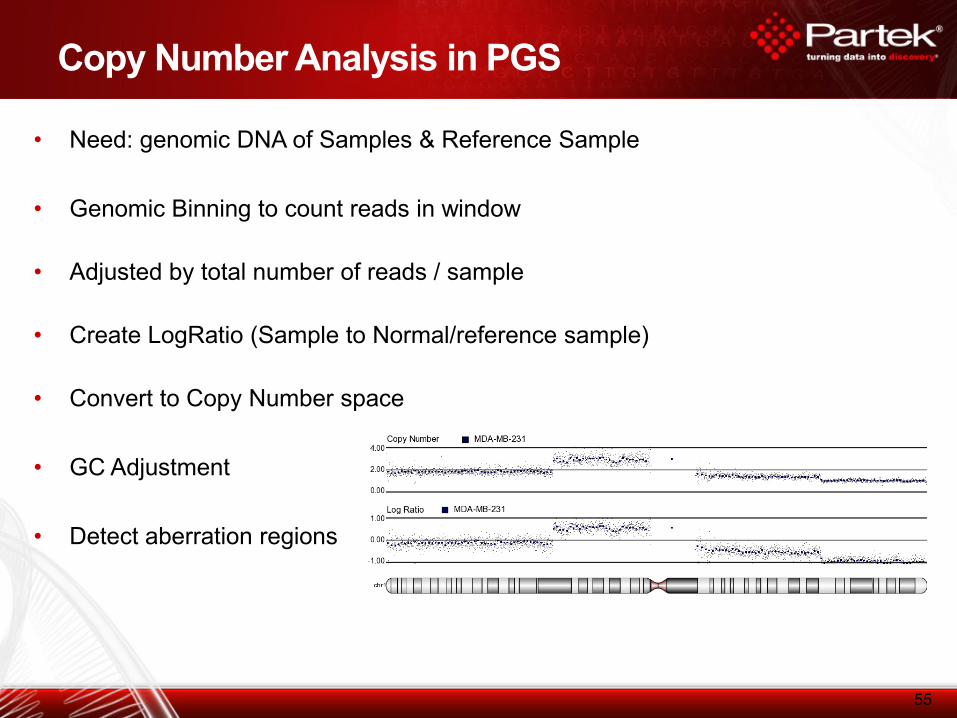
Copy Number Analysis in PGS
• Need: genomic DNA of Samples & Reference Sample
• Genomic Binning to count reads in window
• Adjusted by total number of reads / sample
• Create LogRatio (Sample to Normal/reference sample)
• Convert to Copy Number space
• GC Adjustment
• Detect aberration regions
55

ChIP-seq Analysis
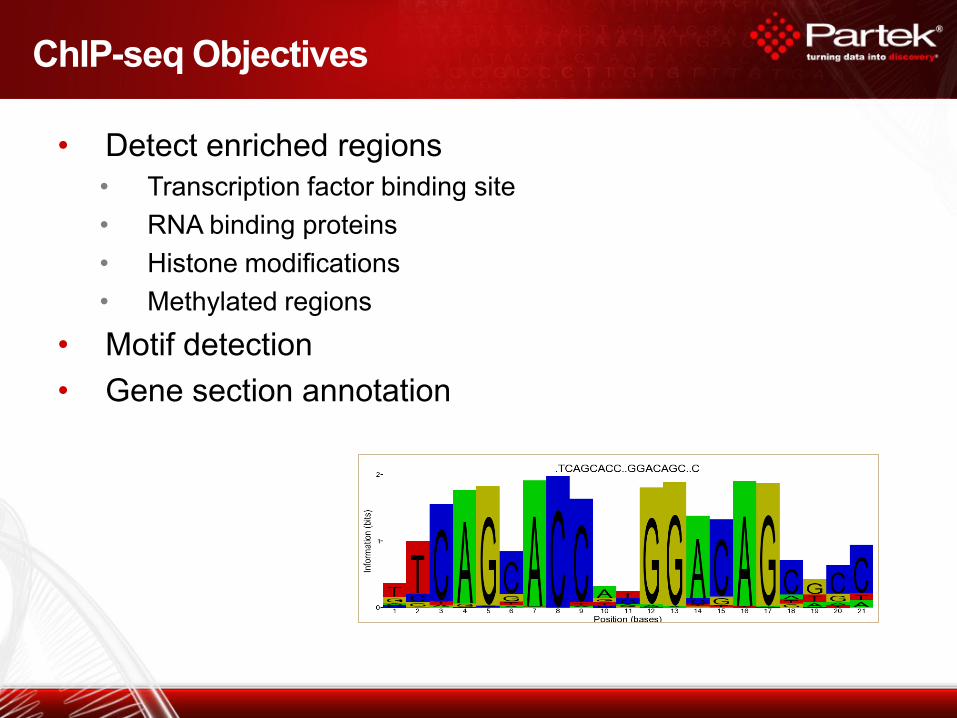
• Detect enriched regions
• Transcription factor binding site
• RNA binding proteins
• Histone modifications
• Methylated regions
• Motif detection
• Gene section annotation
ChIP-seq Objectives
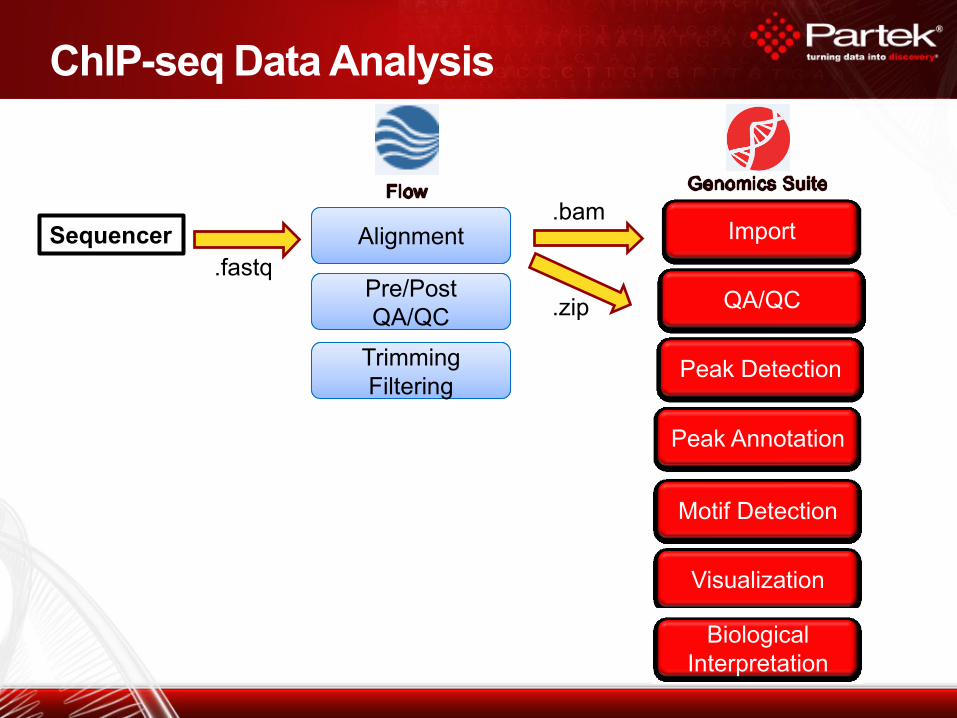
ChIP-seq Data Analysis
Alignment
Peak Detection
Peak Annotation
Visualization
Motif Detection
Biological
Interpretation
Import
Pre/Post
QA/QC
Pre/Post
QA/QC
Trimming
Filtering
Trimming
Filtering
QA/QC
.fastq
.bam
.zip
Sequencer
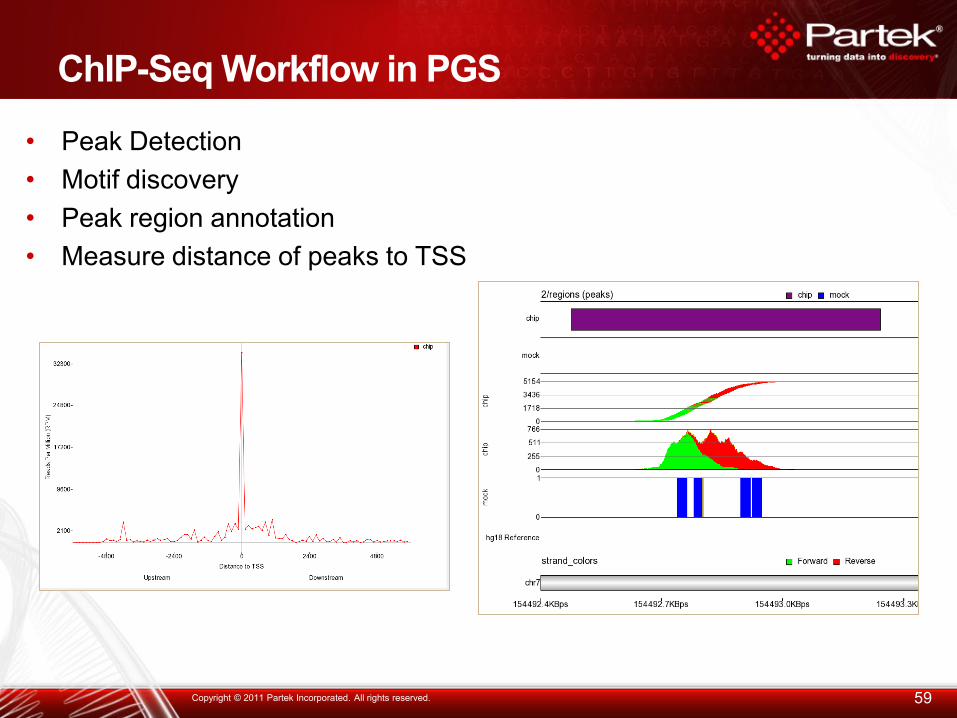
ChIP-Seq Workflow in PGS
• Peak Detection
• Motif discovery
• Peak region annotation
• Measure distance of peaks to TSS
59 Copyright © 2011 Partek Incorporated. All rights reserved.
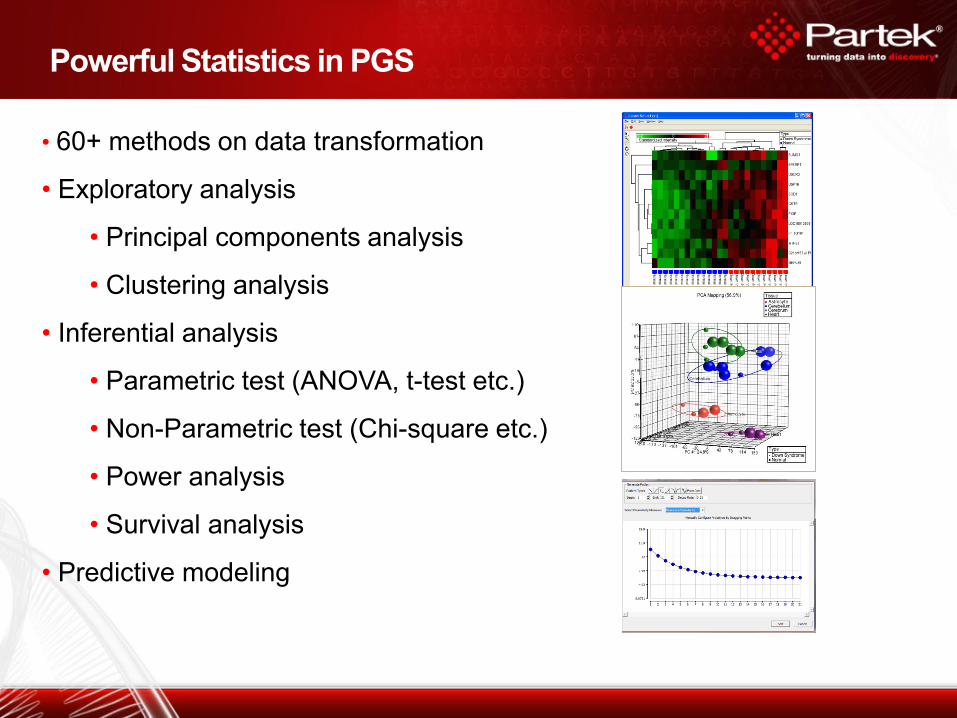
Powerful Statistics in PGS
• 60+ methods on data transformation
• Exploratory analysis
• Principal components analysis
• Clustering analysis
• Inferential analysis
• Parametric test (ANOVA, t-test etc.)
• Non-Parametric test (Chi-square etc.)
• Power analysis
• Survival analysis
• Predictive modeling
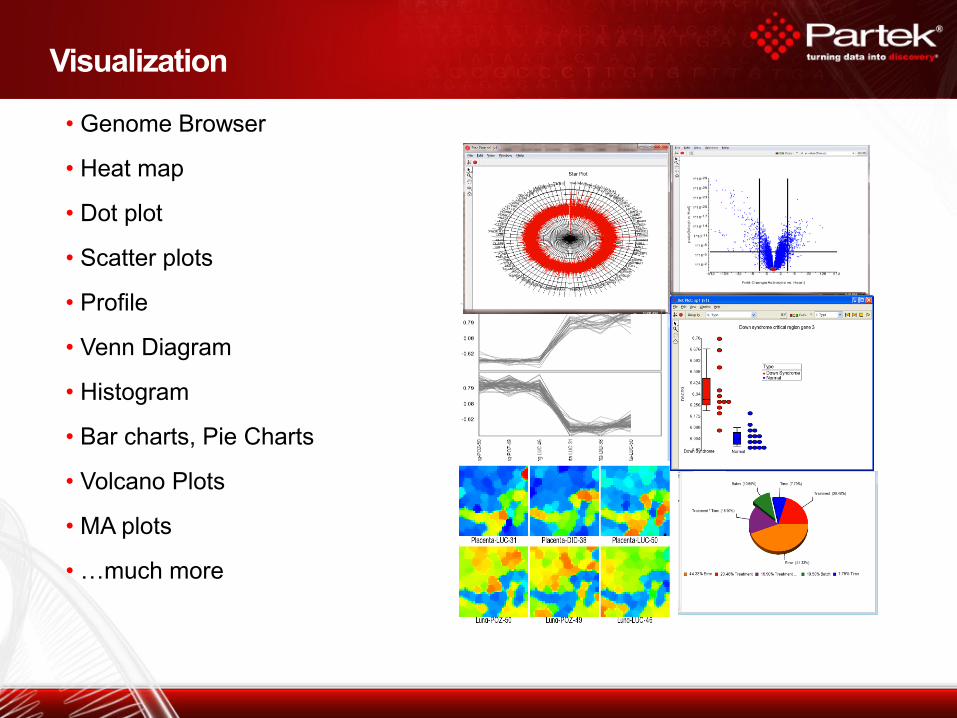
Visualization
• Genome Browser
• Heat map
• Dot plot
• Scatter plots
• Profile
• Venn Diagram
• Histogram
• Bar charts, Pie Charts
• Volcano Plots
• MA plots
• …much more
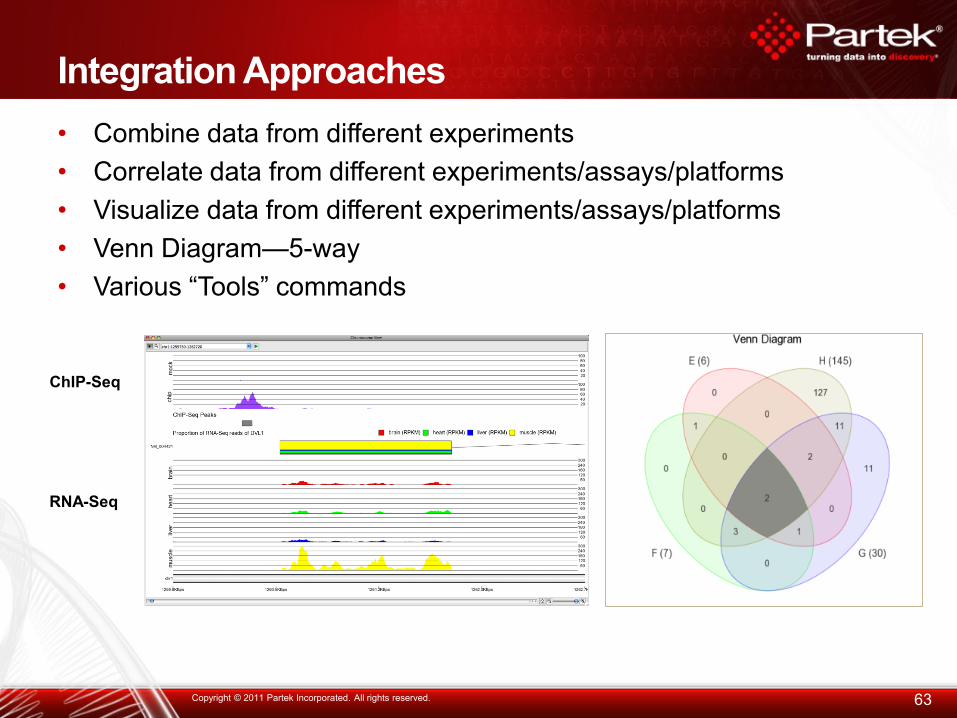
Integration Approaches
• Combine data from different experiments
• Correlate data from different experiments/assays/platforms
• Visualize data from different experiments/assays/platforms
• Venn Diagram—5-way
• Various “Tools” commands
63 Copyright © 2011 Partek Incorporated. All rights reserved.
RNA-Seq
ChIP-Seq
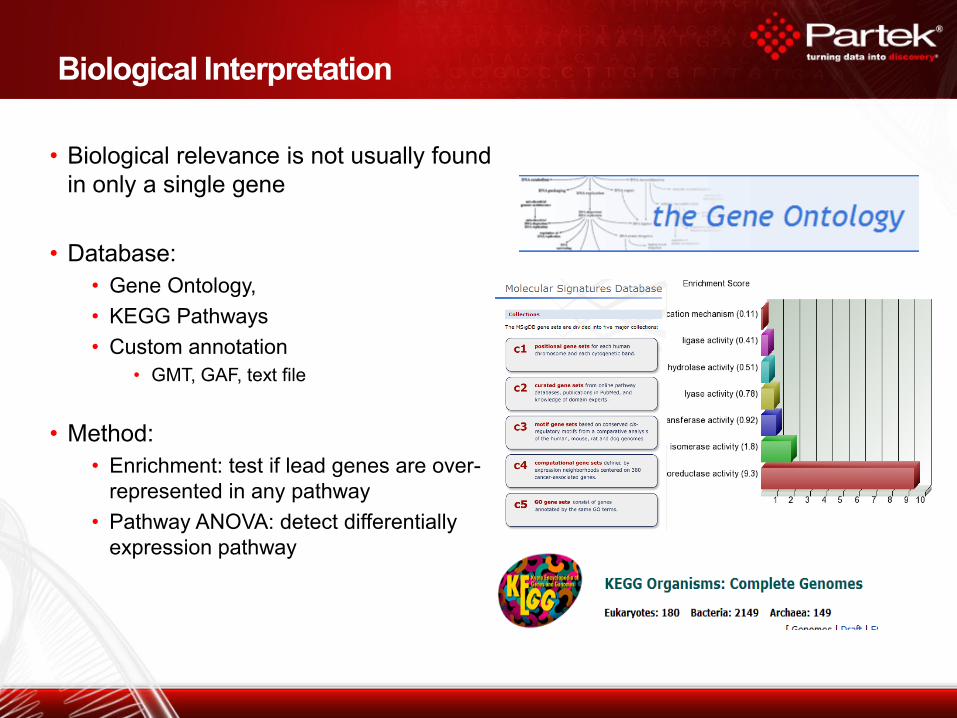
Biological Interpretation
• Biological relevance is not usually found
in only a single gene
• Database:
• Gene Ontology,
• KEGG Pathways
• Custom annotation
• GMT, GAF, text file
• Method:
• Enrichment: test if lead genes are over-
represented in any pathway
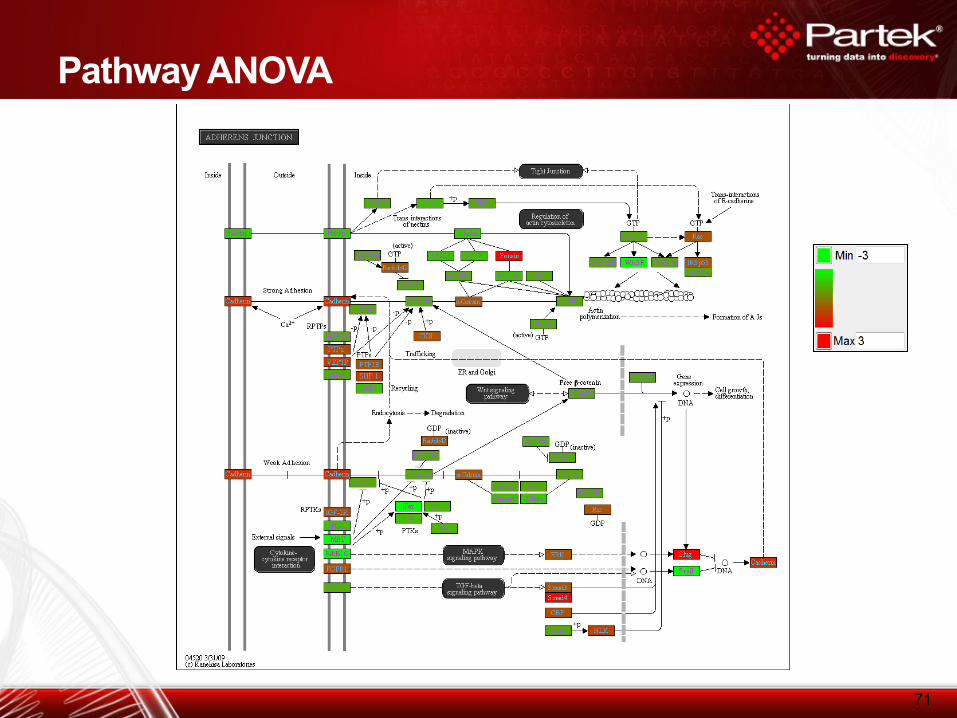
• Pathway ANOVA: detect differentially
expression pathway
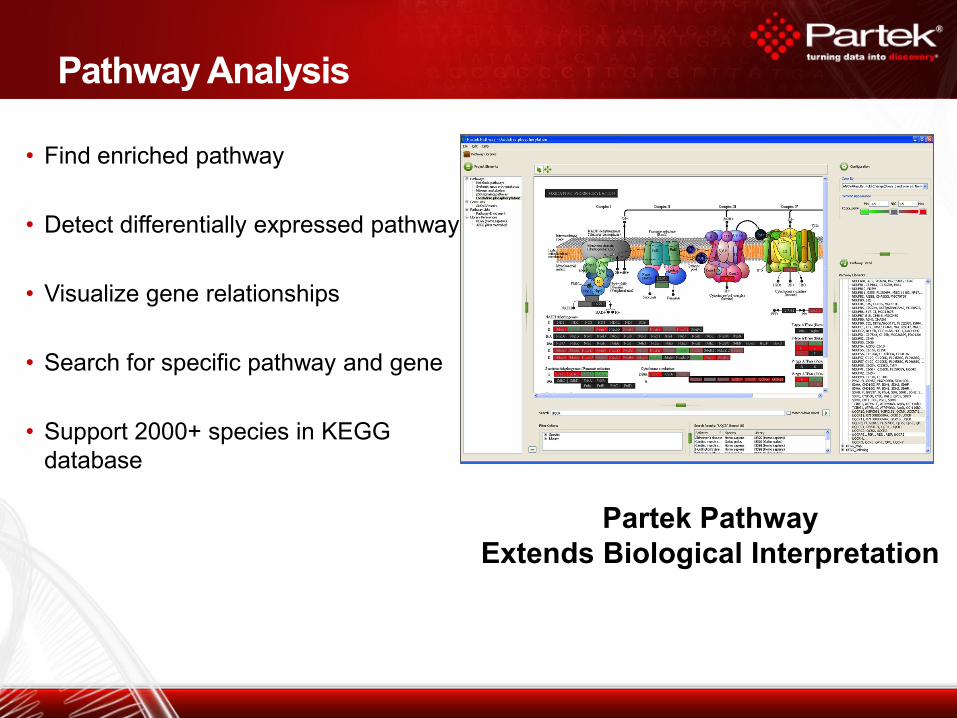
Pathway Analysis
• Find enriched pathway
• Detect differentially expressed pathway
• Visualize gene relationships
• Search for specific pathway and gene
• Support 2000+ species in KEGG
database
Partek Pathway
Extends Biological Interpretation
71
Pathway ANOVA
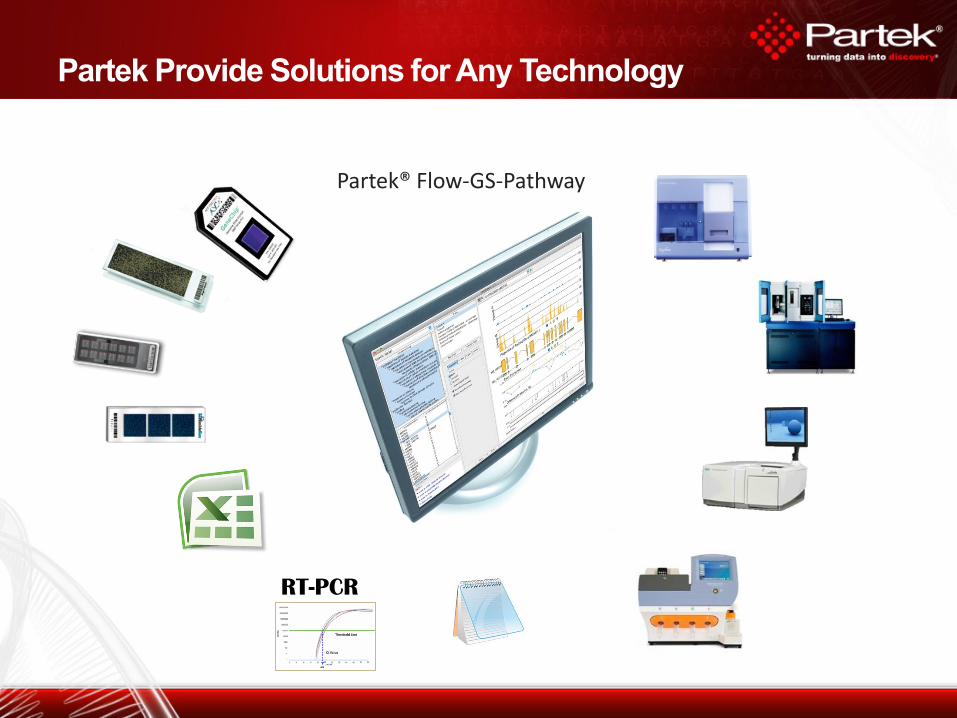
Partek Provide Solutions for Any Technology
RT-PCR
Partek® Flow-GS-Pathway
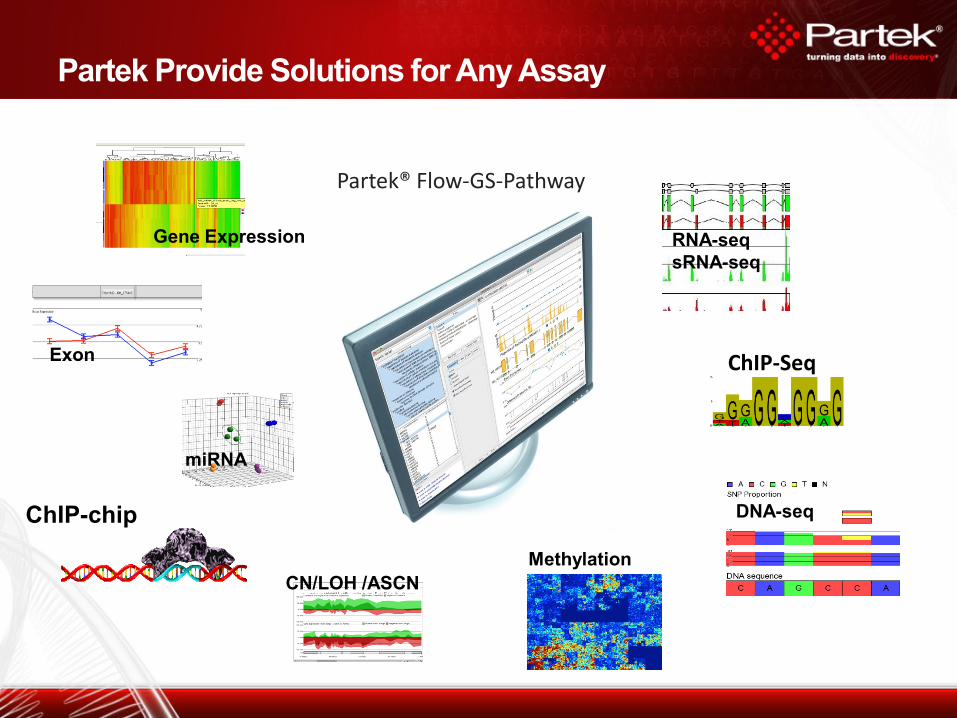
Partek Provide Solutions for Any Assay
Gene Expression RNA-seq
sRNA-seq
RNA-seq
sRNA-seq
RNA-seq
sRNA-seq
Exon Exon Exon
DNA-seq
miRNA
ChIP-chip
CN/LOH /ASCN
Methylation
ChIP-Seq
Partek® Flow-GS-Pathway

Free Software Trials
• partek.com/trial
• Email: [email protected]
Self-learning
• Help > On-line tutorials
• Recorded webinars
Regional Technical Support
• Email: [email protected]
• Phone: +1-314-878-2329
Partek is Your Partner