NextGen TV Survey Report 10-1-18-ForRelease-100518-v4
10
1 CONFIDENTIAL AND PROPRIETARY © 2018 by Frank N. Magid Associates, Inc. Any duplication, reproduction or usage of this document or any portion thereof without the written consent of the firm is prohibited. COURAGEOUS THINKING NextGen TV – Concept Testing Survey Findings September 2018
Transcript of NextGen TV Survey Report 10-1-18-ForRelease-100518-v4

1CONFIDENTIAL AND PROPRIETARY © 2018 by Frank N. Magid Associates, Inc. Any duplication, reproduction or usage of this document or any portion thereof without the written consent of the firm is prohibited.
COURAGEOUS THINKING
NextGen TV – Concept Testing Survey FindingsSeptember 2018

2
OBJECTIVESFor broadcasters, help Pearl TV and its Phoenix partners identify the most compelling NextGen TV features and services of interest to consumers. For CE partners, establish the initial consumer value proposition for buying a new TV set that is next-generation ready.
Prior Years
Q3 2018
Survey
Q4 2018 Labs
Q1 2019 Message Survey
other consumer study TBD
Q2 2019 Product
Test
Consumer Research Timeline
CONTEXT• This nation-wide consumer survey research will provide the
foundation for the Phoenix consumer lab testing later this year• The labs in turn will provide insights a survey can’t capture – and
support the next round of more focused quantitative testing

3
SURVEY METHODOLOGY
Concept Test for NextGen TV and its featuresRespondent shown written
description of concept, and different combinations of features to select
those they consider most/least valuable
N=1,501 Nationally(plus Oversample for additional Cord Nevers)
Ages 18-74, Watch any programming at least 1 hour in a typical day, Not employed in the TV
industry
Fielded September 7-16,
2018
Concept Evaluation and MaxDiff Analysis
See appendix for additional detail
WHAT WHO WHEN ANALYSIS
HOW (Survey design)
Screening Questions Concept Evaluation MaxDiff Exercise Demographics
Shown 14 different screens of different feature combinations and
asked most/least valuable

4
EXECUTIVE SUMMARY

5
§ Next-Gen TV has strong appeal to consumers, consistent with previous concept testing
§ Younger adults and Early Adopters find the Next-Gen TV concept especially appealing
§ The driving features of the Next-Gen TV concept relate primarily to the TV viewing experience. The top-valued features are common across subgroups
§ “Better picture” has top value, both itself and for exclusive programming with better picture quality§ Streaming integration is well received, to make it simpler for consumers to get to the TV content they prefer (whether SVOD or
broadcast networks)§ Similarly, the interactive on-screen guide is well received§ Sound features have notable value, as it relates to immersive audio, consistent loudness, and fixing hard-to-hear speech
§ The HDMI connector and the built-in new TV hardware have the strongest potential§ The set-top box option has notably lower receptivity§ Consumers express a willingness to spend at least something to have the hardware option they prefer
§ Next-Gen TV is seen as potentially adding value to high speed Internet service§ Overall, consumers are more likely to see Internet’s value increasing due to NextGen TV rather than decreasing§ Those most likely to use NextGen TV are even more likely to expect the value of Internet would increase
CONCLUSIONS: NEXT-GEN TV CONCEPT AND FEATURES

6
NEXTGEN TV CONCEPT EVALUATION

7
21% 27% 30% 10% 12%Likelihood to use
5/Very likely to use 4 3 2 1/Not at all likely to use
Most find the NextGen TV concept appealingNearly half would be very/somewhat likely to use the new TV service; rejection is rather low and receptivity is virtually identical to the 2017 findings
Base: Total N=1501Q: How appealing is this potential TV service?Q: How likely would you be to use this TV service, if it were available to you?
NextGen TV Concept Appeal & Likelihood to Use
25% 29% 28% 10% 9%Overall appeal
5/Very appealing 4 3 2 1/Not at all appealing
2017 24% 30% 28% 9% 9%
2017 21% 27% 26% 12% 14%

8
Younger adults find the NextGen TV concept especially appealingTwo-thirds of Gen Z and Millennials give the service a top-2-box rating. Gender differences are less pronounced, although more Gen X men than women rate it “4”.
Base: Gen Z (18-21) N=75; Millennial (22-37) N=455; Gen X (38-54) N=458; Boomer (55-74) N=513; Male Millennial N=228; Male Gen X N=223; Male Boomer N=234; Female Millennial N=227; Female Gen X N=235; Female Boomer N=279Q: How appealing is this potential TV service?
NextGen TV Concept Appeal – By Generation and Gender
28%
36%
23%
16%
37%
35%
24%
23%
14%
18%
35%
31%
30%
24%
32%
30%
35%
26%
26%
23%
Gen Z
Millennial
Gen X
Boomer
Male Millennial
Female Millennial
Male Gen X
Female Gen X
Male Boomer
Female Boomer
5-Very appealing 4
63%
67%53%
40%

9
CORE TARGET PROFILE(for those 5/very appealing AND 5/very likely to use NextGen TV)
49% female
51% male
29% 36% 33%
Under $35K $35K> / <$75K $75K+
54%
17%
20%
7%
3%
White or Caucasian
African American
Latin American or Hispanic
Asian or Pacific Islander
Other
EthnicityHousehold Composition32% Single, never married49% Married9% Divorced/Separated8% Living with Partner48% Kid in HH
Age Group13% 18-2432% 25-3420% 35-4416% 45-5414% 55-646% 65-74
Income
Employment Status66% Employed34% Not Employed
Education51% Less than Bachelor Degree48% Bachelor Degree or More
Region
20% West
20% Midwest
45% South
15% Northeast
Currently Live18% Apartment building6% Townhouse or attached home73% Single family home2% Apartment in someone's home
Rent vs. Own62% Own34% Rent4% Neither
Area Live38% Urban47% Suburban14% Rural
Pay TV38% Cable21% Satellite22% Other19% No Pay TV
GenerationGen Z 18-21
5%Millennial 22-37
47%Gen X 38-54
29%Boomer 55-74
20%
OTA 38%
Higher than TotalLower than Total
Research findings suggest that interest in this Next-Gen TV concept among younger consumers would broaden the appeal of and consumption of television content.
10
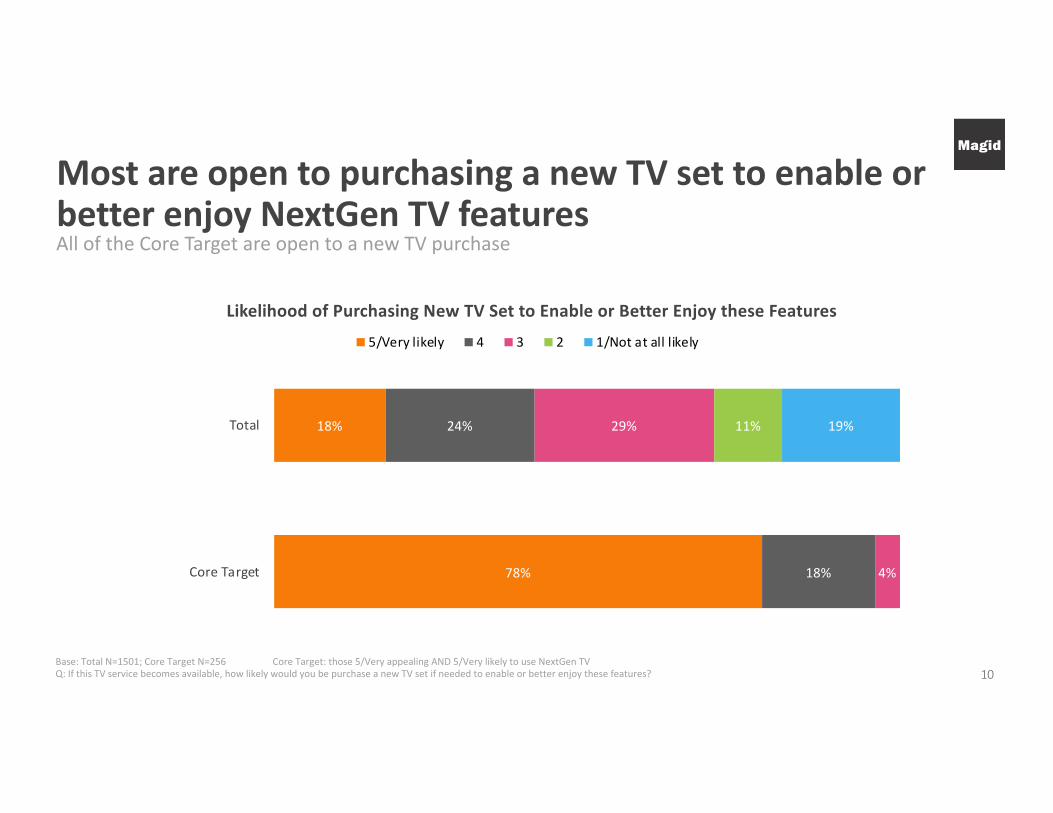
Most are open to purchasing a new TV set to enable or better enjoy NextGen TV features
Base: Total N=1501; Core Target N=256Q: If this TV service becomes available, how likely would you be purchase a new TV set if needed to enable or better enjoy these features?
Likelihood of Purchasing New TV Set to Enable or Better Enjoy these Features
18%
78%
24%
18%
29%
4%
11% 19%Total
Core Target
5/Very likely 4 3 2 1/Not at all likely
All of the Core Target are open to a new TV purchase
Core Target: those 5/Very appealing AND 5/Very likely to use NextGen TV