Next Generation Traveler Information System: A Five Year ...€¦ · Contract No....
76
Next Generation Traveler Information System: A Five Year Outlook Final Report Publication No. FHWA-HOP-15-029 August 2015
Transcript of Next Generation Traveler Information System: A Five Year ...€¦ · Contract No....

Next Generation Traveler Information System: A Five Year Outlook Final Report
Publication No. FHWA-HOP-15-029 August 2015

Notice
This document is disseminated under the sponsorship of the U.S. Department of Transportation in
the interest of information exchange. The U.S. Government assumes no liability for the use of the
information contained in this document.
The U.S. Government does not endorse products or manufacturers. Trademarks or manufacturers’
names appear in this report only because they are considered essential to the objective of the
document.
Quality Assurance Statement
The Federal Highway Administration provides high quality information to serve Government,
industry, and the public in a manner that promotes public understanding. Standards and policies
are used to ensure and maximize the quality, objectivity, utility, and integrity of its information.
FHWA periodically reviews quality issues and adjusts its programs and processes to ensure
continuous quality improvement.

Technical Report Documentation Page
1. Report No.
FHWA-HOP-15-029
2. Government Accession No.
3. Recipient's Catalog No.
4. Title and Subtitle
Next Generation Traveler Information System: A Five Year Outlook,
Final Report
5. Report Date
August 2015
6. Performing Organization Code
7. Author(s)
Valerie Shuman, Shuman Consulting Group (SCG); Michael Waisley
and Jeremy Schroeder, Battelle; Robert Brydia, Texas A&M
Transportation Institute (TTI)
8. Performing Organization Report No.
9. Performing Organization Name and Address
Battelle, 505 King Avenue, Columbus, Ohio 43201
10. Work Unit No. (TRAIS)
11. Contract or Grant No.
Contract No. DTFH61-12-D-
00046; Task Order No. T-5012
12. Sponsoring Agency Name and Address
U.S. Department of Transportation Federal Highway Administration Office of Operations 1200 New Jersey Avenue, SE Washington, DC 20590
13. Type of Report and Period Covered
14. Sponsoring Agency Code
15. Supplementary Notes
16. Abstract
Traveler information is in a state of significant growth and evolution. User expectations, technologies, and
the roles of the major public and private participants in the transportation ecosystem are all in motion.
Traditional approaches to planning for stable, long term solutions do not work well in the face of constant
consumer and technology change.
This report is intended to help agencies plan the next generation traveler information system so that they
stay in step with their customers and with transportation network management needs. It provides a current
snapshot of status in key areas such as traveler needs, technology trends, and business models. Against this
backdrop, the report provides guidance on operational and technical best practices that can be used by
public agencies as they develop next generation traveler information systems (NGTIS). These best
practices are designed to help agencies optimize their operational approaches to provide travelers with
improved functionality and generate desired transportation outcomes.
17. Key Words
Next Generation Traveler Information Systems,
Transportation Network Management
18. Distribution Statement
No restrictions
19. Security Classif.(of this report)
Unclassified
20. Security Classif.(of this page)
Unclassified
21. No. of Pages
76
22. Price
Form DOT F 1700.7 (8-72) Reproduction of completed page authorized


iii
PREFACE
The project team would like to acknowledge the following Transportation Management Center
Pooled Fund Study (TMC PFS) members for their contributions, support, and technical guidance
during this project.
Elizabeth Birriel Florida Department of Transportation
Ish Garza Nevada Department of Transportation
Donald Gedge Tennessee Department of Transportation
Shari Hilliard Kansas Department of Transportation
Elise Kapphahn Michigan Department of Transportation
Brian Kary Minnesota Department of Transportation
Paul Keltner Wisconsin Department of Transportation
Leslie McCoy Pennsylvania Department of Transportation
Lisa Miller Utah Department of Transportation
Jonathan Nelson Missouri Department of Transportation
Suzette Peplinski Michigan Department of Transportation


v
SI* (MODERN METRIC) CONVERSION FACTORS
APPROXIMATE CONVERSIONS TO SI UNITS
SYMBOL WHEN YOU KNOW MULTIPLY BY TO FIND SYMBOL
LENGTH
in inches 25.4 millimeters mm
ft feet 0.305 meters m
yd yards 0.914 meters m
mi miles 1.61 kilometers km
AREA
in2 square inches 645.2 square millimeters mm2
ft2 square feet 0.093 square meters m2
yd2 square yard 0.836 square meters m2
ac acres 0.405 hectares ha
mi2 square miles 2.59 square kilometers km2
VOLUME
fl oz fluid ounces 29.57 milliliters mL
gal gallons 3.785 liters L
ft3 cubic feet 0.028 cubic meters m3
yd3 cubic yards 0.765 cubic meters m3
NOTE: volumes greater than 1000 L shall be shown in m3
MASS
oz ounces 28.35 grams g
lb pounds 0.454 kilograms kg
T short tons (2000 lb) 0.907 megagrams (or "metric ton")
Mg (or "t")
TEMPERATURE (exact degrees) oF Fahrenheit 5 (F-32)/9
or (F-32)/1.8 Celsius oC
ILLUMINATION
fc foot-candles 10.76 lux lx
fl foot-Lamberts 3.426 candela/m2 cd/m2
FORCE and PRESSURE or STRESS
lbf poundforce 4.45 newtons N
lbf/in2 poundforce per square inch 6.89 kilopascals kPa
APPROXIMATE CONVERSIONS FROM SI UNITS
SYMBOL WHEN YOU KNOW MULTIPLY BY TO FIND SYMBOL
LENGTH
mm millimeters 0.039 inches in
m meters 3.28 feet ft
m meters 1.09 yards yd
km kilometers 0.621 miles mi
AREA
mm2 square millimeters 0.0016 square inches in2
m2 square meters 10.764 square feet ft2
m2 square meters 1.195 square yards yd2
ha hectares 2.47 acres ac
km2 square kilometers 0.386 square miles mi2
VOLUME
mL milliliters 0.034 fluid ounces fl oz
L liters 0.264 gallons gal
m3 cubic meters 35.314 cubic feet ft3
m3 cubic meters 1.307 cubic yards yd3
MASS
g grams 0.035 ounces oz
kg kilograms 2.202 pounds lb
Mg (or "t") megagrams (or "metric ton") 1.103 short tons (2000 lb) T
TEMPERATURE (exact degrees) oC Celsius 1.8C+32 Fahrenheit oF
ILLUMINATION
lx lux 0.0929 foot-candles fc
cd/m2 candela/m2 0.2919 foot-Lamberts fl
FORCE and PRESSURE or STRESS
N newtons 0.225 poundforce lbf
kPa kilopascals 0.145 poundforce per square inch lbf/in2

vii
TABLE OF CONTENTS
Page
PREFACE .................................................................................................................................... III
EXECUTIVE SUMMARY ........................................................................................................ XI MAJOR TRENDS ............................................................................................................ XI
RECOMMENDATIONS .................................................................................................. XI
CHAPTER 1. INTRODUCTION ................................................................................................ 1 1.1 INTRODUCTION ...................................................................................... 1 1.2 NGTIS BACKGROUND............................................................................ 2
CHAPTER 2. TRAVELER NEEDS ROADMAP (2014-2020)................................................. 5 2.1 WHO IS THE TRAVELER? ...................................................................... 5
2.1.1 Traveler Characterization Factors ............................................................... 6 2.1.2 Sample Segments ........................................................................................ 7
2.1.3 Overall Travel Trends ................................................................................. 9 2.2 WHAT ARE THEIR NEEDS/GOALS? ................................................... 10
2.2.1 Information Need Trends .......................................................................... 12
2.3 WHAT IS THEIR DAILY CONTEXT? .................................................. 16
CHAPTER 3. TECHNOLOGY ROADMAP (2014-2020) ...................................................... 19 3.1 OFFERINGS AND OFFERING TRENDS .............................................. 19
3.1.1 Today’s Offerings ..................................................................................... 19 3.1.2 Offering Trends ......................................................................................... 21
3.1.3 Offering Gap Analysis .............................................................................. 22 3.2 TECHNOLOGY AND DEPLOYMENT TRENDS ................................. 23
3.2.1 Collection Technologies ........................................................................... 24 3.2.2 Aggregation and Analysis Technologies .................................................. 26 3.2.3 Delivery Technologies .............................................................................. 27
3.2.4 International Trends .................................................................................. 35
CHAPTER 4. ROLES & MODELS REVIEW ........................................................................ 39 4.1 ROLES AND VALUE CHAINS .............................................................. 39
4.1.1 Role Trends ............................................................................................... 40
4.1.2 Public Sector Roles ................................................................................... 42 4.2 BUSINESS MODELS .............................................................................. 43
4.2.1 Public Sector Business Models ................................................................. 44
CHAPTER 5. OPERATIONS REVIEW .................................................................................. 47 5.1 BUSINESS PLANNING .......................................................................... 47
5.1.1 Strategy Management ............................................................................... 47 5.1.2 Roadmapping ............................................................................................ 49
5.2 TECHNOLOGY ADOPTION BEST PRACTICES ................................ 50
5.3 BUILD/BUY DECISION-MAKING ....................................................... 53 5.4 PARTNERSHIPS ..................................................................................... 54 5.5 OPERATIONS CONCLUSIONS ............................................................. 54
CHAPTER 6. REFERENCES ................................................................................................... 57

viii
LIST OF TABLES
Table 1. Sample Segment Analysis Factors (SCG) ....................................................................... 6
Table 2. RTSMIP Minimum Quality Levels (Title 23 CFR Part 511) ........................................ 26 Table 3. Traveler Information Delivery Technology Categories (SCG) ..................................... 29 Table 4. Traveler Information Apps (Brydia R. E., 2015) ........................................................... 32 Table 5. Value Creation Opportunities (SCG) ............................................................................. 43 Table 6. FHWA Systems Engineering Retirement/Replacement (National ITS
Architecture Team , 2007) ......................................................................................... 51
LIST OF FIGURES
Figure 1. Chart. Report Summary (SCG) ..................................................................................... 1 Figure 2. Chart. TNM, Consumer, and NGTIS Relationship View (SCG) .................................. 2
Figure 3. Chart. NGTIS Overview (SCG) .................................................................................... 3 Figure 4. Graph. Snapshot of transportation mode usage by generation (U.S. PIRG
Education Fund, 2014) ................................................................................................. 7 Figure 5. Graph. US Same-Day Delivery Market Forecast (Smith, 2014) ................................... 9 Figure 6. Graph. VMT Projections under Three Scenarios of Future Growth (U.S. PIRG
Education Fund, 2014) ............................................................................................... 10
Figure 7. Chart. Traveler Perspective (SCG) .............................................................................. 11 Figure 8. Chart. Traveler Information Roadmap (SCG) ............................................................. 12 Figure 9. Graph. Annual Person Trips and Person Miles per Capita by Urban/Rural (US
DOT, 2013) ................................................................................................................ 14 Figure 10. Map. State-level Connectivity Continuum (File, 2013) ............................................ 15
Figure 11. Graph. Demographic Composition of Social Networks (Hoelzel, 2015) .................. 17 Figure 12. Chart. Impact of Social Media in Multiple Operational Contexts (Pender,
2014) .......................................................................................................................... 21
Figure 13. Photo. Google Maps “Faster Route” Feature (Google.com) ..................................... 22 Figure 14. Graph. Information Types Disseminated by Freeway and Arterial Agencies
(Gordon & Trombly, 2014) ....................................................................................... 23
Figure 15. Illustration. Traffic Data Collection Technologies (INRIX.com) ............................. 25 Figure 16. Graph. Media Used by Transit Agencies (Gordon & Trombly, 2014) ..................... 28 Figure 17. Graph. Traveler Information Distribution Methods – Freeway and Arterial
Agencies (Gordon & Trombly, 2014) ....................................................................... 28 Figure 18. Graph. State DOT Social Media Adoption (AASHTO, 2014) .................................. 33 Figure 19. Graph. Pre-Trip Information Usage (Robinson, Jacobs, Frankle, Serulle, &
Pack, 2012) ................................................................................................................ 34 Figure 20. Chart. 511/IVR Tracking Framework (SCG) ............................................................ 35
Figure 21. Chart. Traveler Information Value Chain (SCG) ...................................................... 39 Figure 22. Chart. NGTIS / Big Data Landscape Example (Lawson, 2015) ............................... 41 Figure 23. Chart. Value Chain / Value Opportunity Review (SCG) .......................................... 44 Figure 24. Chart. Strategy Framework (SCG) ............................................................................ 48 Figure 25. Chart. Roadmap Framework Example (SCG) ........................................................... 50 Figure 26. Chart. Partnership Example (SCG) ........................................................................... 54

ix
LIST OF ABBREVIATIONS
AASHTO ............................ American Association of State Highway and Transportation Officials
ATDM ................................................................. Active Transportation and Demand Management
ATIS ................................................................................... Advanced Traveler Information System
B2B .................................................................................................................. Business to Business
B2C ................................................................................................................ Business to Consumer
CAGR ........................................................................................... Compound Annual Growth Rate
Caltrans .............................................................................California Department of Transportation
DMS .............................................................................................................Dynamic Message Sign
DOD ............................................................................................................. Department of Defense
ETA ......................................................................................................... Estimated Time of Arrival
FGDC ...................................................................................... Federal Geographic Data Committee
GPS ......................................................................................................... Global Positioning System
HAR ......................................................................................................... Highway Advisory Radio
ISO .......................................................................... International Organization for Standardization
ITIL ......................................................................... Information Technology Infrastructure Library
ITS................................................................................................ Intelligent Transportation System
IVR ......................................................................................................... Interactive Voice Response
MAP-21............................................................Moving Ahead for Progress in the 21st Century Act
NGTIS .................................................................... Next Generation Traveler Information Systems
OEM ............................................................................................ Original Equipment Manufacturer
PND....................................................................................................... Personal Navigation Device
RTSMIP ...................................................... Real-Time System Management Information Program

x
RTTI ............................................................................................... Real Time Traveler Information
SAFETEA-LU .......................... Safe, Accountable, Flexible, Efficient Transportation Equity Act:
A Legacy for Users
SRTI ........................................................................................... Safety-Related Traffic Information
TMC ...................................................................................................... Traffic Management Center
TNM ...................................................................................... Transportation Network Management
US DOT ...................................................................... United States Department of Transportation
VMT ............................................................................................................. Vehicle Miles Traveled

xi
EXECUTIVE SUMMARY
Traveler information is in a state of significant growth and evolution. User expectations,
technologies, and the roles of the major participants in the transportation ecosystem are all in
motion. Against this backdrop, this report seeks to provide a current snapshot of status in key
areas such as traveler needs, technology trends, and business models, and to offer guidance on
best practices which may be used by public agencies to navigate this landscape as they develop
next generation traveler information systems (NGTIS).
MAJOR TRENDS
Traveler information data has moved from being a siloed set of data collected for transportation
uses to being part of the overall “big data” stream that flows to and from consumers. This stream
now includes information about drivers, vehicles, and the network that they both move in, from
driving behavior patterns to real-time traffic status on freeways and arterials.
Both smartphones and connected infotainment- and telematics-equipped vehicles have become a
rich source of these valuable data for private companies, who have uncovered models for
monetizing it. As a result, the private sector is moving aggressively to capture, process, and sell
traveler information and the resulting services on a global scale. Major data mega-managers,
like Google, have included these data in their offerings and continue to integrate it with an ever-
expanding collection of new data and functionality.
Further progress in this direction should be expected, as continuing rapid adoption of
smartphones and other smart devices provides a widely available platform for both collecting
and sharing data and functionality with consumers. Longer term, further adoption of connected
infotainment and connected safety solutions will also add to these capabilities.
RECOMMENDATIONS
As a result of these dynamic trends, the traditional role of public sector agencies in providing
traveler information must be reconsidered. The outcomes of this assessment will vary from
agency to agency, but it is important both to perform such assessments now, as well as to
establish processes that ensure regular reviews are executed to help navigate anticipated change
in the traveler information landscape over the next 5-10 years.
At the most fundamental level, there is a need for agencies to link business and technology
processes more tightly together to ensure that increasingly fast evolution in the consumer and
private-sector marketplaces can be quickly understood, and that public sector NGTIS business
models and technology suites can effectively respond to these changes.

xii
Additional recommendations based on current trends include:
Re-visit core goals. Determine the most important objectives to accomplish as an overall
Transportation Network Management provider. Document how the collection and
sharing of specific transportation data supports those goals, including which data are
mission-critical and which can accept varying levels of availability risk.
Build and monitor a roadmap. The environment in which NGTIS functions is
changing rapidly, but the actual changes to a given agency’s NGTIS must be made at the
right time, in the right way. Building a roadmap allows the agency to set expectations for
change. Monitoring key metrics allows validation or refinement of actual changes. In
particular, the cross-over points where it makes sense to enter or exit key roles, deploy
specific technologies and insource or outsource parts of the overall system should be
carefully considered.
Standardize wherever possible. Standardization facilitates data analysis, sharing and
outsourcing as appropriate. The importance of this cannot be overemphasized. Barriers
to achieving economies of scale, opportunities for advanced functionality, and effective
outsourcing (when appropriate) are all significantly reduced by standardizing data so that
it can be easily integrated across systems.
Measure, measure, measure. The only way to make data-driven decisions is to have the
data in the first place. Determine the costs of collecting transportation data and
delivering it to consumers. Determine how travelers are actually using the data, and
measure how their behavior then impacts the transportation network.

1
CHAPTER 1. INTRODUCTION
1.1 INTRODUCTION
State and local transportation agencies provide traveler information to their communities using
increasingly sophisticated traveler information systems. These systems are evolving quickly.
The next generation traveler information systems (NGTIS) emerging in the five-year timeframe
need to consider an updated variety of data and delivery mechanisms to provide travelers with
improved functionality and generate desired transportation outcomes. The role of the public
sector systems must also be continuously evaluated in the context of private sector activities in
offering traveler information as well.
As in all such situations, resource
constraints prevent perfect
solutions. Decisions about
developing and managing NGTIS
must be based on overall goals and
operational outcomes. Every state
will have its own mix of “best
solutions” for providing these
systems – there is no single answer.
This report offers a set of best
practices and information that can
be used as a guide in making good
decisions over time as agencies
evolve their traveler information
solutions. These best practices are
provided in the context of current
and projected information about
stakeholder needs and overall
industry trends, as well as business
and operational models.
As described in Figure 1, this report is divided into four main chapters, and concludes with
references:
Chapter 2. Traveler Needs Roadmap (2014-2020).
Chapter 3. Technology Roadmap (2014-2020).
Chapter 4. Roles & Models Review.
Chapter 5. Operations Review.
Chapter 6. References.
Figure 1. Chart. Report Summary (SCG)
2
1.2 NGTIS BACKGROUND
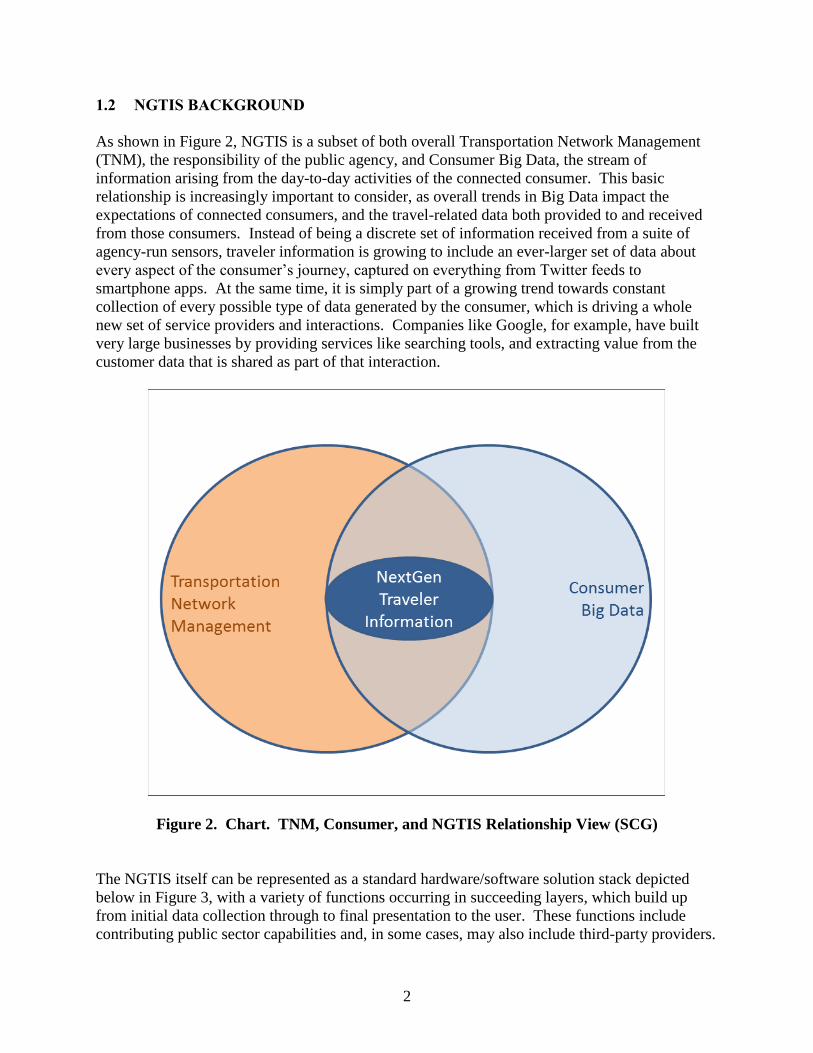
As shown in Figure 2, NGTIS is a subset of both overall Transportation Network Management
(TNM), the responsibility of the public agency, and Consumer Big Data, the stream of
information arising from the day-to-day activities of the connected consumer. This basic
relationship is increasingly important to consider, as overall trends in Big Data impact the
expectations of connected consumers, and the travel-related data both provided to and received
from those consumers. Instead of being a discrete set of information received from a suite of
agency-run sensors, traveler information is growing to include an ever-larger set of data about
every aspect of the consumer’s journey, captured on everything from Twitter feeds to
smartphone apps. At the same time, it is simply part of a growing trend towards constant
collection of every possible type of data generated by the consumer, which is driving a whole
new set of service providers and interactions. Companies like Google, for example, have built
very large businesses by providing services like searching tools, and extracting value from the
customer data that is shared as part of that interaction.
Figure 2. Chart. TNM, Consumer, and NGTIS Relationship View (SCG)
The NGTIS itself can be represented as a standard hardware/software solution stack depicted
below in Figure 3, with a variety of functions occurring in succeeding layers, which build up
from initial data collection through to final presentation to the user. These functions include
contributing public sector capabilities and, in some cases, may also include third-party providers.

3
This framework will provide structure for the rest of the report as we consider the individual
components of the NGTIS.
The first layer includes all data collection activities, both insourced and outsourced.
The second and third layers address data aggregation and data analysis, which may also
include an outsourced component in some cases.
The fourth layer involves the communication of data over various transmission
technologies, such as radio, cellular, etc.
Finally, there is the presentation layer, which encompasses a wide array of hardware and
user interface solutions tailored to deliver information to specific audiences such as
Emergency Responders, Traffic Management, and the Consumer. This fifth layer also
includes all outsourced presentation channels for traveler information, such as TV shows,
radio broadcasts, and private sector websites.
Figure 3. Chart. NGTIS Overview (SCG)
Today’s public sector traveler information systems have evolved from two perspectives: a) as an
outgrowth of existing traffic management activities, with traveler information seen as a useful
but secondary byproduct of data collected for other uses, and b) as solutions specifically
designed to support and improve individual traveler mobility. This difference in focus is
important to consider when planning NGTIS evolution, as it drives the basic goals and outcomes
expected from the system.

4
For example, if an NGTIS is designed to focus primarily on network efficiency, it might focus on
the needs of freight vehicles to help reduce major blockages from freight incidents; while an
NGTIS developed to impact consumer behavior and thus improve the mobility of those travelers
might involve a very different suite of data, communications, and presentation solutions. This
report provides a framework for considering these and many other strategic questions, for use by
state DOTs in addressing their unique local needs.

5
CHAPTER 2. TRAVELER NEEDS ROADMAP (2014-2020)
This roadmap chapter considers today’s traveler needs and projects upcoming requirements as
reflected in consumer research. It focuses on the questions:
What are the future trends of the traveler information needs, e.g., types of information,
coverage, timeliness, accuracy?
What are the trends and needs of urban versus rural areas?
2.1 WHO IS THE TRAVELER?
For agencies that choose to offer traveler-facing solutions, design starts with the end user. Who
is the traveler and what functionality will they actually use? For those focused primarily on
transportation network management, the same questions are important to understanding how to
influence travelers to act in the way which best optimizes network efficiency.
In both cases, it is important to characterize the traveler and their context. This chapter outlines
a segment analysis approach with an example set of traveler characterization factors, which can
be used when considering a specific state or region, and a sample description of key high-level
traveler segments.
Travelers can be characterized in a variety of different ways. This characterization, also
described as ‘segment analysis’, is a useful tool in assessing overall user communities to
determine appropriate NGTIS solutions. For example, a population which is largely rural and
older may take much longer to accept new solutions than a younger urban group.
Once traveler segments are well-understood, this information can be used in considering both the
required functionality of offerings and their deployment timing. Solutions for a rural community
must be tailored to address the needs of longer distance travelers with fewer route and mode
choices than those for a more urban group. Similarly, a community full of early adopters will
quickly benefit from information delivery on the latest handheld platforms, while a more
conservative community will not. At the same time, the early adopter community is quicker to
move away from existing solutions in favor of the next hot option, demanding more aggressive
technology deployment timelines.
These segments may also be used to test and monitor user response to NGTIS. Are specific
segments adopting and responding to new NGTIS offerings as expected? Is their new behavior
having the expected / desired impact on the overall transportation network? Is a new offering
generating positive customer satisfaction ratings among this group?
6
2.1.1 Traveler Characterization Factors
In this analysis, it is helpful to review both travel factors and technology adoption factors for a
target community. Travel factors provide insight into how and why people move from point to
point, helping to clarify what those consumers’ needs are as they do so. Technology adoption
factors help shed light upon the tools people are most likely to use and benefit from as part of
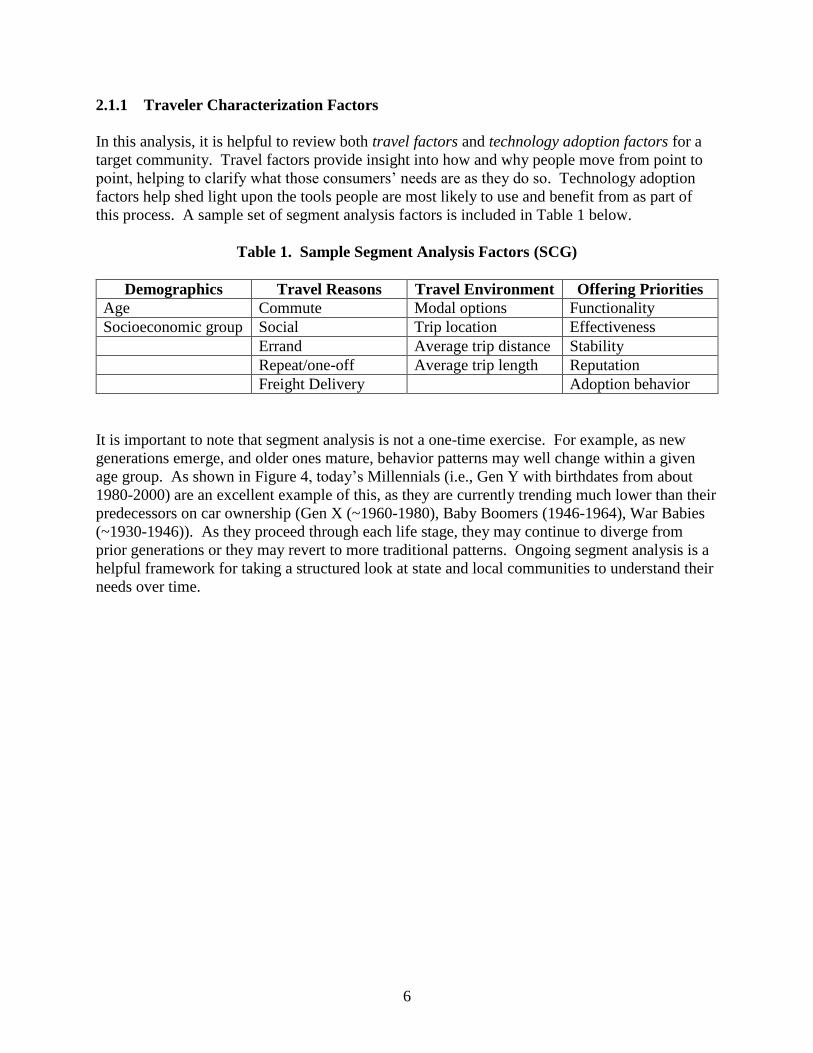
this process. A sample set of segment analysis factors is included in Table 1 below.
Table 1. Sample Segment Analysis Factors (SCG)
Demographics Travel Reasons Travel Environment Offering Priorities
Age Commute Modal options Functionality
Socioeconomic group Social Trip location Effectiveness
Errand Average trip distance Stability
Repeat/one-off Average trip length Reputation
Freight Delivery Adoption behavior
It is important to note that segment analysis is not a one-time exercise. For example, as new
generations emerge, and older ones mature, behavior patterns may well change within a given
age group. As shown in Figure 4, today’s Millennials (i.e., Gen Y with birthdates from about
1980-2000) are an excellent example of this, as they are currently trending much lower than their
predecessors on car ownership (Gen X (~1960-1980), Baby Boomers (1946-1964), War Babies
(~1930-1946)). As they proceed through each life stage, they may continue to diverge from
prior generations or they may revert to more traditional patterns. Ongoing segment analysis is a
helpful framework for taking a structured look at state and local communities to understand their
needs over time.

7
Figure 4. Graph. Snapshot of transportation mode usage by generation
(U.S. PIRG Education Fund, 2014)
2.1.2 Sample Segments
It is not possible to consider every permutation of possible factors which make up a potential
customer segment in this report. Instead, we have partially characterized a few high-level
segments below on a national basis as a sample. Although there are many possible segments
which might need to be considered by an agency, we have characterized a few high-level
segments below:
Urban commuters.
Rural drivers.
Truck drivers.

8
2.1.2.1 Urban Commuters
Travel Reasons: This group predominantly performs local trips to and from work, which
represent approximately 28 percent of all daily trips on U.S. roadways and transit systems
(Dorsey, 2015).
Trip Length: Average national trip length trends were 25.5 minutes in 2011, which did
not change from average length in 2000 (Polzin, 2013).
Modal Options: They have the largest set of modal options, with 69 percent of urban
households having access to transit (as opposed to 14 percent of rural households (ASCE,
2013).
2.1.2.2 Rural Drivers
Travel Reasons: This group largely travels in rural areas, for either business or
recreational purposes.
Trip Length: Rural trips may be long duration, i.e., approximately 50-100 miles, with the
possibility of changing conditions over the course of the travel.
Modal options: This group may have reduced options and mobility in the event of
situations that impact their trip, such as closures, incidents or adverse weather (Deeter,
2009).
2.1.2.3 Truck Drivers
Trip Distance: Truck drivers comprise 10 percent of vehicle miles traveled (VMT) in the
US (US DOT, 2013). This number is increasing as e-commerce continues to grow, as
shown in Figure 5 below (Smith, 2014) with the compound annual growth rate (CAGR).
Offering Priorities: This driving community is highly time-sensitive, facing direct
financial consequences for delay. As a result, the larger carriers have historically been
prompt adopters of technologies with clear return on investment, although solutions must
be hardened to meet the needs of both the truck driver demographic and the freight
business.
Trip Location: Truck drivers handle the bulk of interregional miles as well as an
increasing percentage of urban travel.

9
Copyrighted 2015. Business Insider, Inc. 119663:0915DS
Figure 5. Graph. US Same-Day Delivery Market Forecast (Smith, 2014)
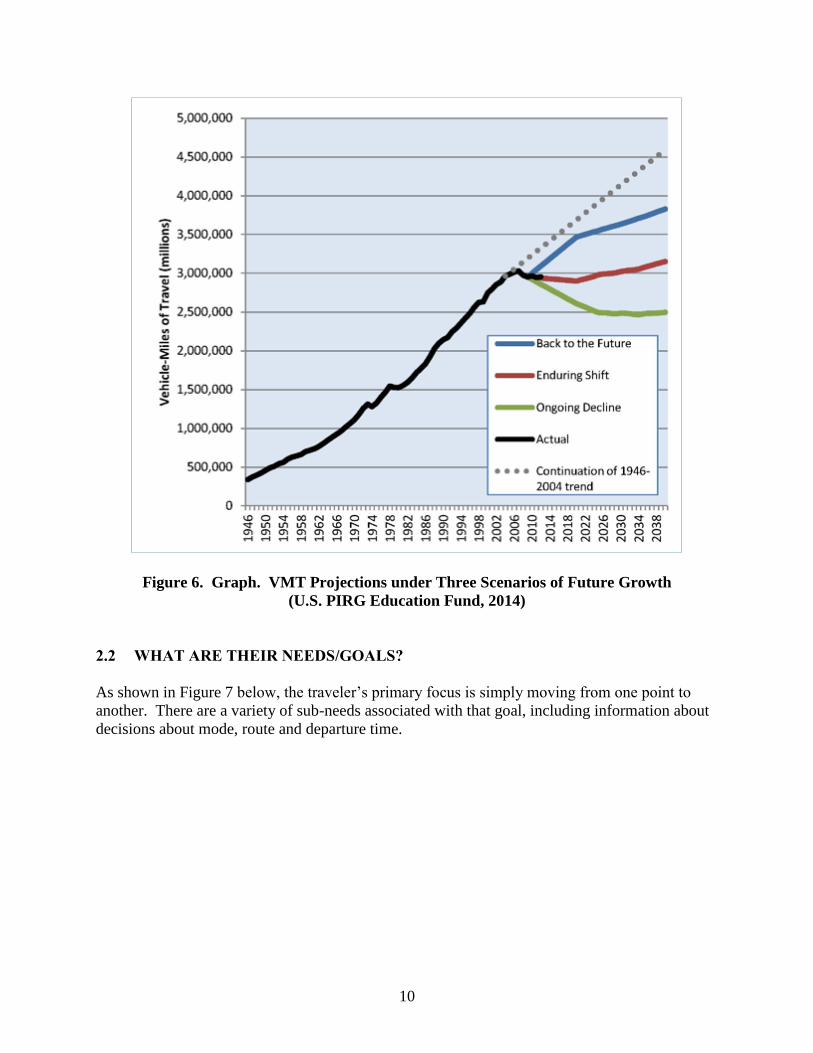
2.1.3 Overall Travel Trends
Overall VMT has decreased since about 2005. It should be noted that the timing for this shift
varies regionally, and that projections of this trend to future years vary significantly. Some
examples of future projections are shown in Figure 6. Researchers have posited a variety of
factors driving the existing trend, but it remains to be seen which will prove to have the most
impact. In the meantime, NGTIS planners and managers should monitor the situation in their
area.
10
Figure 6. Graph. VMT Projections under Three Scenarios of Future Growth
(U.S. PIRG Education Fund, 2014)
2.2 WHAT ARE THEIR NEEDS/GOALS?
As shown in Figure 7 below, the traveler’s primary focus is simply moving from one point to
another. There are a variety of sub-needs associated with that goal, including information about
decisions about mode, route and departure time.

11
Figure 7. Chart. Traveler Perspective (SCG)
At the next level of detail, specific information needs found in recent surveys (Brydia R. E.,
2015) include:
Expected delays between major points.
Current travel times between major points.
Current location and status of incidents.
Locations and times for planned lane closures.
Projected travel times between major points during their trip.
Availability of information (routes/maps) for necessary detour.
Current speeds between major points or smaller segments.
Visual confirmation of conditions at selected points.
Coverage across the entire trip, regardless of roadway choice or jurisdiction.
Pre-trip access to traveler information for planning (days or hours in advance).
En route access to traveler information.
Information of interest along route, including tolls, roadway restrictions, weather events,
rest stops, food, gas, lodging, and information related to tourism.
On the transit side, needs include (Brydia R. E., 2015):
Real-Time:
o Transit departure/arrival time.
o Service changes.
o Outages.
o Parking availability and fees.
o Current system delays.
o Current information on alternate modes.
The Traveler’s Perspective: Get from Point A to Point B
Pre-Trip Needs
• Decide mode
• Decide route
• Decide departure time
• Revise departure time, mode and route as needed
En Route Needs
• Stay aware of travel time changes
• Revise route as needed
• Revise mode as needed
“Last Mile” Needs
• Find parking
• Navigate to final destination

12
Static:
o Schedule, fare, security, and accessibility information.
o Transfer information.
o Directions to/from transit locations.
2.2.1 Information Need Trends
While traveler needs as shown in Figure 7 are not changing, expectations for meeting these needs
are growing rapidly, as connected consumers become used to instant access to information and
services.
Figure 8 provides a high level view of the evolution in information need trends, from a focus on
basic information used by humans to make travel decisions to the availability of more
sophisticated collections of information which can be used by computers to automate support for
traveler needs. These and other information attributes and types of information are described in
more detail in the subsections below.
Figure 8. Chart. Traveler Information Roadmap (SCG)
2.2.1.1 Information Attributes
The core attributes, such as quality, availability, timeliness, functionality and reliability of data
continue to be a focus for all providers. Key trends in this area include:
Anytime/anywhere availability. Connected consumers expect to be able to access
information wherever they are, on whatever device they happen to be using.
Contextual filtering. Simple availability, however, does not go quite far enough. There
is so much data available at this point that consumers are now asking for data and service
Basic Limited information delivered in small, discrete offerings, non-real-time (e.g., HAR listings)
Contextual Information delivered in response to consumer environment. May be real-time or predictive
(e.g., visual traffic congestion along calculated route)
Ambient Anywhere, anytime information automatically integrated with other functionality by machines to support traveler needs
(e.g., calendar alerts based on traffic)
Information for humans Information for machines

13
providers to deliver only “exactly what, when, and where needed.” Consumers want their
data filtered for local and individual relevance and provided in their preferred format.
One example of this is the interest in multi-lingual data. (Deeter, 2009) Another is the
concept of safety-oriented traveler information such as real-time warnings of upcoming
traffic jams to help avoid rear-end collisions with stationary queues. (TomTom, 2013)
Ambient data use. (Daecher & Galizia, 2015) As the Internet of Things evolves, certain
types of data become more useful when employed by machines than by humans. Current
examples include map data, which is increasingly used by machines to provide directions,
rather than by humans directly; and time data, which is a fundamental part of practically
all automated activities. Traffic data appears to be headed in the same direction, as
consumers are being offered functionality which takes the state of the transportation
network into account, rather than consuming traffic incident information directly. One
example would be applications which provide calendar alerts based on current or
projected travel times. Another example is real estate applications which rate location
suitability based on average commute times.
Ability to Integrate. Fundamental to all of the previous points is the concept that
traveler information is one of many types of data being processed in new ways and new
combinations. It must be capable of being attached to locations, processed by calendars,
and fused with multiple other data types to produce new functionality. One classic
example is multimodal data – consumers increasingly expect to get information about
every available mode, from bikeshare to carshare to transit, as well as related parking and
traffic data, in one application.
2.2.1.2 Types of Information
The general trend for information types is simply “more”, as service providers seek to deliver
ever-improving functionality to their consumers. Specific data types that are receiving attention
include:
Arterial travel times. This information is required to deliver high-quality route choice
functionality. Travelers want to know not only where problems are occurring, but the
best ways around them. This is most practical in in areas with strong arterial alternatives
to freeway travel.
Parking. Parking data has been available for some time, but has found its way into the
spotlight over the last two years or so, with a number of new smartphone apps and their
inclusion by OEMs in in-vehicle infotainment solutions. Parking data claims a variety of
strong benefits in addition to consumer convenience, including reduced congestion in
central business districts.
Predictive. True, real-time, predictive data has been a holy grail for traffic providers for
decades. Recent advances in data availability and integration have moved the needle
forward in this area, as providers seek to deliver quality estimated times of arrival for

14
consumer use. For further discussion on predictive data, see the section titled
“Aggregation and Analysis Technologies” in the next chapter.
Environmental. A recent symposium on probe data showed increased private sector
interest in providing environmental data such as emissions and fuel costs (Hamedi, 2015).
These data may be of use both to planners and to system managers who provide it back to
travelers in situations such as Ozone Action Days. Data to support electric vehicles was
also discussed.
Rural vs. Urban
Rural travelers need information that caters to their travel patterns. Longer trips require more en
route data to keep the traveler abreast of changes during the trip. As noted previously, rural
drivers may also have reduced options and mobility in the event of situations that impact their
trip, such as closures, incidents, or adverse weather. Figure 9 shows the contrast between rural
and urban person trips and miles per capita. Per the NHTS, person trips may include any mode
of travel, but rural travel is predominantly automobile travel.
Figure 9. Graph. Annual Person Trips and Person Miles per Capita by Urban/Rural
(US DOT, 2013)
One key item to consider is that the rural availability and adoption of some technologies has
historically been slower than urban. In some areas, for example, cellular coverage is still
unreliable or non-existent. Figure 10 shows the state-level estimates of no connectivity, or
individuals who did not connect to the Internet and lived in a home without a computer. This
means that both information and delivery solutions must be appropriate to the environment and
the demographic.

15
Figure 10. Map. State-level Connectivity Continuum (File, 2013)

16
2.3 WHAT IS THEIR DAILY CONTEXT?
It is important to consider NGTIS in the traveler lifestyle contexts in which they are used. Key
trends in this area include:
Rapid mobile device adoption. At this point, the majority of American adults have
smartphones, and adoption rates continue to grow. A broad array of other mobile devices
are also quickly becoming fixtures in consumer households, fueling the expectation that
at any given moment, a screen providing information access will be ready-to-hand.
From a public sector perspective, it is important to serve both the mobile device-enabled
community and those who have not yet moved to this technology. At the same time, the
extremely high usage levels of these new platforms among those who do have them
makes it equally important to carefully consider the new platforms as they emerge. As of
January 2014:
o 90 percent of American adults have a cell phone.
o 58 percent of American adults have a smartphone.
o 42 percent of American adults own a tablet computer (Pew Internet Project, n.d.).
Traveler Information access via smartphone. There are relatively few studies on this
topic, but it is clear that travelers are using their smartphones as a routine source of travel
information, with most reporting use of directions/navigation, and somewhat fewer
mentioning traffic and transit information. We have not found any studies which show a
direct correlation between smartphone device ownership and use of smartphones for
traveler information – the studies simply note that certain percentages of smartphone
owners do use their phones in this way. It is reasonable to project that in the years since
these studies were done, this trend has continued upwards.
It is important to note that many of those getting directions may also be receiving traffic
data along their routes without having to ask for it separately (e.g., via Google Maps).
Another item to consider is the variation in this usage among user segments, which may
help an agency understand how best to serve certain communities. For example, one
study shows African-Americans using their cellphones 31 percent of the time in the past
month to get up-to-the-minute traffic or public transit information while whites in the
same study reported using their phones in this way 16 percent of the time. (Rainie & Fox,
2012)
o 74 percent of adult smartphone owners ages 18 and older say they use their phone
to get directions or other information based on their current location.
o In an April 2012 survey, 20 percent of users surveyed have used their phone to get
up-to-the-minute traffic or public transit information to find the fastest way to get
somewhere in the past 30 days (US DOT, 2015).
o Some 65 percent of smartphone owners say they have gotten turn-by-turn
navigation or directions while driving, with 15 percent doing so on a typical day.
(Rainie & Fox, 2012)

17
o A 2012 survey of 752 drivers along I-35 in Texas showed that 60% used traffic-
or travel-related applications on their cell phone or device. (Brydia R. E., 2012).
Social media evolution by age group. Social media is the focus of a great deal of
attention, and continues to grow rapidly. However, it is important to note variations by
user segment in this area as well, particularly age-related ones. For example, millennials
are very heavy Facebook users (over 90 percent), while fewer than 40 percent use
Twitter. (MarketingCharts, 2015). An alternative analysis of social media demographics
is shown below in Figure 11.
Copyrighted 2015. Business Insider, Inc. 119663:0915DS
Figure 11. Graph. Demographic Composition of Social Networks (Hoelzel, 2015)


19
CHAPTER 3. TECHNOLOGY ROADMAP (2014-2020)
The Technology Roadmap provides a snapshot of today’s technology landscape, and projects
likely evolution based on emerging technologies, as well as the lifecycles and adoption of
existing and new solutions. Questions considered include:
What are the most popular ways for travelers to obtain information, pre-trip and en route?
What are the back-end data issues with managing large data volumes?
What is the latest on data quality standards and improvements?
What likely impacts will technology advances have on current information delivery
technology? For example, how will advances in cloud-based services and in-vehicle
devices with innovative voice-based transactions and heads-up displays impact traveler
information dissemination? Also, what about connected vehicles?
Will Interactive Voice Response (IVR), Highway Advisory Radio (HAR) and 511 still be
viable delivery methods in the future?
Will social media meet the need? Will there be gaps to be filled and how?
This chapter includes:
Offerings and Offering Trends.
Technology and Deployment Trends.
3.1 OFFERINGS AND OFFERING TRENDS
3.1.1 Today’s Offerings
The list of ways for travelers to get traveler information continues to grow, as dozens of
permutations of new solutions, such as apps and social media, are added. Currently available
platforms include:
FM and AM radio, including highway advisory radio (HAR) and Radio Data System –
Traffic Message Channel (RDS-TMC).
Broadcast TV.
In-vehicle infotainment systems (built-in and aftermarket).
Cellphones.
Smartphones and other smart devices (tablets, etc.).
Desktop computers.
Infrastructure signage such as Dynamic Message Signs (DMS) and real-time transit
information signs.

20
While growth in newer solutions has been explosive, studies show that the more traditional
means of accessing information still receive substantial use. In particular, some studies show
TV, radio, and non-mobile websites are still being used the majority of the time for pre-trip
review (Robinson, Jacobs, Frankle, Serulle, & Pack, 2012). En route, the leading source of
information remains radio, with DMS coming in second.
Newer solutions such as mobile sites and apps are now running third for pre-trip and en route use
according to several recent studies. It is reasonable to expect that growth of these tools will
continue.
However, it remains critical to carefully track both actual usage and the impact of that usage on
behavior in order to determine the correct timing for phasing in traveler information solutions
appropriate to both key user communities and overall transportation goals. Each type of social
media has its pros and cons for different operational situations. For example, when
communicating transit information to users, social media may be much more helpful for services
which operate every hour (or less) than those which have lower service frequencies. One
detailed example of considering the potential impact on user behavior is shown in Figure 12
below (Pender, 2014). In this example, transportation system characteristics (network context,
system characteristics) are mapped to social media application.

21
Figure 12. Chart. Impact of Social Media in Multiple Operational Contexts (Pender, 2014)
3.1.2 Offering Trends
The trend in new traveler information offerings follows the information need characteristics
discussed above, as providers strive to provide functionality which supports anytime/anywhere
availability, contextualized data, and machine-useable ambient data.

22
A few recently announced examples include:
INRIX now offers an app that provides a “driver-friendly user interface” on certain
Samsung phones. It is specifically described as making it easier to get traffic information
with best routes, travel times,
and estimated times of arrival
(ETAs), as well as real-time en
route voice alerts about
incidents, nearby parking
locations, and best price gas
stations (INRIX, 2015 ).
Google Maps now offers a
“faster route” alert solution for
Android and iOS (see Figure
13), which lets users know when
a better route becomes available
(Protalinski, 2014).
TomTom provides real-time
“Jam Ahead” warnings, to make
consumers aware that they are
nearing the tail of a traffic jam
queue. This solution is
described as a safety offering,
helping travelers slow down
before encountering slowed or
stopped traffic (TomTom, 2013).
3.1.3 Offering Gap Analysis
When determining appropriate NGTIS offerings, it is helpful to generate a baseline by
considering both the overall goals of the agencies involved and the specific needs of the major
traveler segments to be served. A gap analysis involves comparing existing offering
functionality with this baseline to identify unmet needs, i.e., gaps. For example, if provision of
high quality traffic-responsive routing is required, then arterial data availability may become a
key gap to address. As is shown in Figure 14 arterial agencies are less likely to disseminate
various types of traveler information.
This analysis will vary by locality, but there are some items which have been consistently
identified as gaps and may serve as a useful starting point for these considerations:
Data type issues.
o Are the available data sets sufficient to support desired functionality?
Figure 13. Photo. Google Maps “Faster Route”
Feature (Google.com)
Google and the Google logo are registered trademarks of Google Inc.,
used with permission.

23
Coverage issues.
o Is the available geographic, modal, and road classification coverage enough to
enable needed capabilities?
Integration issues.
o Is there sufficient cross-jurisdictional integration to support inter-regional and
intermodal travel?
o Are various types of traveler information siloed within departments and agencies,
reducing potential functionality?
o Is the NGTIS offering suite fragmented across platforms, making it difficult to
promote availability and value to consumers?
Figure 14. Graph. Information Types Disseminated by Freeway
and Arterial Agencies (Gordon & Trombly, 2014)
3.2 TECHNOLOGY AND DEPLOYMENT TRENDS
Building, operating, and enhancing an NGTIS requires an increasingly complex suite of
technologies, including:
Collection. Solutions in this area may include everything from traditional loop detectors
to modern probe and crowdsourcing.
Aggregation and Analysis. Once data are collected, a rapidly expanding array of
capabilities is available to combine large sets of similar and related data for
transformation into high value information for use throughout the transportation
management system.

24
Delivery. A variety of mechanisms exist for transporting traveler information from
sources to users, including radio, TV, and the internet, as well as providing a means for
travelers to interact with NGTIS information, including websites, IVRs, apps, etc.
Each of these areas is currently quite dynamic, with new solutions emerging and costs dropping
at an unprecedented rate. This section will take a look at highlights for each area.
3.2.1 Collection Technologies
Data collection has historically been based on static sensors placed at or in the roadside, such as
loop detectors, cameras, toll tag readers, and more recently, Bluetooth readers which register
passing cellphones. Significant deployments of these technologies are in operation, and further
ones are planned. At the same time, there is a new emphasis on mobile sensors which can be
rapidly and broadly deployed. These solutions include:
GPS probes installed in various fleets.
Anonymous or opt-in collection of consumer smartphone data.
Anonymous or opt-in collection of consumer vehicle data.
Citizen reporting via voice or automated tools.
These mobile solutions are particularly appealing because they have no right-of-way restrictions,
and may not require that traffic collectors deploy much physical infrastructure beyond the back-
end processing needed to handle the data. In fact, these solutions have done so well that some
industry commenters have started to consider a future in which mobile sensors become the
exclusive source of traffic data. It is unclear that such a change is feasible at this stage, but the
possibility is certainly one that should be monitored closely over time using consistent metrics
such as quality, reliability, and cost. A summary view of traffic data collection technologies is
shown below in Figure 15.
As a result of the addition of new probe capabilities, more traffic and traveler data streams are
becoming widely available. Basic issues, like cross-source location referencing and overall data
security, have not gone away, but the number of real-time data points to be managed on a daily
basis has soared into the billions. Particularly in the case of probe data, this significantly
increases the complexity of managing this information.

25
Figure 15. Illustration. Traffic Data Collection Technologies (INRIX.com)
Detailed state of the practice summaries of arterial and rural solutions can be found in Travel
Time on Arterials and Rural Highways: State-of-the-Practice Synthesis on Arterial Data
Collection Technology (Singer, Robinson, Krueger, Atkinson, & Myers, 2013).
3.2.1.1 Data Quality Standards
The Real-Time System Management Information Program (RTSMIP) provides a baseline for
traffic quality levels, as shown in Table 2 below. There is ongoing work to provide consensus
standards for measuring this quality. The American Society for Testing and Materials (ASTM)
in particular has a number of activities in this area:
ASTM WK27028 New Test Methods for Evaluating Travel Time Data Quality.
ASTM WK35821 New Specification for / Guide for Highway Classification Systems
with User Requirements and Test Methods.
ASTM WK35917 New Specification for Archiving Traffic Incident Characteristics and
Management Data.

26
Older standards in this space include ASTM’s series of E-standards and Federal Geographic
Data Committee (FGDC), International Organization for Standardization (ISO) and Department
of Defense (DOD) guidelines:
ASTM E2759-10 Standard Practice for Highway Traffic Monitoring Truth-in-Data.
ASTM E2259 Guide for Archiving and Retrieving Intelligent Transportation Systems-
Generated Data.
ASTM E2468 Practice for Metadata to Support Archived Data Management Systems.
ASTM E2532 Test Methods for Evaluating Performance of Highway Traffic Monitoring
Devices.
ASTM E2665 Specification for Archiving ITS-Generated Traffic Monitoring Data.
ASTM E2667 Practice for Acquiring Intersection Turning Movement Traffic Data.
FGDC-STD-001-1998 and ISO DIS 19115 (metadata) guidelines for quality advanced
traveler information system (ATIS) data (ITS America 2000).
DOD Guidelines on Data Quality Management.
Table 2. RTSMIP Minimum Quality Levels (Title 23 CFR Part 511)
Category of
Information
Timelines – Interstate
Highways (Statewide)
Timelines –Limited
Access Roadways In
Metropolitan Areas
Availability Accuracy
Construction
Activities 20 minutes 10 minutes 90% 85%
Roadway or lane-
blocking incidents 20 minutes 10 minutes 90% 85%
Roadway weather
observations 20 minutes 20 minutes 90% 85%
Travel time/speed
information N/A 10 minutes 90% 85%
3.2.1.2 Data Quality Improvements
Public and private sector data managers are continuously working to improve data quality. One
recent example is the focus on sub-TMC granularity. At a January 2015 conference, three major
traffic data vendors reported that they are now able to offer sub-TMC link level data. This is a
relatively new offering, and discussions are underway about access and effective operational use
of this information. (Hamedi, 2015)
3.2.2 Aggregation and Analysis Technologies
The largest trend in data aggregation is the rapidly increasing ability to fuse and analyze data sets
for improved NGTIS end product functionality. One area which illustrates this trend particularly
well is predictive traffic.

27
Travel time prediction has been a major focus of advanced traveler information systems in recent
years. Travelers can use travel time if accurately predicted to make informed decision both pre-
trip and en route. Predicted travel time information can also be used as inputs to optimize
network capacity and reduce bottlenecks using various active transportation and demand
management (ATDM) strategies.
Several travel time prediction techniques have been developed. These techniques can be
categorized into two approaches: (a) regression-based methods and (b) machine learning
methods. The travel time data can come from various sources including toll tags, fixed sensors,
and Bluetooth probes. Research also captures the effect of weather on the predicted travel time
using toll tag readings as a data source (Faouzi, Billot, & Bouzebda, 2010). Specific examples
include:
TomTom claims to be the first company to use real-time weather information to calculate
routes and arrival times commercially (TomTom, 2014).
IBM’s “Smarter Traveler” traffic prediction tool, developed with the help of University
of California Berkeley’s Mobile Millennium project team and the California Department
of Transportation (Caltrans). The tool relies on predictive analytics software, crowd-
sourced GPS monitoring, and permanent infrastructure sensors. The predictive system is
built upon a control theory and machine learning methods. The system can offer alerts
and build a custom model for each individual’s commuter route (Melanson, 2011).
Microsoft’s Clearflow project focused on applying machine learning to learn how to
predict the flows on all street segments of a greater city area. The algorithm is based on
crowdsourcing of GPS data from volunteers, buses, and paratransit vehicles for over five
years. The data was used to identify dependencies among flows based on various
attributes of road network and topology in order to build predictive models. Clearflow
traffic-sensitive directions were first available in the spring of 2008 and have been
integrated into Bing Directions (Predictive Analytics for Traffic, n.d.).
The Daily Commute app compiles the individual traveler’s data from previous commutes
to predict how long the travel time will be on a daily basis, and lets the user know how
much time he/she should budget before embarking on the trip. The application builds a
custom model using average values on a weekly and yearly basis and becomes more
intelligent with frequent use (Commute, n.d.).
3.2.3 Delivery Technologies
Delivery technologies span a wide range of solution types and technologies. Deployment of
many of these solutions has reached very high levels among freeway agencies, with transit
agencies focusing primarily on web-based solutions (Figure 16 and Figure 17).

28
Figure 16. Graph. Media Used by Transit Agencies (Gordon & Trombly, 2014)
Figure 17. Graph. Traveler Information Distribution Methods –
Freeway and Arterial Agencies (Gordon & Trombly, 2014)
29
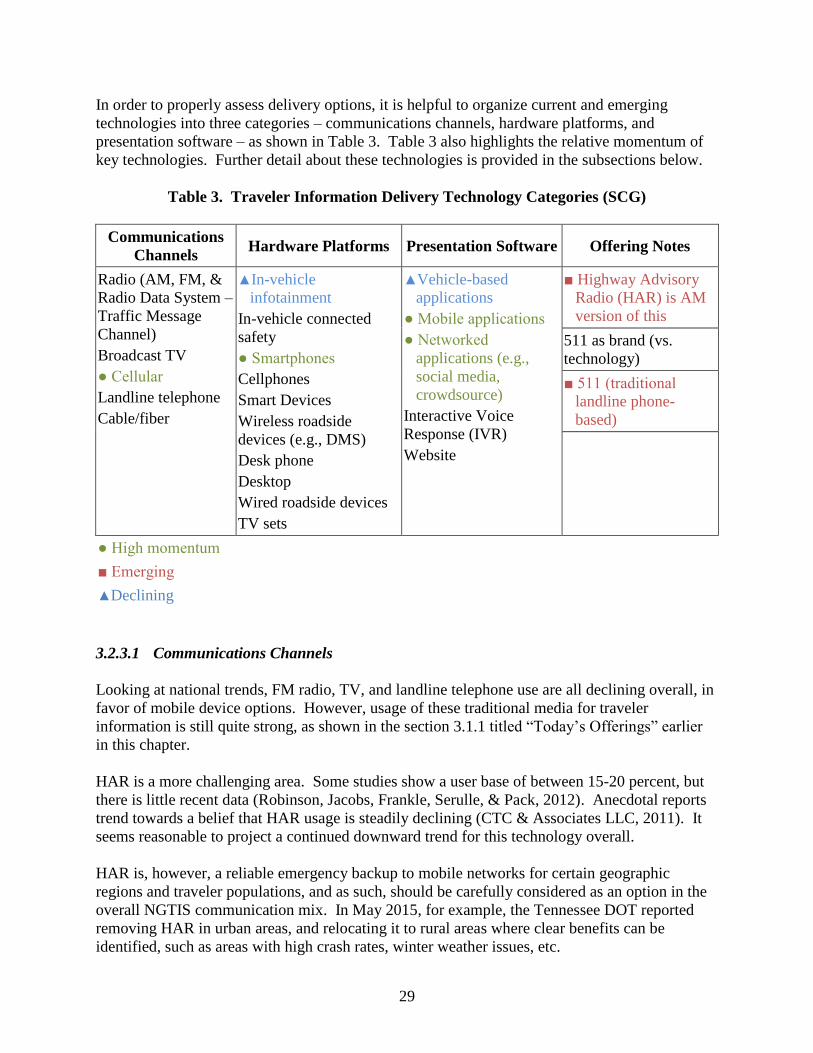
In order to properly assess delivery options, it is helpful to organize current and emerging
technologies into three categories – communications channels, hardware platforms, and
presentation software – as shown in Table 3. Table 3 also highlights the relative momentum of
key technologies. Further detail about these technologies is provided in the subsections below.
Table 3. Traveler Information Delivery Technology Categories (SCG)
Communications
Channels Hardware Platforms Presentation Software Offering Notes
Radio (AM, FM, &
Radio Data System –
Traffic Message
Channel)
Broadcast TV
● Cellular
Landline telephone
Cable/fiber
▲In-vehicle
infotainment
In-vehicle connected
safety
● Smartphones
Cellphones
Smart Devices
Wireless roadside
devices (e.g., DMS)
Desk phone
Desktop
Wired roadside devices
TV sets
▲Vehicle-based
applications
● Mobile applications
● Networked
applications (e.g.,
social media,
crowdsource)
Interactive Voice
Response (IVR)
Website
■ Highway Advisory
Radio (HAR) is AM
version of this
511 as brand (vs.
technology)
■ 511 (traditional
landline phone-
based)
● High momentum
■ Emerging
▲Declining
3.2.3.1 Communications Channels
Looking at national trends, FM radio, TV, and landline telephone use are all declining overall, in
favor of mobile device options. However, usage of these traditional media for traveler
information is still quite strong, as shown in the section 3.1.1 titled “Today’s Offerings” earlier
in this chapter.
HAR is a more challenging area. Some studies show a user base of between 15-20 percent, but
there is little recent data (Robinson, Jacobs, Frankle, Serulle, & Pack, 2012). Anecdotal reports
trend towards a belief that HAR usage is steadily declining (CTC & Associates LLC, 2011). It
seems reasonable to project a continued downward trend for this technology overall.
HAR is, however, a reliable emergency backup to mobile networks for certain geographic
regions and traveler populations, and as such, should be carefully considered as an option in the
overall NGTIS communication mix. In May 2015, for example, the Tennessee DOT reported
removing HAR in urban areas, and relocating it to rural areas where clear benefits can be
identified, such as areas with high crash rates, winter weather issues, etc.
30
3.2.3.2 Hardware Platforms
Key hardware platforms for the dissemination of traveler information include:
Mobile devices have unquestionably become a key platform for the distribution of
traveler information. Smartphones, cellphones, and smart devices are all enjoying rapid
and widespread consumer adoption. The more advanced solutions, however, are not yet
in use by all populations in all locations. Over 30 percent of American adults do not yet
have smartphones (Pew Internet Project, n.d.).
In-vehicle infotainment platforms are growing in availability. Car manufacturers now
offer these systems in a wide range of makes and models. There are, however, ongoing
issues with usability, as the rush to provide complex functionality has outstripped ease of
use considerations. It remains to be seen how quickly consumers will adopt these
solutions as they update their vehicles. It is also not clear exactly how often consumers
are actually using these platforms to access traveler information.
Smartphone integration solutions are also starting to emerge, as car manufacturers seek
to manage the disparity between automotive and consumer electronics life cycles by
enabling the use of the smartphone to host or connect apps for use in the vehicle.
Mirrorlink, Google Android Auto and Apple Carplay solutions are now making their way
into the market, although overall penetration and availability are still fairly low at this
time (Connected World, 2015).
In-vehicle connected safety systems are not yet available, although at least one
automaker has targeted 2017 as an initial commercial release date (GM, 2014). There is
significant federal government interest in accelerating the rapid deployment of these
solutions, but standards and business models are still under discussion and projected
timing of a potential broad deployment is not yet clear. This is an area to watch, but is
unlikely to have a significant impact within the five-year timeframe of this study.
3.2.3.3 Presentation Software
From the traveler’s perspective, the software used to present the information is what matters, as
it controls the user experience and hopefully ensures safe en route operation. This software can
reside in various places – on the vehicle, on mobile devices – and operate either individually or
as part of a social network.
Within the vehicle, an increasing range of traveler information applications are now packaged as
part of in-vehicle infotainment systems, or available through smartphone integration. Private
sector traffic providers have now taken their place on the dashboard, as evidenced by
announcements such as the INRIX / Audi offering first shown at CES 2015 (INRIX, 2015).
31
On the mobile side, the majority of state DOTs now support mobile platforms (80 percent). In
addition, many offer mobile applications with a primary focus on traffic and traveler information
(55 percent). These apps may also provide safety messages (15 percent), project updates and
notifications (23 percent), and general DOT information (34 percent). A significant percentage
of these apps are developed by DOT staff (more than 1-in-4) (Brown, 2014).
These public sector offerings are joined by a broad array of private sector apps and mobile
websites. A summary of some widely-used traveler information applications is provided in
Table 4. As can be seen from this sample set, the private sector is actively investing in traveler
information offerings which draw on the latest data and data collection approaches to provide a
comprehensive set of capabilities.

32
Table 4. Traveler Information Apps (Brydia R. E., 2015)
W
aze
INR
IX
Map
s
Sig
ale
rt
Tra
pst
er*
Sco
ut
GP
S
VZ
Navig
ato
r
AT
&T
Navig
ato
r
Map
Qu
est
Real-time Traffic
Information
Pre-Trip Information
En Route Information
Crowd Sourcing
Sensor/Probe
Information
Prediction Algorithm
Personalized
Information
Number of Users High High High Low Med Med Low Low High
Review Rating 1 4+ 3 4 2.5 NA 3.0 3.0 2.5 3.0
Traffic
Regional Traffic
Alerts Push Push Push Email Push Push Push Push Push
Weather
Police
Gas Station
Accidents
Road Hazard
Key: – Yes; – No; – Partial
Social media has been the recipient of enormous hype. State agencies have quickly added this
tool to their arsenal of traveler information delivery tools (see Figure 18), and anecdotal evidence
shows that the interactive, measurable nature of this technology is yielding benefits (Brown,
2014). However, it is difficult to tell exactly how highly to place social media in the overall
traveler information solution set, as there is little usage data showing how much of the overall
1 This rating reflects user reviews of the applications, as gathered by app stores providing these apps.

33
user base interacts with traveler information in this way. Total costs are also an area for further
research, as initial capital outlay is quite low but operational staffing demands must also be
managed over time (AASHTO, 2014).
Figure 18. Graph. State DOT Social Media Adoption (AASHTO, 2014)
As new solutions become available, the overall traveler information delivery mix must be re-
evaluated. What platforms are best for sharing specific types of data? Which new solutions
should be deployed? Which older ones have run their course? This is a particularly critical
question for older web- and IVR-based solutions. These have often been packaged under the
overall brand of 511, although there is no consistent standard for what is included in a 511
offering, making it difficult to clearly assess them. For the purposes of this report, we note the
following highlights:
Some populations are still relying on IVR systems. Tennessee DOT, for example, reports
that they are tracking 2000 calls/day on average.
Overall, however, the 511 offering should be assessed, as there are some data indicating
low awareness and use of such offerings. In an extensive 2012 survey, 511 ranks
significantly lower than other sources for pre-trip and en route usage. A snapshot of this
assessment is shown in Figure 19 (Robinson, Jacobs, Frankle, Serulle, & Pack, 2012).

34
Anecdotal evidence also suggests that state DOTs are expecting changes away from 511
solutions. For example, as of May 2015, Utah and Tennessee DOTs report that they
expect an eventual phase out of 511 systems.
Figure 19. Graph. Pre-Trip Information Usage
(Robinson, Jacobs, Frankle, Serulle, & Pack, 2012)
Given this general direction and the quickly growing use of alternatives, it appears that 511/IVR
is a technology which is starting to shift into the later phases of its lifecycle. Like all technology
transitions, the exact timing is uncertain and decisions about changes will need to be made on a
case-by-case basis in response to the needs of key traveler populations. This makes it critical to
closely both track performance and determine quantifiable milestones for making any needed
changes (e.g., phasing out 511/IVR in favor of solutions which have become more effective).
A tracking framework might include the items shown in Figure 20:

35
Figure 20. Chart. 511/IVR Tracking Framework (SCG)
This framework will help public agencies conduct a cost/benefit analysis of this technology and
allow its projected lifecycle to be mapped.
3.2.4 International Trends
This section considers highlights of recent trends and activities related to NGTIS occurring
around the world.
3.2.4.1 Global Case Studies
There are a variety of global activities which can serve as valuable sources of lessons learned for
U.S. agencies. The following is a list of selected programs to consider, sorted by key traveler
information topic:
Integration of public and private sector data and functionality. These temporary
public/private partnerships in support of real-time operational events might be adapted to
similar situations in the U.S.:
o Japan Probe Coordination. In response to the 2011 tsunami, Japanese automakers
partnered with the public sector to generate a nationwide database of probe data
from all equipped vehicles in the consumer fleet. This was a temporary
partnership to help with the emergency. There are efforts to build a more
permanent solution, at least in the context of disaster response.
Identify the user segments using 511 phone solutions and understanding their relationship to the overall population
Determine whether they are using 511/IVR exclusively
Determine the actual impact of information from this source on traveler behavior (in addition to tracking usage statistics)
Determine whether known user segments are likely to effectively transition to other solutions if offered
Plot 511/IVR usage and impact trends against similar technologies (e.g., smartphone apps)

36
o In Brazil, public agencies partnered with Waze and Moovit for transportation
management during the World Cup (Olson, 2014). Rio de Janeiro uses Waze data
as part of its traffic management program, and will likely rely on specific
assistance from Waze during the upcoming Olympics (Ungerleider, 2015).
Public sector access to probe data. Private sector companies have established massive
mobile probe data networks, but the public sector has had less access to this information
to date. It is still early in this area, but an important one to track. The following
examples of foreign agencies leveraging private information may have applicability in
the U.S.:
o Cooperative ITS Corridor. Holland, Germany, and Austria are partnering to
establish a connected car corridor which will include some basic probe data
capture based on messages sent out for safety reasons. The exact details of these
systems are still in the works. (Ross, 2014).
o Japan’s ITS Spot system roadside infrastructure which is capable of capturing
vehicle probe data from equipped vehicles has now been broadly deployed.
Implementers are now working to increase the penetration rates for equipped
consumer vehicles.
o Volvo, the Swedish Transport Administration, and the Norwegian Public Roads
Administration are partnering in an experiment to allow cellular-based probe data
sharing via a cloud-based solution. Initial plans are to share road condition data
both among drivers and with road authorities (Crowe, 2015).
o Indonesian toll authorities are implementing probe-based traffic information
collection based on Fujitsu’s SPATIOWL platform. This system includes
software which is put on smartphones to collect vehicle location, time and speed,
and then develops information usable by TMCs (Benzinga, 2014).
3.2.4.2 European Commission Highlights
In December 2012, the European Commission funded a study regarding the provision of
European Union-wide Real Time Traveler Information (RTTI) services. As this study is focused
on very similar topics as this report, a summary is included here to demonstrate the global nature
of the trends which are occurring in this space. Observations and findings for European Union
traveler information services from this report that have implications for the U.S. market include
(van de Ven & Wedlock, July 2014):
Technological advances have changed the traveler information service landscape by
enabling new ways of collecting more road and traffic data through platforms such as
smartphones and personal navigation devices. Big data analytics have been instrumental
to cost-efficient data processing and enrichment of available data.

37
Similar to the progress of connected vehicles in the United States, technology that
connects vehicles to the Internet (Connected Car), to each other, and to roadside
equipment (Cooperative Technology) are expected to lead to a significant increase in
available traveler information data at much lower costs.
As more driving tasks are automated, the need for human-comprehensible traffic
information will decrease, while the demand for machine-readable road and traffic data
will increase. Automated vehicles will in particular require RTTI to provide them with
full forward awareness of potential traffic queues and hazardous traffic situations
downstream, as opposed to only within the range of vehicles’ sensors and cooperative
range.
Roles in the traveler information value chain will likely change in the future. Private
traffic data providers have the technology to process large volumes of new traffic data
and develop profitable business models. Public authorities will, however, retain a key
role in assuring societal interests in the value chain.
Until now, most safety-related traffic information (SRTI) have been collected by public
authorities. It is expected that car manufacturers, their suppliers, and/or service providers
will be a primary collector of SRTI in the near future, for example, through messages
from cooperative vehicles or the CAN-bus.
It is recognized that data privacy and service liability will become key issues for
increasing amounts of data originating from vehicles and communities.


39
CHAPTER 4. ROLES & MODELS REVIEW
Business models for making NGTIS financially viable have changed significantly in recent
years. Business models are the activities associated generating value from the collection and
provision of traveler information. These activities can be described in the context of a “value
chain”, which describes how value is added to a product or service as different actors contribute
to the end product. This chapter takes a structured look at the value chain, from data collection
to data delivery. Public and private sector participants and their current and potential business
models and roles will be discussed for each stage in the chain.
Questions considered include:
What are private sector models and applications for revenue generation? What are the
strengths and weakness and their relevance and appropriateness for public agency use?
What are the roles of state and federal governments in traveler information services in the
next five years? Should public agencies be the content provider? Or should public
agencies become the data provider and let the private sector provide content?
4.1 ROLES AND VALUE CHAINS
Delivery of traveler information service offerings is a complex business. Public and private
sector actors, working both separately and in partnership, bring a variety of agendas and
capabilities to the mix. In order to understand the landscape, it is helpful to consider the entire
chain of participants and the flow of value, from end-to-end (the “value chain”), as shown in
Figure 21.
Figure 21. Chart. Traveler Information Value Chain (SCG)
40
Roles in the value chain include:
Collector. Directly captures the traveler information data and generates data products
and services.
Aggregator. Combines multiple data streams and generates data products and services.
Presenter. Provides the traveler information directly to the consumer. May include
everyone from public agencies providing information on roadside DMS and consumer
device providers, to mobile app providers and automotive original equipment
manufacturers (OEMs) who provide in-vehicle infotainment solutions.
Device Provider. Provides hardware used by the consumer to interact with traveler
information. In some cases, also serves as a Presenter.
IT Services Provider. Provides services such as software development, hosting, and
outsourced operations.
Advertiser/Sponsor. Links its brand with traveler information in some way to gain
business benefit.
Other Data Users. Specific public and private users of traveler information data, e.g.,
real estate industry, urban planners, etc.
4.1.1 Role Trends
As traveler information becomes more pervasive, role boundaries are blurring. The private
sector has discovered the value of creating consumer crowdsourcing communities. Participating
consumers provide much more about themselves and their environment than just traffic data.
Instead, traffic is just one piece of the overall consumer Big Data business, an increasingly
massive operation with global efficiencies of scale. Traffic is useful in this environment because
it is “sticky” – it creates a constant stream of repeat visitors who provide value over time both as
a data source and as an ad audience which can be commercialized.
As a result, there is a growing set of ‘end to end’ providers which handle the entire value chain.
These include data mega-managers like Google/Waze. Rather than confining themselves to data
collection or a particular aspect of data delivery, they have developed fully integrated solutions
complete with cutting-edge end consumer offerings, which have proven very attractive in the
marketplace. This places them directly in parallel with similar state activities.
Another major trend is the increasing complexity of the data sourcing picture. The private sector
has developed a densely interconnected web of data sharing and aggregating agreements, with
more layering on every day. This is partly fueled by the growth of non-infrastructure collection
technology options, which has created new categories of participants and expanded the
capabilities of existing ones. INRIX and TomTom, for example, have made agreements with
auto companies for access to traffic data from their consumer connected car fleets (Marshall,

41
2014). The potential value of these data have already triggered deals from the OEM side as well,
as exemplified by Porsche’s recent investment in INRIX. Providers of all stripes are also eyeing
the potential of data from the entire national vehicle fleet, which may eventually be mandated for
vehicle safety reasons, but can also be used for many other purposes. (Lerman, 2014)
A recent snapshot showing how the data ecosystem around the vehicle has gone well beyond
simple traveler information and is now part of the “connected consumer” Big Data pool is shown
below in Figure 22 (Lawson, 2015). Traffic is a line item in the overall set of information sent to
and received from the car and handled by a wide variety of private sector participants.
Figure 22. Chart. NGTIS / Big Data Landscape Example (Lawson, 2015)

42
4.1.2 Public Sector Roles
Public sector agencies currently serve in almost every role in the value chain. Given the recent
evolution in private sector activities, it is important to assess future public sector roles in NGTIS.
The outcome of this assessment will inevitably vary among agencies, so this report seeks to
provide some key areas for consideration to assist this process.
4.1.2.1 Collector
Federal law as noted in Safe, Accountable, Flexible, Efficient Transportation Equity Act: A
Legacy for Users (SAFETEA-LU) Section 1201 Real-Time System Management Information
Program (RTSMIP) requires public sector agencies to provide certain traveler information. The
larger question is how much of this requirement the public sector fulfills directly (using its own
infrastructure) or indirectly (sourcing the data from other collectors). Numerous public-private
partnerships already show that there can be value in a variety of solutions to this question.
Key factors to consider include:
Pricing. What is the “per unit” cost of information collection? Who can most cost-
efficiently capture each type of data? Determining appropriate metrics and tracking them
over time will help to resolve this question.
Compliance risk. Acceptable risk to regulatory compliance if there are contract or
supply issues with outsourced vendors.
Delivery risk. Acceptable risk to ongoing operations if there are contract or supply
issues with outsourced vendors. This includes stability of potential vendor companies.
Switching costs. Are there multiple sources for a given type of data? What will it take to
switch from one data source to another?
Presenter
It is important to understand the opportunities and limitations at each point in the value chain.
The Presenter has the most access to the consumer and other end users. Those further back in
the chain have much more difficulty establishing a consumer brand, and can be more easily
replaced by similar offerings. They also do not have direct access to consumer interactions and
data.
The public sector has been moving forward along the chain, with the 511 brand and social media
push taking it squarely into the Presenter space. This creates direct conflict with the private
sector entities who want to own that customer interaction. As private sector data providers move
aggressively to capture the traveler’s limited attention, the traveler must choose between their
offerings and those of the public sector.

43
Key questions for the public sector to consider include:
Can agencies achieve their goals without direct customer access? Historically, the public
sector has distributed information through channels such as radio and TV. Is that sort of
dis-intermediated positioning still acceptable?
How much of an audience does the direct public sector offering need to reach? Which
audience segments are most important?
How valuable is direct consumer feedback for data collection and customer satisfaction
monitoring? “Value” should be measured by metrics here.
How will the public sector compete over time with consumer-facing brands like INRIX
and Google for this role?
4.2 BUSINESS MODELS
As the private sector continues to the explore opportunities in the traveler information space,
corporate whiteboards fill with lists of value creation opportunities like the one shown below in
Table 5. Reviewing the marketplace, practically every permutation of these is being tested
somewhere. Companies are selling data for license fees, trading consumer’s functionality for
data, providing data aggregation as a service, etc.
Table 5. Value Creation Opportunities (SCG)
Where’s the value? What’s the deal?
Historical databases
Real-time databases
Predictive databases
Apps (development or white label)
Communications (e.g., radio)
Development, deployment and operations
o Data collection infrastructure
o Data management system
o Data delivery system (Application
Programming Interfaces, Platforms,
User Interfaces, etc.)
Consumer hardware
Consumer software
o Apps (development or white label) –
in-vehicle or mobile
Data licensing
Data swapping (barter/value trade)
Ad revenue (in-app, dedicated/non-
dedicated website, etc.)/sponsorship
Subscription revenue
Bundled hardware fees
App re-selling (white label)
Platform licensing
Hosting/operating
Niche markets (real estate)

44
Shown in Figure 23 in the context of the value chain described in the prior section, these value
creation opportunities vary by role. It is important to recognize that the private sector reviews
both roles and the business models associated with them on a continuous basis, and that every
discussion about a business deal takes place with this thinking as a backdrop.
Figure 23. Chart. Value Chain / Value Opportunity Review (SCG)
4.2.1 Public Sector Business Models
The term “business model” typically refers to an approach which generates revenue. Because
the public sector is different from a for-profit business, and has significant restrictions on any
activities of this type, the role is to create value. In some cases, however, there may be room for
some value creation. Several possible areas include:
Selling or bartering travel data. Limited licensing arrangements, which require fees or
‘in-kind’ barter, may be possible for commercial use of state data. This approach only
works as long as states have data which private sector cannot source less expensively on
its own.
Selling or bartering consumer data. This is a particularly difficult area, as there are major
privacy concerns. However, there may be opt-in scenarios in which consumers allow
sharing of some information under appropriate circumstances.

45
Selling advertisements or sponsorships. Successful ad sales require large volumes of
consumer exposure (e.g., traffic on a web page), or a high value niche customer base.
To date, states have reported very limited success in establishing sufficiently attractive
advertising opportunities (e.g., around 511 websites). This model is very well-
established in the private sector, however, and should not be discarded without
consideration if local regulations permit it.
Selling or bartering access to physical assets. Public sector agencies may have access to
rights of way and/or infrastructure which can be made available to private sector
companies in exchange for data or other related services.
All of these models have major challenges for public sector implementers, and in many cases,
regulatory and commercial realities may dictate that the public agency simply internalize the
entire value equation without the expectation of external revenue or barter value being added to
traditional funding sources. In these cases, business model choices revolve more around the
roles taken by the agency (as discussed previously in the section titled “Public Sector Roles”)
and the opportunity for cost savings due to internal efficiencies and expenditure avoidance.
This last item is particularly interesting in the context of the situation which has evolved in the
private sector telematics space. Automakers initially viewed telematics services as a revenue
generator, but over time recognized that their primary value was in the internal use of the data
captured from vehicles. From a public agency perspective, NGTIS activities may prove to work
in a similar way. For example, the user feedback loop created by social media distribution of
traveler information may produce valuable insights on how best to influence consumer
behaviors, allowing more efficient deployment of resources.
Determining possible business models may be done using a structured process such as the
“business model canvas.” A detailed case study on exploring value creation opportunities in the
public sector using this canvas and related tools may be found in Business Models and Value
Creation: A Case Study of the New York City Economic Development Corporation (Chambers &
Patrocinio, 2011).


47
CHAPTER 5. OPERATIONS REVIEW
This Operations Review will address internal operational issues for public agencies, including
cross-functional data sharing and re-use, build-buy-partner decision-making, and development of
an agency-level technology roadmap. As every state and local agency has a unique set of needs
in this area and the operational environment continues to evolve quickly, a key emphasis of this
chapter is frameworks and best practices that can be applied by specific agencies both to address
today’s challenges and to actively manage operational decisions over time. It is important to
note that these items apply both to existing and new systems: the rapid pace of change requires a
regular reassessment of core business and technical assumptions in every case.
Questions considered include:
What are models of business planning and determining when to phase out current
technology/methods?
What are the issues, processes, and procedures for transitioning to new technology and
phasing out/retiring/replacing older technology and system components?
Some public agencies procure live traffic data from the private sector to supplement
existing data collection capabilities. What are the potentials and possibilities of such
services to replace existing public agencies’ data collection systems (i.e. detectors, loops,
etc.)? What are the risks, gains, and losses for agencies?
How should the sharing of data between states and third parties be handled?
What are the funding outlook, limitations, and opportunities for traveler information
systems for the next five years?
5.1 BUSINESS PLANNING
Public agencies face a variety of important decisions in the NGTIS space. This requires not only
initial strategy formulation, but also continuous strategy maintenance in order to ensure that the
agency effectively evolves along with the overall traveler information space. This section will
review a framework for strategy development and management which can be used to help make
key decisions, such as determining the potential roles of state and federal governments in traveler
information services in the next five years.
5.1.1 Strategy Management
As a basic framework, strategy management can be organized into five key steps shown in
Figure 24:
Set assumptions for overall system goals. This is a critical but often overlooked part of
the strategy process. It is important to determine what the overall system needs to

48
deliver, and how that delivery be measured. The overall goals of the public agency must
be clearly articulated. Determining appropriate Key Performance Indicators which will
be associated with each goal is an important part of this process.
Set assumptions for sub-system contribution to goals. Once top-level goals are set,
it’s time to consider the sub-systems that contribute to those goals. NGTIS is one of
these sub-systems. It is critical to decide how NGTIS will contribute to the overall
agency goals and how this contribution will be measured. Making these decisions may
require significant research into various aspects of the system, from activities at other
agencies to technology trends.
Monitor and regularly assess performance to goals. Quantitatively measuring
performance is the most fundamental activity in ongoing strategy management. It is
crucial to establish and monitor effective systems which provide the right data at the right
time about adherence to goals, performance impacts and trends, etc. These data can also
play a key role in communicating with stakeholders.
Make lifecycle and investment decisions based on results. Armed with quantitative
performance information, business planners can then make good decisions about where to
focus resources. Are travelers trending away from a specific social media platform and is
it time for the agency to follow suit? Are travelers changing their behavior in response to
new functionality or data offered by a public agency app?
Review and re-assess strategy on regular schedule. As external conditions change, it
is important to re-confirm that goals at all levels are still generating the optimal results.
If not, it may be time to change focus in some areas.
Figure 24. Chart. Strategy Framework (SCG)

49
As a simplified example:
An agency might determine that its primary goal is to optimize transportation network
efficiency, and that this goal would be measured by overall throughput of vehicles
through the system per day.
From an NGTIS perspective, this might mean that its goals are to reduce overall vehicle
trips per household. The resulting operational focus might then be on providing the best
possible information about transit, including highly accurate total trip times and
multimodal transfer information. With those decisions in hand, planners could explore
the options for delivering on these goals, which might include assessing current and
potential transit usage among various traveler segments, integrating traffic and transit
data for bus ETA information, providing data feeds to private sector partners for
inclusion in information delivery mechanisms used by traveler segments most likely to
consider using transit, etc.
Once these various programs were implemented, overall transit use, change in transit use,
and impact on private vehicle use, as well as more detailed metrics like adoption of
information delivery mechanisms and use of a specific functionality, might be tracked to
determine overall program performance.
At quarterly and annual reviews of both NGTIS and overall agency strategy, these
metrics could then serve as the basis for decision-making about next steps.
This example is over-simplified, but it shows how the interconnected set of goals and
measurements allows continuous evolution of the system. It also serves as a valuable tool in
communicating decisions and outcomes to both managers and the traveling public.
In addition, the outputs of the strategy management process can provide substantive input to
funding discussions by linking investments and results. This is particularly important in light of
anecdotal evidence showing that NGTIS systems are often included as part of general operating
budgets rather than called out as separate programs.2
5.1.2 Roadmapping
In managing a dynamic system over time, it is easy for the rapid pace of change and the hype
around the latest technology to make good decision-making very difficult. Roadmaps can be a
valuable tool in this environment. They allow each decision to be placed in a consistent context,
and by projecting and aligning trends, can provide helpful insights about when to make changes.
An example of a high-level roadmap framework is shown below in Figure 25. This framework
would be filled in with specific information corresponding to the various milestones identified as
important by a given agency.
2 Information shared by NV, TN, UT, and KS DOTs Spring 2015.

50
Figure 25. Chart. Roadmap Framework Example (SCG)
On the left-hand side, key tracking areas are determined. In this example, regulatory milestones
which will drive specific agency activities (e.g., SAFETEA-LU RTSMIP and MAP-21
Performance Management compliance dates), consumer adoption rates for key technologies such
as smartphones and specific social media, assessment points for specific NGTIS solutions (e.g.,
availability, cost and quality for a new type of data collection solution), and consumer adoption
rates for the agency’s NGTIS offerings are all tracked. For example, SAFETEA-LU requires
collection of certain performance data on metropolitan “Routes of Significance” by November
2016.
Projecting and monitoring these various roadmap elements in visual parallel provides a useful set
of perspectives. For example, it might be the case that cost points for data collection
infrastructure are not going down fast enough to enable an agency to deploy required solutions in
advance of a regulatory milestone, triggering the need to look for alternative data sources and
potentially for the agency to change to a new role in the value chain. Or it might become
obvious that a certain consumer technology is trending, and causing a corresponding drop in
adoption of an existing NGTIS offering and a need to move to a new platform.
5.2 TECHNOLOGY ADOPTION BEST PRACTICES
Managing a dynamic environment with a range of technology lifecycles, including some very
rapidly evolving ones, is a challenging discipline. As described in earlier sections, the collection,
management, and provision of traveler information requires the practitioner to handle
increasingly short technology lifecycles. Rather than measuring the value of deployed
technology over decades, new solutions may now only be relevant for a year at a time. The need

51
to interact with a diverse set of consumer platforms adds to this challenge, as multiple standards
(or no standards) and rapid change are the order of the day.
Decision and deployment timelines are necessarily compressed in this environment. In order to
effectively manage an NGTIS that is responsive to the needs of the consumer and properly
enables all related transportation management activities, it is critically important to focus on a
combination of business and technology processes. As noted above, these include:
Setting business goals for systems and subsystems.
Monitoring metrics designed to support business goal review (performance, cost, etc.).
Building in system adaptability to enable continuous evolution.
Once clear goals have been set, classic systems engineering discipline can combine with
information technology (IT) management to successfully design, deploy and operate systems, as
shown previously in Figure 24 on page 48. On the systems engineering side, FHWA’s Systems
Engineering for Intelligent Transportation Systems is a proven resource. It is designed to
provide an introduction to systems engineering and a “basic understanding of how it can be
applied to planning, designing, and implementing intelligent transportation systems (ITS)
projects.” (National ITS Architecture Team , 2007) Section 4.11 provides specific information
on handling system replacements. A summary is shown below in Table 6.
Table 6. FHWA Systems Engineering Retirement/Replacement
(National ITS Architecture Team , 2007)
OBJECTIVES
Remove the system from operation, gracefully terminating or
transitioning its service.
Dispose of the retired system properly.
INPUT
Sources of
Information
System requirements (retirement/disposal requirements).
Service life of the system and components.
System performance measures and maintenance records.
PROCESS
Key Activities
Plan system retirement.
Deactivate system.
Remove system.
Dispose of system.
OUTPUT
Process Results
System retirement plan.
Archival documentation.
REVIEW
Proceed only if you
have:
Planned the system retirement.
Documented lessons learned.
Disposed of the retired system properly.

52
On the Information Technology (IT) side, there are also resources which may be of assistance.
In particular, the private sector has established formal best practice standards which describe
how to best link technology selection, deployment and management to operational needs. One of
these is the IT Infrastructure Library (ITIL), an international service management standard which
originated in the United Kingdom (Axelos).
ITIL is a large body of work which cannot be effectively detailed in this report. However, one
specific best practice area of specific application to NGTIS (Kempter) should be noted: “The
objective of ITIL Service Transition is to build and deploy IT services. Service Transition also
makes sure that changes to services and Service Management processes are carried out in a
coordinated way.” ITIL Service Transition Processes include:
Transition planning and support.
Change management.
Service asset and configuration management.
Release and deployment management.
Service validation and testing.
Change evaluation.
Knowledge management.

53
5.3 BUILD/BUY DECISION-MAKING
In most areas of the NGTIS, there is a choice to be made between producing solutions within the
agency and outsourcing. From software development to data collection, there are almost always
private sector alternatives which can be considered. These decisions, however, are complicated
and can have significant long term consequences.
When making decisions about data, there are three key variables to review: cost, quality, and
coverage.
Cost can be viewed in a variety of ways, but needs to be addressed consistently across
both internal and external options. For example, a private sector vendor may offer
freeway data at a certain cost per centerline mile. The reviewer must develop an
understanding of the agency’s costs using the exact same metric. This is not always
simple, as hardware and software systems may serve multiple uses, but without it, there is
no real way to compare costs.
Similarly, quality must be consistently defined. This may include percentage accuracy to
ground truth, percent uptime, standard capture to delivery delay, etc.
Finally, a clear understanding of coverage allows true comparison of data sets. For
example, understand how covered links are defined, and the extent of geographic and
road type coverage.
When the outsourced cost is less than performing the work internally, but corresponding quality
and coverage has become greater, it is time to seriously consider this alternative for a given type
of data. If outsourcing becomes the more attractive option for enough types of data, it is then
time to consider whether the agency needs to continue in the data collection business at all.
However, there are other major issues which must also be taken into consideration. The biggest
one is availability risk. If an agency becomes dependent on an external source for a given type
of data, there is always the possibility that the agency will lose access to that source. It is critical
to assess what happens in that situation, which includes developing a very clear understanding of
exactly how the data are used throughout the agency, and the impact of not having it. If there are
other sources for the data, this risk is somewhat mitigated, although switching processes and
costs must also be part of the assessment, as noted in the section titled “Collector” in the
previous chapter.
A modified version of this approach can also be used to assess specific technologies. When cost,
quality, and functionality of a given solution reach a certain point in comparison with another, it
is time to consider switching.
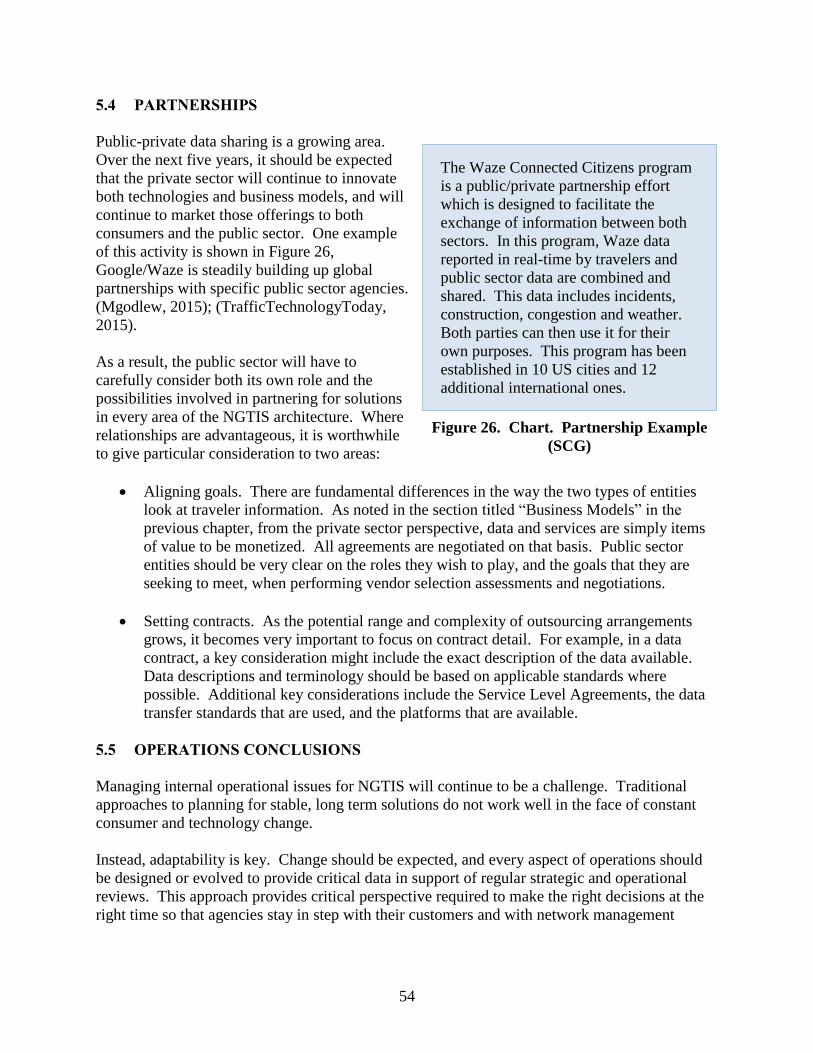
54
5.4 PARTNERSHIPS
Public-private data sharing is a growing area.
Over the next five years, it should be expected
that the private sector will continue to innovate
both technologies and business models, and will
continue to market those offerings to both
consumers and the public sector. One example
of this activity is shown in Figure 26,
Google/Waze is steadily building up global
partnerships with specific public sector agencies.
(Mgodlew, 2015); (TrafficTechnologyToday,
2015).
As a result, the public sector will have to
carefully consider both its own role and the
possibilities involved in partnering for solutions
in every area of the NGTIS architecture. Where
relationships are advantageous, it is worthwhile
to give particular consideration to two areas:
Aligning goals. There are fundamental differences in the way the two types of entities
look at traveler information. As noted in the section titled “Business Models” in the
previous chapter, from the private sector perspective, data and services are simply items
of value to be monetized. All agreements are negotiated on that basis. Public sector
entities should be very clear on the roles they wish to play, and the goals that they are
seeking to meet, when performing vendor selection assessments and negotiations.
Setting contracts. As the potential range and complexity of outsourcing arrangements
grows, it becomes very important to focus on contract detail. For example, in a data
contract, a key consideration might include the exact description of the data available.
Data descriptions and terminology should be based on applicable standards where
possible. Additional key considerations include the Service Level Agreements, the data
transfer standards that are used, and the platforms that are available.
5.5 OPERATIONS CONCLUSIONS
Managing internal operational issues for NGTIS will continue to be a challenge. Traditional
approaches to planning for stable, long term solutions do not work well in the face of constant
consumer and technology change.
Instead, adaptability is key. Change should be expected, and every aspect of operations should
be designed or evolved to provide critical data in support of regular strategic and operational
reviews. This approach provides critical perspective required to make the right decisions at the
right time so that agencies stay in step with their customers and with network management
The Waze Connected Citizens program
is a public/private partnership effort
which is designed to facilitate the
exchange of information between both
sectors. In this program, Waze data
reported in real-time by travelers and
public sector data are combined and
shared. This data includes incidents,
construction, congestion and weather.
Both parties can then use it for their
own purposes. This program has been
established in 10 US cities and 12
additional international ones.
Figure 26. Chart. Partnership Example
(SCG)

55
needs. It also allows public agencies to make good, well-justified decisions quickly, and to
communicate those decisions clearly to the public and to partners.
The sections above provide a high level view of frameworks and best practices which can be of
assistance as agencies optimize their operational approaches to handle the highly dynamic
NGTIS landscape.


57
CHAPTER 6. REFERENCES
AASHTO. (2014). Fifth Annual State DOT Social Media Survey. AASHTO. Retrieved from
http://communications.transportation.org/Documents/2014_AASHTOSocialMediaSurvey
ASCE. (2013). Transit: Conditions and Capacity. Retrieved April 30, 2015, from 2013 Report
Card for America's Infrastructure:
http://www.infrastructurereportcard.org/a/#p/transit/conditions-and-capacity
Axelos. (n.d.). What is ITIL? Retrieved April 30, 2015, from AXELOS:
https://www.axelos.com/Corporate/media/Files/Brochures/ITIL_Product_Brochure_Conf
erence_Version_v1.pdf
Badger, E. (2014, October 14). The many reasons millennials are shunning cars. Retrieved June
15, 2015, from Washington Post:
http://www.washingtonpost.com/blogs/wonkblog/wp/2014/10/14/the-many-reasons-
millennials-are-shunning-cars/
Benzinga. (2014, November 25). Fujitsu Provides its SPATIOWL Traffic Information Service to
Indonesian Toll Road Management Company PT. Marga Utama Nusantara. Retrieved
April 30, 2015, from Benzinga.com:
http://www.benzinga.com/pressreleases/14/11/a5038839/fujitsu-provides-its-spatiowl-
traffic-information-service-to-indonesian
Brown, L. (2014, October 20). Annual Survey Shows States Still Driving Toward Greater Social
Media Usage. Retrieved April 30, 2014, from Talking Transportation:
https://talkingtransportation.wordpress.com/2014/10/20/annual-survey-shows-states-still-
driving-toward-greater-social-media-usage/
Brydia, R. E. (2012). TECHNICAL MEMORANDUM: TASK 11 – TRAVELER INFORMATION
SURVEY. Texas A&M Transportation Institute.
Brydia, R. E. (2015). Next Generation Traveler Information System: A Five Year Outlook -
Literature Review. Washington DC: Battelle.
Chambers, E., & Patrocinio, a. M. (2011). Business Models and Value Creation: A Case Study of
the New York City Economic Development Corporation. Umea, Sweden: UMEA
Universitet.
Commute, D. (n.d.). Apple iTunes. Retrieved December 4, 2014, from Valley Rocket LLC:
https://itunes.apple.com/us/app/daily-commute/id499636507?mt=8

58
Connected World. (2015, March 12). MirrorLink Announced for Samsung and HTC. Retrieved
April 30, 2015, from Connected World: http://connectedworld.com/mirrorlink-
announced-for-samsung-and-htc/
Crowe, P. (2015, February 13). Volvo Expanding Vehicle-to-Vehicle Testing To 1000 Cars.
Retrieved April 30, 2015, from Hybridcars.com: http://www.hybridcars.com/volvo-
expanding-v2v-testing-to-1000-cars/
CTC & Associates LLC. (2011). Improving Highway Advisory Radio Predictability. Caltrans
Division of Research and Innovation.
Daecher, A., & Galizia, a. T. (2015). Tech Trends 2015: The fusion of business and IT. Deloitte
University Press.
Deeter, D. (2009). Real-Time Traveler Information Systems, NCHRP Synthesis 399 .
Washington, D.C: Transportation Research Board.
Dewey, C. (2013, August 19). The 60 million Americans who don’t use the Internet, in six
charts. Retrieved April 30, 2015, from The Washington Post:
http://www.washingtonpost.com/blogs/the-switch/wp/2013/08/19/the-60-million-
americans-who-dont-use-the-internet-in-six-charts/
Dickens, M. (2014, December 10). Transit Ridership Report. Retrieved April 30, 2015, from
APTA: http://www.apta.com/resources/statistics/Pages/ridershipreport.aspx
Dorsey, T. (2015, January 28). AASHTO Completes Series of Reports Tracking Commuter
Trends and Behavior. Retrieved April 30, 2015, from AASHTO Journal:
http://www.aashtojournal.org/Pages/NewsReleaseDetail.aspx?NewsReleaseID=1437
Faouzi, N.-E., Billot, E. R., & Bouzebda, a. S. (2010). Motorway Travel Time Prediction Based
on Toll Data and Weather Effect Integration. IET Intelligent Transport Systems, Vol. 4,
No.4, 338-345.
File, T. (2013). Computer and Internet Use in the United States. Washington, DC: U.S. Census
Bureau. Retrieved from https://www.census.gov/prod/2013pubs/p20-569.pdf
GM. (2014, September 7). Cadillac to Introduce Advanced ‘Intelligent and Connected’ Vehicle
Technologies on Select 2017 Models. Retrieved April 30, 2015, from GM.com:
http://media.gm.com/media/us/en/gm/news.detail.html/content/Pages/news/us/en/2014/Se
p/0907-its-overview.html
Gordon, S., & Trombly, a. J. (2014). Deployment of Intelligent Transportation Systems: A
Summary of the 2013 National Survey Reports. Report FHWA-JPO-12-146. Washington
DC: Oak Ridge National Laboratories.

59
Hamedi, M. (2015). Proceedings of First Outsourced Probe Data Symposium. College Park,
MD: University of Maryland.
Harris, D. (2012, November 18). Why better traffic data means more than just a faster commute .
Retrieved April 30, 2015, from GigaOm: https://gigaom.com/2012/11/18/why-better-
traffic-data-means-more-than-just-a-faster-commute/
Hoelzel, M. (2015, June 29). UPDATE: A breakdown of the demographics for each of the
different social networks. Retrieved July 7, 2015, from Business Insider:
http://www.businessinsider.com/update-a-breakdown-of-the-demographics-for-each-of-
the-different-social-networks-2015-6
INRIX. (2015 , March 1). INRIX Continues Collaboration With Samsung on Mobile Applications
for the Connected Car. Retrieved April 30, 2015, from INRIX.com:
http://www.inrix.com/press/inrix-continues-collaboration-samsung-mobile-applications-
connected-car/
INRIX. (2015, January 5). Audi and INRIX debut online traffic services at CES 2015. Retrieved
April 30, 2015, from INRIX.com: http://www.inrix.com/press/audi-inrix-debut-online-
traffic-services-ces-2015/
Kempter, S. (n.d.). ITIL Service Transition. Retrieved April 30, 2015, from ITIL Process Wiki:
http://wiki.en.it-processmaps.com/index.php/ITIL_Service_Transition
Lawson, P. (2015). The Connected Car: Who Is In the Driver's Seat? Vancouver: BC Freedom
of Information and Privacy Association (FIPA). Retrieved from
https://fipa.bc.ca/wordpress/wp-content/uploads/2015/03/CC_report_lite.pdf
Lerman, R. (2014, September 12). Inrix gets $55M investment from Porsche; IPO next?
Retrieved April 30, 2015, from Bizjournals.com:
http://www.bizjournals.com/seattle/blog/techflash/2014/09/inrix-gets-55m-investment-
from-porsche-ipo-next.html?page=all
MarketingCharts. (2015, March 24). Why Do Millennials Use Facebook and Twitter? Retrieved
April 30, 2015, from Marketing Charts: http://www.marketingcharts.com/online/why-do-
millennials-use-facebook-and-twitter-52812/
Marshall, P. (2014, February 11). How to build a crowdsourced traffic safety network. Retrieved
April 30, 2015, from GCN.com: http://gcn.com/Articles/2014/02/11/crowdsourced-
traffic.aspx
Melanson, D. (2011, April 13). IBM Shows Off Smarter Traveler Traffic Prediction Tool.
Retrieved December 2, 2014, from Engadget: http://www.engadget.com/2011/04/13/ibm-
shows-off-smarter-traveler-traffic-prediction-tool/

60
Mgodlew. (2015, April 7). Connected Citizens Program. Retrieved April 30, 2015, from
Waze.com: https://wiki.waze.com/wiki/Connected_Citizens#Existing_Partners
National ITS Architecture Team . (2007). FHWA-HOP-07-069: System Engineering for
Intelligent Transportation Systems. Washington, DC: Department of Transportation,
Office of Operations.
Olson, P. (2014, July 7). Why Google's Waze Is Trading User Data With Local Governments.
Retrieved April 30, 2015, from Forbes.com:
http://www.forbes.com/sites/parmyolson/2014/07/07/why-google-waze-helps-local-
governments-track-its-users/
Pender, B. G. (2014). Social Media Use during Unplanned Transit Network Disruptions: A
Review of Literature. Transport Reviews: A Transnational Transdisciplinary Journal,
Vol. 34, No. 4, 501-521.
Pew Internet Project. (n.d.). Mobile Technology Fact Sheet. Retrieved April 30, 2015, from Pew
Research Center: http://www.pewinternet.org/fact-sheets/mobile-technology-fact-sheet/
Polzin, S. E. (2013). Commuting in America 2013: The National Report on Commuting Patterns
and Trends. Washington, DC: American Association of State Highway and
Transportation Officials.
Predictive Analytics for Traffic. (n.d.). Retrieved January 20, 2015, from
http://research.microsoft.com/en-us/projects/clearflow/
Protalinski, E. (2014, February 4). Google Maps for Android and iOS now alerts you when a
faster route becomes available. Retrieved April 30, 2015, from TheNextWeb.com:
http://thenextweb.com/google/2014/02/04/google-maps-android-ios-now-alerts-faster-
route-becomes-available/#!u6qRa
Rainie, L., & Fox, S. (2012, May 7). Just-in-time Information through Mobile Connections.
Retrieved April 30, 2015, from Pew Research Center:
http://www.pewinternet.org/2012/05/07/just-in-time-information-through-mobile-
connections/
Robinson, E., Jacobs, T., Frankle, K., Serulle, N., & Pack, M. (2012). NCHRP Web Only
Document 192 - Deployment, Use, and Effect of Real-Time Traveler Information Systems.
Transportation Research Board. Retrieved from
http://onlinepubs.trb.org/onlinepubs/nchrp/nchrp_w192.pdf
Ross, P. E. (2014, December 30). Europe’s Smart Highway Will Shepherd Cars From Rotterdam
to Vienna. Retrieved April 30, 2015, from IEEE Spectrum:

61
http://spectrum.ieee.org/transportation/advanced-cars/europes-smart-highway-will-
shepherd-cars-from-rotterdam-to-vienna
Singer, J., Robinson, A. E., Krueger, J., Atkinson, J. E., & Myers, M. C. (2013). Travel Time on
Arterials and Rural Highways: State-of-the-Practice Synthesis on Arterial Data
Collection Technology. Washington DC: US DOT FHWA.
Smith, C. (2014, November 7). SAME-DAY DELIVERY: E-Commerce Giants Are Battling To
Own The 'Last Mile'. Retrieved April 30, 2015, from Business Insider:
http://www.businessinsider.com/e-commerce-and-same-day-delivery-2014-9
TomTom. (2013, September 4). TomTom Traffic now alerts drivers to slow down when
approaching a traffic jam. Retrieved April 30, 2015, from TomTom Corporate site:
http://corporate.tomtom.com/releasedetail.cfm?ReleaseID=788391
TomTom. (2014). TomTom Annual Report 2014. Retrieved April 30, 2015, from Tomtom.com:
http://annualreport2014.tomtom.com/overview
TrafficTechnologyToday. (2015, March 25). ODOT partners with Waze. Retrieved April 30,
2015, from TrafficTechnologyToday.com:
http://www.traffictechnologytoday.com/news.php?NewsID=67505
U.S. PIRG Education Fund. (2014). Millennials in Motion: Changing Travel Habits of Young
Americans and the Implications for Public Policy. U.S. PIRG Education Fund. Retrieved
from
http://uspirg.org/sites/pirg/files/reports/Millennials%20in%20Motion%20USPIRG.pdf
Ungerleider, N. (2015, April 15). Why Waze is Driving Into City Hall. Retrieved April 30, 2015,
from Fast Company: http://www.fastcompany.com/3045080/waze-is-driving-into-city-
hall
US DOT. (2013). 2013 Status of the Nation's Highways, Bridges, and Transit: Conditions &
Performance. Washington, DC: US DOT. Retrieved from
https://www.fhwa.dot.gov/policy/2013cpr/pdfs/cp2013.pdf
US DOT. (2015). Beyond Traffic 2045: Trends and Choices - DRAFT. Washington DC: US
DOT. Retrieved from http://www.dot.gov/BeyondTraffic
van de Ven, T., & Wedlock, M. (July 2014). ITS Action Plan. Action B – EU-Wide Real-Time
Traffic Information Services. Final Report TREN/G4/FV-2008/475/01. Brussels,
Belgium: European Commission Directorate-General Mobility and Transport.
U.S. Department of Transportation
Federal Highway Administration
Office of Operations (HOP)
1200 New Jersey Avenue, SE
Washington, DC 20590
FHWA-HOP-15-029
August 2015