
NEXT GENERATION - Maynilad Water Services · sa tubig ang aming serbisyo.” ... we are still 12...
104
NEXT GENERATION MAYNILAD SUSTAINABILITY REPORT 2016
Transcript of NEXT GENERATION - Maynilad Water Services · sa tubig ang aming serbisyo.” ... we are still 12...

NEXT GENERATIONmaynilad sustainability report 2016

3
About the Theme and Cover Vision and MissionOur Sustainability Highlights Messages from the Chairman and PresidentAbout this Report
W H AT M AT T E R S T O U S
Caring for Water Source Our Purpose: Enhancing Access, Reliability, and Service Ensuring High Levels of Wastewater Management
H O W W E C R E AT E V A L U E
W H O W E A R E
Minimizing our Ecological Footprint Cultivating Engaged Employees Embracing More Communities Strengthening Effective Governance
W H AT E N A B L E S U S T O C R E AT E V A L U E9 4
1 0 41 2 61 4 8
3 85 68 0
Annexes GRI Content Index External Assurance Statement Acknowledgements
1 7 41 9 42 0 22 0 4
Our Materiality Process Stakeholder Engagement and Management
2 83 2
678
1 0
1 9
Maynilad Sustainability Report 2016
20
36
92
26
CONTENTS
M O V I N G F O R W A R D162

operational efficiency
business growth
organization and people development

7 6
ABOUT THE THEME AND COVER
The Sustainability Report looks at
Maynilad through the different themes that
piece together the whole picture of the
company’s inclusive business approach.
The globe-themed cover alludes to
the company’s NextGen program with
the pillars of organizational and people
development, operational efficiency,
and business growth. Interspersed with
waves, this image sends the message
that Maynilad is embedding this business
strategy in all its operations.
The title of similar name, Next Generation,
is also fitting for the content of the
The Global Reporting Initiative (GRI)
Standards is our primary guide in preparing
this report. GRI™ is an independent
international organization that has
pioneered corporate sustainability reporting
since 1997. In using GRI, we have been
ABOUT GRI
report, which captures the first year of the
program’s implementation in providing
meaningful water solutions. This sets the
stage for the succeeding years, showing
that Maynilad stays true to its tagline, “higit
sa tubig ang aming serbisyo.”
guided in reporting on what matters to
our organization and our impacts to the
environment and society.
For more information, visit
www.globalreporting.org.
We are the leading water solutions
company in the Philippines
with a strong presence across Asia.
VISION
MISSIONWe provide safe, affordable,
and sustainable water solutions
that enable those we serve to lead
healthier, more comfortable lives.

9 8
OUR SUSTAINABILITYREPORT

11 10
The year 2016 will live down Maynilad’s history as a banner year of change and
renewal. This is fully embodied by our Next Generation 2016-2018 program,
which despite being less than a year old has already set the stage for our long-
term strategies beyond 2018.
Exemplifying change at top management is our new president, Ramoncito
Fernandez. With his business acumen, fresh perspective, and inclusive brand of
leadership, I am confident that our various departments will further strengthen
collaborative ties to hit our service-obligation targets.
Already, we are seeing remarkable results.
Our customer satisfaction score is up
to 3.36 out of a possible 4, which
means we have now “exceeded
standards.” Our ultimate goal,
however, is to provide world-class
service and a nonstop supply of
potable water at higher pressures to
all our customers.
Toward this goal, we now align our
focus on three categorical areas:
operational efficiency, business
growth, and organization and people
development.
MESSAGE FROM THE CHAIRMAN
Dear Stakeholders,
Our customer satisfaction score is
up to 3.36 out of a possible 4, which
means we have now “exceeded
standards.” Our ultimate goal,
however, is to provide world-class
service and a nonstop supply of
potable water at higher pressures
to all our customers.
“
102-14

13 12
B U S I N E S S G R O W T H
We are keen to extend our market reach
beyond the West Zone into other local and
international markets. Our expansion drive
now involves various areas in Bulacan, Cavite,
Laguna, and Bicol. Through our sister company,
Metro Pacific Water Investments Corporation,
we are likewise entering new markets such as
commercial buildings, factories, subdivisions,
high-rise buildings, industrial parks, and other
water districts outside the West Zone.
Our initial foray into expanding our
geographical reach has already resulted in
pioneering ventures in countries like Indonesia,
O P E R A T I O N A L E F F I C I E N C Y
Our focus on operational efficiency must
translate to better results in water delivery,
sewerage and sanitation, and customer service.
This year, we delivered safe and affordable
water to more than 9.33 million people in the
West Zone—a coverage of 94.3 percent. This
equals to a billed volume of 498.60 million
cubic meters, surpassing our target of 494.82
million cubic meters. These are testaments
to our conscientious efforts to preserve our
watershed and prepare for the effects of climate
change. They are also a result of our work to cut
down Non-Revenue Water, which is now at 30
percent.
But even with these accomplishments, a fraction
of our customer base still does not receive
water pressure of at least 16 psi or full 24-hour
water service. We thus designed a plan that
will double our capital expenditure (CAPEX)
spending to P14 billion for the next three years,
while also doubling the amount of infrastructure
projects that we implement per year.
In terms of sewerage, we increased our
coverage to 1.4 million customers. However,
we are still 12 percentage points short of
our 27 percent target due to external factors
that delayed our project progress, such as lot
acquisition and right-of-way issues. In direct
response to these setbacks, we are working
double time to fast track the completion
of sewerage systems in Pasay, Parañaque,
Muntinlupa, and Valenzuela.
In terms of customer service, we are establishing
a Key Accounts Relations Department to
provide strategic guidance that will foster
trust and better relations with our clients. We
also launched our Higit sa Tubig: Isip, Puso, at
Gawa (Beyond Water: Mind, Heart, and Action)
program to transform the entire Maynilad
culture into one that puts customer satisfaction
at the top of our priorities.
O R G A N I Z A T I O N A N D P E O P L E D E V E L O P M E N T
Maynilad’s Next Generation program will never
succeed without the right people and teams
to drive it forward. We thus reorganized some
job functions and offices to sharpen our focus,
align functions with expertise, and create
fresh synergies within and among our various
departments and business units.
In support of our people development
initiatives, we are adopting a competency-
based human resource management system to
design more relevant and responsive learning
and growth programs for our employees.
This year, we have also increased our IMS
certificates to 209, proving our dedication
to integrating top standards in sustainability
and organizational excellence into our daily
operations.
where we signed a joined venture agreement
with PT Moya Indonesia. This partnership is set
to extend our services overseas through pipe
network design, installation, and non-revenue
water and wastewater management.
With our outstanding managers and employees
at the helm, I am confident that we will exceed
past gains and fully transform into a total water
solutions company that is able to seize more
market opportunities here and overseas.
O U R W A Y F O R W A R D
As we move closer to becoming a world-
class total water solutions company, I wish to
thank all our employees and partners for your
collaborative spirit, fresh ideas, and invaluable
work day in and day out.
We still have quite a way to go toward fully
resolving much of the service obligation issues
that still hamper our long-term growth. Despite
all these challenges, I am certain that our
advances in operational efficiency and human
resource development will very soon run parallel
with our business expansion targets.
MANUEL V. PANGILINANCHAIRMAN

15 14
MESSAGE FROM OUR PRESIDENT
Dear Stakeholders,
As we continue to work for a stronger customer value proposition, I am heartened
to report that Maynilad’s various departments have hit the ground running toward
our Next Gen targets. Against a challenging operating environment, we pushed
forward in shifting our focus from billed volume to the longer-term metrics of
operational efficiency and organizational development.
Our teams also worked with one mind to deliver our customer obligations in a
timely manner. This strong sense of teamwork has enabled us to respond quickly
to complaints and resolve diverse issues ranging from water availability and billing
disputes to quicker processing of applications and faster installation times.
To further improve the delivery of service to our customers, we allocated about
P17.1 billion as CAPEX. More than half of this amount, or around P12.9 billion,
went to strengthening the infrastructure and operations of our water delivery
services for more people in the 17 cities and municipalities that we cover in the
West Zone.
Well aware of the negative effects of over-extracting groundwater, this budget
covered the expansion of our water services. In Cavite, for example, we were able
to connect more customers after taking over the water systems of 33 subdivisions
in Bacoor and Imus in 2015. This expansion added a total of 5,985 household
connections to Maynilad’s water distribution network. As a result, about 26,987
people who used to rely on deep or shallow wells now enjoy potable, piped-in
water supply 24 hours a day, at a strong pressure ranging from 7 to 16 psi. With
this, we are up to 1,312,223 customers in 2016. This enabled us to garner a total
billed volume of 498.6 million cubic meters.
102-7

17 16
We then allotted some P3 billion for Maynilad’s
Non-Revenue Water (NRW) reduction program,
a cornerstone of our corporate strategy. In
this area, we stepped up our efforts to resolve
challenges involving meter management, leak
repairs, pipe replacements, and District Metered
Area (DMA) management. Our DMA NRW has
been consistently decreasing with each reporting
cycle. For this reporting year, we have reduced our
average water loss to 30 percent compared to last
year’s 31 percent. This is equivalent to 9 million
liters recovered per day. We understand the
severity of NRW and its adverse impacts both on
the planet and to our company’s bottom line. As
such, we vow to continually improve our services
to reduce our NRW and achieve more notable
results in the next years.
Meanwhile, around P1.1 billion went to
wastewater management projects, which
include the construction of much-needed Water
Reclamation Facilities (WRF) in Central Manila
and Cavite, widening of conveyance systems
for these new WRFs, and the development
of sewerage systems in Quezon City and
Valenzuela. The remaining amount in our
wastewater budget went to automation of
facilities, lot acquisitions, maintenance, and
sanitation programs. For the wastewater that
we treat, we ensure that these are within
government standards before discharge. We
managed to treat 58 million cubic meters
of wastewater and remove 3.1 million kg of
oxygen-demanding pollutants this year.
In terms of energy efficiency and conservation,
we continue to note increasing energy use,
which is expected given our very active
expansion and rehabilitation drives. Despite
this surge in power use, we achieved an
energy intensity value of 133.52 kWh/million
liters produced, a decrease from our 2015
value of 137.39 kWh/million liters — a clear
indicator of our prudent and efficient use of
this precious resource. Our GHG emissions,
meanwhile, have reached 69,973.93 tonnes
of CO2e, a decrease by 0.19 percent vs. 2015
emissions. We worked doubly hard to offset
these numbers, particularly through embedding
the Greenhouse Gas Quantification, Reporting,
Validation, Verification standards into our
operations. All these figures demonstrate how
we have been able to make huge strides toward
lowering our impacts and thus move closer to
becoming a truly sustainable water company.
We also continue to give back to the
community through our core business strategy,
as well as the many inventive CSR programs
that we have locked in. Our core business alone
has been able to generate 24,288 jobs in 2016.
Complementing this figure are our livelihood
programs Sining Ipo and Habing Buhay. In
addition, we have other social programs
in place that work for heightened disaster
response and risk reduction systems, improve
our forest covers through tree and mangrove
planting drives, among other strategic social
concerns aligned with our business goals.
Our overall efforts garnered us various awards in
the 8th Annual Global CSR Summit and Awards,
the ASEAN Corporate Sustainability Summit,
the Asia Sustainability Reporting Awards,
and the 2016 Asia Corporate Excellence
& Sustainability Awards. But beyond these
accolades, I wish to remind our employees and
partners that the best reward in our work is our
ability to elevate the living conditions of entire
communities by upholding their right to water
and sanitation.
The investments that we continue to pour into
public infrastructure. Our inclusive business
approach. The increasing number of jobs that
we create to enable more Filipinos to achieve
gainful employment and ultimately lead happier
and healthier lives. All these form the very heart
and center of what drives us to work harder
each day. Toward these ends, rest assured that
we will continue to innovate and find creative
solutions for a stronger company and a truly
sustainable future for more Filipinos.
RAMONCITO S. FERNANDEZPRESIDENT AND CEO
We had a change in leadership on January
1, 2016 with the appointment of Ramoncito
S. Fernandez (RSF) as President and CEO.
Our past president, Victorico P. Vargas,
now serves as Assistant Director of First
Pacific Company and Head of Business
Transformation of the PLDT Group.
Before his appointment to Maynilad, RSF
was the President and CEO of Metro
Pacific Tollways Corp. (MPTC), Tollways
Management Corp. (TMC) and MPCALA
Holdings, Inc. Under his leadership, profits
increased threefold and expansion efforts
grew in the tollways group, along with
championed programs in customer service
satisfaction and innovation.
RSF has extensive experience in international
carrier business, administration, materials
management, industrial marketing, and sales.
Aside from the tollways group, he previously
headed several business groups with the
Philippine Long Distance Telephone Co.
(PLDT), and Pacific Investments Corp., MPTC,
TMC, Manila North Tollways Corp., Cavitex
Infrastructure Corp., MPCALA Holdings, Inc.,
Easytrip Services Corp., and some of PLDT’s
subsidiaries.

19 18
We align our narrative
to the 17 UN Sustainable
Development Goals which
were adopted by 193 countries
last September 2015.
P R I M A R Y C O N TA C T
Atty Roel S. Espiritu, SAVPCorporate Quality, Environment, Safety, & Health
[email protected] (+632) 981-3481
S E C O N D A R Y C O N TA C T
Engr. Enrique G. de Guzman, AVPIntegrated Management System (IMS)
[email protected] (+632) 981-3436
Maynilad reaffirms its commitment to
sustainable development with the publication
of our fifth Sustainability Report, Next
Generation.
This covers our economic, environmental,
and social performance over the period of
January 1 to December 31, 2016. Similar to
last year’s report, Beneath the Surface which
was published in February 2017, Maynilad
is aligning our narrative to the 17 United
Nations Sustainable Development Goals
(SDGs), which were adopted by 193 countries
in September 2015. The SDGs are aimed at
ending poverty, protecting the planet, and
ensuring prosperity for all.
This report has been prepared in accordance
with the GRI Standards: Core option. It has
successfully completed the GRI Materiality
Disclosures service, which verifies that the
General Standard Disclosures 102-40 to 102-
49 were correctly located in both the GRI
Content Index (see pages 194-201) and in the
text of this report.
The external assurance statement is found in
pages 202-203. Our Sustainability Reports
from 2012 to date have all been externally
assured.
ABOUT THIS REPORT
Last year, we highlighted our 2015
performance to transition to the GRI
Standards and through this new report, we
are continuing our promise to report annually.
Maynilad is also publishing a separate 2016
Annual Report to highlight the company’s
financial disclosures.
As we continuously strive to improve
reporting to our stakeholders, we welcome
any feedback or inquiry to help us improve
our reporting. These may be coursed to the
following contact details for prompt action.
102-50, 102-51, 102-52, 102-53, 102-54, 102-55, 102-56

21 20
WHO WE ARE
Metro Pacific Investments
DMCI Holdings Incorporated
Marubeni Corporation
Others
52.8%
Maynilad Water Services, Inc., or
Maynilad, is the largest private water and
wastewater services provider in the country,
headquartered at the Metropolitan Water and
Sewerage Services (MWSS) Compound in
Balara, Quezon City in the Philippines.
We are under the management of DMCI-
MPIC Company, Inc., a joint venture between
DMCI Holdings, Inc. and Metro Pacific
Investments Corporation (MPIC).
In 2013, Japanese trading conglomerate
Marubeni Corporation bought 20 percent
of total shares in the company. Other
subsidiaries under these shareholders such
as PhilHydro and Metro Pacific Water are not
part of Maynilad’s sustainability initiatives, and
are hence not included in this report.
Maynilad is a concessionaire of the MWSS
for the National Capital Region’s West Zone,
serving about 9.33 million people comprising
a 94.3 percent service area coverage. We
cover certain areas in the capital City of
Manila, as well as in Makati and Quezon
Cities. Maynilad likewise serves the entire
cities of Caloocan, Las Piñas, Malabon,
Muntinlupa, Navotas, Parañaque, Pasay,
and Valenzuela. We are also responsible for
some parts of the nearby province of Cavite,
particularly the cities of Bacoor and Imus, as
well as the towns of Kawit, Noveleta, and
Rosario.
We serve the West Zone through 12 Business
Areas (BA) offices, which are clustered into
four Business Districts, namely North, Central
A, Central B, and South. We have 3 water
treatment plants, 14 deep wells, 30 reservoirs,
30 pump stations, 17 WRFs, 2 sewage and
septage treatment plants, and one
septage treatment plant to drive our
operations.
Continuous expansion of pipe networks within
our concession area has brought Maynilad’s
service area coverage to 94.3 percent, with a
total water pipe network of 7,637 kilometers.
25.2% 2%20%
OUR VALUES
C U S T O M E R S E R V I C E
H O N E S T Y A N D I N T E G R I T Y
E N T R E P R E N E U R S H I P
We view excellence as a means and not an
end. To maintain our operational efficiency
and industry leadership, we push our
people to excel by being diligent and
innovative in their work.
T E A M W O R K
L O V E F O R C O U N T R Y
We consider our customers as our growth
partners. Providing them with affordable,
high-quality water solutions precedes
generating business value for our company
and shareholders.
We deal with our stakeholders with honesty
and integrity. We will always do what is
right and fair for the sake of our customers,
shareholders, and the environment.
We encourage creative thinking and
deliberate execution. We expect our
people to manage our company’s resources
with a strong sense of initiative, ownership,
and accountability in order to balance the
needs of our customers with those of our
other stakeholders.
We actively partner with the public sector
so that we can provide even more Filipinos
with water solutions that will spur national
development and secure the environment.
We value our people and consider their
success as our own. This is why we provide
them with the support, responsibilities,
and opportunities that will allow them to
develop individually and with the company.
102-1, 102-2, 102-3, 102-4, 102-5, 102-6, 102-7 102-16
C O M M I T M E N T T O E X C E L L E N C E

23 22
M AY N I L A D 2 0 1 3 - 2 0 1 4 S U S TA I N A B I L I T Y R E P O R T
Asia Sustainability Reporting Awards 2016 Winner, Asia’s Best Stakeholder Reporting Winner, Asia’s Best Environmental Reporting Philippine Quill Awards 2016 Award of Excellence, Publications Category 51st Anvil Awards 2016 Gold Anvil Award, Public Relations Tools: Publications 2016 Asia Corporate Excellence & Sustainability Awards Top Green Companies in Asia
M AY N I L A D 2 0 1 3 A N N U A L R E P O R T
8th Annual Global CSR Summit and Awards 2016 Platinum Award, Best Environmental Excellence Award ASEAN Corporate Sustainability Summit & Awards Winner, Resource Efficiency Category Don Emilio Abello Energy Efficiency Awards 2016 Two Outstanding Awards (PAGCOR PS, LMTP 2) Two Outstanding Energy Manager Awards (Michael Buligan – Water Network and John Jerald De Jesus – Water Production) Certificate of Recognition for Maynilad’s ISO 50001 Certification
E N E R G Y M A N A G E M E N T S Y S T E M
51st Anvil Awards Gold Anvil Award
AWARDS AND RECOGNITION
1st ASEAN Red Ribbon Outstanding Workplace Award 10th DOLE GKK Regional Institution Category NCR Champions (LMTP 2, Central Depot, FCOM BA) Individual Category NCR Champion (Conrado Soriano)
O C C U PAT I O N A L S A F E T Y A N D H E A LT H

25 24
Certificate of Achievement
PA R T N E R S H I P T O C L E A N , R E H A B I L I TAT E , A N D C O N S E R V E T H E M A N I L A B AY
O U T S TA N D I N G D E V E L O P M E N T P R O J E C T F O R TA L AYA N S E W A G E T R E AT M E N T
ADFIAP Awards 2016 LANDBANK Adjudged Winner
T H I N K M AY N I L A D I N N O F E S T
51 st Anvil Awards Gold Anvil Award
M AY N I L A D S I M P L E N G G I N H A W A
51 st Anvil Awards Gold Anvil Award
“ G R A B E A N G M AY N I L A D ” A U D I O - V I S U A L P R E S E N TAT I O N
51 st Anvil Awards Gold Anvil Award
M AY N I L A D 8 K E Y S T E P S T O S E R V I C E E X C E L L E N C E
41 st Annual PSTD Conference Gawad Maestro
10th DOLE GKK National Institution Category Gold Award (LMTP 2) Institution Category Silver Award (Central Depot, FCOM BA) Individual Category Gold Award (Conrado Soriano)
49th National Industrial Safety Convention 2016 SOPI Award of Excellence for Achieving 20,753,356 MHNTLA

WHAT MATTERS TO US

29 28
Maynilad promises to go beyond water
provision and transform into a total water
solutions company that puts a premium on
customer engagement.
The key material aspects of our operations
were derived from our Five-Point Strategy
for Growth, Maynilad’s Mission and Vision
statement, and our Quality, Environment,
Safety, and Health (QESH) Management
OUR MATERIALITY PROCESS
Framework. Moving forward with our
NextGen program, we will continue to
imbibe the same important topics in our
strategies and day-to-day operations.
In our previous sustainability reports,
lowering our ecological footprint was
treated as an implicit must-have within our
other focus areas. In 2016, however, we’ve
raised it as our main focus area.
This is especially important as Maynilad
endeavors to meet the United Nations
SDGs – which include environment-
related Goals 6, 13, 14, and 15 – and our
commitment to international standards
on environmental management, energy
management, and greenhouse gas
reporting, managing our environmental
impact has been brought at the forefront.
102-46 102-46

31 30
STEPS AND GOVERNING PRINCIPLES
OUR PROCESS
We looked at several frameworks that anchor our
business operations to our mandate, including
our Vision and Mission, the QESH Management
Framework, and the GRI Standards. We also
noted the environmental and social contexts in
the localities that we serve.
I D E N T I F I C AT I O N
Sustainability ContextStakeholder Inclusiveness
P R I O R I T I Z AT I O N
MaterialityStakeholder Inclusiveness
We chose our key focus areas based on the
KPIs of the different departments seen through
a shared value perspective, the stakeholder
concerns that arise from the delivery of our
services, and the enablers that could facilitate the
delivery of our value proposition. Together, these
comprise the material aspects for our company.
V A L I D AT I O N
CompletenessStakeholder Inclusiveness
We brought the material aspects to Maynilad’s
management to evaluate the relevance of the
topics to the company’s operations. This is also
to ensure that no important focus area is missed.
R E V I E W
Sustainability ContextStakeholder Inclusiveness
With the increasing recognition of business
contributions to the UN SDGs, we further
aligned our materiality framework to have a
clear understanding of our role in meeting these
universal goals, especially SDG 6 on Clean Water
and Sanitation.
S K I L L E D & E N G A G E DW O R K F O R C E
M O R E W AT E R C O N N E C T I O N S & S E W A G E S E R V I C E S
S E C U R E D W AT E R B O D I E S F O R S O U R C I N G & R E C E I V I N G
- Employee wellness and safety programs- Training and capacity building
- Financial capital infusion- Economic contribution- Efficient operating systems - Regulatory and legal compliance
- Risk assessment and management - Strategic partnership- Restoration of water-related ecosystem
S O C I A L I N C L U S I O N
L O W E R N R W L O W E N V I R O N M E N TA L F O O T P R I N T
- Special privilege programs- Customer programs
- Efficient operating systems- Innovative technologies
- Energy and resource conservation- Pollution reduction
OUR MATERIALITY FRAMEWORK
SUSTAINABLEWATERSOLUTIONsafe affordable dependable
102-46102-47

33 32
ENGAGING OUR STAKEHOLDERS
STAKEHOLDER AND REASON FOR ENGAGEMENT
STAKEHOLDER CONCERNS
Our stakeholders are the cornerstones of Maynilad’s continued sustainability. As we strive to grow
further, we aim to nurture our relationships with our stakeholders and pursue more innovative
mechanisms to ensure our business’ responsiveness and inclusiveness.
MODE AND FREQUENCY OF ENGAGEMENT AND OUR RESPONSE
Career development
Safe work environment
Open communication
Regular trainings
Employee benefits
Employee relationship
E M P L O Y E E S
ensure that our operations, as well as our
relationship with stakeholders, are all running
smoothly.
We are constantly in touch with our employees through regular general meetings and assemblies,
and the Maynilad Employee News. Supervisors and rank-and-file employees alike are empowered
through a Collective Bargaining Agreement. Trainings geared towards capacity building and career
development are also regularly conducted.
102-40, 102-42, 102-43, 102-44
102-40, 102-42, 102-43, 102-44
Regulatory disclosures
Building parterships
Policy alignment with areas of
national interest such as green
initiatives and biodiversity protection
G O V E R N M E N T
regulates Maynilad, which is a concessionaire of
MWSS, a government agency. We make sure to
abide by its laws and policies. We also frequently
work with numerous local government units and
involve them in our programs and projects.
We strive to comply with government requirements and regulations and regularly communicate
policy and other relevant matters to concerned government authorities. As part of the Next Gen
program, we plan to create a Government Relations Department to expedite this.
Our shareholders communicate their vision and align it with the company’s mandate through
monthly board meetings and management reports. Outcomes from these engagements translate
to an operation that is focused on innovation. They are a strategic pillar to grow the business
outside the West Zone concession area.
Value creation
Dividends
Corporate governance
Continued earnings growth
S H A R E H O L D E R S
drive Maynilad’s operation to business growth and
value creation. Major shareholders are represented
in the Board of Directors, which is Maynilad’s
highest governing body.
We engage our labor union groups through negotiations to renew their respective CBAs, which
cover economic provisions such as salary adjustment and mechanisms such as Labor Management
Councils and Grievance Committees. Maynilad also consults with the labor unions whenever there
are complaints concerning salaries or other company rules and their members are involved.
Labor relations
Salaries and wages
Employee welfare
Human rights
T R A D E U N I O N S
are composed of the two labor union groups
in Maynilad, one representing our rank and
file employees and the other representing our
supervisory employees.

35 34
STAKEHOLDER AND REASON FOR ENGAGEMENT
STAKEHOLDER CONCERNS
C I V I L S O C I E T Y O R G A N I Z AT I O N S
serves as our partners in promoting developmental
and environmental advocacies.
Building partnership
Community development
Governance
Environmental protection and preservation
Water cost and water “rights”
MODE AND FREQUENCY OF ENGAGEMENT AND OUR RESPONSE
I N D U S T R Y PA R T N E R S
share their knowledge on best industry practices
and help us become more efficient and effective
in attaining our operational goals.
Continuing support and long-term
partnership and membership
As a member of various industry groups that share our beliefs and commitments, we regularly
participate in conferences, workshops, and other similar events that nurture relationships with
our peers in the business.
We maintain close ties with various local and international NGOs that share our developmental
causes. We organize dialogues, prepare presentations, and should an issue need to be brought to
court, we promptly respond through legal means.
102-40, 102-42, 102-43, 102-44102-40, 102-42, 102-43, 102-44
Transparency
Long term partnership
Ethical behavior
Clear procurement policies
S E R V I C E P R O V I D E R S / S U P P L I E R S
are our partners in implementing various
programs and services while ensuring that our
quality, environment, safety, and health policies
are adhered to.
We engage our service providers through our procurement management system which
follows ethical policies and guidelines.
C U S T O M E R S A N D L O C A L C O M M U N I T I E S
are our top priority. We ensure that they are
provided with safe, affordable, and sustainable
water and wastewater services.
Customized plans
Faster resolution of complaints
Loyalty/rewards program
Better payment system
Maynilad hotline
Care and support for community
Life improving programs
Support for good governance
through ICT
We conduct the Customer Satisfaction Survey (CSAT), disseminate information through the
TextTubig Infoboard, and strive to address customer concerns or complaints as quickly as possible
or within the time allotted by our service obligation. We constantly monitor our systems to mitigate
service interruptions, all throughout the year. Low-income households are also given special
rates or arrangements to settle their arrears. Before every new project, we also conduct public
consultations to solicit community concerns and comply with regulatory requirements.
We engage our communities through various programs and projects, notably our Special Privilege
Programs within the West Zone.

HOW WE CREATE VALUE

39 38
Over the last century, the global
consumption of fresh water has alarmingly
grown faster than the world’s population.
Here in the Philippines, there is growing
concern for our limited fresh water
resources amid a ballooning population,
rapid economic growth, and the growing
amount of pollution.
CARINGFOR WATER SOURCES
Despite these challenges, our ability
to ensure that our water resources are
managed in the best possible way is vital
to Maynilad’s business. We thus support
all measures that protect and nourish
our water resources, and work closely
with the National Water Resources Board
(NWRB), the Metropolitan Waterworks and
Sewerage Services (MWSS), and other key
agencies. Together, we uphold policies and
frameworks that foster bigger investments
in water infrastructure. At the same time,
we actively protect our available water
sources and address water scarcity in some
of our poorest communities and areas that
still lack access to sustainable water lines.

41 40
W AT E R W I T H D R A W A L A N D P R O D U C T I O N
Water withdrawal and production rates
at Maynilad are dependent on customer
demand and water delivery, in turn, is in
response to such demand. To further enhance
the efficiency of our water withdrawal and
production processes, we are constructing
more treatment plants and expanding or
refurbishing existing infrastructure. These
include the 100 million liters per day (MLD)
Expansion at Putatan Water Treatment
Plant, Umiray Angat Transbasin Project
Rehabilitation Phase 2, Design and Build
Contract for La Mesa Treatment Plant 1
Process Improvement Works, Putatan Water
Treatment Plant Development Plan-Phase 2,
and the La Mesa Development Plan-Phase 2.
Raw water coming from Angat Dam that is
meant for domestic use is transmitted to
Metro Manila through Ipo Dam, a diversion
dam, 7 kilometers downstream of Angat, in
Norzagaray, Bulacan. The Ipo Watershed,
meanwhile, straddles three municipalities:
Norzagaray and San Jose Del Monte in
Bulacan, and Montalban in Rizal. Runoff
within the watershed is conveyed through its
main tributary rivers namely, Sapang Anginan,
Sapang Binenet, Sapang Ipo, and Sapang
Paco.
To protect these natural reservoirs, Maynilad
maintains strong collaborative linkages in
managing the Angat Reservoir multi-purpose
water source.
We are also looking for new water sources
to improve our supplies. These tasks are
handled by the Water Source Department
under our Water Supply Operations Division.
This department is responsible for carrying
out thorough planning and feasibility studies
toward protecting our current streams
and discovering new water sources. The
department is made up of two sections: the
Water Source Development section and the
Hydrology and Operations section.
The Water Source Development section is
currently conducting seven feasibility studies.
These include the Putatan Water Treatment
Plant (PWTP) Intake Extension, focusing on
the extension of the PWTP intake from the
offshore of the western lobe of Laguna Lake;
the Kaliwa Dam and Reservoir Water Supply
Project, which seeks to explore the potential
of Kaliwa as an additional water source; and
the Manila Bay Desalination Plant, which
focuses on Manila Bay as a new water source
by desalination. Aside from these projects,
the section is studying 18 other water bodies
in Regions II, III, and IV-A as possible new
water sources.
The Hydrology and the Operations section,
on the other hand, conducts complementary
researches on new water sources and
constantly studies and monitors the status of
existing water sources, such as the Laguna
Lake and the Ipo Reservoir. The section’s
services range from measuring flow from
water sources to getting water samples
for water quality testing and assessing the
hydrology of water sources.

43 42
Water released from Angat Dam is transmitted
through Ipo Dam, and treated at the two
plants in La Mesa, namely, La Mesa Treatment
Plants 1 and 2 (LMTP 1 and LMTP 2). LMTP 1
is a conventional-type plant with a maximum
design capacity of 1,500 MLD while LMTP 2 is
a pulsator-type plant with a design capacity of
900 MLD.
Another source of water is Laguna de Bay, a
lake in southern Luzon. Water from the lake
is treated at the PWTP, the country’s largest
Water Withdrawal
membrane-based water treatment plant that
pioneered the use of large-scale microfiltration-
ultrafiltration and reverse osmosis. The plant
now has a design capacity of 150 MLD.
To increase our productivity, we have the
following key CAPEX projects: the 100 MLD
PWTP costing P5 billion and the Putatan WTP1
development plan (phase 2) costing P56 million;
the 21 MLD Cavite WRF costing P675 million;
the installation of an additional liquid chlorine
storage at LMTP 2 costing P60 million; some
303-1, 303-2
Water Production
LMTP 1 Process Improvement Works costing
P971 million; a 30 million liter Aguinaldo
Reservoir and pump station worth P410 million;
and the Flow Metering (Phase 2) at La Mesa
costing about P68 million.
Our water withdrawal for this year increased
by 7.20 percent, from 846,536.51 million
liters in 2015 to 907,496.80 in 2016. Of this
volume, 93.26 percent was withdrawn from
Angat Dam, a 5.03 percent increase from the
raw water withdrawal in 2015. The remaining
6.74 percent was withdrawn from the Laguna
de Bay, which saw a 50.12 percent increase in
water withdrawal from 2015. The substantial
increase in water withdrawn from the lake is due
to the additional 50 MLD production capacity
from the ultrafiltration (UF) system which started
operations in April of 2015.
After raw water is treated at the plants, it is
then ready to be distributed to customers.
From our raw water, we managed to treat a
total of 864,564.72 million liters, representing
a 5.22 percent increase from last year’s
water production. Both LMTP 1 and LMTP
2 registered a 5.05 percent increase while
PWTP showed an 8.81 percent increase,
particularly due to improvements in PWTP.
A few years ago, PWTP was under producing
due to the poor and inconsistent quality
of water from Laguna de Bay, with its high
ammonia content, high total dissolved
solids (TDS), and algal bloom resulting in an
unpleasant taste and odor. Further, PWTP’s
original process design was not enough to
treat the varying quality of the lake’s water.
We therefore had to improve the plant’s
design to enable PWTP to produce water
according to demands in the south.
In July 2013, Maynilad tapped V.A. Tech
WABAG (Phil.) Inc. to build and design
Biological Aerated Filters (BAF) for ammonia
mitigation. In November of the same year,
the same firm was tasked to build and design
the Dissolved Air Flotation (DAF) upgrade,
and to install a 50 MLD UF membrane
system. These projects, set for completion by
phase, seek to increase PWTP’s capacity from
100 MLD to 150 MLD.
Some improvements were already in place
by April 2015, enabling PWTP to increase
its production. The stabilization period is
still ongoing and process period for the two
projects are set to start soon.
2014 2015 2016
PWTP
LMTP2
LMTP1 498,331.20
285,429.10
25,187.61
515,005.20
290,816.10
40,715.21
539,922.40
306,452.40
61,122.00
PWTP
LMTP2
LMTP1
23,335.49
284,511.54
470,963.87
38,351.41
290,145.87
497,168.86
41,731.06
305,472.54
517,361.12Production in million liters
Withdrawal in million liters

45
Losses and Recovery
Inevitably, some water loss occurs from
raw water withdrawal to water treatment.
Recovery of this water is important to
decrease the net water loss in our system.
The ideal water recovery is 100 percent of
water lost but an acceptable figure internally
is 50-60 percent of water lost at LMTP 1 and
at least 95 percent at LMTP 2.
Losses are primarily incurred at the LMTP 1
and 2 filter beds through cyclic backwashing
or the inability of these plants to fully recover
backwash water from the lagoons and
recovery tanks, which have accumulated
significant amounts of sludge. Losses at
LMTP 1 and 2 are also a result of evaporation
and small leaks in the numerous gates
that all go to the lagoons. Losses at PWTP
1, meanwhile, are incurred through back
washing and the use of reverse osmosis.
Backwash water at LMTP 1 is conveyed and
stored in four lagoons, while backwash water
at LMTP 2 is conveyed to the recovery tanks
and immediately recovered for another cycle
of treatment.
The lagoons were dredged of sludge in 2015
to 2016, resulting in the storage capacity
being restored to nearly its original level.
Only limited scouring during the recovery
period was noted, which cleared turbidity in
recovered water.
In 2016, PWTP 1 losses were incurred
through backwashing of the BAF,
ultrafiltration-microfiltration-reverse osmosis
membranes and longer use of reverse
osmosis. Recovered wash water is mixed
along with newly withdrawn water from the
lake and pumped together into the plant for
treatment. Although water recovery is done
in PWTP 1, separate recordings of both raw
lake water withdrawal and wash water are
currently not available.
Water Loss
Water loss from both LMTP 1 and 2 increased
by 4.60 percent from 2015 levels. PWTP’s
water loss, meanwhile, increased by 720.33
percent, resulting in a total water loss surge
of 72.62 percent, while losses from both
LMTP 1 and 2 increased by 4.60 percent from
2015.
We attribute the marked increase in water
loss from PWTP to the extended operation
of the six reverse osmosis trains brought
about by the high TDS in the lake water. The
concentrate produced is 1 MLD per reverse
osmosis, which is then conveyed back into
the lake. Brine outfall is about 2 kilometers
from the shoreline, monitored monthly by the
Laguna Lake Development Authority (LLDA)
and is reported in the self-monitoring report
(SMR).
During the period, BAF and the different
membranes also needed to be backwashed
more frequently than normal to maintain the
quality of water produced.
In order to decrease water loss in PWTP,
Maynilad has devised some strategies, such
as continuously improving the upstream
treatment process, so that the treated water
being fed into the BAF and the different
membranes will not require frequent
backwashing.
Water Loss Water Recovered
30,137.01 6,514.29
24,870.37 8,140.20
42,932.08 9,967.50
2014
2015
2016
Water Loss and Recoveredin million liters

47 46
Through our continued efforts to increase
water recovery, we managed to increase
this metric by 22.45 percent in both LMTP
1 and 2 relative to 2015 levels. For LMTP 1,
the target for water recovery is at least 60
percent of plant losses or as needed. LMTP
1, however, did not meet this target in 2016
due to the mandatory periodic cleaning of
the 12 sedimentation basins. During this
activity, the sludge generated in the process
303-3
that were stored at the basin’s bottom were
being dumped into the lagoons, which made
recovery not advisable.
For LMTP 2, the target for water recovery is
at least 95 percent of the backwash water.
LMTP 2 succeeded in meeting this target in
2016 because its process design specifically
required the consistent recovery of at least 95
percent of the backwash water.
Water Recovery
Deepwells
We have a total of 14 deep well pump
stations, five of which are operational while
nine are on standby. These pump stations
produced 2.44 million liters of water per day
in 2016.
Reservoirs
We have a total of 30 reservoirs, 28 of which
are operational. These reservoirs discharged
a total of 181,230 million liters of water in
2016.
Pump Stations
We have a total of 30 pump stations that
collectively produced an average 1,668
million liters of water per day in 2016.
Operational
Standby
Liters of water per day in million liters
5
9
2.44
Total
Liters of water discharged in million liters
30
181,230
Operational 28
Total number of pump stations
Liters of water per day in million liters
30
1,668

49 48
We have 1,104 pressure regulating valves,
890 of which are automated. Despite not
being able to surpass the 85 percent target,
we still managed to reach an impressive
figure of 75.79 percent, providing 98.23
percent availability.
These pressure regulating valves increase
our efficiency by providing timely data
availability for analysis; removing the time
consumed during manual logger installation,
dismounting, and data downloading; and
providing a low-pressure alarm notice, which
improves resolution time of the valve failure.
Moving forward, we will aim for more
advanced pressure management, increased
reserved capacity, increased plant efficiency,
reliability redundancy, a more optimized
network through hydraulic models, and
making a central control center.
Operational Efficiency
Chemical Use in Water Treatment
301-1
Various chemicals are used in treating raw water
to ensure that the water we distribute is safe for
consumption. Our efforts include safeguarding
against algal and bacterial growth, removing
metals and ammonia, and lessening turbidity
and unpleasant taste and odor, among others.
Our use of chemicals is dictated by the amount
of water produced and by the quality of raw
water being treated.
Aluminum sulfate and polyaluminum chloride
are the two primary coagulants used in LMTP 1
and 2. These are used alternately depending
on raw water turbidity.
Aluminum chlorohydrate is used in PWTP1
primarily as a coagulant to remove or neutralize
suspended and other charged particles to a
low, manageable level before the water enters
pressure regulating
valves installed1,104
the BAF and membrane filtration system. Our
use of aluminum chlorohydrate increased in
2016 due to periods of increase in raw water
turbidity and the continuing stabilization
period process requiring a higher dose of this
chemical. Use of liquid chlorine also increased
because the chlorine dosing system with
increased capacity had started operating for
PWTP. On the other hand, there was a decrease
in the use of sodium hypochlorite due to
the increased use of liquid chlorine and the
operation of the BAF to mitigate ammonia.
Because of these measures, chemical use
and chemical use intensity increased by 6.84
percent and 1.54 percent, respectively, from
2015 levels.
2014 2015 2016
1,483.96 4,368.68 1,547.19
315.99 955.40 1,303.38
2,105.93 1,871.14 2,707.08
1,898.21 1,854.36 1,965.20
5,655.33 6,341.86 8,979.82
854.19 1,454.18 1,496.03
0.0158 0.0205 0.0208
Sodium Hypochlorite
Aluminum Chlorhydrate
Polyaluminum Chloride
Liquid Chloride
Aluminum Sulfate
Others
Intensity in tonne chemicals used/m3 water produced
Total12,313.62 16,845.62 17,988.70
Chemical Usein tonnes *
* Chemical use reported in the 2015 Sustainability Report follows this unit.
102-48

51 50
MITIGATING THE EFFECTSOF CLIMATE CHANGE, LA NIÑA, AND EL NIÑO
102-11, 102-15
Significant changes observed in climate
patterns today have made managing our
water resources more challenging. The
extent of change in rainfall intensity and
the occurrence of droughts have led to
serious problems within the Ipo and Angat
watersheds. These are compounded by
adverse human activity in the area, such
as charcoal-making and illegal logging.
All these underscore the need to mitigate
climate-change risks and ensure that our
water sources adapt to volatile weather
conditions.
The effects of climate change are further
exacerbated by La Niña, which produces
episodes of heavy rainfall, causing flooding
and soil erosion. Another recurring weather
phenomenon, El Niño, may result in
drought or very minimal rainfall, resulting
in lower water supply. Studies have
shown that changes in climate affects the
variability and intensity of the El Niño and
La Niña phenomena.

53 52
During the wet season and La Niña,
Maynilad faces a host of challenges
including rainfall intensity, variability, and
timing. High rainfall intensity affects the
turbidity of raw water, making it more
difficult to treat. The variability of climate
patterns affects water source management
planning. Accurately forecasting weather
events for more than six months ahead
of time is very difficult, thereby affecting
decision-making for reservoir operations.
Also, timing when and how long a weather
event will occur defines the duration of the
event’s impact on reservoir and treatment
plant operations.
The impact of these factors on the Ipo
Dam is primarily raw water turbidity. Longer
and more intense rainfall, together with a
degrading watershed condition, can cause
flooding, carrying soil and sediments from
the watershed down to its tributary rivers.
This, in turn, may further carry bed loads to
the reservoir, reducing its capacity. Floating
debris such as tree branches and logs
also affect reservoir operations as these
may damage facilities or clog raw water
conveyance.
Ipo Dam also has a very close range of
operating level required to meet the flow
requirement of the treatment plants located
around 22 km downstream; hence, spilling
becomes inevitable during floods.
Very turbid raw water is beyond the
treatment capacity of our plants at present.
As a result, we need to plot varying levels
of production and increase chemical use
to enable the plants to comply with the
standards of Philippine National Standards
for Drinking Water (PNSDW ).
Scouring of over-accumulated sludge at the
bottom of LMTP 1 basins results in poor in-
house water quality, while removing larger
sludge at LMTP 2 is beyond the capacity of
the existing conveyance system. There is
also a risk of land and water contamination
with plant discharge.
To mitigate these risks, prudent dam
operations and controlled spilling are set
at critical levels. Our Common Purpose
Facilities (CPF) closely monitor the
rainfall, release from Angat Dam, and Ipo
water level and quality. We also closely
coordinate with various stakeholders such
as the NWRB, MWSS, PAGASA, Maynilad,
Wet Season and La Niña
Manila Water, Bulacan Provincial Risk
Reduction Management Council (PDRRMC),
Provincial Government of Bulacan,
National Power Corporation (NPC), Angat
Hydropower Corporation (AHC), National
Irrigation Administration (NIA), and local
government units (LGUs). During this
period, the CPF implements its standard
operating procedures for the rainy season,
which usually brings in floods.
The following upgrades are also being put
in place in our facilities:
We awarded the rehabilitation project
of LMTP 1 to a Filipino-Japanese
consortium in December 2016. This is
expected to provide the following process
improvements: 1) installation of lamella
plates, which will remove the sludge from
the bottom of sedimentation basins; 2)
use of hydraulic mixing in the coagulation
process; 3) automation of filter backwashing
with use of scour air; and 4) construction
of a sludge management facility to avoid
accumulation and storage on site.
Rehabilitation work on LMTP 2 is expected
to be awarded by June 2017 to treat water
with high turbidity (>1,000 NTUs) and
improve existing sludge conveyance. This
project will provide process improvements
that include installation of lamella plates,
modification of clarifier basins, and
replacement of electrical system; improve
existing conveyance system that can
accommodate increased sludge volume
during high turbidity episodes; and create
an innovation laboratory.

55 54
Dry Season and El Niño
During the dry season and El Niño,
variability and timing remain as our
top challenges as variability affects the
preparedness of reservoirs and treatment
plants. Timing, on the other hand, defines
the extent of the dry season’s impact on
reservoir and treatment plant operations.
These also affect the availability and quality
of raw water.
Since Angat Dam supplies nearly around
95 percent of Metro Manila’s potable
water supply, raw water availability must
be prioritized especially during abrupt El
Niño occurrences. During dry seasons, the
water level at Angat may be lower than
the critical low water level. The greatest
risk during this period is scarcity of supply
and poor raw water quality, particularly
episodes of raw water containing a high
concentration of manganese. Dry periods
also lead to taste and odor problems due
to algal blooms in Laguna de Bay, as well as
high concentrations of dissolved solids and
ammonia.
Poor raw water quality leads to high
chemical costs for treatment and reduced
water production. To mitigate these
risks, prudent dam operations by pre-
determining allocations for all stakeholders
of Angat Dam is done by the NWRB. We
also control the Ipo Dam gates to ensure
LMTP requirements are met while storing
extra water at La Mesa Dam. We then
implement process improvement projects,
such as the Putatan Development Plan
Phase 2.
During the dry season, the common
purpose facilities (CPF) closely coordinates
with the Angat Technical Working Group
(TWG), composed of members from NWRB,
NIA, NPC, AHC, MWSS, and PAGASA.
During coordination meetings, the TWG
plans the raw water allocation to manage
the Angat water level. This is also the
avenue for the CPF team to raise concerns
regarding the needed raw water allocations
for both concessionaires.
The permanent solution to minimize the
impacts of climate change on existing water
sources is to improve watershed conditions
and maintain it thereafter. Potential new
water sources are determined through
feasibility studies, subject to coordination
and approval by MWSS.
Preserving our Watersheds
Watersheds are geographic areas through
which water flows across the land and drains
into a common body of water, such as rivers,
lakes, and oceans.
The Ipo Watershed and its forests—part
of our watershed system that supplies
around 97 percent of Metro Manila’s water
requirements—span an area of around 6,000
hectares and are some of our most important
natural assets.
Beyond the delivery of water, Maynilad
actively works to ensure that our
water sources are well managed and
environmentally protected and conserved
starting from the very source. As such, we
follow strict land-use and water management
304-1, 304-2, 304-3
practices to improve the quality of the
water and other natural resources within our
watersheds.
Recognizing that trees are indispensable
in the sustainability of watersheds, and
therefore our water supply, Maynilad
established the Plant for Life program, which
taps volunteers and partner agencies to
reforest the Ipo Watershed as well as plant
mangrove propagules in Manila Bay. So far,
the program has planted 70,700 indigenous
seedlings at the Ipo Watershed with the help
of 1,187 participants. Some of these native
species include narra (Pterocarpus indicus),
kupang (Parkia timoriana), and antipolo
(Artocarpus blancoi).
El Niño advisory no. 6, issued on August 5,
2015, stated that moderate El Niño conditions
persisted across the equatorial Pacific Ocean.
Leading climate models also suggested that it
may intensify from moderate to strong El Niño
in the last quarter of 2015, lasting until early
2016. This was followed by El Niño advisory
no. 7, issued on September 4, 2015, which
advised that a mature and strong El Niño was
already present in the tropical Pacific Ocean,
likely to strengthen further before the end of
2015 and may last until the first half of 2016.
Given these updates, Maynilad embarked
on different water conservation schemes and
efficient dam operations that had Angat Dam
at 213.71 meters at 12 midnight of December
31, 2015.
We also assembled an El Niño task force to
carry out mitigating actions in case of strong
El Niño in order to help the plant continue
operating within the required service levels.
El Niño in 2016

57 56
As Maynilad continues to grow its profits, we
also expand the social and environmental
motives that are inherent in our business
model. Given the advances we have already
made, we are now in a better position to
support the government’s developmental
targets and help achieve the UN SDG on
water. In this regard, we will work harder
to ensure the availability and sustainable
management of water for the communities
that we serve.
OUR PURPOSE:ENHANCING ACCESS, RELIABILITY, AND SERVICE
Our obligation to improve access to
water and enhance sanitation and health
services will always be central to our growth
strategies. We therefore continue to
refurbish and expand our infrastructure in an
environmentally sound, socially responsive,
and economically supportive manner,
particularly in communities that have yet to
access clean and potable water services.
Today, our sustained investments in water
infrastructure, service improvement, and
support for marginalized communities all
signify our corporate mantra of putting
customers first over billed volume as our top
corporate goal.

59 58
C O N C E S S I O N B O U N D A R YL G U B O U N D A R Y
S E R V I C E C O V E R A G E :
94.3%P O P U L AT I O N S E R V E D :
9.33 M*
As a water utility and a public trust,
product quality, safety, and affordability
are inevitably cornerstones of the Maynilad
brand. This led us to develop NextGen as
our new flagship program, which ultimately
puts our service to our customers at the
very front and center of our business
agenda.
W AT E R D E L I V E R Y
True to our mandate of delivering safe and
affordable water to our customers, this year
we posted a record 112.9 percent service
area coverage using the unconstrained
water-served population and 94.3 percent
using the constrained water-served
population – up from 108.3 percent and
93.6 percent in 2015, respectively. Our
expanded infrastructure and water-lines
enabled us to serve more than 9.33 million
people in the West Zone and adjoining
areas, up from 9.17 million people in 2015.
102-15
The unconstrained water-served population
is computed by multiplying the number of
Maynilad accounts per city or municipality
by the number of persons per account
based on the results of the University of the
Philippines National Engineering Center
2011 Consumer Survey. Constrained water-
served population is computed using the
same formula for unconstrained water-
served population except that the product
is capped by the total population in each
city or municipality.
O U R C U S T O M E R S :F R O N T A N D C E N T E R
* Values in the illustration represent constrained percent service coverage and the served population
in millions per municipality.

61 60
The number of our customers increased
by 4 percent to 1,312,223, surpassing
our target of 1,309,831 for the year. This
indicates an increase in demand for our
services and also a considerable return
on our investments. We further strive to
increase our customer base and target to
1,354,604 customers for 2017.
Total Customer Accounts
Some of our customers receive both water
and sewer services. Their number increased
by 5 percent from 63,383 in 2015 to 66,021
in 2016.
Water Water and Sewer
1,190,062 59,898
1,265,625 63,383
1,312,223 66,021
2014
2015
2016
Billed Volume
Billed volume directly translate to the
amount of water that our customers
receive and is our biggest income stream.
This year, billed volume increased by 4
percent to 1,365.54 MLD from 1,318.59
MLD in 2015. We are pleased to note that
this amount surpassed our 2016 target of
1,354.20 MLD.
Similarly, total billed volume increased by 4
percent, from 481.53 million cubic meters
in 2015 to 498.60 million cubic meters in
2016. We also surpassed our 2016 target of
494.82 million cubic meters.
1,266.86
1,318.59
1,365.54
2014
2015
2016
102-7
Number of accounts Average Billed Volumein million liters per day

63 62
Water pressure is a key issue in our
concession and a challenge we vow to
overcome and fully resolve.
As all of our connections now experience a
pressure of at least 7 psi, we are taking the
next step by targeting to reach at least 16
psi for 100% of our connections next year.
This year, we worked double time to get
closer to this goal, resulting in a 5.10
percentage-point increase of customers
Water Pressure Customer Distribution
who are enjoying a water pressure of at
least 16 psi. This was a result of initiatives
on total or partial pipe replacement,
pump station operation adjustments,
resetting of the pressure regulating valves
(PRVs), improvements on supply plus the
normalization of raw water quality at PWTP.
Our 1,104 PRVs give us timely data
on pressure and low pressure alarm
notifications improve our resolution times
to any problems on pressure as well.
2014 2015 2016
32.80%
67.20%
29.30%
70.70%
24.21%
75.79%
Customers Receiving 24-hr Service
With our NextGen program, we magnify
our focus on uninterrupted water availability
and nonstop customer support. We
acknowledge that we fell short of our 2016
target of reaching 85.13% connections with
nonstop water service. This was due to our
effort to increase our supply by 50 MLD
consequently contributing to a modest
depletion in our network and a reduction of
service levels. To catch up, we are planning
to energize and fully complete our Putatan
2 and North A Annex CAPEX projects by
2017, and we have adjusted our 2017
target to 77.4 percent for a more realistic
target in light of these upgrades.
Furthermore, we have started building a
supplementary pumping station inside
the La Mesa Compound to improve water
pressure. The North A Annex will serve
more than 84,000 households in Quezon
City and Caloocan, of which some 10,000
will be new customers. Other pumping
stations currently under construction are in
Muntinlupa and Cavite. In total, we have
allocated P883 million for the construction
of new pumping stations in 2016, bringing
us to a total of 27 pumping stations
producing an average of 2,126 MLD
throughout the West concession area.
2014 2015
95.55%
67.15%
94.94%
70.66%
7 psi
16 psi
2016
91.97%
75.74%
7 psi
16 psi
7 to < 16 psi
At least 16 psi
Water PressureCustomer Distribution
Customers Receiving 24-hr Service

65 64
There are now more customers who avail of
our online billing, the MyWaterBill program.
Through this, Statements of Account (SAO)
can be viewed through the MyWaterBill
website, allowing greater convenience
to customers. From 210,871 customers
availing of this online service in 2015,
the number has significantly increased
by 70 percent, or 358,899 customers,
in 2016. This is due to the program’s
additional features, such as sending
Online Billing
of payment notifications to customers
via SMS/e-mail and allowing them to
make online payments at any given time
through accredited bank sites linked in
the MyWaterBill website, all of which are
provided free of charge.
For 2017, we aim to cover 75 percent of
our billed customers under this online
service.
2014
2015
80,653
210,871
2016 358,899
E N S U R I N G S A F E W AT E R Q U A L I T Y
Maynilad subscribes to strict standards
and principles required by the Philippine
National Standards for Drinking Water
(PNSDW). To uphold drinking water
specifications, we collected 102,751
samples, which were analyzed for physico-
chemical parameters, heavy metals,
organic compounds, radiological elements,
pesticide residues, and disinfection by-
products. We send samples that do not
meet the standards to the head of the
102-11, 416-2
concerned plant and the Environmental
Management Department of Maynilad for
their prompt action. Data generated by our
laboratory are also reported to the DENR
through Maynilad’s biannual Environmental
Compliance Certificate (ECC) Monitoring
Report and Annual Report being submitted
to the Environmental Management Bureau
of the Department of Environment and
Natural Resources.
Number of accounts availing of online billing

67 66
Our sampling methodology is a population-
based tripartite sampling with local
government units (LGU) and MWSS. For
coliform bacteria, we have 1 sample per
10,000 population monthly. At least 95
percent of the samples taken should be
negative. In case of unsatisfactory results,
we immediately conduct re-samplings and
take additional samples from the left and
right of the original sampling point until
the questionable water has achieved the
satisfactory result.
For physico-chemical properties, we have
one sample per 10,000 people per year
distributed evenly. Further, we have two
samples per 100,000 people per year
for metals and two samples per 500,000
people per year for organic pollutants. We
have monthly meetings with MWSS and
the Department of Health to discuss our
sampling results and ensure the quality
of the process and safety of the product.
In 2016, we had an issue in Muntinlupa
with the presence of trihalomethane, a
product of chlorine reactions with organic
compounds.
To address this, we upgraded the capability
of the Putatan Water Treatment Plant
(PWTP) to remove the precursors of these
compounds from the very start of the
treatment process by using biofiltration
before the water enters the membrane
filters. Additionally, we employed
ultrafiltration to remove smaller particles
that microfiltration could not remove.
As due diligence, we instituted a systematic
increase in the monitoring of areas
influenced by the PWTP. Aside from the
required PNSDW parameters, we included
ammonia and chloramine content in our
monitoring of the distribution system in
2016. These compounds contribute to taste
and odor issues that can manifest in our
customer’s taps. For the water quality at the
intake, we included microscopic biological
examination of the algae in our repertoire
to monitor the occurrence and density of
taste and odor algae species.
Some results of our 2016 data gathering
are found in Annex B.
Special Programs
Aside from our standard billed services,
we also focus on social inclusion through
various special programs. The number
of customers who received discounts on
installation cost decreased by 46 percent,
from 29,271 in 2015 to only 15,788 in
2016. This decrease is due to the success
of our ongoing discounted installation cost
initiative, which already connected a large
number of our target communities to the
Maynilad network, causing the proportional
decrease in the number of program
enrollees for this reporting year.
Lifeline customers are categorized under
those that consume a maximum of 10
cubic meters per month. There was a 7
percent increase in the number of lifeline
customers, from 263,019 customers in 2015
to 280,547 customers in 2016.
The number of low-income households that
enjoy discounts decreased by 5 percent
from 221,621 in 2015 to 210,647 in 2016.
This is due to the change in the category of
these households from Class D to higher-
income class.
There was a 5 percent increase in the
number of households receiving senior
citizen discounts, from 2,157 in 2015
to 2,270 in 2016. A total P336,863 in
discounts were availed by households with
senior citizens, who receive a 5 percent
discount as mandated by law.

69 68
Discounted Installation Cost
Lifeline Customers
< 10 m3
2014
2015 29,271
2016 15,788
41,160
2014
2015
223,437
263,019
2016 280,547
Low-Income Households
Senior Citizen Discounts
2014
2015
211,520
221,621
2016 210,647
Number of Low-Income Households
2014
2015
3,278
2,157
2016 2,270
-%%Brgy.rgy.
Number of accounts with discount
Lifeline customers in number of accounts
Households with Senior Citizen Discounts in number of accounts

71 70
Customer Satisfaction
102-43, 102-44
As embodied in NextGen, we are
strengthening our focus on customer
experience by improving the touch points
between the company and our customers.
From our previous revenue and billed
volume focus, we have now moved to a
more customer-centric mindset.
We are migrating from a Customer
Service Information System to a Workflow
Management System to better monitor new
customer applications and other customer
concerns, enabling us to enhance overall
customer experience.
Customer Satisfaction (CSAT) Score
A key indicator in our relationship with our
customers is the CSAT score. Our CSAT score
improved in 2016 at 3.36 from 2.99 in 2015,
based on surveys conducted among our
customers with service concerns. This means
that we are now “Exceeding Standards,”
from only “Meeting Standards.” All scores
covering all classes of complaints and
requests (C1 to C4) increased – a testament
to our company’s renewed vigor and industry,
particularly in the prompt handling of
customer concerns and complaints.
We send these results to their respective
Business Areas to sustain advances and
address areas for improvements. We are
also constantly enhancing our survey
questionnaire to better capture our
customers’ sentiments.
In addition, we established a Key Accounts
Relations Department, with the objective of
taking care of large accounts’ volume and
collection. The department is also in charge
of providing strategic relationship guidance
to better know our customers, understand
their needs, and ultimately garner their trust
and full support.CSAT score for 20163.36
Complaints and Requests
While there was an increase in service-
related complaints in 2016, we are glad
to note that we have a resolution rate of
98 percent within 10 working days. This
means we were able to promptly address
56,904 out of the total 57,898 complaints.
Our customer satisfaction score in this area
also increased from 2.88 in 2015 to 3.26
in 2016, following better water quality and
availability, increased water pressure, and
more frequent and timely water advisories.
C1: Service-related complaints
There was a 6 percent decrease in billing-
related complaints, from 60,417 in 2015 to
56,735 in 2016. Of this total, 99 percent
were resolved within 10 working days.
The company’s timeliness and improved
accuracy in billing, as well as faster billing
resolution periods, helped increase our
customer satisfaction score in this area from
2.80 in 2015 to 3.07 in 2016.
C2: Billing-related complaints
20,327
35,922
2016 57,898
2014
2015
72,629
60,417
2016 56,735
2014
2015

73 72
We received 46,628 application requests
in 2016, which is 7 percent lower than in
2015. All these applications, or around 99
percent, were resolved within five working
days.
Our faster processing of applications and
better basic orientation platforms have
helped increase our customer satisfaction
score in this aspect from 3.12 in 2015 to
3.52 in 2016.
C3: Application requests
There was a 9 percent decrease in
installation requests, from 41,173 in 2015
to 37,476 in 2016. Better timeliness of
installation has resulted in higher customer
satisfaction in this area, from 3.20 in 2015
to 3.60 in 2016.
C4: Installation requests
43,526
49,900
2016 46,628
2014
2015
38,264
41,173
2016 37,476
2014
2015
2016
N O N - R E V E N U E W AT E R
Amid population growth and rapid
industrialization, Maynilad must constantly
face the challenges posed by non-revenue
water (NRW) or water that is lost in any
segment of our entire service line.
We believe that NRW reduction is the
more cost-effective measure to guarantee
sustained water supplies for both existing
customers and upcoming markets. Along
with NRW reduction, common problems like
product and revenue loss, intermittent water
supply, health risks and poor water quality,
environmental impacts of water spills, poor
company image, and customer dissatisfaction
are lessened.
We were able to reduce the annual average
NRW level by 1 percentage-point from 31
percent in 2015 to 30 percent in 2016. The
equivalent volume is 9 million liters per day.
Since we embarked on a large-scale NRW
reduction program in 2007, we have built
the capacity of our personnel in various
aspects of NRW reduction and management.
2014
2015 201634%
650 31%
593
30%
583% NRW
NRW in million liters per day
% NRW and NRW in million liters per day

75 74
Aside from addressing our own NRW
challenges, we have also been sharing our
knowledge and expertise with several local
and international water utilities to improve
their own capabilities in NRW management.
We have helped water utilities from
Bangladesh, India, Indonesia, Nepal, United
Arab Emirates, Senegal, South Africa, and
Vietnam. Locally, we have been instrumental
in building up the capacities of water districts
in Iloilo City and Cagayan de Oro City.
With the start of the Maynilad Next Gen
program, NRW Operations has been
decentralized and reintegrated into our
various Business Areas, paving the way
for improved efficiency in responding to
anomalies in the system and in leakage
management. We also created an NRW
Services section to better cater to local and
international clients.
Maynilad’s NRW program is designed to
address both physical and commercial
components.
To address physical losses, active leakage
control (ALC) is implemented. This aims to
locate all leaks, both surfacing and non-
surfacing, using sophisticated leak-detection
equipment. This is followed by speedy and
lasting leak repair solutions.
To address commercial losses, we constantly
aim to stop illegal connections and replace
faulty meters. The company also implements
selected pipe replacement projects that
rehabilitate segments of the network that
are no longer economical to maintain. This
program addresses both leakage and illegal
connections.
District Metered Area Management
Maynilad’s NRW management strategy uses
the Distric Metered Area (DMA) approach,
which breaks down the network into smaller,
more manageable areas. DMAs are small
isolated areas where the volume of water
entering and leaving the system is measured.
Hydraulic Systems (HSs) are clusters of DMAs,
including the primary lines. Formation of
DMAs and HSs are necessary to quantify
and separate the losses in the primary and
secondary mains. This enables the company
to assess each system and identify the
specific sources of NRW.
We reached full DMA coverage in 2012, and
as of December 2016, we had 138 HSs and
1,589 DMAs. The increase in the number of
DMAs is due to the splitting of large DMAs
and the conversion of multiple inflow DMAs
into a single inflow, plus the establishment
of DMAs in expansion areas. Moreover, we
installed electromagnetic flow meters (EMF)
with automated meter reading capabilities for
more accurate and reliable measurements of
DMA supply.
The performance indicators of each DMA
are continuously monitored, and the focus
of diagnostic activities depends upon their
performance. Thus, Maynilad has adopted
the International Water Association (IWA)
classification of DMAs. Under the IWA,
DMAs are classified as Type A DMAs, which
are world class; Type B DMAs, which are
good performing but have potential for
improvement; Type C DMAs, which are bad
performing; and Type D DMAs, which are the
worst performing DMAs with very high NRW
indicators.
By the end of 2016, Maynilad had 1,589
DMAs, 541 (34 percent) of which were Type
A; 269 (17 percent) were Type B; 293 (18
percent) were Type C; and 486 (31 percent)
were Type D. We promptly worked on
step testing, leak detection, and repair for
Type C and D DMAs. Sustenance activities
were implemented in type A and B DMAs.
Continuous monitoring and evaluation were
done in these DMAs to ensure that their low
NRW are sustained.
District metered
areas1,589

77 76
2015
Active Leakage Control
Physical losses, caused by leaks in the
distribution system, contribute around 70
to 80 percent of our total losses. Maynilad
commits to active leakage control and
persistently looks for non-surfacing leaks.
These programs are implemented by the
Leak Detection Management Department,
made up of highly skilled leak detectives
specializing in the use of different modern
sounding and correlating instrument.
Maynilad uses leak noise detectors and
correlators, as well as tethered leak
detection equipment, which is capable of
audio and visual inspection from inside
the pipes without water interruption. In
addition, we use the Sahara Leak Detection
System for big pipes and JD7 Investigator
for small pipes.
In 2016, 3,700 kilometers of secondary
and tertiary pipes were detected, finding
5,080 underground leaks. In addition,
292 kilometers of primary lines were
investigated, locating 61 leaks.
20162014 2015
58,122
42,444
41,171
53,207
38,110
41,171
52,253
28,872
27,936
This was followed by speedy and quality
leak repairs. Of the 52,253 received leak
reports from both customers and staff,
28,872 were found to be actual leaks, and
27,936 of which were repaired in 2016. The
resolution rate was 98 percent, while the
average leak repair runtime was eight days.
Primary leaks fall under leaks from pipes
that are larger than 300 millimeters in
diameter. In 2016, 101 primary line leaks
were repaired, lower than 2015’s total of
122 because of the lower leak frequency
present in primary lines.
122
122
2016 101
2014
4,000
4,300
4,600
2014
2015
2016
Pipes Checked in kilometers
Leaks reported
Actual leaks
Leaks repaired
Leaks
Primary Leaks Repaired

79 78
Massive Meter Replacement
To maintain the accuracy of billed volume
measurement, Maynilad implements a five-
year replacement cycle for 15-millimeter
velocity meters. Maynilad also introduced
the use of volumetric meters that are
capable of measuring very low flows and
have a 10-year useful life span.
In 2016, we replaced 127,159 velocity
meters, most of which were installed in
2011. We replaced 76,137 of these old
units with volumetric meters, and 51,022
with new velocity meters.
VolumetricVelocity
99,963
59,618
51,022
136,304
78,001
76,1372016
2014
2015
Selective Pipe Replacement
We replace pipes when continuous
diagnostic and maintenance activities
become too costly. Selecting which pipes
to replace is based on the volume of
NRW, maintenance costs, age and type
of materials, and the need to improve
service levels in the area. Selective pipe
replacement is done as the last resort only
after undergoing systematic diagnostic
process.
In 2016, Maynilad was able to replace 196
kilometers of pipe lines. We conducted
major rehabilitation work in Bacoor City,
Paranaque City, the districts of Tondo in
Manila and Fairview in Quezon City, and
Muntinlupa City. We also realigned and
replaced 19 kilometers of pipe lines as a
result of road and drainage construction
projects.
Maynilad pipe replacement contractors
follow strict procedures to ensure the safety
and security of all stakeholders. These
entail the placement of appropriate board-
ups, lights, and signages; the deployment
of additional traffic aides to man the area;
and the temporary restoration of diggings
to make roads passable during the day.
170
235
1962016
2014
2015
Meter Replacement Pipes Replaced in kilometers

81 80
As much as 80 percent of the potable water
consumed by our customers turns into
wastewater. If left untreated this will pollute
our seas and rivers with harmful pathogens
and expose us all to serious sanitation and
health risks.
ENSURINGHIGH LEVELS OF WASTEWATER MANAGEMENT
At Maynilad, we take these concerns
seriously and aim to go over and beyond
standard steps in treating and managing
our overall wastewater outputs. Our
wastewater program seeks to be at par
with global standards and is geared for
sustained growth in all fronts, especially
for the environment and the welfare of our
communities.

83 82
Sewerage Coverage
S E W E R A G E A N D S A N I TAT I O N
For every one percent increase in coverage,
we can serve an estimated 100,000 more
people. We thus seek to enlarge our
investments in water reclamation facilities
and other related infrastructure to further
widen our coverage.
We are glad to report a 9 percent increase
in the number of people reached by our
sewerage services, up from 1,286,799
people in 2015 to 1,401,590 in 2016.
Despite this marked increase, however,
we still fell short of our ambitious 27
percent coverage target for the year, as we
covered only 15 percent. This was caused
by delays in project completion stemming
from lot acquisition and right-of-way issues
beyond our control. We have learned from
1,071,321
1,286,799
1,401,5902016
2014
2015
experience and will proactively address the
root causes of these delays as quickly as
possible.
In addition, we are creating a new Business
Plan that will reflect the status of our
sewage coverage projects and targets
accurately. The progress of ongoing
projects, namely the Pasay, Parañaque,
Muntinlupa, and Valenzuela Sewerage
Systems, are in full swing. Moreover, lot
acquisition for future projects are being
done at an earlier stage to give enough
time to address unforeseen issues that may
arise. The final wastewater coverage target
at the end of the concession remains to be
100 percent while our short-term target for
2017 is a coverage of 19 percent.
Moving forward, the WRF and pump station
sites of our 2018-2022 projects are already
being validated and shall be acquired
ahead of time.Total Population Covered

85 84
Sanitation Coverage
Our sanitation coverage represents
the number of people that have been
offered desludging services, which we are
constantly improving as well as promoting
to more people. For this year, we achieved
59 percent coverage, accounting for a 36
percent increase in the number of people
who availed of our sanitation services,
which has reached 5,499,835. This increase
was mainly due to the operation of the
Alabang-Zapote Septage Treatment
Facility, which increased our capacity and
coverage in the south. As we enter the next
five-year sanitation cycle, we are setting our
target to 81 percent by 2021, beginning
with 10 percent by 2017. This periodic
resetting of sanitation coverage target is in
accordance with the Compliance Period of
the concession agreement.
Sewer Lines
The total length of our sewer lines
remained the same in 2016. Moving
forward, we anticipate an increase in the
length of sewer lines as we add more
operational sewerage systems.
522
527
5272016
2014
2015
C O N C E S S I O N B O U N D A R YL G U B O U N D A R Y
S A N I TAT I O N C O V E R A G E :
59%
P O P U L AT I O N S E R V E D :
5.50 M*
* Values in the illustration represent constrained percent service coverage and the served population
in millions per municipality.
Length of Sewer Lines in kilometers

87 86
W AT E R R E C L A M AT I O N F A C I L I T I E S
Our sewerage and sanitation services
include the collection, transport, treatment,
and discharge of wastewater. In following
these steps, we practice proper water
resource management that is rooted in
environmental stewardship and health issue
prevention.
We have a total of 17 WRFs, two sewage
and septage treatment plants and one
septage treatment plant.
Our WRFs have a total capacity of 541,917
MLD.
We were able to increase the total volume
of wastewater treated and discharged by
2 percent from 57,120,333 cubic meters in
the previous year to 57,981,304 in 2016.
This was made possible by the increase in
our sewerage and sanitation coverages and
the process optimization of our facilities as
well as our increased plant availability.
44,707,406
57,120,333
57,981,3042016
2014
2015
Wastewater Treated and Discharged in cubic meters

89 88
With the addition of our Alabang-Zapote
Septage Treatment Plant, there was a significant
53 percent increase in the number of septic
tanks desludged in 2016, aggregating to
96,594 septic tanks from 63,134 septic tanks in
the previous year.
We desludge the septic tanks of domestic
customers once every five to seven years. The
collected septage is carried by vacuum trucks
to the Veterans WRF in Project 7, Quezon City;
the Dagat-Dagatan Sewage and Septage
Treatment Plant in Caloocan; or the Alabang-
Zapote Septage Treatment Plant in Las Piñas.
D E S L U D G I N G
Desludged Septic Tanks
41,873
63,134
96,5942016
2014
2015
In these facilities, the collected septage is
dewatered, processed into biosolids, and
further treated and safely disposed by our
contractors at their respective composting
facilities.
F.G. Agro, our hauling and treatment partner,
collects biosolids and further processes them
by drying them for 20 to 30 days. This process
brings down the moisture content of the
sludge to around 80 to 60 percent. These are
then transferred to a composting area, where
carbon and microorganisms are added. Once
finished, the treated biosolids are applied into
agricultural lands in Central Luzon to enrich soils
with nitrogen for growing sugar cane.
Number of Desludged Septic Tanks

91 90
Customers who Availed of Desludging Services
There was a 58 percent increase in the
number of customers who availed of
Maynilad’s desludging services, from
66,817 in 2015 to 105,374 in 2016. We
attribute this increase to our intensive
advertising campaigns, resulting in
heightened awareness among the public
of the crucial need for proper sanitation
services.
52,878
66,817
105,374
2014
2015
2016
W A S T E W AT E R M A N A G E M E N T306-1
Pollution Load Abatement
The effective and safe collection and
processing of sewage is important both to
our community’s health and the sustained
success of our concession. We only
discharge treated wastewater into water
bodies once we are certain that it has been
treated properly using the latest treatment
technologies and following all government
discharge limits and regulations. However,
the amount of pollutants removed varies
year on year, as it is dependent on the
pollution concentration of the wastewater
collected by the combined sewer system.
This resulted in a qualitatively lower
amount of pollution removed for this year
compared to 2015.
1,829,003
4,820,669
2015 2016
1,794,646
72,322
1,731,943
3,171,521
1,600,121
42,178
BOD
COD
TSS
Oil and Grease
Pollution Load Abatement in kilograms
Number of accounts availing of Desludging Services

WHAT ENABLES US TO CREATE VALUE
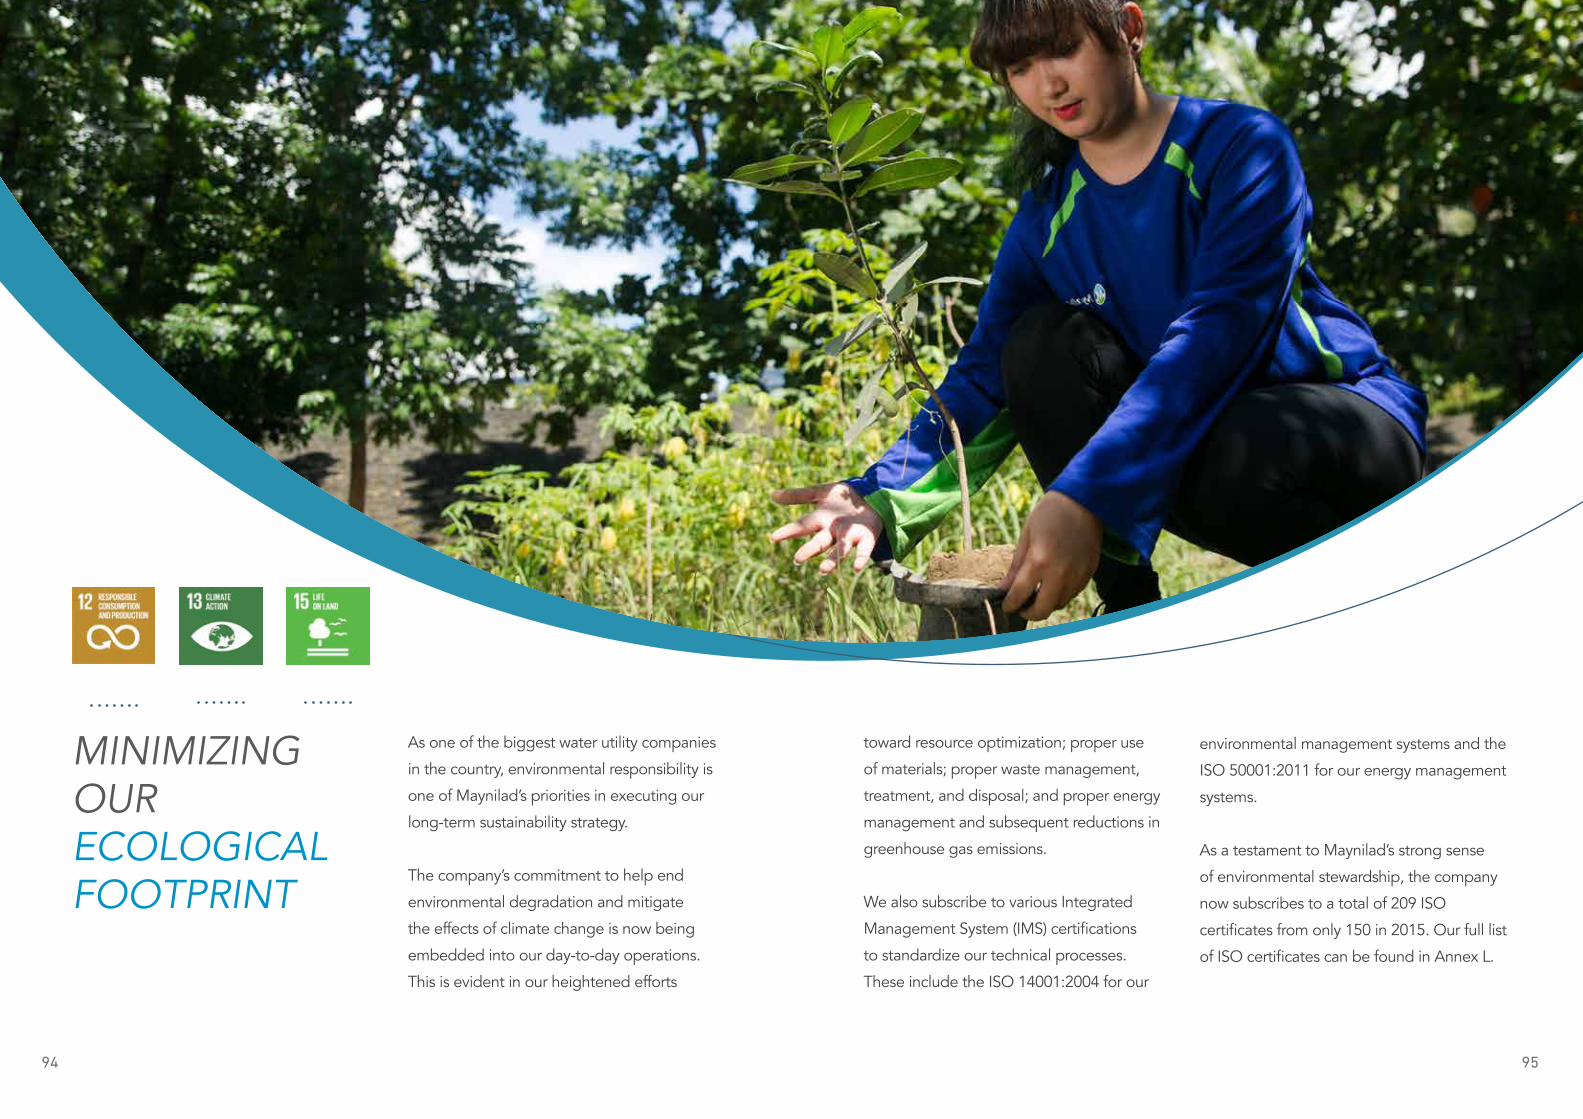
95 94
As one of the biggest water utility companies
in the country, environmental responsibility is
one of Maynilad’s priorities in executing our
long-term sustainability strategy.
The company’s commitment to help end
environmental degradation and mitigate
the effects of climate change is now being
embedded into our day-to-day operations.
This is evident in our heightened efforts
MINIMIZING OUR ECOLOGICAL FOOTPRINT
toward resource optimization; proper use
of materials; proper waste management,
treatment, and disposal; and proper energy
management and subsequent reductions in
greenhouse gas emissions.
We also subscribe to various Integrated
Management System (IMS) certifications
to standardize our technical processes.
These include the ISO 14001:2004 for our
environmental management systems and the
ISO 50001:2011 for our energy management
systems.
As a testament to Maynilad’s strong sense
of environmental stewardship, the company
now subscribes to a total of 209 ISO
certificates from only 150 in 2015. Our full list
of ISO certificates can be found in Annex L.

97 96
We use various types of materials for our
operations and projects. These materials
range from water meters to pipes to
various fittings. It is imperative that we have
proper inventory management to provide
continuous and uninterrupted service.
To ensure the availability of materials
when needed while optimizing costs, we
implement regular customer engagement
with end-users, materials training,
continuous maintenance of our online
Stock Materials Catalogue, stock keeping
unit rationalizations, and benchmarking our
supply chain practices.
In 2016, we achieved a service level target
of 99.67 percent, higher than our targeted
98 percent. Our 2016 Physical Inventory
yielded a very minimal net variance of
P13,776.74 for Central Depot with zero
variance for all satellite depots. This year-
end inventory result is a big improvement
over various years’ and from last year’s net
inventory variance of P98,718.96.
M AT E R I A L S U S E D301-1
Valves, hydrants, accessories
Water meters and spare parts
2014
2015
2016
7,646
7,309
691,297
448,498
472,806
1,157,8002014
2015
2016
1,178,971
1,288,725
Materials Used in pieces
7,924
S O L I D W A S T E306-2
One of the targets of SDG 12 is to
substantially reduce waste generation
through prevention, reduction, recycling,
and reuse. We seek to contribute to this
Global Goal by upholding our subscription
to ISO 14001:2004 or the Environmental
Management Systems, and aiming to
reduce the wastes that we create, while
soundly managing waste disposal and
treatment.
Our systems involving solid wastes
follow a strict set of guidelines to ensure
that they are properly segregated. Our
biodegradables and residuals are collected
daily and are disposed in accordance with
an established waste disposal scheme.
Our recyclables, varying on the amount
accumulated, are collected at least once a
month, and are either sold to junk shops
or recyclers, or donated to charitable
institutions.
Our total solid waste amounted to
46,660.15 kg for this year. This accounts
for 48 reporting facilities out of the total
115 facilities, including business areas,
water treatment plants, materials depots,
and WRFs. This is an improvement from
the 21 facilities that reported in 2015, and
we continuously aim to increase this in the
succeeding years.
Pipes and fittings
10,202.0214,544.8921,913.24
Biodegradable RecyclablesResiduals
Solid Wastein kilograms

99 98
H A Z A R D O U S W A S T E306-4
1,300.30
134.70
306.00Generated
In Storage
Disposed
Contained container and
paint cans
1,033.00
789.10
1,172.00
Ink cartridges
942.00
227.75
174.70
Oil contaminated rags and materials
17,478.00
39.00
6,818.00Generated
In Storage
Disposed
Used oil
3,352.00
0.00
2,840.00
Used batteries
1,305.40
906.80
859.70
Used bulbs and fluorescent lamps Hazardous wastes pose significant threats
to human health and the environment. We
thus make sure that we fully comply with
Republic Act 6969 or the Toxic Substances
and Hazardous and Nuclear Wastes
Control Act of 1990. We properly store our
hazardous wastes and engage government-
accredited suppliers for their proper
transport and treatment. From storage to
disposal, we are well aware of where our
wastes go.
To improve our performance in this area,
we are now including hazardous waste
categorized as in storage, disposed, and
generated in our reporting metrics. A total
68 percent of hazardous waste in storage
is used oil, while 80.86 percent of our
disposed waste are ink cartridges and used
bulbs and lamps. Meanwhile, 88.99 percent
of our generated hazardous waste are ink
cartridges, used oil, and used batteries.
Hazardous Waste in kilograms

101 100
E N E R G Y C O N S U M P T I O N302-1, 302-3
We established an Energy Management
System through ISO 50001 to effectively
monitor the energy consumption of
our facilities and find ways to decrease
our overall energy consumption and
intensity. Our energy consumption for
this year increased by 2.26 percent
from 112,886,862.53 kWh in 2015 to
115,436,790.25 in 2016. However, our
energy intensity decreased from the
previous year’s 137.39 to 133.52 kWh per
million liters of water produced, proving
that we are moving towards fully utilizing
the energy that we consume.
This decrease in intensity is materialized
through our focused efforts on LMTP 1
and 2, La Mesa Pump Station, Villamor
Pump Station, PAGCOR Station, Pasay
Pump Station, and Tondo Sewage Pumping
Plant – seven of our most energy-intensive
facilities. These include initiatives such as
reduced operating hours of some pumps
from the Tondo Sewage Pumping Plant
and the optimization of generator sets
from the LMTP 1. Through various energy
management activities, we were able to
save P10,923,842.87.
2014
2015
2016
With our current initiatives in fuel efficiency,
we also managed to reduce our fuel
consumption by 29.40 percent or 50,047
gigajoules equivalent of fuel consumed
in 2016. One measure that contributed to
this achievement is the Fleet Management
program, where we transitioned from old,
company-owned vehicles to leased vehicles
that are new and regularly checked for
efficiency.
Energy Consumption in kWh
95,777,777.80
112,886,862.53
115,436,790.25
Consumption
122.98
137.39
133.52
Fuel Consumption in gigajoules
2014
2015
2016
12,667
21,023
7,647
Intensity kWh/ML water produced
Gasoline Diesel
60,195
49,870
42,400

103 102
G H G E M I S S I O N S305-1, 305-2, 305-4
Climate change is one of the biggest issues
facing our world today. As a company with
a certified carbon footprint, we own up to
our contribution to this global problem and
are thus taking strategic and calculated
steps to reduce our greenhouse gas
emissions.
One of the targets of SDG 13 is to
integrate climate change measures into
organizational strategies and planning,
and we are doing so by embedding ISO
14064-1:2006 and ISO 14064-3:2006 or
the Greenhouse Gases Quantification,
Reporting, Validation, and Verification
standards into our operations. This year,
we constructed the Maynilad Safety
Center, which we target for the Building for
Ecologically Responsive Design Excellence
(BERDE) 2-Star Rating – the Maynilad Safety
Center. As of the design stage audit, the
green building passed for 1-Star BERDE
Rating.
We managed to decrease our GHG
emissions by 0.19 percent in 2016. Our
total of 69,973.93 tonnes of CO2e consists
of 4,249.20 tonnes from our Scope 1
emissions and 65,724.73 tonnes from our
Scope 2 emissions. Our Scope 1, or Direct
GHG, consists of stationary combustions
from our generator sets and fleet vehicles.
Our Scope 2, or Indirect GHG on the other
hand, comes from the electricity that we
purchased. The emission factors used are
from 2016 figures of the Department of
Energy.
6,496.79
4,249.202016
2015 63,342.30
65,724.73
Scope 1 Scope 2
GHG Emissions tonnes CO2 equivalence
0.085
0.081
Intensity tonnes CO2e/ML water
produced
5,872.942014 54,156.26 0.074
B I O D I V E R S I T Y
Mangrove forests are important sanctuaries
for fish and other marine animals. They also
provide protection from storm surges and
tidal waves, especially in vulnerable coastal
communities.
For this reporting year, we planted 25,000
mangroves with the help of 348 volunteers.
We seek to rehabilitate mangrove areas
in Cavite City, Kawit, Noveleta, and
Rosario in Cavite Province to help protect
its coastlines and manage our carbon
footprint simultaneously. This year, together
with experts from the Ateneo de Manila
University and Philippine Business for the
Environment as well as partners from the
local community and DENR, we measured
21,287.16 tonnes as baseline carbon
stock which will serve as reference for
future carbon sequestration and offset
calculations.
The Angat and Ipo Watersheds are the
source of 97 percent of Metro Manila’s
water resources.
As such, we continuously endeavor to
ensure its protection and conservation.
We contributed P7.5 million to support
the forest guards who are continually
protecting these critical areas. Recognizing
that trees are an integral part of this
ecosystem, Maynilad also established the
Plant for Life program. This program taps
volunteers and partner agencies to reforest
the Ipo Watershed. This year, we were able
to plant 70,700 seedlings with the help of
1,187 participants. To increase the survival
rates of the seedlings, we continue to
work in collaboration with the indigenous
communities around the watershed who
safeguard the seedlings until they mature.
See Annex E for our planting partners.
seedlings planted70, 700
304-1, 304-2, 304-3
2,975.202009 (baseline)
27,238.37 0.035

105 104
CULTIVATING ENGAGED EMPLOYEES
Through the years, we have seen how a
dynamic and highly engaged work force
can increase not just productivity but also
innovation and the company’s triple-bottom
line performance. Because of this, our
employee engagement has long been a top
concern.
Our employee engagement and retention
scores improve every time we take measures
to empower our people. As such, we require
management to enable employees to meet
tangible goals by giving them a challenging
yet fair amount of responsibility, coupled with
the appropriate tools to succeed.
We also aim to provide our people with
sufficient space for autonomy, opportunities
for mastering their craft, and an enhanced
sense of purpose by articulating, in the best
way possible, our development goals.
We seek to employ the best talents in the
country regardless of their ethnicity, religion,
or gender. We consider eligible applicants
equally and fairly throughout the hiring
process. We look beyond physical disabilities
and focus more on a candidate’s potential
to help advance our sustainability cause and
business goals.
Back in 2015, we launched a program
called Higit sa Tubig: Isip, Puso, at Gawa
(Beyond Water: Mind, Heart, and Action)
to hasten the transformation of Maynilad’s
workforce culture into one that puts customer
satisfaction first before all other key result
areas.
Since then, Higit sa Tubig has engaged
over 600 Maynilad employees including key
officers and board of directors of two union
groups, who now embody our enhanced
focus on customers in both mind and spirit.

107 106
E M P L O Y E E S TAT I S T I C S102-7, 102-8, 405-1
As we continue to expand our business and
services, we saw a 4 percent increase in our
workforce in 2016, reaching a total of 2,229
employees. Of the 156 new employees,
112 are males and 44 are females. For this
year, we have a low 2.33 percent turnover
rate of 52 employees consisting of 31
males and 21 females.
We seek to attract the best candidates
and strive to select the best person for
each job. We ensure that the recruitment
and selection of potential employees are
conducted in a professional and lawful
manner.
All applicants are treated fairly, with respect
and courtesy, to ensure that the applicant’s
experience remains positive regardless of
the outcome.
We consider recruitment and selection a
public relations exercise, wherein factors
that may affect our reputation must always
be considered throughout the process. As
such, part of our hiring policy is ensuring
that recruitment materials such as audio
visual presentations, as well as job fair
booths, corporate portfolios and other
marketing materials, are in compliance with
the company’s brand policy.
New Hires401-1
Employee Turnover
0
0
2
2014
2015
2016
New Hires
64
33
36
Over 50 years old 30-50 yrs old Below 30 years old
195
125
118
1
0
2
2014
2015
2016
Employee Turnover
26
17
29
Over 50 years old 30-50 yrs old Below 30 years old
60
42
21

109 108
Composition by Employee Contract
Our direct employees are composed
of permanent and project-based hires.
Out of our current 2,229 permanent
employees, 1,679 are male and 550 are
female. With the increase in employees,
job positions also increased in many levels.
Executive-level employees increased by 2
percent, managers increased by 6 percent,
supervisors increased by 9 percent, and
rank-and-file employees increased by 2
percent.
We also hire project-based employees.
In 2016, there was a 4 percent increase
in their number, which has now reached a
total of 335 project-based employees.
Meanwhile, the number of our indirect
employees – consisting of security,
maintenance and housekeeping personnel,
drivers, and other administrative staff hired
through a third-party agency – increased by
8 percent in 2016.
Breakdown of Permanent Employees
Indirect Employees
54
57
58
2014
2015
2016
258
288
304
Executive Manager Supervisor
373
368
401
Rank-and-file
1,386
1,434
1,466
16
19
19
2014
2015
2016
116
116
132
Maintenance Personnel
Drivers Housekeeping Personnel
149
158
178
Others
12
13
13
2014
2015
2016
2,071
2,147
2,229
Permanent Project-based
315
323
335
Composition by Employee Type
Security
307
311
322

111 110
Collective Bargaining Agreement
The percentage of employees covered by
collective bargaining agreement is 75.33
percent in 2016.
employees covered by
collective bargaining
agreement75.33%
T R A I N I N G A N D D E V E L O P M E N T404-1
We focus on four areas for competency
development. First, we prioritize programs
based on how they will favorably impact our
business efficiency, service obligation, and
business development targets. Second, we
develop internal trainers or coaches who
are responsible for providing development
programs for their respective teams. Third, we
have put in place a senior-level management
program to ensure leadership succession.
Finally, we report return investments and use
these as leverage in justifying an appropriate
budget to sustain the company’s training
needs.
For this reporting year, we trained a total of
1,269 employees and 222 service providers,
reaching a cumulative total of 69,639 training
hours in 2016. Our average training hours
decreased due to our increasing number
of employees. We aimed to reach 3,753
participants in trainings conducted in 2016 and
managed to attract 6,241 participants, 166%
higher than our target.
Average Training Hours*
77.9468.0965.67
2014
2015
2016
55.4048.4450.59
Executive Manager
Supervisor
32.30
34.13
40.65
Rank-and-file
11.67
15.18
22.5
2014
2015
2016
102-41
102-48
* The average training hours in 2014 and 2015 were corrected from the previous Sustainability Reports due to a
change in calculation.
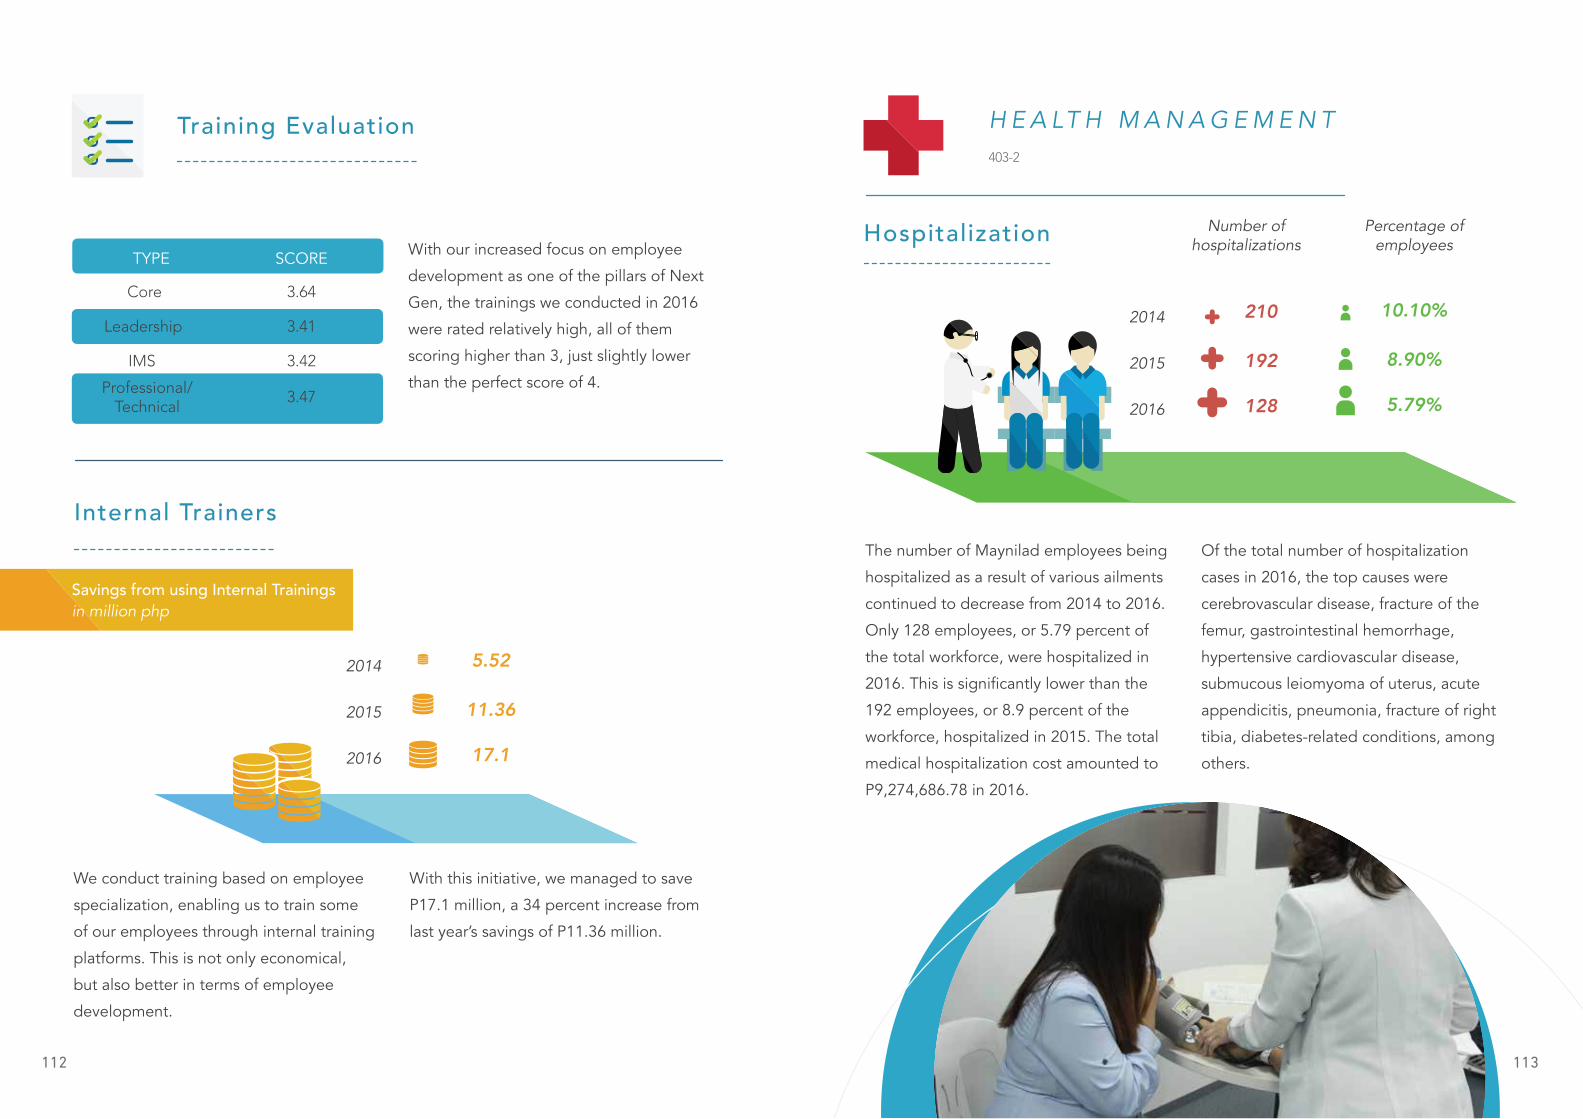
113 112
Training Evaluation
With our increased focus on employee
development as one of the pillars of Next
Gen, the trainings we conducted in 2016
were rated relatively high, all of them
scoring higher than 3, just slightly lower
than the perfect score of 4.
We conduct training based on employee
specialization, enabling us to train some
of our employees through internal training
platforms. This is not only economical,
but also better in terms of employee
development.
With this initiative, we managed to save
P17.1 million, a 34 percent increase from
last year’s savings of P11.36 million.
Internal Trainers
TYPE SCORE
Core
Leadership
IMS
Professional/Technical
3.64
3.41
3.42
3.47
2014
2015
2016
5.52
11.36
17.1
Savings from using Internal Trainings in million php
H E A LT H M A N A G E M E N T403-2
Hospitalization
The number of Maynilad employees being
hospitalized as a result of various ailments
continued to decrease from 2014 to 2016.
Only 128 employees, or 5.79 percent of
the total workforce, were hospitalized in
2016. This is significantly lower than the
192 employees, or 8.9 percent of the
workforce, hospitalized in 2015. The total
medical hospitalization cost amounted to
P9,274,686.78 in 2016.
Of the total number of hospitalization
cases in 2016, the top causes were
cerebrovascular disease, fracture of the
femur, gastrointestinal hemorrhage,
hypertensive cardiovascular disease,
submucous leiomyoma of uterus, acute
appendicitis, pneumonia, fracture of right
tibia, diabetes-related conditions, among
others.
2014
2015
2016
210
192
128
Number of hospitalizations
Percentage of employees
10.10%
8.90%
5.79%

115 114
Health Management Programs
Weight Loss Challenge
We launched our first company-wide
weight loss challenge program in 2016 to
encourage overweight or obese employees
to lose their excess pounds. The program
aims to help all our employees reduce
their risk of developing lifestyle-associated
diseases and prevent further complications.
On its first year, 478 employees
participated in the program, resulting in a
26.38 percent reduction of overweight staff
members.
Full Implementation of Online Pharmacy
We fully implemented our online pharmacy
program in 2016. This new program aims to
provide easy access to cheaper medicines
reduction of
overweight/obese
employees26.38%
Php worth of savings119,734.60
Enhanced Vaccination Program
After the company successfully negotiated
a significant discount of 54.62 percent on
various vaccines, we observed a much higher
enrollment rate for employees and their
dependents under this preventive medicine
program. As such, our enhanced vaccination
program is expected to significantly reduce
cases of communicable diseases, which may
lead to more serious complications that may
require hospitalization. Medical expense and
absenteeism are likewise expected to be
reduced as a result of this proactive approach
to healthcare.
To improve the productivity of employees
exposed to certain biological agents, we
provide them with free vaccination that will
prevent them from harboring the disease. We
vaccinated 90 percent of employees at risk
of hepatitis A and 84.92 and 90.69 percent
of those at high risk of rabies and tetanus,
respectively.
Because of our enhanced vaccination
program, there were no cases of rabies,
tetanus, or hepatitis A in 2016. There
were only six cases of flu and 65 cases of
pneumonia in the previous year.
Oral Cavity Reduction Program
This program aims to educate employees
on the importance of oral health. Our
goal is to boost employee confidence
through proper oral healthcare, while
simultaneously preventing serious dental-
related conditions among our ranks even
before such ailments arise.
For this year, 71 percent of our employees
availed of oral prophylaxis and 93 percent
sought dental treatments or consultations.
These procedures enabled us to achieve
zero instances of cavities for 25 percent of
our employees.
E - PHARMACY
to our employees and their dependents,
aside from maximizing treatment
interventions for those who already require
maintenance medication for chronic
diseases. We managed to provide savings
of P119,734.60 through discounts on some
medicines and health products, as well as
through promotional initiatives.

117 116
Improved Employee Health
Education and Awareness
Believing that prevention is always better
than finding a cure, we improved our
employee health education and awareness
through company-wide health forums and
road shows, employee health exemplars
bulletins, medical and dental bulletins, and
features in our Ripples magazine.
Annual Physical Examination and
Random Drug Testing
Required by the Department of Labor and
Employment, both tests are in compliance
with our existing policies. In 2016, we
had a 99.45 percent compliance for the
annual physical examination (APE) and
99.12 percent compliance for random drug
testing (RDT).
Five employees confirmed positive, two
of whom resigned; the remaining three
successfully completed rehabilitation and
have since returned to work.
Voluntary Blood Donation
As part of our corporate social
responsibility program, we conducted
six blood-letting activities in three areas,
collecting blood donations from 264 of our
employees.
Through this drive, we were able to assist
the medical needs of 16 employees and
their dependents, aside from making more
blood donations available to the general
public.
Chemical Hazard Surveillance
and Audiometry
These occupational health programs
are provided to our employees who are
exposed to both chemical and physical
hazards. These monitor their level of
exposure so that early appropriate
interventions, if necessary, are already
administered.
All or 100 percent of our employees
exposed to chemicals were found to be
negative for chemicals nearing the toxic
threshold. We also registered a 100 percent
compliance for audiometry with subsequent
referrals for evaluation of an Ear-Nose-
Throat (ENT) specialist.
AUDIOMETRY 2016 FREQUENCY
CNRW
WATER NETWORK
WATER PRODUCTION(Putatan)
WATER PRODUCTION(La Mesa)
Every year
Every year
Every year
Every 2 year
HEAVY METAL ANALYSIS 2016
METALS
Water Production(La Mesa and Putatan)
Central Lab
Aluminum
Lead
LAST DONE
May 2016
Sept 2016
August 2016
August 2016
NO. OF EMPLOYEES
72
50
78
56
ManganeseMercuryArsenic
CadmiumChromium
CadmiumArsenic
ChromiumMercury
FREQUENCY
Every 5 years
Every year
Every 2 years
LAST DONE
May 2015
May 2015
May 2015May 2015May 2015May 2015May 2015
May 2015May 2015May 2015May 2015
NO. OF EMPLOYEES
42
3
2219113
1133

119 118
O R G A N I Z AT I O N A L D E V E L O P M E N T
In 2016, we formalized a succession
planning system which categorically
identifies and classifies potential successors
into three groups: those who are ready
immediately, those who will be ready in 1
to 2 years, and those who will be ready in 3
to 5 years.
The potential successors who have been
identified were then assessed by their
superiors, customers, subordinates, and
peers in terms of perceived leadership and
performance.
The results were then combined with
their performance ratings to arrive at an
aggregate score for each candidate.
A development program that combines
classroom training with cross-functional
assignment and project management
will then be launched to enhance the
leadership and management skills of
our candidates. The number of ready
successors by the end of the development
program will be measured to evaluate the
effectiveness of the system.
Succession PlanningMON TUES WED
Health Support Clubs
This program particularly caters to our
hypertensive and diabetic employees to
maximize treatment interventions.
It also aims to educate and prevent further
complications or hospitalizations.
NO. OF INTERNAL PROMOTION TO KEY ROLES
AVP
Senior Manager
Junior Manager
Assistant Manager
8
28
1
28

121 120
Customer Experience Boot Camp
Integral to our concession agreement with
MWSS are service obligations that we have
to comply with and adhere to consistently.
While we are religiously complying with all
the obligations provided in the agreement,
the Business Operations Group, led by
Christopher Lichauco, believe that the
company can still improve its performance
using stricter internal standards.
Beyond compliance to the agreement,
sound observations and relevant data
indeed showed that we can still enhance
our performance to reach greater
customer satisfaction. Hence, the Business
Area Operations partnered with our
Human Resources department to design
and organize the Maynilad Customer
Experience Boot Camp with the goal
of improving our customer experience
through stronger collaborative efforts
across divisions.
As Next Gen’s emphasis is on customer
service, this is a clear and promising step
forward for Maynilad in achieving our goals.
Boot Camp Highlights
Ten cross-functional groups (composed
of employees from different divisions and
ranks) were formed to address the current
issues we are facing. All groups participated
in a teambuilding activity together with Top
Management Teams (TMT) and facilitator
Yeyette Albert to simulate how the different
functions could collaborate to produce a
more satisfying customer experience.
As an incubation period, the participants
were then given one and a half months
to discuss and work on solutions and
recommendations for their assigned issues.
These were then presented to the TMT for
approval and implementation.
In addition, the Boot Camp organized a
conference that featured companies with
excellent customer service. Donnie Tantoco
of Rustan’s Supermarket, Ana David of
Security Bank, and Irene Isleta of St. Luke’s
Medical Center shared their company best
practices with the attendees.

123 122
We achieved a productivity index
(manpower per thousand connections ratio)
of 1.70, which surpassed our base yearly
target of 2.1.
Even with this high efficiency index, we
still seek to further encourage innovation
among our employees through various
initiatives, such as the annual Innofest
Program. This competition showcases the
most innovative ideas from our employees;
it also serves as our platform to recognize
and reward brilliant, homegrown concepts.
For three years now, this competition has
received some 190 innovation entries from
more than 300 employees.
I N C R E A S I N G W O R K P L A C E E F F I C I E N C Y
E N C O U R A G I N G I N N O V AT I O N
productivity index1.70
In 2016, two grand winners of the Innofest
Program were chosen out of ten finalist
teams. The Let’s Vault in Team won with
their Lego Vault, a lightweight, heavy-
duty chamber made from special steel
that is quicker to install than conventional
concrete chambers, along with the
Wave Team, which conceptualized a
Watertight Air Valve Enclosure, or WAVE, a
maintenance-free enclosure for protecting
air valves. Both ideas were developed to
minimize public inconvenience while still
performing Maynilad’s operations.
The members of the two winning teams
received an all-expense paid trip to
Singapore along with new iPad Air 2. The
eight other team finalists, meanwhile, were
treated to a trip to Cagayan De Oro.

125 124
Maynilad had a total of 322 security
personnel in 2016. We make sure that
they are well-equipped with the proper
skills through various trainings in character
development, drills and formations, and
roles and responsibilities on physical
security system, basic investigation
procedures, and gun safety and firearms
handling.
S E C U R I T Y
security personnel
322
The safety of all our employees will
always be a top concern for Maynilad’s
management. As a testament to this
commitment, we are proud to report a total
of 4,208,092 MHNLTA (Man Hour No Lost
Time Accidents) for this year. This puts us
at a total of 21,846,919 hours by end of
2016, from a 2015 year-end MHNLTA of
17,638,827 hours.
In 2016, we inspected a total of 560
projects, 382 of which had no violations.
We also inspected 86 facilities, conducted
51 emergency preparedness and response
S A F E T Y
cumulative MHNLTA
21,846,919
drills, and performed 106 work environment
measurement (WEM) audits. An accident/
incident comparison between 2015 and
2016 showed that less workplace and
vehicular accidents occurred during this
reporting year.
* For 2015, the MHNLTA is 4,019,264 hours and the total as of year-end is 17,638,827 hours.
102-48, 403-2

127 126
It is in our best interest as a public utility to
empower our stakeholders by enhancing
mechanisms for social inclusion. We
therefore strive to continuously expand
the benefits of our business operations by
including more communities and business
partners into the continuously growing
Maynilad family.
As we make our presence felt on a wider
scale, we also endeavor to enrich the
lives of more people, particularly those
EMBRACING MORE COMMUNITIES
who continue to live with limited clean
water and wastewater services, and those
who have yet to be part of the economic
mainstream.
We have sustained our collaborations in
and out of the company to advocate for
access to water, poverty alleviation, health,
youth empowerment, and environmental
responsibility. Our campaign in these
aspects have been instrumental in ensuring
business sustainability and strengthening
our brand of service that goes beyond
clean, reliable water.
Notably, 2016 was another momentous
year for us, as we successfully enabled
various Maynilad teams to engage different
customer segments; government officials,
including regulators and local government
leaders; marginalized communities,
particularly indigenous people and disaster
survivors; and various industry partners,
sister organizations, and advocacy groups.
203-2, 413-1

129 128
In 2016, we led the inauguration of STM-Riverview, the newest
Samahang Tubig Maynilad community in Quezon City. With our
assistance, an informal settler group composed of 60 families were
able to organize themselves into a cooperative-based organization
so they can effectively manage their own water system installed by
Maynilad.
Samahang Tubig Maynilad (STM)-Riverview
This year, we partnered yet again with social
business, Tubig Pag-asa, to end the dependence of
around 150 families on so-called “water syndicates”
that sell overpriced water at P30 to P35 per drum.
Last year, we carried out this program in Magtalhai
and Dinamita in Bacoor and we extended it
this year to Upper Sucat. We also constructed a
“ginhaWASHarea” or communal toilet-and-bath
facility to give residents easy access to a sanitation
facility while allowing us to properly collect the
community’s septage. Families benefiting from
these two schemes become legitimate Maynilad
customers and are also able to save P300 to P400
a month.
Pag-asa sa Patubig Partnership
W AT E R F O R T H E P O O R E M P O W E R I N G C O M M U N I T I E S
We continue to empower the Dumagat sculptors of Ipo Watershed
by supporting their works of art. After their mentorship under
artist Tata Raul Funilas and the success of the Sungka Series, these
talented Dumagats were tapped to create exquisite wine holders
that became part of Maynilad’s 2016 Christmas giveaways.
Sining Ipo

131 130
Each Habing Buhay (life weave) handcraft is made from water
lilies, woven by skilled members of the Laguna Bay community
surrounding Maynilad’s Putatan Water Treatment Plant.
This livelihood initiative enables Maynilad to turn water lilies from
a work nuisance into a source of wealth and artistry for some of
our partner communities. The lilies are harvested to improve the
quality of water for fishing activities and for treatment into drinking
water by Maynilad.
This also addresses the clogging of the plant’s intake facility due to
the overgrowth of water lilies.
Habing Buhay continues to provide additional income to
low-income families, weaving a stronger partnership among
stakeholders for a healthier and more sustainable Laguna Lake.
This year, the weavers underwent training under the DOST-Forest
Products Research and Development Institute in advanced water
lily crafts involving leathers, dyes, and more intricate patterns.
Habing Buhay
Kapwa, a Filipino word denoting the value of kinship or “being
one for the other,” is a line of hand and homecare products made
by the women of a community in Tondo, Manila, empowered by
Maynilad through the Samahang Tubig Maynilad (STM) program.
Maynilad helps in marketing and product development, while our
training partner, the DOST, teaches the members how to produce
their merchandise, consisting of hand (hand wash, lotion and
sanitizer) and homecare (detergent, all-purpose cleaner, fabric
conditioner, etc.) products. Through Kapwa, we saw the ability of a
livelihood project to empower women who used to rely solely on
the meager income of their husbands. The women of STM Tondo
now have a livelihood project that helps them make ends meet for
their families.
These women have now grown more assertive and closer to
each other, all because of Kapwa and the STM. The STM has also
uplifted the lives of low-income families who previously suffered
from waterborne illnesses and costly water rations.
Kapwa

133 132
We held the first Cooperative Management
Training for our social enterprise groups
(including some community-based water
associations) in 2016. The training series
covered the fundamentals of a cooperative,
including more particular management
skills like policy formulation and auditing.
Cooperative Management Training
D I S A S T E R R E S P O N S E
Ranging from fires to natural calamities, our
disaster response activities aim to directly
respond to challenges brought about
by such unfortunate events. We see the
importance of giving back even to those
who are not part of our concession area to
strengthen both our brand and the spirit of
humanitarianism among our people.
In 2016, we and our Business Areas
responded to at least 12 fire incidents by
providing much-needed water to affected
communities. The amount of water
contributed amounted to around P560,000.
Bacoorenong Mandaragat Games
We celebrated Bacoor City’s 345th
founding anniversary with the 3rd
Mandaragat Games in 2016. Maynilad
and the Mamamayan Para sa Lambat at
Dagat Cooperative conceptualized the
annual games to promote the livelihood of
Bacoor’s poor fisherfolk and engage coastal
communities to help in cleaning up Bacoor
Bay, the southern inlet of Manila Bay. The
2016 Mandaragat Games included de-
motor/de-sagwan boat races, horizontal/
vertical palosebo sa tubig, tagisang-hatak
sa baybayin, and a shellfish cook-off.
We also partnered with the MVP CSR
Council in conducting relief efforts by
providing food packs in El Niño-stricken
areas in Mindanao. Among the areas we
covered are Kidapawan City in North
Cotabato, where we helped 1,029 families;
M’lang in North Cotabato with 100 families;
President Roxas in North Cotabato with 160
families; and Arakan in North Cotabato with
650 families.
Our Mission Ginhawa team, comprised
of Advocacy and WSO personnel, went
to Kalinga-Apayao, Tuguegarao and
Peñablanca, Cagayan to bring water relief
and teach Lawin-hit communities how
to use the 300 water filters donated by
Maynilad.

135 134
C H A M P I O N E D W AT E R , H E A LT H A N D T H E E N V I R O N M E N T
With the support of our Parañaque Business Area and the
Parañaque City Government, Maynilad inaugurated 12 FAITH
(Food Always In The Home) Gardens. FAITH Gardens is a home
food security program that aims to provide a steady source of
fresh vegetables to Pantawid Pamilyang Pilipino Program (4Ps)
beneficiaries, senior citizens, and other marginalized groups in
the city. Under this partnership, we installed 260-gallon overhead
water tanks and drip irrigation systems and provided technical
assistance in setting up each community garden. We also
conducted Ginhawa Gardening Workshops to equip residents with
the right skills to start their own backyard gardens, with or without
a plot of land.
Faith Gardens and Ginhawa Gardening Workshops
Eight barangays were taught proper
hygiene practices, including ways to
properly clean water containers to prevent
dengue infestation in households. We also
distributed our award-winning Anti-Dengue
Mosquito trap—a simple, innovative, and
affordable way to fight dengue.
Anti-Dengue Campaign
The award-winning water education
program Daloy Dunong engaged more
than 14,000 elementary and high school
students on the importance of water, good
hygiene, and environmental responsibility.
Since its inception in 2012, Daloy Dunong
has visited more than 350 schools and
engaged 50 other various groups outside
campuses. In the process, close to 110,000
children have been converted into “Water
Warriors” or young champions for water,
health, and the environment.
Daloy Dunong

137 136
Lingkod Eskwela gave more students access to potable water by
installing drink-wash facilities in the most populous and resource-
deficient public schools in the West Zone. The initiative also
served as a relationship-building tool for the Business Areas. The
project, which installed drink-wash areas in 44 public schools, was
inaugurated at the Polytechnic University of the Philippines in
collaboration with the Business Areas and Business Operations and
Central Services – Revenue Enhancement Management.
Lingkod Eskwela Drink-Wash Areas
In support of the Brigada Eskwela program
of the Department of Education (DepEd), we
sent employee-volunteers to help refurbish
classrooms and upgrade water and sanitation
facilities in 30 public schools throughout our
concession area.
We kicked off our participation in the program
with the installation of a new drink-wash
station and bidets at the Parañaque National
High School. Our employee-volunteers also
replaced busted faucets and flushes to make
these operational in time for the opening of
classes. We also presented our back-to-school
preparations to DepEd’s Oplan Balik Eskwela
Command Conference, an inter-agency group
formed to ensure an orderly school opening.
Brigada Eskwela
Signing of the Earth Day 2016 Covenant
We joined leaders from various government agencies, civil society
groups, and the private sector in signing the Philippine Earth Day
2016 Covenant last April 22, 2016. The covenant established the
Philippines’ support to the Paris Agreement, adopted during the 21st
United Nations Framework Convention on Climate Change (UNFCCC)
Conference of Parties.
Zapote River Festival
We supported the Villar Sipag Foundation’s week-long
commemoration of the Battle of Zapote Bridge in Las Piñas City. As
a long-time partner of the foundation, we supported key events,
including the February 13 kick-off program, an inter-school street
band competition, the 2nd Las Piñas Run, and the inauguration of the
Zapote River Drive.

139 138
GinhaWASH
In addition to the hospitals, health centers, and barangay halls that
GinhaWASH helped last year, bidets and drinking fountains were also
installed in select public schools and government establishments this
year to reinforce good hygiene among school children. Ten drinking
fountains were also installed in transport terminals, including six LRT
stations, for the benefit of commuters. We believe that the program will
help emphasize ideal hygienic practices that the beneficiaries will be
able to practice in their own homes.
DepEd WinS Policy
Along with UNICEF and other local and international NGOs, Maynilad
formed part of the committee that would strengthen DepEd’s Policy
and Guidelines for the Comprehensive Water, Sanitation and Hygiene
in Schools (WinS) Program. This shows how we have become a major
influencer in establishing W.A.S.H. strategies in and out of the West
Zone.
Wastewater Education Module
True to our corporate slogan of delivering service beyond water, we
piloted the implementation of our Wastewater Education Module in high
schools located in areas affected by our Wastewater Expansion Program,
mainly the San Juan River Basin. Covering steps in the urban water cycle,
this module is a light alternative for teaching students to draw practical
solutions on wastewater management from their own experience.

141 140
Manila Bay Sunset Partnership
We joined Land Bank of the Philippines and 21 other institutional
partners in keeping Manila Bay clean to protect its remaining coastal
resources. More than 70 volunteer employees joined in the coastal
cleanup, adopted esteros for cleanup, and made mudballs, which help
improve the water quality in Manila Bay.
Water Warrior Ultimate Frisbee Clinics
Our employee coaches taught ultimate Frisbee to some 200 youth from
poor families in 10 communities. The initiative also served as a vehicle
for us to update barangay officials and customers on ongoing service
concerns in their areas.
Marathons and Sports Sponsorships
To promote a healthy and active lifestyle, we continued to support
sports programs like marathons, golf tournaments, and basketball
leagues through sponsorships, hydration support, and training
programs.

143 142
F O R G I N G I N S T I T U T I O N A L PA R T N E R S H I P S
World Water Day 2016: Water and Jobs
Eighteen exemplary individuals and organizations were
awarded during the 2nd World Water Day (WWD)
Awards, led by Maynilad in partnership with the
NWRB. Maynilad established the awards to recognize
champions who have significantly promoted water
and environment sustainability, as well as to inspire
Filipinos to make a difference through environmental
stewardship and greater access to clean water.
Aside from the awards, we also led several WWD-
related activities, including an inter-agency sungka
tournament, participated in by more than 30
government and private organizations, and the WWD
Run for Water, joined by some 1,500 runners. The run,
which we co-led with the Department of Interior and
Local Government, highlights the need to strengthen
collaboration among agencies and organizations to
fast-track the national water and environmental agenda.
Sungka is a Filipino game of strategy, where players
compete for marbles that go to corresponding holes
while protecting one’s “home” from running out
of marbles or occupants. Sungka evokes resource
management and the need to foster
strategic partnerships among stakeholders
(the WWD partners) in their common
interest to preserve Ipo Watershed. Among
these stakeholders are the indigenous
Dumagats (the sungka blocks used in the
tournament are shaped out of driftwood
by Dumagat sculptors from Ipo Watershed
under the Sining Ipo livelihood program).
The principles of the game echo the
efforts of Maynilad and our indigenous
brothers and sisters to protect Ipo, the
source of drinking water for millions of
people. This underscores the importance
of collaboration in the responsible
management of a finite and crucial resource
such as water, an imperative underscored
every year during World Water Day.
Further, Maynilad led other WWD events
such as mangrove-planting activities in
Kawit and Noveleta, Cavite, as well as a
Kids Foam Bath hygiene awareness drive in
Bacoor, Cavite together with Tubig Pag-asa
and Water and Life Philippines.
Together with the Palayan Water District
and Baler Water District, we were also
tapped by the Local Water Utilities
Administration to conduct teaching
sessions to more than 500 elementary
school children in Baler Central School.
The activity sought to address the need for
water education and sanitation in Typhoon
Lando-struck Aurora province.

145 144
Global Handwashing Day
To stress the importance of good health and
proper hygiene, we joined the observance of the
annual Global Handwashing Day in October 15,
an international advocacy to promote the value of
handwashing with clean water and soap. In celebrating
the event, we visited seven schools and one depressed
community to teach some 2,000 school children the
proper steps in handwashing and the value of water
through fun, engaging water-themed activities.
O U T R E A C H E S
Ipo Elementary School Computer Lab
We joined the inauguration of the MVP Computer Laboratory at Ipo
Elementary School, where more than half of the students are from
Dumagat families living in the Ipo Watershed. Pitching in equipment
and volunteer work to put up the 20-unit IT facility were DepEd,
PLDT-Smart Foundation, Manila North Tollways Corporation – North
Luzon Expressway, and the Technological Institute of the Philippines.
We garnered a total of 16 volunteer hours and provided 10 units and
a printer.
Community Outreach
In our continued efforts to help more
communities, we supported at least
12 other outreach activities in 2016,
organized by different partners,
including the MVP Group Paskong
Kapatid, as well as various medical
and dental missions.

147 146
E N G A G I N G O U R V E N D O R S
Contractors and suppliers are important
stakeholders and partners in our
operations. Contractors provide various
infrastructure and maintenance services,
while suppliers provide office supplies,
equipment and logistical services.
We persistently seek to influence our
vendors toward improved sustainability
practices. We engage them in a quarterly
general assembly for policy updating and
to inform them of upcoming projects. We
also conduct performance evaluations;
failure in these evaluations would mean
suspensions for three to six months.
A contractor’s handbook was also created
to guide vendors in doing business with
Maynilad.
To recognize those who meet our strict
performance standards, we hold the
annual Top Achievement for Partners (TAP)
Awards. Now on its sixth year, the TAP
Awards have continuously sustained the
excellent performance among suppliers,
contractors, and consultants who contribute
in our continued service improvements in
the West Zone.
We also help vitalize the local economy
by choosing local vendors over their
foreign counterparts. Most of our supplies
are procured from 383 local suppliers,
representing 98.71 percent of our total
number of accredited suppliers. All of our
56 contractors accredited in 2016 are also
local, and their engagement with Maynilad
has generated a total of 24,288 jobs in the
same year.
Our Supply Chain
Two main components of our supply
chain have substantial impacts on the
environment and society. These are pipe-
laying and rehabilitation works to supply
water and enhance existing services to
our customers, and our sanitation services
which removes sewage and septage from
our customers’ homes.
In order to start laying or rehabilitating
pipes, we have to obtain necessary permits
from the government and inform the
community at large as these would have
environmental impacts such as dust and
noise pollution, as well as social impacts
such as traffic, safety risks, and possible
interruptions to the operations of adjacent
businesses. To limit these impacts, we
put safeguards in place. Our suppliers
follow strict procedures such as placing
board-ups, lights, and signages as well
as temporary restoration to make roads
passable during the day.
Our sanitation services also require the
same rigor. In putting up water reclamation
facilities, we acquire permits from the
government and also get the affected
communities’ approval. We have to assure
102-9, 308-2, 414-2
communities that concerns such as odor
from wastewater and biosolids are properly
mitigated. Biosolids are also hauled by
an accredited supplier for use as soil
conditioners. * In 2015, we had a total of 174 accredited suppliers, where 168 were local suppliers.
102-48, 204-1, 414-2

149 148
STRENGTHENING EFFECTIVE GOVERNANCE
Our leadership is driven by a strong
commitment to nation-building and a
vision of competing within the region in
accordance with our company values.
Our leadership team is unwavering in our
principles and skilled in their craft. With
them, we are heading towards becoming
one of the top water and wastewater
service providers in the Philippines and
in the broader Asia-Pacific region. Our
Board and Management Team have
proudly enabled us to consistently meet
performance targets for almost a decade.

151 150
B O A R D O F D I R E C T O R S405-1
Our Board of Directors is composed of
ten select individuals, eight of whom
are male and one female, with seven
Filipino and three Japanese nationals.
The responsibilities of the board include
the upholding of high ethical standards;
the continuous practice of fairness,
transparency, and accountability;
the alignment of the company with our
vision, mission, and the best interests
of our shareholders; and the guiding,
monitoring, and evaluation of Management
performance.
Manuel V. Pangilinan Chairman
Atty. Marilyn Victorio-Aquino
Director
Ramoncito S. Fernandez Director
Isidro A. Consunji Vice Chairman
Jose Ma. K. Lim Director
Kensuke Tatsukawa Director
Randolph T. Estrellado Director
Takeshi Kurioka Director
Manabu Sugawara Director
Jorge A. Consunji Director

153 152
Board Meetings
Aside from the six regular meetings
conducted annually, the Board of Directors
may gather for a special meeting upon the
call of the Chairman of the Board or upon
request of the majority of directors. These
meetings require strict attendance, both
for regular and special meetings, and are
always recorded. On the occasion that the
Chairman is unavailable, the President may
represent him and lead discussions on his
behalf.
Composition and Selection of the Board102-24
The members of our Board of Directors
are chosen using a special criterion by
the Nomination Committee. These nine
members are elected at the Annual
Stockholder’s meeting. To maintain an
unbiased space for decision-making, Board
memberships are either executive or non-
executive. Non-executive directors have
expertise and diverse experience equaling
the executive members and are fully able to
participate during Board discussions.
Avoidance of Conflict of Interest102-25
Any person with a reason for engagement
in a competing business with or against
the Corporation or any of its subsidiaries
or affiliates is considered unqualified to be
a member of the Board of Directors. The
Board considers the adoption of guidelines
on the number of directorships that its
members can hold in stock and non-stock
corporations, taking into consideration
the capacity of a director to diligently
and efficiently perform his or her duties
and responsibilities. The CEO and other
executives may be covered by a lower
indicative limit for membership in other
Boards. This also applies to independent
or non-executive directors serving as full-
time executives in other corporations.
This serves to maintain their integrity in
their performance and responsibilities as a
member of the Board.
Disclosure and Transparency
Because we believe that transparency
is one of the most important aspects
of corporate governance, we extend
greater effort in gaining the trust of the
Management, stockholders, and the
different people involved with Maynilad’s
work. All important information about our
company are reported to MPIC, DMCI,
Marubeni, MWSS, and other shareholders.
It is our duty to report any violation of our
Code of Business Ethics, and ensure that
risk measures are implemented in a timely
manner. Throughout the reporting process,
due diligence and confidentiality are strictly
observed.

155 154
G O V E R N A N C E S T R U C T U R E A N D C O M M I T T E E S
102-18, 102-24
Our Governing Committees support our
Board of Directors in the implementation
of their functions and responsibilities.
They provide through the designing and
developing of frameworks that the Board
uses in order to fulfill their objectives and
resolve appropriate issues and concerns.
Executive Committee
The Executive Committee is given
particular authorities by the Board of
Directors through a majority vote. The
members of the Executive Committee
are given a restricted power to decide on
key matters regarding management and
corporate affairs in the absence of the
Board, if the matters are urgent.
Risk and Audit Committee
The Risk and Audit Committee supports
the Board through checks and balances
and independent reviews. These help
in strategically developing Maynilad’s
policies on governance, risk management,
financial reporting and audits, information
technology, and security, in full compliance
with applicable internal and external laws,
rules and regulations.
Compensation and Remuneration Committee
The Compensation and Remuneration
Committee’s job is to determine the most
appropriate and equitable remuneration
of corporate officers and directors. The
Committee evaluates, reviews, and makes
recommendations based on accepted best
practices. It ensures that the compensation
provided is consistent with the Maynilad
culture, business strategy, and corporate
environment.
Nomination Committee
The Nomination Committee is responsible
for reviewing all candidates for positions
in our Board of Directors, including all
candidates to positions that specifically
warrant the Board’s approval. A minimum
of three members of the committee reviews
and evaluates nominees for qualification,
and ensures valid, fair, and effective
appointments.

157 156
O U R M A N A G E M E N T T E A M
Our Top Management Team is comprised
of trained and experienced professionals
working for the company’s inclusive growth.
Specific tasks are assigned to the team by
the Board of Directors with the expectation
of fulfilling them with the utmost
professionalism and expertise.
Ramoncito S. Fernandez
President and CEO
Randolph T. Estrellado COO and CFO
Christopher J. Lichauco Head, Business Area
Operations
John Patrick C. Gregorio
Head, Commercial & Marketing
Antonio F. Garcia Head, Wastewater
Management
Atty. Lourdes Marivic P. Espiritu
Head, Legal & Regulatory Affairs
Irineo L. Dimaano Head, Central Non-
Revenue Water
Francisco A. Arellano Head, Corporate
Quality, Environment, Safety & Health
Yolanda C. Lucas Head, Porgram Management
Arturo Celso D. Baranda
Head, Corporate Logistics
Francisco C. Castillo Head, Information
Technology Services
Eric J. Montes Head, Integrated Asset
Management
Mitchie M. Arcaina Head, Human
Resources
Marcos D. de Jesus Head, Technical
Services
Ronaldo C. Padua Head, Water Supply
Operations

159 158
E C O N O M I C V A L U E D I S T R I B U T I O N
102-7, 201-1
We fully support the UN’s SDG 8, which is
the promotion of decent work for all and
equitable economic growth.
We believe that inclusive growth enables
lasting development, so we seek to
transform our business into an engine
for the growth not only of our business
partners and shareholders, but also of the
larger community where we operate.
We accomplish this primarily by ensuring
that our business remains viable and
profitable, so we can continue to contribute
to public funds and enlarge the number
of employees and suppliers who stand to
benefit from our success.
In addition, we invest in corporate social
responsibility (CSR) programs that promote
market inclusivity and shared value
creation. We also support philanthropic
projects that improve the health and well-
being of our immediate communities.
Across all these programs, our Finance
Department ably assists the company in
allocating budgets, promptly processing
payments, compensating our employees,
and remitting taxes to the government.
F U N D M A N A G E M E N T H I G H L I G H T S102-7, 102-45, 201-1
In 2016, we generated P20.03 billion in
revenues, including receipts from other
fees and services, in 2016. This represents
a 6 percent increase in total revenues
compared in 2015.
Using GRI Standards in accounting for our
direct economic contribution to society,
we disbursed around P10 billion, or 50
percent of our revenues, as payments
or contributions to our key stakeholder
groups.
We paid 19 percent, or P5.88 billion, to our
suppliers. About 9 percent, or P1.80 billion,
was paid to loan providers as payment
for interests, while disbursements to our
shareholders are based on an equitable
profit-sharing scheme determined by the
Board. We released another 8 percent, or
P1.99 billion, to cover employee salaries
and benefits.
Meanwhile, our payments to the
government totaled P305.76 million,
9 percent higher than in 2015. This
includes disbursement for taxes, licenses
and regulatory costs. Our direct local
community investments, on the other hand,
amounted to P22.78 million.
Dividends and service concession payables
were at P2 billion and P1.21 billion,
respectively.
We reinvested the remaining 50 percent or
P10.03 billion of our consolidated revenue
to our company, not accounting dividends
and service concession fees.
These figures come from the annual
financial statement of Maynilad Water
Services, Inc. For more information, please
refer to our audited financial statements
found in our 2016 Annual Report.

161 160
E N T E R P R I S E R I S K M A N A G E M E N T
Using the ISO 31000 standards, we
identified our risks according to their
significance and likelihood and drew up
action points to mitigate them. The risks
were identified by the Enterprise Risk
Management Committee composed of
representatives from various Divisions of
Maynilad. The identified risks are reviewed
by the President and submitted to the
Board of Maynilad for discussion and
appropriate action by its Audit and Risk
Committee. The results of the process
are also shared with the Audit and Risk
Committee of the Board of MPIC.
The risks we identified have potential
significant impact to the sustainability of
our business and to the environment and
community that we operate in. The top five
risks for 2016 are regulatory risks, water
supply risk, natural calamities, chemical
supply, and financial risks.
Regulatory risks may result in penalties,
low tariffs, and non-achievement of service
obligation targets. To mitigate this, we
conduct regular review and monitoring
of compliance, submit requirements on
time, and seek MWSS approval on any
enhancement on system process and
design.
Water supply risk, on the other hand, is
the non-provision of water supply to our
customers on a 24/7 basis. This results in
customer complaints and non-compliance
with regulatory obligations. Often caused
by high turbidity levels in the WTPs
which affects the our’ normal production
levels, we mitigate this risk through our
enhancement plans for our WTPs such as
the resiliency plan for PWTP.
Next on the list are natural calamities that
can be caused by liquefaction, ground
subsidence, earthquakes, and flash floods
– threatening our operations and our ability
to provide quality service to our customers.
We are in the process of establishing our
Business Continuity Plan to manage this.
We have also conducted Probabilistic
Seismic Hazard Assessment for all Maynilad
facilities to evaluate our readiness for
earthquakes and reinforce our facilities as
needed.
Chemical supply risk refers to the non-
availability of chemicals needed for water
treatment and production which also affects
our ability to deliver water 24/7. This risk
is driven by inadequate forecasts, delayed
delivery of chemicals, limited storage, and
limited sources of chemicals. Mitigating this
includes continuous sourcing of suppliers
and entering into long-term contracts for
the procurement of major chemicals. The
construction of additional storage for 200
tonnes of liquid chlorine is also being done.
Financial risk is due to the non-adjustment
of tariff rates, non-implementation of
approved tariffs, and unprogrammed
expenditures in projects. In response, we
ensure adequate planning and review of
our CAPEX programs. For the tariffs, we are
undergoing arbitration, the results of which
are expected to come out in 2017.
102-11, 102-15

163 162
MOVING FORWARD
With the achievements we made in 2016
and Next Gen embodied within our
organization, we are confident that we will
make more significant strides in the years
to come.
We will continue to increase the
populations that we serve and seek out
novel markets that need our assistance.
All these will be achieved with our valued
customers and our service obligations to
them in mind.

165 164
N E X T G E N E R AT I O N
Maynilad Next Generation is a three-
year business strategy with the goal of
further improving our capability to meet
service obligations while increasing
enterprise value to USD 2.2 billion by
2018. The program has three pillars:
operational efficiency, business growth, and
organization and people development.
The first year’s objectives of the Next Gen
program includes informing the entire
Maynilad organization about the company’s
new strategic direction, encouraging the
employees to accept the change, and
challenging the employees to reach our
CAPEX disbursements for the year.
The Maynilad Next Gen “Organization
Transformation Group” or OTG is
responsible for ushering in this change.
The OTG’s primary task is to ease the
process of transformation. To ensure that
the entire organization supports the Next
Gen vision, the OTG conducted town
hall meetings, training and development
sessions, and group learning activities
that detailed how we can build on the
success of the past years and prepare the
organization for sustained growth. These
events also stressed the reasons why our
company will not be able to meet our
service obligations unless a new business
model is adopted.
Ultimately, Next Gen was formed from
the need to catch-up in our CAPEX
disbursements. With the target to sustain
growth, meet our service obligations, and
prepare ourselves for future challenges,
we conducted a thorough review of our
existing organizational structure to address
our gaps.
Operational Efficiency
We plan to intensify our efforts to meet
our comprehensive service obligations
for water, sewerage and sanitation,
and customer service. We established
a catch-up plan that would double our
average annual CAPEX spending. With
this in mind, we plan to hire, realign, and
develop more people to assume critical
roles and positions, particularly in areas
that require high technical proficiency and
specialization. We also plan to streamline
internal business processes and conduct
comprehensive risk assessments to ensure
that CAPEX spending is done prudently
and efficiently.

167 166
Business Growth
Nearing our 100 percent water coverage
within the West Zone, we are looking to
expand our reach to local and international
markets through a strong partnership with
our sister company, Metro Pacific Water
Investments Corporation. This partnership
opens opportunities for new business
ventures in the form of water solution
products and services that we continuously
develop and innovate. With this, we are
looking to soon expand to various business
areas specific to Bulacan, Cavite, Laguna,
and Bicol.
Organization and People Development
The last pillar of Next Gen is the primary
driver of the program itself. With a focus
on employee development, we are
accelerating organization and people
development initiatives to boost our
capability to meet set goals and targets.
To do this, we are reorganizing and creating
several Maynilad offices to ensure focus
and alignment of functions. We are also
creating synergy within and among the
different business units along with our
major people development and people
management initiatives to complement
each other.
Among these changes are the re-
integration of BA-NRW technical teams
into the business areas; the reorganization
of the Program Management Division; the
centralization of all procurement functions
under the Logistics Division; the creation of
the Integrated Asset Management Division;
the creation of the Business Development
Project Managers positions; the creation
of the Government Relations Department
under Commercial and Marketing; creation
of the Systems, Process, and Methods
Department under Corporate QESH; the
transfer of the Internal Audit Department
to the Office of the President; the transfer
of the Administration Department to
the Human Resources Division; and the
transfer of the Maynilad Water Academy to
Commercial and Marketing.

169 168
Impacts
Next Gen’s impacts on specific
departments are seen through changes in
their operations and their targets and key
performance indicators. In the case of the
Business Area Operations Department,
there is a shift from revenue and billed
volume to a more customer-centric
mindset. This shift in focus is executed by
migrating the customer service information
system to the workflow management
system to better monitor the new water
service applications and customer
concerns.
Strategic relationship management is also
provided by the Key Accounts Relations
Department to better know our customers,
understand their needs, develop customer
intimacy, and foster trust. In terms of
targets and key performance indicators
(KPIs), the shift to a more customer centric
approach can be seen by focusing on
customer service KPIs and maintaining
customer response and resolutions above
targets.
I N F R A S T R U C T U R E P R O J E C T I N V E S T M E N T S
To enhance the water supply and pressure
in the West Zone, we have earmarked
around P9.2 billion – or more than half of
our 2017 CAPEX – for water infrastructure
projects. This budget covers infrastructure
that impact both our water source and
delivery programs, and our wastewater
management projects.
Over P4.2 billion will cover improvement
works upstream, from our La Mesa and
Putatan Water Treatment Plants, pumping
stations and reservoirs, to installation
works for our service expansion, and
enhancements of Common Purpose
Facilities (CPF) in the Bigte Basins, La Mesa
Aqueduct and Ipo Dam. From this, P4
billion is slated for the NRW Management
and Service Expansion Program.
On the other hand, P5 billion will cover our
wastewater management projects, which
includes the increase of our sewerage
coverage and maintenance of our
compliance with environmental standards.
In particular, this amount will support
our construction of a new WRF and its
accompanying conveyance system in Las
Piñas.
Aside from these 2017 project investments,
we are also expecting to reap the benefits
of our earlier investments, such as the
development of the sewerage systems in
Valenzuela and Muntinlupa. These projects
are covered by our World Bank loan to
help us accelerate the development of
sanitation infrastructure in Metro Manila.
The Valenzuela WRF, with its 60 MLD
design capacity, will begin operations by
January 2018 and will treat the wastewater
discharges of over 300,000 people in
Valenzuela City. On the other hand, the
Tunasan WRF in Muntinlupa City, with
a 20 MLD design capacity, will begin
operations in September 2018 and will
serve approximately 92,000 customers in
Barangay Tunasan. Set to provide efficient
and high-quality treatment that will meet
effluent standards, these new facilities will
improve the quality of our receiving bodies
of water and reduce incidence of water-
borne diseases in the West concession area
by 2021.

171 170
TOPIC RELATED GRI DISCLOSURE
201-1L O W E R N R W
M O R E W AT E R C O N N E C T I O N S A N D S E W E R A G E S E R V I C E S
201-1
203-2
416-2
S E C U R E D W AT E R B O D I E S F O R S O U R C I N G A N D R E C E I V I N G
303-1
303-2
303-3
304-1
MATERIAL TOPIC AND ITS BOUNDARY
304-2
306-1
306-5
102-46, 102-47
WHY IT IS MATERIAL AND OUR INVOLVEMENT
BOUNDARY
This is material within our company
and to our customers in the West
Zone of Metro Manila and other
adjacent provinces.
Lowering non-revenue water is important as it
addresses water loss, thereby increasing the
actual metered water used by customers and
adds to our revenue. It also aids in decreasing
the amount of water withdrawn daily as water
needs are addressed.
This is material within our company,
our government regulating
body, and communities/potential
customers as we add more water
connections.
This is material within our company,
the government regulators, our
industry and CSO partners, and
communities around our water
sources and receiving water bodies.
It is part of our concession agreement with the
government to give safe water and sewerage
services to our concession area and address
the needs of communities. This will also further
increase the economic value that we generate.
Water is our primary resource and protecting
and securing its sources is of utmost
importance. The effluents that we discharge
should also be within standards to conserve
the remaining of the ecology of the receiving
water bodies.
102-46, 102-47

173 172
TOPIC RELATED GRI DISCLOSURE
401-1
403-2
404-1
405-1
406-1
407-1
S K I L L E D A N D E N G A G E D W O R K F O R C E
L O W E C O L O G I C A L F O O T P R I N T
301-1
302-1
302-3
305-1
305-2
S O C I A L I N C L U S I O N 204-1
413-1
414-2
305-4
306-2
306-4
307-1
308-2
WHY IT IS MATERIAL AND OUR INVOLVEMENT
BOUNDARY
This is material within our company
and our employees.
Our employees are our partners in delivering
services to our customers. A skilled and
engaged workforce better ensures low
turnover rates, excellent services and
operations, and the living out of our
values. We also guarantee the safety of our
employees, both from occupational hazards
and from discrimination. Our employees
are also free to create unions and bargain
collectively.
This is material within our company,
our government regulators, our
suppliers, and communities.
This is material within our company,
our government regulators, our
suppliers, and communities.
As a responsible company that relies on
the environment for the sustainability of our
business, we endeavor to keep our ecological
footprint low and within environmental
standards. This involves managing our solid
wastes, hazardous wastes, water use, energy
use, and greenhouse gas emissions. We also
influence our suppliers to be mindful of their
environmental impacts.
We are tasked to provide services to everyone
in our concession area with various economic
backgrounds. We provide special rates for
lower income customers and also engage the
communities we are located in to further know
their needs and build better relationships.
We also influence our suppliers to be socially
responsible and minimize social impacts.
102-46, 102-47 102-46, 102-47

175 174
ANNEX
Annex A: Raw Water Quality Results
mg/
L
01
2
345678
Angat Downstream Putatan Raw
Value
PNSDW Limits
DISSOLVED OXYGEN
mg/
L
010
20
304050607080
Angat Downstream Putatan Raw
Value
PNSDW Limits
TOTAL SUSPENDED SOLIDS
90
MPN
/100
ml
02000
4000
600080009000100001200014000
Angat Downstream Putatan Raw
Value
PNSDW Limits
FECAL COLIFORM
Angat Downstream Putatan Raw
Value
PNSDW
Lower Limit
PH
01
2
3456789
PNSDW
Upper Limit

177 176
Annex B: Finished Water Quality ResultsM
PN/1
00 m
L
0.940.96
0.98
11.021.041.061.081.1
LMTP 1 Putatan
2016
PNSDW Limits
TOTAL COLIFORM
1.12
LMTP 2
LMTP 1 Putatan
PH
LMTP 2
01
2
3456789
Value
PNSDW
Lower Limit
PNSDW
Upper Limit
AC
U
02
4
681012
LMTP 1 Putatan
2016
PNSDW Limits
COLOR
LMTP 2
TURBIDITY
NTU
01
2
3456
LMTP 1 Putatan
2016
PNSDW Limits
LMTP 2
HARDNESS
mg/
L
050
100
150200250300350
LMTP 1 Putatan
2016
PNSDW Limits
LMTP 2

179 178
Annex C: Water Coverage per Municipality
City / Municipality Water coverage2016 Water Covered
Population (Unconstrained)
% coverage
NCR
Manila 1,899,990 128.4%
Quezon City 2,523,937 124.2%
Caloocan 1,752,084 109.1%
Malabon 356,034 104.8%
Navotas 221,696 83.0%
Valenzuela 756,904 122.5%
Las Piñas 782,121 128.6%
Makati 101,847 186.1%
Muntinlupa 455,952 89.6%
Parañaque 907,682 137.2%
Pasay City 528,381 138.3%
Cavite Province
Bacoor 380,105 60.4%
Cavite City 106,367 108.6%
Imus 240,515 64.7%
Kawit 65,572 70.8%
Noveleta 30,223 61.1%
Rosario 55,827 62.1%
Total 11,165,236 112.9%
Annex D: Status of Deep Wells
Location Q (m3/hr) Status DistrictBagong Silang Phase 10 Deepwell Station 4.17 Standby North District
Bagong Silang Phase 9 Deepwell Station 4.58 Standby North District
Goodwill Deepwell Station 30.42 Standby North District
Remarville Deepwell Station 26.25 Standby North District
Rockville 2 Deepwell Station 27.1 Standby North District
Tanada Deepwell Station 46 Standby North District
Rainbow 10.83 Standby North District
J. Felipe Deepwell Station 28.85 Standby South Cavite
Malagasang 2D Deepwell Station 60.78 Active South Cavite
Molino Deepwell Station 40 Standby South Cavite
New Crescini Deepwell Station 52 Standby South Cavite
New NWF4 Deepwell Station 75.8 Standby South Cavite
Pandawan Deepwell Station 47 Active South Cavite
Poblacion Deepwell Station 36 Active South Cavite
Rivero Deepwell Station 32.08 Standby South Cavite
Imus Deepwell Station 30 Inactive South Cavite
San Nicolas Deepwell Station 12 Inactive South Cavite
NWF1 Deepwell Station 41 Inactive South Cavite
NWF2 Deepwell Station No Data Inactive South Cavite
NWF3 Deepwell Station 33.75 Inactive South Cavite
Georosville Deepwell 42.08 Inactive South Cavite
Aav R229B Deepwell Station 79.5 Standby South Putatan
ASV3 Deepwell Station 26.8 Active South Putatan
ASV4 St Jude Deepwell Station 26.8 Active South Putatan
Sonera 1 Deepwell Station To Check Standby South Putatan
Mutual 1 Deepwell No Data Inactive South Putatan

181 180
Annex E: Planting Partners in 2016
Participants Number of Participants/VolunteersMangrove
Air Force 15th SW, DENR PENRO-Cavite, Maynilad
53
GMA7, PNP Maritime, DENR PENRO-Cavite, Maynilad
78
JCI Manilena, BJMP, PCG/CGS Cavite, DENR PENRO-Cavite, Maynilad
93
The Bodyshop, DENR PENRO – Cavite, Maynilad
53
DENR PENRO-Cavite, Maynilad 71
Ipo
Judge Juan Luna HS – Batch 1991, Maynilad
36
DENR PENRO – Bulacan, NCIP, Ms. Earth Foundation, Maynilad
155
TV5 and Alagang Kapatid Foundation, Maynilad
76
APO Fraternity, Maynilad 86
Baesa Seventh-Day Adventist Church, Maynilad
95
Safety Organization of the Philippines, Maynilad
71
Dumagat Community 26
Maynilad (WSO Division) 67
Clean Pacific, Maynilad 65
Maynilad (TSD Division) 57
Maynilad, UP-IBA, MC-IBA, UP Green League
52
Maynilad (BA-NRW) 78
Maynilad, Gold Link 129
Maynilad, DOLE-NCR, Mabuhay Vinyl Corp. 65
Maynilad (CQESH, WMD), Philippine Dental Association
129
Annex F: Water Reclamation Facilities
Facility Technology Capacity (cubic meter/day)
Receiving body of water
Operational pe-riod/Status
Dagat-dagatan Sewage and Septage Treatment Plant
Waste Stabilization Pond (Conventional Lagoon System) / Dewatering (Screw Press)
26,000 / 450
Maypajo Creek *Turned-over facility from MWSS; Rehabililtated in 2004-2005
Alabang WRF Conventional Activated Sludge
10,000 Pasong Diablo Creek
*Turned-over facility from AAVA in 2009; Rehabilitated in 2012
Congressional WRF
Sequencing Batch Reactor
567 Culiat Creek 2011
Baesa WRF STM Aerotor 390 Dario Creek 2011
Legal WRF Sequencing Batch Reactor
409 Dario Creek 2012
Grant WRF Sequencing Batch Reactor
621 Dario Creek 2012
San Antonio WRF
Moving Bed Bioreactor
3,310 San Francisco River
2013
Paltok WRF Moving Bed Bioreactor
4,900 Maribolo Creek 2013
306-5

183 182
Facility Technology Capacity (cu.m./day)
Receiving body of water
Operational period/Status
Tandang Sora WRF
STM Aerotor 1,200 Dario Creek 2013
Del Monte WRF Moving Bed Bioreactor
3,510 San Francisco River
2013
Project 7 Sewage and Septage Treatment Plant (Veterans Village WRF)
Sequencing Batch Reactor / Dewatering Screw Press
2,400 / 240 Culiat Creek 2013
Paco WRF Moving Bed Bioreactor
410 Estero de Santibañez
2013
Tatalon WRF Sequencing Batch Reactor
8,100 San Juan River 2013
Samson WRF STM Aerotor 1,900 San Francisco River
2015
Bahay Toro WRF Conventional Activated Sludge
13,400 Dario Creek 2014
Bagbag WRF Sequencing Batch Reactor
10,400 Dario Creek 2014
Talayan WRF Conventional Activated Sludge
15,400 San Juan River 2015
Kapiligan WRF Moving Bed Bioreactor
6,000 San Juan River 2015
Alabang Zapote Septage Treatment Plant
Dewatering (Screw Press)
500 2016 (Process Proving)
Annex G: Reservoirs
Reservoir Name Year Constructed Capacity (ML)
Refilling Discharging Status (as of May 2017)
AAV Reservoir 1 Turned over Sept 2009
7.57 Pumped from Putatan PWPS
Pumped to distribution system
Utilized
AAV Reservoir 2 Turned over Sept 2009
9.46 Pumped from Putatan PWPS
Pumped to distribution system
Utilized
Algeciras MWSS 38 Gravity Pumped to distribution system
Utilized
Ayala Southvale (ASV)
Turned over Sept 2009
2.84 Pumped from Daang Hari PS
Pumped to distribution system
Utilized
Bacoor Nov-13 10 Pumped from Pagcor PS
Pumped to distribution system
Utilized
Baesa 2012 5 Gravity Pumped to distribution system
Utilized
Bagbag 1979 200 Gravity Gravity Utilized
Binuksuk MWSS 30 Pumped from LMPS
Gravity Utilized
Caloocan Rehabilitated by MWSI in 2008
19 Gravity Pumped to distribution system
Utilized
D. Tuazon MWSS 19 Gravity Pumped to distribution system
Utilized
Ermita MWSS 19 Gravity Pumped to distribution system
Utilized
Espiritu MWSS 19 Gravity Pumped to distribution system
Utilized
Fairview # 3 MWSS 1.51 Gravity NA Not Utilized
Fairview # 4 MWSS 1.14 Gravity NA Not Utilized
JP Ramoy 2012 2 Gravity Gravity Utilized
La Mesa (ARPS) 1998 Hanjen Engg
50 Gravity Pumped to distribution system
Utilized

185 184
Reservoir Name Year Constructed Capacity (ML)
Refilling Discharging Status (as of May 2017)
Litex 2013 2 Pumped from Amlac Inline
Pumped to distribution system
Utilized
Novaliches Rehabilitated in 1991
7 Gravity Pumped to distribution system
Utilized
Noveleta MWSS 8 Pumped from Pagcor PS
Pumped to distribution system
Utilized
Pagcor PS Operated in June 2011
23 Gravity Pumped to distribution system
Utilized
Pasay MWSS 19 Gravity Pumped to distribution system
Utilized
Putatan 2011 22 Pumped from PWTP
Pumped to distribution system
Utilized
Sacred Heart 1 (old)
10 pumped from North A
Pumped to distribution system
Utilized
Sacred Heart 2 (new)
Operated in May 2014
10 Pumped from North A
Pumped to distribution system
Utilized
Sangley Cherry 2013 1.2 Pumped from Noveleta PS
Pumped to distribution system
Utilized
Sangley Fort San Felipe
2013 1 Pumped from Noveleta PS
Pumped to distribution system
Utilized
Sangley Fuel Depo
2013 0.5 Pumped from Noveleta PS
Pumped to distribution system
Utilized
Sauyo (Bagbag) 2012 2.5 Pumped from Bagbag Booster
Gravity Utilized
Tondo MWSS 19 Gravity Pumped to distribution system
Utilized
Villamor PS Operated in April 2010
10 Gravity Pumped to distribution system
Utilized
Aguinaldo Ongoing Construction
30 Pumped from Patindig Araw PS
Pumped to distribution system
Ongoing construction
Annex H: Training Programs
Program Type Number of ProgramsTarget Actual
Core 6 6
Leadership 8 10
IMS 19 30
Professional/Technical under each division
BAO 18 21
CQESH 20 25
PMD 13 26
Logistics 10 17
C&M 12 19
LRA 7 4
HR 17 24
ITS 7 21
TSD 16 18
WMD 25 36
WSO 57 70
Finance 9 11
Total 244 338
Reservoir Name Year Constructed Capacity (ML)
Refilling Discharging Status (as of May 2017)
Octaviano Ongoing construction
10 Pumped from Magdiwang PS
Pumped to distribution system
Ongoing construction
Magdiwang Ongoing construction
40 Pumped from Marcos Alva-rez PS
Pumped to distribution system
Ongoing construction
Toclong 2016 35 Pumped from Pagcor PS
Pumped to distribution system
Completed, for commis-sioning
Sacred Heart 3 (newest)
Ongoing construction
50 Pumped from North A Annex PS
Gravity Completed, for commis-sioning
Victoria 2017 20 Pumped from Daang Hari PS
Pumped to distribution system
nearing completion, for commis-sioning

187 186
Annex I: Health Forums
Date Business Area/Offices Attendees Number of Employees %
01 3 - Feb Tondo BA 45 59 76%
02 5 - Feb SMPM Forum 47 68 69%
03 17 - Feb Putatan 39 45 87%
04 19 - Feb Water Network 53 171 31%
05 8 - Mar HO - Finance 26 72 36%
06 15 - Mar HO- IT/ Legal & Regulatory 15 32 47%
07 22 - Mar HO - Commercial & Marketing/ OP/ COO 9 31 29%
08 12 - Apr Sampaloc BA 44 59 75%
09 13 - Apr DDSSTP/TSPS 33 79 42%
10 19 - Apr HO - CQESH/Wastewater Mgt 48 64 75%
11 4 - May N/Val BA 55 80 69%
12 18 - May Imus BA 44 59 75%
13 1 - Jun Quirino/Roosevelt 71 82 87%
14 6 - Jun South Cal 42 59 71%
15 8 - Jun HO- Logistics / Business Ops Central Services 34 86 40%
16 13 - Jun Malabon/Navotas 49 70 70%
17 17 - Jun La Mesa Treatment Plant 27 167 16%
18 23 - Jun HO - PMD 29 39 74%
19 14 - Jul Soccea Bonna 27 27 100%
20 21 - Jul HO - HR 29 39 74%
21 5 - Aug North Cal 88 98 90%
22 10 - Aug Faiview/Commonwealth BA 55 92 60%
23 17 - Aug Muntinlupa BA 59 70 84%
24 25 - Aug HO - Technical Services 33 83 40%
25 7 - Sep Paranaque BA 23 72 32%
26 14 - Sep Alabang Sewage Plant 27 3 900%27 21 - Sep CNRW 56 64 88%
Annex J: Influent and Effluent Water Quality
01
2
345678
Legal STP Grant STP
Influent
Effluent
PH
9
Baesa STP
10
DAO 90-35 Lower Limit
DAO 90-35 Upper Limit
010
20
304050607080
Legal STP Grant STP
Influent Effluent
BOD
90
Baesa STP
100
DAO 90-35 Limit
mg/
L
306-1

189 188
Annex K: Accounts Offered with Desludging Services
010
20
304050607080
Legal STP Grant STP
Influent Effluent
TSS
Baesa STP
DAO 90-35 Limit
mg/
L
Municipality 2014 2015 2016Caloocan 6,059 75,297 32,778
Las Pinas 3,086 32,888 26,987
Makati 84 118 181
Malabon 3,337 8,551 383
Manila 2,483 42,085 2,698
Muntinlupa 77 135 16,257
Navotas 3,450 444 117
Paranaque 554 1,663 23,761
Pasay 260 21,170 3,929
Quezon City 103,625 17,763 26,310
Valenzuela 12,994 1,916 25,276
Bacoor 2 6,883 24,002
Imus 12 103 18,036
Rosario - - 340
Cavite City 129 141 184
Noveleta - - 2,712
Kawit - 22 5,158
TOTAL 136,152 209,179 209,109
Annex L: IMS Certificates
ISO 9001
ISO 14001
OHSAS 18001
ISO 14064
ISO 17025
ISO 20000
ISO 50001 TOTAL
2007 2 1 3
2009 1 2 2 5
2010 0
2011 1 1 1 1 4
2012 14 13 13 40
2013 11 11 11 1 1 35
2014 14 7 7 1 29
2015 14 15 15 44
2016 17 17 17 8 59
Total 74 67 66 2 1 1 8 209
Risk Impact Mitigation Responsible MonitoringIf production pattern is unreliable
Bagbag level target not met
Reduce/ Increase production to hit target Bagbag level
La Mesa Treatment Plant 1
Production pattern target versus actual
Closely monitor Bagbag level
La Mesa Treatment Plant 1
Bagbag level target versus actual
Defective Electrical Equipment & System Integration, Inc. meter
No measurement of raw water
Use LMTP data as reference
Common Purpose Facilities
LMTP production
Annex M: Risk Management
102-12

191 190
Risk Impact Mitigation Responsible MonitoringOpening of Manila Water Company, Inc. by-pass to Balara Treatment Plant
Inability to meet production pattern due to difficulty in LP2 withdrawal at portal
Increase LP1 production
La Mesa Treatment Plant 1
LMTP production
Throttling of LP2 2.1m by-pass
La Mesa Treatment Plant 2
Angat Water Optimization Project Reservoir & Pumping Station level
Convene CPF-TWG to agree on withdrawal timing during peak hours
Common Purpose Facilities/Maynilad Water Services, Inc./Manila Water Company, Inc.
Daily data/measurement
Actual release to MWSS is less than the allocation
Inability to meet production
Call attention of AHC, NWRB, and MWSS
Common Purpose Facilities/Maynilad Water Services, Inc./ Manila Water Company, Inc.
Angat tailrace measurement
Opening of low level outlet
Inability to meet production due to reduction in raw water
Maximize recovered backwash water
La Mesa Treatment Plant 1 and La Mesa Treatment Plant 2
Recovery flow meter
Poor quality of raw water
Proper dosing of chemicals
Process Control Services, LP1 and LP2
Actual versus recommended dosing data
Stratified water quality sampling in Ipo and LMTP inlet and outlet
Process Control Services
Water quality within PNSDW
Ensure enough supply of treatment chemicals
Support Services
Daily maintaining balance
Risk Impact Mitigation Responsible MonitoringStrict implemen-tation of 60/40
No flexibility in raw water requirements
Raise issue of Sharing Protocol to MWSS
Ronaldo C. Padua
CPF implementation
Defective recovery pump
Reduction in LMTP production
Acquire spare recovery pump; quick repair
Treatment Plant Maintenance/La Mesa Treatment Plant Operations
Recovery flow meter and pump operation
Recovery pumps clogged
Reduction in LMTP production
Ensure wet well and pumps chamber always free of sludge and unwanted plants
La Mesa Treatment Plant Operations/Treatment Plant Maintenance
Recovery flow meter and pump operation
Continuous reduction on MWSS allocation
Reduction in LMTP production
Notice to customers
Business Areas Customer complaints
Media campaigns
Commercial & Marketing
Customer complaints
Establish different reduction schemes
Water Supply Operations
Reduction in actual production; accuracy in water availability
Clogging of low level outlet
Loss of available raw water
Ensure operability of Low Level Outlet intake screen
Angat Hydropower Corporation (thru CPF)
Angat tailrace measurement
Removal of clog thru declogging valve
Angat Hydropower Corporation (through Common Purpose Facilities)
Angat tailrace measurement

193 192
Risk Impact Mitigation Responsible MonitoringIntake (radial gate and butterfly valve) malfunction
Reduction in LMTP Production
Immediate re-port/repair and availability of chain block
Treatment Plant Maintenance/La Mesa Treatment Plant Operations
Inspection report and Job orders
Regular maintenance
Treatment Plant Maintenance/La Mesa Treatment Plant Operations
Inspection report and Job orders
Defective LP2 2.1 meter by-pass
No flexibility in treated water
Regular maintenance
Treatment Plant Maintenance/La Mesa Treatment Plant 2
Inspection report and Job orders
Power Failure Reduction in LMTP production
Ensure synchronized genset operation and regular exercise with load
Treatment Plant Maintenance/La Mesa Treatment Plant Operations
Weekly genset exer-cise report/Contrac-tor's Job Order
Malfunction of chemical dosing facilities (chlorine, Alum/polyaluminum chloride, polymer, potassium permanganate, and caustic soda)
Reduction in LMTP production; plant shutdown
Regular maintenance and exercise especially the potassium permanganate and caustic soda dosing system
Treatment Plant Maintenance/La Mesa Treatment Plant Operations/Contractors for newly upgraded chemical dosing facilities
Weekly exercise report/Job Order
Defective existing spectro- photometer
No monitoring of critical parameters during El Niño like manganese, iron
Availability of spare equipment
Process Control Services
Daily accuracy check
352
Fire Relief Faith Garden
No. of Hours No. of Volunteers
VOLUNTEERS
Mission Ginhawa
Brigada Eskwela and other school-based volunteer
activities
Manila Bay SUNSET
Partnership Program Inc.
Coastal Clean-up
Annex N: Volunteers
44
352
7
400
50
1,760
170312
78

195 194
GRI Standard Page Number Omission
GRI 101: Foundation 2016
General Disclosures
GRI 102: General Disclosures 2016
Organizational Profile
102-1 Name of the organization 20
102-2 Activities, brands, products, and services
20
102-3 Location of headquarters 20
102-4 Location of operations 20
102-5 Ownership and legal form 20
102-6 Markets served 20
102-7 Scale of the organization 15-17, 20, 61, 106-109, 158, 159
102-8 Information on employees and other workers
106-109
102-9 Supply chain 147
102-10 Significant changes to the organization and its supply chain
No significant change to the organization and its supply chain.
102-11 Precautionary Principle or approach
50-55, 65-66, 160-161
102-12 External initiatives 189
102-13 Membership of associations
Global Water Intelligence, International Water Association, Philippine Water Works Association, Philippine Business for the Environment
GENERAL DISCLOSURES
GRI CONTENT INDEX
GRI 102: General Disclosures 2016
Strategy
102-14 Statement from senior decision-maker
10-13
102-15 Key impacts, risks, and opportunities
50-55, 59, 160-161
Ethics and integrity
102-16 Values, principles, standards, and norms of behavior
21
Governance
102-18 Governance structure 154-155
102-24 Nominating and selecting the highest governance body
152, 154-155
102-25 Conflicts of interest 153
Stakeholder engagement
102-40 List of stakeholder groups 32, 33, 34, 35
102-41 Collective bargaining agreements
110
102-42 Identifying and selecting stakeholders
32, 33, 34, 35
102-43 Approach to stakeholder engagement
32, 33, 34, 35, 70
102-44 Key topics and concerns raised
32, 33, 34, 35, 70
Reporting practice
102-45 Entities included in the consolidated financial statements
159
102-46 Defining report content and topic Boundaries
28, 29, 30, 170, 171, 172, 173
102-47 List of material topics 31, 170, 171, 172, 173
102-48 Restatements of information
49, 111, 125, 146
102-49 Changes in reporting No significant changes in list of material topics and topic boundaries.
102-50 Reporting period 19
102-51 Date of most recent report 19

197 196
GRI 102: General Disclosures 2016
102-52 Reporting cycle 19
102-53 Contact point for questions regarding the report
19
102-54 Claims of reporting in accordance with the GRI Standards
19
102-55 GRI content index 19, 194-201
102-56 External assurance 19, 202-203
GRI Standard Page Number Omission
GRI 200 Economic Standard Series
Economic Performance
GRI 103:Management Approach 2016
103-1 Explanation of the material topic and its Boundary
170-171
103-2 The management approach and its components
158-159
103-3 Evaluation of the management approach
158-159
GRI 201: Economic Performance 2016
201-1 Direct economic value generated and distributed
158-159
Indirect Economic Impacts
GRI 103:Management Approach 2016
103-1 Explanation of the material topic and its Boundary
170-171
103-2 The management approach and its components
126-127
103-3 Evaluation of the management approach
126-127
GRI 203: Indirect Economic Impacts 2016
203-2 Significant indirect economic impacts
126-127
Procurement Practices
GRI 103:Management Approach 2016
103-1 Explanation of the material topic and its Boundary
172-173
103-2 The management approach and its components
146
103-3 Evaluation of the management approach
146
GRI 204: Procurement Practices 2016
204-1 Proportion of spending on local suppliers
146
MATERIAL TOPICS
GRI Standard Page Number Omission
GRI 300 Environmental Standard Series
Materials
GRI 103:Management Approach 2016
103-1 Explanation of the material topic and its Boundary
172-173
103-2 The management approach and its components
48-49, 96
103-3 Evaluation of the management approach
48-49, 96
GRI 301: Materials 2016
301-1 Materials used by weight or volume
48-49, 96
Energy
GRI 103:Management Approach 2016
103-1 Explanation of the material topic and its Boundary
172-173
103-2 The management approach and its components
100-101
103-3 Evaluation of the management approach
100-101
GRI 302:Energy 2016
302-1 Energy consumption within the organization
100-101
302-3 Energy intensity 100-101
Water
GRI 103:Management Approach 2016
103-1 Explanation of the material topic and its Boundary
170-171
103-2 The management approach and its components
40-46
103-3 Evaluation of the management approach
40-46, 174-177
GRI 303:Water 2016
303-1 Water withdrawal by source 42-43
303-2 Water sources significantly affected by withdrawal of water
42-43
303-3 Water recycled and reused 46
Biodiversity
GRI 103:Management Approach 2016
103-1 Explanation of the material topic and its Boundary
170-171
103-2 The management approach and its components
55, 103
103-3 Evaluation of the management approach
No measurement of survival yet.
GRI 304:Biodiversity 2016
304-1 Operational sites owned, leased, managed in, or adjacent to, protected areas and areas of high biodiversity value outside protect-ed areas
55, 103
304-2 Significant impacts of activities, products, and services on biodi-versity
55, 103
304-3 Habitats protected or restored 55, 103
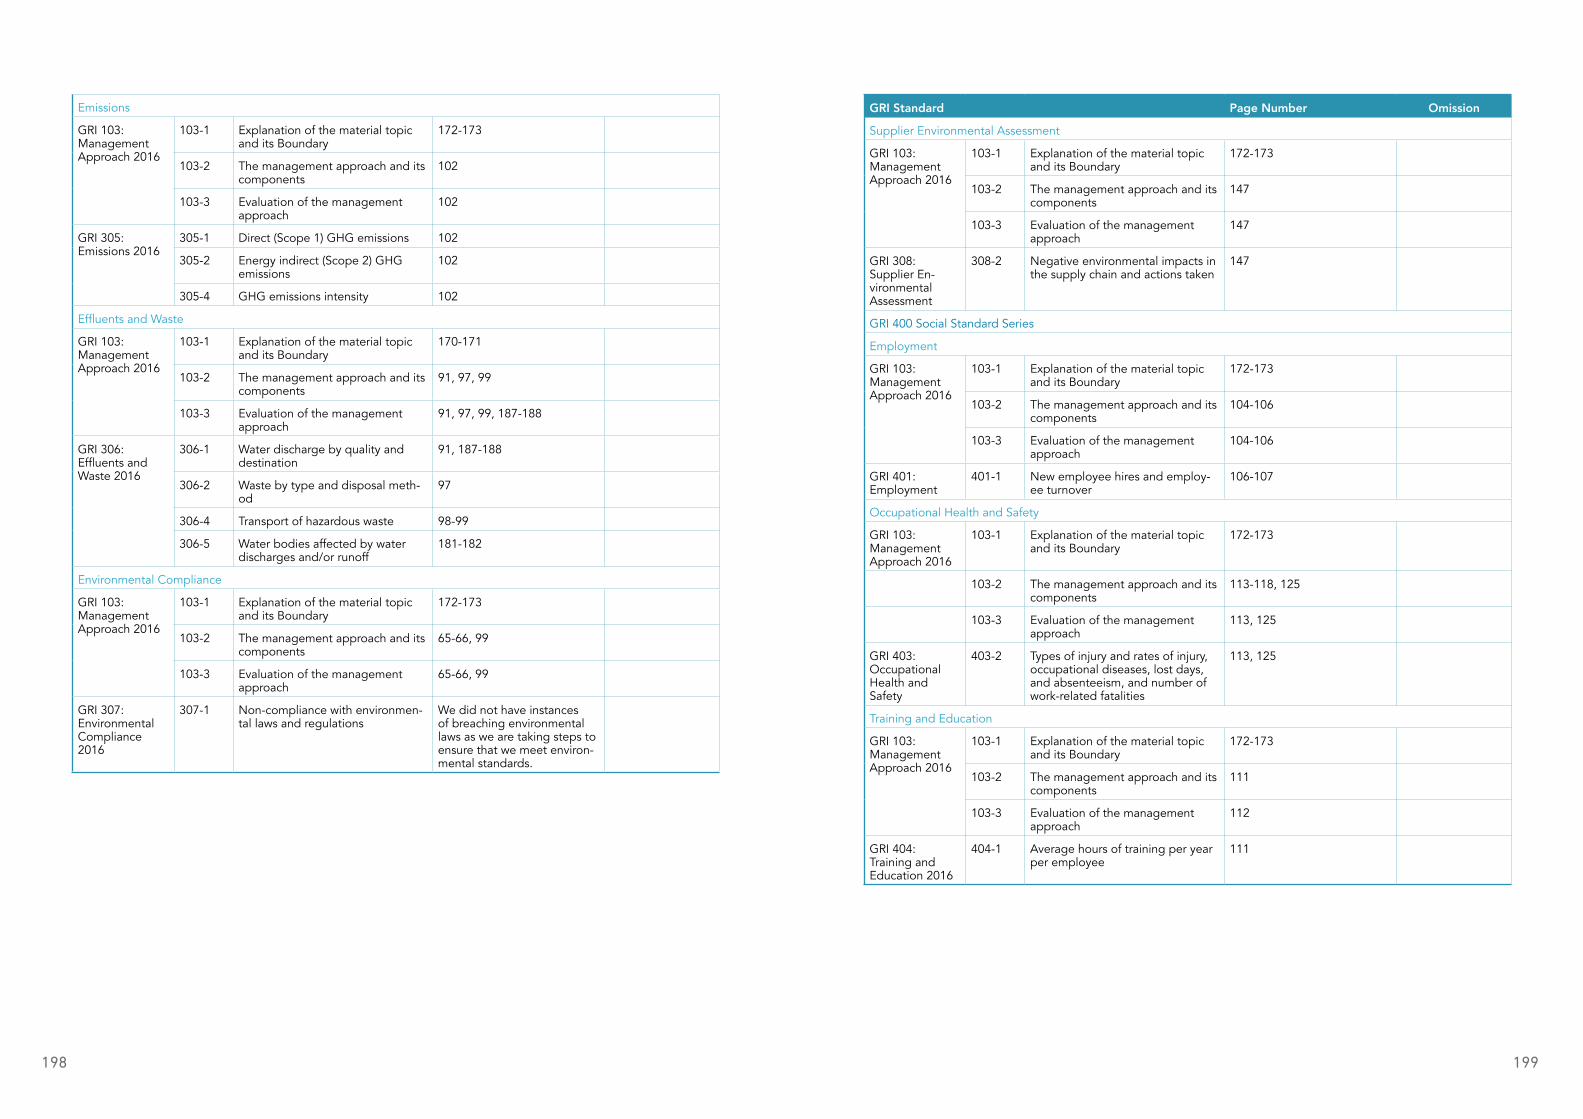
199 198
Emissions
GRI 103:Management Approach 2016
103-1 Explanation of the material topic and its Boundary
172-173
103-2 The management approach and its components
102
103-3 Evaluation of the management approach
102
GRI 305:Emissions 2016
305-1 Direct (Scope 1) GHG emissions 102
305-2 Energy indirect (Scope 2) GHG emissions
102
305-4 GHG emissions intensity 102
Effluents and Waste
GRI 103:Management Approach 2016
103-1 Explanation of the material topic and its Boundary
170-171
103-2 The management approach and its components
91, 97, 99
103-3 Evaluation of the management approach
91, 97, 99, 187-188
GRI 306:Effluents and Waste 2016
306-1 Water discharge by quality and destination
91, 187-188
306-2 Waste by type and disposal meth-od
97
306-4 Transport of hazardous waste 98-99
306-5 Water bodies affected by water discharges and/or runoff
181-182
Environmental Compliance
GRI 103:Management Approach 2016
103-1 Explanation of the material topic and its Boundary
172-173
103-2 The management approach and its components
65-66, 99
103-3 Evaluation of the management approach
65-66, 99
GRI 307:Environmental Compliance 2016
307-1 Non-compliance with environmen-tal laws and regulations
We did not have instances of breaching environmental laws as we are taking steps to ensure that we meet environ-mental standards.
GRI Standard Page Number Omission
Supplier Environmental Assessment
GRI 103:Management Approach 2016
103-1 Explanation of the material topic and its Boundary
172-173
103-2 The management approach and its components
147
103-3 Evaluation of the management approach
147
GRI 308:Supplier En-vironmental Assessment
308-2 Negative environmental impacts in the supply chain and actions taken
147
GRI 400 Social Standard Series
Employment
GRI 103:Management Approach 2016
103-1 Explanation of the material topic and its Boundary
172-173
103-2 The management approach and its components
104-106
103-3 Evaluation of the management approach
104-106
GRI 401:Employment
401-1 New employee hires and employ-ee turnover
106-107
Occupational Health and Safety
GRI 103:Management Approach 2016
103-1 Explanation of the material topic and its Boundary
172-173
103-2 The management approach and its components
113-118, 125
103-3 Evaluation of the management approach
113, 125
GRI 403:Occupational Health and Safety
403-2 Types of injury and rates of injury, occupational diseases, lost days, and absenteeism, and number of work-related fatalities
113, 125
Training and Education
GRI 103:Management Approach 2016
103-1 Explanation of the material topic and its Boundary
172-173
103-2 The management approach and its components
111
103-3 Evaluation of the management approach
112
GRI 404:Training and Education 2016
404-1 Average hours of training per year per employee
111

201 200
GRI Standard Page Number Omission
Diversity and Equal Opportunity
GRI 103:Management Approach 2016
103-1 Explanation of the material topic and its Boundary
172-173
103-2 The management approach and its components
104-109, 150-151
103-3 Evaluation of the management approach
104-109, 150-151
GRI 405:Diversity and Equal Opportu-nity 2016
405-1 Diversity of governance bodies and employees
106-109, 150-151
Non-discrimination
GRI 103:Management Approach 2016
103-1 Explanation of the material topic and its Boundary
172-173
103-2 The management approach and its components
104-109
103-3 Evaluation of the management approach
104-109
GRI 406:Non-discrimina-tion 2016
406-1 Incidents of discrimination and corrective actions taken
No incidence of discrimina-tion.
Freedom of Association and Collective Bargaining
GRI 103:Management Approach 2016
103-1 Explanation of the material topic and its Boundary
172-173
103-2 The management approach and its components
32-33
103-3 Evaluation of the management approach
32-33
GRI 407:Freedom of Association and Collective Bargaining
407-1 Operations and suppliers in which the right to freedom of association and collective bargaining may be at risk
No part of our operation puts to risk the right of association and collective bargaining.
Local Communities
GRI 103:Management Approach 2016
103-1 Explanation of the material topic and its Boundary
172-173
103-2 The management approach and its components
126-145
103-3 Evaluation of the management approach
No evaluation of programs conducted yet.
GRI 413:Local Communi-ties 2016
413-1 Operations with local community engagement, impact assessments, and development programs
126-145
Supplier Social Assessment
GRI 103:Management Approach 2016
103-1 Explanation of the material topic and its Boundary
172-173
103-2 The management approach and its components
146-147
103-3 Evaluation of the management approach
146-147
GRI 414:Supplier Social Assessment 2016
414-2 Negative social impacts in the sup-ply chain and actions taken
146-147
Customer Health and Safety
GRI 103:Management Approach 2016
103-1 Explanation of the material topic and its Boundary
170-171
103-2 The management approach and its components
65-66
103-3 Evaluation of the management approach
65-66
GRI 416:Customer Health and Safety 2016
416-2 Incidents of non-compliance concerning the health and safety impacts of products and services
No incidents of non-compli-ance concerning the health and safety of products and services. We are taking steps to ensure that our customers get safe water.
Unique Maynilad Disclosures
Disclosure Page Number
Operational Efficiency
Water Withdrawal and Production 40-43
Progress on NRW Reduction 73-74
Pipes Replaced 79
Leaks Reported and Repaired 76-77
Employee Engagement
Employee Engagement and Drivers No employee engagement
survey done for 2016.
Workplace Efficiency and Innovation 122
Employee Volunteerism 191

203 202

ACKNOWLEDGEMENTS
CQESHRoel S. Espiritu
Kris G. Catangcatang
Marionne Kristel U. Mariano
Gianna I. Veracruz
Chester Y. Del Rosario
Enrique G. De Guzman
John Emmanuel B. Martinez
Sarah Lynn S. Duroy
Mark Paul S. Capati
Jimer R. Felices
Justine G. Madlangsakay
WSOMa. Ana E. Tria
Marianito H. Barahan Jr.
Anna Belen G. Herrera
Kerwin T. Aganon
Ramoncito N. Fernandez
Erwin S. Miranda
Jessica H. Agarap
Ressie D. Vicente
Alvin Ryan C. Ong
London-Philip L. Israel
Salvador S. Leyble
Joseph De Guzman
Archie Barria
Marvin M. Villanueva
Resurreccion B. Medrano
Ginny Vivien T. Calaycay
WMDJan Patrick S. Reyes
Ann Margarett M. Caranto
Benerly D. Ampo
Ryan E. Villamer
LRAAtty. Prescila Bartolome-Culala
Atty. Marianina Claudette D.
Guilbert
CNRWRonald Jeremy B. Salamat
Benson Jhon A. Martin
HRChristian Reginald Indon
Russel M. Cristi
Rhesa Angelie M. Perez
Mae Liza S. Velasquez
Ma. Elizabeth H. Obanil
Nancy D. Espenilla
Ricardo Jose G. Miranda
Jo-Ann R. Pabilona
Djunah Fe D. Escobar
Lorejane A. Eguia
BAOJenneyfer A. Rueda
Jeric Daniel M. Axalan
Bernadette Joy R. Cometa
CMDJennifer Rufo
Karmina M. Alejandro
Rosmon M. Tuazon
Edmundo M. Perez II
Oliver B. Sta. Ana
Arrianne M. Gamotin
Mikhail D. Sanchez
PMDYolanda C. Lucas
Jannebelle L. Dellosa
Angela Mae A. Selga
Sheila Frances P. Pajanustan
Sheryl Vina B. Cecilio
LOGISTICSDeobie M. Mendoza
Maria Teresa M. Artiaga
Clarisse Joy S. Gomez
Henry Z. Espedillon
Allan S. Figueroa
Ronulfo G. Gaylon
Grace A. Laguardia
Glenneth S. Magtalas
Samuel Gerald T. Saludez
Mark Jason M. Herrera
Joshua D. Sarmiento
Mayflor S. Tomarong
Ericson S. Garcia
FINANCERachelle R. Cajurao
Cybele L. Regalado
Jerome Paolo R. Cruz
Ferdinand Luna
Liza R. Briones
TSDMyra P. Tacderan
Juan Paulo T. De Leon
Ailyn C. Cabral
METRO PACIFIC WATERYang G. Villa
NAPOCOREliseo Calija
Roque De Guzman
Christian Espiritu
ANGAT HYDROPOWER CORPORATIONGeung Jeon Han
Paul D. Causon

WWW.MAYNILADWATER.COM.PH


![G.R. Nos. 202897, 206823 & 207969 - Maynilad Water ......EN BANC [G.R. No. 202897. August 6, 2019.] MAYNILAD WATER SERVICES, INC., petitioner, vs. THE SECRETARY OF THE DEPARTMENT OF](https://static.fdocuments.in/doc/165x107/613814900ad5d20676490a5a/gr-nos-202897-206823-207969-maynilad-water-en-banc-gr-no.jpg)


