News U Can Use - Mutual Fund Services India | Savings ... · PDF fileNews U Can Use 19th June...
27
News U Can Use 19 th June, 2015
Transcript of News U Can Use - Mutual Fund Services India | Savings ... · PDF fileNews U Can Use 19th June...

News U Can Use
19th June, 2015

Slide
The Week that was…
13th June to 19th June
Slide
Indian Economy
India’s trade deficit in May narrowed to $10.40 bn compared with around $10.99 bn in April;
merchandise exports in May contracted 20.19%, reaching $22.34 bn compared with $28 bn
a year ago in the same month; imports in May reached $32.75 bn, down 16.52% compared
with $39.23 bn last year in the same month.
India’s wholesale price index-based inflation came in at -2.36% in May, slightly higher than
the 2.65% decline in price growth registered in April.
India’s services exports fell by 4.5% to $13.01 bn in April 2015 as compared to the same
month last year.
SBI’s Composite Index for manufacturing activity fell to 53.2 in June from 56.6 in May.

Slide
Indian Commodities Market
International crude oil prices ended little changed in the week due to lack of any strong
triggers; prices ended at $60.45 a barrel on the NYMEX on June 18, compared with $60.77
a barrel on June 11.
US crude oil inventories fell 2.7 mn barrels to 467.9 mn barrels for the week ended June 12.
India’s gold imports grew 10.47% to $2.42 bn in May on declining prices and easing of
restrictions by RBI; imports of the precious metal stood at $2.19 bn in the same month of
2014.
India Ratings and Research maintains a stable outlook for gems and jewellery exporters as
well as retailers for FY16.
MCX is close to sell about 18 cr warrants it holds in Metropolitan Stock Exchange.

Slide
Indian Government
Indian President Pranab Mukherjee promulgates ordinance on cheque bounce cases.
India signs a motor vehicles pact with three SAARC nations - Bhutan, Bangladesh and
Nepal - that will enable seamless transit of passenger and cargo vehicles among them.
Government proposes to issue gold bonds worth Rs 13500 cr with a sovereign guarantee to
divert investment demand for physical gold to a financial instrument.
Government approves 16 FDI proposals amounting to around Rs 6751 cr, including those of
Torrent Pharmaceuticals, Star India and Syngene International.
The Cabinet Committee on Economic Affairs (CCEA) raises the minimum support price
(MSP) for paddy by Rs 50 to Rs 1410 a quintal and by Rs 250-275 per quintal for pulses for
2015-16.
The Cabinet approves the ‘Housing for All by 2022′ programme for slum rehabilitation in
urban areas.
Government approves the revised targets of Jawaharlal Nehru National Solar Mission
(JNNSM) to 1 lakh Mw by 2022.
Government approves highway projects worth Rs 7529 cr in Maharashtra.
Government cancels approvals of 22 special economic zones for lack of ‘satisfactory’
progress.
Government hikes import duty on long steel products from 5.5% to 7.5% and that of flat
steel product from 7.5% to 10%.
Slide
Indian Government
Finance Ministry sets up two panels to suggest tax rates and look into technology
preparedness for the roll out of GST from April 2016.
Government plans to sell 3% stake in Bharat Petroleum this fiscal to raise around Rs 1800
cr.
Finance Ministry asks state-run banks to prepare a list of non-core assets that can be sold.
Finance Ministry advises banks to lend at least six times more towards housing loan – up to
Rs 25 lakh during the current fiscal.
Government launches a Rs 1500 cr insurance pool in a bid to offset financial burden of
foreign nuclear suppliers.
Government set to approve six pharma parks this year at an estimated investment of Rs 180
cr to promote the pharmaceuticals manufacturing.
Government proposes a stringent appraisal system for public sector banks to increase
efficiency and transparency.
Department of Telecom (DoT) issues the Letter of Intent (LoI) to all the telecom players that
participated in the March auction and is speeding up spectrum allocation to them.
Empowered Committee on GST to submit its views on June 16 to the Parliamentary panel
looking into the Constitutional amendment bill for introduction of new indirect tax regime.
Government launches an online portal for job seekers in the micro, small and medium
enterprises (MSME) sector.
Slide
Indian Government
Indian Railways ropes in an international train-maker China Railway Rolling Stock Corp Ltd
to manufacture rakes for country's first underground mass transit system in Kolkata.
An inter-ministerial panel defers decision for the second time on Kotak Mahindra Bank's
proposal for raising foreign investment limit in the bank to 55%.
Andhra Pradesh government is planning to create a Rs 100 cr state innovation fund for
startups.
Slide
Regulatory updates in India
RBI introduces a new 30-year government bond; it will be reckoned as an eligible instrument
in government security by banks for statutory liquidity ratio (SLR) purpose.
RBI to introduce cash-settled interest rate futures (IRFs) on 5-7 year and 13-15 year
government securities; also decides to modify the residual maturity of cash-settled 10-year
IRF to between 8 and 11 years.
RBI concludes a memorandum of understanding (MoU) on “Supervisory Cooperation and
Exchange of Supervisory Information” with Maldives Monetary Authority (MMA).
RBI extends up to June 22, the timeline for the receipt of comments and feedback on the
draft framework on issue of rupee-linked bonds.
SEBI allows stock exchanges to introduce cash-settled IRFs on 6- and 13-year government
securities, in addition to 10-year bonds already traded in the market.
SEBI says foreign venture capital investors (FVCIs) can be granted registration as a FPI if
they meet certain guidelines.
SEBI comes out with detailed disclosure norms for listed firms while exercising employee
stock ownership plan (ESOP).
SEBI probes a scam where gullible investors are being lured through SMSes and WhatsApp
with promise of multi-fold returns from ‘options’ trading.

Slide
Regulatory updates in India
SEBI is likely to come out this month with detailed guidelines on e-IPOs.
SEBI to initiate fresh proceedings in NSEL scam.
SEBI bars Karvy Stock Broking from taking up any new IPO assignment for one year.
SEBI bars HBJ Capital Services and its directors from acting as investment adviser and
alternative investment fund for providing unauthorised investment tips to investors.
According to SEBI data, overall deployment of equity funds in bank stocks stood at Rs
79215 cr in May as compared with Rs 74810 cr in the previous month.
According to SEBI data, MFs exposure to IT stocks stood at Rs 35750 cr in May compared
with Rs 34100 cr in April.
IRDAI is planning changes in health insurance, including more incentives for health policy
holders and a level playing field for life and non-life insurers, among others.
IRDAI in its exposure draft on third party administrator (TPA) says that at least one of the
directors in a TPA should be a MBBS graduate.
According to TRAI, telephone subscriber base rose to 999.7 mn in April.
Competition Commission of India approves a Rs 233 cr deal for the acquisition of Birla
Textile Mills by Sutlej Textile and Industries.

Slide
International Markets
US Federal Reserve says the US economy is growing moderately after a winter swoon and
likely strong enough to support an interest rate increase by the end of the year; cuts its
economic growth forecast for 2015 to 1.8-2.0%, down from March's 2.3-2.7% outlook, to
account for the unexpected contraction in the first quarter of the year.
US industrial production declined by a seasonally adjusted 0.2% in May compared to a
revised drop of 0.5% in April; the capacity utilization rate declined to 78.1% in May from
78.3% in April.
US housing starts dropped to a seasonally adjusted annual pace of 1.04 mn units in May
compared to April’s revised 1.17 mn units; building permits issued in May increased by
11.8% to a seasonally adjusted 1.275 mn units from April’s total of 1.140 mn.
US NAHB housing market index rose 5 points from the previous month to 59 in June.
US Empire State general business conditions index fell from 3.09 in May to -1.98 in June,
hitting its lowest level since January 2013.
US consumer price growth was flat in the 12 months through May after a 0.2% yearly
decline in April.
US initial claims for state unemployment benefits dropped 12,000 to a seasonally adjusted
267,000 for the week ended June 13.
US Philadelphia Fed manufacturing conditions index rose to 15.2 in June from 6.7 in May.
Slide
International Markets
US’ University of Michigan consumer sentiment index came in at 94.6 in June, up from the
final reading of 90.7 in May.
The US current account deficit widened to $ 113.34 bn in Q1 2015 from $ 103.14 bn in Q4
2014.
US leading economic indicators index rose 0.7% in May for the second month in a row.
US Treasury International Capital (TIC) long-term purchases rose to a seasonally adjusted
$53.9 bn in April, compared with $25.6 bn in the previous month.
The European Central Bank’s economic bulletin noted that its asset purchase programmes
were "proceeding well and positive effects are visible."
Euro zone’s trade balance recorded a 24.9 bn euro surplus in April, compared with 14.9 bn
euros in the same month last year.
Eurozone consumer price inflation increased by a seasonally adjusted 0.3% in May,
unchanged from a preliminary estimate.
Eurozone ZEW expectations fell to 53.7 in June, compared with 61.2 in May.
UK unemployment declined by 43,000 in the three months ended April to 1.81 mn, the
lowest since the June to August period of 2008; the ILO jobless rate for the February to April
period was 5.5%, down from 5.7% logged for the three months to January.
UK jobless claims fell 6,500 in May from April to 791,800.

Slide
International Markets
UK consumer prices rose by 0.1% in the year to May, compared with a 0.1% fall in the year
to April.
UK producer prices fell 1.6% in the year to May, compared with a fall of 1.7% in the year to
April.
UK retail sales rose by 0.2% in May, a slowdown from a rise of 0.9% in April.
Japan posted a merchandise trade deficit of around 216 bn yen in May, following the
downwardly revised 55.8 bn yen deficit in April; exports added 2.4% year-on-year to 5.74
trillion yen, while imports tumbled an annual 8.7% to 5.96 trillion yen.
The Greek central bank warned that the country would be put on a “painful course” towards
default and exiting the euro zone if the government and its international creditors failed to
reach an agreement.
CVS Health Corp to buy Target Corp's pharmacies and clinics in a $1.9 bn deal.

Slide
Global Equities
Indices June 19 June 12 Change
%
Change
DJIA 18115.84* 17898.84 217.00 1.21
Nasdaq Composite 5132.95* 5051.10 81.85 1.62
Nikkei 225 (Japan) 20174.24 20407.08 -232.84 -1.14
Straits Times (Singapore) 3300.96 3353.85 -52.89 -1.58
Hang Seng (Hong Kong) 26760.53 27280.54 -520.01 -1.91
FTSE 100 (London) 6707.88* 6784.92 -77.04 -1.14
DJIA – Dow Jones Industrial Average *Data as on June 18
Slide
Global Equities Key global indices closed lower in the week ended June 18/19 (except US’ Dow Jones
and Nasdaq – up 1.2% and 1.6%, respectively) with Hong Kong’s Hang Seng index falling
the most – down 1.9%.
Wall Street stocks closed higher in the week as the US Federal Reserve’s (US Fed) dovish
statement at its policy meeting raised prospects of a gradual rise in interest rates.
Gains were however shortened due to disappointing domestic industrial production and
business activity data and as the Greek debt talks remained unresolved.
Britain’s FTSE index fell over 1% in the week mainly due to an impasse over the Greek
bailout deal.
A decline in shares of EasyJet Plc following a ratings downgrade and a sell-off in grocery
stocks also weighed on the market.
Hong Kong's Hang Seng index fell nearly 2% in the week, hit by steep losses in Chinese
markets which plunged over margin tightening worries and a flurry of IPOs in the week.
Sentiments were also affected on Greek debt default worries and caution ahead of a
politically sensitive vote in Hong Kong that could spark mass protests.
Japan’s Nikkei index lost 1% in the week on concerns about a possible default by Greece on
its debt and caution ahead of the US Fed meeting.
Singapore’s Straits Times index gave up 1.6% in the week ended June 19 on worries about
the Greece debt crisis.

Slide
Global Debt
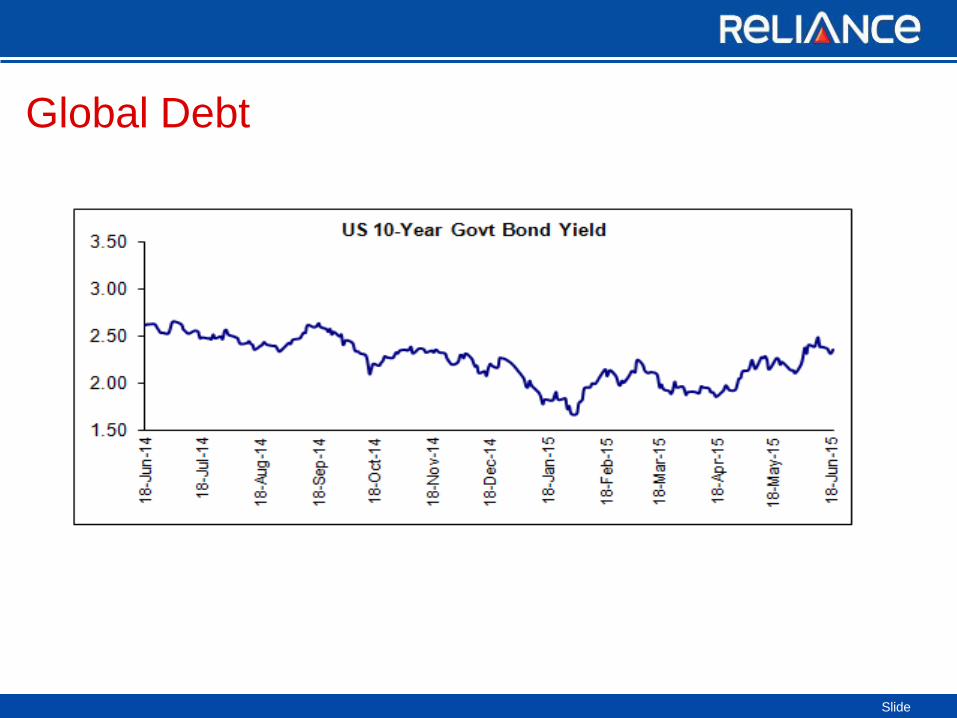
US treasury prices advanced in the week ended June 18 due to strong demand for bonds
following US Federal Reserve's (US Fed) dovish statement on pace of interest rate hikes
and on ongoing uncertainty over Greece bailout agreement.
The yield of the 10 year benchmark bond fell to 2.35% on June 18 from 2.38% on June 11.
US Treasuries onset the week on a positive note on the back of disappointing New York
manufacturing data and weak industrial production numbers.
Concerns that Greece might default on loans and be ejected from the European currency if
there is no agreement between the nation and its lenders also boosted demand for safe-
haven US bonds.
Treasury prices were further boosted after the US Fed reduced its growth and federal funds
rate forecasts, but said growth this year is still likely strong enough to support an interest rate
increase later in the year.
Further rise in treasury prices was however capped due to some positive economic data.
US initial claims for state unemployment benefits dropped 12,000 to a seasonally
adjusted 267,000 for the week ended June 13.
US consumer price index rose 0.4% on month in May after gaining 0.1%in April.
On weekly debt holding front, foreign central banks' investment in US Treasuries and
agency debt at the Federal Reserve rose by $8 bn to $3.36 trillion in the week ended June
17.
Slide
Global Debt

Slide
USA Wall Street stocks closed higher in the week ended June 18 with Dow Jones rising 1.2%
while Nasdaq went up 1.6% (closing at its all-time high).
Sentiments were down earlier on persisting uncertainty about how soon the US Federal
Reserve might raise interest rates, and as the Greek debt talks remained unresolved.
Disappointing domestic industrial production and business activity data weighed on the
markets further.
US industrial production declined by a seasonally adjusted 0.2% in May compared to a
revised drop of 0.5% in April; the capacity utilization rate declined to 78.1% in May
from 78.3% in April.
US Empire State general business conditions index fell from 3.09 in May to -1.98 in
June, hitting its lowest level since January 2013.
Losses were however wiped off due as the US Fed’s dovish statement at its policy meeting
raised prospects of a gradual rise in interest rates.
US Fed said the US economy is growing moderately after a winter swoon and likely
strong enough to support an interest rate increase by the end of the year; also cut its
economic growth forecast for 2015 to 1.8-2.0%, down from March's 2.3-2.7% outlook.
Better-than-expected domestic building permits data and intermittent rise in the crude oil
prices also supported rise in the benchmarks.
US building permits issued in May increased by 11.8% to a seasonally adjusted 1.275 mn
units from April’s total of 1.140 mn.
Slide
UK
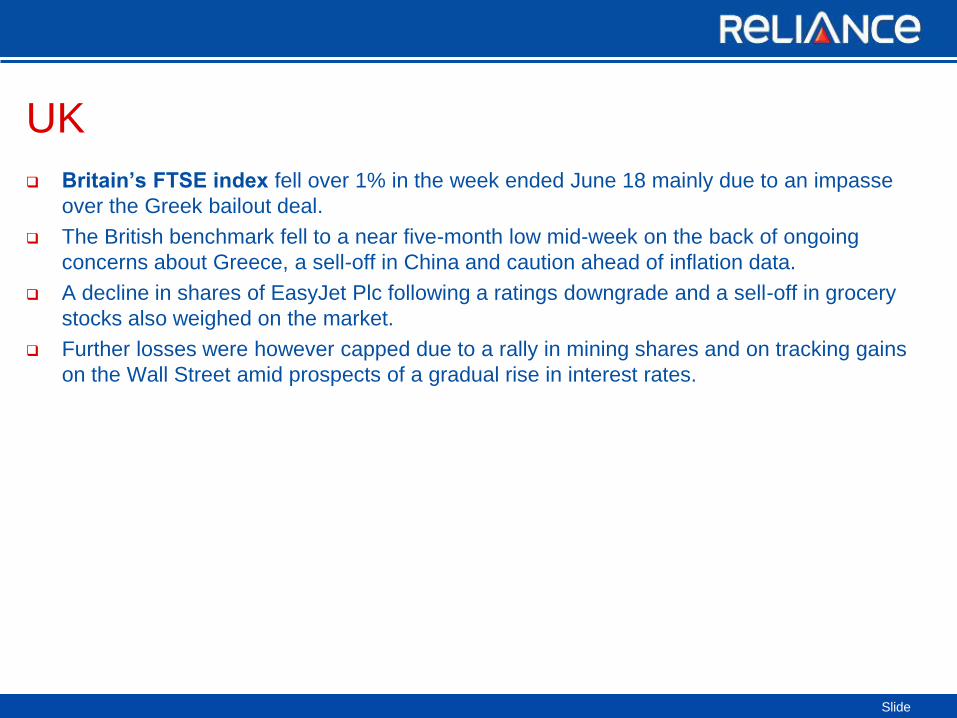
Britain’s FTSE index fell over 1% in the week ended June 18 mainly due to an impasse
over the Greek bailout deal.
The British benchmark fell to a near five-month low mid-week on the back of ongoing
concerns about Greece, a sell-off in China and caution ahead of inflation data.
A decline in shares of EasyJet Plc following a ratings downgrade and a sell-off in grocery
stocks also weighed on the market.
Further losses were however capped due to a rally in mining shares and on tracking gains
on the Wall Street amid prospects of a gradual rise in interest rates.

Slide
ASIA
Hong Kong's Hang Seng index fell nearly 2% in the week ended June 19 and emerged
as the biggest decliner among key indices analyzed.
Market was primarily hit by steep losses in Chinese markets which plunged over margin
tightening worries and a flurry of IPOs in the week.
Sentiments were also affected on Greek debt default worries and caution ahead of a
politically sensitive vote in Hong Kong that could spark mass protests.
Further losses were however prevented on tracking gains on the Wall Street.
Japan’s Nikkei index lost 1% in the week ended June 19 on tracking some weak global
cues.
Market fell earlier due to concerns about a possible default by Greece on its debt and
caution ahead of the US Fed meeting.
The exporters’ heavy benchmark was pulled down further as yen strengthened after the US
Fed signaled that it will hike interest rates at a slower pace than expected.
Some losses were however cut short after the country’s central bank kept its record stimulus
plan unchanged.
Bank of Japan stuck to its strategy of increasing base money at an annual pace of 80 trillion
yen through asset purchases.
Slide
ASIA
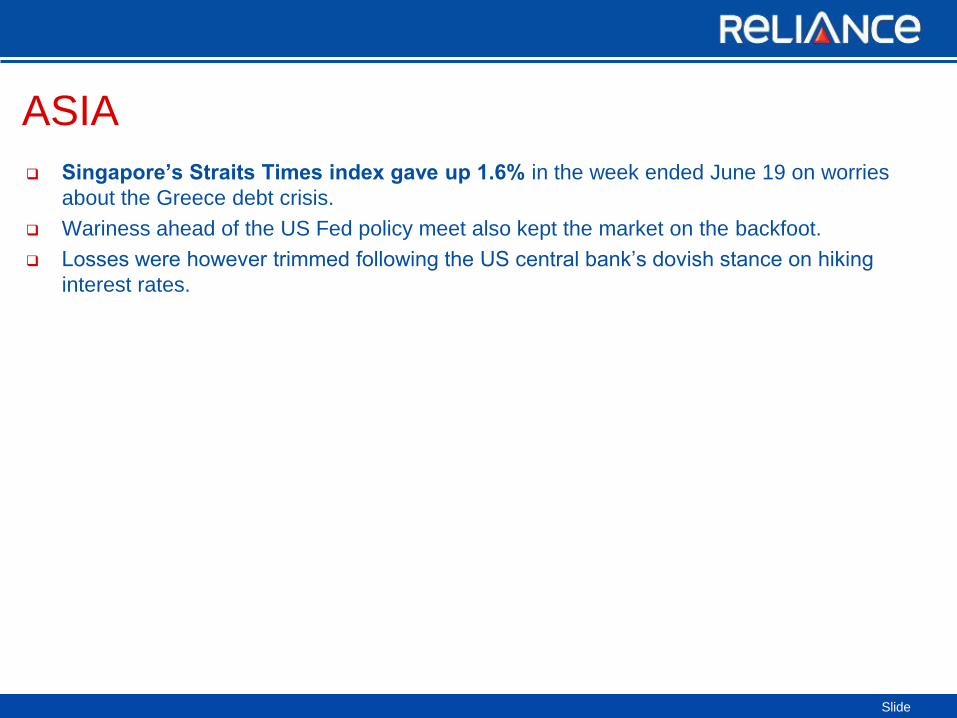
Singapore’s Straits Times index gave up 1.6% in the week ended June 19 on worries
about the Greece debt crisis.
Wariness ahead of the US Fed policy meet also kept the market on the backfoot.
Losses were however trimmed following the US central bank’s dovish stance on hiking
interest rates.

Slide
Indian Futures and Options Market Review
Nifty Futures
The Nifty near month contract (June 25, 2015) closed up with 12.65 point premium to the
spot index on June 19.
In the week ended June 19, the Nifty spot index rose 3.03% primarily boosted by the
steady progress in monsoon, positive macroeconomic numbers and a dovish stance by
the US Federal Reserve (Fed) on interest rate hike outlook.
The other Nifty future contract, viz., July contract ended at 8258 points (up 247 points
over the week) and August contract ended at 8298 points (up 239 points over the week).
Overall, Nifty futures saw a weekly trading volume of Rs 55,372 cr arising out of around
27 lakhs contracts with an open interest of nearly 183 lakhs.

Slide
Indian Futures and Options Market Review
Nifty Options
Nifty 8500 call witnessed the highest open interest of 80 lakh on June 19 and Nifty 8400
call saw the highest increase in open interest of 8 lakhs over the week.
Nifty 8200 call garnered the higher number of contracts over the week at 49 lakhs.
Nifty 8000 put witnessed the highest open interest of 118 lakh on June 19 and also saw
the highest increase in open interest of 40 lakhs over the week.
Nifty 8000 put also garnered the highest number of contracts over the week at 47 lakhs.
Overall, options saw 424 lakh contracts getting traded at a notional value of Rs 8,62,250 cr
during the week.

Slide
Indian Futures and Options Market Review
Week ended
June 19, 2015
Turnover
Rs. Cr. % to Total
Index Futures 82,017 6.71
Index Options 966,406 79.01
Stock Futures 117,318 9.59
Stock Options 57,446 4.70
Total 1,223,187 100.00
Put Call Ratio 1.21 (June 19) 0.73 (June 12)
Stock Futures and Options –
NSE witnessed 46 lakh contracts in stock futures valued at Rs 117,318 cr while stock options saw volumes of 22 lakh contracts valued at Rs 57,446 cr during the week ended June 19, 2015.
NSE F&O Turnover –
Overall turnover on NSE's derivatives segment stood at Rs 12.23 lakh cr (548 lakh contracts) during the week ended June 19 vs. Rs 9.99 lakh cr (445 lakh contracts) in the previous week.
Put Call ratio rose sharply to 1.21 on June 19 from 0.73 on June 12.
Slide
Indian Futures and Options Market Review
Source - SEBI
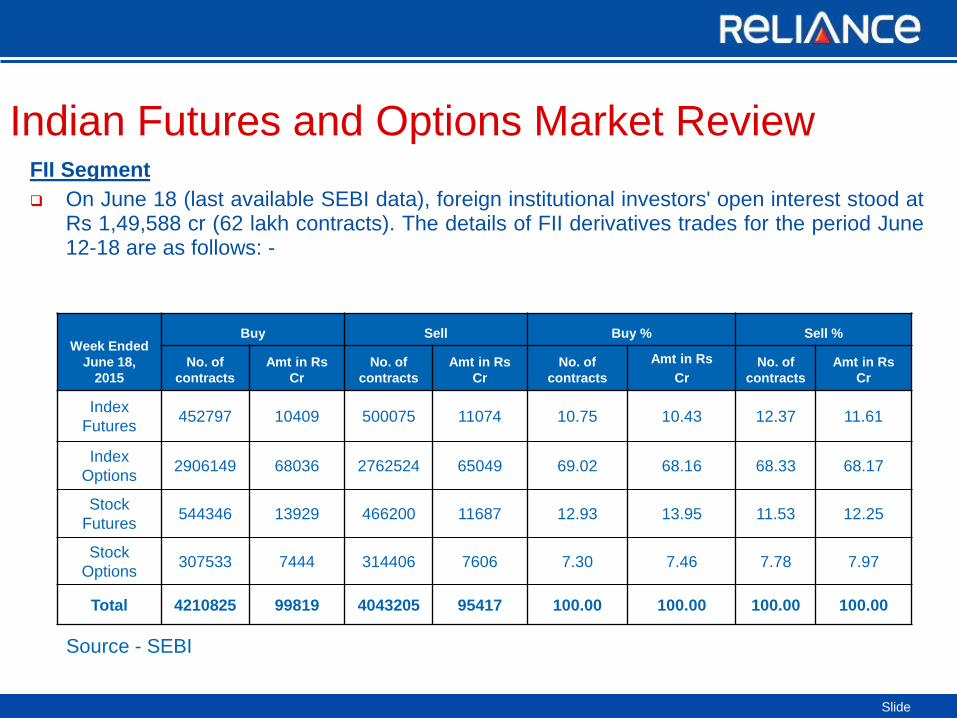
FII Segment
On June 18 (last available SEBI data), foreign institutional investors' open interest stood at Rs 1,49,588 cr (62 lakh contracts). The details of FII derivatives trades for the period June 12-18 are as follows: -
Week Ended
June 18,
2015
Buy Sell Buy % Sell %
No. of
contracts
Amt in Rs
Cr
No. of
contracts
Amt in Rs
Cr
No. of
contracts
Amt in Rs
Cr
No. of
contracts
Amt in Rs
Cr
Index
Futures 452797 10409 500075 11074 10.75 10.43 12.37 11.61
Index
Options 2906149 68036 2762524 65049 69.02 68.16 68.33 68.17
Stock
Futures 544346 13929 466200 11687 12.93 13.95 11.53 12.25
Stock
Options 307533 7444 314406 7606 7.30 7.46 7.78 7.97
Total 4210825 99819 4043205 95417 100.00 100.00 100.00 100.00

Slide
The Week Ahead Day Event
Monday, June 22
US Existing Home Sales, May
US Chicago Fed National Activity Index, May
Eurozone Consumer Confidence, June
Bank of Japan's Monthly Economic Report, June
Tuesday, June 23
US New Home Sales, May
US Durable Goods Orders, May
US Flash Manufacturing Purchasing Managers’ Index (PMI), June
Eurozone Markit Manufacturing, Services and Composite PMI, June
China’s HSBC Manufacturing PMI, June
Bank of Japan May 21-22 meeting minutes
Japan’s Markit/JMMA Manufacturing PMI, June
Wednesday, June 24
US GDP - Third Estimate, Q1
US Crude Oil Inventories, June 19
Japan’s Small Business Confidence, June
Thursday, June 25
US Personal Income & Spending, May
US Initial Jobless Claims, June 20
US Flash Services and Composite PMI, June
Japan’s Consumer Price Index, May
Japan’s Jobless Rate, May
Friday, June 26
University of Michigan Consumer Sentiment Index – Final, June
India’s Forex Reserves, June 19

Slide
Disclaimer The views expressed herein constitute only the opinions and do not constitute any guidelines or recommendation on any course of action to be
followed by the reader. This information is meant for general reading purposes only and is not meant to serve as a professional guide for the readers.
Certain factual and statistical (both historical and projected) industry and market data and other information was obtained by RCAM from independent,
third-party sources that it deems to be reliable, some of which have been cited above. However, RCAM has not independently verified any of such
data or other information, or the reasonableness of the assumptions upon which such data and other information was based, and there can be no
assurance as to the accuracy of such data and other information. Further, many of the statements and assertions contained in these materials reflect
the belief of RCAM, which belief may be based in whole or in part on such data and other information. The Sponsor, the Investment Manager, the
Trustee or any of their respective directors, employees, affiliates or representatives do not assume any responsibility for, or warrant the accuracy,
completeness, adequacy and reliability of such information. Whilst no action has been solicited based upon the information provided herein, due care
has been taken to ensure that the facts are accurate and opinions given are fair and reasonable. This information is not intended to be an offer or
solicitation for the purchase or sale of any financial product or instrument. Recipients of this information should rely on information/data arising out of
their own investigations. Readers are advised to seek independent professional advice, verify the contents and arrive at an informed investment
decision before making any investments. None of the Sponsor, the Investment Manager, the Trustee, their respective directors, employees, affiliates or
representatives shall be liable for any direct, indirect, special, incidental, consequential, punitive or exemplary damages, including lost profits arising in
any way from the information contained in this material. The Sponsor, the Investment Manager, the Trustee, any of their respective directors,
employees including the fund managers, affiliates, representatives including persons involved in the preparation or issuance of this material may from
time to time, have long or short positions in, and buy or sell the securities thereof, of company (ies) / specific economic sectors mentioned herein.
Statutory Details: Reliance Mutual Fund has been constituted as a trust in accordance with the provisions of the Indian Trusts Act, 1882. Sponsor:
Reliance Capital Limited. Trustee: Reliance Capital Trustee Company Limited. Investment Manager: Reliance Capital Asset Management Limited
(Registered Office of Trustee & Investment Manager: ‘H’ Block,1st Floor, Dhirubhai Ambani Knowledge City, Koparkhairne, Navi Mumbai - 400 710.
Maharashtra). The Sponsor, the Trustee and the Investment Manager are incorporated under the Companies Act 1956. The Sponsor is not
responsible or liable for any loss resulting from the operation of the Scheme beyond their initial contribution of Rs.1 lakh towards the setting up of the
Mutual Fund and such other accretions and additions to the corpus. Mutual fund investments are subject to market risks. Please read the
Scheme Information Document and Statement of Additional Information carefully before investing.
CRISIL Research, a division of CRISIL Limited (CRISIL) has taken due care and caution in preparing this Report based on the information obtained by
CRISIL from sources which it considers reliable (Data). However, CRISIL does not guarantee the accuracy, adequacy or completeness of the Data/
Report and is not responsible for any errors or omissions or for the results obtained from the use of Data/Report. This Report is not a recommendation
to invest/ disinvest in any company covered in the Report. CRISIL especially states that it has no financial liability whatsoever to the subscribers/
users/ transmitters/ distributors of this Report. CRISIL Research operates independently of, and does not have access to information obtained by
CRISIL’s Ratings Division/ CRISIL Risk and Infrastructure Solutions Limited (CRIS), which may, in their regular operations, obtain information of a
confidential nature. The views expressed in this Report are that of CRISIL Research and not of CRISIL’s Ratings Division / CRIS. No part of this
Report may be published/ reproduced in any form without CRISIL’s prior written approval.

Thank you