NEWS RELEASE PRUDENTIAL PLC GROUP COMMUNICATIONS …/media/Files/P/... · 14.11.2013 ·...
24
1 NEWS RELEASE PRUDENTIAL PLC GROUP COMMUNICATIONS 12 ARTHUR STREET LONDON EC4R 9AQ TEL 020 7220 7588 FAX 020 7548 3725 www.prudential.co.uk 8.15 am (GMT) 14 November 2013 PRUDENTIAL PLC THIRD QUARTER 2013 INTERIM MANAGEMENT STATEMENT Asian growth continues to drive strong Group performance Asia new business profit up 20 per cent year-to-date to £990 million M&G net inflows of £8.9 billion with third party FUM up 19 per cent to a record £124 billion Disciplined execution in the US with new business profit 11 per cent higher at £756 million UK retail new business profit resilient despite impact of regulatory changes Tidjane Thiam, Group Chief Executive, said: “As we get closer to the end of 2013, the Group has continued to make good progress in the third quarter. In Asia, our life business increased new business profit by 20 per cent in the first nine months. Our growth in Asia is supported by a number of key long-term fundamentals: a fast-growing and increasingly wealthy middle class, a positive demography i.e a young population, rising urbanisation, high savings rates, strong demand for accumulation and protection products and low insurance penetration. Our third- quarter performance illustrates that these positive long-term fundamentals are not affected by short-term financial market fluctuations. The scale and quality of our distribution and our product suite put us in a strong position to capture the savings and protection opportunity in our target Asian markets. “In the US, we continue to successfully execute our diversification strategy, with nearly a third of our variable annuity sales now accounted for by variable annuities without living benefit guarantees, led by increased sales of our Elite Access product. In the UK, our life business continues to focus on driving value over volume, while M&G has built on the momentum of the first half of the year, generating net inflows of £5.1 billion in the third quarter and increasing external funds under management to £124 billion, 19 per cent higher year on year. “We remain on track to achieve our 2013 ‘Growth and Cash’ objectives. In Asia, our focus on meeting the long-term savings and protection needs of a rapidly growing and increasingly wealthy middle class remains a key driver of resilient and sustainable profit growth. Our US and UK businesses remain focused on delivering earnings and cash.”
Transcript of NEWS RELEASE PRUDENTIAL PLC GROUP COMMUNICATIONS …/media/Files/P/... · 14.11.2013 ·...

1
NEWS RELEASE
PRUDENTIAL PLC GROUP COMMUNICATIONS 12 ARTHUR STREET LONDON EC4R 9AQ TEL 020 7220 7588 FAX 020 7548 3725 www.prudential.co.uk 8.15 am (GMT) 14 November 2013 PRUDENTIAL PLC THIRD QUARTER 2013 INTERIM MANAGEMENT STATEMENT
Asian growth continues to drive strong Group performance
Asia new business profit up 20 per cent year-to-date to £990 million
M&G net inflows of £8.9 billion with third party FUM up 19 per cent to a record £124 billion
Disciplined execution in the US with new business profit 11 per cent higher at £756 million
UK retail new business profit resilient despite impact of regulatory changes
Tidjane Thiam, Group Chief Executive, said: “As we get closer to the end of 2013, the Group has continued to make good progress in the third quarter. In Asia, our life business increased new business profit by 20 per cent in the first nine months. Our growth in Asia is supported by a number of key long-term fundamentals: a fast-growing and increasingly wealthy middle class, a positive demography i.e a young population, rising urbanisation, high savings rates, strong demand for accumulation and protection products and low insurance penetration. Our third-quarter performance illustrates that these positive long-term fundamentals are not affected by short-term financial market fluctuations. The scale and quality of our distribution and our product suite put us in a strong position to capture the savings and protection opportunity in our target Asian markets. “In the US, we continue to successfully execute our diversification strategy, with nearly a third of our variable annuity sales now accounted for by variable annuities without living benefit guarantees, led by increased sales of our Elite Access product. In the UK, our life business continues to focus on driving value over volume, while M&G has built on the momentum of the first half of the year, generating net inflows of £5.1 billion in the third quarter and increasing external funds under management to £124 billion, 19 per cent higher year on year. “We remain on track to achieve our 2013 ‘Growth and Cash’ objectives. In Asia, our focus on meeting the long-term savings and protection needs of a rapidly growing and increasingly wealthy middle class remains a key driver of resilient and sustainable profit growth. Our US and UK businesses remain focused on delivering earnings and cash.”

PRUDENTIAL PLC THIRD QUARTER 2013 INTERIM MANAGEMENT STATEMENT
2
BUSINESS UNIT REVIEW ASIA Our Asian business has delivered a strong performance for the first nine months of the year, demonstrating the resilience of the business to short-term investment market volatility and its gearing to positive, long-term structural trends. Our businesses continue to perform well underpinned by our diversified geographic footprint, multi-channel distribution platform and the disciplined execution of our strategy to drive both value and volume by focusing on providing regular premium savings and protection products to the region’s rapidly growing middle classes. New business profit in Asia increased by 20 per cent to £990 million for the first nine months of 2013 and we remain on track to achieve our remaining Asia growth objective of doubling 2009 new business profit to £1,426 million by the end of this year. The increase in new business profit reflects both higher volumes, with APE up 15 per cent to £1,523 million in the year-to-date, and the benefit of favourable changes in country mix, channel mix and economic assumptions following the rise in interest rates, particularly in Hong Kong. In the third quarter new business APE grew by 20 per cent to £513 million, which is a record for the third quarter. This growth has been broad based, with double digit growth in six of our sweet-spot1 markets in South-east Asia including Hong Kong, and in nine markets overall. Both our main distribution channels contributed strongly to this performance with third-quarter agency APE growing by 19 per cent and bancassurance APE up by 27 per cent. In our larger markets, Hong Kong has delivered year-to-date APE growth of 23 per cent mainly reflecting the excellent productivity of our agency force as Hong Kong continues to derive a significant amount of activity from its close links with mainland China. Indonesia APE grew by 22 per cent on a constant currency basis. The decline of the rupiah in the period means that the equivalent reported APE growth is 15 per cent. This strong growth on a constant currency basis illustrates the continuing strength of our agency distribution in this market with low penetration and vast potential. In Singapore our highly professional and productive agency business grew year-to-date APE by 21 per cent and our bank partners also continue to perform well with collective growth of 17 per cent. APE growth of 4 per cent in the first nine months in Malaysia reflects our strategy to de-emphasise higher volume but lower value top-ups in the second half of 2012. However, the 11 per cent increase in the third quarter is more representative of the underlying growth achieved reflecting our focus on protection products and on strengthening our Bumi distribution capabilities. Our new, exclusive distribution agreement with Thailand’s Thanachart Bank has had a very encouraging start with 96 per cent of Thanachart’s 600 plus branches being active since the completion of the transaction in May 2013. This strong start has helped deliver £22 million of third quarter APE for Prudential Thailand, accelerating the year-to-date growth to 68 per cent over 2012. In our other South-east Asian markets, the Philippines and Vietnam have delivered strong growth in the year-to-date with APE sales up 24 per cent and 28 per cent respectively. Our new start-up operation in Cambodia is also progressing well, and on 29 October we received regulatory approval to establish a representative office in Myanmar. In our North Asian markets, China continues to make excellent progress growing year-to-date APE by 48 per cent with equal contributions from both our agency and bank channels. In India the life insurance market remains complex, but we have seen year-to-date APE growth at reported exchange rates of 8 per cent with 14 per cent growth on a constant currency basis. In Korea sales growth for the third quarter slowed as anticipated after an exceptionally strong first half that coincided with changes in tax regulations. In Taiwan, APE declined 35 per cent in the first nine months, reflecting our decision since the second half of 2012 not to provide low-margin guaranteed products. Taiwan’s discrete third quarter growth of 17 per cent reflects an increase in sales through our partner Standard Chartered Bank. Our Asia asset management business, Eastspring Investments ended the quarter with funds under management (FUM) of £59.7 billion, up 7 per cent over the same time last year. FUM from external parties2 rose by 12 per cent to £18.5 billion, benefiting from third party net inflows of £2.0 billion (2012: £1.0 billion) in the first nine months. On 30 September 2013, Eastspring Investments formally announced that it has received regulatory approval to open a London distribution office, in line with its strategy to broaden its reach outside of Asia. Our project to domesticate our Hong Kong insurance business is approaching its conclusion, with the completion timetable approved by the UK and Hong Kong courts in September 2013. The aim is for the transfer to become effective on 1 January 2014.

PRUDENTIAL PLC THIRD QUARTER 2013 INTERIM MANAGEMENT STATEMENT
3
Overall, our business in Asia continues to deliver strong and profitable growth driven by our leading positions in the fast growing sweet-spot markets of South-east Asia, our excellent and competitive product suite well suited to our customers’ needs, and the scale and quality of our market leading multi-channel, multi-product platform. US Jackson’s new business profit in the first nine months of 2013 increased 11 per cent to £756 million, compared to the same period last year, as we continue to optimise the balance between volume, value, risk, cash and capital. Higher new business profits were achieved this year in spite of the deliberate slow-down in sales of variable annuities (VAs) with guarantees, reflecting the benefit of pricing and product actions taken by Jackson, the contribution from Elite Access and the positive effects of higher long-term yields. Our focus in Jackson is on delivering earnings and cash, led by growth in separate account assets under management. Total annuity flows in the first nine months of 2013 were £6.5 billion, of which £2.1 billion reflects flows in the discrete third quarter. As a result, at the end of the period Jackson’s statutory separate account assets were £61.2 billion and general account assets were £38.8 billion, up 30 per cent and in-line respectively with the same period in 2012. In the first nine months of 2013, Jackson achieved retail APE sales of £1,129 million, a 2 per cent increase compared to the same period in 2012. These sales levels were achieved while maintaining pricing discipline and continuing to write new business at aggregate internal rates of return in excess of 20 per cent. Including institutional sales, total APE was £1,202 million, a 6 per cent increase over the same period in 2012. Total variable annuity APE increased to £1,000 million (2012: £970 million) for the first nine months of 2013. This growth was driven by the rapid progress of Elite Access, a variable annuity product without guarantees launched last year, which contributed £191 million of APE in the period (2012: £40 million). Excluding Elite Access, VA sales of £809 million were 13 per cent lower than the prior year, which is the direct result of our disciplined approach to cycle management in the VA market. The on-going diversification of our business means that 30 per cent of our year-to-date VA sales do not feature any living benefit guarantees (2012: 15 per cent). Fixed annuity sales of £44 million remained relatively flat compared to 2012, while fixed index annuity APE sales of £84 million increased 6 per cent compared to the same period in 2012. Curian Capital, the specialised asset management company of Jackson, that provides innovative fee-based separately managed accounts, had FUM of £6.4 billion at the end of September 2013 compared with £5.5 billion at the end of 2012. Curian attracted deposits of £1.4 billion in the first nine months of 2013, a 13 per cent increase compared to the same period in 2012. In the US, we continue to price new business on a conservative basis targeting value over volume, and our financial market hedging remains focused on optimising the economics of our exposures and therefore accepting a degree of volatility in our accounting results where they are not aligned with the underlying economics. This approach has enabled Jackson to deliver significant profitable growth across the cycle while maintaining a strong balance sheet. Jackson completed a review of policyholder behaviour during the third quarter, which showed that experience continues to emerge generally in line with our assumptions. We are also pleased that earnings in relation to REALIC in the first year of its ownership are in line with our expectations at the time of the acquisition. UK During the first nine months of 2013, the UK life and pensions industry continued to experience the effects of significant regulatory change following the implementation of the Retail Distribution Review (RDR) and introduction of the ABI Code on Retirement Choices. Total new business profit of £204 million was 10 per cent lower than in the first nine months of 2012, reflecting lower sales of bulk annuities in the period. Retail new business profit was 2 per cent above the first nine months of 2012, reflecting the combined positive effects of business mix, pricing actions and higher long-term interest rates. Total APE sales of £540 million were 12 per cent lower than in the first nine months of 2012, and included a contribution of £15 million from bulk annuities (2012: £41 million). Retail APE sales of £525 million were 9 per cent lower principally due to the anticipated reduction in sales of with-profits bonds following the implementation of RDR and lower corporate pensions sales. Individual annuities APE sales of £161 million were 3 per cent lower than the prior period. The reduction is due to lower internal vesting sales, which declined 6 per cent to £98 million, reflecting increased customer deferrals which offset the impact of higher average fund values and stable vesting rates. Sales of with-profits annuities increased by 15 per cent to £66 million. The strength of

PRUDENTIAL PLC THIRD QUARTER 2013 INTERIM MANAGEMENT STATEMENT
4
our with-profits proposition continues to drive good demand for our Income Choice Annuity, which offers customers relatively attractive returns in the current sustained low interest rate environment, with the potential for income growth. APE sales of onshore bonds of £126 million were 22 per cent lower than the first nine months of 2012, driven by with-profits bond APE sales of £114 million which reduced by 25 per cent. The anticipated reduction in with-profits bond sales followed the implementation of the requirements of RDR at the beginning of 2013 and is mainly attributable to the subsequent contraction in adviser numbers, particularly within banks which were previously major distributors of bonds. Sales through financial advisers remained strong, despite disruption caused by the transition to the new distribution landscape. Corporate pensions APE sales of £138 million were 7 per cent lower than in the same period last year, mainly due to lower incremental sales and fewer additional members joining public sector schemes. We continue to focus on securing new members and incremental business rather than new corporate pensions schemes, where the opportunities to write business on economically attractive terms are limited. In the Wholesale market, bulk sales totalled £15 million in the first nine months of 2013, including one large transaction completed in the third quarter (2012: two deals, APE £41 million). We continue to maintain our focus on value and only participate opportunistically in capital-efficient transactions that meet our return on capital and payback requirements. APE sales of other products, principally individual pensions, PruProtect, PruHealth and offshore bonds, of £100 million were in line with the first nine months of 2012. M&G Stock markets have continued to make gains during the third quarter with investors favouring risk assets over low-yielding bonds and cash. However, investor sentiment remains sensitive to speculation about the timing and pace of the US Federal Reserve’s intention to unwind its quantitative easing programme. Against this backdrop, M&G has reported steady inflows for the three months to the end of September 2013. Total net inflows for the quarter were £5.1 billion, taking the cumulative total since the start of the year to £8.9 billion. In Retail, M&G’s European businesses continue to be the main engine of growth. During the first nine months of the year, net fund flows from Europe reached £6.4 billion, an 82 per cent increase over the same period in 2012. In the UK, retail net flows remain impacted by our proactive decision to slow contributions to two of our market-leading corporate bond funds to protect their investment performance, with inflows of £0.3 billion in the third quarter. Total net retail inflows for the quarter were £1.1 billion and for the year-to-date amount to £5.9 billion, being 4 per cent lower than at the same stage in 2012, which was itself a record year. Retail funds under management (FUM) increased by 24 per cent year-on-year to £64.5 billion at 30 September 2013. Of this, FUM from European clients total £22.1 billion, up from £12.3 billion at 30 September 2012 and now account for over a third of total retail FUM. M&G’s strategy of diversifying its business, not only by country and channel, but also by fund and asset class, continues to be successful. While 12 months ago sales were heavily concentrated in fixed income funds, reflecting investor buying preferences, the third quarter saw an increased proportion of net fund sales being derived from equity funds, multi asset and property. M&G Optimal Income and M&G Global Dividend remain our best sellers, with a total of eight funds attracting net inflows of at least £150 million each in the year-to-date, highlighting the strength and breadth of our overall product portfolio. The Institutional business posted net inflows of £4.0 billion during the third quarter, resulting in total net inflows for the year of £3.0 billion. Sales of alternative credit products remain strong, especially asset-backed and inflation-linked investment strategies, along with leveraged loan, infrastructure and real estate finance mandates. The Institutional business also has a multi-billion pound pipeline of new business wins which have yet to be funded. Total FUM have risen to £242.2 billion at the end of September 2013, up 12 per cent year on year. Over the same period, external client assets increased by 19 per cent to £124.3 billion; net inflows contributed 14 percentage points of this growth with the remaining 5 percentage points attributable to market movements.

PRUDENTIAL PLC THIRD QUARTER 2013 INTERIM MANAGEMENT STATEMENT
5
BALANCE SHEET Our balance sheet remains resilient and conservatively positioned. As at 30 September 2013, our IGD surplus was £3.9 billion, after deducting the 2013 interim dividend. This is equivalent to a cover of 2.3 times. INVESTOR CONFERENCE Prudential plc will be holding an investor conference for analysts and investors on Tuesday 10 December 2013 in London. OUTLOOK Our businesses continue to perform well with a particularly strong performance in Asia in the third quarter. We believe the global economic environment is increasingly supportive for our Group. There is some evidence of a recovery in the US, an increasingly positive outlook for the UK and growth in mainland China is stabilising while the economies in our key Asian markets are continuing to grow, albeit at a lower rate than in prior years. These emerging economies of Asia will continue to grow significantly faster than developed economies3. With healthy fiscal positions and low debt-to-GDP ratios, these countries have several levers they can pull to continue to do well across the economic cycle. The central point for Prudential is that the long-term structural trends in Asia of faster GDP growth, low insurance penetration, a rapidly growing and wealthier middle class, high savings rates and strong demand from the middle class for protection remain intact and are a key driver of sustainable and profitable growth for the company. Our regular premium offering, with health and protection features, is the right product for the young, emerging Asian middle class, at the right time and in the right place. It satisfies a fundamental need for our customers and helps close the significant ‘protection gap’ present in some of the fast-growing South-east Asian economies with low welfare provision. It also ensures our performance is resilient in times of increased market volatility, as 90 per cent of our business is regular premium, and drives sustained long-term shareholder value creation. In the UK and US, our performance continues to benefit from our disciplined approach and the prioritisation of earnings and cash over volumes. We will continue to execute our strategy with discipline. We will do this while maintaining a strong balance sheet, which is absolutely key to meeting our commitments to our 25 million customers around the world. We remain confident about our prospects for the rest of the year and our positioning for the long term.

PRUDENTIAL PLC THIRD QUARTER 2013 INTERIM MANAGEMENT STATEMENT
6
1. Q3 2013 Business Unit financial highlights New Business Profit 4 YTD 2013 YTD 2012 % change Q3 2013 Q3 2012 % changeAsia £990m £828m 20% £331m £281m 18%US £756m £683m 11% £277m £241m 15%UK £204m £227m (10)% £74m £75m (1)%Total Group Insurance £1,950m £1,738m 12% £682m £597m 14%
Sales - APE YTD 2013 YTD 2012 % change Q3 2013 Q3 2012 % changeAsia £1,523m £1,328m 15% £513m £429m 20%US £1,202m £1,133m 6% £405m £414m (2)%UK £540m £617m (12)% £185m £205m (10)%Total Group Insurance £3,265m £3,078m 6% £1,103m £1,048m 5%
Investment Flows YTD 2013 YTD 2012 % change6 Q3 2013 Q3 2012 % change6
Gross inflows
Retail £21.3bn £16.0bn 33% £5.9bn £4.9bn 21%Institutional £10.6bn £9.2bn 14% £5.4bn £5.6bn (5)%M&G - total £31.9bn £25.2bn 26% £11.3bn £10.5bn 7%Eastspring Investments5 £9.6bn £6.5bn 49% £2.2bn £2.7bn (16)%Total Group £41.5bn £31.7bn 31% £13.5bn £13.2bn 2%Net inflows
Retail £5.9bn £6.1bn (4)% £1.1bn £1.9bn (39)%Institutional £3.0bn £5.2bn (42)% £4.0bn £4.5bn (13)%M&G - total £8.9bn £11.3bn (21)% £5.1bn £6.4bn (21)%Eastspring Investments5 £2.0bn £1.0bn 97% £0.0bn £0.6bn (95)%Total Group £10.9bn £12.3bn (11)% £5.1bn £7.0bn (27)%
Funds Under Management7 YTD 2013 YTD 2012 % changeM&G £242.2bn £216.9bn 12%Eastspring Investments £59.7bn £56.0bn 7%Total Group £301.9bn £272.9bn 11%External Funds Under Management8
M&G £124.3bn £104.2bn 19% Eastspring Investments £18.5bn £16.5bn 12% Total Group £142.8bn £120.7bn 18%
ENDS Enquiries: Media Investors/Analysts
Jonathan Oliver +44 (0)20 7548 3719 Raghu Hariharan +44 (0)20 7548 2871
Robin Tozer +44 (0)20 7548 2776 Richard Gradidge +44 (0)20 7548 3860
1 Hong Kong, Indonesia, Malaysia, the Philippines, Singapore, Thailand and Vietnam 2 External funds under management for Eastspring excluding Money Market Funds as set out in schedule 3 3 2014 GDP growth projections as per IMF World Economic Outlook, October 2013: Developing Asia 6.5%; Advanced Economies 2.0% 4 New business profits have been calculated by applying the assumptions set out in schedule 5 5 Gross and net investment inflows excluding Eastspring Money Market Funds. Investment flows exclude Eastspring Money Market Funds (MMF) gross inflows of
£45,464 million (Q3 2012 year-to-date: £39,550 million) and net outflows of £82 million (Q3 2012 year-to-date: net outflows of £217 million) 6 Percentages based on unrounded numbers 7 Total Funds under management include all external and internal funds 8 Excludes Eastspring Money Market Funds

PRUDENTIAL PLC THIRD QUARTER 2013 INTERIM MANAGEMENT STATEMENT
7
Notes:
1. Annual premium equivalent (APE) sales comprise regular premium sales plus one-tenth of single premium insurance sales and are subject to rounding.
2. Present Value of New Business Premiums (PVNBP) are calculated as equalling single premiums plus the present value of
expected new business premiums of regular premium business, allowing for lapses and other assumptions made in determining the EEV new business contribution.
3. NBP assumptions for the period are detailed in the accompanying schedule 5. 4. There will be a conference call today for the media at 09.15 (UK) / 17.15 (Hong Kong) hosted by Tidjane Thiam, Group Chief
Executive. Dial in telephone number: (UK) +44 (0)203 139 4830 (Hong Kong) +852 3068 9834 Pin: 74820219#. 5. There will be a conference call today for analysts and investors at 10.30 (UK) / 18.30 (Hong Kong) hosted by Tidjane Thiam,
Group Chief Executive. Dial in telephone number: +44 (0)203 139 4830 / 0808 237 0030 (Freephone UK) Pin: 19738872# Playback (PIN: 643415#) +44(0)203 426 2807 / 0808 237 0026 (Freephone UK) (available from 12.30 (UK) on 14 November 2013 until 23.59 (UK) on 13 December 2013).
6. High resolution photographs are available to the media free of charge at www.prudential.co.uk/media/group-images-and-
videos or by calling the media office on +44 (0) 207 548 2776. 7. Sales for overseas operations have been reported using average exchange rates for the period as shown in the attached
schedules. Reference to prior year figures in the commentary is on an actual exchange rate basis unless stated. An alternative method of presentation is on a constant exchange rate basis shown in supplementary schedules 1B, 2B, 2C, 4B and 4C.
8. Prudential plc is incorporated in England and Wales, and its affiliated companies constitute one of the world's leading financial
services groups. It provides insurance and financial services through its subsidiaries and affiliates throughout the world. It has been in existence for 165 years and has £427 billion in assets under management (as at 30 June 2013). Prudential plc is not affiliated in any manner with Prudential Financial, Inc., a company whose principal place of business is in the United States of America.
9. Forward-Looking Statements
This document may contain ‘forward-looking statements’ with respect to certain of Prudential's plans and its goals and expectations relating to its future financial condition, performance, results, strategy and objectives. Statements that are not historical facts, including statements about Prudential’s beliefs and expectations and including, without limitation, statements containing the words “may”, “will”, “should”, “continue”, “aims”, “estimates”, “projects”, “believes”, “intends”, “expects”, “plans”, “seeks” and “anticipates”, and words of similar meaning, are forward-looking statements. These statements are based on plans, estimates and projections as at the time they are made, and therefore undue reliance should not be placed on them. By their nature, all forward-looking statements involve risk and uncertainty. A number of important factors could cause Prudential's actual future financial condition or performance or other indicated results to differ materially from those indicated in any forward-looking statement. Such factors include, but are not limited to, future market conditions, including fluctuations in interest rates and exchange rates and the potential for a sustained low-interest rate environment, and the performance of financial markets generally; the policies and actions of regulatory authorities, including, for example, new government initiatives related to the financial crisis and the effect of the European Union's ‘Solvency II’ requirements on Prudential's capital maintenance requirements; the impact of designation as a global systemically important insurer; the impact of competition, economic growth, inflation, and deflation; experience in particular with regard to mortality and morbidity trends, lapse rates and policy renewal rates; the timing, impact and other uncertainties of future acquisitions or combinations within relevant industries; the impact of changes in capital, solvency standards, accounting standards or relevant regulatory frameworks, and tax and other legislation and regulations in the jurisdictions in which Prudential and its affiliates operate; and the impact of legal actions and disputes. These and other important factors may for example result in changes to assumptions used for determining results of operations or re-estimations of reserves for future policy benefits. Further discussion of these and other important factors that could cause Prudential's actual future financial condition or performance or other indicated results to differ, possibly materially, from those anticipated in Prudential's forward-looking statements can be found under the ‘Risk factors’ heading in its most recent Annual Report and the ‘Risk Factors’ heading of Prudential's most recent annual report on Form 20-F filed with the U.S. Securities and Exchange Commission, as well as under the ‘Risk Factors’ heading of any

PRUDENTIAL PLC THIRD QUARTER 2013 INTERIM MANAGEMENT STATEMENT
8
subsequent Prudential Half Year Financial Report. Prudential's most recent Annual Report, Form 20-F and any subsequent Half Year Financial Report are/will be available on its website at www.prudential.co.uk.
Any forward-looking statements contained in this document speak only as of the date on which they are made. Prudential expressly disclaims any obligation to update any of the forward-looking statements contained in this document or any other forward-looking statements it may make, whether as a result of future events, new information or otherwise except as required pursuant to the UK Prospectus Rules, the UK Listing Rules, the UK Disclosure and Transparency Rules, the Hong Kong Listing Rules, the SGX-ST listing rules or other applicable laws and regulations.
10. The financial information presented in this Interim Management Statement and accompanying schedules is unaudited.

PRUDENTIAL PLC THIRD QUARTER 2013 INTERIM MANAGEMENT STATEMENT
9
Supplementary schedules
Contents
Page
Schedule 1A
New Business Insurance Operations (Reported Exchange Rates)
10
Schedule 1B
New Business Insurance Operations (Constant Exchange Rates)
11
Schedule 2A
Total Insurance New Business APE – By Quarter (Reported Exchange Rates)
12
Schedule 2B
Total Insurance New Business APE – By Quarter (Constant Exchange Rates for 2012)
13
Schedule 2C
Total Insurance New Business APE – By Quarter (Constant Exchange Rates)
14
Schedule 3
Investment Operations – By Quarter (Reported Exchange Rates)
15
Schedule 4A
New Business Profit and Margin (% APE and % PVNBP) (Reported Exchange Rates)
16
Schedule 4B
New Business Profit and Margin (% APE and % PVNBP) (Constant Exchange Rates for 2012)
17
Schedule 4C
New Business Profit and Margin (% APE and % PVNBP) (Constant Exchange Rates)
18
Schedule 5
EEV New Business Methodology and Assumptions
19
Schedule 6
Capital Management
22
Schedule 7
Basis of preparation
23

PRUDENTIAL PLC THIRD QUARTER 2013 INTERIM MANAGEMENT STATEMENT
10
Schedule 1A – Reported Exchange Rates PRUDENTIAL PLC – NEW BUSINESS – Q3 2013 INSURANCE OPERATIONS
Single Regular Annual Equivalents(3) PVNBP
Q3 2013 Q3 2012 Q3 2013 Q3 2012 Q3 2013 Q3 2012 Q3 2013 Q3 2012
YTD YTD +/- (%) YTD YTD +/- (%) YTD YTD +/- (%) YTD YTD +/- (%)
£m £m £m £m £m £m £m £mGroup Insurance Operations
Asia (1a) 1,562 1,071 46% 1,366 1,221 12% 1,523 1,328 15% 8,206 7,074 16%US(1a) 12,006 11,221 7% 1 11 (91)% 1,202 1,133 6% 12,006 11,308 6%UK 3,744 4,514 (17)% 165 166 (1)% 540 617 (12)% 4,398 5,264 (16)%Group Total 17,312 16,806 3% 1,532 1,398 10% 3,265 3,078 6% 24,610 23,646 4%
Asia Insurance Operations(1a)
Hong Kong 214 101 112% 314 263 19% 335 273 23% 1,922 1,574 22%
Indonesia 264 247 7% 321 279 15% 348 303 15% 1,453 1,242 17%Malaysia 79 69 14% 143 138 4% 151 145 4% 1,001 892 12%Philippines 163 131 24% 24 20 20% 41 33 24% 239 188 27%Singapore 373 277 35% 220 189 16% 257 217 18% 1,831 1,564 17%Thailand 44 9 389% 42 27 56% 47 28 68% 199 106 88%Vietnam 1 1 - 37 29 28% 37 29 28% 136 102 33%SE Asia Operations inc. Hong Kong 1,138 835 36% 1,101 945 17% 1,216 1,028 18% 6,781 5,668 20%China(7) 95 27 252% 59 43 37% 68 46 48% 342 218 57%Korea 229 26 781% 62 64 (3)% 85 67 27% 465 353 32%Taiwan 73 131 (44)% 66 99 (33)% 73 112 (35)% 321 514 (38)%India(5) 27 52 (48)% 78 70 11% 81 75 8% 297 321 (7)%Total Asia Operations 1,562 1,071 46% 1,366 1,221 12% 1,523 1,328 15% 8,206 7,074 16%
US Insurance Operations(1a)
Variable Annuities 8,096 9,295 (13)% - - N/A 809 930 (13)% 8,096 9,295 (13)%
Elite Access (variable annuity) 1,909 400 377% - - N/A 191 40 378% 1,909 400 377%Fixed Annuities 439 452 (3)% - - N/A 44 45 (2)% 439 452 (3)%Fixed Index Annuities 835 790 6% - - N/A 84 79 6% 835 790 6%Life - 5 (100)% 1 11 (91%) 1 11 (91)% - 92 (100)%Wholesale 727 279 161% - - N/A 73 28 161% 727 279 161%Total US Insurance Operations 12,006 11,221 7% 1 11 (91)% 1,202 1,133 6% 12,006 11,308 6%
UK & Europe Insurance Operations
Direct and Partnership Annuities 223 214 4% - - N/A 22 21 5% 223 214 4%
Intermediated Annuities 406 411 (1)% - - N/A 41 41 - 406 411 (1)%Internal Vesting Annuities 981 1,036 (5)% - - N/A 98 104 (6)% 981 1,036 (5)%Total Individual Annuities 1,610 1,661 (3)% - - N/A 161 166 (3)% 1,610 1,661 (3)%Corporate Pensions 103 179 (42)% 127 130 (2)% 138 148 (7)% 553 757 (27)%On-shore Bonds 1,263 1,613 (22)% - - N/A 126 161 (22)% 1,264 1,613 (22)%Other Products 622 648 (4)% 38 36 6% 100 101 (1)% 825 820 1%Wholesale 146 413 (65)% - - N/A 15 41 (63)% 146 413 (65)%Total UK & Europe Insurance Operations 3,744 4,514 (17)% 165 166 (1)% 540 617 (12)% 4,398 5,264 (16)%Group Total 17,312 16,806 3% 1,532 1,398 10% 3,265 3,078 6% 24,610 23,646 4%

PRUDENTIAL PLC THIRD QUARTER 2013 INTERIM MANAGEMENT STATEMENT
11
Schedule 1B – Constant Exchange Rates PRUDENTIAL PLC – NEW BUSINESS – Q3 2013 INSURANCE OPERATIONS Note: In schedule 1B constant exchange rates have been used to calculate insurance new business for overseas operations for all
periods in 2012.
Single Regular Annual Equivalents(3) PVNBP
Q3 2013 Q3 2012 Q3 2013 Q3 2012 Q3 2013 Q3 2012 Q3 2013 Q3 2012
YTD YTD +/- (%) YTD YTD +/- (%) YTD YTD +/- (%) YTD YTD +/- (%)
£m £m £m £m £m £m £m £mGroup Insurance Operations
Asia (1a) (1b) 1,562 1,074 45% 1,366 1,221 12% 1,523 1,331 14% 8,206 7,119 15%US(1a) (1b) 12,006 11,449 5% 1 11 (91)% 1,202 1,156 4% 12,006 11,538 4%UK 3,744 4,514 (17)% 165 166 (1)% 540 617 (12)% 4,398 5,264 (16)%Group Total 17,312 17,037 2% 1,532 1,398 10% 3,265 3,104 5% 24,610 23,921 3%
Asia Insurance Operations(1a)
(1b)
Hong Kong
214 103 108% 314 268 17% 335 278 21% 1,922 1,606 20%Indonesia 264 233 13% 321 263 22% 348 286 22% 1,453 1,171 24%Malaysia 79 70 13% 143 139 3% 151 147 3% 1,001 901 11%Philippines 163 135 21% 24 20 20% 41 34 21% 239 194 23%Singapore 373 285 31% 220 194 13% 257 222 16% 1,831 1,605 14%Thailand 44 9 389% 42 29 45% 47 30 57% 199 111 79%Vietnam 1 1 0% 37 29 28% 37 30 23% 136 104 31%SE Asia Operations inc. Hong Kong 1,138 836 36% 1,101 942 17% 1,216 1,027 18% 6,781 5,692 19%China(7) 95 28 239% 59 45 31% 68 48 42% 342 228 50%Korea 229 27 748% 62 67 (7)% 85 71 20% 465 372 25%Taiwan 73 134 (46)% 66 101 (35)% 73 114 (36)% 321 524 (39)%India(5) 27 49 (45)% 78 66 18% 81 71 14% 297 303 (2)%Total Asia Operations 1,562 1,074 45% 1,366 1,221 12% 1,523 1,331 14% 8,206 7,119 15%
US Insurance Operations(1a) (1b)
Variable Annuities
8,096 9,485 (15)% - - N/A 809 948 (15)% 8,096 9,485 (15)%Elite Access (variable annuity) 1,909 407 369% - - N/A 191 41 366% 1,909 407 369%Fixed Annuities 439 461 (5)% - - N/A 44 46 (4)% 439 461 (5)%Fixed Index Annuities 835 806 4% - - N/A 84 81 4% 835 806 4%Life - 5 (100)% 1 11 (91)% 1 12 (92)% - 94 (100)%Wholesale 727 285 155% - - N/A 73 28 161% 727 285 155%Total US Insurance Operations 12,006 11,449 5% 1 11 (91)% 1,202 1,156 4% 12,006 11,538 4%
UK & Europe Insurance Operations
Direct and Partnership Annuities
223 214 4% - - N/A 22 21 5% 223 214 4%Intermediated Annuities 406 411 (1)% - - N/A 41 41 0% 406 411 (1)%Internal Vesting Annuities 981 1,036 (5)% - - N/A 98 104 (6)% 981 1,036 (5)%Total Individual Annuities 1,610 1,661 (3)% - - N/A 161 166 (3)% 1,610 1,661 (3)%Corporate Pensions 103 179 (42)% 127 130 (2)% 138 148 (7)% 553 757 (27)%On-shore Bonds 1,263 1,613 (22)% - - N/A 126 161 (22)% 1,264 1,613 (22)%Other Products 622 648 (4)% 38 36 6% 100 101 (1)% 825 820 1%Wholesale 146 413 (65)% - - N/A 15 41 (63)% 146 413 (65)%Total UK & Europe Insurance Operations 3,744 4,514 (17)% 165 166 (1)% 540 617 (12)% 4,398 5,264 (16)%Group Total 17,312 17,037 2% 1,532 1,398 10% 3,265 3,104 5% 24,610 23,921 3%

PRUDENTIAL PLC THIRD QUARTER 2013 INTERIM MANAGEMENT STATEMENT
12
Schedule 2A - Reported Exchange Rates PRUDENTIAL PLC - NEW BUSINESS – Q3 2013 TOTAL INSURANCE NEW BUSINESS APE - BY QUARTER 2012 2013
Q1 Q2 Q3 Q4 Q1 Q2 Q3
£m £m £m £m £m £m £mGroup Insurance Operations Asia (1a) 443 456 429 569 495 515 513 US(1a) 332 387 414 329 358 439 405 UK 189 223 205 219 185 170 185 Group Total 964 1,066 1,048 1,117 1,038 1,124 1,103
Asia Insurance Operations(1a)
Hong Kong
85 92 96 123 107 107 121Indonesia 97 109 97 143 112 128 108Malaysia 45 53 47 73 46 53 52Philippines 10 11 12 12 14 15 12Singapore 72 69 76 84 80 90 87Thailand 11 8 9 9 11 14 22Vietnam 7 11 11 16 10 13 14SE Asia Operations inc. Hong Kong 327 353 348 460 380 420 416 China(7) 17 16 13 10 27 20 21Korea 21 24 22 28 30 32 23Taiwan 43 45 24 44 19 26 28India(5) 35 18 22 27 39 17 25 Total Asia Insurance Operations 443 456 429 569 495 515 513
US Insurance Operations(1a)
Variable Annuities
279 318 333 230 240 298 271Elite Access (variable annuity) - 14 26 45 54 73 64Fixed Annuities 16 15 14 13 14 16 14Fixed Index Annuities 25 25 29 30 34 28 22Life 4 4 3 1 1 - -Wholesale 8 11 9 10 15 24 34Total US Insurance Operations 332 387 414 329 358 439 405
UK & Europe Insurance Operations
Direct and Partnership Annuities
7 7 7 9 8 7 7Intermediated Annuities 10 15 16 24 15 14 12Internal Vesting annuities 31 35 38 42 32 35 31Total Individual Annuities 48 57 61 75 55 56 50 Corporate Pensions 49 55 44 41 53 40 45On-shore Bonds 55 51 55 67 45 38 43Other Products 37 33 31 36 32 36 32Wholesale - 27 14 - - - 15 Total UK & Europe Insurance Operations 189 223 205 219 185 170 185 Group Total 964 1,066 1,048 1,117 1,038 1,124 1,103

PRUDENTIAL PLC THIRD QUARTER 2013 INTERIM MANAGEMENT STATEMENT
13
Schedule 2B - Constant Exchange Rates PRUDENTIAL PLC - NEW BUSINESS – Q3 2013 TOTAL INSURANCE NEW BUSINESS APE - BY QUARTER Note: In schedule 2B constant exchange rates have been used to calculate insurance new business for overseas operations for all
periods in 2012. Discrete quarters in 2013 are presented on reported exchange rates.
2012 2013
Q1 Q2 Q3 Q4 Q1 Q2 Q3
£m £m £m £m £m £m £m Group Insurance Operations
Asia(1b) 437 459 435 576 495 515 513 US(1b) 336 396 424 342 358 439 405 UK 189 223 205 219 185 170 185 Group Total 962 1,078 1,064 1,137 1,038 1,124 1,103
Asia Insurance Operations(1b)
Hong Kong
86 94 98 127 107 107 121 Indonesia 89 103 94 140 112 128 108 Malaysia 45 54 48 74 46 53 52 Philippines 10 11 13 13 14 15 12 Singapore 74 71 77 86 80 90 87 Thailand 11 9 10 9 11 14 22 Vietnam 7 11 12 16 10 13 14 SE Asia Operations inc. Hong Kong 322 353 352 465 380 420 416 China(7) 18 17 13 11 27 20 21 Korea 22 26 23 29 30 32 23 Taiwan 43 46 25 45 19 26 28 India(5) 32 17 22 26 39 17 25 Total Asia Insurance Operations 437 459 435 576 495 515 513
US Insurance Operations(1b)
Variable Annuities
283 326 339 240 240 298 271 Elite Access (variable annuity) - 14 27 46 54 73 64 Fixed Annuities 16 15 15 13 14 16 14 Fixed Index Annuities 25 26 30 32 34 28 22 Life 4 4 4 1 1 - - Wholesale 8 11 9 10 15 24 34 Total US Insurance Operations 336 396 424 342 358 439 405
UK & Europe Insurance Operations
Direct and Partnership Annuities
7 7 7 9 8 7 7 Intermediated Annuities 10 15 16 24 15 14 12 Internal Vesting annuities 31 35 38 42 32 35 31 Total Individual Annuities 48 57 61 75 55 56 50 Corporate Pensions 49 55 44 41 53 40 45 On-shore Bonds 55 51 55 67 45 38 43 Other Products 37 33 31 36 32 36 32 Wholesale - 27 14 - - - 15 Total UK & Europe Insurance Operations 189 223 205 219 185 170 185 Group Total 962 1,078 1,064 1,137 1,038 1,124 1,103

PRUDENTIAL PLC THIRD QUARTER 2013 INTERIM MANAGEMENT STATEMENT
14
Schedule 2C - Constant Exchange Rates PRUDENTIAL PLC - NEW BUSINESS – Q3 2013 TOTAL INSURANCE NEW BUSINESS APE - BY QUARTER Note: In schedule 2C constant exchange rates have been used to calculate insurance new business for overseas operations for all
periods in 2012 and 2013 i.e the year-to-date exchange rate for the nine month period ended 30 September 2013 is applied to each discrete quarter for 2012 and 2013.
2012 2013
Q1 Q2 Q3 Q4 Q1 Q2 Q3
£m £m £m £m £m £m £m Group Insurance Operations
Asia(1c) 437 459 435 576 488 507 528 US(1c) 336 396 424 342 359 436 407 UK 189 223 205 219 185 170 185 Group Total 962 1,078 1,064 1,137 1,032 1,113 1,120
Asia Insurance Operations(1c)
Hong Kong
86 94 98 127 107 107 121 Indonesia 89 103 94 140 109 124 115 Malaysia 45 54 48 74 45 52 54 Philippines 10 11 13 13 14 14 13 Singapore 74 71 77 86 79 89 89 Thailand 11 9 10 9 11 14 22 Vietnam 7 11 12 16 10 13 14 SE Asia Operations inc. Hong Kong 322 353 352 465 375 413 428 China(7) 18 17 13 11 27 20 21 Korea 22 26 23 29 30 32 23 Taiwan 43 46 25 45 19 26 28 India(5) 32 17 22 26 37 16 28 Total Asia Insurance Operations 437 459 435 576 488 507 528
US Insurance Operations(1c)
Variable Annuities
283 326 339 240 241 297 271 Elite Access (variable annuity) - 14 27 46 54 73 64 Fixed Annuities 16 15 15 13 14 15 15 Fixed Index Annuities 25 26 30 32 34 28 22 Life 4 4 4 1 1 - - Wholesale 8 11 9 10 15 23 35 Total US Insurance Operations 336 396 424 342 359 436 407
UK & Europe Insurance Operations
Direct and Partnership Annuities
7 7 7 9 8 7 7 Intermediated Annuities 10 15 16 24 15 14 12 Internal Vesting annuities 31 35 38 42 32 35 31 Total Individual Annuities 48 57 61 75 55 56 50 Corporate Pensions 49 55 44 41 53 40 45 On-shore Bonds 55 51 55 67 45 38 43 Other Products 37 33 31 36 32 36 32 Wholesale - 27 14 - - - 15 Total UK & Europe Insurance Operations 189 223 205 219 185 170 185 Group Total 962 1,078 1,064 1,137 1,032 1,113 1,120

PRUDENTIAL PLC THIRD QUARTER 2013 INTERIM MANAGEMENT STATEMENT
15
Schedule 3 - Reported Exchange Rates PRUDENTIAL PLC - NEW BUSINESS – Q3 2013 INVESTMENT OPERATIONS - BY QUARTER 2012 2013 Q1 Q2 Q3 Q4 Q1 Q2 Q3 £m £m £m £m £m £m £mGroup Investment Operations
Opening FUM 106,984 109,507 110,204 120,709 129,498 138,926 137,407Net Flows:(9) 2,116 3,251 6,975 6,165 3,502 2,344 5,093 - Gross Inflows 9,183 9,305 13,228 13,783 13,409 14,561 13,528 - Redemptions (7,067) (6,054) (6,253) (7,618) (9,907) (12,217) (8,435)Other Movements 407 (2,554) 3,530 2,624 5,926 (3,863) 320Total Group Investment Operations(11) 109,507 110,204 120,709 129,498 138,926 137,407 142,820
M&G
Retail
Opening FUM 44,228 47,972 48,352 51,951 54,879 61,427 62,655Net Flows: 2,398 1,876 1,863 1,705 2,446 2,308 1,132 - Gross Inflows 6,055 4,995 4,903 5,528 7,213 8,138 5,919 - Redemptions (3,657) (3,119) (3,040) (3,823) (4,767) (5,830) (4,787)Other Movements 1,346 (1,496) 1,736 1,223 4,102 (1,080) 717Closing FUM 47,972 48,352 51,951 54,879 61,427 62,655 64,504
Comprising amounts for:
UK 36,411 36,801 38,667 39,142 41,194 39,953 40,955 Europe (excluding UK) 10,434 10,547 12,254 14,446 18,696 21,198 22,064 South Africa 1,127 1,004 1,030 1,291 1,537 1,504 1,485 47,972 48,352 51,951 54,879 61,427 62,655 64,504 Institutional(4)
Opening FUM 47,720 45,371 46,291 52,215 56,989 57,745 55,484Net Flows: (631) 1,298 4,505 3,867 (15) (899) 3,928 - Gross Inflows 954 2,697 5,643 5,688 2,656 2,591 5,364 - Redemptions (1,585) (1,399) (1,138) (1,821) (2,671) (3,490) (1,436)Other Movements (1,718) (378) 1,419 907 771 (1,362) 398Closing FUM 45,371 46,291 52,215 56,989 57,745 55,484 59,810Total M&G Investment Operations 93,343 94,643 104,166 111,868 119,172 118,139 124,314
PPM South Africa FUM included in Total M&G 3,757 3,584 3,848 4,391 4,701 4,509 4,633
Eastspring - excluding MMF(9)
Equity/Bond/Other(8)
Opening FUM 13,007 13,970 13,423 14,508 15,457 17,206 16,756Net Flows: 333 50 838 521 795 838 65 - Gross Inflows 2,120 1,552 2,407 2,446 3,122 3,596 2,214 - Redemptions (1,787) (1,502) (1,569) (1,925) (2,327) (2,758) (2,149)Other Movements 630 (597) 247 428 954 (1,288) (688)Closing FUM(6) 13,970 13,423 14,508 15,457 17,206 16,756 16,133
Third Party Institutional Mandates
Opening FUM 2,029 2,194 2,138 2,035 2,173 2,548 2,512Net Flows: 16 27 (231) 72 276 97 (32) - Gross Inflows 54 61 275 121 418 236 31 - Redemptions (38) (34) (506) (49) (142) (139) (63)Other Movements 149 (83) 128 66 99 (133) (107)Closing FUM(6) 2,194 2,138 2,035 2,173 2,548 2,512 2,373
Total Eastspring Investment Operations 16,164 15,561 16,543 17,630 19,754 19,268 18,506
US
Curian Capital - FUM(6) (10) 5,064 5,193 5,332 5,473 6,315 6,466 6,371

PRUDENTIAL PLC THIRD QUARTER 2013 INTERIM MANAGEMENT STATEMENT
16
Schedule 4A - Reported Exchange Rates PRUDENTIAL PLC - NEW BUSINESS – Q3 2013 TOTAL INSURANCE NEW BUSINESS PROFIT 2012 2013
Q1 Q2 Q3 Q4 Q1 Q2 Q3
YTD YTD YTD YTD YTD YTD YTD
£m £m £m £m £m £m £mAnnual Equivalent(3)
Total Asia Insurance Operations 443 899 1,328 1,897 495 1,010 1,523Total US Insurance Operations 332 719 1,133 1,462 358 797 1,202Total UK & Europe Insurance Operations 189 412 617 836 185 355 540Group Total 964 2,030 3,078 4,195 1,038 2,162 3,265
New business profit(2)
Total Asia Insurance Operations 260 547 828 1,266 308 659 990Total US Insurance Operations 214 442 683 873 192 479 756Total UK & Europe Insurance Operations 62 152 227 313 63 130 204Group Total 536 1,141 1,738 2,452 563 1,268 1,950
New business margin (% of APE)
Total Asia Insurance Operations 59% 61% 62% 67% 62% 65% 65%Total US Insurance Operations 64% 61% 60% 60% 54% 60% 63%Total UK & Europe Insurance Operations 33% 37% 37% 37% 34% 37% 38%Group Total 56% 56% 56% 58% 54% 59% 60%
PVNBP(3)
Total Asia Insurance Operations 2,303 4,725 7,074 10,544 2,734 5,524 8,206Total US Insurance Operations 3,307 7,180 11,308 14,600 3,581 7,957 12,006Total UK & Europe Insurance Operations 1,580 3,495 5,264 7,311 1,540 2,943 4,398Group Total 7,190 15,400 23,646 32,455 7,855 16,424 24,610
New business profit(2)
Total Asia Insurance Operations 260 547 828 1,266 308 659 990Total US Insurance Operations 214 442 683 873 192 479 756Total UK & Europe Insurance Operations 62 152 227 313 63 130 204Group Total 536 1,141 1,738 2,452 563 1,268 1,950
New business margin (% of PVNBP)
Total Asia Insurance Operations 11.3% 11.6% 11.7% 12.0% 11.3% 11.9% 12.1%Total US Insurance Operations 6.5% 6.2% 6.0% 6.0% 5.4% 6.0% 6.3%Total UK & Europe Insurance Operations 3.9% 4.3% 4.3% 4.3% 4.1% 4.4% 4.6%Group Total 7.5% 7.4% 7.4% 7.6% 7.2% 7.7% 7.9%
PRUDENTIAL PLC THIRD QUARTER 2013 INTERIM MANAGEMENT STATEMENT
17
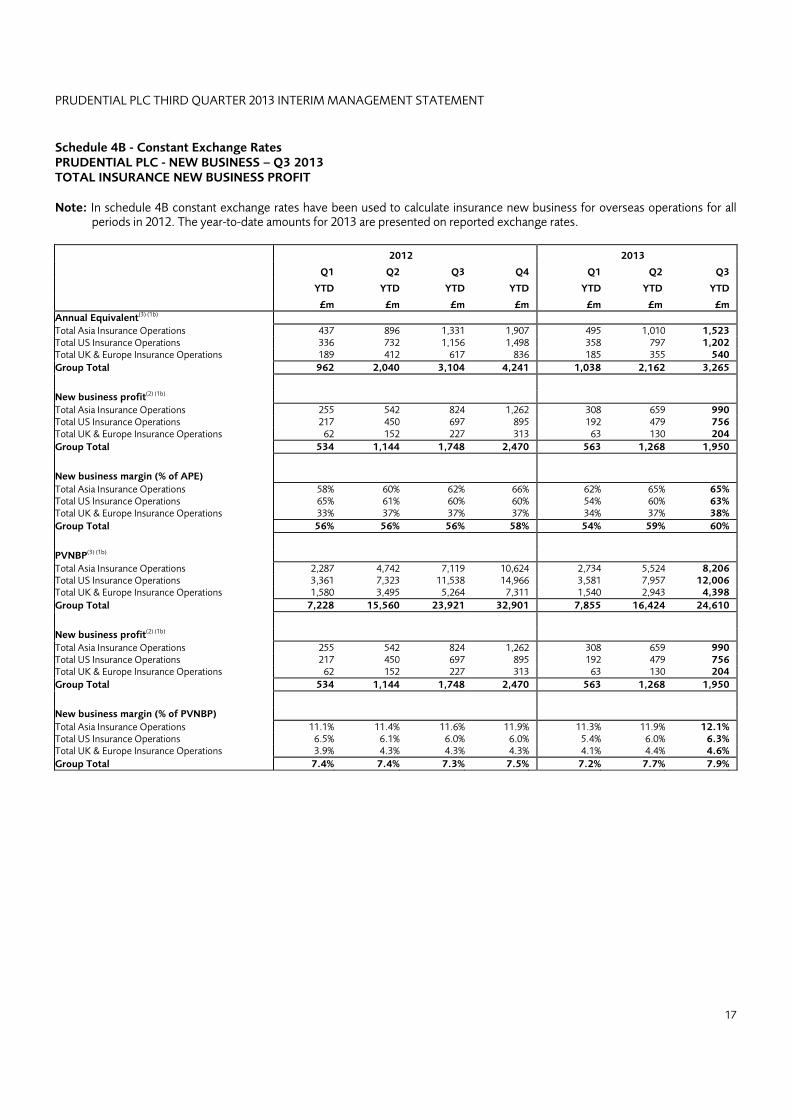
Schedule 4B - Constant Exchange Rates PRUDENTIAL PLC - NEW BUSINESS – Q3 2013 TOTAL INSURANCE NEW BUSINESS PROFIT Note: In schedule 4B constant exchange rates have been used to calculate insurance new business for overseas operations for all
periods in 2012. The year-to-date amounts for 2013 are presented on reported exchange rates. 2012 2013
Q1 Q2 Q3 Q4 Q1 Q2 Q3
YTD YTD YTD YTD YTD YTD YTD
£m £m £m £m £m £m £mAnnual Equivalent(3) (1b)
Total Asia Insurance Operations 437 896 1,331 1,907 495 1,010 1,523Total US Insurance Operations 336 732 1,156 1,498 358 797 1,202Total UK & Europe Insurance Operations 189 412 617 836 185 355 540Group Total 962 2,040 3,104 4,241 1,038 2,162 3,265
New business profit(2) (1b)
Total Asia Insurance Operations
255 542 824 1,262 308 659 990Total US Insurance Operations 217 450 697 895 192 479 756Total UK & Europe Insurance Operations 62 152 227 313 63 130 204Group Total 534 1,144 1,748 2,470 563 1,268 1,950
New business margin (% of APE)
Total Asia Insurance Operations
58% 60% 62% 66% 62% 65% 65%Total US Insurance Operations 65% 61% 60% 60% 54% 60% 63%Total UK & Europe Insurance Operations 33% 37% 37% 37% 34% 37% 38%Group Total 56% 56% 56% 58% 54% 59% 60%
PVNBP(3) (1b)
Total Asia Insurance Operations
2,287 4,742 7,119 10,624 2,734 5,524 8,206Total US Insurance Operations 3,361 7,323 11,538 14,966 3,581 7,957 12,006Total UK & Europe Insurance Operations 1,580 3,495 5,264 7,311 1,540 2,943 4,398Group Total 7,228 15,560 23,921 32,901 7,855 16,424 24,610
New business profit(2) (1b)
Total Asia Insurance Operations
255 542 824 1,262 308 659 990Total US Insurance Operations 217 450 697 895 192 479 756Total UK & Europe Insurance Operations 62 152 227 313 63 130 204Group Total 534 1,144 1,748 2,470 563 1,268 1,950
New business margin (% of PVNBP)
Total Asia Insurance Operations
11.1% 11.4% 11.6% 11.9% 11.3% 11.9% 12.1%Total US Insurance Operations 6.5% 6.1% 6.0% 6.0% 5.4% 6.0% 6.3%Total UK & Europe Insurance Operations 3.9% 4.3% 4.3% 4.3% 4.1% 4.4% 4.6%Group Total 7.4% 7.4% 7.3% 7.5% 7.2% 7.7% 7.9%

PRUDENTIAL PLC THIRD QUARTER 2013 INTERIM MANAGEMENT STATEMENT
18
Schedule 4C - Constant Exchange Rates PRUDENTIAL PLC - NEW BUSINESS – Q3 2013 TOTAL INSURANCE NEW BUSINESS PROFIT Note: In schedule 4C constant exchange rates have been used to calculate insurance new business for overseas operations for all
periods in 2012 and 2013 i.e the year-to-date average exchange rate for the nine month period ended 30 September 2013 is applied to each period for 2012 and 2013.
2012 2013
Q1 Q2 Q3 Q4 Q1 Q2 Q3 YTD YTD YTD YTD YTD YTD YTD £m £m £m £m £m £m £mAnnual Equivalent(3) (1c)
Total Asia Insurance Operations 437 896 1,331 1,907 488 995 1,523 Total US Insurance Operations 336 732 1,156 1,498 359 795 1,202 Total UK & Europe Insurance Operations 189 412 617 836 185 355 540 Group Total 962 2,040 3,104 4,241 1,032 2,145 3,265
New business profit(2) (1c)
Total Asia Insurance Operations 255 542 824 1,262 302 647 990 Total US Insurance Operations 217 450 697 895 192 478 756 Total UK & Europe Insurance Operations 62 152 227 313 63 130 204 Group Total 534 1,144 1,748 2,470 557 1,255 1,950 New business margin (% of APE)
Total Asia Insurance Operations 58% 60% 62% 66% 62% 65% 65% Total US Insurance Operations 65% 61% 60% 60% 53% 60% 63% Total UK & Europe Insurance Operations 33% 37% 37% 37% 34% 37% 38% Group Total 56% 56% 56% 58% 54% 59% 60%
PVNBP(3) (1c)
Total Asia Insurance Operations 2,287 4,742 7,119 10,624 2,699 5,449 8,206 Total US Insurance Operations 3,361 7,323 11,538 14,966 3,595 7,946 12,006 Total UK & Europe Insurance Operations 1,580 3,495 5,264 7,311 1,540 2,943 4,398 Group Total 7,228 15,560 23,921 32,901 7,834 16,338 24,610
New business profit(2) (1c)
Total Asia Insurance Operations 255 542 824 1,262 302 647 990 Total US Insurance Operations 217 450 697 895 192 478 756 Total UK & Europe Insurance Operations 62 152 227 313 63 130 204 Group Total 534 1,144 1,748 2,470 557 1,255 1,950
New business margin (% of PVNBP)
Total Asia Insurance Operations 11.1% 11.4% 11.6% 11.9% 11.2% 11.9% 12.1% Total US Insurance Operations 6.5% 6.1% 6.0% 6.0% 5.3% 6.0% 6.3% Total UK & Europe Insurance Operations 3.9% 4.3% 4.3% 4.3% 4.1% 4.4% 4.6% Group Total 7.4% 7.4% 7.3% 7.5% 7.1% 7.7% 7.9%

PRUDENTIAL PLC THIRD QUARTER 2013 INTERIM MANAGEMENT STATEMENT
19
Schedule 5 EEV New Business Methodology and Assumptions Valuation of new business The valuation of new business for the third quarter of 2013 represents profits determined using non-economic assumptions which are consistent with those at 30 June 2013. For UK immediate annuity business and single premium Universal Life products in Asia, primarily Singapore, the new business contribution is determined by applying economic assumptions reflecting point of sale market conditions. This is consistent with how the business is priced as crediting rates are linked to yields on specific assets and the yield locked-in when the assets are purchased at the point-of-sale of the policy. For other business within the Group, end of period economic assumptions are used. Principal economic assumptions Expected returns on equity and property asset classes and corporate bonds in respect of each territory are derived by adding a risk premium, based on the Group’s long-term view, to the risk-free rate. In Asia, equity risk premiums range from 3.5 per cent to 8.7 per cent for 30 September 2013 (30 June 2013 and 30 September 2012: 3.5 per cent to 8.7 per cent). In the US and the UK, the equity risk premium is 4.0 per cent for all periods shown below. Assumed investment returns reflect the expected future returns on the assets held and allocated to the covered business at the valuation date. The tables below summarise the principal financial assumptions: Asia operations note (ii)
30 September 2013
ChinaHong Kong India Indonesia Korea Malaysia Philippines Singapore Taiwan Thailand Vietnam
notes
(ii), (iii) note (iii) note (iii) % % % % % % % % % % %New business risk discount rate 10.6 4.5 14.0 12.4 7.3 6.2 10.4 4.5 4.0 10.7 16.3Government bond yield 4.1 2.7 9.0 8.7 3.5 3.8 3.6 2.4 1.7 3.9 9.5
30 June 2013
ChinaHong Kong India Indonesia Korea Malaysia Philippines Singapore Taiwan Thailand Vietnam
notes
(ii), (iii) note (iii) note (iii) % % % % % % % % % % % New business risk discount rate 10.1 4.3 13.0 11.1 7.3 6.0 10.6 4.5 3.8 10.5 16.1Government bond yield 3.6 2.5 8.0 7.3 3.4 3.6 3.9 2.4 1.4 3.8 9.3
30 September 2012
ChinaHong Kong India Indonesia Korea Malaysia Philippines Singapore Taiwan Thailand Vietnam
notes
(ii), (iii) note (iii) note (iii) % % % % % % % % % % % New business risk discount rate 10.0 3.7 13.3 11.0 6.4 6.4 11.7 3.8 4.8 10.3 17.5Government bond yield 3.5 1.7 8.3 6.1 3.0 3.6 4.9 1.5 1.2 3.5 10.8

PRUDENTIAL PLC THIRD QUARTER 2013 INTERIM MANAGEMENT STATEMENT
20
Schedule 5 EEV New Business Methodology and Assumptions (cont.) Asia Total
30 Sep 2013 30 Jun 2013 30 Sep 2012 % % % New business weighted risk discount rate note (i) 7.9 7.5 7.3
Notes (i) The weighted risk discount rates for Asia operations shown above have been determined by weighting each country’s risk discount rates by
reference to the EEV basis new business result. (ii) For Hong Kong the assumptions shown are for US dollar denominated business. For other territories, the assumptions are for local currency
denominated business. (iii) The mean equity return assumptions for the most significant equity holdings in the Asia operations were: 30 Sep 2013 30 Jun 2013 30 Sep 2012 % % % Hong Kong 6.7 6.5 5.7Malaysia 9.8 9.6 9.6Singapore 8.4 8.4 7.5
US operations
30 Sep 2013 30 Jun 2013 30 Sep 2012 % % %Assumed new business spread margins:Fixed Annuity business:1,2
January to June issues 1.2 1.2 1.4 July to September issues 1.75 n/a 1.25Fixed Index Annuity business:2
January to June issues 1.45 1.45 1.75 July to September issues 2.0 n/a 1.5Institutional business 0.75 0.75 1.25New business risk discount rate note (i)
Variable annuity 7.4 7.3 6.5 Non-variable annuity 4.9 4.8 4.4 Weighted average total 7.2 7.2 6.3US 10-year treasury bond rate at end of period 2.7 2.5 1.7Pre-tax expected long-term nominal rate of return for US equities 6.7 6.5 5.7
1 Including the proportion of variable annuity business invested in the general account
2 The rates at inception shown above grade up linearly by 25 basis points to a long-term assumption over five years
Note (i) The risk discount rates shown above include an additional credit risk allowance for general account business of 150 basis points (30 June
2013:150 basis points; 30 September 2012: 200 basis points) and for variable annuity business of 30 basis points (30 June 2013: 30 basis points; 30 September 2012: 40 basis points).
PRUDENTIAL PLC THIRD QUARTER 2013 INTERIM MANAGEMENT STATEMENT
21
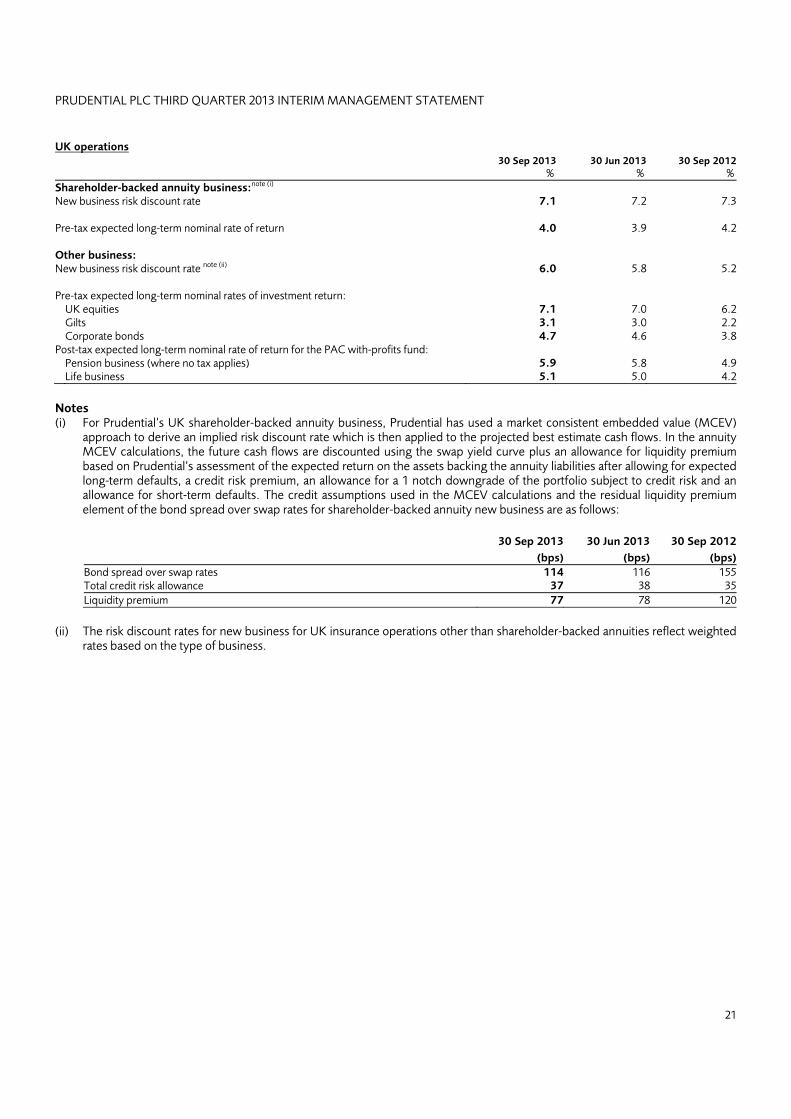
UK operations
30 Sep 2013 30 Jun 2013 30 Sep 2012 % % % Shareholder-backed annuity business:note (i) New business risk discount rate 7.1 7.2 7.3 Pre-tax expected long-term nominal rate of return 4.0 3.9 4.2 Other business:
New business risk discount rate note (ii) 6.0 5.8 5.2 Pre-tax expected long-term nominal rates of investment return:
UK equities 7.1 7.0 6.2 Gilts 3.1 3.0 2.2 Corporate bonds 4.7 4.6 3.8Post-tax expected long-term nominal rate of return for the PAC with-profits fund: Pension business (where no tax applies) 5.9 5.8 4.9 Life business 5.1 5.0 4.2
Notes (i) For Prudential’s UK shareholder-backed annuity business, Prudential has used a market consistent embedded value (MCEV)
approach to derive an implied risk discount rate which is then applied to the projected best estimate cash flows. In the annuity MCEV calculations, the future cash flows are discounted using the swap yield curve plus an allowance for liquidity premium based on Prudential’s assessment of the expected return on the assets backing the annuity liabilities after allowing for expected long-term defaults, a credit risk premium, an allowance for a 1 notch downgrade of the portfolio subject to credit risk and an allowance for short-term defaults. The credit assumptions used in the MCEV calculations and the residual liquidity premium element of the bond spread over swap rates for shareholder-backed annuity new business are as follows:
30 Sep 2013 30 Jun 2013 30 Sep 2012 (bps) (bps) (bps) Bond spread over swap rates 114 116 155 Total credit risk allowance 37 38 35 Liquidity premium 77 78 120
(ii) The risk discount rates for new business for UK insurance operations other than shareholder-backed annuities reflect weighted
rates based on the type of business.

PRUDENTIAL PLC THIRD QUARTER 2013 INTERIM MANAGEMENT STATEMENT
22
Schedule 6 Capital Management We continue to operate with a strong solvency position, while maintaining high levels of liquidity and capital generation. At 30 September 2013 our IGD surplus is estimated at £3.9 billion after deducting the 2013 interim dividend generating strong coverage of 2.3 times the requirement. This is reflective of our capital discipline, the effectiveness of our hedging activities, our low direct Eurozone exposure and the minimal level of credit impairments. This compares to £3.9 billion at 30 June 2013 (before taking into account the 2013 interim dividend of £0.3 billion) and £4.1 billion at 30 September 2012. The 30 September 2012 comparative does not include the subsequent change in the Jackson contribution basis set out below. As disclosed in our full year 2012 results announcement in March 2013, Prudential agreed with the PRA to amend the calculation of the contribution Jackson makes to the Group’s IGD surplus. Until then, the contribution of Jackson to the reported IGD was based on an intervention level set at 75 per cent of US Risk Based Capital Company Action Level (CAL). Post this change, the contribution of Jackson to IGD surplus now equals the surplus in excess of 250 per cent of CAL. This is more in line with the level at which we have historically reported free surplus, which had been set at 235 per cent of CAL. In the first half of 2013 this was raised to 250 per cent to align with IGD. In the absence of an agreed Solvency II approach, we believe that this change makes the IGD surplus a more meaningful measure and one that is more closely aligned with economic reality. The revised IGD surplus calculation has no impact on the way that the US business is managed or regulated locally. The impact of this change was a reduction in IGD surplus of £1.2 billion. As at 30 September 2013 stress testing of our IGD capital position to various events has the following results:
An instantaneous 20 per cent fall in equity markets from 30 September 2013 levels would reduce the IGD surplus by £100 million;
A 40 per cent fall in equity markets (comprising an instantaneous 20 per cent fall followed by a further 20 per cent fall over a four week period) would reduce the IGD surplus by £450 million;
A 100 bps reduction (subject to a floor of zero) in interest rates would have no impact on the IGD surplus; and
Credit defaults of ten times the expected level would reduce IGD surplus by £700 million.
All of our subsidiaries continue to hold strong capital positions on a local regulatory basis. In particular, at 30 September 2013, the value of the estate of our UK with-profits funds is estimated at £7.8 billion which is excluded from the IGD calculation. The value of shareholders’ interest in future transfers from the UK with-profits fund is valued at £2.6 billion of which credit for only £0.2 billion is included in the IGD calculation. The surplus of the UK with-profits fund is excluded from the IGD calculation.
In addition to our strong capital position, on a statutory basis the total credit reserve for the UK shareholder annuity funds also contributes to protecting our capital position in excess of the IGD surplus. This credit reserve as at 30 September 2013 was £2.0 billion, equivalent to 6.9 per cent of the assets backing annuity liabilities. This represents 46 per cent of the portfolio spread over swaps, compared to 41 per cent at 30 June 2013 and 40 per cent at 30 September 2012.

PRUDENTIAL PLC THIRD QUARTER 2013 INTERIM MANAGEMENT STATEMENT
23
Schedule 7 BASIS OF PREPARATION The format of the schedules is consistent with the distinction between insurance and investment products as applied for previous financial reporting periods. With the exception of some US institutional business, products categorised as ‘insurance’ refer to those classified as contracts of long-term insurance business for regulatory reporting purposes, i.e falling within one of the classes of insurance specified in part II of Schedule 1 to the Regulated Activities Order under PRA regulations. The details shown for insurance products include contributions for contracts that are classified under IFRS 4 ‘Insurance Contracts’ as not containing significant insurance risk. These products are described as investment contracts or other financial instruments under IFRS. Contracts included in this category are primarily certain unit-linked and similar contracts written in UK Insurance Operations, and Guaranteed Investment Contracts and similar funding agreements written in US Operations. New business premiums for regular premium products are shown on an annualised basis. Internal vesting business is classified as new business where the contracts include an open market option. New business premiums reflect those premiums attaching to covered business, including premiums for contracts designed as investment products for IFRS reporting. Investment products referred to in the tables for funds under management are unit trusts, mutual funds and similar types of retail fund management arrangements. These are unrelated to insurance products that are classified as investment contracts under IFRS 4, as described in the preceding paragraph, although similar IFRS recognition and measurement principles apply to the acquisition costs and fees attaching to this type of business. New Business Profit has been determined using the European Embedded Value (EEV) methodology and assumptions set out in our 2013 Half Year Report. In determining the EEV basis value of new business written in the period policies incept, premiums are included in projected cash flows on the same basis of distinguishing annual and single premium business as set out for statutory basis reporting. Annual premium equivalent (APE) sales are subject to rounding. Notes to Schedules 1 – 4 (1) Prudential plc reports its results at both reported exchange rates (RER) to reflect actual rates and also constant exchange rates
(CER) so as to eliminate the impact of exchange translation.
Local currency: £ Q3 2013* Q3 2012*
Q3 2013 vs Q3 2012
appreciation / (depreciation)
of local currency FY 2012
Q3 2013 vs FY 2012
appreciation / (depreciation)
of local currency
Hong Kong
Average Rate 11.99 12.24 2% 12.29 2% Closing Rate 12.56 12.52 0% 12.60 0% Indonesia
Average Rate 15,519.15 14,638.90 (6)% 14,842.01 (5)%
Closing Rate 18,752.65 15,453.64 (21)% 15,665.76 (20)% Malaysia
Average Rate 4.84 4.89 1% 4.89 1%
Closing Rate 5.28 4.94 (7)% 4.97 (6)% Singapore
Average Rate 1.94 1.99 3% 1.98 2%
Closing Rate 2.03 1.98 (3)% 1.99 (2)% India
Average Rate 88.80 83.91 (6)% 84.70 (5)%
Closing Rate 101.38 85.17 (19)% 89.06 (14)% Vietnam
Average Rate 32,474.00 32,945.92 1% 33,083.59 2%
Closing Rate 34,189.58 33,725.10 (1)% 33,875.42 (1)% Thailand
Average Rate 46.99 49.25 5% 49.26 5%
Closing Rate 50.65 49.70 (2)% 49.72 (2)% US
Average Rate 1.55 1.58 2% 1.58 2%
Closing Rate 1.62 1.61 (1)% 1.63 1%
*Average rate is for the nine months to 30 September

PRUDENTIAL PLC THIRD QUARTER 2013 INTERIM MANAGEMENT STATEMENT
24
Notes to Schedules 1 – 4 (cont.) (1a) Insurance and investment new business for overseas operations are converted using the year-to-date average exchange rate
applicable at the time (RER). The sterling results for individual quarters represent the difference between the year-to-date reported sterling results at successive quarters and will include foreign exchange movements from earlier periods.
(1b) Insurance new business for overseas operations for 2012 has been calculated using constant exchange rates (CER). (1c) Constant exchange rates have been used to calculate insurance new business for overseas operations for all periods in 2012
and 2013. (2) New business values are all presented pre-tax. (3) Annual Equivalents, calculated as regular new business contributions plus 10 per cent of single new business contributions, are
subject to roundings. PVNBPs are calculated as equalling single premiums plus the present value of expected premiums of new regular premium business. In determining the present value, allowance is made for lapses and other assumptions applied in determining the EEV new business profit.
(4) Balance includes segregated and pooled pension funds, private finance assets and other institutional clients. Other movements reflect the net flows arising from the cash component of a tactical asset allocation fund managed by PPM South Africa.
(5) New business in India is included at Prudential's 26 per cent interest in the India life operation. (6) Balance Sheet figures have been calculated at the closing exchange rate. (7) New business in China is included at Prudential's 50 per cent interest in the China life operation. (8) Mandatory Provident Fund (MPF) product sales in Hong Kong are included at Prudential's 36 per cent interest in Hong Kong
MPF operation. (9) Investment flows for the period exclude Eastspring Money Market Funds (MMF) gross inflows of £45,464 million (year-to-date
2012: £39,550 million) and net outflows of £82 million (year-to-date 2012 net outflows: £217 million). (10) Excludes Curian Variable Series Trust funds (internal funds under management). (11) Total M&G and Eastspring excluding MMF.