NEWS RELEASE - Adaro · NEWS RELEASE Jakarta, ... *As restated due to implementation of PSAK 24 ......
13
1 NEWS RELEASE Jakarta, March 14, 2016 For further information please contact: Mahardika Putranto, Head of Corporate Secretary & Investor Relations Division [email protected]; [email protected] ADARO DELIVERS RESILIENT FINANCIAL PERFORMANCE Difficult Coal Market Condition Persists in 2015, Adaro Lowers Costs, Reduces Capital Spending and Maintains Solid Liquidity Jakarta, March 14, 2016 – PT Adaro Energy Tbk (IDX: ADRO) today lodged its audited consolidated financial statements for the full year of 2015, with lower profitability but a solid liquidity position to weather the current downturn. Adaro Energy’s President Director and Chief Executive Officer, Mr. Garibaldi Thohir, said: “We have delivered on our 2015 financial performance targets. Our operations are running well despite challenges in the coal market and volatility in the global economy. We continue to deliver operational excellence with strong performance from our core business. Our Operational EBITDA and Core Earnings reflect Adaro’s fundamental earning power. We believe this downturn is cyclical and that the fundamentals for coal remain intact. We expect Indonesia, other South East Asian countries and India will require more coal to ensure sufficient electricity to support their economic growth. Our focus is to stay the course, continue our contribution to national development and keep implementing our strategy to strengthen our core for business sustainability.” FY15 Financial Highlights: We booked 19% lower revenue at US$2,684 million due to 7% lower sales volume and 14% lower ASP. We lowered our coal cash cost (excluding royalty) by 16% to US$27.98 per tonne, mainly due to lower strip ratio and lower-than-budgeted fuel costs, and beat our guidance of US$31 to US$33 per tonne. Our operational EBITDA, which excludes non-operational accounting items, decreased by 18% to US$730 million. We delivered on our operational EBITDA guidance of US$550 million to US$800 million, demonstrating the high quality of our earnings and the sustainability of our business model. Our net income declined by 17% to US$151 million due to lower revenue from a softer ASP and a one-time, non-cash impairment charge. We recorded US$293 million of core earnings, representing our quality after-tax earnings and the resilient performance of our core business. We maintained strong liquidity with a cash balance of US$702 million and US$60 million in undrawn fully committed bank facilities, which provided a support against the current downturn. We continued to lower our net debt position and reduced our net debt by 25% to US$865 million, resulting in ratios of net debt to last 12 months operational EBITDA
Transcript of NEWS RELEASE - Adaro · NEWS RELEASE Jakarta, ... *As restated due to implementation of PSAK 24 ......

1
NEWS RELEASE
Jakarta, March 14, 2016
For further information please contact: Mahardika Putranto, Head of Corporate Secretary & Investor Relations Division
[email protected]; [email protected]
ADARO DELIVERS RESILIENT FINANCIAL PERFORMANCE
Difficult Coal Market Condition Persists in 2015, Adaro Lowers Costs,
Reduces Capital Spending and Maintains Solid Liquidity
Jakarta, March 14, 2016 – PT Adaro Energy Tbk (IDX: ADRO) today lodged its audited
consolidated financial statements for the full year of 2015, with lower profitability but a solid
liquidity position to weather the current downturn.
Adaro Energy’s President Director and Chief Executive Officer, Mr. Garibaldi Thohir, said:
“We have delivered on our 2015 financial performance targets. Our operations are
running well despite challenges in the coal market and volatility in the global
economy. We continue to deliver operational excellence with strong performance
from our core business. Our Operational EBITDA and Core Earnings reflect Adaro’s
fundamental earning power. We believe this downturn is cyclical and that the
fundamentals for coal remain intact. We expect Indonesia, other South East Asian
countries and India will require more coal to ensure sufficient electricity to support
their economic growth. Our focus is to stay the course, continue our contribution to
national development and keep implementing our strategy to strengthen our core for
business sustainability.”
FY15 Financial Highlights:
We booked 19% lower revenue at US$2,684 million due to 7% lower sales volume
and 14% lower ASP.
We lowered our coal cash cost (excluding royalty) by 16% to US$27.98 per tonne,
mainly due to lower strip ratio and lower-than-budgeted fuel costs, and beat our
guidance of US$31 to US$33 per tonne.
Our operational EBITDA, which excludes non-operational accounting items,
decreased by 18% to US$730 million. We delivered on our operational EBITDA
guidance of US$550 million to US$800 million, demonstrating the high quality of our
earnings and the sustainability of our business model.
Our net income declined by 17% to US$151 million due to lower revenue from a
softer ASP and a one-time, non-cash impairment charge. We recorded US$293
million of core earnings, representing our quality after-tax earnings and the resilient
performance of our core business.
We maintained strong liquidity with a cash balance of US$702 million and US$60
million in undrawn fully committed bank facilities, which provided a support against
the current downturn.
We continued to lower our net debt position and reduced our net debt by 25% to
US$865 million, resulting in ratios of net debt to last 12 months operational EBITDA
2
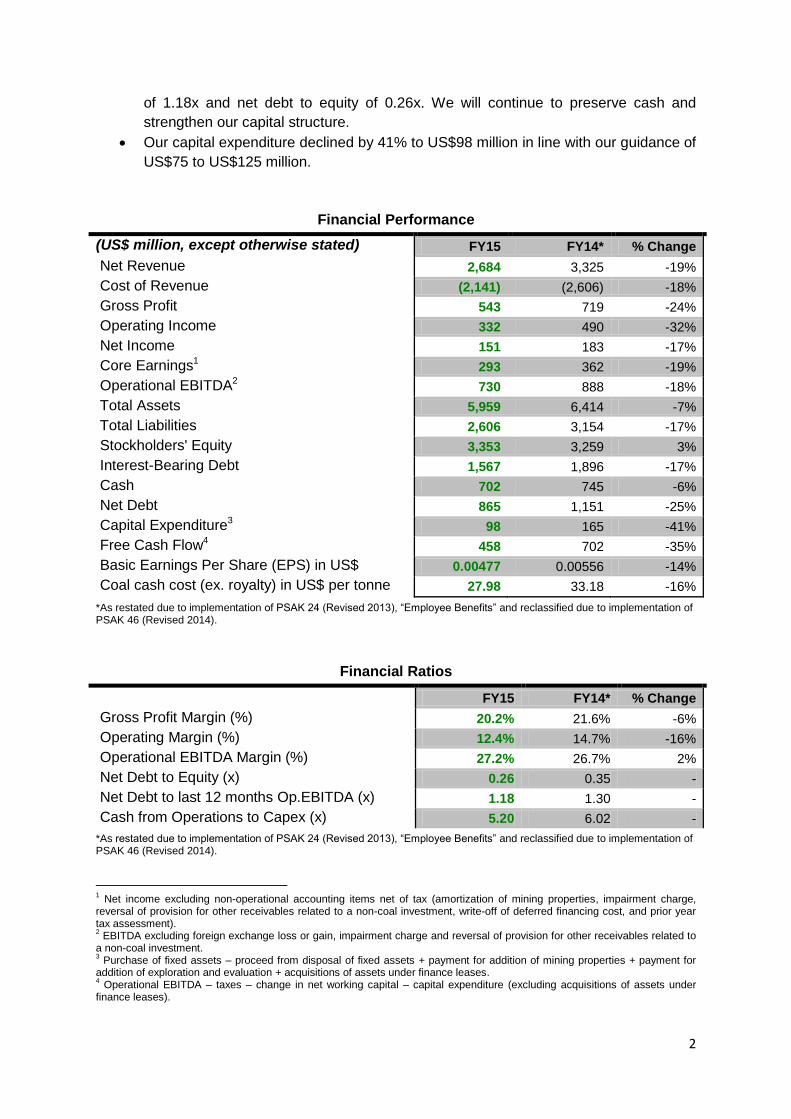
of 1.18x and net debt to equity of 0.26x. We will continue to preserve cash and
strengthen our capital structure.
Our capital expenditure declined by 41% to US$98 million in line with our guidance of
US$75 to US$125 million.
Financial Performance
(US$ million, except otherwise stated) FY15 FY14* % Change
Net Revenue 2,684 3,325 -19%
Cost of Revenue (2,141) (2,606) -18%
Gross Profit 543 719 -24%
Operating Income 332 490 -32%
Net Income 151 183 -17%
Core Earnings1 293 362 -19%
Operational EBITDA2 730 888 -18%
Total Assets 5,959 6,414 -7%
Total Liabilities 2,606 3,154 -17%
Stockholders' Equity 3,353 3,259 3%
Interest-Bearing Debt 1,567 1,896 -17%
Cash 702 745 -6%
Net Debt 865 1,151 -25%
Capital Expenditure3 98 165 -41%
Free Cash Flow4 458 702 -35%
Basic Earnings Per Share (EPS) in US$ 0.00477 0.00556 -14%
Coal cash cost (ex. royalty) in US$ per tonne 27.98 33.18 -16%
*As restated due to implementation of PSAK 24 (Revised 2013), “Employee Benefits” and reclassified due to implementation of PSAK 46 (Revised 2014).
Financial Ratios
FY15 FY14* % Change
Gross Profit Margin (%) 20.2% 21.6% -6%
Operating Margin (%) 12.4% 14.7% -16%
Operational EBITDA Margin (%) 27.2% 26.7% 2%
Net Debt to Equity (x) 0.26 0.35 -
Net Debt to last 12 months Op.EBITDA (x) 1.18 1.30 -
Cash from Operations to Capex (x) 5.20 6.02 -
*As restated due to implementation of PSAK 24 (Revised 2013), “Employee Benefits” and reclassified due to implementation of PSAK 46 (Revised 2014).
1 Net income excluding non-operational accounting items net of tax (amortization of mining properties, impairment charge,
reversal of provision for other receivables related to a non-coal investment, write-off of deferred financing cost, and prior year tax assessment). 2 EBITDA excluding foreign exchange loss or gain, impairment charge and reversal of provision for other receivables related to
a non-coal investment. 3 Purchase of fixed assets – proceed from disposal of fixed assets + payment for addition of mining properties + payment for
addition of exploration and evaluation + acquisitions of assets under finance leases. 4 Operational EBITDA – taxes – change in net working capital – capital expenditure (excluding acquisitions of assets under
finance leases).

3
Operating Segment
Revenue Net Profit (loss)
(US$ million) FY15 FY14 %
Change FY15 FY14* % Change
Coal mining & trading 2,491 3,102 -20% 195 200 -3%
Mining services 123 139 -12% 20 24 -17%
Others 70 84 -17% (14) 78 -118%
Elimination (50) (119) -58%
Adaro Energy Group 2,684 3,325 -19% 151 183 -17%
*As restated due to implementation of PSAK 24 (Revised 2013), “Employee Benefits”.
Adaro Energy’s guidance for 2016:
Production: 52 million tonnes to 54 million tonnes
Blended strip ratio: 4.71x
Coal cash cost: US$26 to US$28 per tonne
Operational EBITDA: US$450 million to US$700 million
Capex: US$75 million to US$100 million
FINANCIAL PERFORMANCE ANALYSIS FOR THE FULL YEAR 2015
Net Revenue, Average Selling Price (ASP) and Production
The global economic environment and its impact on coal prices presented the industry with
significant challenges during 2015. Chronic oversupply continues to weigh on the coal
industry. On top of that, lower demand growth in China added downward pressure on coal
prices. This situation impacted our average selling price (ASP), which declined 14%
compared to 2014. Coupled with a 7% lower sales volume of 53.11 million tonnes, our
revenue declined 19% year-on-year to US$2,684 million.
Despite these difficult conditions, our operations continued to run well. While our total coal
production decreased by 8% to 51.46 million tonnes, slightly below our guidance of 52 to 54
million tonnes, we recorded a 25% increase in coal production from our Balangan mine to
1.11 million tonnes. In the last quarter of the year, we introduced a new product, a blend of
Wara and Balangan coals, which was well received by customers in India and China. We
continue to be a major supplier to the domestic market and committed to supplying
Indonesia’s growing coal demand.
Cost of Revenue and Coal Cash Cost
Our cost of revenue decreased by 18% to US$2,141 million mainly due to a lower strip ratio
and lower-than-budgeted fuel costs. Consolidated strip ratio for the year was 5.19x, slightly
below the planned strip ratio of 5.33x set at the beginning of the year.
We lowered our coal cash cost (excluding royalty) by 16% to US$27.98 per tonne, below our
guidance of US$31 to US$33 per tonne. Our fuel costs, a significant component, decreased
by 38% to the low US$0.50s per liter.

4
We have hedged about 25% of our annual fuel requirements through fuel swaps at prices
below the budget we set for 2016. We continue to improve our operational efficiency and
continue to implement initiatives that will increase productivity and lower costs.
Royalties to Government
Our cost of royalties to the Government of Indonesia dropped by 22% to US$277 million, in
line with lower revenue. Royalties accounted for 13% of our total cost of revenue in 2015.
Operational EBITDA
The current market downturn continued to pressure our operational EBITDA, which
contracted by 18% to US$730 million but still demonstrates high-quality earnings and the
sustainability of our business model. Our operational EBITDA excludes an US$7 million
reversal of provision for other receivables related to a non-coal investment, a US$65 million
one-time, non-cash impairment charge, and a US$16 million foreign exchange loss. We
delivered on our operational EBITDA guidance of US$550 million to US$800 million. We
maintained a strong operational EBITDA margin at 27%, among the highest of Indonesian
thermal coal producers.
Net Profit and Core Earnings
Net profit after tax declined by 17% to US$151 million, recognizing a US$65 million one-time
non-cash impairment charge. Our underlying core earnings in 2015 remained solid at
US$293 million, reflecting the resilient performance of our core business and operational
excellence. Core earnings exclude non-operational accounting items net of tax, which
consisted of US$65 million for a one-time non-cash impairment charge, US$78 million for
amortization of mining properties net of tax, US$7 million for a reversal of provision for other
receivables related to a non-coal investment, US$6 million for a write-off of deferred
financing cost, and US$1 million for a prior year tax assessment.
Total Assets, Solid Liquidity
Our total assets decreased by 7% to US$5,959 million. Current assets declined by 14% to
US$1,093 million, mainly due to lower cash and trade receivables from third parties. Cash
decreased by 6% to US$702 million, 94% of which was held in US dollars. Cash accounted
for 12% of our total assets. Non-current assets decreased by 5% to US$4,866 million, mainly
due to the decline in mining properties and fixed assets by 3% and 9% respectively.
Total Liabilities
We reduced total liabilities by 17% to US$2,606 million. Current liabilities were reduced by
41% to US$454 million, mainly due to lower trade payables and lower current maturity of
long-term bank loans as part of the refinancing. We lowered our total bank loans by 17% to
US$1,477 million in 2015. Non-current liabilities decreased by 10% to US$2,151 million
mainly due to 14% lower long-term bank loans.
Our balance sheet remains healthy as we improve our ratios of net debt to last 12 months
operational EBITDA to 1.18x and net debt to equity to 0.26x.

5
Current Maturity of Long-term Borrowings
Current maturity of long-term borrowings decreased by 41% to US$123 million due to our
refinancing effort to convert shorter-duration and maturing liabilities into long-term liabilities
at a more competitive rate.
Long-term Borrowings
Our long-term borrowings, mainly consisting of long-term bank loans, decreased by 14% to
US$1,444 million.
Debt Management and Liquidity
At the end of last year, we successfully refinanced a US$400 million facility agreement of our
mining services company PT Saptaindra Sejati (SIS) and a US$160 million facility
agreement of our barging and ship-loading company PT Maritim Barito Perkasa (MBP) with
a more competitive rate and longer loan period. We used some of our internal cash to pay
down a portion of the loan, hence reducing our level of interest-bearing debts. This
refinancing will lower interest expenses in the coming year and provide more flexibility for
Adaro.
We repaid US$625 million of bank loans in 2015 and have reduced our net debt by 25%
year-on-year to US$865 million. We have access to US$762 million of liquidity, including
US$60 million in undrawn fully committed bank facilities. Our average debt repayment
schedule for the next six years from 2016 to 2021 is at a manageable level of around
US$252 million per year.
Cash Flows from Operating Activities
Our cash flows from operating activities for 2015 decreased by 14% year-on-year to US$512
million, mainly attributable to lower receipts from customers, which fell by 17% to US$2,777
million due to lower average selling price and lower sales volume.
Cash Flows from Investing Activities
We booked higher net cash flows used in investing activities of US$118 million mainly from
purchases of fixed assets of US$70 million.
Capital Expenditure and Free Cash Flow
Our net capital expenditure (including acquisition of assets under finance lease) decreased
40% to US$98 million in 2015, within our capex guidance of US$75 million to US$125 million
for the year. Capex spending in 2015 was mainly for regular maintenance. We booked
positive free cash flow of US$458 million this year on the back of solid operational EBITDA
and prudent capital spending.
Cash Flows from Financing Activities
Net cash flow used in financing activities was US$423 million or 15% lower compared to the
previous year. During the year, we drew down US$320 million of bank loans for refinancing
purposes and distributed US$75 million in cash dividends to shareholders. We also made
total repayments of bank loans of US$625 million.

6
Dividend
We will continue to pay regular cash dividends and deliver returns to our shareholders. As
approved during the Annual General Meeting of Shareholders on April 23, 2015, we paid
US$75 million in cash dividends to our shareholders for 2014, consisting of an interim cash
dividend of US$30 million and a final cash dividend of US$45 million. On January 15, 2016,
we also paid an interim cash dividend for 2015 of US$35 million.

PT ADARO ENERGY Tbk DAN ENTITAS ANAK/AND SUBSIDIARIES
Lampiran 1/1 Schedule
LAPORAN POSISI KEUANGANKONSOLIDASIAN31 DESEMBER 2015, 31 DESEMBER 2014 DAN1 JANUARI 2014(Dinyatakan dalam ribuan Dolar AS,kecuali nilai nominal dan data saham)
CONSOLIDATED STATEMENTS OFFINANCIAL POSITION
AS AT 31 DECEMBER 2015, 31 DECEMBER 2014 AND1 JANUARY 2014
(Expressed in thousands of US Dollars,except for par value and share data)
Catatan atas laporan keuangan konsolidasian terlampir merupakanbagian yang tidak terpisahkan dari laporan keuangan konsolidasian
secara keseluruhan.
The accompanying notes to the consolidated financial statements form anintegral part of these consolidated financial statements.
31 31 1Desember/ Desember/ Januari/
Catatan/ December December JanuaryNotes 2015 2014* 2014*
ASET ASSETS
ASET LANCAR CURRENT ASSETSKas dan setara kas 5 702,452 745,248 680,904 Cash and cash equivalentsDeposito berjangka yang dibatasi Restricted time deposits -
penggunaannya - bagian lancar 6 370 - 389 current portionPiutang usaha 7 195,694 285,560 309,565 Trade receivablesPersediaan 9 72,791 96,743 102,747 InventoriesPajak dibayar dimuka - Prepaid taxes -
bagian lancar 34a 83,067 80,452 186,716 current portionPajak yang bisa dipulihkan Recoverable taxes -
kembali - bagian lancar 34b 23,547 45,779 10,875 current portionPiutang lain-lain - pihak ketiga 2,384 1,606 1,980 Other receivables - third partiesPinjaman ke pihak ketiga - Loan to a third party -
bagian lancar 17 - - 16,670 current portionPinjaman ke pihak berelasi - - 40,233 Loan to a related partyInstrumen keuangan derivatif - - 1,379 Derivative financial instrumentsUang muka dan biaya dibayar Advances and prepayments -
dimuka - bagian lancar 8 11,089 15,656 18,469 current portionAset lancar lain-lain 1,125 588 952 Other current assets
Total aset lancar 1,092,519 1,271,632 1,370,879 Total current assets
ASET TIDAK LANCAR NON-CURRENT ASSETSDeposito berjangka
yang dibatasi penggunaannya - Restricted time deposits -bagian tidak lancar 6 1,956 1,166 601 non-current portion
Investasi pada entitas asosiasi Investment in associatesdan ventura bersama 12 327,460 395,626 402,021 and joint ventures
Uang muka dan biaya dibayar Advances and prepayments -dimuka - bagian tidak lancar 8 49,345 52,641 68,170 non-current portion
Pinjaman ke pihak ketiga Loan to a third party -- bagian tidak lancar 17 20,000 - - non-current portion
Pajak dibayar dimuka - Prepaid taxes -bagian tidak lancar 34a 38,901 47,473 - non-current portion
Pajak yang bisa dipulihkan Recoverable taxes -kembali - bagian tidak lancar 34b - - 12,301 non-current portion
Aset eksplorasi dan evaluasi 10 - 213 111 Exploration and evaluation assetsProperti pertambangan 13 2,026,965 2,098,603 2,186,801 Mining propertiesAset tetap 11 1,467,111 1,616,603 1,705,799 Fixed assetsGoodwill 14 903,553 903,553 920,296 GoodwillAset pajak tangguhan 34e 4,746 4,755 8,660 Deferred tax assetsAset tidak lancar lain-lain 26,073 21,599 20,278 Other non-current assets
Total aset tidak lancar 4,866,110 5,142,232 5,325,038 Total non-current assets
TOTAL ASET 5,958,629 6,413,864 6,695,917 TOTAL ASSETS
* Disajikan kembali (Catatan 3) As restated (Note 3) *

PT ADARO ENERGY Tbk DAN ENTITAS ANAK/AND SUBSIDIARIES
Lampiran 1/2 Schedule
LAPORAN POSISI KEUANGANKONSOLIDASIAN31 DESEMBER 2015, 31 DESEMBER 2014 DAN1 JANUARI 2014(Dinyatakan dalam ribuan Dolar AS,kecuali nilai nominal dan data saham)
CONSOLIDATED STATEMENTS OFFINANCIAL POSITION
AS AT 31 DECEMBER 2015, 31 DECEMBER 2014 AND1 JANUARY 2014
(Expressed in thousands of US Dollars,except for par value and share data)
Catatan atas laporan keuangan konsolidasian terlampir merupakanbagian yang tidak terpisahkan dari laporan keuangan konsolidasian
secara keseluruhan.
The accompanying notes to the consolidated financial statements form anintegral part of these consolidated financial statements.
31 31 1Desember/ Desember/ Januari/
Catatan/ December December JanuaryNotes 2015 2014* 2014*
LIABILITAS DAN EKUITAS LIABILITIES AND EQUITY
LIABILITAS LIABILITIES
LIABILITAS JANGKA PENDEK CURRENT LIABILITIESUtang usaha 15 196,419 351,145 326,987 Trade payablesUtang dividen 28 35,185 30,067 39,983 Dividends payableBeban yang masih harus dibayar 18 28,380 24,867 42,987 Accrued expensesLiabilitas imbalan kerja jangka Short-term employee benefit
pendek 1,577 2,020 1,849 liabilitiesUtang pajak 34c 13,069 47,744 37,468 Taxes payableUtang royalti 16 43,372 44,786 117,022 Royalties payableBagian lancar atas pinjaman Current maturity of long-term
jangka panjang: borrowings:- Utang sewa pembiayaan 21 29,307 32,249 32,289 Finance lease payables -- Utang bank 22 93,574 160,522 155,577 Bank loans -
Pinjaman dari pihak ketiga 19 - 15,541 - Loans from a third partyInstrumen keuangan derivatif 20 8,147 61,864 - Derivative financial instrumentsUtang lain-lain 5,443 3,790 19,517 Other liabilities
Total liabilitas jangka pendek 454,473 774,595 773,679 Total current liabilities
LIABILITAS JANGKA PANJANG NON-CURRENT LIABILITIESPinjaman dari pihak ketiga 19 15,541 - - Loans from a third partyPinjaman jangka panjang setelah
dikurangi bagian yang akan Long-term borrowings, net ofjatuh tempo dalam satu tahun: current maturities:
- Utang sewa pembiayaan 21 45,443 74,322 47,511 Finance lease payables -- Utang bank 22 1,383,481 1,613,437 1,195,541 Bank loans -
Senior Notes - - 789,870 Senior NotesLiabilitas pajak tangguhan 34e 582,305 575,888 633,685 Deferred tax liabilities
Post-employment benefitsLiabilitas imbalan pasca kerja 23 51,344 51,012 37,641 liabilitiesProvisi reklamasi dan penutupan Provision for mine reclamation
tambang 24 72,999 65,138 40,355 and closure
Total liabilitas jangka panjang 2,151,113 2,379,797 2,744,603 Total non-current liabilities
TOTAL LIABILITAS 2,605,586 3,154,392 3,518,282 TOTAL LIABILITIES
EKUITAS EQUITY
Ekuitas yang diatribusikan Equity attributable tokepada pemilik entitas induk owners of the parent entity
Modal saham - modal dasar Share capital - authorised80.000.000.000 lembar; 80,000,000,000 shares;ditempatkan dan disetor penuh issued and fully paid31.985.962.000 lembar dengan 31,985,962,000 shares atnilai nominal Rp100 per saham 25 342,940 342,940 342,940 par value of Rp100 per share
Tambahan modal disetor, neto 26 1,154,494 1,154,494 1,154,494 Additional paid-in capital, netSaldo laba 27 1,387,009 1,310,883 1,199,987 Retained earningsRugi komprehensif lain 2i (18,555) (40,707) (10,256) Other comprehensive loss
Total ekuitas yang diatribusikan Total equity attributable tokepada pemilik entitas induk 2,865,888 2,767,610 2,687,165 owners of the parent entity
Kepentingan non-pengendali 29 487,155 491,862 490,470 Non-controlling interests
Total ekuitas 3,353,043 3,259,472 3,177,635 Total equity
TOTAL LIABILITAS DAN TOTAL LIABILITIES ANDEKUITAS 5,958,629 6,413,864 6,695,917 EQUITY
* Disajikan kembali (Catatan 3) As restated (Note 3) *

PT ADARO ENERGY Tbk DAN ENTITAS ANAK/AND SUBSIDIARIES
Lampiran 2/1 Schedule
LAPORAN LABA RUGI DAN PENGHASILANKOMPREHENSIF LAIN KONSOLIDASIANUNTUK TAHUN YANG BERAKHIRPADA TANGGAL 31 DESEMBER 2015 DAN 2014(Dinyatakan dalam ribuan Dolar AS,kecuali laba bersih per saham dasar dan dilusian)
CONSOLIDATED STATEMENTS OFPROFIT OR LOSS AND OTHER
COMPREHENSIVE INCOME FOR THE YEARS ENDED31 DECEMBER 2015 AND 2014
(Expressed in thousands of US Dollars,except for basic and diluted earnings per share)
Catatan atas laporan keuangan konsolidasian terlampir merupakanbagian yang tidak terpisahkan dari laporan keuangan konsolidasian
secara keseluruhan.
The accompanying notes to the consolidated financial statements form anintegral part of these consolidated financial statements.
Catatan/ 31 Desember/DecemberNotes 2015 2014*
Pendapatan usaha 30 2,684,476 3,325,444 Revenue
Beban pokok pendapatan 31 (2,141,176) (2,605,707) Cost of revenue
Laba bruto 543,300 719,737 Gross profit
Beban usaha 32 (133,010) (163,192) Operating expensesBeban lain-lain, neto 33 (78,409) (66,713) Other expenses, net
Laba usaha 331,881 489,832 Operating income
Biaya keuangan (60,762) (189,717) Finance costsPendapatan keuangan 11,859 25,260 Finance incomeBagian atas rugi neto entitas asosiasi Share in net loss of associates
dan ventura bersama 12 (3,005) (3,736) and joint ventures
(51,908) (168,193)
Laba sebelum pajak penghasilan 279,973 321,639 Profit before income tax
Beban pajak penghasilan 34d (128,970) (138,395) Income tax expenses
Laba tahun berjalan 151,003 183,244 Profit for the year
Penghasilan komprehensif lain Other comprehensive incometahun berjalan: for the year:
Pos-pos yang akan direklasifikasi Items that may be subsequentlyke laba rugi: reclassified to profit or loss:
Exchange difference due toSelisih kurs karena penjabaran financial statements
laporan keuangan (7,018) (4,082) translationBagian atas penghasilan komprehensif Share of other comprehensive
lainnya dari entitas asosiasi dan income of associatesventura bersama - (310) and joint ventures
Effective portion of movementBagian efektif dari pergerakan on hedging instruments
instrumen lindung nilai designated as cash flowsdalam rangka lindung nilai arus kas 20 50,761 (52,044) hedges
Pajak penghasilan terkait pos ini 34d (22,843) 23,419 Income tax relating to this item
20,900 (33,017)
Pos-pos yang tidak akan direklasifikasi Items that will not be reclassifiedke laba rugi: to profit or loss:
Remeasurements ofPengukuran kembali liabilitas imbalan post-employment benefit
pasca kerja 6,460 (2,800) obligationsPajak penghasilan terkait pos ini 34d (1,966) 978 Income tax relating to this item
4,494 (1,822)
Total penghasilan komprehensif Total other comprehensivelain tahun berjalan, setelah income for the year,pajak 25,394 (34,839) net of tax
Total penghasilan komprehensif Total comprehensive incometahun berjalan 176,397 148,405 for the year
* Disajikan kembali (Catatan 3) As restated (Note 3) *

PT ADARO ENERGY Tbk DAN ENTITAS ANAK/AND SUBSIDIARIES
Lampiran 2/2 Schedule
LAPORAN LABA RUGI DAN PENGHASILANKOMPREHENSIF LAIN KONSOLIDASIANUNTUK TAHUN YANG BERAKHIRPADA TANGGAL 31 DESEMBER 2015 DAN 2014(Dinyatakan dalam ribuan Dolar AS,kecuali laba bersih per saham dasar dan dilusian)
CONSOLIDATED STATEMENTS OFPROFIT OR LOSS AND OTHER
COMPREHENSIVE INCOME FOR THE YEARS ENDED31 DECEMBER 2015 AND 2014
(Expressed in thousands of US Dollars,except for basic and diluted earnings per share)
Catatan atas laporan keuangan konsolidasian terlampir merupakanbagian yang tidak terpisahkan dari laporan keuangan konsolidasian
secara keseluruhan.
The accompanying notes to the consolidated financial statements form anintegral part of these consolidated financial statements.
Catatan/ 31 Desember/DecemberNotes 2015 2014*
Laba tahun berjalan yang dapat Profit for the yeardiatribusikan kepada: attributable to:
Pemilik entitas induk 152,440 177,897 Owners of the parent entityKepentingan non-pengendali 29 (1,437) 5,347 Non-controlling interests
Laba tahun berjalan 151,003 183,244 Profit for the year
Total penghasilan komprehensif Total comprehensivetahun berjalan yang dapat income for the yeardiatribusikan kepada: attributable to:
Pemilik entitas induk 178,883 145,697 Owners of the parent entityKepentingan non-pengendali 29 (2,486) 2,708 Non-controlling interests
Total penghasilan komprehensif Total comprehensive incometahun berjalan 176,397 148,405 for the year
Laba bersih per saham 36 Earnings per share- Dasar 0.00477 0.00556 Basic -- Dilusian 0.00444 0.00518 Diluted -
* Disajikan kembali (Catatan 3) As restated (Note 3) *


PT ADARO ENERGY Tbk DAN ENTITAS ANAK/AND SUBSIDIARIES
Lampiran 4/1 Schedule
LAPORAN ARUS KAS KONSOLIDASIANUNTUK TAHUN YANG BERAKHIRPADA TANGGAL 31 DESEMBER 2015 DAN 2014(Dinyatakan dalam ribuan Dolar AS)
CONSOLIDATED STATEMENTS OF CASH FLOWSFOR THE YEARS ENDED
31 DECEMBER 2015 AND 2014(Expressed in thousands of US Dollars)
Catatan atas laporan keuangan konsolidasian terlampir merupakanbagian yang tidak terpisahkan dari laporan keuangan konsolidasian
secara keseluruhan.
The accompanying notes to the consolidated financial statements form anintegral part of these consolidated financial statements.
31 Desember/December2015 2014
Arus kas dari aktivitas operasi Cash flows from operating activitiesPenerimaan dari pelanggan 2,776,552 3,342,921 Receipts from customersPembayaran kepada pemasok (1,713,618) (1,988,783) Payments to suppliersPembayaran kepada karyawan (129,645) (131,744) Payments to employeesPenerimaan pendapatan bunga 11,391 25,260 Receipts of finance incomePembayaran royalti (234,959) (396,338) Payments of royaltiesPembayaran pajak penghasilan badan Payments of corporate income taxes
dan pajak penghasilan final (207,055) (182,635) and final income taxesPenerimaan restitusi pajak penghasilan 50,950 88,726 Receipts of income tax refundsPembayaran beban bunga dan keuangan (45,427) (164,298) Payments of interest and finance costsPenerimaan/(pembayaran) lain-lain, neto 3,405 (1,003) Other receipts/(payments), net
Arus kas bersih yang diperoleh dari Net cash flows providedaktivitas operasi 511,594 592,106 from operating activities
Arus kas dari aktivitas investasi Cash flows from investing activitiesPembelian aset tetap (69,978) (55,226) Purchase of fixed assetsPembayaran atas penambahan properti Payment for addition of mining
pertambangan (31,175) (48,054) propertiesPemberian pinjaman ke pihak ketiga (20,000) - Loan given to a third partyHasil penjualan aset tetap 2,712 5,086 Proceeds from disposal of fixed assetsPembayaran atas penambahan aset Payment for addition of exploration and
eksplorasi dan evaluasi (8) (102) evaluation assetsHasil penjualan investasi Proceeds from the sale of investment
pada entitas asosiasi - 25,130 in an associatePenambahan kepemilikan Purchase of additional
pada entitas asosiasi - (9,750) interest in associatesPenerimaan pembayaran kembali Receipt from repayment
pinjaman ke pihak ketiga - 16,670 of loan to a third partyPenerimaan pembayaran kembali Receipt from repayment
pinjaman ke pihak berelasi - 40,233 of loan to a related party
Arus kas bersih yang digunakan Net cash flows used inuntuk dari aktivitas investasi (118,449) (26,013) investing activities
Arus kas dari aktivitas pendanaan Cash flows from financing activitiesPembayaran utang bank (625,250) (729,249) Repayments of bank loansPenerimaan utang bank 320,000 1,156,000 Proceeds from bank loansPembayaran dividen kepada Payments of dividends to
pemegang saham Perusahaan (75,487) (75,168) the Company’s shareholdersPembayaran utang sewa pembiayaan (31,821) (39,694) Payments of finance lease payablesPembayaran beban yang berhubungan
dengan pinjaman (6,874) (22,762) Payment of loan related costsPembayaran dividen kepada Payments of dividends to
kepentingan non-pengendali (2,221) (1,032) non-controlling interestsTransfer ke deposito berjangka yang
dibatasi penggunaannya (1,160) (176) Transfer to restricted time depositsPinjaman dari pihak ketiga - 15,541 Loans from a third partyPenerimaan setoran modal dari Receipt of capital injection from
kepentingan non-pengendali - 219 non-controlling interestsPelunasan Senior Notes - (800,000) Redemption of Senior Notes
Arus kas bersih yang digunakan Net cash flows used inuntuk aktivitas pendanaan (422,813) (496,321) financing activities

PT ADARO ENERGY Tbk DAN ENTITAS ANAK/AND SUBSIDIARIES
Lampiran 4/2 Schedule
LAPORAN ARUS KAS KONSOLIDASIANUNTUK TAHUN YANG BERAKHIRPADA TANGGAL 31 DESEMBER 2015 DAN 2014(Dinyatakan dalam ribuan Dolar AS)
CONSOLIDATED STATEMENTS OF CASH FLOWSFOR THE YEARS ENDED
31 DECEMBER 2015 AND 2014(Expressed in thousands of US Dollars)
Catatan atas laporan keuangan konsolidasian terlampir merupakanbagian yang tidak terpisahkan dari laporan keuangan konsolidasian
secara keseluruhan.
The accompanying notes to the consolidated financial statements form anintegral part of these consolidated financial statements.
31 Desember/December2015 2014
(Penurunan)/kenaikan bersih kas dan Net (decrease)/increase in cash andsetara kas (29,668) 69,772 cash equivalents
Kas dan setara kas Cash and cash equivalents atpada awal tahun 745,248 680,904 the beginning of the year
Efek perubahan nilai kurs pada Effect of exchange rate changes onkas dan setara kas (13,128) (5,428) cash and cash equivalents
Kas dan setara kas pada akhir Cash and cash equivalents at the endtahun (Catatan 5) 702,452 745,248 of the year (Note 5)
Lihat Catatan 38 untuk penyajian transaksi non-kasGrup.
Refer to Note 38 for presentation of the Group’snon-cash transactions.