NEWS GIS - picgisrs.org
16
s GIS & REMOTE SENSING NEWS FIJI USER GROUP, Number 13 (9504), December 1995 NOVEMBER MEETING Management Services Division, Forestry, 14 November 1995 News Updates MSD Forestry announced that: • Data capture of proposed log- ging areas is completed. • FFI may request further map- ping in Vanua Levu in order to be able to operate with sustain- able yield which requires maps of 1:10,000 scale. • Plantation mapping under EU funded project continues. The GPS survey is completed for most plantations of Vanua Levu. The stereo mapping of these plantations is postponed because of difficulties produc- ing copies of the 1:25,000 aerial dia-positives. • Forest change detection using new satellite data continues. • ERDAS-Imagine is running un- der version 8.2, however, the system is not fully operational yet. • The new addition of the forest type / forest function map was checked in the field and mini- mal errors were noted. These maps will be printed soon. • Logged areas are still mapped on old LRD maps (1:50,000) by sketching. • MSD-Forestry were faced with many hardware problems dur- ing the last weeks. Thanks to SOPAC and also to USP who helped. SOPAC announced that: • Production of mapping mate- rial during past month for re- view of the European Union funded Regional Marine Re- sources Program which in- cluded SOPAC-MAPS seabed mapping project. • PEACESAT site is continuing operation and will be officially opened 1st December, 1995. Daily testing for one hour of full Internet connection. Other or- ganisations encouraged to use this facility for regional commu- nications. • SOPAC, in joint partnership with with the results of the evalua- tion will be published in the next Fiji GIS & Remote Sensing Newsletter. MRD advised: • Vanua Levu geological map is now available. • A data base is available for un- derground water. This data mainly concentrating on Namosi. • The network is now complete. Lukemine Enterprise an- nounced that: • A private consultant is working with GPS for Fiji Sugar. • Drainage location is being un- dertaken for PWD. FLIS advised that: • First draft of 1996 training pro- gram is available. • A Hazard mapping pilot project has started with involvement of FLIS. • The data capture of existing cadastral maps of Fiji will be completed by next week. • The census boundary data cap- ture continuous. • One consultant is upgrading the FLIS GIS system and two other consultants are enhanc- ing the other components in- cluding the information tech- nology strategy. • Two examples of the digital topographical map of Fiji at Relief Data, Global View Project, Gravity, Terrain Base, Southern Oceans Geophysical Data. • Evaluating two Geology soft- ware applications for storage and display of borehole data. One is GDM, a French pack- age while the other is Discover, an Australian product, which is a MapInfo add-on. An article the British Geological Survey (BGS), will be implementing a Mineral Resources Database in Vanuatu using Microsoft Access for organising the data and MapInfo for display. • Ordered several datasets on CD from the National Geo- physical Data Centre (NGDC), USA. The titles are: Geologi- cal Hazards Photos, Global T his is the fourth and final newsletter for 1995 and the end of the year is a time to reflect on the successes and failures of the past twelve months. The best thing about 1995 was the increased awareness in the benefits from improved communications and the first footsteps by many into the world of the Internet. What were the things we could have done better? Well, besides producing more releases of this newsletter we could have made a more united front and obtained a more cost effective Internet service for Fiji. But we have 1996 to put both of these issues to rights. Of course the end of the year is a time of food and drink and while on the subject of the former there was food for thought when Mike Poidevin made his final presentation in summarising his work in Fiji over the past two years. He reminded us of the importance of the GIS and Remote Sensing User Group Newsletter and the User Group itself in keeping government departments, regional organisations, commercial sector and interested par- ties informed of who is doing what and who is holding what data. He also encouraged the different groups within Fiji to work closely together and provide assistance and support to each other. This is especially true in relatively small countries where it is not practical to have specialist services in each group. So if there is one message for 1996 it’s to keep the user group committed to providing relevant information to the widest possible audience and to share data and services in the most cost effective manner. All the best for 1996.c NEWS
Transcript of NEWS GIS - picgisrs.org

1
sG I S
&REMOTE SENSING NEWS
FIJI USER GROUP, Number 13 (9504), December 1995
NOVEMBER MEETING
Management Services Division,Forestry, 14 November 1995
News UpdatesMSD Forestry announced that:• Data capture of proposed log-
ging areas is completed.• FFI may request further map-
ping in Vanua Levu in order tobe able to operate with sustain-able yield which requires mapsof 1:10,000 scale.
• Plantation mapping under EUfunded project continues. TheGPS survey is completed formost plantations of VanuaLevu. The stereo mapping ofthese plantations is postponedbecause of difficulties produc-ing copies of the 1:25,000aerial dia-positives.
• Forest change detection usingnew satellite data continues.
• ERDAS-Imagine is running un-der version 8.2, however, thesystem is not fully operationalyet.
• The new addition of the foresttype / forest function map waschecked in the field and mini-mal errors were noted. Thesemaps will be printed soon.
• Logged areas are still mappedon old LRD maps (1:50,000)by sketching.
• MSD-Forestry were faced withmany hardware problems dur-ing the last weeks. Thanks toSOPAC and also to USP whohelped.
SOPAC announced that:• Production of mapping mate-
rial during past month for re-view of the European Unionfunded Regional Marine Re-sources Program which in-cluded SOPAC-MAPS seabedmapping project.
• PEACESAT site is continuingoperation and will be officiallyopened 1st December, 1995.Daily testing for one hour of fullInternet connection. Other or-ganisations encouraged to usethis facility for regional commu-nications.
• SOPAC, in joint partnership with
with the results of the evalua-tion will be published in the nextFiji GIS & Remote SensingNewsletter.
MRD advised:• Vanua Levu geological map is
now available.• A data base is available for un-
derground water. This datamainly concentrating onNamosi.
• The network is now complete.
Lukemine Enterprise an-nounced that:• A private consultant is working
with GPS for Fiji Sugar.• Drainage location is being un-
dertaken for PWD.
FLIS advised that:• First draft of 1996 training pro-
gram is available.• A Hazard mapping pilot project
has started with involvement ofFLIS.
• The data capture of existingcadastral maps of Fiji will becompleted by next week.
• The census boundary data cap-ture continuous.
• One consultant is upgrading theFLIS GIS system and twoother consultants are enhanc-ing the other components in-cluding the information tech-nology strategy.
• Two examples of the digitaltopographical map of Fiji at
Relief Data, Global ViewProject, Gravity, Terrain Base,Southern Oceans GeophysicalData.
• Evaluating two Geology soft-ware applications for storageand display of borehole data.One is GDM, a French pack-age while the other is Discover,an Australian product, which isa MapInfo add-on. An article
the British Geological Survey(BGS), will be implementing aMineral Resources Databasein Vanuatu using MicrosoftAccess for organising the dataand MapInfo for display.
• Ordered several datasets onCD from the National Geo-physical Data Centre (NGDC),USA. The titles are: Geologi-cal Hazards Photos, Global
This is the fourth and final newsletter for 1995 and the end of the year is atime to reflect on the successes and failures of the past twelve months. Thebest thing about 1995 was the increased awareness in the benefits fromimproved communications and the first footsteps by many into the world ofthe Internet. What were the things we could have done better? Well, besides
producing more releases of this newsletter we could have made a more united front andobtained a more cost effective Internet service for Fiji. But we have 1996 to put both ofthese issues to rights.
Of course the end of the year is a time of food and drink and while on the subject of theformer there was food for thought when Mike Poidevin made his final presentation insummarising his work in Fiji over the past two years. He reminded us of the importance ofthe GIS and Remote Sensing User Group Newsletter and the User Group itself in keepinggovernment departments, regional organisations, commercial sector and interested par-ties informed of who is doing what and who is holding what data. He also encouraged thedifferent groups within Fiji to work closely together and provide assistance and support toeach other. This is especially true in relatively small countries where it is not practical tohave specialist services in each group.
So if there is one message for 1996 it’s to keep the user group committed to providingrelevant information to the widest possible audience and to share data and services in themost cost effective manner.
All the best for 1996.c
N E W S

22
1:25,000 scale will be broughtin two weeks to FLIS. This datawill include contours and drain-age.
• The last two missing mapsheets of Fiji’s topographicalmap 1:50,000 are available,now.
NLTB advised that:• FLIS is assisting NLTB acquir-
ing cadastral data to be usedin NLTB ALTA Task Force.
• Since September NLTB is us-ing InfoCAD GIS software run-ning under Windows NT. NLTBmoved from mainframe toPCs. First experiences arepositive.
UNHDA advised that:• A server for windows NT is in-
stalled• They have no GIS at the mo-
ment.
PresentationsMike Poid evin ’s presentation fo-cused on the mapping project hewas involved with during his twoyear contract with The Fiji ForestResource Tactical PlanningProject. The main points fromMike’s talk were:
• His contract was to introduce amapping capability into Man-agement Services Division inthe Forestry Dept. This in-volved the purchase of suitablemapping equipment and thetraining of counterpart staff.
• The equipment purchased in-cluded a Zeiss Visopretstereoplotter, computers, digi-tising tablet, ink-jet plotter anda GPS mapping system.
• Microstation is used for the dig-ital mapping in Forestry.
• The mapping focus is on theproduction of 1:10,000 scaletopographic maps of loggingareas.
• GPS is used for control of theaerial photography, and foradding detail to the maps, andeventually the update of log-ging operations onto the maps.
• Forestry has worked well withother Government Depart-ments in Fiji and regional or-ganisations.
• Fiji is a small country and re-sources, both human and
equipment are scarce. It is im-por tant that the differentgroups within Fiji work closelytogether and provide assist-ance and suppor t to eachother. An example of this iswhere, Forestry uses theLands Dept. PUG-IV foraerotriangulation marking, andLands uses the Dept. of For-estry’s PAT-M aerotriangulationsoftware. The Lands Dept. hasmade use of the Dept. of For-estry’s GPS system to acquireground control points for their1:50,000 scale mappingproject.
Atu Laqeretabu explained theVillage Profile Project which con-sist of a data base containing sta-tistical data grouped for village,district, province and division.This survey stored in a data bankgives a picture of the rural Fiji. Itreflects the status and can beused for planning the develop-ment. An important feature of thisdata base is the ability to ana-lyse population water and sani-tation relationship.
DiscussionIt was agreed that the value ofthe Village Profile Project datawould be more fully realised byintegration with a GIS in orderthat the interaction betweenpopulation pressure and the en-vironment may be displayed andbetter understood.
Further to Mike Poidevin’s pres-entation, considerable time wasspend highlighting the limitedtechnical resources and thelarge areas to be covered andhow these problem can be ad-dressed by through sharing oftechnical services, sharing ofbaseline data and expertise. Thevalue of the user group wasagreed as it serves as a forumfor discussion and regular ex-change of ideas and develop-ments at technical level well aspreventing duplication of effortand repetition of data capture.
The establishment of the GPSbase station at MSD for differ-ential correction was discussed
and several examples notedwhere this valuable services canbe utilised by a wide audience ofGPS users throughout the entirecountry. MSD and SOPAC ex-plored the possibility of storingthe necessary reference data ina suitable format for subsequentdownloading via dial up tel-ephone lines. For example, asurveyor in the Lau Group Is-lands could arrange for the ref-erence data for differential cor-rection of his GPS survey, to bestored in Suva and downloadedvia telephone lines the next dayto enable him to produce surveyresults with sub-meter accuracy.
DECEMBER MEETING
Fiji Land Information Service, 12December 1995.
News UpdatesDepartment of Lands reportedfrom:• the ISSIR conference which
highlighted future use of satel-
n by J. Bhusan, V. Latilevu, E. Tupua, A. Wata, MSD, Forestry
FOREST TYPE MAPPING OF TAVEUNIIntroductionTaveuni is an island east of Vanua Levu on which the eastern side was mostly covered withclouds. However, it has dense tropical rain forest containing rich flora and fauna. It was notpossible to map it during the forest inventory carried out 1969. During the recent inventoryof Fiji’s natural forests no cloud free satellite data was available. Towards the end of 1994, itwas possible to take cloud free aerial photographs at a scale of 1:50,000. Where other parts ofFiji’s rainforest was mapped by satellite data analysis, for Taveuni aerial photo analysis wasapplied. A ZEISS Visopret was used to map the land cover types, road network, villages anddrainage system. The map editing of this vector data was carried out by MicroStation. ARC-INFO was necessary to convert the MicroStation data set into an ERDAS readable formatand finally ERDAS software integrated the forest cover into other raster data, necessary tocalculate forest functions. The forest functions and forest cover was sent as TIF file and allvector data was sent as DXF file to a German printing company.
Stereo ModellingThe forest type mapping of Taveuni was undertaken using the 1994 AAM1 photographs andfield controls (GPS) established by Mike Poidevin (MSD-Forestry) for the Lands & SurveyDepartment.
Altogether a total of 19 stereo models were set up which had been pugged and controlledby the air survey section of the Lands Department. Initially the aero-triangulation control
1 AAM = Australian Aerial Mapping

3
lite data• the AURISA conference which
concentrated on user applica-tions on GIS and RemoteSensing
FLIS advised that:• Systems are updated for topo-
mapping.• 1986 boundaries from Bureau
of Statistics are digitised.• Data transfer from NLTB is on-
going.
MRD advised.• Further sections have been
equipped with computer facili-ties.
MSD Forestry announced that:• Forest cover mapping for
Taveuni is complete. Aerialphotographs were mapped bystereo plotter and transferred
to raster GIS via Microstationand Arc/Info.
• Data capture for Nadarivatuplantation at 1:10,000 com-pleted and shifted to FMG
• Forest change detection con-tinued for map sheets Suvaand Nausori. An alarming de-crease of mangrove and de-crease of natural forest wasnoted. However, this will re-quire field verification.
NLTB announced that:• Data translation is an ongoing
activity• The first district has been
translated from Infomap toInfocadd
SOPAC announced that.• Phase one of the Vanuatu Min-
eral Resources Database willbe completed this week which
will provide the Department ofGeology, Mines and Water Re-sources with access to tabu-lar and spatial information frommineral surveys which haveconducted in Vanuatu over thepast 40 years. The system iswritten in MapInfo and Access.
• SOPAC will be providing thetechnical expertise for imple-menting the Department of En-vironment GIS commencingJanuary 1996.
Town Planning stated:• The need to acquire compu-
ter equipment has been iden-tified to assist in access to datafrom other departments.
UNDHA advised that:• A GIS is needed and a system
will be implemented early nextyear
World Wildlife Foundation re-ported that:• There is considerable interest
in applying GIS within their or-ganisation to assist fulfillingtheir mandate.
PresentationsIlaitia Navunisaravi , FLIS, pre-sented the digitising of censusboundaries. The Bureau of Sta-tistics defines the census
boundaries on cadastral mapsand FLIS is digitising theseboundaries. The title for thisproject is CCMS (ComputerisedCadastral Mapping System).There are several boundaries:one from 1976, one from 1986,and the new one for 1996 Thelatter will be completed in March1996. The purpose of this projectis to provide spatial data for elec-tions, medical health centres andeducation centres.
Wolf Forstreuter presented onbehalf of Rupeni Anise (MSD,Forestry) the new forest-type/for-est-function maps which havebeen verified in the field and arenow being printed in Germany. Itwas explained that the informa-tion contained in these maps willenable Fiji to undertake improvedland use planning. These mapscontain three types of informa-tion:
1. the forest types stratified intothree densities of natural for-est, hardwood and pine plan-tations, coconut dominated ar-eas, mangrove areas, andnon-forest;
2. forest functions classified intomultiple use forest, preserveforest, protection forest, timberproduction plantation, and
extensions was done usingPAT-M2 software and thestereo-plotter (Visopret) bythe Lands Department staffat the MSD. These photo con-trols were down loadedwhen mapping properstarted. Some problems wereencountered when the mod-els were set up for absoluteorientations. Quick liaisonwith the air survey unit re-solved this problem. In factthey had done a new set ofadjustments.
Since two flight runs cov-ered the island all thestereopairs set up for obser-vations were incompletemodels. But this did nothinder accuracy of mapping.The tolerances were set up at5 metres for x and y valuesand 3 metres for z. The actualmapping is more precisewhere tolerances were farbelow the accepted level.
The Photointerpretationand MappingOn the black and white con-tact prints (aerial photo-
graphs) the following landcover types and other linearfeatures were interpretedand delineated. Diapositiveswere used to do the actualmapping on the Visopret.The contact prints were usedas a guide. All the classes offorest typing done was basedon crown closure.
Non-Forests: Any zone with:no trees, shrubs, bushes andgrassland were all identifiedas non forest. The texture al-lows a clear separation fromforest.
Villages: Most of the villagesare situated along the flatcoastal plains, very few in-land. Villages are easily iden-tifiable by the houses, roadsand other man made featuresin the surrounding.
Rivers and Creeks: Interpre-tation and mapping of thesefeatures was easy of thewestern side of the islanddue to less vegetation anddeep gorges. Where densevegetation and overgrowthwas found mapping was lessprecise.
Scattered forests: Scatteredforest was mostly foundalong river banks and gorgesand along cultivated sides.Other such areas fell inlogged over forest locations.The criteria was the crownclosure of less than 50% in-cluding trees and tree ferns.
Medium dense forests : Me-dium dense forest was alsobased on the crown closureconcept . Forest areas where30 - 70 % crown closure wasseen got classified as thistype.
Dense forest: Dense foresttyping was interpreted in re-gions where 70 to 100%crown closure was found.Most o these regions fall in-
land, on and around themain ridge running down inthe middle of the island. Adense concentration is seenin the middle western fringesof the island.
Coconuts: The coconut plan-tations fringe on the coastalline extended up the mainrivers. Most of the coconutplantations are seen in thenorth, south and the west ofthe island the east is coveredmainly by forests (see Figure1). The fine pattern of the co-conut leaves gives a typicaltexture on the image whichis easily identifiable.
Evaluation of crown clo-sure is more subjective thanthe determination of otherforest typing e.g. species
2 PAT-M = aerial triangolation soft-ware of MicroStation Visopret

44
SOFTWARE WARNINGSForestry have encountered a problem withVersion 2.54 and Version 3.00 of Trimble Navi-gation Pfinder software. The problem relatesto conversion to FMG (Fiji Map Grid). Heightscomputed are in error to approximately 20metres. The problem has been logged withTrimble Navigation. For further informationcontact Epi Rakita at MSD-Forestry phone320814.
Another problem was encountered withImage Alchemy software Version 1.7.7 dur-ing plotting raster data files. The plotter is notable to produce the output in the right size.The difficulty was discussed with HandmadeSoftware Inc, USA and the company hasfound a solution. If you have problems to plot-ting with this Version of Image Alchemyplease contact Wolf Forstreuter MSD-Forestryphone 322635.Mike Poidevin, MSD-Forestry
identification. A number offactors enter into this estima-tion of crown closure:• scale of the photographs• quality of the images• quality of the optics• pattern and texture of the
Taveuni vegetationBecause of the scale
(1:50,000) small gaps mayhave been overlooked. How-ever the quality of the aerialphotographs and diaposi-tives is excellent because ofgood illumination, good filmmaterial and professionaldeveloping. The optics of theVisopret allow good enlarge-ment and provide a veryclear view of the images.Taveuni’s forest mostly fallsinto nature and forest re-serves which are mainly un-touched. Dense forest andscattered forests are more dif-ferent than in other parts ofFiji. The interpreter have for-est knowledge which provedto be essential for this job.
There was no field checksnecessary because both inter-preters have a good localknowledge about the island.
ginal information normallyshown on the 1:50,000 serieswere omitted.
Co-ordinate shifting wasdone using MicroStationwere mapping on full FMGco-ordinates is not possible.The software controlling theVisopret only accepts trun-cated co-ordinates. There aretwo possibilities, one is toshift the global origin and theother a MSD written soft-ware which adds the missingdigits to the truncated co-or-dinates. Lastly, the files con-taining the planimetry datawere converted to a DXF fileby MicroStation software.
In a few doubtful cases ad-vise was sought from otherMSD foresters. It proved tobe unnecessary to undertakefurther filed checks.
Map Editing and DataConversionThe mapped data went fromthe Visopret to MicroStationmap editing. From there toARC-INFO and finally toERDAS.
MicroStationAll the features shown on themap were on different levelsfor ease of reference. Featurenames i.e. text were placedalong elements (creeks, min-ers, villages etc.) during mapediting and the labelling ofland cover was done duringobservation with some cor-rections during map editing.
Finally the whole of TaveuniIsland were cut into 3 differ-ent sheets as per 1:50,000mapping series namely S23Rabi, S24 Taveuni, S25Vatuva Point. All the mar-
ARC-INFOARC-INFO software pack-age is equipped with themodule DATA CONVER-SION which converts differ-ent file formats to ARC-INFOcoverages. The programused called DXFARC. Thismodule allows to display(DXFINFO) all layers createdby MicroStation and to selectonly the forest cover.
MicroStation do not have thefacility to relate a defined GISvalue to every polygon. AGIS value is a numeric codeindicating the land use type.MicroStation does this bydisplaying the annotation.
amenity plantation;3. infrastructure which shows the
river system, road network,and village locations and otherannotations.
It was noted that access to newsatellite data is critical for landuse planners to have up-to-datethematic maps. The forest typeinformation is currently beingupdated by MSD through the useof new satellite images.
An article by Rupeni Anise willbe published in Fiji GIS & Re-mote Sensing News 9504.
Tevita Wara , NLTB presentedthe translation of NLC maps tostandard format which can beintegrated into other Fiji depart-ments. The conversion of theNLTB data which was held in thenow redundant Informap system
has been achieved through as-sistance from FLIS. NLTB hadcarried out capture of a varietyof land use data through a com-prehensive digitising program butthe project was hampered by dif-ferent grid systems and nonstandard software. These prob-lems have now been overcomethough by translating the old datainto DXF format files which hasbeen adopted as the agreed in-terchange format in Fiji. Theproject will be completed by mid1996 and the data, which in-cludes ALTA information.
DiscussionThe problems of data exchangewas discussed and FLIS notedthat, following attendance at con-ferences, there are severe prob-lems in Australia through the lackof common formats. These prob-lems have been identified by the
user group as early as 1992 andaddressed by participants so thatFiji is able to easily exchangedata among different organisa-tions.
In remote sensing applications,the Pacific Island Countries, lagbehind their neighbours, in par-ticular Australia. If immediatesteps are not taken to addressthis gap, then severe problems
will arise as this gap may widensufficiently and it may prove im-possible to overcome. It was sug-gested that a regional organisa-tion, with suitable specialist skillsbe requested to take steps toreduce this problem.
There will be a Regional RemoteSensing meeting in Fiji during1996. There should be thoroughpreparation before the meeting

5
Water 1
Mangrove 2
Non Forest 3
Coconut 6
Scattered Forest 9
Medium Dense Forest 10
Dense Forest 11
3 ERDAS DIG file = file format of the ERDAS digitising program whichcontains vector data in ASCII form.
RADARSAT is equipped withSynthetic Aperture Radar (SAR)which penetrates clouds, smokeand haze. This sensor can recordday and night and is able todownload to stations in Canada,UK, Norway and Singapore. Thesatellite has also onboard tapefacilities so data recording fromFiji is possible! RADARSAT an-nounced that they will send aVideotape to SOPAC about thesatellite launch and product in-formation.
RADARSAT satellite portableground stations are being de-veloped as well as the IOSAT onedescribed in the last newsletter.RADARvision from MacDonaldDettwiler provides a portable sta-tion capable to receive and proc-ess data from this satellite.c
will now have the same illumina-tion as before the orbit inclina-tion decrease.
EOSAT also advised that the In-dian satellite IRS-1C, which dataEOSAT is distributing, will belaunched end of December1995. As mentioned in earliernewsletter, the satellite has a on-board tape recorder and is ableto collect data from Fiji. We ex-pect the price list and furtherdetails and will publish it in thenext newsletter.
RADARSAT International ad-vised that its satellite has beenlaunched successfully and thefirst images acquired 14 Decem-ber 1995 are excellent.RADARSAT images are availablefor public in February 1996.
of an UN organisation is entirelyinadequate.
Next MeetingTo be held first Tuesday Febru-ary 1996 at FLIS.
SATELLITE
NEWSBecause it is only six weeks sincethe last newsletter was published,there have not been many newdevelopments.
EOSAT informed the newsletterthat the 11 years old space vehi-cle Landsat V is still working well.The spacecraft’s orbit inclinationdecreased and its equator cross-ing became earlier. This effectsthe illumination of the scenesbecause the sun angle is loweras Landsat’s orbit is sun-synchro-nous. During 27 October and 29November 1995 three orbit incli-nation adjustment manoeuvreswere carried out and the scenes
to ensure that the needs of theregion are heard and adequatesteps taken to meet thoseneeds. It was noted that consid-erable effort had been put intothe ESCAP funded meeting in1995 but no actions or benefitshave resulted from this meetingwhich was generally agreed tohave been ineffectual.
Osea Tuiniv anua , briefly out-lined the research undertaken inEurope. He investigated the re-lationship between forest coverand water catchment using re-mote sensing data and GIS ap-plications. He will be applyingthese techniques for monitoringforests within the region to fore-cast problem areas arising fromdeforestation within water catch-ments. The need for a portablesatellite receiving ground stationwas highlighted due to the cur-rent as well as future lack of datafor the region. It was agreed thatPacific Island politicians must beinformed of this urgent need forsatellite data in order that theywill lobby at the appropriate level.The inclusion of a por tableground station in a “shopping list”
Finally, the BUILD program of ARCEDIT correlates the GISvalues with the PAT file.
ERDASThe program ERDARC of the ERDAS data conversion mod-ule converts ARC/INFO coverages to ERDAS DIG3 files. The
The operator has to relate the GIS values in ARC-INFO envi-ronment. Table 1 shows the GIS values used for 1:50,000 for-est type mapping.
Table 1. GIS values of forest type mapping. Agriculture andvillages are classified as non forest, the land use type coconutwith scattered forest was reclassified to coconut.
Figure 1. The “forest function” layer(above) and the (aggregated) “interpretedforest function” layer (below). Blackindicates coconut, the mediumgrey multiple use forest, thelighter grey part in thewest preserved forestand the very lightgrey protectionforest. Non forestand water isindicated in verylight grey andwhite.

66
FMG related data is treated as UTM during this conversionbecause there is no FMG option in the program. However,there is no distortion at 1:50,000 scale if this process is car-ried out separately for every map sheet.
Then, the ERDAS program GRDPOL converts the vectordata of the DIG file to raster data by importing it into a rasterbackground map-file. The data conversion of the forest coverlayer is necessary to be able to carry out overlay analysis fordetermination of forest functions.
Calculation of Forest FunctionThe forest functions derive from GIS overlay analysis. Sev-eral sources of spatial information have to be combined tocreate this layer. The forest functions indicate which parts ofthe forest should be protected, preserved or can be managedfor timber production.
1) In Taveuni there is a large forest reserve, a nature reserveand some areas of endangered species. These areas areshown by the layer “declared areas”.
2) The slope layer was not created from the DTM4 becausethe DTM of Taveuni did not reflect the actual field situa-tion. The slope classes were manually delineated on atopographical map and digitised.
3) Soil erodability classes derived from the digital soil mapis available at MSD.
4) Mean annual rainfall and seasonallity rainfall layers werealready available for the island.
The forest function layer is calculated separately for everypixel. This creates a so called salt and pepper effect. For mapproduction and management of these different forest catego-ries the areas were aggregated into clusters (see Figure 1).
A further GIS overlay process combined the forest func-tion layer with the forest type to produce a layer showing theforest types and forest functions in different colour.
Sending Files to GermanyThe forest type / forest function was converted to TIF file byERDAS software. This is a more common format comparedto the normal ERDAS GIS file and can be used by a Germanprinting company to download the data directly for offsetprinting. The linear features were send in DXF file format.
Because even airmail needs much time to reach Germanyand because of outdated mentally of German customs, thefiles were send by telephone line. In order to reduce the costall files have been compressed by ARJ5 software to approxi-mately 10% of their originally size. Then the telephone linkwas established by modem and QuickLink software foruploading the data to the GOPA headquarters computer inGermany.
Summary and RecommendationsIf recent aerial photographs at a scale of 1:50,000 are avail-able, they can have more potential than satellite images:• texture information was used for forest stratification which
4 DTM = Digital Terrain Model, created in Germany from 1:50,000 topographicmaps.5 ARJ = data compression software which is used by MSD mainly forcompression of raster data.
The British Geological Survey (BGS) and the South Pacific AppliedGeoscience Commission (SOPAC) have been awarded a contract toestablish a Mineral Resources Database. The project, funded by theBritish Government under its bilateral assistance to Vanuatu aims toestablish an integrated geoscience information system with the pri-mary objective of compiling all data sets relating to mineral explora-tion in Vanuatu.
The project which began in November 1995 and will be com-pleted in 1996 is implemented by Gaynor Collins of BGS and FrankMartin of SOPAC. Initially the project will establish the database for-mat and provide training to the national counterparts in the input ofdata and the maintenance of the data base. The national counter-parts will be responsible for the input of data and the project person-nel will return to complete the project in 1996.
The database written in Microsoft Access and MapInfo will cap-ture and adapt key spatial data sets (geochemistry and mineral oc-currence etc.) land access information and prospecting licences indigital form and will utilise a GIS to create integrated data packagesfor islands and regions of high exploration potential. Technical datathat once took weeks to locate and collate will be available in aninstant in GIS from, and the data can be regularly updated as newinformation becomes available on open-file. Other geo-technical dataincluding magnetics and radiometric data will be compiled in futurewhich will create a “one-stop-shop” computerised information sys-tem by linking spatial, text, attribute and image data through the GIS.
This project forms part of the Vanuatu Mineral Exploration Initia-tive, implemented in 1995 to assist the mining industry in the explo-ration for and development nation’s mineral resources, and the asso-ciated to Government and consequently the community.
We acknowledge the suppor t received from SOPAC in the main-tenance and upgrading of our computing facilities and both SOPACand BGS for the training of our nationals in GIS and databaseoperations.c
n by Neil Nimoho, Department of Geology, Mines &Water Resources, Vanuatu
ESTABLISHMENT OF VANUATUMINERAL RESOURCES DATABASE
is impossible with available satellite data.6
• all linear features such as creeks and small roads can bemapped which is impossible with satellite dataVector data is difficult to be used for overlay analysis and
for the calculation of forest function, overlay analysis is ab-solutely essential. The work carried out demonstrates thatthe integration of vector and raster data is possible.
Forest stratification requires a field experienced foresterwho is trained in aerial photo analysis. If an operator of suchqualification does the aerial photo analysis less field work isnecessary.
If there will be a regional remote sensing and GIS centrefor forest monitoring it should have the potential to analyseaerial photographs and combine the analysis with rasterdata.c
6 The aerial photographs and the optic of theVisopret have a very good quality.

7
n by Fabrice Williot, SOPAC
Evaluation of IDRISI for Windows
Version 1.0 – A raster GIS
Raster GISA raster GIS has most of the functionality of any GIS but itincludes image processing facilities. It is therefore a naturallink between Remote Sensing, which produces images, anda GIS that analyses and integrates them.
The choice of a raster GISOne of the tasks of SOPAC is to provide recommendations toits members countries about software. The use of a consist-ent set of computer tools within an organisation or region isa way to make easier training, support and exchange of data.Thus, in this way, a software suite has been defined by SOPACfor its secretariat as well as for the member countries.
This suite includes core office software and the more special-ised application such as GIS, mapping and remote sensing.Some vector mapping applications are already included inthe software platform and it is now time to evaluate a solu-tion to address the need of the countries in terms of RemoteSensing, Image processing and Raster GIS. IDRISI for Win-dows could be a good candidate.
IDRISI for WindowsIDRISI for Windows is a raster based geographic analysis andimage processing system developed by the Graduate Schoolof Geography at Clark University. It is designed to provideprofessional level geographic research tools on a low cost,non-profit basis.
IDRISI for Windows is composed of a main interface and acollection of over 100 program modules. These modules pro-vide capabilities for the input, display and analysis of geo-graphic data. See Figure 1. The geographic data is stored in
map layers, each one being an elementary map componentthat describes a single theme. Furthermore, IDRISI for Win-dows is able to store in different map layers, geographic dataof different types:• Image layers;• Vectors layers.
The structure of raster or vector layers is composed byone header and one data file. The data file of raster image isonly a matrix of numbers. (in ASCII or binary format) There-fore, IDRISI files are very easy to manipulate. See Figure 2.
Figure 2. IDRISI for Windows provides a utility to see theheaders or documentation files description.
IDRISI for Windows associates each vector or raster file to anattributes file, which describes all the non geographical data.A database Workshop provides the ability to manage theseattributes.
RequirementIDRISI for Windows requires an AT or PC/2 compatible com-puter with 512k of free RAM, a hard disk, and an EGA, VGA,
n by Les Allinson, SOPAC
MapInfo DebutsMapInfo Professional(version 4.0)
MapInfo Corp., Troy, N.Y., intro-duced MapInfo Professional, thelatest version of its flagship soft-ware, in October 1995. Availablein Windows 95 format and 32-bitand 16-bit executables, the newversion is the fourth release for
graphic user interface platformsand the ninth since the productfirst shipped in DOS in 1987. APower Macintosh version will bereleased during the first quarterof 1996, according to RandyDrawas, MapInfo vice presidentof communications.
Release highlights include anew interface, designed aroundWindows 95 standards’ intelli-gent client/server functionality,which allows users to access,change, manipulate and replacedata from and between softwareprograms in a server environ-ment; Object Linking and Em-
Figure 1. IDRISI for Windowsprovides some interesting imageprocessing capabilities.
MapInfo NEWS

88
Super VGA or 8514/A graphics adapter. A math co-proces-sor is highly recommended but not required.
Evaluation of IDRISI for Windows
Advantages• Image processing facilities: image restoration, image trans-formation, image enhancement, image transformation. IDRISIfor Windows provides a lot of modules in those four topics :filters, stretch contrast, overlay, etc. See Figure 3.
Figure 3. This module allows to overlay 2 images and creates anoutput image of the result.
• An efficient Database Workshop (internal DBMS): abilityto read, create and modify database files in its own format,or in Access format (.mdb), or in Xbase format (.dbf). SeeFigure 4.
Figure 4. The Database Workshop loads and save files directly inAccess format.
• Import / export capabilities: .tif, .bmp, .dxf, .wmf, andErdas, Grass, ArcInfo file formats, and more ...
• Easy to learn,• Low price.
Drawbacks• Version 1.000000 ! So, there is a lot of little bugs !• lack of homogeneity of the Man Machine Interface,• printing facilities: you print what you have on your screen.
(No page setup, no layout)• no Cancel command,• no efficient macro language.
ConclusionIDRISI for Windows has the most important capabilities ofimage processing with the ability to import and export im-age and data format commonly used in the region.
It appears to be a good application to complementMapInfo and promises to become a very powerful softwarewith an extension of data management capabilities, newmodules for image processing and a macro language.
It is a version 1.0 which says it all. There are a lot of de-tails which need to be cleaned up for version 1.1 or 2.0.c
bedding (OLE) technology whichallows data visualisation andgeographic analysis in main-stream business applications viadrag-and-drop and integratedmapping functionality; bundledGlobal Positioning System (GPS)software from Blue MarbleGeographics, Gardiner, Maine,which provides connectivity tocommercially available GPS re-ceivers and allows users to col-lect, display and track field data;and Version 4.0 of the MapBasicDevelopment Environment, aMapInfo programming languagefor building custom vertical map-ping applications.
According to Drawas, the re-lease follows MapInfo’s evolvingstrategy of segmenting its prod-uct line by releasing high andlow-end products. “MapInfo Pro-fessional’s release, users nolonger will be bound by the desk-top. And through (our low-end
products), we are trying to bringmapping into mainstream appli-cations by map-enabling them oradding mapping elements andfunctionality”.
MapInfo Professional, pricedat $1,295 upgrades and replacesMapInfo as the company’s flag-ship software package. Its re-lease follows the release of DataMap with Microsoft Corp,Redmond Wash. (see MapInfo,Microsoft Ready Data Map Fea-ture for Release, “GIS WORLD,September 1995), andMapMarker as well as the initia-tion of its MapOpen program.According to Drawas,MapMarker 2.0, an addressmatching product that can beembedded in applications, will bereleased in December 1995 withenhanced algorithm functionality.In addition, a series of Data Mapdata applets, add-on productsproduced by MapInfo and its
value-added resellers, will be re-leased during the next severalmonths. GIS World - December1995
It is not known whether the GPSfeature will be bundled with allsoftware as it was announced inSeptember by MapInfo that thebundle only applied to the first10,000 units shipped. Pr icequoted is in US Dollars and the“international version” which willbe distributed in the region byMapInfo, Australia, will cost con-
siderably more. This reflectsMapInfo’s national and interna-tional pricing strategy as well asthe cost of doing business in theregion.
There have been rumourscirculating on the MapInfoInternet mailing list (MAPINFO-L) that a hardware key will be in-cluded in the “international ver-sion”. SOPAC has ordered bothMapInfo and MapBasic 4.0 asupgrades with an anticipateddelivery of early January. A “firstimpressions” article will be in-

9
cluded in the next newsletter andthe hardware key question will beanswered.
There have been criticisms ofMapInfo 4.0 on MAPINFO-Lwhere users have questionedwhether 4.0 is a full point up-grade from 3.0 or whether itshould have been a revisionnumber such as 3.1. These us-ers are invariably running on Win-dows 3.1 or 3.11. MapInfo re-plies:
As for the question of whether4.0 is a wor thy “full point” up-grade, someone on the list men-tioned that a major upgradeshould include fundamental tech-nological changes. Here theyare:
Support for 32 bit Windowsmeans that you get a faster, morerobust product then would everhave been possible with Win-dows 3.1.We took the time andcare to get certified as a Win-dows 95 compatible application.This means that we won’t destroyyour registry, you can uninstallthe software completely, and thatour NT version is fully functional.
The Database Connectivityfeature is a fundamental changeto the product that many usersrequested. If you use data storedin a server database, this new
feature allows you to work with thatdata directly without having tomove your changes back and forthbetween MapInfo and your maindatabase. We used to charge ex-tra for a feature that didn’t comeclose to doing what this featureprovides.
Integrated Mapping is basedon the ability to launch MapInfo asan OLE server. We have provideda robust OLE automation inter-face, and many extensions toMapBasic that will allow develop-ers to create mapping applicationsthat were simply not possible be-fore. Because MapInfo can act asan OLE server, developers cannow use Visual Basic, Visual C++,or Powerbuilder to create the frontends to their applications.
There are also major enhance-ments to our Raster support, digi-tising, DXF import, Metafile ex-port, True Type and custom sym-bol support. We revamped label-ling and added seamless mapsheets, transparent fills and raster,an animation layer, and a dozenother features. You also get GPSreceiver suppor t, a vastly im-proved bundled data set, and aslew of new utilities and applica-tions to further improve the prod-uct. We tried to pick the featuresand changes that would removeroadblocks, and that would ben-
efit the most users. I think we’veprovided the best MapInfo up-grade ever. Jim Coloprisco,MapInfo Corporation.
MapInfo Corp of the US has ac-quired Peripheral Systems PtyLtd to create MapInfo AustraliaPty Ltd. Peripheral has longbeen one of the most significantcompanies in the Australiandesktop mapping scene andwas one of the first commercial
organisations to offer a roadcentreline database. GIS User,December 1995.
A list of all MapInfo sites canbe found at http://www.gisnet.com/gis/mapinfoThis is particularly useful if youare trying to find MapInfo dataconversion utilities such as DXFto MIF, Arc to MIF and other help-ful programs and related infor-mation. GIS User, December1995.c
n by Rupeni Anise, MSD-Forestry
The New Forest Cover /Forest Function Map of FijiIntroductionFrom 1991 to 1993 a forestinventory was carried out forFiji’s natural forests. A forestinventory normally providestwo products: statistical dataabout timber volume, speciescomposition etc. and a mapshowing the forest cover anddifferent forest types withinthe forest function. The mapfor Fiji’s forests was also sup-posed to show forest func-tions such as production and
protection forest. The mapproduction was delayed andthe forest type mapping of thefirst edition of maps was notaccepted. The second editionwas checked in the field dur-ing November 1995 and thefinal print will start in Ger-many early 1996.
The map shows foresttypes, forest functions andnecessary infrastructure fororientation in the field. Theforest types are derived from
satellite image interpreta-tion and show the forestsituation of 1991/1992. Thisis not the up-to-date status.However, along with themap, the necessary facilitieshave been established at theforestry department to up-date the mapping of forestcover.
Forest Cover• dense forest
Crown density by treesand/or ferns 75 - 100 %and ground coverage bygrass, palm and/orbamboo 0 - 25 %.
• medium dense forestCrown density by treesand/or ferns 45 - 80 %and ground coverage bygrass, palm and/orbamboo 20 - 55 %.
• scattered forestShrub forest (includingscattered coconutstands), dense bushland(thickets) with singletrees. Crown density bytrees and/or ferns 15 - 50% and ground coverageby grass, palm and/orbamboo 50 - 85 %.
• mangroveMangrove forests areforest types with highoccurrence of mangrovespecies.
• hardwood plantationAreas declared as hard-wood plantation on
sketch maps available atthe forestry department.
• pine plantationAreas declared as pineplantation on maps pro-vided by Fiji Pine.
• coconut plantationAreas mapped as coconutplantation on MPI maps.
• non forestAreas covered by settle-ments, urban areas, grassand shrub vegetation vis-ible as such in the satel-lite images
The forest cover types denseforest, medium dense forest,scattered forest and non for-est derived from satellitedata analysis. Satellite datahas been used instead ofaerial photographs becausethere were no recent aerialphotographs of the forestand it was too expensive todo a photo-flight at 1:25,000scale. This is the scale re-quired for forest stratifica-tion. In the planning phase ofthe inventory it was decidedto contract a company in Ger-many specialising in satellitedata interpretation. Thiscompany took much time todeliver the first maps be-cause the company facedseveral unexpected difficul-ties.
In order to speed up themapping process the planta-tion areas were digitised inFiji. All pine plantationswere digitised from 1:50,000

1 010
the extent compatible withthe retention of the amenityvalue, but is not the primarypurpose.
• timber production planta-tion Timber productionplantation are areas of exist-ing or intended plantationestablished primarily for tim-ber production.
The determination of forestfunctions is an output of aGIS overlay analysis. In or-der to combine spatial infor-mation shown on differentmaps all maps have beendigitised and imported to theGIS. The GIS then is able tocombine these maps andanalyse for every picture el-ement (25 x 25 m) if it is suit-able to do logging or if it ismore advisable to protect orpreserve the forest. The pa-rameters in the system wereset by Dr. Dick Watling. SeeFigure 1 for the different in-formation layers.
The information layer“declared areas” includes ar-eas which are declared ascatchment or reserve orwhich are proposed reservesor catchments. Reserves canbe either declared Forest Re-serve or Nature Reserve andalso those that were still un-der proposal. The Forest Re-serves are areas generallyplanted under forests to and
als or recommendations forWorld Heritage, Nature Re-serves or National Park sta-tus.
• protection forestProtection forest are areas ofhighly sensitive native forestby virtue of their topography,climate, soil type or combi-nations their of timber har-vesting or other forestry op-erations would be restrictedto minor forest products or tomanual or non mechanisedtimber extraction. Such op-erations should have negligi-ble effect on forest cover,stand composition or hydro-logical conditions.
• multiple use forestMultiple Use Natural Forestare areas carrying indig-enous forest vegetation to bemaintained under forestcover and to be used for tim-ber production, catchmentprotection, wildlife habitat,forest recreation and amen-ity uses and for minor forestproducts.
• amenity plantation Amenity plantation are sitesof or intended areas for plan-tations primarily for someamenity purposes such asreforestation, catchment re-habilitation, landscape im-provement. Timber produc-tion would be permissible to
scale maps delivered by FijiPine. The hardwood planta-tions were digitised fromsketch maps. The maps usedfor the digitising of areasstocked with coconut planta-tions have a scale of1:126,720. The scale of1:126,700 or even sketchmaps create inaccuracies.However, it was the best in-formation available. Thehardwood plantations arenow re-mapped under Euro-pean Union funding.
The company in Ger-many had many problems toseparate mangrove areasfrom some forest cover. Fi-nally the company digitisedthe new Lands Departmentmaps. The mangrove map-ping of these maps derivedfrom aerial photographstaken in 1986.
Forest Functions• preserved forestPreserved Natural Forest areareas of natural forest to bemaintained in an undis-turbed natural condition andfor the preservation of spe-cific biological values. It in-cludes the Forestry Depart-ment Nature Reserves, otherlegally established reservesand other areas of knownunique, rare, or considera-tion for formal preservation.This includes formal propos-
reservesdeclared water catchments declared areasparks
special emphasisnatural forest FOREST COVERplantation
slopesoil erodivitymean annual rainfall erosion riskseasonal rainfall
FOREST FUNCTION
Figure 1. Determination of Forest Functions in the GIS. The forest cover was combined withother information to analyse its impact and interrelation.
being managed as planta-tions of native or exotic treespecies or allocated for futureplantation.
Nature Reserves are areasof natural forest maintainedin an undisturbed naturalcondition and for the preser-vation of biological values.These include Forestry De-partment Nature Reservesand other legally establishedreserves (e.g., Garrick Me-morial Reserve) and otherareas of known unique, rare,or very uncommon biologi-cal values which are worthyof consideration for formalpreservation. Developmentis generally excluded fromthis category.
Areas of existing Parksand Reserves are also valuesof miscellaneous amenitywhich includes: a) Recreationb) Education c) Landscape.In these areas, managementfor other use is constraint toa level designed to maintainthe value of these amenities.
Protected catchments areareas of particularly sensitivewater supplies or aquaticecosystem where compre-hensive prescriptions or con-straints in catchment use formaintenance of water qual-ity or soil stability are re-quired.
Proposed Nature Reserve,catchment and national parketc., are areas that have simi-lar natural values as previ-ously described but differsonly in terms of their legalreferences.
Special Emphasis refersto special features that de-serve to be considered inviews of their legal status. Itis the combination of de-clared areas and the existingforest cover. This informationwas obtained after combin-ing declared areas and forestcover. It seemed to be neces-sary because dense forest hashigh biodiversity and shouldhave a value for protection.
Seasonal rainfall is de-scribed as the squared ofhighest monthly rainfall (ofobservations during the timeof recording) divided by
11
n by Fiji Land Information Service
COMPUTERISATION OFBUREAU OF STATISTICS
BOUNDARIESThe Bureau of Statistics (BOS)conducts a population censusonce every decade and the nextone is scheduled for 1996. Mapsare an essential part of popula-tion census and preparations areunderway to have enumerationarea (EA) maps updated andready for this census.
However, traditional censusmap making methods haveproven to be tedious and timeconsuming on BOS staff with theincreasingly high number of newdevelopments and populationgrowth and redistribution everyyear. Such changes have there-
fore resulted in additional workfor the census staff in splitting.EAs and redefinition of bounda-ries which have accumulatedover the years. Through the yearsBOS has worked with unsuitablemaps, most of them were datedback more than 30 years old.These maps were generally on1:50,000 scale and are also toocongested to accommodate allthese changes.
BOS was grateful to the Gov-ernment’s initiative and commit-ment towards the establishmentof the Fiji Land Information Cen-tre in early 1992 for the compu-
terisation of land data. The FLISstrategy adopted by cabinet in1991 as the blue print for theFLIS programme highlighted theimportance of developing an in-tegrated geographic databasethat would avoid duplication andmeet the needs of a wide rangeof potential users. The strategyalso identified the significance ofthe enumeration area maps forthe 1996 national census and theimportance of a topographicaldatabase for a more statisticalmapping.
The project actually startedin early 1993 with the par ticipa-tion of FLIS and BOS staff. Themain aim of this joint project wasto digitise all existing censusboundaries to provide an auto-mated system and focus towardsthe production of the 1996 na-tional census. However, due tofinancial constraint the projectwork was abandoned later in thatyear. The project work was reac-tivated in July, 1995 when therequired funds were again avail-able through the BOS. The intro-duction of this new mappingtechnique in BOS census map-ping work has simplified censuswork and would solve the prob-
lems that have accumulated overthe years.
In view of the time frame andthe importance of this project forthe 1996 census, a second shiftwork programme was designedand activated for the CCMS staffin an endeavour to speed up datacapture. The shift work pro-gramme started in July, 1995 witha team comprised of four CCMSstaff and a staff from BOS. Ac-cording to Mr Josefa Uluibua, theacting supervisor CCMS, thingslook promising and about 90% ofthe total 1976 and 1986 censusboundaries have been captured.Mr Uluibua believes, this is anexcellent achievement realisedwithin a very short period whichstaff should be commended.
While digitising of the 1976and 1986 EA boundaries contin-ues, a team of Bureau staff arecurrently concentrating in thedefinition of the 1996 boundaries.This has yet to be completed andsubmitted to FLIS for digitising.The task is complicated one es-pecially in urban areas where alot of development changes andpopulation redistribution occurs.However, it is expected to becompleted soon and data sub-
mean annual rainfall (of all observations for the station dur-ing the time of recording).
Rainfall data was based only on the validated data of therainfall stations recorded at the Hydrology section, Tamavua(PWD). A seasonal factor was then calculated using a smallprogramme based on the following formula,
s = (monthly extreme)2
mean year
Stations with continuous records (giving a more reliable sea-sonal factor), were used to define the seasonal boundary.
The Mean Annual Rainfall quantifies the erosive force ofrainfall and as well as run-off. The record of collection rangefrom 0 to 4,0000 mm and above on an annual bases. This wasthe second part of the rainfall data source; captured fromPWD, also from a erodent map. As prescribe (in PublicationNo. 1 of Fiji Meteorological Service report in 1980), this rain-fall map was prepared by plotting a rainfall Factor R at eachrainfall recording station. The information was provided bythe Meteorological Section, Nadi Airport.
It was received in A4 size paper without any scale shown.There were geographical coordinates marked which was ex-actly the same when compare with the 250,000 scale map.The scale was calculated (equal to 1:760,000) and then en-larged to 1:250,000 scale, using a Planvariograph machine.This was later transferred to a 1:250,000 scale map for digi-tising.
The Soil Erodivity information was extracted from theexisting soil raster files stored at MSD-Forestry. These differ-ent soil types were regrouped into their erodability ratingsshown below:
Soil Type Ratings2 low1, 5, 9 moderate3, 11, 6, 8 high4, 7, 10 severe
The Slope Classes derived from recoding the slope mapswhich contain for every pixel (25 x 25m) a GIS value show-ing the slope of the pixel in degree. The slope informationwas recoded into 4 separate categories.
GIS: Categories: Slope Ranging:1 low 0º-16º
2 moderate 16º-27º
3 steep 27º-31º
9 extreme > 31º
The Erosion Risk information layer tells the level of risk (1-10) for potential erosion. The “erosion risk” layer is an out-put of the combination of following GIS layers: a) slope classesb) soil erodability c) seasonal rainfall d) mean annual rain-fall.
InfrastructureThe infrastructure derives from transparencies provided bythe Lands Department. One transparency shows the river

1 212
mitted to the CCMS to completethe work.
The close co-operation be-tween the FLIS and BOS in re-gards to this project is vital andshould be a long term one.Regular meetings organised be-tween the two agencies’ officialshave proved very useful, dis-cussing important issues andsolving problems. It is hoped thatsuch meetings would continue tomaintain good working relation-ship between the two organisa-tions and ultimately for the suc-cessful completion of this jointproject.
Digitising of EAs is based onthe census mastersheets (DOS1:50,000) from BOS headquar-ters using INTERGRAPH MGEand ORACLE as database. Forthe safety of thesemastersheets, photocopies areprovided to the project staff toassist them in the identificationof boundaries both in the urbanand rural areas. Cadastral dataavailable within the CCMS data-base are used for the definitionof existing boundaries in the ur-ban and peri-urban areas,whereas the topographical dataare used in areas that are notcovered by cadastral sheets i.e.2, 8,16 chains maps.
Since the digital topographi-cal data are still being scannedin NZ, the latest 1:50,000 topo-graphical maps available are be-ing used for this purpose. Withthe help of available cadastral
data, appropr iate censusboundaries can be identified onthese 1:50,000 topographicalmaps before they are registeredand digitised. For the small outerislands that are not covered bythe cadastral and topographicalmaps, the detailed Island Trac-ings available with the LandsDepartment are used to identifyestablished census boundaries.
New features were createdfor the 1976, 1986, and the 1996enumeration boundaries linked tothe table containing EA numbers.These features are added to theexisting feature lists already cre-ated for the CCMS. Once a fea-ture is selected the system wouldautomate all these processes i.e.selecting the levels, colours, lineweight, etc. EA boundaries aredigitised over the CCMS digitalcadastral boundaries using theCCMS maps as the base layer.
According to Mr Uluibua, theavailability of the digital topo-graphical data from NZ whencombined with the captured dig-ital BOS data will provide a highlevel of accurate census bound-ary definition.
This project is scheduled tobe completed by March, 1996before the actual 1996 censustaking, sometimes in August nextyear. It is expected that once theproject is completed the 1996census will be the first census inthe history of Fiji to benefit fromthis new GIS mappingtechnology.c
system and another shows the road network together withvillage names and spot heights. These transparencies havebeen scanned in Germany and the produced digital rasterdata was combined with the Forest Type / Forest FunctionLayer for printing.
The Roadnetwork of Viti Levu was scanned from the lat-est Lands Department topographical map 1:50,000. The mapedition is completed for all sheets of this island. For VanuaLevu and Kadavu transparencies of the old map sheet cover-age (DOS maps of United Kingdom) have been physicallycut and reassembled to the new map sheet coverage beforethe scanning process. This implicates that the road networkis not the up-to-date status for these maps. This also impli-cates a few small gaps between the joint transparencies anddifferent form style within one map sheet. The roadnetworkof Taveuni was mapped new from 1:25,000 aerial photogra-phy recorded 1994.
The transparency of the Riversystem was reassembled for
the islands Vanua Levu, Kadavu in the same like theroadnetwork. However, the riversystem does not change thatfast. It can be used for many years.
Change of Natural Forest CoverThe current mapping reflects the forest situation of 1991/1992. The area calculation is not finalised yet, Table 1 showsthe first area estimation of the revised Forest Type / ForestFunction maps.
Table 1. Results of the forest area calculation for the first foresttype / forest function maps. (The forest stratification was notaccepted)
dense forest medium dense forest scattered forest
308,000 420,000 97,000
Table 2. The forest area calculation of the second map edition(not finalised yet). Digits behind the point do not present theactual accuracy. The table is the output of a statistical programwhich calculates the sum for figures stored in the area data bankat MSD-Forestry. The trend is already visible: after thereclassification of forest densities more area is stratified to lessdense forest types and more non forest area is classified asscattered forest.
DF MF SF SUM
MUF 175657.61 272110.30 120405.35 568173.26
PRF 24518.99 24314.82 8705.50 57539.31
PTF 75541.62 130329.80 39408.89 245280.31
SUM 275718.22 426754.92 168519.74 870992.88
The area estimation cannot be compared directly with thelast inventory, because many parts of the west in Viti Levu aswell as Taveuni were mapped for the first time. In 1994, acomparison was carried out for those map sheets which showthe forest cover 1969 (LRD maps) and the current mapping.Considering this information 20% of the forest area mapped25 years ago has disappeared. This figure does not includeintensive logging, leaving remaining trees, tree ferns or bam-boo. This will be recognised by the satellite image analysis asforest cover. This 20% of forest area loss is covered by sugarcane area and farmland around the villages.
More than 7% of the forest area was converted into hard-wood plantation, assuming that these plantation areas areestablished on areas previously covered with natural forest.
Even with such deforestation, the total forest area did notdecrease. More than 20% of the forest area, mapped now, cov-ers parts which have been classified as “non forest” by the1969 inventory. This is not due to change in forest definition,because also other sources such as the new map series of theLands Department show “dense forest” in some of those ar-eas. There are two reasons for increase of forest in such areas.
1) The LRD maps have some inaccuracies.2) Fast growing introduced species formed forest on pas-
ture and agricultural land.
This new forest with dominance of African Tulip can be adense forest from the biological view, but these forests havevery low commercial value. However, also these forests pro-
13
tect the soil and build a forest environment which probablyallows other species being dominant at a later stage.
In summary it can be noted population pressure in ruralareas decrease the natural forest cover. Statistically the forestarea is stable because fast growing species cover areas whichwere not covered before. The total forest area is larger than25 years before, because many parts of Fiji were mapped thefirst time.
From Mapping to MonitoringThe importance of the forest cover is growing and the im-pact to the forest is increasing. This requires a permanentobservance of the forest cover. An inventory every 25 yearsis insufficient. Because of this the inventory project also es-tablished a remote sensing and GIS unit in the Forestry De-partment.
It would be too expensive to map the forest cover everyfour years by aerial photo interpretation. However, it couldbe possible to apply satellite data for this. The first repetitivesatellite data coverage is paid by German Aid and MSD-For-estry is analysing the first recently recorded satellite data.Applying simple techniques every conversion from forest tonon forest can be visualised and mapped.
First results comparing the Forest Type/Forest Functionmap with satellite data taken in 1995 covering the map sheetsSuva and Nausori show a reduction of mangrove area of ap-proximately 10%1 and a visible reduction of natural forestcover. These first figures have to be checked in the field. Fur-
n by Eberhard Kobler, Vanuatu
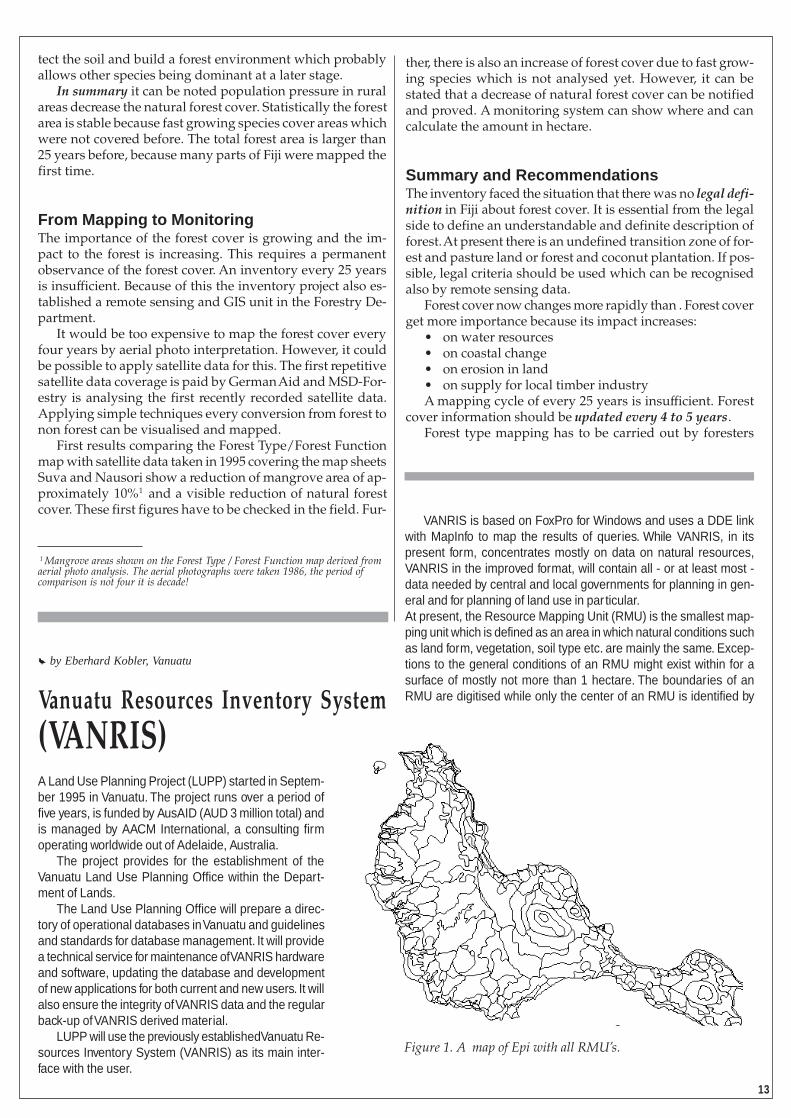
Vanuatu Resources Inventory System
(VANRIS)A Land Use Planning Project (LUPP) started in Septem-ber 1995 in Vanuatu. The project runs over a period offive years, is funded by AusAID (AUD 3 million total) andis managed by AACM International, a consulting firmoperating worldwide out of Adelaide, Australia.
The project provides for the establishment of theVanuatu Land Use Planning Office within the Depart-ment of Lands.
The Land Use Planning Office will prepare a direc-tory of operational databases in Vanuatu and guidelinesand standards for database management. It will providea technical service for maintenance of VANRIS hardwareand software, updating the database and developmentof new applications for both current and new users. It willalso ensure the integrity of VANRIS data and the regularback-up of VANRIS derived material.
LUPP will use the previously established Vanuatu Re-sources Inventory System (VANRIS) as its main inter-face with the user.
Figure 1. A map of Epi with all RMU’s.
1 Mangrove areas shown on the Forest Type / Forest Function map derived fromaerial photo analysis. The aerial photographs were taken 1986, the period ofcomparison is not four it is decade!
ther, there is also an increase of forest cover due to fast grow-ing species which is not analysed yet. However, it can bestated that a decrease of natural forest cover can be notifiedand proved. A monitoring system can show where and cancalculate the amount in hectare.
Summary and RecommendationsThe inventory faced the situation that there was no legal defi-nition in Fiji about forest cover. It is essential from the legalside to define an understandable and definite description offorest. At present there is an undefined transition zone of for-est and pasture land or forest and coconut plantation. If pos-sible, legal criteria should be used which can be recognisedalso by remote sensing data.
Forest cover now changes more rapidly than . Forest coverget more importance because its impact increases:
• on water resources• on coastal change• on erosion in land• on supply for local timber industryA mapping cycle of every 25 years is insufficient. Forest
cover information should be updated every 4 to 5 years.Forest type mapping has to be carried out by foresters
VANRIS is based on FoxPro for Windows and uses a DDE linkwith MapInfo to map the results of queries. While VANRIS, in itspresent form, concentrates mostly on data on natural resources,VANRIS in the improved format, will contain all - or at least most -data needed by central and local governments for planning in gen-eral and for planning of land use in par ticular.At present, the Resource Mapping Unit (RMU) is the smallest map-ping unit which is defined as an area in which natural conditions suchas land form, vegetation, soil type etc. are mainly the same. Excep-tions to the general conditions of an RMU might exist within for asurface of mostly not more than 1 hectare. The boundaries of anRMU are digitised while only the center of an RMU is identified by

1 414
and by foresters who are familiar with the situation in thefield. The satellite data analysis required for the Forest Type/Forest Function map was handed over to an overseas basedcompany and the communication and missing field knowl-edge caused unacceptable delays in the project. Further up-dates should be produced by foresters of Fiji’s Forestry De-partment.
The American satellite cannot download data from Fiji be-cause of technical problems. The French satellite data costsabout four times more. Fiji should arrange an agreement toshare satellite data amongst different departments. Satellitedata used for forestry could be also utilised for further landcover mapping.
A Forestry Department should be able to analyse satellitedata for forest monitoring. However, it will be impossible fora department of South Pacific Island country to keep up withthe updates of image analysis and GIS software and hard-ware. A regional organisation should get the mandate for as-sisting forestry departments in the South Pacific.
Assumed that there is a regular requirement for satellitedata, it would be advisable to have a portable ground receiv-ing station for the south pacific. Fiji or other South PacificIsland countries would not be limited to buy the French SPOTdata and could receive other data such as Landsat. Every pathof a satellite over Fiji could be used to receive and downloaddata because data recording is not limited to the onboard tapedrive.c
longitude and latitude.An RMU serves as geographical reference point for a large vari-
ety of data. There are two data groups. Data on natural resourcesand conditions and other data (socio economic etc.) that is, for con-venience, stored for the same RMU for which the boundaries aredefined by the first set of data. The first data group is about naturalconditions such as:
Land form Rock type Relief AltitudeAnnual Rainfall Cyclone Frequency Vegetation Land Use IntensityRegrowth Soil Group Stoniness DepthDrainage Reaction Salinity Base SaturationErodibility Mineral Reserves Texture etc.
The following table is an extract of the Vegetation Reference Data-base showing all types of midheight forest that VANRIS keeps trackof:
VegCode Description of Midheight Forest TypeFme Midheight forest with emergentsFmeAgCl Midheight forest with Agathis-CalophyllumFmeCl Midheight forest with CalophyllumFmeClAg Midheight forest with Calophyllum-AgathisFmKh Midheight forest with Kleinhovia hospitaFmm Midheight forest with small to medium crownsFmm1 Midheight forest with small to medium crowns; dense remnantsFmm2 Midheight forest with small to medium crowns; medium dense
remnantsFmm3 Midheight forest with small to medium crowns; sparse remnantsFmo Midheight forest with an open canopyFmo1 Midheight forest with an open canopy; dense remnantsFmo2 Midheight forest with an open canopy; medium dense remnantsFmo3 Midheight forest with an open canopy; sparse remnantsFmoCl Midheight forest, open canopy, with Calophyllum; local AgathisFmoe Midheight forest, moderately open canopy, with emergentsFms Midheight forest with small crownsFmW Midheight forest with Metrosideros-Weinmannia
The second data group associated with RMU’s, at present, is re-stricted to those data that come from the national census 1989. Thosedata are based on households. VANRIS contains for every RMU thetotal number of households and for all households within an RMUinformation about:
Total males in RMU Total Females in RMU Water Supply1
Livestock keeping/selling Copra growing/selling Cocoa growing/sellingKava growing/selling Fishing activities etc.
VANRIS, also, contains a complete database of all villages (and placeswithin villages) in Vanuatu. At present, villages and places are geo-graphically identified only by the number of RMU in which they arelocated and by the number of the Enumeration Area to which theybelong.
The new Land Use Planning Project (LUPP) will digitise both thevillage locations and the boundaries of the enumeration Areas.
In addition, all rivers and roads, hospitals and schools and otherplaces of importance will be digitised and made available throughMapInfo for mapping.
LUPP will widen the content of the second database group byincluding data from departments such as Education, Health, Geol-ogy and Mines, Agriculture, Forestry etc. and by also including infor-mation from the private or semi-private sector.
One of the main duties of the Land Use Planning Project is toestablish a mechanism which assures that VANRIS data are up-dated regularly and by local resources without foreign assistance.For that purpose, a VANRIS Users Group has been formed withmembers from almost all Government Departments and from theprivate or semi-private sector such as the Chamber of Commerceand the Vanuatu Commodities Marketing Board. The Group’s mem-bers discuss:• subjects of common concern in order to learn one from the other• standardisation of data collection and• exchange of data between the members and the VANRIS sys-
tem.The Land Use Planning Office has started to negotiate ‘Data
Transfer Agreements’ with members of the VANRIS Users Group. Inthose agreements, all details are outlined for the regular transfer ofdata from the data provider to the VANRIS system and for the distri-bution of such data through VANRIS.
For example, there will be a ‘Data Transfer Agreement’ betweenthe Department of Agriculture and the Land Use Planning Officeoutlining all details about kind and format of data from the currentSmall holders Survey that will become part of VANRIS.
As another example, negotiations have started for a similar agree-ment between the Forestry Department and the Land Use PlanningOffice with the goal to make data about logging licenses and loggingactivities available to VANRIS users.
It is hoped that the update of VANRIS data can be more or lessautomated for those data that come from operational databases ofGovernment Departments. For example, when data about schoolsand school population is kept at the Ministry of Education, a pre-arranged subset of those data can be transferred to VANRIS at agreedintervals and in the agreed format.
Except for data update coming from VANRIS users through theabove mechanisms, LUPP does not provide for an update of data inthe first data group (natural resources and conditions). This will beleft for one ore more different and additional projects.
For more information please contact Eberhard Kobler PO Box1377, Port Vila, Vanuatu, Phone (678) 25-757, Fax (678) 25-938.c
1 Individual water supply by pipe or by tank, communal tank, river, well etc.

15
n by Joe Wakolo, MSD-Forestry
Computer Assisted VisualForest Change Detection
Figure 1. Clear cut within forest areas near Wailaici river (1) (2), right the change detection file, left the satellite image map (SPOTband 1, green light). Areas with tone of grey (1) indicate loss of forest, black indicates forest or mangrove areas without change. In thesatellite image map (2) clearings are detectable by their high reflection. The white area at the bottom is a cloud.
IntroductionFiji’s natural forest have been mapped with Landsat TM datarecorded 1991/1992. Overlaying SPOT data recorded 1995on these maps, deforestation is visible1. It is necessary, now,to calculate the area which has changed to non forest. At thesame time it is essential to visualise the area of change todemonstrate to decision makers. In order to do this, simpletechniques have been chosen to map forest and non forest ofthe SPOT image, overlay this new digital map over the olddigital map and enhance areas converted to non forest. Thisresult then is interpreted together with the image to reducethe impact of image disturbance such as cloud and cloudshadow. Only the clearly visible non forest areas have beenused to update the forest cover map.
Visualisation of Forest and Non Forest in theSatellite ImageTo combine the SPOT image with digital maps, it was geo-metrically corrected and cut into map sheet size. Such a fileis called a Satellite image map.
Ratio images are enhancements resulting from the divi-sion of image picture element values in one spectral band bythe corresponding values in another band. A major advan-tage of ratio images is that they convey the spectral or colourcharacteristics of image features, regardless of variation inscene illumination conditions. Ratioed images are useful fordiscriminating unclear spectral variations in a scene that aremasked by the brightness variations in images from indi-vidual spectral bands or in standard colour composites.
The normalised difference vegetation index (NDVI) is pre-
ferred for vegetation monitoring because the NDVI helpscompensate for changing illumination conditions, surfaceslopes, aspect and other extraneous factors. In highly veg-etated scene areas, the NDVI typically ranges from 0.1 to 0.6,in proportion to the density and greenness of the plant canopy.
(SPOT band 3) - (SPOT band 2)NDVI image = --------------------------------------------
(SPOT band 3) + (SPOT band 2)
Density slicing is used to segment an input image into twoclasses; one for those pixels having values below an analystdefined grey level and one for those above this value. Theboundary of forest to non forest was determined on the ratioimage by moving the cursor from the edge of the forest to themiddle of the forest in order to get the extreme range of val-ues. It was found that the values for forest reflection rangefrom 97-125. All values between 0 and 96 which is lower thanthe forest reflection is re-coded to 10. Forest reflection whichranges from 97 - 125 is re-coded to 20. For values higher thanthe forest reflection 126 - 255 is re-coded to 30. The imageoutput can be coloured, if the value 20 get the colour greenand the values 10 and 30 the colour sand, the viewer seesforest and non forest of this normalised vegetation map.
Combining the Old Forest Map with theSatellite Image MapINDEX creates a composite GIS file by adding together theclass values of two input GIS files. The corresponding cellsfrom each file are added, and the composite output GIS filecontains the resulting sums.
Table 1. Indexing the nomalised vegetation map containing thevalues 10, 20 and 30 with the old forest map containing the values1 to 9. ( 1 = water, 2 = mangrove, 3 = non forest, 4 = hardwoodplantation, 5 = pine plantation 6 = coconut plantation, 7 = scatteredforest, 8 = medium dense forest, 9 = dense forest).
1 2 3 4 5 6 7 8 9
non forest 10 11 12 13 14 15 16 17 18 19
forest 20 21 22 23 24 25 26 27 28 29
non forest 30 31 32 33 34 35 36 37 38 391 see Wakolo, J. Visual Forest Change Detection, Newsletter 9503
1 616
FIJI User Group, GIS & Remote Sensing NewsNumber 13 (9504), December 1995
SEND TO:
The output of the index process containsthe values from 11 to 39. This can be col-oured and converted to a change detec-tion map. The values 22 and 24 to 29indicate forest in the satellite image mapwhere forest was already mapped in1992, this is coloured in pine green. Thevalues 32, 12, 34 to 39 and 14 to 19 indi-cate non forest in the satellite image mapwhere forest has been before, this is col-oured in red. The values 33 and 13 indi-cate non forest where non forest wasmapped 1992 this is coloured in sand.The value 23 indicates forest on areasmapped as non forest before. These ar-eas were not investigated yet, detailedfield checks are necessary, to investigatethe invasion of fast growing AfricanTulip and other pioneer species stock-ing on former pasture and agriculturalland.
Visual Interpretation ofchange Detection MapRatio images or the special form of nor-malised vegetation index are created byan automatic process. This has to bechecked by an interpreter knowing thesituation in the field and the character-istics of a satellite image. ERDAS Imag-ine allows an image link of the changedetection map with the satellite imagemap.
By moving the cursor along theboundary of an area indicated as defor-ested in the change detection map thecursor in the satellite image map is mov-ing correspondingly. If the indication ofdeforestation is due to cloud or cloudshadow which effects the rationingprocess, this part is converted back to
GIS values indicating “no change” (seeTable 1, values 22 and 24 to 29). Areaswhere bare soil can detected in the sat-ellite image map stay without change.This readjustment of the change detec-tion must cover the complete area andis the most time consuming process.
Update of the Old ForestCover Map and ResultsThe digital map sheets showing the for-est cover 1991/1992 were updated by aERDAS-GISMO program. The programchecks for every pixel indicating forestcover if the corresponding pixel of theinterpreted change detection file is for-est as well. If this is not the case, theprogram converts the pixel to non for-est. The created output is the forestcover 1995. At this stage the additionalforest visible in the satellite image wasnot included!
For the same map sheet e.g. sheetNausori there are two files a) showingthe forest cover of 1991/1992 and b)showing the forest cover of 1995. Thearea calculation can be compared afterprinting by the program which justcounts the number of pixels indicatingforest cover and non forest cover.
The results shows an alarming de-crease of mangrove forest which isgreater than 10% for map sheet Nausori!The period of comparison is from 1986to 1995, nevertheless the situation iscritical because mangrove forest pro-tects the coast and is an importantbiotop. The decrease mainly appearsnear villages which indicates the con-version to farmland. During formerfield visits negative impact on the man-grove due to seawalls, flood gates anddrainage was noted as well.
The loss of dense and medium denseforest seems to be high as well (>10%)within a period of only four years. How-ever, the interpretation of forest de-crease is difficult due to its scatteredappearance. This requires actual fieldverification. The forest loss occurs on thetransition zone to farming areas whereclear cuts are necessary for the exten-sion of such farms. New roads throughforests are visible as well.
There is also new forest visible onareas mapped as non forest 1991/1992.This could most probably be related tofast growing, introduced species e.g.African Tulip which stocks on formergrazing land.
RecommendationThe results have to be proven in the fieldbefore a clear statement can be given.However, a period of four to five yearsis sufficient to note differences in forestcover. It is therefore recommended tocontinue the monitoring and investigatethe causes of forest changes.c
Requests for inclusion in the mail-ing list for this newsletter as well asthe submission of articles for publi-cation should be sent to:
GIS AND REMOTE SENSING NEWSSOPAC, PRIVATE MAIL BAG, GPOSUVA, FIJI
Attention: Les AllinsonTel: 381377Fax:370040E-mail: [email protected]
or
MANAGEMENT SERVICES DIVISIONFORESTRY DEPARTMENTPO BOX 3890, SAMABULASUVA, FIJI
Attention: Wolf ForstreuterTel: 322635Fax: 320311E-mail: [email protected]
It would be appreciated if contribu-tions could be sent on floppy disk inWord for Windows (preferred),Wordperfect for Windows orWordperfect for DOS format.