News Bulletin PIC Terminal Sires - birchwoodgenetics.com Bulletin Winter 2011... · PIC Terminal...
6
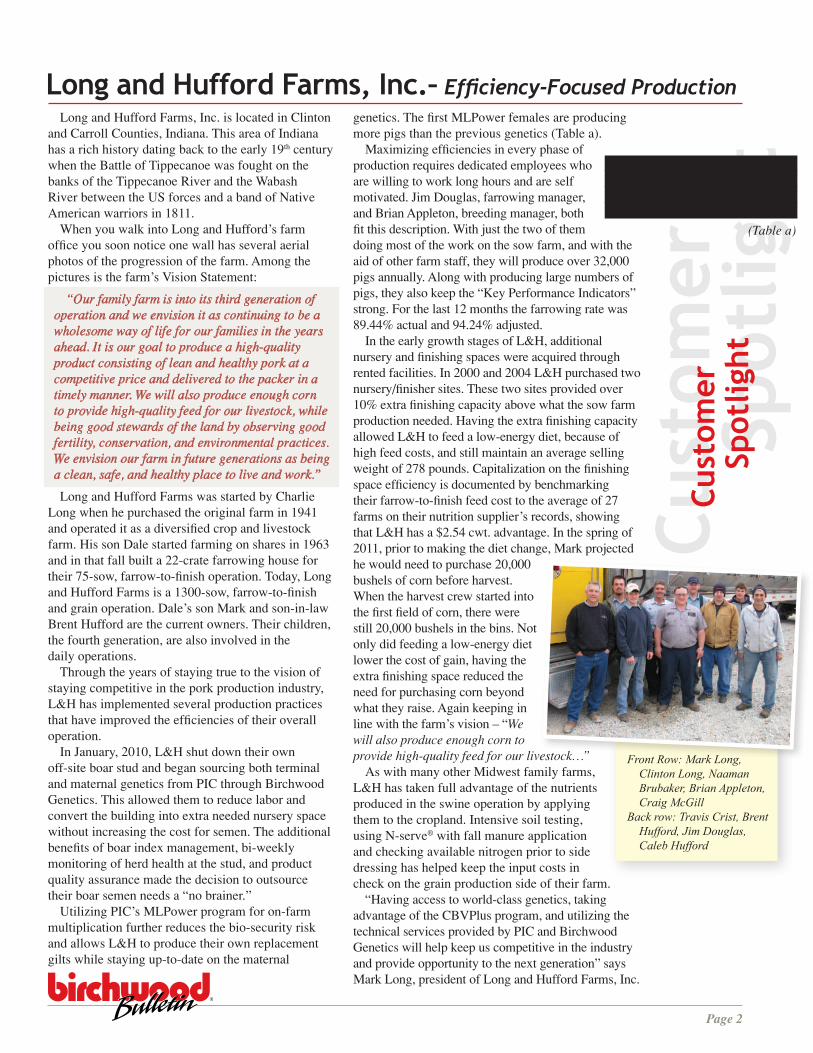
In today’s pork production industry, there are different needs at the farm level, packer level and consumer level for options in terminal sire lines. However, producers, packers and consumers around the globe have spoken and the clear choice for termi- nal sire-line genetics is PIC. Whether you have a specific need for on-farm performance traits, your packer wants certain carcass criteria, or you’re putting pork into a niche market and need specific meat- quality characteristics, Birch- wood Genetics can deliver the PIC terminal sire line to you that will meet these demands. Choices, Choices, Choices!! Currently, PIC has six terminal sire-line choices from which producers may choose. Whether you historically have challenges in the areas of mortality and morbidity, your packer has specific emphasis on backfat or percent lean, you face specific feed and/or housing costs, or just have a personal or managerial preference, PIC has a boar choice to fit your needs. PIC’s genetic services team has worked to develop lines that give producers an advantage over competitor lines, with specific emphasis on average daily gain, feed conversion and robustness, while maintaining desirable carcass traits for the packer PIC Terminal Sires – Real Choices, Real Value! PIC Sires and consumer. The line chart in Table 1 outlines the current make-up of each of the PIC terminal sires. So which line is right for your operation? The PIC 337 RG remains the gold standard among all terminal sire lines globally. With that said, it is important to understand that this line also has specific production requirements to achieve optimum results. The 337 pre- fers 8.0+ square feet (wt. over 265 lbs.), smaller micron feed size (700-800), optimal air quality and freedom from stresses such as out-of-feed events or restricted feed or water access. Given these requirements, the 337 is the industry’s leading growth rate boar with greater profit potential from increased throughput. The focus on throughput makes the 337 ideal for going to heavier weights with the same barn turnover. The newest addition to PIC’s terminal sire line team is the PIC 359. This boar is designed to provide producers with robust lean growth and excellence in percent lean. This boar is quickly becoming the industry leader for robust lean growth. This cross- bred boar has proven performance in less than desirable environments with continued high growth rates and optimal feed conversions you have come to expect from PIC terminal sires. PIC’s 280 sire line provides outstanding produc- tion durability, while leading the PIC sire line team in meat quality traits. If outstanding growth rates and robustness are what you need in your operation, while still maintaining feed efficiency and high carcass standards, the (cont. on page 5) WINTER 2011 /2012 Birchwood Genetics, Inc. PO Box 137 465 Stephens Road West Manchester, OH 45382 800-523-2536 Tel: (937) 678-9313 Fax: (937) 678-9323 Email: [email protected] © 2011 Birchwood Genetics, Inc. Table 1 PIC280 PIC380 PIC359 PIC327 PIC337 RG PIC410 L62 L65 L27 L15 Courtesy of PIC
Transcript of News Bulletin PIC Terminal Sires - birchwoodgenetics.com Bulletin Winter 2011... · PIC Terminal...
Marinated Pork RoastPrep Time: 15 Min./Cook Time: 1 Hour 45 Min.Servings: 6INGREDIENTS:1 liter ginger ale1/2 cup soy sauce1/4 cup finely chopped green pepper4 garlic cloves, minced1 tablespoon lemon juice1 tablespoon sugar1 (4 lb.) bone-in center cut pork roast1/4 cup all-purpose flour1/3 cup water
All Rights Reserved © 2011 Allrecipes.com
DIRECTIONS:1. In a large heavy-duty resealable plastic bag or shallow glass dish, combine the firstsix ingredients. Add pork roast. Seal or cover and refrigerate overnight, turning once. Place roast and marinade in a shallow roasting pan. Bake at 325 degrees F for 1 hourand 45 minutes or until a meat thermometer reads 145 degrees F - 160 degrees F. Let stand for 10 minutes.2. Meanwhile, measure 2 cups pan drippings. Skim fat; pour into a saucepan. Combine the flour and water until smooth; add to drippings. Bring to a boil; cook and stir for 2 minutes. Serve with the roast.
In today’s pork production industry, there are different needs at the farm level, packer level and consumer level for options in terminal sire lines. However, producers, packers and consumers around the globe have spoken and the clear choice for termi-nal sire-line genetics is PIC.
Whether you have a specific need for on-farm performance traits, your packer wants certain carcass criteria, or you’re putting pork into a niche market and need specific meat-quality characteristics, Birch-wood Genetics can deliver the PIC terminal sire line to you that will meet these demands.
Choices, Choices, Choices!! Currently, PIC
has six terminal sire-line choices from which producers may choose. Whether you historically have challenges in the areas of mortality and morbidity, your packer has specific emphasis on backfat or percent lean, you face specific feed and/or housing costs, or just have a personal or managerial preference, PIC has a boar choice to fit your needs.
PIC’s genetic services team has worked to develop lines that give producers an advantage over competitor lines, with specific emphasis on average daily gain, feed conversion and robustness, while maintaining desirable carcass traits for the packer
PIC Terminal Sires – Real Choices, Real Value!
PIC Sires
and consumer. The line chart in Table 1 outlines the current make-up of each of the PIC terminal sires.
So which line is right for your operation? The PIC 337 RG remains the gold standard among all terminal sire lines globally. With that said, it is important to understand that this line also has specific production requirements to achieve optimum results. The 337 pre-fers 8.0+ square feet (wt. over 265 lbs.), smaller micron feed size (700-800), optimal air quality and freedom from stresses such as out-of-feed events or restricted feed or water access. Given these requirements, the 337 is the industry’s leading growth rate boar with greater profit potential from increased throughput. The focus on throughput makes the 337 ideal for going to heavier weights with the same barn turnover.
The newest addition to PIC’s terminal sire line team is the PIC 359. This boar is designed to provide producers with robust lean growth and excellence in percent lean. This boar is quickly becoming the industry leader for robust lean growth. This cross-bred boar has proven performance in less than desirable environments with continued high growth rates and optimal feed conversions you have come to expect from PIC terminal sires.
PIC’s 280 sire line provides outstanding produc-tion durability, while leading the PIC sire line team in meat quality traits. If outstanding growth rates and robustness are what you need in your operation, while still maintaining feed efficiency and high carcass standards, the
PIC 280 line will “meat” your needs.If additional primal yield and percent lean are what you
are looking for, yet in a package that provides excellent growth rate and feed conversions, the hybrid, PIC 410 boar will work for you. The enhanced survivability and robustness traits of this boar, combined with excellent carcass yields, make it a logical choice for producers with less than ideal health or housing environments.
PIC’s 380 line was developed to provide producers with a combination of the growth, efficiency and carcass traits of the 337 and the robustness and superior meat quality of the 280. This ultimate combination can be the ideal boar for producers needing to maximize system throughput with high standards of carcass traits and meat quality.
The industry’s leading lean production boar is the PIC 327. This boar line has a 20-year running history for lowering production cost, while providing efficient, lean production with excellent growth rates, low backfat levels and high lean content to heavier weights.
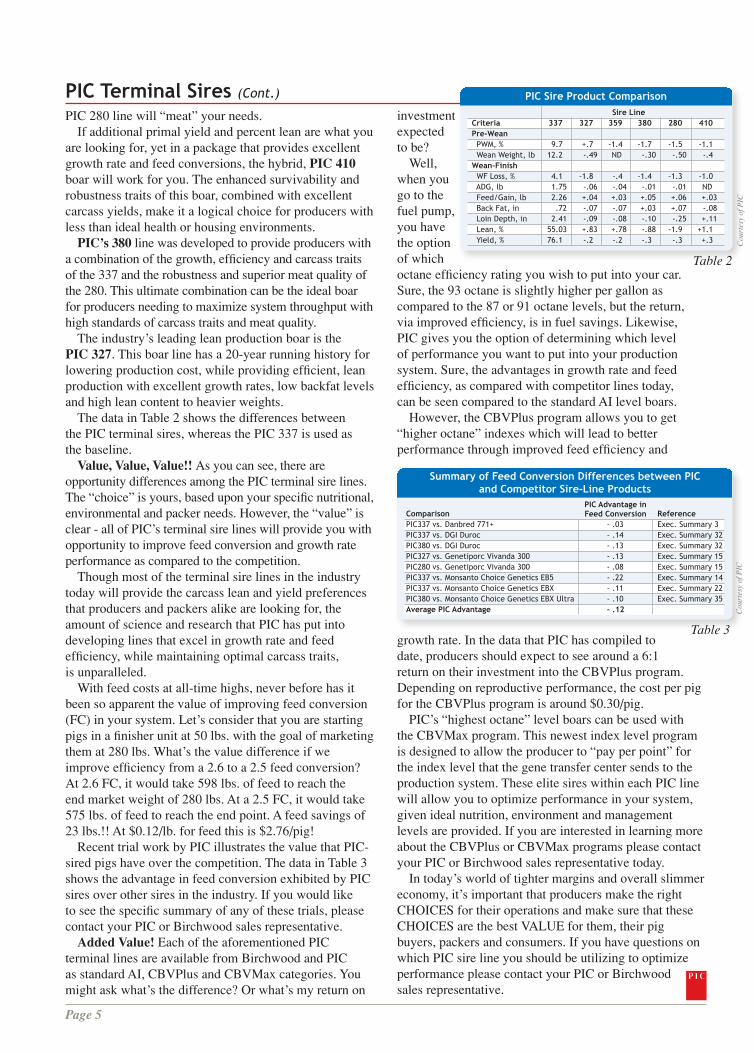
The data in Table 2 shows the differences between the PIC terminal sires, whereas the PIC 337 is used as the baseline.
Value, Value, Value!! As you can see, there are opportunity differences among the PIC terminal sire lines. The “choice” is yours, based upon your specific nutritional, environmental and packer needs. However, the “value” is clear - all of PIC’s terminal sire lines will provide you with opportunity to improve feed conversion and growth rate performance as compared to the competition.
Though most of the terminal sire lines in the industry today will provide the carcass lean and yield preferences that producers and packers alike are looking for, the amount of science and research that PIC has put into developing lines that excel in growth rate and feed efficiency, while maintaining optimal carcass traits, is unparalleled.
With feed costs at all-time highs, never before has it been so apparent the value of improving feed conversion (FC) in your system. Let’s consider that you are starting pigs in a finisher unit at 50 lbs. with the goal of marketing them at 280 lbs. What’s the value difference if we improve efficiency from a 2.6 to a 2.5 feed conversion? At 2.6 FC, it would take 598 lbs. of feed to reach the end market weight of 280 lbs. At a 2.5 FC, it would take 575 lbs. of feed to reach the end point. A feed savings of 23 lbs.!! At $0.12/lb. for feed this is $2.76/pig!
Recent trial work by PIC illustrates the value that PIC-sired pigs have over the competition. The data in Table 3 shows the advantage in feed conversion exhibited by PIC sires over other sires in the industry. If you would like to see the specific summary of any of these trials, please contact your PIC or Birchwood sales representative.
Added Value! Each of the aforementioned PIC terminal lines are available from Birchwood and PIC as standard AI, CBVPlus and CBVMax categories. You might ask what’s the difference? Or what’s my return on
investment expected to be?
Well, when you go to the fuel pump, you have the option of which octane efficiency rating you wish to put into your car. Sure, the 93 octane is slightly higher per gallon as compared to the 87 or 91 octane levels, but the return, via improved efficiency, is in fuel savings. Likewise, PIC gives you the option of determining which level of performance you want to put into your production system. Sure, the advantages in growth rate and feed efficiency, as compared with competitor lines today, can be seen compared to the standard AI level boars.
However, the CBVPlus program allows you to get “higher octane” indexes which will lead to better performance through improved feed efficiency and
growth rate. In the data that PIC has compiled to date, producers should expect to see around a 6:1 return on their investment into the CBVPlus program. Depending on reproductive performance, the cost per pig for the CBVPlus program is around $0.30/pig.
PIC’s “highest octane” level boars can be used with the CBVMax program. This newest index level program is designed to allow the producer to “pay per point” for the index level that the gene transfer center sends to the production system. These elite sires within each PIC line will allow you to optimize performance in your system, given ideal nutrition, environment and management levels are provided. If you are interested in learning more about the CBVPlus or CBVMax programs please contact your PIC or Birchwood sales representative today.
In today’s world of tighter margins and overall slimmer economy, it’s important that producers make the right CHOICES for their operations and make sure that these CHOICES are the best VALUE for them, their pig buyers, packers and consumers. If you have questions on which PIC sire line you should be utilizing to optimize performance please contact your PIC or Birchwood sales representative.
PIC Terminal Sires (Cont.)
(cont. on page 5)
News Bulletin
latest birchwood new
s……
latest birchwood new
s……
latest birchwood new
s……
latest birch-w
ood news…
…
WINTER 2011/2012
Birchwood Genetics, Inc.PO Box 137465 Stephens RoadWest Manchester, OH 45382
800-523-2536Tel: (937) 678-9313 Fax: (937) 678-9323Email: [email protected]
© 2011 Birchwood Genetics, Inc.Page 6Page 5
Winter Trade Show DatesThe Birchwood sales and technical service team will be attending many
of the state and regional pork congresses and trade shows during the winter months. Please mark your calendars to join us at the show in your area.
Kentucky Pork Producers Annual Meeting ......... Jan. 20 & 21, 2012Illinois Pork Conference................................ Jan. 31 & Feb. 1, 2012Ohio Pork Congress ....................................................... Feb. 8, 2012Keystone Pork Expo ..................................................... Feb. 21, 2012Michigan Pork Conference........................................... Feb. 23, 2012
Birchwood Online!Birchwood will soon be able to offer producers and
other industry partners the opportunity to learn more about Birchwood and our products and services, via the internet. Coming this winter, you will be able to visit us at www.birchwoodgenetics.com. The website is being designed to bring you information related to our product quality, health and delivery, along with genetic updates and information from PIC and technical service information and performance calculators for use in your enterprise.PIC introduces updated Nutrient Specifications Manual
PIC recently published an updated Nutrient Specification Manual. This publication summarizes PIC’s recommendations for nutrient specifications for both sow herd production and grow-finish production. This publication can be found on the web at www.pic.com or feel free to contact your PIC or Birchwood sales and technical service team for a copy.
Summary of Feed Conversion Differences between PIC and Competitor Sire-Line Products
PIC Advantage in Feed Conversion
PIC Sire Product Comparison Sire LineCriteria 337 327 359 380 280 410Pre-Wean PWM, % 9.7 +.7 -1.4 -1.7 -1.5 -1.1 Wean Weight, lb 12.2 -.49 ND -.30 -.50 -.4Wean-Finish WF Loss, % 4.1 -1.8 -.4 -1.4 -1.3 -1.0 ADG, lb 1.75 -.06 -.04 -.01 -.01 ND Feed/Gain, lb 2.26 +.04 +.03 +.05 +.06 +.03 Back Fat, in .72 -.07 -.07 +.03 +.07 -.08 Loin Depth, in 2.41 -.09 -.08 -.10 -.25 +.11 Lean, % 55.03 +.83 +.78 -.88 -1.9 +1.1 Yield, % 76.1 -.2 -.2 -.3 -.3 +.3
Table 2
Table 3
Table 1
PIC280PIC380 PIC359
PIC327 PIC337 RG PIC410
L62L65L27L15
Semen Homogenization
Production staff members routinely rotate doses twice per day in their storage units to keep the sperm cells suspended in the extender within the semen package. However, often times producers overlook the need to homogenize the dose just prior to breeding to re-suspend the cells within the extender. As the doses lay for ½ hour to 1 hour in the cooler used to transport the doses to the barn, the cells may begin to settle out in the package. Non-homogenization could lead to uneven sperm distribution within the package and thus, incomplete distribution into the reproductive tract. Please remind your teams to rotate the doses gently just prior to attaching the dose to the catheter.
Comparison ReferencePIC337 vs. Danbred 771+ - .03 Exec. Summary 3PIC337 vs. DGI Duroc - .14 Exec. Summary 32PIC380 vs. DGI Duroc - .13 Exec. Summary 32PIC327 vs. Genetiporc Vivanda 300 - .13 Exec. Summary 15PIC280 vs. Genetiporc Vivanda 300 - .08 Exec. Summary 15PIC337 vs. Monsanto Choice Genetics EB5 - .22 Exec. Summary 14PIC337 vs. Monsanto Choice Genetics EBX - .11 Exec. Summary 22PIC380 vs. Monsanto Choice Genetics EBX Ultra - .10 Exec. Summary 35Average PIC Advantage - .12
NEW! U.S. Department
of Agriculture guidelines:
Pork can be safely cooked to medium
rare at a final internal cooked temperature of 145 degrees F. as measured by a food
thermometer, followed by a three-minute rest
time. Ground pork, like all ground meats, should be cooked to
160 degrees F.
USD
A PO
RK P
REPA
RATI
ON
TIP
Cou
rtes
y of
PIC
Cou
rtes
y of
PIC
Courtesy of PIC
Spot
light
Cust
omer
Long and Hufford Farms, Inc.– Efficiency-Focused Production
Cust
omer
S
potl
ight
Long and Hufford Farms, Inc. is located in Clinton and Carroll Counties, Indiana. This area of Indiana has a rich history dating back to the early 19th century when the Battle of Tippecanoe was fought on the banks of the Tippecanoe River and the Wabash River between the US forces and a band of Native American warriors in 1811.
When you walk into Long and Hufford’s farm office you soon notice one wall has several aerial photos of the progression of the farm. Among the pictures is the farm’s Vision Statement:
“Our family farm is into its third generation of operation and we envision it as continuing to be a wholesome way of life for our families in the years ahead. It is our goal to produce a high-quality product consisting of lean and healthy pork at a competitive price and delivered to the packer in a timely manner. We will also produce enough corn to provide high-quality feed for our livestock, while being good stewards of the land by observing good fertility, conservation, and environmental practices. We envision our farm in future generations as being a clean, safe, and healthy place to live and work.”
Long and Hufford Farms was started by Charlie Long when he purchased the original farm in 1941 and operated it as a diversified crop and livestock farm. His son Dale started farming on shares in 1963 and in that fall built a 22-crate farrowing house for their 75-sow, farrow-to-finish operation. Today, Long and Hufford Farms is a 1300-sow, farrow-to-finish and grain operation. Dale’s son Mark and son-in-law Brent Hufford are the current owners. Their children, the fourth generation, are also involved in the daily operations.
Through the years of staying true to the vision of staying competitive in the pork production industry, L&H has implemented several production practices that have improved the efficiencies of their overall operation.
In January, 2010, L&H shut down their own off-site boar stud and began sourcing both terminal and maternal genetics from PIC through Birchwood Genetics. This allowed them to reduce labor and convert the building into extra needed nursery space without increasing the cost for semen. The additional benefits of boar index management, bi-weekly monitoring of herd health at the stud, and product quality assurance made the decision to outsource their boar semen needs a “no brainer.”
Utilizing PIC’s MLPower program for on-farm multiplication further reduces the bio-security risk and allows L&H to produce their own replacement gilts while staying up-to-date on the maternal
genetics. The first MLPower females are producing more pigs than the previous genetics (Table a).
Maximizing efficiencies in every phase of production requires dedicated employees who are willing to work long hours and are self motivated. Jim Douglas, farrowing manager, and Brian Appleton, breeding manager, both fit this description. With just the two of them doing most of the work on the sow farm, and with the aid of other farm staff, they will produce over 32,000 pigs annually. Along with producing large numbers of pigs, they also keep the “Key Performance Indicators” strong. For the last 12 months the farrowing rate was 89.44% actual and 94.24% adjusted.
In the early growth stages of L&H, additional nursery and finishing spaces were acquired through rented facilities. In 2000 and 2004 L&H purchased two nursery/finisher sites. These two sites provided over 10% extra finishing capacity above what the sow farm production needed. Having the extra finishing capacity allowed L&H to feed a low-energy diet, because of high feed costs, and still maintain an average selling weight of 278 pounds. Capitalization on the finishing space efficiency is documented by benchmarking their farrow-to-finish feed cost to the average of 27 farms on their nutrition supplier’s records, showing that L&H has a $2.54 cwt. advantage. In the spring of 2011, prior to making the diet change, Mark projected he would need to purchase 20,000 bushels of corn before harvest. When the harvest crew started into the first field of corn, there were still 20,000 bushels in the bins. Not only did feeding a low-energy diet lower the cost of gain, having the extra finishing space reduced the need for purchasing corn beyond what they raise. Again keeping in line with the farm’s vision – “We will also produce enough corn to provide high-quality feed for our livestock…”
As with many other Midwest family farms, L&H has taken full advantage of the nutrients produced in the swine operation by applying them to the cropland. Intensive soil testing, using N-serve® with fall manure application and checking available nitrogen prior to side dressing has helped keep the input costs in check on the grain production side of their farm.
“Having access to world-class genetics, taking advantage of the CBVPlus program, and utilizing the technical services provided by PIC and Birchwood Genetics will help keep us competitive in the industry and provide opportunity to the next generation” says Mark Long, president of Long and Hufford Farms, Inc.
How Does Your Farrowing Rate?The definition of Farrowing Rate is: the actual
number of sows producing a litter of piglets compared to the number of sows bred. Farrowing rate is one of the main Key Performance Indicators (KPI) used while evaluating a production system. This article will look at the impact farrowing rate has on the profitability in every sow production system and management techniques used to improve farrowing rate. As with every production-related KPI, herd health should be considered if the farrowing rate is below acceptable levels. Consult with your herd veterinarian to promote and maintain a healthy sow herd.
Increasing the farrowing rate just two percent alone will add 0.6 to the pigs/sow/year (see Table 1).
Using the calculations shown in Table 1, the assumed P/S/Y was 27.0 P/S/Y with an 88% farrowing rate. If the farm’s farrowing rate moved up
4% to 92%, this farm would produce an additional 3,077 piglets a year and the P/S/Y would be at 28.3. Valuing each weaned pig at $36.00, this production unit could realize an additional $110,772.00 a year with a minimal cost increase. Conversely, with challenges in maintaining an adequate farrow rate the lost opportunities are just as great. PIC has set a farrowing rate target at 90% and recommends adamantly pursuing ways to increase the farrowing rate when it falls below 85% (see “Gilt and Sow Management Manual”; pg. 45).
A 90% farrowing rate is achieved by minimizing impediments and maximizing the sow’s natural ability to reproduce. Juan Carlos Pinilla, DVM, said at the PIC 2011 Road Show to “Think of production in a sow unit as an assembly line.” Dr. Pinilla added: “Only breed sows that have a high probability to farrow.” This begins in the gilt developer and continues until the sow exits the production unit.
Start with a solid Heat-No-Serve (HNS) program being done seven days a week in the Gilt Developer Unit (GDU).
• Have all of the acclimatization and vaccinations completed three weeks prior to starting the HNS in the GDU.
• Use high libido, mature boars.• Begin heat checking around 24 weeks of age. • Record all gilts that express estrus. • Consider putting a button tag in the gilt’s ear,
using three different color buttons for each week of a 3-week rotation, or placing all the gilts expressing heat in a separate pen by week.
• House the boars in a separate air space away from the GDU. Or at the minimum, keep the
boars as far away as possible from the gilts that are ready for HNS.
• Allow the boar to be in the gilt pen at least one-half minute per gilt in the pen, rotating with fresh boars every hour while doing the HNS.
• Reduce non-cycling gilts by moving and mixing with other gilts.
- Consider using PG 600® on all gilts not showing signs of estrus after heat checking for four weeks.
- Increase boar exposure with this group of gilts.
Table 2 shows standard targets for a HNS program.
A successful service (defined by ≥14 total born piglets) begins during the previous gestation period. A K-State study released in 2005 shows a correlation between gestation feed intake and lactation feed intake (Table 3). In this study, when the gestation feed intake was decreased by 12.7% to 4.8 lbs. the lactation feed intake increased 20% to 13.2 lbs. Also as lactation feed intake increased the farrowing rate in subsequent parities increased around 8.5% (see Table 4).
Reproduction is a luxury and will only be optimized when maintenance requirements are met. Feed weaned sows twice a day to encourage feed intake. The target is 40 lbs. of feed intake from weaning to service. After breeding, feed up to 5 lbs./day to bring sows into body correct condition (BCS 2.5 to 3) by day-30 post breeding, and then feed 4 lbs. for maintenance thereafter. Gilts should be on full feed until bred and then fed 4 lbs./day. Increase the feed by 1 to 2 lbs. on all females (except those with a body score of ≥3.5) after 90 days of gestation to provide additional nutrition for fetal development and to minimize sow body tissue loss.
Encourage as much feed intake as possible in lactation:
• Drop the farrowing room temperature 1̊ a day, three days after the last sow farrows in the room, until the room is at 68̊ F.
• Monitor sows for constipation.
Front Row: Mark Long, Clinton Long, Naaman Brubaker, Brian Appleton, Craig McGill
Back row: Travis Crist, Brent Hufford, Jim Douglas, Caleb Hufford
Page 2 Page 4Page 3
• Make sure all sows are getting adequate water – drinkers should provide 3 quarts per minute.
• Start feeding the sow as much as she wants to eat the day after she farrows.• Feed sows three or more times a day
– not only will this encourage the sow to eat an extra couple of pounds of feed, she will also drink more water.
• Consider placing ad-lib feeders in the farrowing rooms.When the right females have been
managed correctly, getting them bred is another work station in the assembly line – not the main focal point in achieving and maintaining a 90% farrowing rate. Reviewing some basic processes at this work station with boar management and AI procedures will help realize successful services.
Properly managing the heat-check boars to maximize the female’s estrous response is a key element in AI. Have at least one mature boar (12 months old, or a Meishan-cross boar 6 to 7 months) for every 250 inventoried sows. Provide boar stimulation to the weaned sows the first day after weaning; this could be done by letting a boar run in the aisle an hour a day. Tables 5 and 6 show the impact proper
boar management makes on the intensity and duration of a sow or gilt’s estrous response.
• House the boars away from any females that will be heat checked the next day, including 21 day returns. Provide nose-to-nose contact between the boar and sow and only breed sows that are rock solid in heat.
• “Cleanliness is next to successfulness” – power wash the breeding area before bringing in the weaned sows. Keep all breeding supplies in a tote while in the barn with the catheters in a sealed bag. Wipe the vulva with a clean, disposable paper towel (single use). Discard the catheter if it comes in contact with a crate, the floor, or skin.• Catheter placement. Rotate the spiral-tipped catheter until there is resistance. Push foam-tipped catheters firmly until resistance is felt and then gently pull back. If the catheter is in proper placement there should be slight resistance.• Re-suspend the dose of semen before attaching to the catheter. This is a critical step and is often overlooked.
MLPower PreviousAveWeaned 10.12 8.84L/MF/Y 2.56 2.41P/MF/Y 25.91 21.26
(Table a)
Table 1
Table 2
Targets for a HNS program:
• Day 0 to 21 - 75% or more females
recorded with one HNS• Day 21 to 42 - 90% or more females
with one HNS• By 42 days
- all non-cycling gilts identified & marketed
Sow Inventory: 2,500 Sows Farrowing Rate No. Matings No. Farrowings 88% 7,325 6,446 90% 7,325 6,592
AdditionalFarrowings 146Ave.Weaned 10.5Additional Piglets 1,533Additional P/S/Y 0.62
LactationAD
FI,kg
May-03
Jul-03
Sep-03
Nov-03
Jan-04
Mar-04
May-04
Jul-04
Aug-04
Oct-04
Dec-04
Feb-05
Apr-05
GestationAD
FI,kgGestationintake
Lactationintake
7.0
6.5
6.0
5.5
5.0
4.5
4.0
3.5
3.0
2.8
2.6
2.4
2.2
2.0
1.8
1.6
Relationship between lactation and gestation feed intake (K-State 2005)
LactationAD
FI,kg
May-03
Jul-03
Sep-03
Nov-03
Jan-04
Mar-04
May-04
Jul-04
Aug-04
Oct-04
Dec-04
Feb-05
Apr-05
FarrowingRate
7.0
6.5
6.0
5.5
5.0
4.5
4.0
3.5
100
94
88
82
76
70
64
58
Farrowingrate
Lactationintake
Relationship between lactation feed intake and farrowing rate (K-State 2005)
Tilbrook and Hemsworth, 1990
Table 6
Housing the boar adjacent to gilts or away and the effect on estrous response• Boar housed adjacent to the gilts - 75% detected in estrus with fence-line contact - 95% detected in estrus with physical contact• Boar housed away from the gilts - 95% detected in estrus with fence-line contact - 100% detected in estrus with physical contact
Table 5
Percent of females exhibit standing heat:
• 48% withback-pressurealone;noboar• 70% back-pressureandboarvocalization• 80% back-pressureandboarodor;novocals• 97% withback-pressure,vocals,odorandvisual
Signoret, 1970
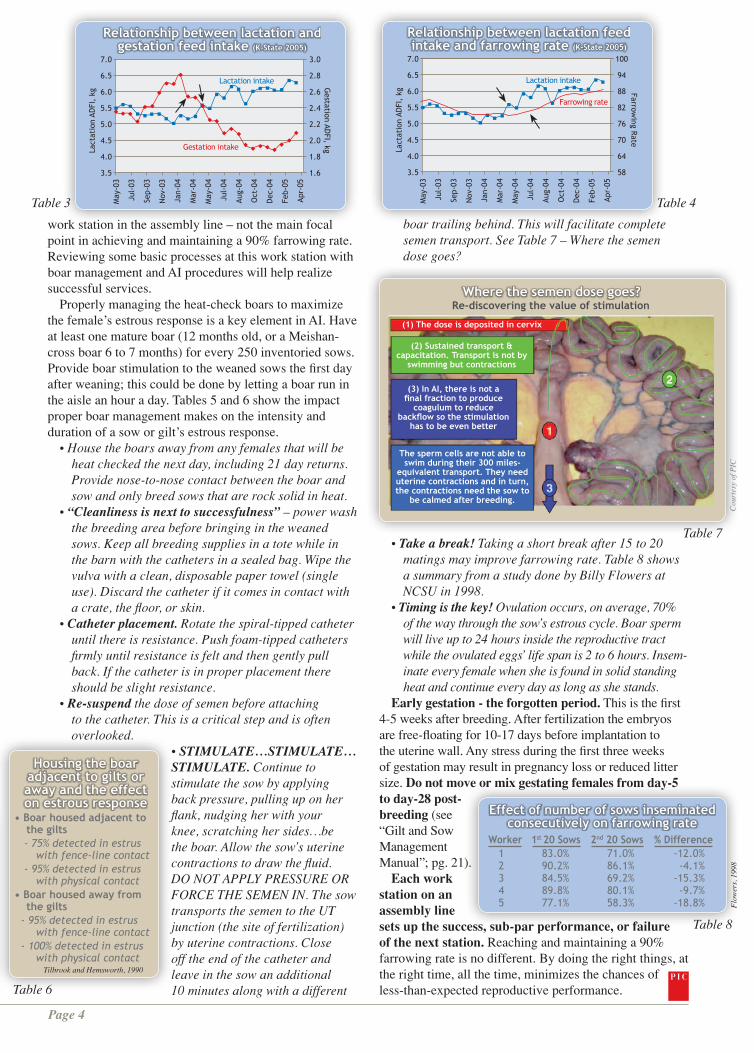
• STIMULATE…STIMULATE…STIMULATE. Continue to stimulate the sow by applying back pressure, pulling up on her flank, nudging her with your knee, scratching her sides…be the boar. Allow the sow’s uterine contractions to draw the fluid. DO NOT APPLY PRESSURE OR FORCE THE SEMEN IN. The sow transports the semen to the UT junction (the site of fertilization) by uterine contractions. Close off the end of the catheter and leave in the sow an additional 10 minutes along with a different boar trailing behind. This will facilitate complete semen transport. See Table 7 – Where the semen dose goes?
• Take a break! Taking a short break after 15 to 20 matings may improve farrowing rate. Table 8 shows a summary from a study done by Billy Flowers at NCSU in 1998.
• Timing is the key! Ovulation occurs, on average, 70% of the way through the sow’s estrous cycle. Boar sperm will live up to 24 hours inside the reproductive tract while the ovulated eggs’ life span is 2 to 6 hours. Insem-inate every female when she is found in solid standing heat and continue every day as long as she stands.
Early gestation - the forgotten period. This is the first 4-5 weeks after breeding. After fertilization the embryos are free-floating for 10-17 days before implantation to the uterine wall. Any stress during the first three weeks of gestation may result in pregnancy loss or reduced litter size. Do not move or mix gestating females from day-5 to day-28 post-breeding (see “Gilt and Sow Management Manual”; pg. 21).
Each work station on an assembly line sets up the success, sub-par performance, or failure of the next station. Reaching and maintaining a 90% farrowing rate is no different. By doing the right things, at the right time, all the time, minimizes the chances of less- than-expected reproductive performance.
Table 8
Effect of number of sows inseminated consecutively on farrowing rate
Worker 1st 20 Sows 2nd 20 Sows % Difference 1 83.0% 71.0% -12.0% 2 90.2% 86.1% -4.1% 3 84.5% 69.2% -15.3% 4 89.8% 80.1% -9.7% 5 77.1% 58.3% -18.8%
Table 7
Where the semen dose goes?Re-discovering the value of stimulation
Cou
rtes
y of
PIC
(1) The dose is deposited in cervix
(2) Sustained transport & capacitation. Transport is not by
swimming but contractions
(3) In AI, there is not a final fraction to produce
coagulum to reduce backflow so the stimulation
has to be even better
The sperm cells are not able to swim during their 300 miles-
equivalent transport. They need uterine contractions and in turn, the contractions need the sow to
be calmed after breeding.
Table 3
Table 4
Flowers, 1998
Courtesy of PIC

How Does Your Farrowing Rate?The definition of Farrowing Rate is: the actual
number of sows producing a litter of piglets compared to the number of sows bred. Farrowing rate is one of the main Key Performance Indicators (KPI) used while evaluating a production system. This article will look at the impact farrowing rate has on the profitability in every sow production system and management techniques used to improve farrowing rate. As with every production-related KPI, herd health should be considered if the farrowing rate is below acceptable levels. Consult with your herd veterinarian to promote and maintain a healthy sow herd.
Increasing the farrowing rate just two percent alone will add 0.6 to the pigs/sow/year (see Table 1).
Using the calculations shown in Table 1, the assumed P/S/Y was 27.0 P/S/Y with an 88% farrowing rate. If the farm’s farrowing rate moved up 4% to 92%, this farm would produce
an additional 3,077 piglets a year and the P/S/Y would be at 28.3. Valuing each weaned pig at $36.00, this production unit could realize an additional $110,772.00 a year with a minimal cost increase. Conversely, with challenges in maintaining an adequate farrow rate the lost opportunities are just as great. PIC has set a farrowing rate target at 90% and recommends adamantly pursuing ways to increase the farrowing rate when it falls below 85% (see “Gilt and Sow Management Manual”; pg. 45).
A 90% farrowing rate is achieved by minimizing impediments and maximizing the sow’s natural ability to reproduce. Juan Carlos Pinilla, DVM, said at the PIC 2011 Road Show to “Think of production in a sow unit as an assembly line.” Dr. Pinilla added: “Only breed sows that have a high probability to farrow.” This begins in the gilt developer and continues until the sow exits the production unit.
Start with a solid Heat-No-Serve (HNS) program being done seven days a week in the Gilt Developer Unit (GDU).
• Have all of the acclimatization and vaccinations completed three weeks prior to starting the HNS in the GDU.
• Use high libido, mature boars.• Begin heat checking around 24 weeks of age. • Record all gilts that express estrus. • Consider putting a button tag in the gilt’s ear,
using three different color buttons for each week of a 3-week rotation, or placing all the gilts expressing heat in a separate pen by week.
• House the boars in a separate air space away from the GDU. Or at the minimum, keep the boars as far away as possible from the
gilts that are ready for HNS. • Allow the boar to be in the gilt pen at least one-
half minute per gilt in the pen, rotating with fresh boars every hour while doing the HNS.
• Reduce non-cycling gilts by moving and mixing with other gilts.
- Consider using PG 600® on all gilts not showing signs of estrus after heat checking for four weeks.
- Increase boar exposure with this group of gilts.Table 2 shows standard targets for a HNS program.
A successful service (defined by ≥14 total born piglets) begins during the previous gestation period. A K-State study released in 2005 shows a correlation between gestation feed intake and lactation feed intake (Table 3). In this study, when the gestation feed intake was decreased by 12.7% to 4.8 lbs. the lactation feed intake increased 20% to 13.2 lbs. Also as lactation feed intake increased the farrowing rate in subsequent parities increased around 8.5% (see Table 4).
Reproduction is a luxury and will only be optimized when maintenance requirements are met. Feed weaned sows twice a day to encourage feed intake. The target is 40 lbs. of feed intake from weaning to service. After breeding, feed up to 5 lbs./day to bring sows into body correct condition (BCS 2.5 to 3) by day-30 post breeding, and then feed 4 lbs. for maintenance thereafter. Gilts should be on full feed until bred and then fed 4 lbs./day. Increase the feed by 1 to 2 lbs. on all females (except those with a body score of ≥3.5) after 90 days of gestation to provide additional nutrition for fetal development and to minimize sow body tissue loss.
Encourage as much feed intake as possible in lactation:
• Drop the farrowing room temperature 1̊ a day, three days after the last sow farrows in the room, until the room is at 68̊ F.
• Monitor sows for constipation.• Make sure all sows are getting adequate water –
drinkers should provide 3 quarts per minute.• Start feeding the sow as much as she wants to eat
the day after she farrows.• Feed sows three or more
times a day – not only will this encourage the sow to eat an extra couple of pounds of feed, she will also drink more water.
• Consider placing ad-lib feeders in the farrowing rooms.
When the right females have been managed correctly, getting them bred is another
Page 4Page 3
work station in the assembly line – not the main focal point in achieving and maintaining a 90% farrowing rate. Reviewing some basic processes at this work station with boar management and AI procedures will help realize successful services.
Properly managing the heat-check boars to maximize the female’s estrous response is a key element in AI. Have at least one mature boar (12 months old, or a Meishan-cross boar 6 to 7 months) for every 250 inventoried sows. Provide boar stimulation to the weaned sows the first day after weaning; this could be done by letting a boar run in the aisle an hour a day. Tables 5 and 6 show the impact proper boar management makes on the intensity and duration of a sow or gilt’s estrous response.
• House the boars away from any females that will be heat checked the next day, including 21 day returns. Provide nose-to-nose contact between the boar and sow and only breed sows that are rock solid in heat.
• “Cleanliness is next to successfulness” – power wash the breeding area before bringing in the weaned sows. Keep all breeding supplies in a tote while in the barn with the catheters in a sealed bag. Wipe the vulva with a clean, disposable paper towel (single use). Discard the catheter if it comes in contact with a crate, the floor, or skin.
• Catheter placement. Rotate the spiral-tipped catheter until there is resistance. Push foam-tipped catheters firmly until resistance is felt and then gently pull back. If the catheter is in proper placement there should be slight resistance.
• Re-suspend the dose of semen before attaching to the catheter. This is a critical step and is often overlooked.
• STIMULATE…STIMULATE…STIMULATE. Continue to stimulate the sow by applying back pressure, pulling up on her flank, nudging her with your knee, scratching her sides…be the boar. Allow the sow’s uterine contractions to draw the fluid. DO NOT APPLY PRESSURE OR FORCE THE SEMEN IN. The sow transports the semen to the UT junction (the site of fertilization) by uterine contractions. Close off the end of the catheter and leave in the sow an additional 10 minutes along with a different Table 5
Tilbrook and Hemsworth, 1990
Table 6
Table 7
Table 3 Table 4
Percent of females exhibit standing heat:
Housing the boar adjacent to gilts or away and the effect on estrous response
• Boar housed adjacent to the gilts
- 75% detected in estrus with fence-line contact
- 95% detected in estrus with physical contact
• Boar housed away from the gilts
- 95% detected in estrus with fence-line contact
- 100% detected in estrus with physical contact
• 48% with back-pressure alone; no boar
• 70% back-pressure and boar vocalization
• 80% back-pressure and boar odor; no vocals
• 97% with back-pressure, vocals, odor and visual
Signoret, 1970
Flo
wer
s, 1
998
boar trailing behind. This will facilitate complete semen transport. See Table 7 – Where the semen dose goes?
• Take a break! Taking a short break after 15 to 20 matings may improve farrowing rate. Table 8 shows a summary from a study done by Billy Flowers at NCSU in 1998.
• Timing is the key! Ovulation occurs, on average, 70% of the way through the sow’s estrous cycle. Boar sperm will live up to 24 hours inside the reproductive tract while the ovulated eggs’ life span is 2 to 6 hours. Insem-inate every female when she is found in solid standing heat and continue every day as long as she stands.
Early gestation - the forgotten period. This is the first 4-5 weeks after breeding. After fertilization the embryos are free-floating for 10-17 days before implantation to the uterine wall. Any stress during the first three weeks of gestation may result in pregnancy loss or reduced litter size. Do not move or mix gestating females from day-5 to day-28 post-breeding (see “Gilt and Sow Management Manual”; pg. 21).
Each work station on an assembly line sets up the success, sub-par performance, or failure of the next station. Reaching and maintaining a 90% farrowing rate is no different. By doing the right things, at the right time, all the time, minimizes the chances of less-than-expected reproductive performance.
Table 8
Effect of number of sows inseminated consecutively on farrowing rate
Worker 1st 20 Sows 2nd 20 Sows % Difference 1 83.0% 71.0% -12.0% 2 90.2% 86.1% -4.1% 3 84.5% 69.2% -15.3% 4 89.8% 80.1% -9.7% 5 77.1% 58.3% -18.8%
Where the semen dose goes?Re-discovering the value of stimulation
Cou
rtes
y of
PIC
(1) The dose is deposited in cervix
(2) Sustained transport & capacitation. Transport is not by
swimming but contractions
(3) In AI, there is not a final fraction to produce
coagulum to reduce backflow so the stimulation
has to be even better
The sperm cells are not able to swim during their 300 miles-
equivalent transport. They need uterine contractions and in turn, the contractions need the sow to
be calmed after breeding.
Table 1
Sow Inventory: 2,500 Sows
Table 2
Targets for a HNS program:
• Day 0 to 21 - 75% or more females
recorded with one HNS• Day 21 to 42 - 90% or more females
with one HNS• By 42 days
- all non-cycling gilts identified & marketed
Courtesy of PIC
Lact
atio
n AD
FI,
kg
May
-03
Jul-
03
Sep-
03
Nov
-03
Jan-
04
Mar
-04
May
-04
Jul-
04
Aug-
04
Oct
-04
Dec
-04
Feb-
05
Apr-
05
Gestation AD
FI, kgGestation intake
Lactation intake
7.0
6.5
6.0
5.5
5.0
4.5
4.0
3.5
3.0
2.8
2.6
2.4
2.2
2.0
1.8
1.6
Relationship between lactation and gestation feed intake (K-State 2005)
Lact
atio
n AD
FI,
kg
May
-03
Jul-
03
Sep-
03
Nov
-03
Jan-
04
Mar
-04
May
-04
Jul-
04
Aug-
04
Oct
-04
Dec
-04
Feb-
05
Apr-
05
Farrowing Rate
7.0
6.5
6.0
5.5
5.0
4.5
4.0
3.5
100
94
88
82
76
70
64
58
Farrowing rate
Lactation intake
Relationship between lactation feed intake and farrowing rate (K-State 2005)
Farrowing Rate No. Matings No. Farrowings 88% 7,325 6,446 90% 7,325 6,592
Additional Farrowings 146Ave. Weaned 10.5Additional Piglets 1,533Additional P/S/Y 0.61Sp
otlig
htCu
stom
er
Long and Hufford Farms, Inc.– Efficiency-Focused Production
Cust
omer
S
potl
ight
Long and Hufford Farms, Inc. is located in Clinton and Carroll Counties, Indiana. This area of Indiana has a rich history dating back to the early 19th century when the Battle of Tippecanoe was fought on the banks of the Tippecanoe River and the Wabash River between the US forces and a band of Native American warriors in 1811.
When you walk into Long and Hufford’s farm office you soon notice one wall has several aerial photos of the progression of the farm. Among the pictures is the farm’s Vision Statement:
“Our family farm is into its third generation of operation and we envision it as continuing to be a wholesome way of life for our families in the years ahead. It is our goal to produce a high-quality product consisting of lean and healthy pork at a competitive price and delivered to the packer in a timely manner. We will also produce enough corn to provide high-quality feed for our livestock, while being good stewards of the land by observing good fertility, conservation, and environmental practices. We envision our farm in future generations as being a clean, safe, and healthy place to live and work.”
Long and Hufford Farms was started by Charlie Long when he purchased the original farm in 1941 and operated it as a diversified crop and livestock farm. His son Dale started farming on shares in 1963 and in that fall built a 22-crate farrowing house for their 75-sow, farrow-to-finish operation. Today, Long and Hufford Farms is a 1300-sow, farrow-to-finish and grain operation. Dale’s son Mark and son-in-law Brent Hufford are the current owners. Their children, the fourth generation, are also involved in the daily operations.
Through the years of staying true to the vision of staying competitive in the pork production industry, L&H has implemented several production practices that have improved the efficiencies of their overall operation.
In January, 2010, L&H shut down their own off-site boar stud and began sourcing both terminal and maternal genetics from PIC through Birchwood Genetics. This allowed them to reduce labor and convert the building into extra needed nursery space without increasing the cost for semen. The additional benefits of boar index management, bi-weekly monitoring of herd health at the stud, and product quality assurance made the decision to outsource their boar semen needs a “no brainer.”
Utilizing PIC’s MLPower program for on-farm multiplication further reduces the bio-security risk and allows L&H to produce their own replacement gilts while staying up-to-date on the maternal
genetics. The first MLPower females are producing more pigs than the previous genetics (Table a).
Maximizing efficiencies in every phase of production requires dedicated employees who are willing to work long hours and are self motivated. Jim Douglas, farrowing manager, and Brian Appleton, breeding manager, both fit this description. With just the two of them doing most of the work on the sow farm, and with the aid of other farm staff, they will produce over 32,000 pigs annually. Along with producing large numbers of pigs, they also keep the “Key Performance Indicators” strong. For the last 12 months the farrowing rate was 89.44% actual and 94.24% adjusted.
In the early growth stages of L&H, additional nursery and finishing spaces were acquired through rented facilities. In 2000 and 2004 L&H purchased two nursery/finisher sites. These two sites provided over 10% extra finishing capacity above what the sow farm production needed. Having the extra finishing capacity allowed L&H to feed a low-energy diet, because of high feed costs, and still maintain an average selling weight of 278 pounds. Capitalization on the finishing space efficiency is documented by benchmarking their farrow-to-finish feed cost to the average of 27 farms on their nutrition supplier’s records, showing that L&H has a $2.54 cwt. advantage. In the spring of 2011, prior to making the diet change, Mark projected he would need to purchase 20,000 bushels of corn before harvest. When the harvest crew started into the first field of corn, there were still 20,000 bushels in the bins. Not only did feeding a low-energy diet lower the cost of gain, having the extra finishing space reduced the need for purchasing corn beyond what they raise. Again keeping in line with the farm’s vision – “We will also produce enough corn to provide high-quality feed for our livestock…”
As with many other Midwest family farms, L&H has taken full advantage of the nutrients produced in the swine operation by applying them to the cropland. Intensive soil testing, using N-serve® with fall manure application and checking available nitrogen prior to side dressing has helped keep the input costs in check on the grain production side of their farm.
“Having access to world-class genetics, taking advantage of the CBVPlus program, and utilizing the technical services provided by PIC and Birchwood Genetics will help keep us competitive in the industry and provide opportunity to the next generation” says Mark Long, president of Long and Hufford Farms, Inc.
Front Row: Mark Long, Clinton Long, Naaman Brubaker, Brian Appleton, Craig McGill
Back row: Travis Crist, Brent Hufford, Jim Douglas, Caleb Hufford
Page 2
MLPower PreviousAve Weaned 10.12 8.84L/MF/Y 2.56 2.41P/MF/Y 25.91 21.26
(Table a)
Marinated Pork RoastPrep Time: 15 Min./Cook Time: 1 Hour 45 Min.Servings: 6INGREDIENTS:1 liter ginger ale1/2 cup soy sauce1/4 cup finely chopped green pepper4 garlic cloves, minced1 tablespoon lemon juice1 tablespoon sugar1 (4 lb.) bone-in center cut pork roast1/4 cup all-purpose flour1/3 cup water
All Rights Reserved © 2011 Allrecipes.com
DIRECTIONS:1. In a large heavy-duty resealable plastic bag or shallow glass dish, combine the firstsix ingredients. Add pork roast. Seal or cover and refrigerate overnight, turning once. Place roast and marinade in a shallow roasting pan. Bake at 325 degrees F for 1 hourand 45 minutes or until a meat thermometer reads 145 degrees F - 160 degrees F. Let stand for 10 minutes.2. Meanwhile, measure 2 cups pan drippings. Skim fat; pour into a saucepan. Combine the flour and water until smooth; add to drippings. Bring to a boil; cook and stir for 2 minutes. Serve with the roast.
In today’s pork production industry, there are different needs at the farm level, packer level and consumer level for options in terminal sire lines. However, producers, packers and consumers around the globe have spoken and the clear choice for termi-nal sire-line genetics is PIC.
Whether you have a specific need for on-farm performance traits, your packer wants certain carcass criteria, or you’re putting pork into a niche market and need specific meat-quality characteristics, Birch-wood Genetics can deliver the PIC terminal sire line to you that will meet these demands.
Choices, Choices, Choices!! Currently, PIC
has six terminal sire-line choices from which producers may choose. Whether you historically have challenges in the areas of mortality and morbidity, your packer has specific emphasis on backfat or percent lean, you face specific feed and/or housing costs, or just have a personal or managerial preference, PIC has a boar choice to fit your needs.
PIC’s genetic services team has worked to develop lines that give producers an advantage over competitor lines, with specific emphasis on average daily gain, feed conversion and robustness, while maintaining desirable carcass traits for the packer
PIC Terminal Sires – Real Choices, Real Value!
PIC Sires
and consumer. The line chart in Table 1 outlines the current make-up of each of the PIC terminal sires.
So which line is right for your operation? The PIC 337 RG remains the gold standard among all terminal sire lines globally. With that said, it is important to understand that this line also has specific production requirements to achieve optimum results. The 337 pre-fers 8.0+ square feet (wt. over 265 lbs.), smaller micron feed size (700-800), optimal air quality and freedom from stresses such as out-of-feed events or restricted feed or water access. Given these requirements, the 337 is the industry’s leading growth rate boar with greater profit potential from increased throughput. The focus on throughput makes the 337 ideal for going to heavier weights with the same barn turnover.
The newest addition to PIC’s terminal sire line team is the PIC 359. This boar is designed to provide producers with robust lean growth and excellence in percent lean. This boar is quickly becoming the industry leader for robust lean growth. This cross-bred boar has proven performance in less than desirable environments with continued high growth rates and optimal feed conversions you have come to expect from PIC terminal sires.
PIC’s 280 sire line provides outstanding produc-tion durability, while leading the PIC sire line team in meat quality traits. If outstanding growth rates and robustness are what you need in your operation, while still maintaining feed efficiency and high carcass standards, the
PIC 280 line will “meat” your needs.If additional primal yield and percent lean are what you
are looking for, yet in a package that provides excellent growth rate and feed conversions, the hybrid, PIC 410 boar will work for you. The enhanced survivability and robustness traits of this boar, combined with excellent carcass yields, make it a logical choice for producers with less than ideal health or housing environments.
PIC’s 380 line was developed to provide producers with a combination of the growth, efficiency and carcass traits of the 337 and the robustness and superior meat quality of the 280. This ultimate combination can be the ideal boar for producers needing to maximize system throughput with high standards of carcass traits and meat quality.
The industry’s leading lean production boar is the PIC 327. This boar line has a 20-year running history for lowering production cost, while providing efficient, lean production with excellent growth rates, low backfat levels and high lean content to heavier weights.
The data in Table 2 shows the differences between the PIC terminal sires, whereas the PIC 337 is used as the baseline.
Value, Value, Value!! As you can see, there are opportunity differences among the PIC terminal sire lines. The “choice” is yours, based upon your specific nutritional, environmental and packer needs. However, the “value” is clear - all of PIC’s terminal sire lines will provide you with opportunity to improve feed conversion and growth rate performance as compared to the competition.
Though most of the terminal sire lines in the industry today will provide the carcass lean and yield preferences that producers and packers alike are looking for, the amount of science and research that PIC has put into developing lines that excel in growth rate and feed efficiency, while maintaining optimal carcass traits, is unparalleled.
With feed costs at all-time highs, never before has it been so apparent the value of improving feed conversion (FC) in your system. Let’s consider that you are starting pigs in a finisher unit at 50 lbs. with the goal of marketing them at 280 lbs. What’s the value difference if we improve efficiency from a 2.6 to a 2.5 feed conversion? At 2.6 FC, it would take 598 lbs. of feed to reach the end market weight of 280 lbs. At a 2.5 FC, it would take 575 lbs. of feed to reach the end point. A feed savings of 23 lbs.!! At $0.12/lb. for feed this is $2.76/pig!
Recent trial work by PIC illustrates the value that PIC-sired pigs have over the competition. The data in Table 3 shows the advantage in feed conversion exhibited by PIC sires over other sires in the industry. If you would like to see the specific summary of any of these trials, please contact your PIC or Birchwood sales representative.
Added Value! Each of the aforementioned PIC terminal lines are available from Birchwood and PIC as standard AI, CBVPlus and CBVMax categories. You might ask what’s the difference? Or what’s my return on
investment expected to be?
Well, when you go to the fuel pump, you have the option of which octane efficiency rating you wish to put into your car. Sure, the 93 octane is slightly higher per gallon as compared to the 87 or 91 octane levels, but the return, via improved efficiency, is in fuel savings. Likewise, PIC gives you the option of determining which level of performance you want to put into your production system. Sure, the advantages in growth rate and feed efficiency, as compared with competitor lines today, can be seen compared to the standard AI level boars.
However, the CBVPlus program allows you to get “higher octane” indexes which will lead to better performance through improved feed efficiency and
growth rate. In the data that PIC has compiled to date, producers should expect to see around a 6:1 return on their investment into the CBVPlus program. Depending on reproductive performance, the cost per pig for the CBVPlus program is around $0.30/pig.
PIC’s “highest octane” level boars can be used with the CBVMax program. This newest index level program is designed to allow the producer to “pay per point” for the index level that the gene transfer center sends to the production system. These elite sires within each PIC line will allow you to optimize performance in your system, given ideal nutrition, environment and management levels are provided. If you are interested in learning more about the CBVPlus or CBVMax programs please contact your PIC or Birchwood sales representative today.
In today’s world of tighter margins and overall slimmer economy, it’s important that producers make the right CHOICES for their operations and make sure that these CHOICES are the best VALUE for them, their pig buyers, packers and consumers. If you have questions on which PIC sire line you should be utilizing to optimize performance please contact your PIC or Birchwood sales representative.
PIC Terminal Sires (Cont.)
(cont. on page 5)
News Bulletin
latest birchwood new
s……
latest birchwood new
s……
latest birchwood new
s……
latest birch-w
ood news…
…
WINTER 2011/2012
Birchwood Genetics, Inc.PO Box 137465 Stephens RoadWest Manchester, OH 45382
800-523-2536Tel: (937) 678-9313 Fax: (937) 678-9323Email: [email protected]
© 2011 Birchwood Genetics, Inc.Page 6Page 5
Winter Trade Show DatesThe Birchwood sales and technical service team will be attending many
of the state and regional pork congresses and trade shows during the winter months. Please mark your calendars to join us at the show in your area.
Kentucky Pork Producers Annual Meeting ......... Jan. 20 & 21, 2012Illinois Pork Conference................................ Jan. 31 & Feb. 1, 2012Ohio Pork Congress ....................................................... Feb. 8, 2012Keystone Pork Expo ..................................................... Feb. 21, 2012Michigan Pork Conference........................................... Feb. 23, 2012
Birchwood Online!Birchwood will soon be able to offer producers and
other industry partners the opportunity to learn more about Birchwood and our products and services, via the internet. Coming this winter, you will be able to visit us at www.birchwoodgenetics.com. The website is being designed to bring you information related to our product quality, health and delivery, along with genetic updates and information from PIC and technical service information and performance calculators for use in your enterprise.PIC introduces updated Nutrient Specifications Manual
PIC recently published an updated Nutrient Specification Manual. This publication summarizes PIC’s recommendations for nutrient specifications for both sow herd production and grow-finish production. This publication can be found on the web at www.pic.com or feel free to contact your PIC or Birchwood sales and technical service team for a copy.
Summary of Feed Conversion Differences between PIC and Competitor Sire-Line Products
PIC Advantage in Feed Conversion
PIC Sire Product Comparison Sire LineCriteria 337 327 359 380 280 410Pre-Wean PWM, % 9.7 +.7 -1.4 -1.7 -1.5 -1.1 Wean Weight, lb 12.2 -.49 ND -.30 -.50 -.4Wean-Finish WF Loss, % 4.1 -1.8 -.4 -1.4 -1.3 -1.0 ADG, lb 1.75 -.06 -.04 -.01 -.01 ND Feed/Gain, lb 2.26 +.04 +.03 +.05 +.06 +.03 Back Fat, in .72 -.07 -.07 +.03 +.07 -.08 Loin Depth, in 2.41 -.09 -.08 -.10 -.25 +.11 Lean, % 55.03 +.83 +.78 -.88 -1.9 +1.1 Yield, % 76.1 -.2 -.2 -.3 -.3 +.3
Table 2
Table 3
Table 1
PIC280PIC380 PIC359
PIC327 PIC337 RG PIC410
L62L65L27L15
Semen Homogenization
Production staff members routinely rotate doses twice per day in their storage units to keep the sperm cells suspended in the extender within the semen package. However, often times producers overlook the need to homogenize the dose just prior to breeding to re-suspend the cells within the extender. As the doses lay for ½ hour to 1 hour in the cooler used to transport the doses to the barn, the cells may begin to settle out in the package. Non-homogenization could lead to uneven sperm distribution within the package and thus, incomplete distribution into the reproductive tract. Please remind your teams to rotate the doses gently just prior to attaching the dose to the catheter.
Comparison ReferencePIC337 vs. Danbred 771+ - .03 Exec. Summary 3PIC337 vs. DGI Duroc - .14 Exec. Summary 32PIC380 vs. DGI Duroc - .13 Exec. Summary 32PIC327 vs. Genetiporc Vivanda 300 - .13 Exec. Summary 15PIC280 vs. Genetiporc Vivanda 300 - .08 Exec. Summary 15PIC337 vs. Monsanto Choice Genetics EB5 - .22 Exec. Summary 14PIC337 vs. Monsanto Choice Genetics EBX - .11 Exec. Summary 22PIC380 vs. Monsanto Choice Genetics EBX Ultra - .10 Exec. Summary 35Average PIC Advantage - .12
NEW! U.S. Department
of Agriculture guidelines:
Pork can be safely cooked to medium
rare at a final internal cooked temperature of 145 degrees F. as measured by a food
thermometer, followed by a three-minute rest
time. Ground pork, like all ground meats, should be cooked to
160 degrees F.
USD
A PO
RK P
REPA
RATI
ON
TIP
Cou
rtes
y of
PIC
Cou
rtes
y of
PIC
Courtesy of PIC
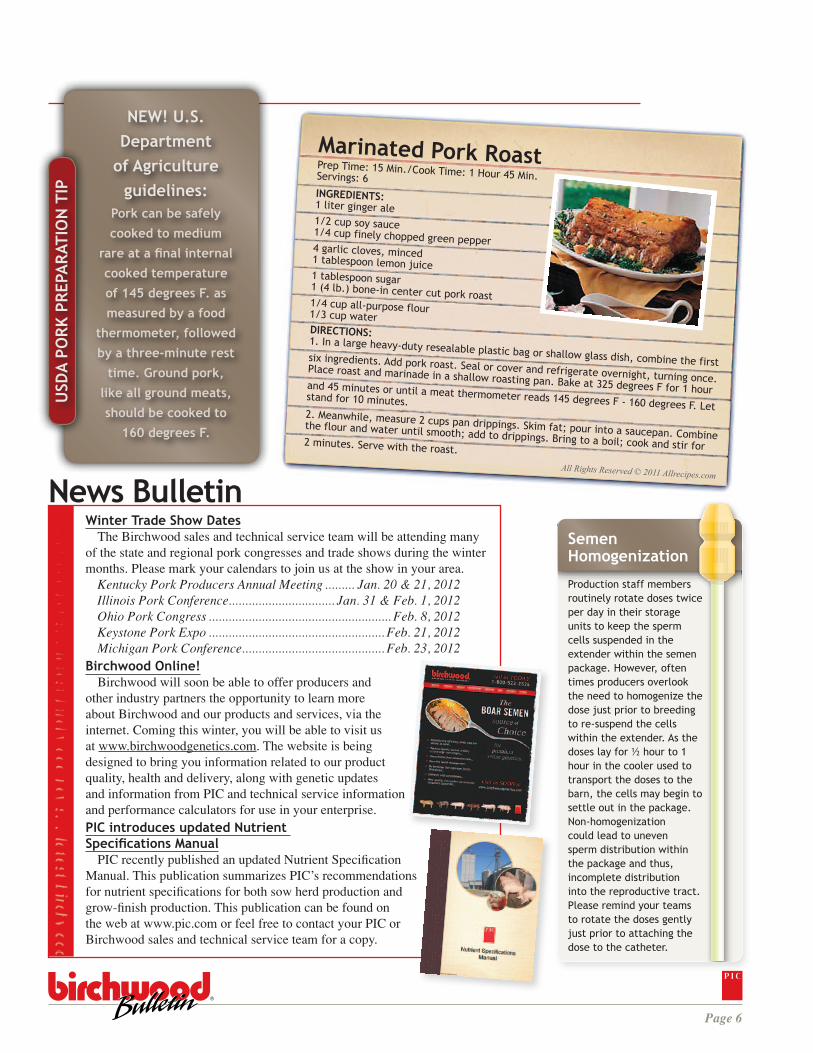