NEWS 02.2011 GB - shimadzu.eu · Shimadzu’s UV-VIS-NIR UV-3600 spectrophotometer is particularly...
28
NEWS 2/2011 NEWS Multi-purpose tools: New spectrophoto- meter series New Front End system: Nexera MP – More than a new record Capability redefined – New generation of the most powerful multimode inlet – OPTIC-4 Happy Birthday: 55 years of FTIR spectroscopy
Transcript of NEWS 02.2011 GB - shimadzu.eu · Shimadzu’s UV-VIS-NIR UV-3600 spectrophotometer is particularly...

NEWS
2/2011
NEWS
Multi-purpose tools:New spectrophoto-meter series
New Front End system:Nexera MP – More than a new record
Capability redefined – New generation of themost powerful multimodeinlet – OPTIC-4
Happy Birthday:55 years of FTIRspectroscopy

If one drop of water repre-sents an entire river, then onehandful of soil represents a
whole area. The small representsthe large and is reflected therein.This is how the world works, oureconomies, science and individualcountries. The small representsthe large, the random sample theentirety, politicians represent thepeople, a trickle of sand an entirebuilding site.
Representation also plays a majorrole in X-ray fluorescence. Ob-taining reproducible results isoften a question of proper sam-pling and sample preparation. In this example, a building sitemeasuring 30 m x 30 m is exam-ined for contamination byheavy metals.
Representative soil samples – X-ray fluorescence detects contamination »2
Mineral water in a different light – Quality control using UV spectroscopy »4
Plastics analysis in practice – Untreated and recycled polymers compared »6
Shake well before use – Laser diffraction and ICP-OES spectrometry »8
Digital Image Correlation (DIC) helps the aircraft industry – HPV-2 high-speed camera »10
How salt load doesn’t become a heavy load – TOC determination in highly polluted samples »12
From drinking water to ultrapure water – TOC in purified drinking water »14
Rapunzel, let your hair down – Tensile tests on human hair »16
Multi-purpose tools – New spectro-photometer series »15
Performance redefined – New generation of the most powerful multimode inlet – OPTIC-4 »18
More than a new record – New Front End system – Nexera MP »20
Anniversary package for FTIR’s birthday – 55 years of FTIR spectroscopy »28
Powerful together – Particle size anal-ysis for the determination of the separation efficiency of an HPLC column »17
Dioxin and PCB monitoring in animal feed – Single Quad GC/MS »21
A strong team – EmpowerTM meets GC-2010 Plus »24
24-hour support for TOC-L instruments – Tips and tricks for the TOC-L – ‘TOC-L Virtual Advisor’ on the internet »26
APPLICATION
TELEGRAM
New Generation –UV-2600 & -2700
APPLICATION Shimadzu News 2/2011
2
READ FOR YOU
SOFTWARE
TIPS & TRICKS
PRODUCTS
RepresentativePractical measuring tips – X-ray flu
The task is perfectly suited forthe EDX-720, Shimadzu’s stan-dard X-ray fluorescence instru-ment.
The first challenge is to obtain arepresentative sample. Testing forcontamination up to a depth ofone meter, for example, the testvolume comprises 900 m3 (30 m x30 m x 1 m), but the sample vol-ume for a single EDX measure-ment is about 1 cm3. Rounded offto 1,000 m3, only one billionth of the actual volume can be meas-ured.
EDX-720
Shimadzu NEWS, Customer Magazine of Shimadzu Europa GmbH, Duisburg
Publisher:Shimadzu Europa GmbHAlbert-Hahn-Str. 6 -10 · D - 47269 DuisburgPhone: +49 - 203 - 76 87- 0 Telefax: +49 - 203 - 76 66 [email protected]
Editorial Team:Uta Steeger · Phone: +49 - 203 - 76 87- 410 Ralf Weber, Tobias Ohme
Design and Production:m/e brand communication GmbH GWADüsseldorf
Circulation:German: 7,333 · English: 22,790
©Copyright:Shimadzu Europa GmbH, Duisburg, GermanySeptember 2011
Windows is a trademark of Microsoft Corporation. ©2011 Apple Inc. All rights reserved. Apple, the Apple logo, Mac, Mac OS andMacintosh are trademarks of Apple Inc.
IMPRINT

occurs especially when the sam-ple in the sample cell is shaken.
As measurement and detectiontake place “from below”, compo-nents present near the bottom ininhomogeneous samples will beover-represented while compo-nents near the top are under-represented. It is therefore veryhelpful to grind the entire sample
Sampling distribution
The contamination of the build-ing site can be better mappedwhen, based on a predeterminedraster, multiple samples areobtained over the entire area atevenly distributed locations. It ishelpful to include conditionssuch as similar or dissimilar soillayers in the sampling process, tocreate a good map of the contam-ination.
After obtaining the samples, thesoil material is placed into anopen-ended sample cell of whichthe bottom is sealed with a thin(Mylar) foil. Mylar is highlytransparent to X-ray radiation.The sample cell is placed in theEDX-720. During measurement,the sample is irradiated “frombelow” with X-rays. The samplesubsequently emits X-ray fluo-rescence radiation that can berecorded via a detector. X-raytube and detector are located inthe EDX-720 underneath thesample.
Homogenizing the samples
The closer an element in the vialis to the detector, the
more likely that fluorescenceradiation will hit the detector.When a small amount of soilmaterial is dispensed into thesample cell, smaller and heaviercomponents are primarily presentclose to the bottom end of thecell, whereas larger and lightercomponents will, in principle, belocated near the top. This effect
3
APPLICATIONShimadzu News 2/2011
soil samplesorescence detects contamination
Figure 1: EDX inhomogeneous sample Figure 2: EDX homogeneous sample
into a powder of homogenoussize distribution. Preparing sam-ples in this way will yield useableresults.
A qualitatively more sophisticat-ed sample preparation is thepreparation of a vitreous meltconsisting of dilithium tetrabo-rate (Li2B4O7) and the pulverizedsample.

APPLICATION Shimadzu News 2/2011
4
Mineral water in a diffe
With 130 liters consump-tion per capita and peryear in Germany, they
are an important food source inour daily nutritional intake, sup-plying important minerals andtrace elements, both sparklingand still – mineral waters. Theirlabels are their trademarks andbusiness cards as they containspecific information on the con-tents. These labels testify to thequality of the mineral waterspring where the water comesfrom. Interestingly, the labels donot mention the actual test dateof the water, as the informationcannot be printed fast enough onthe labels. When checking theimprints on the bottles, one findsa date that differs by severalmonths from the mineral analysisof the well itself.
Drinking water is one of themost tested food sources. It issubject to continuous monitoringaccording to national and Euro-pean drinking water ordinances.Monitoring includes, among oth-ers, the analysis of minerals andtrace elements. These analyses are
usually carried out using atomicabsorption spectroscopy or ICP-OES methods. The total organiccarbon content is determinedusing TOC methods; nitrate andnitrite content can be determinedusing UV spectroscopy. Manyfoods are also characterized usingNIR spectroscopy, a measuringtechnique that is not quite assuitable for the identification ofmineral water.
UV spectroscopy also for the identification ofspring waters
The following application showsthat UV spectroscopy is suitablenot only for the determination ofelements and their salts, but alsofor straightforward identificationof spring waters. Waters fromvarious sources exhibit differ-ences and these differences can berevealed using absorption spec-troscopy and UV spectra, as wellas NIR measurements. As miner-al waters are all transparent in thevisible range, special attentionwas focused on the ultravioletand near-infrared ranges.
Quality control using UV spectroscopy
0.0
0.5
1.0
1.5
1.8
190.0 200.0 220.0 240.0 250.0 nm
Ab
s
Figure 1: Ultraviolet spectra of four different still mineral waters

5
APPLICATIONShimadzu News 2/2011
Sample (theoretical) A Water (%) B Water (%) C Water (%)
104020
C Water (%)9.72
39.9219.91
123
Sample (calculated)123
103020
A Water (%)10.3630.1220.41
803060
B Water (%)79.9029.9659.68
Standard A Water (%) B Water (%) C Water (%)
12345
205030
050
30205050
0
5030205050
rent light
Analysis in the ultra-violet range
Spectra of four store-bought stillmineral waters were measured inthe ultraviolet range of 190 - 250nm using Shimadzu’s UV-3600spectrophotometer. The result isshown in figure 1. A 10 mm thickquartz cuvette was used for themeasurements, and deionizedwater was used and measured asreference sample. When compar-ing the spectra, one can see aclear difference between thecurves, which can be attributed tothe individual characteristics ofthe mineral waters.
Water in the near infrared range
In the infrared range of 100 -1800 nm using a layer thicknessof 2 mm, the same waters did notexhibit any individual character-istics for the water absorptionsignal at 1440 nm (Figure 2). Thisis due to the strong absorptionby water in the NIR range, as canbe seen in figure 2. This value lies within the linear measuring
Table 1: Mixing ratios for measurements using the UV-3600 of three different still
mineral waters (see Figure 3).
Table 2: The result of a model calculation with respect to four analytical wavelengths
and three samples
0.0
1.0
2.0
3.0
3.3
1000.0 1200.0 1400.0 1600.0 1800.0nm
Ab
s
Figure 2: Near-infrared spectra of 4 still mineral waters, measured using a 2 mm
thick cuvette
0.0
0.5
1.0
1.5
1.7
190.0 200.0 220.0 240.0 250.0 nm
Ab
s
Figure 3: Five UV absorption spectra of mixtures of three mineral waters.
The different mixing ratios are listed in Table 1; red = standard 1, blue = standard 2,
black = standard 3, green = standard 4, brown = standard 5
range of the instrument. The dif-ferences among the water samplescannot be determined using NIR,as the NIR range is representedby -CH, -OH and -NH vibra-tions. Minerals are inorganic innature.
Multiple linear regression
To verify the assumption that theultraviolet range reveals differ-ences, multiple linear regressionwas carried out at four analyticalwavelengths in the UV range.The wavelengths 200, 205, 210and 215 were selected and a cali-bration was carried out. Calibra-tion standards were prepared bymixing 3 mineral waters (Tab. 1).Figure 3 shows five UV spectraof these standards.
The result from this straightfor-ward multiple-component analy-sis model (Table 2) shows that themineral waters are distinguish-able. It should be noted that mul-tiple-component analysis can alsobe applied in the UV spectros-copy range of 190 to 250 nm.
This evidently requires an instru-ment technology which stilldelivers reliable results in thisrange. Shimadzu’s UV-VIS-NIRUV-3600 spectrophotometer isparticularly suitable for thesetypes of analysis.
We will gladly send you additional
information. Please enter the cor-
responding number on the reply
card or order via Shimadzu’s News
App or News WebApp. Info 396

APPLICATION Shimadzu News 2/2011
6
Plastics analysis in pracFTIR measuring technology – untreated and recycled
Raw materials are becom-ing increasingly scarceand more expensive. In its
IP/11/122 press release entitled“The Commission calls for actionon commodities and raw materi-als”, the EU Commission notonly discussed the supply of rawmaterials but also specificallymentioned resource efficiency inorder to promote recycling.
Recycling of polymers is animportant environmental issue.But this is a difficult road to trav-el, as new legislation specifiesclear threshold values (RoHS*),thereby limiting recyclingoptions. Regranulates designatedfor subsequent processing mustbe tested according to these regu-lations.
Fast analysis of recycled poly-mers is an advantage for incom-ing goods inspection. In theshortest possible time, the basicpolymer as well as problems canbe identified. The increasing
interest in recycling of materialsis of course related to costs. Nat-ural resources can be saved whenrecycling-based materials areused instead.
In comparison: untreated and recycled polymers
What happens during the recy-cling process? Polymers such asABS are mixed from varioussources and returned to the mar-ket as pure-grade material. Thesematerials are, for instance, avail-able as granules and are termed asregranulates. Quality assuranceshould highlight the differencesbetween such mixtures. The pres-ent application compares anuntreated polymer with a treatedone, using an example of pureand recycled ABS.
ABS, a terpolymer, is often usedin the automotive industry as amaterial for casings for lightsources, cooler grilles or hubcaps.The advantage of this material isthat it can easily be galvanized.Since years, mirrors and reflec-tors have no longer been manu-factured from metal.
The terpolymer ABS consists ofacryl nitrile, 1,3-butadiene and
Figure 1: Infrared spectrum of pure ABS, measured using a diamond-based single-reflectance unit
IRAffinity -1
-0.005
4600
1/cmABS, DuraSamplIR
Ab
s.
4400 4200 4000 3800 3600 3400 3200 3000 2800 2600 2400 2200 2000 1900 1800 1700 1600 1500 1400 1300 1200 1100 1000 900 800 700 600 500
00.005
0.010.015
0.020.025
0.030.035
0.040.045
0.050.055
0.060.065
0.070.075
0.080.085
0.090.095
0.10.105
0.110.115
0.120.125
0.130.135
0.140.145
0.150.155
0.160.165
0.170.175
0.180.185
0.190.195
0.20.205

7
APPLICATIONShimadzu News 2/2011
ticepolymers compared
Figure 2: Infrared spectra of two ABS polymers. The black spectrum represents untreated ABS; the red spectrum recycled ABS
-0.015
4600
1/cmABS, DuraSamplIR
Ab
s.
4400 4200 4000 3800 3600 3400 3200 3000 2800 2600 2400 2200 2000 1900 1800 1700 1600 1500 1400 1300 1200 1100 1000 900 800 700 600 500
00.015
0.030.045
0.060.075
0.090.105
0.120.135
0.150.165
0.180.195
0.210.225
0.240.255
0.270.285
0.30.315
0.330.345
0.360.375
0.390.405
0.420.435
0.450.465
0.480.495
0.510.525
0.540.555
0.570.585styrene. FTIR spectrometry com-
bined with single-reflectancemeasurements offers a fast, reli-able and non-destructive analysisof this material. In the presentexample, a diamond-based ATRaccessory was used for single-reflectance. The polymer sample,in the form of a granulate, waspressed with reproducible pres-sure onto the measuring window.Single-reflectance from the IR-beam was already sufficient toobtain a result.
A look at the spectra
To interpret the ABS spectrum,the spectra of three individualpolymers can be used to revealdifferences. The acryl nitrilespectrum, for instance, exhibits acharacteristic band at 2237 cm-1
(nitrile band).
The ABS spectrum exhibits alltypical characteristics of styrene,acryl nitrile and butadiene. At975 cm-1, the spectrum features apeak which can be attributed tothe butadiene group. The basicstructure of the spectrum can betraced to styrene and the nitrilebands are exhibited at 2237 cm-1.
The ABS-typical spectrum isshown in figure 1.
In the spectrum of recycled ABSthe following structures could beidentified: polybromated di-phenyl ether at 1725 cm-1, bromi-nated flame retardant, polycar-bonate with its typical triplebands at 1200 cm-1, 1,3-butadieneat 975 cm-1 and the nitrile struc-ture of acryl nitrile at 2237 cm-1.
The spectrum of the recycledpolymer exhibits the pattern of amixed spectrum: it is not pure.However, this is not necessarily adisadvantage. In the present
example, the polymer was anadmixture with polycarbonate(PC), used to harden polymers.Each of the functional groupsinfluences the physics of thepolymer and this is specificallyused in the manufacturing ofcomponent parts. Additional dis-tinctive features in the spectrumstill need to be clarified. Thisrequires further analysis stepsusing pyrolysis-GCMS and ele-ment analysis using EDX, AASor ICP as already reported in theShimadzu News and variousapplication notes.
*RoHS: Recycling of HazardousSubstances
Literature:
1. “The Commission calls for
action on commodities and
raw materials”, IP/11/122,
Brussels, 2 February 2011
2. “Directive on the restriction
of the use of certain hazardous
substances in electrical and
electronic equipment”, RoHS
2008/385/EC
3. Shimadzu News 2005 and
2006, www.shimadzu.eu,
Application Information
Albert van Oyen of CARAT GmbH in
Bocholt, Germany is gratefully
acknowledged for his kind support
of this topic.
Instruments used:
• Instrument: Shimadzu IRAffinity-1
FTIR spectrophotometer
• Single-reflectance unit:
DuraSamplIR
• Library: Shimadzu RoHS,
Polymer
We will gladly send you additional
information. Please enter the cor-
responding number on the reply
card or order via Shimadzu’s News
App or News WebApp. Info 397

APPLICATION Shimadzu News 2/2011
8
Shake well before useLaser diffraction and ICP-OES spectrometry – charac quantification of TiO2 nanoparticles in sunscreen
Nowadays, nanotechnolo-gy is present in our dai-ly life and nano particles
are commonly used in manyapplications such as nanotubesfor textiles, nanotechnology forfood products, and cosmeticssuch as sunscreens and otherbodycare products includingshower gels and toothpastes.
The Scientific Committee onEmerging and Newly IdentifiedHealth Risks (SCENIHR) wasestablished by the EuropeanCommission in 2004 to promotescientific advice on the safety ofnew technologies such as nano-technology and nanoparticles [1].
What is a nano particle?
A material is called a nano-objectwhen one, two or three externaldimensions are present in nano-scale, so a nanoparticle is anobject with all three dimensionsin nanoscale. These definitionswere developed in 2008 by theTechnical Committee ISO/TC229 “Nanotechnologies” in col-laboration with the TechnicalCommittee CEN/TC 352 “Nan-otechnologies” [2].
Nanoparticles can be of differentchemical natures. Both inorganicand organic nanoparticles are
known. They can consist of justone element such as metal or car-bon, or of compounds likeoxides, nitrides, etc. Nanocom-posites are understood to becomposite materials having atleast one component in the formof a nano-object.
Nanoparticles often build clustersof aggregates or agglomerates. Incontrast to aggregates, agglomer-ates can be ground into primarygrains through optimal mixing.Their shape can therefore be very inconsistent and they may take a wide variety of forms, having considerable influence on their properties. In principle, due to their enormous surface-to-mass ratio nanoparticlesbehave completely differentlythan larger composites.
Since opinions differ on the be-havior of nanoparticles on thehuman organism, many studiesdealing specifically with toxicityof nanoparticles have recentlybeen published. Data on thebehavior and toxicity of particlescomes mainly from studies oninhaled nanoparticles. Data onparticle migration through theskin is also available in detailfrom pharmaceutical studies.
Nano particles in sunscreen
Sunburn on the human skin iscaused by exposure to ultravioletlight in the medium wave range(UVB, 280 - 320 nm) and longwave range (UVA, 320 - 400 nm).UVB rays cause reddening andinflammation of the skin, as wellas blistering, while UVA rayscause darkening and aging (wrin-kles and sagging) of the skin.
Figure 1: Simultaneous ICP-OES spectrometer ICPE-9000 with CCD detector

9
APPLICATIONShimadzu News 2/2011
does not use scattered light, it isfree from these physical restric-tions and does not require theinput of refractive index as ameasurement condition. It there-fore allows nanoparticle size tobe measured simply with highsensitivity. It is particularly effec-tive for nanoparticle size distribu-tion in the range of 0.5 to 200 nm.
The samples were diluted x 10with water and put in an ultra-sonic bath for 30 seconds. Final-ly, a drop of triton X-100 wasadded to reduce surface tension.
The sunscreen samples show atypical particle size distributionof TiO2 nano particles as shownin figure 1 with a mean particlediameter of 35 nm.
Quantitative Analysis using ICPE-9000
For quantitative analysis of TiO2nanoparticles the simultaneousICPE-9000 with minitorch hasbeen used. The system is suitablefor axial and radial plasma obser-vation. Its high-performanceEchelle optics use a large-scaleCCD detector with 1024 x 1024pixels and can determine all ele-ments in various concentrationlevels simultaneously with justone analysis.
The ICPEsolution software’sreprocessing function enablesdetermination of additional ele-ments or changing of concentra-tion range for alternate wave-lengths without the need for newmeasurements. The vacuumoptics combined with mini torchtechnology reduce argon gas con-sumption considerably. The torchused in this experimental workreduces argon gas consumptionto almost half that of convention-al torches without loss in sensi-tivity. In addition, time-consum-ing rinsing of the optics withultrapure gas is no longer neces-
sary. The system is ready foroperation and is stable within theshortest possible time. Whenequipped with the optionalautosampler, the system can befully automated for high samplethroughput operation. The sys-tem status is monitored continu-ously and can be accessed at anytime.
Software supported by twohelpful “assistants”
The ICPEsolution softwareoffers additional support withtwo integrated assistant func-tions. The “Development Assis-tant” creates complex calibra-tions, from selection of optimalwavelengths up to the composi-tion of standard concentrations.Together with the “MonitorFunction” for qualitative analy-sis, this assistant highlights possi-ble interference problems orincorrect wavelength selectionbefore the actual calibration takesplace, and displays solutions formethod modification or errorcorrection. The “Diagnosis Assis-tant” evaluates data already meas-ured, and compares this withinformation from variousdatabases. Data evaluation andrecalculation have never beenmore straightforward. �
Figure 2: Particle size distribution of Titanium dioxide
Table 1: Instrumental Parameters for the quantification of nano particles in sunscreen
ICPE-9000
No
rma
lize
d p
art
icle
am
ou
nt
Particle diameter (nm)
Particle size distribution (Volume dimension)
Generator power [kW]Plasmagas [L/min]Carrierergas [L/min]ObservationPlasma torchWavelength [nm]Calibration range [mg/L]
1.2100.8
axialMinitorch
0 - 1 - 10 - 10
Spectrometer
Nano particles made of titaniumdioxide and zinc oxide are usedin sunscreen to block exposure toultraviolet rays. Titanium dioxidehas been demonstrated to beeffective in shielding againstUVB, while zinc oxide effectivelyscreens out UVA rays.
Nowadays, the TiO2 particles insunscreens protecting againstUVB are in nanoscale and onlyvisible using an electron micro-scope. The typical white film onthe skin after using sunscreen informer times has meanwhile dis-appeared, since the nano particlesof TiO2 are almost invisible.
To evaluate the size of nano par-ticles in sunscreen a nanoparticlesize analyzer has been used. TheShimadzu IG-1000 uses the in-duced grating method, based on anew principle for measuringnanoparticle size using the phe-nomenon of induced electro-phoresis and diffracted light.
With conventional dynamic lightscattering, the light scattered byparticles decreases sharply forparticle sizes of less than 100 nm.Furthermore, physical restric-tions in the single nano region ofparticle sizes of less than 10 nmmake it difficult to detect scat-tered light, and measurement ofparticle sizes also becomes diffi-cult. Since the IG-1000 method
terization and

APPLICATION Shimadzu News 2/2011
10
Digital Ihelps th
Digital Image Correlation(DIC) has been used byphysicists and material
scientists for many years and isnow finding new applications inhigh speed imaging as a methodof image analysis. Shimadzu’sHPV-2 camera pushes the bound-aries of this technique with itsability to image high-speedevents with a microsecond timescale.
This application is interesting forthe aircraft industry, which isalways looking for innovation inmaterials withstanding highestimpacts and loads while reducingenergy consumption and costs.
HPV-2 high-speed
Figure 1: Two HPV-2 cameras at 45 degree stereo angle viewing a 30 cm square stif-
fened aluminium panel which is impacted from above using a drop weight tower
Sunscreen samples with differentsun protection factors have beenmeasured. The sun protectionfactor is an indicator of the effec-tiveness of sunscreen – the higherthe SPF, the more protection asunscreen offers against UV-Bradiation.
Qualitative analysis was first per-formed to see the basic composi-tion and element distribution. Aquantitative method was thendeveloped based on the parame-ters indicated by the “Develop-ment Assistant.” For the samplesbased on TiO2 nano particles thefollowing parameters were used(see table 1).
Summary
Distribution of TiO2nano parti-cles in the sunscreen lotions wasfound not to be homogeneous, soit is important to shake the con-tainer well before taking a sam-ple. TiO2 concentration is relateddirectly to the sun protection fac-tor. The Ti-concentration in sun-screen with the highest protec-tion factor (30 in this experiment)was 210 mg/L. Results of all sam-ples taken for comparison aresummarized in table 2.
Titanium dioxide (TiO2) nano-particles are manufactured world-wide in large quantities for use ina wide range of applicationsincluding pigment and cosmeticmanufacturing such as sunscreen.Although TiO2 is chemicallyinert, TiO2 nanoparticles cancause negative health effects suchas respiratory tract cancer in rats.However, the mechanisms
Table 2: Ti concentrations in sunscreen samples with different light protection factors
involved in TiO2-induced geno-toxicity and carcinogenicity havenot been clearly defined and arepoorly studied in vivo [3]. Der-mal penetration of TiO2 nanopar-ticles through the outer layer ofthe skin is still the subject of fur-ther investigation [4].
In contrast to the variety of toxi-cological opinions the analyticalresults are very clear. The IG-1000 laser diffraction particle sizeanalyzer and the ICPE-9000ICP-OES spectrometer are idealtools for characterization andquantification of TiO2 nanoparti-cles in sunscreens.
Literature
[1] EUROPEAN COMMISSION,
HEALTH & CONSUMER
PROTECTION DIRECTORATE-
GENERAL, Directorate C – Pub-
lic Health and Risk Assessment
C7 – Risk assessment, 2006
[2] Nanotechnology Standards for
Health, Safety, and Environmen-
tal Factors Nanotechnology Law
Report, 2008
[3] Cancer Res 2009; 69: (22).
November 15, 2009
[4] Australian Government,
www.tga.gov.au, A review of
the scientific literature on the
safety of nanoparticulate titani-
um dioxide or zinc oxide in sun-
screens
We will gladly send you additional
information. Please enter the cor-
responding number on the reply
card or order via Shimadzu’s News
App or News WebApp. Info 398
Ti 70 210
Element SPF 15 [mg/kg] SPF 30 [mg/kg]

11
APPLICATIONShimadzu News 2/2011
e aircraft industrymage Correlation (DIC)
number of cameras used) in orderto help understand how theobject or material under investi-gation behaves.
Stiffened panel underextreme flight conditions
Two HPV-2 cameras were usedrecently at Cardiff UniversitySchool of Engineering, UK tostudy a stiffened panel underhigh levels of stress. A dropweight tower was used to impactthe panel, simulating the highstress conditions found on air-frames under extreme flight con-ditions. The Shimadzu HPV-2cameras recorded the impact at125,000 frames per second.
The camera images were import-ed into the DIC software provid-ed by Correlated Solutions Inc.,Columbia, South Carolina/USA,which analyzed each pair offrames from the two cameras todetermine the precise distortionof the panel as it was subjected tohigh speed dynamic loading.
In this experiment the panel waspainted with a random “speckle”pattern (random black dots on ahigh contrast white background).
Mathematical treatment of DICimages is capable of measuringvery precisely the position andshape of an object in two or threedimensions (depending on the
camera
Figure 2: A pair of raw images from the HPV-2 cameras showing the speckle pattern
on the aluminium sample
Figure 3: Result of a stereo pair of images from the HPV-2 cameras after image
processing by the DIC software. Note: impact point from the drop weight tower is
on the left of the image.
The DIC software scanned thespeckle pattern and tracks themovement of the dots from oneframe to the next in order tomeasure movement and distor-tion of the panel. Since two cam-eras were deployed, three-dimen-sional information could bederived from the images.
Powerful tool for engineering scientists
The HPV-2 camera’s designmakes it particularly suited toDIC measurements. Each imageis recorded using the same light-sensitive areas (pixels) on the InSitu Image Storage CCD (ISISCCD), meaning that no relativedistortion of the images occursfrom frame to frame. Also, up tofour cameras can be synchro-nized ensuring that the event is
recorded by all cameras simulta-neously.
The unique benefits of the Shimadzu HPV-2 camera coupledwith the analytical techniques ofDIC make this combination ofequipment a powerful tool forengineering scientists studyingnew materials under transientdynamic loading conditions.
Acknowledgements:
Speyer Photonics Ltd.
Brian Speyer
Correlated Solutions Inc.
Hubert Schreier
Cardiff University.
Mark Eaton

it is desirable to keep mainte-nance intervals as long as possi-ble. Shimadzu’s TOC-L offersseveral possibilities to minimizemaintenance frequency for highlypolluted samples.
The TOC-L series features cat-alytic combustion at 680 °C. Thisis below the melting point ofsodium chloride, preventing amelt from deactivating the activecenters of the catalyst. The use ofa platinum catalyst ensures com-plete conversion of the organiccarbon compounds to CO2.
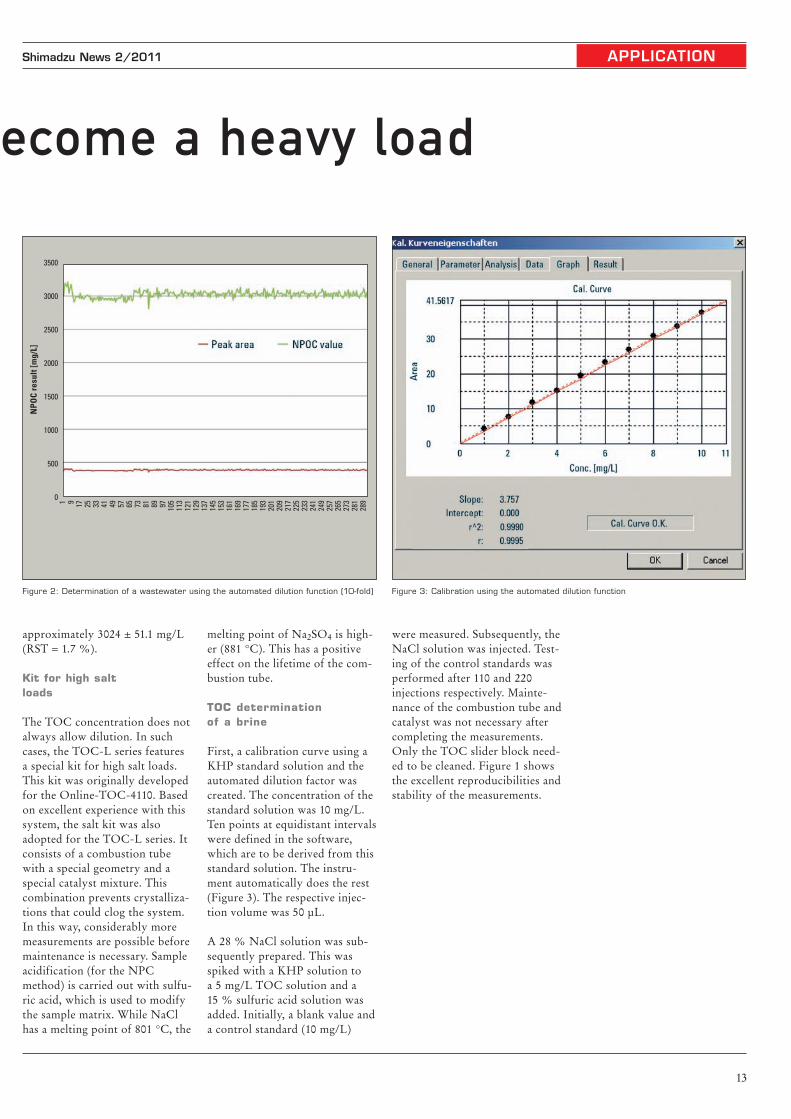
The highly sensitive NDIR detec-tor enables small injection vol-umes (typically 20 - 50 μL),which minimizes the absolutesample load on the catalyst. Anadditional reduction can beattained using the integrated dilu-tion function. The ISP (Integrat-ed Sample Pretreatment) moduleenables automated sample dilu-tion, which can be applied con-tinually or when measuring val-ues are being exceeded. In thiscase, the user defines the desireddilution factor in the method. Figure 2 shows close to 300 injec-tions of a wastewater which wasmeasured after 10-fold dilution.The result of this measurement is
APPLICATION Shimadzu News 2/2011
12
TOC determination in highly polluted samples
TOC is an accepted param-eter for the determinationof organic pollution in
various matrices. Originally usedas an indicator for testing drink-ing and wastewater, TOC is nowincreasingly being used as a mon-itoring parameter in many pro-cesses. In the chemical industry itis, for instance, used for chlorine-alkali electrolysis brines with asalt content (NaCl) of up to 28 %. In these processes it isimportant to know the TOCcontent. The unique feature ofthe application does not inherent-ly lie in the conversion of carboncompounds to carbon dioxide,but in the salt load associatedwith the matrix.
Are high salt loads a problem?
Thermal catalytic combustion ofthe sample is accompanied by
crystallization of the dissolvedsalts. Depending on the salt loadlevel, this can contaminate thecatalyst or clog the system,requiring maintenance measures(for instance, replacement of thecatalyst) to return the instrumentto operational status. Of course,
TOC-L with autosampler
How salt load doesn’t b
Figure 1: TOC determination of a brine (28 % NaCl)
0
2
4
6
8
10
0
10
20
30
40
50
0
Injections
Injection of 28 % NaCI in 5 mg/L KHP [Inj.: 50 μl; Acid: 15 %]
Co
nc
en
tra
tio
n [
mg
/L]
Are
a
50 100 150 200 250
13
APPLICATIONShimadzu News 2/2011
Figure 3: Calibration using the automated dilution function
melting point of Na2SO4 is high-er (881 °C). This has a positiveeffect on the lifetime of the com-bustion tube.
TOC determination of a brine
First, a calibration curve using aKHP standard solution and theautomated dilution factor wascreated. The concentration of thestandard solution was 10 mg/L.Ten points at equidistant intervalswere defined in the software,which are to be derived from thisstandard solution. The instru-ment automatically does the rest(Figure 3). The respective injec-tion volume was 50 μL.
A 28 % NaCl solution was sub-sequently prepared. This wasspiked with a KHP solution to a 5 mg/L TOC solution and a 15 % sulfuric acid solution wasadded. Initially, a blank value anda control standard (10 mg/L)
were measured. Subsequently, theNaCl solution was injected. Test-ing of the control standards wasperformed after 110 and 220injections respectively. Mainte-nance of the combustion tube andcatalyst was not necessary aftercompleting the measurements.Only the TOC slider block need-ed to be cleaned. Figure 1 showsthe excellent reproducibilities andstability of the measurements.
approximately 3024 ± 51.1 mg/L(RST = 1.7 %).
Kit for high salt loads
The TOC concentration does notalways allow dilution. In suchcases, the TOC-L series featuresa special kit for high salt loads.This kit was originally developedfor the Online-TOC-4110. Basedon excellent experience with thissystem, the salt kit was alsoadopted for the TOC-L series. Itconsists of a combustion tubewith a special geometry and aspecial catalyst mixture. Thiscombination prevents crystalliza-tions that could clog the system.In this way, considerably moremeasurements are possible beforemaintenance is necessary. Sampleacidification (for the NPCmethod) is carried out with sulfu-ric acid, which is used to modifythe sample matrix. While NaClhas a melting point of 801 °C, the
Figure 2: Determination of a wastewater using the automated dilution function (10-fold)
0
500
1000
1500
2000
2500
3000
3500
1 9 17 25 33 41 49 57 65 73 81 89 97 105
113
121
129
137
145
153
161
169
177
185
193
201
209
217
225
233
241
249
257
265
273
281
289
NP
OC
re
su
lt [
mg
/L]
ecome a heavy load

APPLICATION Shimadzu News 2/2011
14
From drinking water to ultrapure water
What do the manufactureof drugs and computerchips, generation of
electricity in steam turbines andchemical analysis have in com-mon? They all use ultrapurewater for a wide variety of tech-nical processes. Ultrapure wateris usually generated from lesspure water, for instance drinkingwater, and various methods areused for purification such as dis-tillation, reverse osmosis, ion-exchange or various adsorptionmedia (e.g. active carbon). TOC(Total Organic Carbon) is a keyparameter describing the purityof water and indicating thedegree of pollution by organiccomponents.
(up to 20.4 mL) and the highlysensitive NDIR detector, thisleads to extremely low detectionlimits (0.5 μg/L) and excellentreproducibilities in the low ppb-range. This makes the TOC-VWPhighly suitable for TOC determi-nation in the ultra-trace range.
The following setup was selectedto investigate the adsorptionbehavior of the products: drink-ing water was passed through aglass column packed with adsor-bent. The ultrapure water gener-ated was sampled after elutionfrom the column and was meas-ured using a TOC analyzer.
Contaminations are eliminated
Reproducibility of initial testmeasurements was poor, and theresults were also higher thanexpected. A possible reason: dur-ing measurement in the lowestranges, organic contaminationsarising from the environmentplay a major role. This is whysampling is a critical factor inTOC trace analysis and is accom-panied by a large error rate.
LUMA consequently developedan online experimental setup.Drinking water was again passedthrough a column packed with anadsorbent. However, the columneluate was then transferred viatubing to a closed sample vesselconnected directly to the TOCanalyzer’s injection unit. In thisway, contaminations arising fromsampling and external influenceswere eliminated.
In this experimental setup, drink-ing water was passed through the
since 1994 as a service laboratoryin environmental and metal anal-ysis. LUMA uses a ShimadzuTOC-VWP system for TOCdetermination.
TOC determination in theultra-trace range
TOC-VWP uses powerful oxida-tion via the combination of sodi-um persulfate and UV oxidationat 80 °C. This guarantees that alldissolved carbon species aredetected. An automated reagentpreparation function eliminatespossible contamination from thesolution and minimizes the blankvalue of the instrument. Togetherwith the high injection volume
Blücher GmbH, based in Erkrathnear Düsseldorf, Germany, devel-ops spherical high-performanceadsorbents for the generation ofultrapure water. To investigateproduct qualities of the adsor-bents in terms of their adsorptionbehavior, and to test the latestproduct developments regardingtheir TOC reduction on a semi-industrial scale, Blücher lookedfor a partner with excellent ana-lytical and technical facilities andsufficient experience in TOCanalysis in the ppb-range.
LUMA, the laboratory for envi-ronment and metal analytics atTRIMET Aluminium AG inEssen, Germany, has been active
TOC in purified drinking water
Figure 1: Diagram of the column experiment
Figure 2: Calibration curve
-146
26466686
106126146166186206226246266286306326346366386406426446466486506526546566586606626
1 26 5 h 51 10 h 76 15 h 101 20 h 126 27 h
TOC reduction by means of adsorbents:
Sample: test sample = test sample supplied by Blücher
Number of measurements / Measuring time in hours

15
PRODUCTSShimadzu News 2/2011
Figure 3: Experimental setup
column at a flow rate of 50 mL/min. The ultrapure water generat-ed was measured every 5 minutesover a time interval of 27 hours.Approximately 80 liters of waterflowed through the column inthis time.
Conclusion
Using this online experimentalsetup, LUMA was able to gener-ate ultrapure water with a TOCcontent generally lower than 5 μg/L from drinking water, withan average input concentration of500 - 800 μg/L.
The measurement results wereplotted against time in a diagram.
For the determination, a range of20 - 520 μg/L is calibrated inequidistant intervals.
Sampling and environmental con-ditions lead to an increased inputof organic carbon to the sample.Only after online connection ofthe column to the TOC systemcould an error-free measurementwithout any influence of sam-pling be guaranteed.
For further inquiries:
TRIMET ALUMINIUM AG LUMA
Labor für Umwelt- und Metallanalytik
Hans Mattedi: +49 201- 366 257
www.trimet.de
Multi-purpose toolsNew spectrophotometer series – highest perfor-mance with lowest stray light
As the market leader inUV-VIS-NIR spectrosco-py Shimadzu has been
setting milestones in spectropho-tometry technology for almost 60years. A new series of scanningspectrophotometers will now bereleased with the UV-2700, a truedouble beam double monochro-mator system in a compact andsmart design. In fact, the foot-print of the instrument has beendecreased by 28 % in comparisonto the previous UV-2550 model.
The new compact spectrophoto-meters enable high-precisionspectral analysis of a wide rangeof samples including organic andinorganic compounds, biologicalsamples, optical materials andphotovoltaics.
High sophisticated applications
The high performance level of theoptical system is based on theShimadzu “LO-RAY-LIGH®”diffraction grating, featuring hig-hest efficiency and exceptionallylow stray light. The UV-2700works in the wavelength range of185 to 900 nm and allows highlysophisticated applications such asdirect measurement of high den-sity samples up to 8 absorbanceunits without dilution.
For users who do not need theultra-low stray light levels of theUV-2700, the UV-2600 singlemonochromator version is alsoavailable. Combined with thedual detector integrating sphereISR-2600 Plus, it allows a measu-ring range from 185 up to 1400nm. This wide range allows thedetermination of optical materialor expanded research of photo-voltaics.
Measurement of solid samples
The MPC-2600 multipurpose lar-ge-sample compartment and inte-grating sphere attachment enablesmeasurement of solid samples.Various cell holders such as theconstant-temperature cell holder,the film holder and the powdersample cell can be mounted aswell, enabling a wide range ofmeasurement possibilities. Theinstrument is equipped with stan-dard USB ports and controlledby the new UVProbe softwareversion 2.40. For pharmaceuticaland other applications requiringhardware validation, the UV-2600/2700 series provides inte-grated validation software asstandard. USP, EP and JP testrequirements are supported.
Figure 1: UV-2700 double beam double monochromator
UV-VIS spectrophotometer
We will gladly send you additional
information. Please enter the cor-
responding number on the reply
card or order via Shimadzu’s News
App or News WebApp. Info 399

APPLICATION Shimadzu News 2/2011
16
Rapunzel, let your hair downTensile tests on human hair
Biologically speaking,human hair regulates bodytemperature, protects
from rain and is a protective bar-rier against UV radiation. Today,these biological functions are ofless importance as the socialmeaning of hair is becomingmore and more significant. Hairis at the same time an eye-catcherand an embellishment, and isoften an expression of personali-ty. What has remained through-out history, however, is the factthat strong hair is a symbol for aperson’s health, as symptoms ofdeficiency can have a direct influ-ence on the quality of hair.
But how strong is human hair? Is it really possible that a princewas able to climb up the towerusing Rapunzel’s hair? Could theBaron von Münchhausen reallypull himself out of a swamp byhis own hair?
Stress test for hair
Modern technology offers themeans to obtain objective results,for instance using universal test-ing machines. For this applica-tion, a hair is placed in a suitableclamping device – or glued to avertically folded window cutfrom a piece of paper that is sub-sequently secured in a parallelclamping device. In the subse-quent test, the hair is stretched atconstant tensile speed until it
breaks. The stress-strain diagramis a graphical representation ofthe curve from which the maxi-mum force and the elastic modu-lus can be determined. As can beseen from the diagram, the maxi-mum tensile load is approximate-ly 1.16 N.
Humans have on average 100,000hairs, so a maximum load of upto 116 kN (11.6 tons) is conceiv-able. Strong enough, therefore, tolet a whole crowd of princesclimb up Rapunzel’s hair. In thiscase, it is rather the force neededto pull a hair from its roots thatis relevant.
Women or men – who has the toughest hair?
What is the influence of hair col-or on tensile strength? Accordingto myth, dark hair is deemed tobe thicker and, therefore, toughercompared to other hair colors.And what about differencesbetween men and women? Thetable 1 provides a non-represen-tative example on the relevancebetween hair color, hair thicknessand gender.
Since hair thickness also dependsstrongly on water retention andhumidity and therefore influencesthe above parameters, the sampleswere measured after a standarddrying time at constant humidity.
Table 1: Tensile strength data for different hair colors in men and women (*Good manners prevent asking)
Figure 1: Single-column universal
testing machine, series EZ-Test-L
65331.36
1.148.45501
85283.89
1.6185.33405
84178.10.9946.32466
70360.41
1.6168.43387
75214.99
0.9549.643444
49387.73
0.7366.74332
70299.96
1.1558.64191
Hair thickness, μmTensile strength in MPaTensile strength in N/mm2
Stretching until breakage %Elastic modulus (MPa)
Grey hair
Man Woman*
Dark hair
Man Woman
Brown hair
Man Woman
Blonde hair
Man Woman
The results show that the tensilestrength of male hair is consider-ably less than that of female hair.Stretching until breakage resultedin noticeably higher recorded val-ues for female hair. A possibleinfluence of hair care productscould not be determined retroac-tively.
This, however, should not haveany effect on the elasticity, whichshould be virtually the same forboth men and women. Again, itcan be determined that less-pig-mented hair exhibits a higherelastic modulus than pigmentedhair.
�

Standard deviation
Silicate 0.425 1.45 - 0.10i 3.234 3.564 3.190 0.082
File name Absorbance Ref index Median diameter Modal diameter Mean value
0
50
100
0
50
100
0
50
100
10
0.01 0.05 0.1 0.5 1 5 10 50 100 500
20 30 40 50 60 66 70
Lig
ht
inte
ns
ity
No
rma
lize
d p
art
icle
am
ou
nt
(Cμ
m/D
iff.
)
Sensor element number
(%) 100 % = 2000
Q3 (%) q3 (%)
Particle diameter (μm)
17
TELEGRAMShimadzu News 2/2011
Powerful together
With its particle size anal-yzer series, Shimadzuoffers the possibility to
determine particle sizes in therange of 0.5 nm to 3 mm. Theanalyzers differ in their measure-ment principles. Laser diffraction,for instance, is applied in theSALD analyzer series, whichallow measurements in a broadspectrum of 10 nm to 3 mm. TheIG-1000, on the other hand, is aspecialized instrument usedexclusively for the detection ofnanoparticles in the range of 0.5 nm to 200 nm and worksaccording to Shimadzu’s patented‘induced grating’ principle.
In chemical analysis, a suitableselection of several analyticalmethods is often needed to provi-de a comprehensive solution toan analytical problem. Manufac-turers with an organically grownand finely tuned product portfo-lio can offer their customers tai-lor-made solutions and are there-fore best equipped to address theproblem at hand.
In the present case, an HPLCcolumn packing was measuredusing the SALD-2201 particlesize analyzer (measuring range of30 nm - 1000 μm). HPLC is aroutine method for the analysisof complex substance mixtures
used in the pharmaceutical indu-stry, clinical chemistry as well asin life and environmental scien-ces.
The heart of the HPLC system isthe separation column in whichthe individual components of a
Particle size analysis for the determination of theseparation efficiency of an HPLC column
Figure 1: The upper diagram represents the light intensity per detector element. The lower diagram shows the particle size
distribution.
Table 1: Measuring results
The IG-1000 determines particles sizes of 0.5 up to 200 nm
mixture are separated. Conven-tional columns are usually packedwith silica gel particles and thecolumn separation efficiency isdependent on the particle size.
For particle size determination,the column packing was removed
from the column and dispersedin water. The mixture was thentransferred to the autosampler ofthe SALD-2201 equipped with ahigh-performance stirrer, andsubsequently measured in theanalyzer’s flow cell.
An experimental value of 3.2 μmwas found, which correspondedvery well with the expected valueof approximately 3 μm. Particlesize analysis is therefore suitablefor the determination of theseparation efficiency of anHPLC column.

the time needed in pyrolysis forheat transfer to the sample direct-ly influences reproducibility ofthe pyrolysis application. Themaximum linear temperatureramp of the OPTIC-4 is 60 °C/sup to a maximum temperature of600 °C, which is suitable formost pyrolysis applications.
As seen in figure 3 a μ-vial filledwith sample can be positioned
PRODUCTS Shimadzu News 2/2011
18
Performance redefined
“Multimode” inlet is oftenreferred to in modern chro-matography equipment. Butwhat characterizes a realmultimode inlet system?
I t should offer the flexibilityof different injection tech-niques where more than one
inlet would normally be needed.For a real benefit of a multimodeinlet system, the standard injec-tion modes should be supportedat least as well as with a standardsplit/splitless injector.
In addition to standard injectionmodes, the temperature pro-grammable OPTIC-4 (Atas GL)inlet offers split/splitless injec-tions, rapid at-once large volumeinjections (LVI) and direct (in-liner) sampling techniques suchas pyrolysis, thermochemolysisand thermal desorption as singleor multi-shot analysis.
Direct (in-liner) sampling technique
The direct in-liner sampling tech-nique enables analysis of samplesdirectly out of the liner. This
technique is useful when han-dling solid or highly matrix-load-ed samples since additional sam-ple preparation such as extrac-tion, clean-up or diluting is un-necessary. The sample itself canbe positioned in a μ-vial which isplaced in the liner. Analysis canthen be done directly by heatingthe sample.
Boiling Point selected transfer
Using the technique of boilingpoint selected transfer, a definedheating ramp is applied to thesample. Only the compoundsextracted by the applied tempera-ture profile are transferred to theGC column inlet. Using the opti-mal temperature profile the com-pounds with higher molecularweight or matrix remain in the μ-vial. After the analysis the μ-vialis discard and the liner can be re-used.
Pyrolysis
Using the technique of pyrolysis,the applied temperature rampshould be as high as possible, as
New generation of the most powerful multimode inle
into an OPTIC-4 liner which islarge enough to accommodate it.In principle, temperature pro-grammed vaporizers (PTV) applya uniform temperature profilewith fast and reproducible heattransfer to the sample. Thepatented low thermal mass designof the OPTIC-4 body togetherwith direct resistive heatingenables the flexibility of standardliner inner diameters (ID) of 3.4 mm. As most PTV systems inPTV mode working with linerIDs of less or equal than 2 mmare restricted due to the heatingtechnique, the OPTIC-4 distin-guishes itself through its uniquedirect resistive heating and opensthe above mentioned applicationflexibilities.
Large volume injection
Wherever detection limits arecrucial, for example for determi-nation of pollutants in environ-ment, large volume injection(LVI) techniques are of interest.LVI can be carried out either byapplying on-column injectionusing a retention gap or by using
Figure 2: Temperature and flow method of an LVI
05
1015
2520
3035404550
1.0
406080
120100
140160180200220240
-01:00 -00:30 00:00 00:30 01:00 01:30 02:00 02:30 03:00 03:30 04:00 04:30 05:00
Time
Sp
lit
flo
wC
olu
mn
flo
wIn
let
tem
pe
ratu
re
Figure 1: Shimadzu GCMS-QP-2010 Ultra equipped with the OPTIC-4

19
PRODUCTSShimadzu News 2/2011
t – OPTIC-4
PTV injectors. On-column tech-niques are less suitable for deal-ing with dirty samples, as the dirteasily contaminates the columninlet. In this respect, LVI using aPTV is advantageous. For LVIinto a PTV inlet different tech-niques are mentioned in the liter-ature [1]. Here the well-knownand in use proven technique ofsolvent split injection is high-lighted.
LVI – Solvent split injection
In the solvent split injection theinlet temperature at the time ofinjection is below the solventboiling point, with the Split exitwide open. With method adjust-ment for the optimal temperatureand venting time, the solvent iseliminated. Closing the Split exitcompletely and raising the inlettemperature, the analytes aretransferred to the column. Sincesolvent evaporation temperatureand venting time is crucial inmethod development, thisbecomes much easier with theOPTIC-4 solvent monitorinstalled as default. The solventmonitor is installed in the splitline, and it detects the evaporat-ing solvent peak by a thermal
Figure 3: Direct sampling using DMI technique Table 1: Key Features of OPTIC-4
Temperature ramp rateTemperature rangeOption for cooling
Liner dimensionsSolvent sensorFerrulesSampling modes
1 °C/sec - 60 °C/sec35 °C - 600 °C (air cooling)Liquide CO2: -50 °CLiquide N2: -180 °CID = 3.4 mm · L = 80 mmInstalled as standardGraphite or SilTiteHot split /splitless (high pressure)Cold split /splitlessRapid at-once LVIDirect (in-liner) sampling (pyrolysis, thermal desorption, DMI, thermo-chemolysis)
conductivity detector monitoredin real time in the Evolution soft-ware.
Rapid at-once LVI
The maximum volume which canbe held within the injector de-pends mainly on the liner dimen-sions and the amount of packingmaterial [1]. Using inserts of ID3.4 mm in the OPTIC-4, samplevolumes up to 150 μl can beinjected rapidly, hence the name“rapid at-once LVI.” Comparedwith other PTV inlets equippedwith narrow inserts (± 1 mm ID),the maximum volume that can beinjected at-once is around 20 μl[1]. If more sample volumeshould be introduced, a speedcontrolled LVI can be donewhere the injection speed is limit-ed by the solvent evaporationtime. With rapid at-once LVI themethod development is simpli-fied, as no optimization of injec-tion speed is necessary.
Depending on the sample ana-lyzed and particularly on itsmatrix content, the liner mayhave to be changed after a fewhundred or even after a few tensof injections. Based on theOPTIC-4 and the new AOC-
5000 Plus, the option of automat-ed liner exchange (LINEX) sim-plifies the process of exchangingliner and increases laboratoryproductivity. Furthermore, theLINEX option enables the auto-mated direct sampling techniquesavailable with the OPTIC-4, asthe direct analysis requires oneliner (filled with a μ-vial andsample or packed liners wheresample is adopted) for each sam-ple.
The new OPTIC-4 (Atas GL)with its patented design providesthe flexibility to choose differentinjection modes by defining linerand method respectively. Usingthe Shimadzu AFC (advancedflow control) the OPTIC-4 pneu-matic control is fully implementin GC/GCMSsolution software.
[1] “Trace analysis with gas
chromatography using online
enrichment and large volume
injection” Chapter 3.1
Hans Mol

been decreased – even the mostdistant sampling position isreached quickly, and for an injec-tion of 10 μL the time is de-creased from 10 to 8 secondscompared with the basic model.For this measurement, all addi-tional rinsing options were omit-ted – meaning, measuring with amaximum allowable tailwind inkeeping with the analogy tosports.
As for the rinsing options: allavailable options in the basic
model can alsobe selected here.In addition to
PRODUCTS Shimadzu News 2/2011
20
More than a new record
Records are usually short-lived. Sooner or later, newtop records are set which
have their own foreseeable expirydate. When it comes to technolo-gy and technical specifications, itis a just question of time whenthey will be surpassed or newstandards are set.
As a part of the recently intro-duced Nexera MP system, thenew Nexera SIL-30AC autosam-pler sets new records in injectionspeed, cycle time and lowest car-ryover. For the first time, carry-over for UV detectors as well asfor LCMS/MS is specified.
The new autosampler originatesfrom a prominent family – SIL-HT, prominence and Nexera haveinspired the development of thenew instrument. The Nexera SIL-30ACMP matches the design ofthe series and has an expandedsample capacity – a maximum ofsix racks of 54 sample vials of 1.5 mL each and 324 + 10 posi-tions for standards. The capacitycan be increased to 576 or 2,304when using microtiter plates.These are placed in three drawertrays which can be accessed andexchanged during operation. For
New Front End system – Nexera MP
Figure 1: From left to right: SIL-30AC, SIL-10A, SIL-10HT und SIL-20AC
Figure 2: SIL with LCMS/MS
the decreased injection time, thetotal cycle time can be decreasedfrom 23 to 14 seconds. The ‘newone’ is, therefore, approximately30 - 40 % faster.
Configuration gap is closed
Who needs an (even) fasterautosampler and increased samplecapacity? The new SIL-30CMPwith six microtiter plate rackstargets the segment between bothprominence and Nexera configu-rations and their setups with anautosampler and rack changer.Both systems have more thanproven themselves as Front Endfor LCMS/MS systems. Whentime for automated exchange of
safety reasons, a blinking lightissues a warning. The inner com-partment of the autosampler canoptionally be illuminated, usefulfor checking the correct needleposition as well as for servicingthe instrument.
Up to 40 percent saving in time – with a reliable tail-wind
In spite of the wider compart-ment structure, injection time has

21
READ FOR YOUShimadzu News 2/2011
sample racks becomes critical- inparticular when only a few vialsor wells are to be injected inorder to obtain a fast overviewon positives or negatives within a batch – the time of the newautosampler’s special disciplinehas come.
The ability to mix configurationsbetween microtiter plates andvials provides additional flexibili-ty for users. Even more: just likethe predecessor model SIL-HT,the SIL-30ACMP also features anintegrated controller; pumps, col-umn oven and detectors can bedirectly connected and operated.
The column oven is also innova-tive. The small CTO-30AS oven –used especially when dealing withshort columns and thereforemaximum speeds and smallestpossible dead volume – can beintegrated directly into the sys-tem via a special board. The ovenis mounted on the side of theautosampler and its position canbe adjusted to align with the con-nected MS/MS system.
With the triple quadrupoleLCMS-8030 mass spectrometer,Shimadzu offers a high-perfor-mance LCMS/MS system in ad-dition to the Nexera, a combina-tion that fits perfectly in terms ofoptics and software technology.
Breaking records means alwayspushing the envelope hard in set-ting new standards, and holdingtight onto one’s dreams.
Dioxin and PCB moni-toring in animal feed Single Quad GC/MS
The current draft foramendments to the Ger-man Feed Regulation
(Futtermittelverordnung, FMV)calls for additional requirementsof dioxin and PCB (polychlori-nated biphenyls) monitoring,such as individual detection of all17 polychlorinated dibenzo-p-dioxins and dibenzofuranes(PCDD/F). Sample throughputand the demand for cost-effectivedioxin and PCB analyses willincrease significantly. Will thesemaximum value analyses alwaysrequire the use of high-resolutionmass spectrometry (HRMS) or islow-resolution mass spectrome-try (single quadrupole MS) suit-able?
Legislative regulation
Methods for the official controlof foods and animal feed arespecified in the Commission Reg-ulation (EC) No 1883/2006Annex II[1]. It lists the require-ments of GC/MS screening pro-
cesses – single quadrupole MS,ion trap MS or triple quadrupoleMS – for high sample throughputas well as GC/HRMS as a confir-matory method for reconfirmingpositive results when maximumvalues are exceeded.
The text, however, does notclearly state in which case theresult of a screening methodshould be reconfirmed usingHRMS. Paragraph 7.2 in AnnexII, for instance states: “Positiveresults have always to be con-firmed by a confirmatory methodof analysis (HRGC/HRMS).”This means in consequence, thatresults from GC/MS screeningwhich exceed the maximum valueby only 50 % meet the require-ments. Also the wording:“Screening results with concen-trations at significant levels”(paragraph 1, Annex II) thatshould be confirmed via HRMS,is vague on the level at which thisshould occur. The originalEnglish text states “significant
levels.” This could refer to re-sidues that significantly stand outfrom the overall background pol-lution, which starts at a medianvalue of 0.03 pg/g[2] from a resultof > 0.05 pg/g PCDD/F (toxicityequivalent) TEQ. Or are “signifi-cant levels” close to the maxi-mum value?
The same paragraph of the regu-lation, however, also states thatscreening methods “in order toselect those samples with levels ofdioxins and dioxin-like PCBsthat are less than 25 % below orexceed the maximum level” aresufficient. For an animal feedwith a maximum value of 0.75pg/g[3] the screening method istherefore legally valid up to ameasuring result of 0.19 pg/g.When including the dioxin-likePCBs (WHO-PCBs), the totalmaximum value is 1.25 pg/gPCDD/F-PCB-TEQ. The sensi-tivity in the GC/MS screeningmethod must therefore, accordingto the 25 % level, attain a �

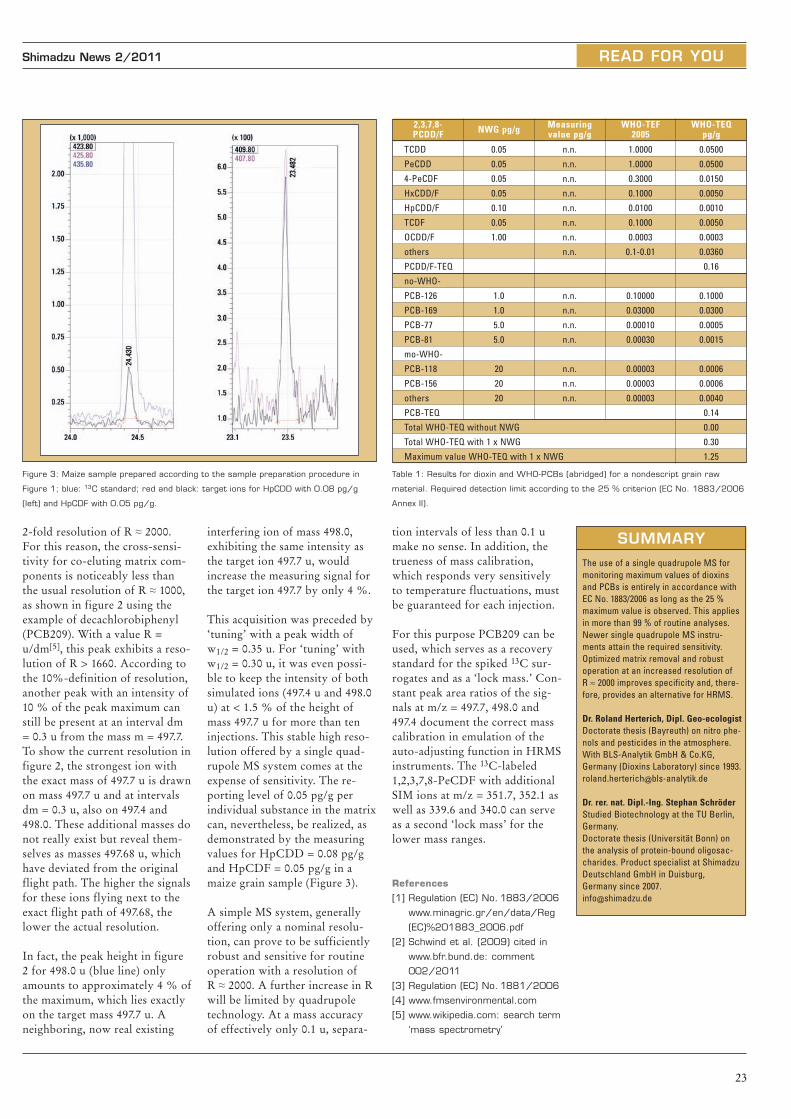
Figure 2: Peak heights for 3 neighboring masses with dm = 0.3; u ≈ W1/2 and
R = 1660. R = u / w1/2 resp. R = u / dm.
Systems)[4]. The final extractsobtained this way exhibit veryhigh purity levels and ensure long service lifetime of the singlequadrupole MS system.
Screening using singlequadrupole GC/MS
The requirements defined in EC1883/2006 Annex II on the quali-ty of HRMS measurements canalso be met without exception bya single quadrupole MS instru-ment. The determination limits of< 20 % of the maximum value asrequired in the confirmatorymethod are, due to the highersample weights, also feasible inroutine analyses, despite the low-er sensitivity in favor of increasedspecificity, which should be espe-cially important for screeningpurposes.
The MS was operated with de-creased peak width in the tuningthat gives an approximately
can easily achieve this in matrix-free calibration solutions. Theextent to which this detectionlimit can also be attained in ananimal feed matrix depends onthe purity of the extracts as wellas on the MS-selectivity of theanalytes. The latter is, in additionto the 10-fold higher sensitivity,the power of HRMS.
Focusing the detector on theexact mass of TCDD of m =321.894 u at a peak width at halfheight w1/2 = 0.03, masks matrixcomponents with few chlorineatoms or molecules lacking chlo-rine atoms, even when these pos-sess a similar mass of, for in-stance, m = 322.23 u. The highspecificity that can be attainedwith a mass resolution of R ≈10,000 (for R see Figure 2) makesHRMS indispensable for analysesinvolving complex matrices.
Sample prepa-ration
For simple monitoring of maxi-mum values in accordance withEC regulations – and more can-not be imposed on the foodindustry – GC/MS screeningmethods for animal feeds offerclear cost advantages, for instancedue to the minimum use of con-sumables. Upstream degradationof fats via precipitation in con-centrated sulfuric acid (H2SO4),as well as the final separation offats using miniaturized GPC areessential additional steps inmatrix removal with respect tosample preparation using anAutoprepTM (Fluid Management
detection limit of at least 0.19 pg/g PCB-TEQ.
This detection limit can be calcu-lated from the sum of the indi-vidual results for 17 PCDD/Fand 12 PCBs, whereby the toxici-ty equivalent factors (TEF) of theindividual substances to 2,3,7,8-tetrachlorodibenzodioxin(TCDD) are also included in thequantification. Analytes exhibit-ing high TEF should therefore bedetected at a detection limit of atleast 0.05 pg/g. For the OCDDor other less toxic PCBs, 1 pg/gup to 20 pg/g will be sufficient(Table 1).
For a sample weight of 20 g andenrichment of the TCDD in 20μL toluene, a 5 μL injection vol-ume (Figure 1) of 0.05 pg TCDDis measured at a S/N ratio of 3 :1.State-of-the-art generation GC/MS instruments, for instance Shimadzu’s GCMS-QP2010 Plus,
READ FOR YOU Shimadzu News 2/2011
22
Figure 1: Sample preparation for a
dioxin and PCB maximum value testing
using single quadrupole MS
20 g ground premixed feed+ 0,2/2,0 ng 13C-PCB+ 20/40 pg 13C-PCDD/F
Solvent exchange in 0.5 L
hexane
10 g fat with13C-standard in
0.5 L hexane
SPE extraction using toluene
Fat degradation in H2SO4
Mini-GPC: 10 mL hexane eluate
H2SO4 / silica gel/NaOH column0.75 L hexane extract
PCB/PCDF fractionation3 x 5 mL eluate
Final extracts for injectionmo-PCB 1 mL
no-PCB 0.1 mLPCDD/F 20 μL
GCMS-QP 2010 series
23
READ FOR YOUShimadzu News 2/2011
Table 1: Results for dioxin and WHO-PCBs (abridged) for a nondescript grain raw
material. Required detection limit according to the 25 % criterion (EC No. 1883/2006
Annex II).
Figure 3: Maize sample prepared according to the sample preparation procedure in
Figure 1; blue: 13C standard; red and black: target ions for HpCDD with 0.08 pg/g
(left) and HpCDF with 0.05 pg/g.
TCDD
PeCDD
4-PeCDF
HxCDD/F
HpCDD/F
TCDF
OCDD/F
others
PCDD/F-TEQ
no-WHO-
PCB-126
PCB-169
PCB-77
PCB-81
mo-WHO-
PCB-118
PCB-156
others
PCB-TEQ
Total WHO-TEQ without NWG
Total WHO-TEQ with 1 x NWG
Maximum value WHO-TEQ with 1 x NWG
0.05
0.05
0.05
0.05
0.10
0.05
1.00
1.0
1.0
5.0
5.0
20
20
20
n.n.
n.n.
n.n.
n.n.
n.n.
n.n.
n.n.
n.n.
n.n.
n.n.
n.n.
n.n.
n.n.
n.n.
n.n.
1.0000
1.0000
0.3000
0.1000
0.0100
0.1000
0.0003
0.1-0.01
0.10000
0.03000
0.00010
0.00030
0.00003
0.00003
0.00003
0.0500
0.0500
0.0150
0.0050
0.0010
0.0050
0.0003
0.0360
0.16
0.1000
0.0300
0.0005
0.0015
0.0006
0.0006
0.0040
0.14
0.00
0.30
1.25
2,3,7,8-PCDD/F
NWG pg/gMeasuring value pg/g
WHO-TEF2005
WHO-TEQpg/g
2-fold resolution of R ≈ 2000.For this reason, the cross-sensi-tivity for co-eluting matrix com-ponents is noticeably less thanthe usual resolution of R ≈ 1000,as shown in figure 2 using theexample of decachlorobiphenyl(PCB209). With a value R =u/dm[5], this peak exhibits a reso-lution of R > 1660. According tothe 10%-definition of resolution,another peak with an intensity of10 % of the peak maximum canstill be present at an interval dm= 0.3 u from the mass m = 497.7.To show the current resolution infigure 2, the strongest ion withthe exact mass of 497.7 u is drawnon mass 497.7 u and at intervalsdm = 0.3 u, also on 497.4 and498.0. These additional masses donot really exist but reveal them-selves as masses 497.68 u, whichhave deviated from the originalflight path. The higher the signalsfor these ions flying next to theexact flight path of 497.68, thelower the actual resolution.
In fact, the peak height in figure2 for 498.0 u (blue line) onlyamounts to approximately 4 % ofthe maximum, which lies exactlyon the target mass 497.7 u. Aneighboring, now real existing
interfering ion of mass 498.0,exhibiting the same intensity asthe target ion 497.7 u, wouldincrease the measuring signal forthe target ion 497.7 by only 4 %.
This acquisition was preceded by‘tuning’ with a peak width ofw1/2 = 0.35 u. For ‘tuning’ withw1/2 = 0.30 u, it was even possi-ble to keep the intensity of bothsimulated ions (497.4 u and 498.0u) at < 1.5 % of the height ofmass 497.7 u for more than teninjections. This stable high reso-lution offered by a single quad-rupole MS system comes at theexpense of sensitivity. The re-porting level of 0.05 pg/g perindividual substance in the matrixcan, nevertheless, be realized, asdemonstrated by the measuringvalues for HpCDD = 0.08 pg/gand HpCDF = 0.05 pg/g in amaize grain sample (Figure 3).
A simple MS system, generallyoffering only a nominal resolu-tion, can prove to be sufficientlyrobust and sensitive for routineoperation with a resolution of R ≈ 2000. A further increase in Rwill be limited by quadrupoletechnology. At a mass accuracyof effectively only 0.1 u, separa-
tion intervals of less than 0.1 umake no sense. In addition, thetrueness of mass calibration,which responds very sensitivelyto temperature fluctuations, mustbe guaranteed for each injection.
For this purpose PCB209 can beused, which serves as a recoverystandard for the spiked 13C sur-rogates and as a ‘lock mass.’ Con-stant peak area ratios of the sig-nals at m/z = 497.7, 498.0 and497.4 document the correct masscalibration in emulation of theauto-adjusting function in HRMSinstruments. The 13C-labeled1,2,3,7,8-PeCDF with additionalSIM ions at m/z = 351.7, 352.1 aswell as 339.6 and 340.0 can serveas a second ‘lock mass’ for thelower mass ranges.
References
[1] Regulation (EC) No. 1883/2006
www.minagric.gr/en/data/Reg
(EC)%201883_2006.pdf
[2] Schwind et al. (2009) cited in
www.bfr.bund.de: comment
002/2011
[3] Regulation (EC) No. 1881/2006
[4] www.fmsenvironmental.com
[5] www.wikipedia.com: search term
‘mass spectrometry’
SUMMARYThe use of a single quadrupole MS formonitoring maximum values of dioxinsand PCBs is entirely in accordance withEC No. 1883/2006 as long as the 25 %maximum value is observed. This appliesin more than 99 % of routine analyses.Newer single quadrupole MS instru-ments attain the required sensitivity.Optimized matrix removal and robustoperation at an increased resolution of R ≈ 2000 improves specificity and, there-fore, provides an alternative for HRMS.
Dr. Roland Herterich, Dipl. Geo-ecologist
Doctorate thesis (Bayreuth) on nitro phe-nols and pesticides in the atmosphere. With BLS-Analytik GmbH & Co.KG, Germany (Dioxins Laboratory) since [email protected]
Dr. rer. nat. Dipl.-Ing. Stephan Schröder
Studied Biotechnology at the TU Berlin,Germany.Doctorate thesis (Universität Bonn) onthe analysis of protein-bound oligosac-charides. Product specialist at ShimadzuDeutschland GmbH in Duisburg, Germany since [email protected]

SOFTWARE Shimadzu News 2/2011
24
A strong team
Still young, but already wellestablished – on the marketsince just 18 months, the
GC-2010 Plus is already knownas a top class instrument for sen-sitivity, reproducibility and sam-ple throughput. Shimadzu nowmakes this technology availablealso to customers who have cho-sen network-oriented chromatog-raphy data software (client/serverCDS).
Empower is a leading client/serv-er CDS system. In the Worksta-tion or Enterprise scale-up con-figurations, the software offerscontrol of numerous liquid or gaschromatography systems over alocal network (LAN). Operationof an instrument occurs viaLAC/E boxes which are connect-ed to the Empower server via anetwork. Shimadzu’s HPLC andGC systems are integrated inEmpower using suitable instru-ment drivers via the LAC/E box.In addition, chromatography sys-tems of other manufacturers canbe operated in conjunction withother LAC/E boxes.
All chromatograms, methodsand results available via thenetwork
The Empower driver for the GC-2010 Plus has been available since2011. It is compatible with Em-
power Version 2 and also withEmpower Version 3. Control ofthe AOC-20i auto-injector for amaximum of 15 samples with orwithout the AOC-20s (for up to150 samples) is implemented aswell. The same driver also con-trols the GC-2014 series – forcapillary and packed columns –as well as the GC-2010 (predeces-sor to the GC-2010 Plus).
Several GC systems can be con-trolled via a LAC/E box (ofcourse, also in combination withShimadzu’s liquid chromatogra-phy systems). The LAC/E boxstores intermediary chromato-graphic data before these are sent
to the Empower server via thenetwork and are finally stored inan Oracle database. All chro-matograms, methods and resultsare available to all users afterappropriate authentication.
Regulatory environmentswith dedicated access rights
The strengths of Empower lie inits deployment in regulatoryenvironments, where multipleusers usually have access to vari-ous analytical instruments andmeasured data. This requires adedicated administration ofaccess rights to instruments andresults. Safeguarding and security
of all results always has the high-est priority.
The database is safeguardedagainst unauthorized access. Atthe same time, all accompanyinginformation (metadata) is com-prehensively documented andstored together with the results –who measured data, when, howand where, or who changed theevaluation? Suitable databasefunctions also simplify searchingfor results tremendously. Com-plemented by a flexible and ver-satile reporting system for clear
presentation of results, the soft-ware is ideal for laboratories withdifferent chromatography sys-tems and high sample through-put.
Software handling remains verystraightforward. For Shimadzusystems, the ‘Configuration Wiz-ard’ (Figure 2) supports the con-figuration of the GC as well as itscorrect integration in the Em-power system. Shimadzu’s provenGCsolution and LabSolutionssoftware packages have beenadapted for entering methodparameters (Figure 3). Empowerdistinguishes between the instru-ment, data processing and report-ing method, which can be sum-marized in a ‘Method Set.’
Four user interfaces facilitate operation
To operate the GC system, thesoftware offers four different userinterfaces – from a ‘Quick Start’
Figure 1: Empower and GC-2010 Plus
Figure 2: GC Instrument Configuration Wizard
Figure 3: GC-2010 Plus method develop-
ment in Empower
EmpowerTM meets

25
SOFTWAREShimadzu News 2/2011
Figure 4: GC-2010 Plus diagnostic functions supported in Empower
Figure 5: Empower ‘Quick Start’ interface screen
Figure 6: GC-2010 Plus instrument
monitor in Empower
interface to an interface thatenables instrument access via theWorld Wide Web. When the useris away from the gas chromato-graph, the diagnostic functions ofthe GC-2010 Plus enable check-ing of the instrument’s status andits operational readiness. Whenthe GC operates normally withinits parameters the test result is‘Pass’; should discrepancies arise,the test result ‘Fail’ will be dis-played (Figure 4). In this case, anextensive report can be viewedvia ‘View Results’, listing thefunction which does not work inaccordance with the require-ments.
The Empower Quick Start inter-face enables straightforward andfast generation of chromatogra-phic results. It offers all ofEmpower’s features, althoughonly the essential functions aredisplayed (Figure 5). An instru-ment monitor informs the user of the current values of the mostimportant GC parameters (Fig-ure 6).
Expandable company-wideand still secure
Empower’s architecture and datasecurity are true benefits – thesoftware can where necessary beexpanded from a single-user to acompany-wide system. Storage ofchromatography data in the inte-grated database simplifies dataretrieval via intelligent searchprocesses, offering securityagainst unauthorized access as
well as comprehensively docu-menting all user interactions.
In this way, the Empower soft-ware is especially suitable forlarge companies dealing withextensive analytics and high sam-ple throughput, whereby researchgroups worldwide can be grantedprincipal access to results. Theclient/server structure does notrequire the user to always worknear the instrument; on the con-
GC-2010 Plus
trary, multiple instruments can bemonitored from a distance. Relia-bility of a GC system and exten-sive diagnostic functions, whichsignal necessary maintenancesteps in time, are thereby essen-tial.
Fast answers on analytical questions
Due to globalization of compa-nies, analytical data of projectteams are being processed world-wide and results are used inresearch and development. Theexcellent sensitivity with highestprecision of the GC-2010 Plushas extended the applicationcapabilities of gas chromatogra-phy significantly. Moreover, itsshort analysis time contributes tofinding fast answers to analyticalquestions. By bringing togetherthe GC-2010 Plus and Empower,performance, reliability, flexibili-ty and security are now com-bined in one package. Together,software and hardware form anideal team to meet the futuredemands and challenges in chemi-cal analysis.

TIPS & TRICKS Shimadzu News 2/2011
26
24-hour support for TOC
In addition, Shimadzu has updat-ed the ‘Virtual Advisor’ for thenew TOC-L series: toclva.ssi.shimadzu.com/ offers a range of in-formation relating to the TOC-Lfamily. After a short registrationstep, the following sections areaccessible for TOC users:
The ‘TOC Virtual Advisor’website was originallylaunched for the TOC-V
series. It graphically depicts theoperation and maintenance of theTOC instrument. This successfuland helpful tool is now also avail-able for the LC and LCMS series.
Tips and tricks for the TOC-L – ‘TOC-L Virtual Adviso
TOC-LCPH with autosampler ASI-L
Figure 1: Start-up
page of the TOC-L
Virtual Advisor
Figure 2: The flow lines of a
TOC-LCPH analyzer
1. ‘My Account’Here, users can virtuallyassemble their TOC analysissystem. In total, up to fivesystems can be defined andsaved. The content of the following webpages is thentailored to the selected sys-tem.
2. ‘Using This Site’lists tips for optimal use ofthis website
3. ‘Contacts’offers contact forms for sales questions, servicerequirements and feedback
4. ‘Reference’This page offers useful infor-mation on TOC determina-tion. A glossary explains themost important definitionsaround TOC and TNb analy-sis. All material safety data

27
TIPS & TRICKSShimadzu News 2/2011
-L instrumentsr’ on the internet
Figure 3: Filling the drain of the dehumidifier Figure 4: Animation of replacement of the catalyst combustion tube
sheets for compounds used inTOC/TN determination canbe found in the section‘MSDS’ and are available inpdf format.
5. ‘Flowlines’shows the flowlines withinthe instruments that the userhas specified under point 1. If, for instance the TOC-LCPH with ASI-L and SSM-5000A was selected, all threeinstruments are shown, and,after choosing the appropriateinstrument, the flowlines canbe animated.
6. ‘Daily Maintenance’Below each menu item for the various systems, a listingof suitable tests that enableoptimal use of the measuringsystem can be found. Activat-ing one opens an additionalwindow with the required
explanation. Testing the de-humidifier drain vessel levelis, for instance, explained infigure 3.
7. ‘Perodic Maintenance’offers advice for large mainte-nance work such as replacingcatalysts or exchangingsyringes, tubing and O-rings.Using short animated movies,maintenance is explained step-by-step.
8. ‘Troubleshooting’This page is presently underconstruction. It will soon bepossible to examine manyphenomena extensively. After selecting the currentphenomenon, the respectiveflow line opens and a certainarea is marked. The systemthen asks a specific questionon this area, which the usercan answer with ‘yes’ or ‘no.’
The system will then advise onsolving the problem, or the usercan move to the next area with afurther question. In this way, theproblem is analyzed step-by-step.Until this page has been complet-ed, the ‘Troubleshooting’ page ofthe TOC-V Virtual Advisor canbe used as reference.
The website is continuouslyexpanded. At present it is avail-able in English. Additional lan-guages are in preparation.

PRODUCTS Shimadzu News 2/2011
28
I nfrared spectroscopy is themost important analyticalmethod for unequivocal
identification of samples in awide application range such aspharmaceuticals, foods, polymersor mineral oils. Shimadzu hasbeen developing infrared spec-trometers since 1956. With theIRAffinity-1 and the IRPrestige-21the company currently offersmodern system configurationswhich are tailor-made for theanalysis of the most diverse sam-ple materials.
On the 55th anniversary of intro-duction of its infrared spectros-copy instruments, Shimadzuoffers pre-configured productpackages at anniversary prices –customized for the analysis ofpolymers or mineral oils.
Numerous analytical problemsand tasks can be solved usingFTIR spectroscopy with ATRtechniques such as the conven-
measuring windows that can beinterchanged easily. A Ge-crystal(Germanium) plate can be usedfor strongly absorbing materialsand a ZnSe-crystal (Zinc Sele-
nide) is used for standardmeasurements. The dif-
ferent physical char-acteristics of thecrystals enable theradiation to pene-trate to various
depths in the sam-ple.
The FTIR polymer anniver-sary package includes the follow-ing system components:• IRAffinity-1 FTIR-spectropho-
tometer• Certified polystyrene film for
instrument validation• Polymer library• SilverGate™ with ZnSe- and
Ge-crystals.
FTIR mineral oil accessory package
In mineral oil analysis carried outin accordance with DIN, liquidcuvettes are used for FAME (Fat-ty Acid Methyl Ester) analysis,carbon black content or othercharacteristics. These methodsrequire solvents, the consumptionof which every user would verymuch like to reduce.
Efforts are increasingly focussingon solving these analytical prob-lems using ATR techniques. Indoing so, however, close atten-tion must be paid to the concen-tration of the required parameterin oil. Multiple-reflectance ATRincreases the required layer thick-ness needed for this application.In an instrument package formineral oil, Shimadzu offers asolution meeting every need. Andall of this is combined with soft-ware for the automated determi-nation of, for instance, FAME,
tional horizontal ATR or single-reflectance ATR. The units can beoperated easily, and generateresults within a few secondswithout complex sample prepara-tion.
FTIR polymeranniversary pack-age
Polymer analysis inthe ATR mode isdependent on thephysical state of thepolymer. Is the materialsoft, hard or extremely hard? Oris the polymer colorless, lightlycolored or, in pure visual terms,pitch black? Depending on theseproperties, the accessories used inthe analysis must be interchange-able.
SPECAC’s SilverGate™ accessoryunit offers an attractive solution.The ‘Evolution’ series featuresmeasuring plates with integrated
Anniversary package forFTIR’s birthday 55 years of FTIR spectroscopy
Figure 1: Influence of layer thickness on the spectrum of a hydraulic oil.
Three ATR spectra are shown: single-reflectance (green, ~ 4 μm layer thickness),
triple-reflectance (red, 12 μm layer thickness) and multiple-reflectance
(black, > 20 μm layer thickness). The layer thickness refers to a range of around
1000 cm-1 in the infrared spectrum.
20
1800
1/cm
% T
1750 1700 1650 1600 1550 1500 1450 1400 1350 1300 1250 1200 1150 1100 1050 1000 950 900 850 800 750 700 650
25
30
35
40
45
50
55
60
65
70
75
80
85
90
95
105
100
hydrocarbons according to theBrandes method and more.
An ideal solution is to use both –the liquid cell for detection limitanalysis and ATR for routineanalysis. When using ATR, thisshould be a system offering theH-ATR (Horizontal AttenuatedTotal Reflectance) technique.
The FTIR mineral oil anniversarypackage consists of the followingsystem components:• IRAffinity-1 FTIR-spectropho-
tometer • Certified polystyrene film for
instrument validation• Certified 100 μm liquid cuvette
with CaF2 (Calcium Fluoride)windows
• SPECAC Gateway with ZnSe-crystal and equipped with a liq-uid sample trough.
FTIR basic starter package
An additional package, for in-stance for conventional infraredspectroscopy in the transmissiontechnique for liquids and pow-ders is the FTIR basic starterpackage, consisting of the follow-ing system components:• IRAffinity-1 FTIR-spectropho-
tometer• Certified polystyrene film for
instrument validation• ‘Liquid package’ for transmis-
sion measurements consistingof various measuring cells
• ‘Powder package’ for transmis-sion measurements consistingof an effective hand press.
We will gladly send you additional
information. Please enter the cor-
responding number on the reply
card or order via Shimadzu’s News
App or News WebApp. Info 400