NewPotentialLigand-ReceptorSignalingLoopsinOvarian ... · 2006; 66(22): 10709-19) Introduction...
12
New Potential Ligand-Receptor Signaling Loops in Ovarian Cancer Identified in Multiple Gene Expression Studies Giancarlo Castellano, 1 James F. Reid, 2,4 Paola Alberti, 1 Maria Luisa Carcangiu, 3 Antonella Tomassetti, 1 and Silvana Canevari 1 1 Unit of Molecular Therapies, Department of Experimental Oncology, 2 Department of Experimental Oncology, and 3 Unit of Pathology C, Department of Pathology, Istituto Nazionale Tumori; and 4 Molecular Genetics of Cancer Group, Fondazione Istituto FIRC di Oncologia Molecolare, Milan, Italy Abstract Based on the hypothesis that gene products involved in the same biological process would be coupled at transcriptional level, a previous study analyzed the correlation of the gene expression patterns of ligand-receptor (L-R) pairs to discover potential autocrine/paracrine signaling loops in different cancers (Graeber and Eisenberg. Nat Genet 2001; 29:295). By refining the starting database, a list of 511 L-R pairs was compiled, combined to eight data sets from a single pathology, epithelial ovarian cancer, and examined as a proof- of-principle of the statistical and biological validity of the correlation of the L-R gene expression patterns in cancer. Analysis revealed a Bonferroni-corrected significant correla- tion of 105 L-R pairs in at least one data set and, by systematic analysis, identified 39 more frequently correlated L-R pairs, 7 of which were already biologically confirmed. In four data sets examined for an L-R correlation associated with patient survival time, 15 L-R pairs were significantly correlated in short surviving patients in two of the data sets. Immunohis- tochemical analysis of one of the newly identified correlated L-R pairs (i.e., EFNB3-EPHB4) revealed the correlated expres- sion of ephrin-B3 and EphB4 proteins in 45 of 55 epithelial ovarian tumor samples (P < 0.0001). Together, these data not only support the validity of cross-comparison analysis of gene expression data because known and expected correlations were confirmed but also point to the promise of such analysis in identifying new L-R signaling loops in cancer. (Cancer Res 2006; 66(22): 10709-19) Introduction Traditional hypothesis-driven strategies for identifying molecu- lar markers of a disease state were based on individual gene analysis. Although useful, these approaches could fail to identify biological relevant differences that are based on subtle but multiple and coordinated gene alterations more than on quantitative expression differences of a single gene. Several recent critical advances, such as sequencing of the human genome and the development of high-throughput techniques for identifying global gene expression, have dramatically accelerated the speed of research. Although extrapolation of biological mechanisms from the generated gene lists remains a major challenge, the availability of numerous published microarray analyses, rich in the amount of high-quality data (1), and the public access to the original data sets have accelerated the developments of new types of analysis. In fact, the combination of hypothesis- and discovery-based research resulted in the development of new techniques, based on aggregated gene sets (reviewed in ref. 2), to extract useful information from microarray gene expression data sets (3, 4) and to interpret genome-wide expression profiles (5). The use of pathway-oriented approaches has enabled the interrogation and dissection of multiple disrupted signaling path- ways during oncogenesis. Accordingly, an algorithm was designed (6) that is suitable for detecting dysregulation of autocrine/ paracrine ligand-receptor (L-R) signaling loops. This approach was based on the hypothesis that two gene products participating in a common function show correlated expression as reflected in their correlated transcription levels. However, to date, this algorithm has only been applied in a single study, in which five cancer-based gene expression data sets originated from different cancers were analyzed separately (6). In principle, this type of analysis could provide a tool to compare independently derived gene expression data sets, even those obtained from different platforms, and to obtain more consistent results than those from single gene analysis. Here, we examined patterns of correlated gene expression of ligands and receptors with respect to their role as possible activated signaling pathways involved in epithelial ovarian cancer (EOC). The unfavorable statistics in EOC patients reflects, in part, the poor understanding of the molecular pathogenesis and progression of the disease. As a step toward gaining insight into the mechanisms underlying this pathology and toward identifying potentially meaningful activated signaling pathways, we exploited a previously described L-R database (6) to select frequently correlated L-R pairs by a ‘‘systematic’’analysis of EOC publicly available data sets of gene expression. Analysis across eight selected EOC microarray data sets gave 39 L-R pairs with significant and consistent correlation in at least three data sets. In four data sets, analysis of samples from EOC patients with short-term versus long-term survival showed that 15 L-R pairs were associated to short-term survival in two of the data sets. EFNB3-EPHB4 pair was one of the newly identified L-R pairs and the coexpression was confirmed at the protein level by immunohistochemistry on epithelial ovarian tumors. Materials and Methods Public gene expression data. Twenty-five publications on microarray analysis of gene expression profiling of EOC samples were recorded from PubMed 5 (from January 2000 to May 2005). Gene expression data were Note: Supplementary data for this article are available at Cancer Research Online (http://cancerres.aacrjournals.org/). Requests for reprints: Antonella Tomassetti, Unit of Molecular Therapies, Department of Experimental Oncology, Istituto Nazionale Tumori, 20133 Milan, Italy. Phone: 39-02-23902568; Fax: 39-02-23903073; E-mail: antonella.tomassetti@ istitutotumori.mi.it. I2006 American Association for Cancer Research. doi:10.1158/0008-5472.CAN-06-1327 5 http://www.ncbi.nlm.nih.gov/entrez/query.fcgi?DB=pubmed. www.aacrjournals.org 10709 Cancer Res 2006; 66: (22). November 15, 2006 Research Article Research. on July 6, 2020. © 2006 American Association for Cancer cancerres.aacrjournals.org Downloaded from Published OnlineFirst November 6, 2006; DOI: 10.1158/0008-5472.CAN-06-1327
Transcript of NewPotentialLigand-ReceptorSignalingLoopsinOvarian ... · 2006; 66(22): 10709-19) Introduction...

New Potential Ligand-Receptor Signaling Loops in Ovarian
Cancer Identified in Multiple Gene Expression Studies
Giancarlo Castellano,1James F. Reid,
2,4Paola Alberti,
1Maria Luisa Carcangiu,
3
Antonella Tomassetti,1and Silvana Canevari
1
1Unit of Molecular Therapies, Department of Experimental Oncology, 2Department of Experimental Oncology, and 3Unit of Pathology C,Department of Pathology, Istituto Nazionale Tumori; and 4Molecular Genetics of Cancer Group, Fondazione IstitutoFIRC di Oncologia Molecolare, Milan, Italy
Abstract
Based on the hypothesis that gene products involved in thesame biological process would be coupled at transcriptionallevel, a previous study analyzed the correlation of the geneexpression patterns of ligand-receptor (L-R) pairs to discoverpotential autocrine/paracrine signaling loops in differentcancers (Graeber and Eisenberg. Nat Genet 2001; 29:295).By refining the starting database, a list of 511 L-R pairs wascompiled, combined to eight data sets from a single pathology,epithelial ovarian cancer, and examined as a proof-of-principle of the statistical and biological validity of thecorrelation of the L-R gene expression patterns in cancer.Analysis revealed a Bonferroni-corrected significant correla-tion of 105 L-R pairs in at least one data set and, by systematicanalysis, identified 39 more frequently correlated L-R pairs,7 of which were already biologically confirmed. In four datasets examined for an L-R correlation associated with patientsurvival time, 15 L-R pairs were significantly correlated inshort surviving patients in two of the data sets. Immunohis-tochemical analysis of one of the newly identified correlatedL-R pairs (i.e., EFNB3-EPHB4) revealed the correlated expres-sion of ephrin-B3 and EphB4 proteins in 45 of 55 epithelialovarian tumor samples (P < 0.0001). Together, these data notonly support the validity of cross-comparison analysis of geneexpression data because known and expected correlationswere confirmed but also point to the promise of such analysisin identifying new L-R signaling loops in cancer. (Cancer Res2006; 66(22): 10709-19)
Introduction
Traditional hypothesis-driven strategies for identifying molecu-lar markers of a disease state were based on individual geneanalysis. Although useful, these approaches could fail to identifybiological relevant differences that are based on subtle but multipleand coordinated gene alterations more than on quantitativeexpression differences of a single gene. Several recent criticaladvances, such as sequencing of the human genome and thedevelopment of high-throughput techniques for identifying globalgene expression, have dramatically accelerated the speed ofresearch. Although extrapolation of biological mechanisms from
the generated gene lists remains a major challenge, the availabilityof numerous published microarray analyses, rich in the amount ofhigh-quality data (1), and the public access to the original data setshave accelerated the developments of new types of analysis. In fact,the combination of hypothesis- and discovery-based researchresulted in the development of new techniques, based onaggregated gene sets (reviewed in ref. 2), to extract usefulinformation from microarray gene expression data sets (3, 4) andto interpret genome-wide expression profiles (5).
The use of pathway-oriented approaches has enabled theinterrogation and dissection of multiple disrupted signaling path-ways during oncogenesis. Accordingly, an algorithm was designed(6) that is suitable for detecting dysregulation of autocrine/paracrine ligand-receptor (L-R) signaling loops. This approachwas based on the hypothesis that two gene products participating ina common function show correlated expression as reflected in theircorrelated transcription levels. However, to date, this algorithm hasonly been applied in a single study, in which five cancer-basedgene expression data sets originated from different cancers wereanalyzed separately (6). In principle, this type of analysis couldprovide a tool to compare independently derived gene expressiondata sets, even those obtained from different platforms, and toobtain more consistent results than those from single gene analysis.
Here, we examined patterns of correlated gene expression ofligands and receptors with respect to their role as possible activatedsignaling pathways involved in epithelial ovarian cancer (EOC).The unfavorable statistics in EOC patients reflects, in part, the poorunderstanding of the molecular pathogenesis and progression ofthe disease. As a step toward gaining insight into the mechanismsunderlying this pathology and toward identifying potentiallymeaningful activated signaling pathways, we exploited a previouslydescribed L-R database (6) to select frequently correlated L-R pairsby a ‘‘systematic’’ analysis of EOC publicly available data sets of geneexpression. Analysis across eight selected EOC microarray data setsgave 39 L-R pairs with significant and consistent correlation in atleast three data sets. In four data sets, analysis of samples from EOCpatients with short-term versus long-term survival showed that 15L-R pairs were associated to short-term survival in two of the datasets. EFNB3-EPHB4 pair was one of the newly identified L-R pairsand the coexpression was confirmed at the protein level byimmunohistochemistry on epithelial ovarian tumors.
Materials and Methods
Public gene expression data. Twenty-five publications on microarrayanalysis of gene expression profiling of EOC samples were recorded from
PubMed5 ( from January 2000 to May 2005). Gene expression data were
Note: Supplementary data for this article are available at Cancer Research Online(http://cancerres.aacrjournals.org/).Requests for reprints: Antonella Tomassetti, Unit of Molecular Therapies,
Department of Experimental Oncology, Istituto Nazionale Tumori, 20133 Milan,Italy. Phone: 39-02-23902568; Fax: 39-02-23903073; E-mail: [email protected].
I2006 American Association for Cancer Research.doi:10.1158/0008-5472.CAN-06-1327 5 http://www.ncbi.nlm.nih.gov/entrez/query.fcgi?DB=pubmed.
www.aacrjournals.org 10709 Cancer Res 2006; 66: (22). November 15, 2006
Research Article
Research. on July 6, 2020. © 2006 American Association for Cancercancerres.aacrjournals.org Downloaded from
Published OnlineFirst November 6, 2006; DOI: 10.1158/0008-5472.CAN-06-1327
available in only eight of these publications and used for our analysis(Table 1A). These data sets were generated by hybridization on cDNA
and oligonucleotide DNA chips in three and five cases, respectively. No
additional data manipulation was done to the downloaded processed
gene expression matrices, except for the thresholding of negative valuesto 0 for MAS4-processed data (data sets III and VII). All probe sets and
cDNA clones from each platform were assigned National Center for
Biotechnology Information (NCBI) gene identifications (7), which were usedto match common genes across data sets based on the most recent plat-
form annotation from either NetAffx6 (release 2005-12-20; ref. 8) or Stanford
SOURCE7 (release 2005-10-26; ref. 9). All data (clinical, platform annotation
and expression) were stored in BioConductor8 (10) expression sets.L-R pair compilation. The list of L-R pairs was manually curated by a
PubMed search for proteins interacting on the cell surface. The list was
integrated to database of L-R partners (DLRP) contained in the database of
interacting proteins9 (6), yielding 199 ligands and 157 receptors for a total of511 L-R pairs.
Correlation analysis of L-R pairs. Expression measurements of each
L-R pair were extracted from each data set through their respective NCBI
gene identification. When more than one cDNA clone or probe set matcheda given gene, all possible pairs where considered. Pearson and Spearman
correlation coefficients were computed for each L-R pair across each data
set; Ps for each correlation were computed using the function cor.test of the
software package R10 and adjusted for multiple testing using the Bonferronimethod. The complete list of the extracted correlations for each data set is
available.11
Tissue samples and study subjects. The pathologic and clinicalcharacteristics of EOC patients (Table 1B) were derived from published
data (11–18) or, for our previous study (data set II), by up-to-date clinical
information. Data sets I to IV reported clinical information (Table 1B) that
allowed subgrouping of the samples according to overall survival. Criteria forsubcategorization in short-term and long-term survivors have been reported
for data sets I, III, and IV (11, 13, 14); for data set II (12), the 36 samples
from patients with available follow-up data were split into two groups to
obtain median overall survival times similar to those reported in ref. 11.Immunohistochemistry. All clinical specimens used in this study were
obtained with Institutional Review Board approval and informed consent to
use excess biological material for investigative purposes from allparticipating patients. Immunohistochemistry was done using nine routine
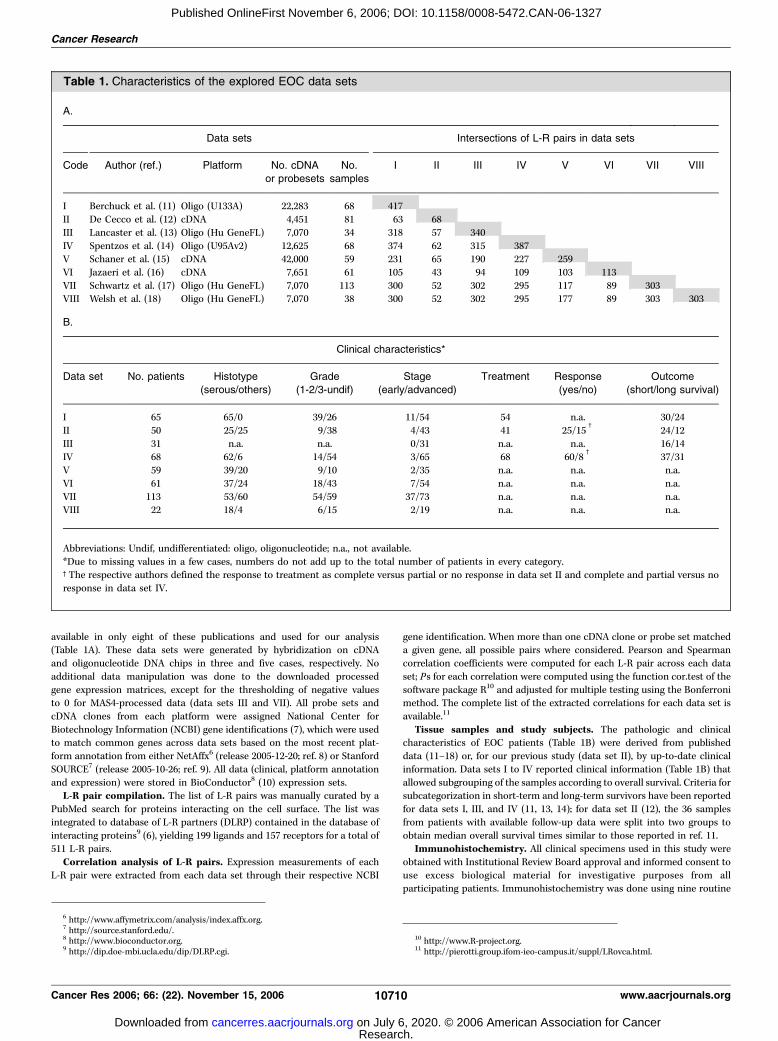
Table 1. Characteristics of the explored EOC data sets
A.
Data sets Intersections of L-R pairs in data sets
Code Author (ref.) Platform No. cDNA
or probesets
No.
samples
I II III IV V VI VII VIII
I Berchuck et al. (11) Oligo (U133A) 22,283 68 417
II De Cecco et al. (12) cDNA 4,451 81 63 68
III Lancaster et al. (13) Oligo (Hu GeneFL) 7,070 34 318 57 340
IV Spentzos et al. (14) Oligo (U95Av2) 12,625 68 374 62 315 387V Schaner et al. (15) cDNA 42,000 59 231 65 190 227 259
VI Jazaeri et al. (16) cDNA 7,651 61 105 43 94 109 103 113
VII Schwartz et al. (17) Oligo (Hu GeneFL) 7,070 113 300 52 302 295 117 89 303VIII Welsh et al. (18) Oligo (Hu GeneFL) 7,070 38 300 52 302 295 177 89 303 303
B.
Clinical characteristics*
Data set No. patients Histotype
(serous/others)
Grade
(1-2/3-undif)
Stage
(early/advanced)
Treatment Response
(yes/no)
Outcome
(short/long survival)
I 65 65/0 39/26 11/54 54 n.a. 30/24
II 50 25/25 9/38 4/43 41 25/15c
24/12
III 31 n.a. n.a. 0/31 n.a. n.a. 16/14IV 68 62/6 14/54 3/65 68 60/8
c37/31
V 59 39/20 9/10 2/35 n.a. n.a. n.a.
VI 61 37/24 18/43 7/54 n.a. n.a. n.a.
VII 113 53/60 54/59 37/73 n.a. n.a. n.a.VIII 22 18/4 6/15 2/19 n.a. n.a. n.a.
Abbreviations: Undif, undifferentiated: oligo, oligonucleotide; n.a., not available.
*Due to missing values in a few cases, numbers do not add up to the total number of patients in every category.cThe respective authors defined the response to treatment as complete versus partial or no response in data set II and complete and partial versus no
response in data set IV.
6 http://www.affymetrix.com/analysis/index.affx.org.7 http://source.stanford.edu/.8 http://www.bioconductor.org.9 http://dip.doe-mbi.ucla.edu/dip/DLRP.cgi.
10 http://www.R-project.org.11 http://pierotti.group.ifom-ieo-campus.it/suppl/LRovca.html.
Cancer Research
Cancer Res 2006; 66: (22). November 15, 2006 10710 www.aacrjournals.org
Research. on July 6, 2020. © 2006 American Association for Cancercancerres.aacrjournals.org Downloaded from
Published OnlineFirst November 6, 2006; DOI: 10.1158/0008-5472.CAN-06-1327

tissue blocks and two commercially available tissue arrays (Ovary cancer,AccuMax Array, Petagen and CJ1 Human, Ovary cancer, and Super Bio
Chips) essentially as described. Fifty-five samples were selected by the
pathologist (M.L.C.) and classified in tumors of low malignant potential
(LMP) and carcinomas of either grade II and III. Conditions for antigenretrieval and dilution for each antibody were optimized as suggested by the
manufacturer. For staining with mouse monoclonal anti-EphB4 antibody
(Zymed, San Francisco, CA), tissue sections were heated for 20 minutes in
citrate buffer (pH 6) in a pressure cooker; for staining with the rabbitpolyclonal anti-ephrin-B3 antiserum (Zymed), antigen retrieval was by
pepsin digestion (0.4% in 0.01 N HCl for 30 minutes at 37jC). Negative
control slides omitting primary antibody were included in all assays. Two
observers (M.L.C. and A.T.) classified independently slides as negative, weak/moderate, or strong staining based on intensity and percentage of positive
cells. Statistical analysis of L-R correlated expression levels in the same sample
was done using m2 test. Ps < 0.05 (two sided) were considered significant.
Results
Generation of DLRP-rev1. The original list of L-R pairs presentin the DLRP database was refined based on a literature search forproteins interacting on the cell surface and whose interactionswere experimentally proved, which yielded 25 ligands and 33
receptors for a total of 42 added L-R pairs. The revised list (DLRP-
rev1) used in this study consisted of 199 ligands, 157 receptors,
and 511 L-R pairs involved in autocrine/paracrine signaling in
eukaryotic cells (Supplementary Table S1). This final set of L-R
pairs was subdivided according to functional consequence of the
L-R interactions [i.e., angiogenesis factor (4%), chemokine (15%),
cytokine (23%), growth factor (42%), motility/adhesion factor
(14%), and others (2%)].Identification of correlated L-R pairs in EOC. Analysis of the
eight data sets revealed extensive variability in the L-R pairscoverage according to platform type and time of manufacture(Table 1A). The L-R pairs from DLRP-rev1 extractable from theeight selected EOC microarray data sets (shaded values) rangedfrom 68 to 417 (excluding redundant pairs) and represented amaximum of 82.5% DLRP-rev1 pairs in data set I to <13.5% DLRP-rev1 pairs in data set II. The matrix measuring the overlap providesthe possible cross-comparisons between the data sets (Table 1A).
When multiple probe sets or clones matching a single gene(ligand or receptor) were present, each one was consideredseparately. Both Spearman and Pearson correlation coefficientswere computed for each L-R pair in each data set. Becausecorrelation coefficients (q and r) and the associated Ps assigned foreach L-R pair were very similar (data not shown), only the Pearsoncorrelation values were considered. A total of 105 L-R pairs hadsignificant correlation after Bonferroni correction in at least onedata set (Supplementary Table S2). These L-R pairs weresubsequently analyzed across the other data sets for concordantcorrelations. After several arbitrary selections (e.g., Bonferroni-corrected significant correlations in two or three data sets and/orsignificant correlations in at least half of the informative data sets),L-R pairs that showed a significant correlation after Bonferronicorrection in at least one data set and have significant correlations,without Bonferroni correction, in at least two other data sets wereconsidered potentially meaningful. Forty-one L-R pairs showed asignificant correlation in at least three data sets (Table 2). Thisarbitrary cutoff produced a substantial number of L-R pairs shownpreviously to be implicated in EOC molecular signaling [PDGFA-PDGFRA (19), CXCL12-CXCR4 (20), CSF1-CSF1R (21, 22), FGF2-FGFR4 (12), IGF2-IGF2R (23), HGF-MET (24), and PLAU-PLAUR
(25)]. Correlations were consistently positive or negative for 36 and3 L-R pairs, respectively, whereas 2 L-R pairs, CCL4-CCR5 andTGFB1-TGFBR2, showed a contradictory trend of correlation indifferent data sets and were excluded from further analysis. Amongthe 39 consistently correlated L-R pairs, 3 pairs are involved inangiogenesis, 13 are chemokine family members, 9 are cytokinefamily members, 11 mediate growth, and 5 regulate cell migration/adhesion.Identification of L-R pairs correlated in EOC subgroups
according to survival. Not all tested samples were from surgicalspecimens (the number ranged from 22 in data set VIII to 113 indata set VII) and the type of clinical information was variable in thedifferent data sets. Based on the available clinical information, EOCsamples could be subdivided according to histotype, grading,staging, response to treatment, and outcome (Table 1B). Becausethe identification of predictive markers of poor outcome is still amajor challenge in ovarian cancer, we focused our further analysison data sets I to IV where outcome data were available. Thesamples used for this analysis were all, but three in data set IV, atlate stage of the disease and several other clinical variables areknown and recorded (see respective references for the criteria forsubcategorization in short-term and long-term survivors andfurther clinical information). Samples with complete clinicalhistory were classified according to length of survival (Table 3A),and the correlation analysis was focused on L-R correlation inshort-term and long-term survivors. Initially, we selected L-R pairsthat were significantly correlated in short-term survivors and notor inversely correlated in long-term survivors from the same dataset. When no correction for multiple test was done, 166 L-R pairswere found significantly correlated (Supplementary Table S3). NoL-R pairs showed a significant correlation after Bonferronicorrection, probably due to the limited number of samples foreach subgroup (range, 16-37). When we arbitrarily based ourexternal statistical validation on L-R pairs showing a concordantcorrelation in at least two data sets in short-term survivors, thenumber of correlated L-R pairs dropped to 15 pairs (Table 3B). Asupport to our selection criteria comes from the observation thatin about a third of the pairs significantly correlated in short-termsurvivors (LIF-IL6ST, FGF1-FGFR1, FGF4-FGFR3, and FGF7-FGFR2) we observed in the long-term survivors from the samedata set an opposite correlation. The ability to discriminatebetween patient subsets, as well as the inclusion of the IGF2-IGF2Rpair already associated with a worse prognosis (23), furthersupported the validity of our selection. Correlations in short-termsurvivors were consistently positive or negative for 10 and 5 L-Rpairs, respectively. Of the selected L-R pairs, only IGF2-IGF2R andEFNB3-EPHB4 were identified as correlated also in the entire casematerial (see Table 2), suggesting that the weight of correlation inshort-term survivors only was very strong.
Among the 15 correlated L-R pairs, 1 is involved in angiogenesis,1 and 2 belong to the chemokine and cytokine families,respectively, 6 mediate growth, and 5 regulate cell migration/adhesion. Furthermore, we found that four of the six growth-associated L-R pairs exhibited a negative correlation and four ofthe five motility/adhesion factors belong to the ephrin-Ephreceptor family.EFNB3-EPHB4 correlated protein expression in epithelial
ovarian tumor specimens. Emerging information on the roles ofephrin proteins and their receptors links them to tumorigenesisand invasion (26). Although the EFNB3-EPHB4 L-R pair is taggedin the original DLRP as experimentally determined, it is not
L-R Signaling Loops in Ovarian Cancer
www.aacrjournals.org 10711 Cancer Res 2006; 66: (22). November 15, 2006
Research. on July 6, 2020. © 2006 American Association for Cancercancerres.aacrjournals.org Downloaded from
Published OnlineFirst November 6, 2006; DOI: 10.1158/0008-5472.CAN-06-1327

described as a canonical pair in normal or cancer signaling (27).In our analysis, the EFNB3-EPHB4 pair was significantlycorrelated in four of seven EOC data sets and, in two of them,the correlation was also significant only in the short-termsurvivor subgroup. Thus, immunohistochemical analysis was
carried out to determine whether these proteins are coexpressedin epithelial ovarian tumors. Consistent with previous reports(28, 29), anti-ephrin-B3 antibodies selectively reacted witharterioles, whereas they did not stain venous vessels and thesurrounding stromal cells (Fig. 1A, 1). Anti-EphB4 was strongly
Table 2. L-R pairs with statistically significant correlation coefficient (Pearson r) after Bonferroni correction
Data set
Ligand Receptor I II III IV
r P r P r P r P
Angiogenesis factorsANGPT1 TEK 0.51 0.00001 0.48 0.00445 0.39 0.00111
PDGFA* PDGFRA 0.27 0.02669 0.61 0.00012 0.56 0.00000PGF FLT1 0.32 0.00866 0.46 0.1280 �0.07 0.70975 0.57 0.00000
ChemokinesCCL19 CCR7 0.38 0.00168 0.41 0.01582 0.64 0.00000CCL2 CCR1 0.61 0.00000 0.29 0.9390 0.42 0.00035
CCL21 CCR7 0.34 0.00629 0.23 0.19880 0.66 0.00000CCL25 CCR9 0.21 0.9280 0.36 0.3774 0.59 0.00000CCL3 CCR1 0.46 0.00616 0.64 0.00000CCL4 CCR1 0.68 0.00000 0.53 0.00120
CCL4* CCR5 0.47 0.00007 0.66 0.00002CCL5* CCR1 0.65 0.00000 0.63 0.00006 0.51 0.00001CCL5 CCR5 0.56 0.000000 0.55 0.00081 0.62 0.00000CCL8 CCR1 0.68 0.00000 0.56 0.00063 0.55 0.00000CCL8* CCR5 0.47 0.00009 0.56 0.00061 0.45 0.00010CXCL12 CXCR4 0.23 0.06559 0.40 0.00063 0.15 0.38706 0.36 0.00248
PPBP IL8RB 0.34 0.00516 0.34 0.05235 0.48 0.00004Cytokines
CSF1 CSF1R 0.57 0.00000 0.54 0.00104 0.22 0.06877
EPO EPOR 0.29 0.01721 �0.27 0.12662 0.71 0.00000IL12B IL12RB2 0.26 0.03760 0.74 0.00000 0.46 0.00007
IL15 IL15RA 0.56 0.00000 0.12 0.49169 0.16 0.36727 0.65 0.00000IL15 IL2RB 0.32 0.00973 �0.13 0.45284 0.20 0.25731 0.48 0.00004IL16 CD4 0.51 0.00002 0.56 0.00000IL6 IL6ST �0.22 0.08025 0.48 0.00369 0.26 0.03214
LIF IL6ST 0.29 0.01964 0.35 0.04139 0.55 0.00000TNF TNFRSF1B 0.31 0.01291 0.22 0.20230 0.59 0.00000
Growth factors
FGF2 FGFR4 0.31 0.01141 0.78 0.00000 0.06 0.73822 0.43 0.00023FGF4 FGFR4 0.29 0.01739 0.63 0.00006 0.58 0.00000IGF2 IGF2R 0.26 0.03718 0.94 0.00000 0.45 0.00744 �0.08 0.53725
INHA ACVR1B 0.29 0.01752 0.35 0.04142 0.57 0.00000INHBA* ACVR1B �0.38 0.00173 0.40 0.01778 0.53 0.00000JAG1* NOTCH3 �0.37 0.00221 0.35 0.00699 0.42 0.01336 �0.40 0.00077
NRG1* ERBB3 0.38 0.00196 �0.15 0.17804 �0.39 0.02144 0.54 0.00000TGFB1* TGFBR2 0.49 0.00003 0.06 0.57487 0.30 0.08760 �0.59 0.00000TGFB1* TGFBR3 �0.15 0.23348 0.38 0.00057 �0.14 0.43299 �0.17 0.16731TGFB2* TGFBR2 �0.23 0.06019 �0.07 0.54554 0.26 0.14050 �0.28 0.02238
TGFB3* TGFBR3 0.05 0.69678 �0.45 0.00007 �0.07 0.67513 �0.10 0.41893
Motility/adhesion factors
EFNB1 EPHB2 �0.08 0.53813 0.15 0.39382 0.17 0.16673EFNB3 EPHB4 0.16 0.20784 0.39 0.00030 0.16 0.36816 0.26 0.03221
HGF* MET 0.66 0.00000 0.62 0.00000 0.63 0.00007 0.29 0.01634
PLAU PLAUR 0.51 0.00002 �0.22 0.06034 0.56 0.00057 0.57 0.00000THBS1* CALR �0.38 0.00170 0.12 0.30819 �0.40 0.01854 �0.71 0.00000
NOTE: Shaded areas identify significant correlation (P < 0.05); bold characters identify a significant correlation after Bonferroni correction.
*Discordant correlations observed for the indicated L-R pairs in different data sets.
Cancer Research
Cancer Res 2006; 66: (22). November 15, 2006 10712 www.aacrjournals.org
Research. on July 6, 2020. © 2006 American Association for Cancercancerres.aacrjournals.org Downloaded from
Published OnlineFirst November 6, 2006; DOI: 10.1158/0008-5472.CAN-06-1327

reactive with the cell membrane of a colonic adenocarcinomabut was negative on stromal cells surrounding the tumor cells(Fig. 1A, 2). Representative staining with anti-ephrin-B3 and anti-EphB4 antibodies on different histotypes of EOCs is shown (Fig.1B, 1-8). Anti-ephrin-B3 staining was strong and well defined onthe tumor cell membrane of all the different histotypes with somestaining in the cytoplasm of tumor and stromal cells; some tumornuclei also showed weak/moderate reactivity (Fig. 1B, 1, 3, and 7).Anti-EphB4 antibody strongly stained the membrane of tumor
cells of all the different histologic types (Fig. 1, 5-7), with theexception of clear cell carcinoma where was observed only aweak/moderate cytoplasmic staining of the tumor cells. Basically,no reactivity was observed with anti-EphB4 antibody on stromalcells surrounding EOC cells. On the mucinous-type tumor, thestaining with both anti-ephrin-B3 and anti-EphB4 appearedreduced in some cells because of the cytoplasmic filling bymucous (Fig. 1B, 3 and 4). The anti-ephrin-B3 and anti-EphB4staining on 8 LMP ovarian tumors and 47 EOC is summarized in
Table 2. L-R pairs with statistically significant correlation coefficient (Pearson r) after Bonferroni correction (Cont’d)
Data set
Ligand Receptor V VI VII VIII
r P r P r P r P
Angiogenesis factorsANGPT1 TEK 0.12 0.46809 0.11 0.39983 0.15 0.10732
PDGFA* PDGFRA 0.34 0.33128 0.22 0.08806 0.31 0.00069 �0.40 0.00682
PGF FLT1 0.22 0.16112 �0.15 0.11226 0.22 0.15490
ChemokinesCCL19 CCR7 0.24 0.01008 0.40 0.00670
CCL2 CCR1 0.34 0.02727 0.08 0.54674 �0.10 0.31264
CCL21 CCR7 �0.03 0.73401 0.32 0.03172CCL25 CCR9 �0.04 0.65497 0.53 0.00019
CCL3 CCR1 0.41 0.00676 0.11 0.42242
CCL4 CCR1 0.47 0.00000CCL4* CCR5 0.43 0.00000 �0.49 0.00074CCL5* CCR1 0.23 0.13944 �0.26 0.04306 0.50 0.000000CCL5 CCR5 0.50 0.00000 �0.09 0.54865
CCL8 CCR1 0.39 0.23182 0.41 0.00001CCL8* CCR5 0.36 0.00008 �0.51 0.00045CXCL12 CXCR4 0.84 0.00114 0.44 0.00043 0.15 0.10563 �0.21 0.17967
PPBP IL8RB 0.30 0.00108 0.47 0.00119
CytokinesCSF1 CSF1R �0.51 0.13434 0.43 0.00000 0.08 0.58686
EPO EPOR �0.24 0.45348 0.10 0.42689 �0.03 0.73626 0.37 0.01296
IL12B IL12RB2 �0.10 0.27461 0.05 0.73704
IL15 IL15RA 0.14 0.38690 0.39 0.00194 0.40 0.00001 0.14 0.34901IL15 IL2RB 0.13 0.41234 0.40 0.00001 0.03 0.82490
IL16 CD4 0.50 0.00099 �0.07 0.44860 0.11 0.46750
IL6 IL6ST 0.26 0.09457 0.50 0.00006 �0.06 0.53944 0.08 0.61314
LIF IL6ST 0.36 0.01835 0.40 0.00170 0.04 0.63902 0.04 0.78033TNF TNFRSF1B �0.44 0.15133 0.52 0.00002 0.07 0.44745 �0.21 0.16690
Growth factors
FGF2 FGFR4 �0.13 0.39052 �0.18 0.15994 0.11 0.22822 �0.09 0.56650FGF4 FGFR4 �0.05 0.63463 �0.11 0.46907
IGF2 IGF2R 0.29 0.05498 0.50 0.00004 0.03 0.79188 0.52 0.00032
INHA ACVR1B �0.11 0.25881 0.12 0.44518
INHBA* ACVR1B �0.42 0.00667 0.27 0.00382 �0.25 0.10428JAG1* NOTCH3 0.32 0.04281 �0.22 0.08996 0.02 0.80421 0.90 0.00000NRG1* ERBB3 0.41 0.18542 �0.11 0.24770 0.40 0.00713
TGFB1* TGFBR2 0.33 0.03760 �0.36 0.00512 0.25 0.00645 0.16 0.30638
TGFB1* TGFBR3 0.37 0.01582 0.26 0.04996 �0.01 0.92640 �0.43 0.00347TGFB2* TGFBR2 �0.35 0.02167 �0.04 0.75038 �0.05 0.59681 �0.57 0.00005TGFB3* TGFBR3 �0.63 0.02884 0.35 0.00900 �0.21 0.02277 �0.27 0.07156
Motility/adhesion factors
EFNB1 EPHB2 0.62 0.00002 0.55 0.00000 0.18 0.06284 0.36 0.01616EFNB3 EPHB4 0.16 0.62466 0.36 0.00009 0.46 0.00171
HGF* MET 0.35 0.02479 �0.29 0.02389
PLAU PLAUR 0.55 0.00018 0.32 0.00056 0.35 0.01933THBS1* CALR 0.41 0.00554 �0.09 0.47552 �0.16 0.08381 0.10 0.51591
L-R Signaling Loops in Ovarian Cancer
www.aacrjournals.org 10713 Cancer Res 2006; 66: (22). November 15, 2006
Research. on July 6, 2020. © 2006 American Association for Cancercancerres.aacrjournals.org Downloaded from
Published OnlineFirst November 6, 2006; DOI: 10.1158/0008-5472.CAN-06-1327

Table 4. Twenty-seven of the 30 serous tumors showed correlatedexpression of both ephrin-B3 and EphB4 proteins. Within LMPserous tumors, one showed weak staining with anti-ephrin-B3antibody and one was not reactive with anti-EphB4 antibody.Within serous EOCs, only one showed no reactivity with eitherantibody, and two samples with weak reactivity with anti-EphB4antibody showed strong and negative staining with anti-ephrin-B3 antibody, respectively. In all mucinous (6) and endometroid(9) tumors, the staining intensities of both antibodies werecorrelated. By contrast, 4 of 10 clear cell EOCs were not reactivewith anti-EphB4 antibody and 4 samples showed strongreactivity; only 1 sample showed no reactivity with anti-ephrin-B3 antibody. Contingency analysis by m2 test indicated asignificant (P < 0.0001) correlation between ephrin-B3 and EphB4protein expression levels.
Discussion
Initial evidence in Saccharomyces cerevisiae (30) indicated thatgenes with similar expression profiles were more likely to encodeinteracting proteins and, very recently, similar results wereobtained for the human genome (31). A pioneering studyanalyzed the correlation of the gene expression patterns of L-R
pairs with the aim of discovering potential autocrine/paracrinesignaling loops in different cancers (6). Although limited by thedata sets available at the time (one for each pathology) and bythe relative paucity of L-R pairs extractable from them (range, 33-68), that study identified a large number (>30) of known and newsignaling loops as potentially active in diffuse large B-celllymphoma, leukemia, and colon and breast cancer. Thesystematic evaluation of multiple data sets promises to yieldmore reliable and more valid results because it is based on alarger number of samples and the effects of individual study-specific biases are weakened (32).
In the present study, we refined the starting list of L-R pairs andapplied it to numerous data sets from a single pathology, EOC, asproof-of-principle that the correlation of gene expression patternsof L-R pairs is statistically and biologically valid. Integration of therefined DLRP-rev1 database with eight EOC data sets of geneexpression matched a larger number of L-R pairs (range, 68-417)compared with the initial study and enabled the identification of105 L-R pairs showing significant correlation after Bonferronicorrection. To select potential candidates, the 105 L-R pairsidentified as significantly correlated in a single data set wereanalyzed across the other data sets to obtain independentstatistical validation of their correlation. Several arbitrary selection
Table 3. L-R pairs differentially correlated between short-term and long-term survivors in at least two EOC data sets
Short-term survivors
I II III IV
A. Clinical information
No. patients 30 24 16 37Median survival 17.5 33 <24 30
B. Ligand receptor r P r P r P r P
Angiogenesis
VEGF* NRP2 �0.47 0.00904 �0.45 0.03113 �0.27 0.12045Chemokines
CCL11c
CCR5 0.37 0.04626 0.64 0.00742 0.37 0.02743
CytokinesIL15 IL2RG 0.53 0.00289 0.24 0.44834 0.41 0.11299 0.50 0.00250
LIF IL6ST 0.41 0.02364 0.42 0.01200
Growth factors
FGF1 FGFR1 �0.39 0.03474 0.04 0.86895 �0.43 0.00921FGF13 FGFR1 0.55 0.00183 �0.42 0.10211 0.37 0.02907
FGF4 FGFR3 �0.38 0.03647 �0.63 0.00845 �0.02 0.89576
FGF7c
FGFR2 �0.44 0.01409 �0.54 0.03016 �0.36 0.03573
FGF8 FGFR3 �0.50 0.00462 �0.59 0.01658 0.12 0.48082IGF2
cIGF2R 0.37 0.04457 0.92 0.00000 0.75 0.00092 0.14 0.42554
Motility adhesion factors
EFNA5* EPHA5 0.39 0.03221 0.62 0.01100 0.21 0.22593EFNB2 EPHA4 0.41 0.02537 0.15 0.58643 0.59 0.00019
EFNB2 EPHB2 0.38 0.03926 0.47 0.06614 0.41 0.01429
EFNB3 EPHB4 �0.31 0.09764 0.44 0.03028 0.18 0.49978 0.50 0.00245
TNC* ANXA2 0.45 0.01360 0.70 0.00271 �0.09 0.59351
NOTE: Shaded areas identify significant correlations (P < 0.05) that differentiate short-term from long-term survivors.
*Discordant correlations observed for the indicated L-R pairs in different data sets.cDiscordant correlations observed for the indicated L-R pairs in the same data set.
Cancer Research
Cancer Res 2006; 66: (22). November 15, 2006 10714 www.aacrjournals.org
Research. on July 6, 2020. © 2006 American Association for Cancercancerres.aacrjournals.org Downloaded from
Published OnlineFirst November 6, 2006; DOI: 10.1158/0008-5472.CAN-06-1327

cutoffs were applied and some were also tested experimentally. Inour analysis, we gaged statistical validation as well as the existingknowledge about EOC biology. For the entire case material, wefocused on EOC biology, selecting a cutoff based on the correctidentification of all seven L-R pairs already implicated in EOC(12, 19–25) and on means of down-weighting data sets representingfewer initial L-R pairs and/or samples. Our selection criteriareduced the potential L-R candidates to 39 pairs, 7 of which alreadybiologically confirmed.
Because the case materials analyzed were biased towardadvanced-stage disease (see Table 1B), the identified L-R pairsare likely associated to EOC biology as well as to EOC progression.The identification of pathways involved in epithelial ovarianoncogenesis awaits gene expression analysis of a larger series ofearly-stage case material.
The availability of clinical information about overall survival infour data sets provided an opportunity to evaluate correlationspotentially associated with late-stage tumor progression. Thestatistical cutoff adopted for the entire case material (correlationsignificance after Bonferroni correction) was not informative,probably due to the smaller number of patients included in eachdata set. When a less stringent level of significance (P < 0.05)was considered, 166 L-R pairs were identified. To validate thesecorrelations, possibly including numerous false-positives, due tothe limited knowledge of EOC progression, we should rely only onvalidation using statistical independent data sets. Our selectedcutoff reduced the list of potential candidates to 15 L-R pairs.Only advanced stage EOC patients were selected for analysis of
L-R correlation with survival, but the limited number of availablecases precluded a further subcategorization. Thus, several clinicalvariables, such as difference in age, histology, residual diseaseafter debulking, and type of treatment, could confound theresults. Some of these factors have been already taken intoaccount in the original articles describing the subcategorizationin short-term and long-term survivors (11, 13, 14) and seemed notto play an important role in determining patient’s outcome.However, the relevance of candidate L-R pairs in diseaseprogression should be interpreted with caution and awaitvalidation in larger data sets and confirmation in biological/functional assays.
To retrieve further information about the biological significanceof our data, we evaluated the distribution of the identified L-R pairsin functional classes (Fig. 2). The distribution of the L-R pairspotentially correlated to EOC biology after cross-analysis (Fig. 2C),compared with their relative presence in the DLRP-rev1 databaseand in correlation analysis of single data sets (Fig. 2A), clearlyindicated a significant increase in L-R pairs involved in chemokinesignaling (33% versus 15% and 23%, respectively) accompanied by adecrease in growth factors and cognate relevant receptor L-R pairs(28% versus 42% and 37%, respectively). By contrast, analysis of L-Rpairs potentially correlated to EOC progression in late stageimplicated mainly motility/adhesion signaling molecules [33% aftercross-analysis (Fig. 2D) versus 14% in DLRP-rev1 database and incorrelation analysis (Fig. 2B)] and suggested a switch toward anegative correlation in the class of growth factors (see Table 3).These observations are consistent with current hypotheses linking
Table 3. L-R pairs differentially correlated between short-term and long-term survivors in at least two EOC data sets (Cont’d)
Long-term survivors
I II III IV
A. Clinical information
No. patients 24 12 14 31Median survival 107.5 71 >84 >47
B. Ligand receptor r P r P r P r P
Angiogenesis
VEGF* NRP2 �0.31 0.13698 �0.16 0.62375 �0.48 0.00467Chemokines
CCL11c
CCR5 0.19 0.38031 0.57 0.02524 0.25 0.15438
CytokinesIL15 IL2RG 0.35 0.09470 0.31 0.61209 0.15 0.58851 0.22 0.21322
LIF IL6ST 0.29 0.16797 �0.71 0.00000
Growth factors
FGF1 FGFR1 0.41 0.04807 0.12 0.66879 0.23 0.20495FGF13 FGFR1 0.27 0.20500 �0.04 0.87376 0.17 0.33862
FGF4 FGFR3 0.33 0.11983 0.65 0.00929 0.37 0.03483
FGF7c
FGFR2 0.60 0.00179 0.31 0.25912 �0.53 0.00142
FGF8 FGFR3 0.26 0.21225 0.39 0.15425 0.38 0.02975IGF2
cIGF2R 0.22 0.30655 0.80 0.01670 �0.17 0.54510 �0.30 0.09501
Motility adhesion factors
EFNA5* EPHA5 0.32 0.12698 0.17 0.53370 0.37 0.03245EFNB2 EPHA4 0.07 0.74276 0.46 0.08787 0.15 0.39864
EFNB2 EPHB2 0.39 0.06175 0.21 0.45219 �0.31 0.08244
EFNB3 EPHB4 �0.09 0.69181 0.28 0.38473 0.12 0.67314 0.12 0.50100
TNC* ANXA2 0.10 0.63268 �0.46 0.08542 0.39 0.02466
L-R Signaling Loops in Ovarian Cancer
www.aacrjournals.org 10715 Cancer Res 2006; 66: (22). November 15, 2006
Research. on July 6, 2020. © 2006 American Association for Cancercancerres.aacrjournals.org Downloaded from
Published OnlineFirst November 6, 2006; DOI: 10.1158/0008-5472.CAN-06-1327

epithelial ovarian oncogenesis and progression to inflammation(33) and EOC progression to a dysregulation of cell-cell and cell-stroma interactions (34).
The relevance of DLRP database revision based on newbiological knowledge is supported by the observation that at leasttwo of the significantly correlated L-R pairs, PLAU-PLAUR(identified in the EOC biology analysis) and TNC-ANXA2 (identifiedin the EOC progression analysis), could be retrieved by implemen-tation of the originally published database. That database wasfocused mainly on autocrine signaling, although it contained pairsable to signal also or only through paracrine interactions, and ourimplementation was partially dedicated to increasing identificationof motility/adhesion-involved molecules. Our L-R pair selection,together with the observation that the cancer specimens in all datasets contained 70% to 80% tumor cells but were not micro-dissected, enabled retrieval of most of the potential tumor-tumorand tumor-stroma autocrine/paracrine interactions.
Despite the improvements relative to the initial study, severalpotential limitations and bias, as outlined in the original article (6),could also affect our analyses. In fact, the intra-data set evaluationwas strongly limited by the number of samples considered (<40 indata sets III and VIII), and the inter-data set comparison might bebiased by the type and size of the platform, by the selected genespresent on each array, and by the type of samples included in eachdata set.
Both previous (6) and present studies identified some negativelycorrelated L-R pairs. By cross-comparison analysis of L-R pairscorrelated with EOC biology, only 3 pairs with consistently negativecorrelation versus 36 with consistently positive correlation wereobserved. When only the L-R pairs correlated with short-termsurvivors were considered, the percentage of negatively correlatedpairs strongly increased (5 of 15). This may reflect either a lack ofautocrine/paracrine signaling due to decreased levels of a ligand/receptor whenever its cognate receptor/ligand is produced orthe transcriptional activation of an alternative ligand/receptor tocompensate for the absence of the physiologic signaling. Biolog-ical/functional validation is necessary to identify the underlyingmechanism.
Figure 1. Expression of ephrin-B3 and EphB4 proteins on normal tissues andovarian tumor specimens. Immunostaining with anti-ephrin-B3 and EphB4antibodies was done on paraffin-embedded tissues. Positive controls wereas follows: A, 1, normal ovarian arterioles (anti-ephrin-B3); 2, colonicadenocarcinoma (anti-EphB4). B, 1 and 5, serous ovarian carcinoma; 2 and 6,mucinous ovarian carcinoma; 3 and 7, endometroid ovarian carcinoma; 4 and 8,clear cell ovarian carcinoma. Original magnification, �200.
Table 4. Immunostaining results in 55 paraffin-embedded samples from epithelial ovarian tumors
Tumor histotype* Total cases(% correlated expression)
Ephrin-B3 EphB4
Negative Weak/moderatec
Strongc
Negative Weak/moderatec
Strongc
Serous 30 (90)
LMP 4 — 1 3 1 1 3
EOCb
26 2 6 20 1 6 20Mucinous 6 (100)
LMP 3 — 1 2 — 1 2
EOC 3 — 1 2 — 1 2
Endometrioid 9 (100)LMP 1 — 1 — 1
EOC 8 1 7 1 7
Clear cell 10 (30) 1 2 7 4 2 4
NOTE: Ephrin-B3 and EphB4 protein expression levels were significantly correlated (P < 0.0001) by m2 test.
*Routine tissue blocks and commercially available tissue arrays.cWeak/moderate or strong staining of 80% of tumor cells in the tissue section.bEOCs comprise grade II and III tumors.
Cancer Research
Cancer Res 2006; 66: (22). November 15, 2006 10716 www.aacrjournals.org
Research. on July 6, 2020. © 2006 American Association for Cancercancerres.aacrjournals.org Downloaded from
Published OnlineFirst November 6, 2006; DOI: 10.1158/0008-5472.CAN-06-1327

The identification of known and expected correlations in ouranalysis strongly supports the validity of our cross-comparisonanalysis and potentially implicated the newly identified correlatedL-R pairs in EOC biology and progression. Among the newlyidentified correlated L-R pairs, we focused on EFNB3-EPHB4. Ephreceptors, divided into A and B type based on interaction withtheir ligands, comprise the largest group of membrane tyrosinekinase receptors, and their ligands, ephrins, are also membranebound ( for review, see ref. 26). The paracrine/juxtacrine signalingis cell contact dependent and can potentially trigger a bidirec-tional response leading to either cell repulsion or invasion. Atpresent, only the EphA2 protein has been reported to beassociated with aggressive ovarian carcinomas (35, 36). Although
very little is known about how Eph receptors contribute to theoncogenic process, EphB4 overexpression has been reported incolon (37), breast (38), and prostate carcinomas (39) and positivelyassociated with malignant potential, clinical grade and stage inendometrial carcinoma (40, 41). Furthermore, EphB4 de novoexpression in a breast carcinoma cell line contributes to tumorprogression by attracting endothelial cells and inducing neo-vascularization, thus promoting tumor cell proliferation andsurvival (42). Signaling through a paracrine loop between EphB4and any member of B-class ephrins is required for directionalgrowth of developing vasculature, confirming that the EphB4receptor can interact with and signal through an overexpressedephrin-B3 ligand (28). Our immunohistochemical analysis showed
Figure 2. Flow chart diagram of theexperimental design showing the stepsof analysis and the percentage distributionof L-R pairs according to functionalconsequence of the L-R interaction. Afterextraction of L-R pairs from EOC data sets,all tumor samples were examined withrespect to EOC biology (A and C ) and onlythe samples from patients with short-termsurvival were used for EOC progressionanalysis (B and D ). A and B, the classdistribution of L-R pairs from correlationanalysis of eight and four data sets,respectively. C and D, the class distributionof selected L-R pairs after cross-analysis.See results for cutoff criteria.
L-R Signaling Loops in Ovarian Cancer
www.aacrjournals.org 10717 Cancer Res 2006; 66: (22). November 15, 2006
Research. on July 6, 2020. © 2006 American Association for Cancercancerres.aacrjournals.org Downloaded from
Published OnlineFirst November 6, 2006; DOI: 10.1158/0008-5472.CAN-06-1327

the correlated expression of ephrin-B3 and EphB4 in 45 of 55ovarian tumor specimens. Clear cell was the only EOC histotype, inwhich the correlation was absent. A potential explanation rests inrecent evidence, by gene expression profiling, that EOC clear cellhistotype can be reconducted to normal uterine endometrium(43), instead of ovarian surface epithelium from which the vastmajority of EOC originate (44). The correlated expression in allthe other histotypes was similar irrespectively of grading andmalignant potential. Indeed, seven of eight LMP tumors resultedto have correlated expression of ephrin-B3/EphB4 and only onedid not express EphB4. LMP ovarian tumors represent a subsetof EOC with a very good prognosis, and most of them showmolecular characteristics distinct from carcinomas (45, 46). Hence,analysis of a larger number of samples would allow evaluating thesignificance of ephrin-B3/EphB4 correlated expression in thissubset of tumors. The Eph-ephrin signaling occurs at themembrane level, but it was shown recently that the L-R pairephrin-B2-EphB4, once activated by cell-cell contact, is endocy-tosed as a consequence of a cytoskeletal rearrangement thatrequires RAC function (47). Accordingly, the cytoplasmic localiza-tion of both ephrin-B3 and EphB4 in our analysis might reflectinternalization after signaling activation. Overall, our observationssuggest the involvement of paracrine/juxtacrine signaling through
ephrin-B3-EphB4 in EOC progression. Further studies are neededto address this possibility and their potential usefulness asphenotypic and/or prognostic markers.
Together, our data point to the feasibility of a cross-platformanalysis of gene expression data to identify L-R signaling loops inother oncotypes, provided that a sufficient number of data sets areavailable and that the principle of external validation in indepen-dent data sets is uphold. The proposed bioinformatic systematicsearch of L-R coexpression might also prove useful in conjunctionwith conventional protein-protein interaction methods of predic-tion. Once supported and validated by biological/functional assays,the L-R coexpression search might provide insight into the biologyof a specific oncotype and could open avenue to the design ofspecifically targeted new diagnostic and therapeutic tools.
Acknowledgments
Received 4/17/2006; revised 7/14/2006; accepted 8/30/2006.Grant support: Associazione Italiana Ricerca Cancro and CARIPLO Foundation (S.
Canevari).The costs of publication of this article were defrayed in part by the payment of page
charges. This article must therefore be hereby marked advertisement in accordancewith 18 U.S.C. Section 1734 solely to indicate this fact.
We thank M.A. Pierotti for helpful and stimulating discussion, Y. Yarden for criticalreading of the article, and Gloria Bosco for secretarial assistance.
Cancer Research
Cancer Res 2006; 66: (22). November 15, 2006 10718 www.aacrjournals.org
References1. Group TTABPW. Expression profiling-best practicesfor data generation and interpretation in clinical trials.Nat Rev Genet 2004;5:229–37.2. Segal E, Yelensky R, Koller D. Genome-wide discoveryof transcriptional modules from DNA sequence andgene expression. Bioinformatics 2003;19 Suppl 1:i273–82.3. Alon U, Barkai N, Notterman DA, et al. Broadpatterns of gene expression revealed by clusteringanalysis of tumor and normal colon tissues probed byoligonucleotide arrays. Proc Natl Acad Sci U S A 1999;96:6745–50.4. Zamecnik P, Aghajanian J, Zamecnik M, Goodchild J,Witman G. Electron micrographic studies of transportof oligodeoxynucleotides across eukaryotic cell mem-branes. Cell Biol 1994;91:5156–60.
5. Subramanian A, Tamayo P, Mootha VK, et al. Gene setenrichment analysis: a knowledge-based approach forinterpreting genome-wide expression profiles. Proc NatlAcad Sci U S A 2005;102:17745–50.6. Graeber TG, Eisenberg D. Bioinformatic identificationof potential autocrine signaling loops in cancers fromgene expression profiles. Nat Genet 2001;29:295–300.7. Wheeler DL, Barrett T, Benson DA, et al. Databaseresources of the National Center for BiotechnologyInformation. Nucleic Acids Res 2006;34:D173–80.8. Liu G, Loraine AE, Shigeta R, et al. NetAffx: Affymetrixprobesets and annotations. Nucleic Acids Res 2003;31:82–6.9. Diehn M, Sherlock G, Binkley G, et al. SOURCE: aunified genomic resource of functional annotations,ontologies, and gene expression data. Nucleic Acids Res2003;31:219–23.10. Gentleman RC, Carey VJ, Bates DM, et al. Biocon-ductor: open software development for computationalbiology and bioinformatics. Genome Biol 2004;5:R80.11. Berchuck A, Iversen ES, Lancaster JM, et al. Patternsof gene expression that characterize long-term survivalin advanced stage serous ovarian cancers. Clin CancerRes 2005;11:3686–96.12. De Cecco L, Marchionni L, Gariboldi M, et al. Geneexpression profiling of advanced ovarian cancer: char-acterization of molecular signature involving thefibroblast growth factor 2. Oncogene 2004;23:8171–83.13. Lancaster JM, Dressman HK, Whitaker RS, et al. Geneexpression patterns that characterize advanced stage
serous ovarian cancers. J Soc Gynecol Investig 2004;11:51–9.14. Spentzos D, Levine DA, Ramoni MF, et al. Geneexpression signature with independent prognosticsignificance in epithelial ovarian cancer. J Clin Oncol2004;22:4700–10.15. Schaner ME, Ross DT, Ciaravino G, et al. Geneexpression patterns in ovarian carcinomas. Mol Biol Cell2003;14:4376–86.16. Jazaeri AA, Yee CJ, Sotiriou C, et al. Geneexpression profiles of BRCA1-linked, BRCA2-linked,and sporadic ovarian cancers. J Natl Cancer Inst 2002;94:990–1000.17. Schwartz DR, Kardia SL, Shedden KA, et al. Geneexpression in ovarian cancer reflects both morphologyand biological behavior, distinguishing clear cell fromother poor-prognosis ovarian carcinomas. Cancer Res2002;62:4722–9.18. Welsh JB, Zarrinkar PP, Sapinoso LM, et al. Analysisof gene expression profiles in normal and neoplasticovarian tissue samples identifies candidate molecularmarkers of epithelial ovarian cancer. Proc Natl Acad SciU S A 2001;98:1176–81.19. Matei D, Emerson RE, Lai YC, et al. Autocrineactivation of PDGFRa promotes the progression ofovarian cancer. Oncogene 2005;25:2060–9.20. Scotton CJ, Wilson JL, Scott K, et al. Multiple actionsof the chemokine CXCL12 on epithelial tumor cells inhuman ovarian cancer. Cancer Res 2002;62:5930–8.21. Toy EP, Chambers JT, Kacinski BM, Flick MB,Chambers SK. The activated macrophage colony-stimulating factor (CSF-1) receptor as a predictor ofpoor outcome in advanced epithelial ovarian carcinoma.Gynecol Oncol 2001;80:194–200.22. Bonafe N, Gilmore-Hebert M, Folk NL, et al.Glyceraldehyde-3-phosphate dehydrogenase binds tothe AU-Rich 3¶ untranslated region of colony-stimulatingfactor-1 (CSF-1) messenger RNA in human ovariancancer cells: possible role in CSF-1 posttranscriptionalregulation and tumor phenotype. Cancer Res 2005;65:3762–71.23. Sayer RA, Lancaster JM, Pittman J, et al. High insulin-like growth factor-2 (IGF-2) gene expression is anindependent predictor of poor survival for patients withadvanced stage serous epithelial ovarian cancer. Gyne-col Oncol 2005;96:355–61.24. Di Renzo MF, Olivero M, Katsaros D, et al. Over-
expression of the MET/HGF receptor in ovarian cancer.Int J Cancer 1994;58:658–62.25. Van der Burg MEL, Henzen-Logmans SC, Berns EMJJ,et al. Expression of urokinase-type plasminogen activa-tor (uPA) and its inhibitor PAI-1 in benign, borderline,malignant primary, and metastatic ovarian tumors. Int JCancer 1996;69:475–9.26. Surawska H, Ma PC, Salgia R. The role of ephrins andEph receptors in cancer. Cytokine Growth Factor Rev2004;15:419–33.27. Murai KK, Pasquale EB. ‘Eph’ective signaling: for-ward, reverse, and crosstalk. J Cell Sci 2003;116:2823–32.28. Helbling PM, Saulnier DM, Brandli AW. The receptortyrosine kinase EphB4 and ephrin-B ligands restrictangiogenic growth of embryonic veins in Xenopus laevis .Development 2000;127:269–78.29. Batlle E, Bacani J, Begthel H, et al. EphB receptoractivity suppresses colorectal cancer progression.Nature 2005;435:1126–30. Erratum in: Nature 2005;436:881.30. Ge H, Liu Z, Church GM, Vidal M. Correlationbetween transcriptome and interactome mappingdata from Saccharomyces cerevisiae . Nat Genet 2001;29:482–6.31. Hahn A, Rahnenfuhrer J, Talwar P, Lengauer T.Confirmation of human protein interaction data byhuman expression data. BMC Bioinformatics 2005;6:112.32. Warnat P, Eils R, Brors B. Cross-platform analysis ofcancer microarray data improves gene expressionbased classification of phenotypes. BMC Bioinformatics2005;6:265.33. Balkwill F. Cancer and the chemokine network. NatRev Cancer 2004;4:540–50.34. Cavallaro U, Christofori G. Cell adhesion andsignalling by cadherins and Ig-CAMs in cancer. NatRev Cancer 2004;4:118–32.35. Thaker PH, Deavers M, Celestino J, et al. EphA2expression is associated with aggressive features inovarian carcinoma. Clin Cancer Res 2004;10:5145–50.36. Han L, Dong Z, Qiao Y, et al. The clinical significanceof EphA2 and Ephrin A-1 in epithelial ovarian carcino-mas. Gynecol Oncol 2005;99:278–86.37. Stephenson SA, Slomka S, Douglas EL, Hewett PJ,Hardingham JE. Receptor protein tyrosine kinase EphB4is up-regulated in colon cancer. BMC Mol Biol 2001;2:15.38. Berclaz G, Andres AC, Albrecht D, et al. Expression ofthe receptor protein tyrosine kinase myk-1/htk in
Research. on July 6, 2020. © 2006 American Association for Cancercancerres.aacrjournals.org Downloaded from
Published OnlineFirst November 6, 2006; DOI: 10.1158/0008-5472.CAN-06-1327

L-R Signaling Loops in Ovarian Cancer
www.aacrjournals.org 10719 Cancer Res 2006; 66: (22). November 15, 2006
normal and malignant mammary epithelium. BiochemBiophys Res Commun 1996;226:869–75.39. Xia G, Kumar SR, Masood R, et al. EphB4 expressionand biological significance in prostate cancer. CancerRes 2005;65:4623–32.40. Takai N, Ueda T, Nishida M, Nasu K, Miyakawa I. Therelationship between oncogene expression and clinicaloutcome in endometrial carcinoma. Oncol Rep 2004;4:511–20.41. Takai N, Miyazaki T, Fujisawa K, Nasu K, MiyakawaI. Expression of receptor tyrosine kinase EphB4 andits ligand ephrin-B2 is associated with malignant
potential in endometrial cancer. Oncol Rep 2001;8:567–73.42. Noren NK, Lu M, Freeman AL, Koolpe M, PasqualeEB. Interplay between EphB4 on tumor cells andvascular ephrin-B2 regulates tumor growth. Proc NatlAcad Sci U S A 2004;101:5583–8.43. Marquez RT, Baggerly KA, Patterson AP, et al.Patterns of gene expression in different histotypes ofepithelial ovarian cancer correlate with those in normalfallopian tube, endometrium, and colon. Clin Cancer Res2005;11:6116–26.44. Sainz dlC, Eichhorn JH, Rice LW, et al. Histologic
transformation of benign endometriosis to early epithe-lial ovarian cancer. Gynecol Oncol 1996;60:238–44.45. Shih I, Kurman RJ. Molecular pathogenesis of ovarianborderline tumors: new insights and old challenges. ClinCancer Res 2005;11:7273–9.46. Bonome T, Lee JY, Park DC, et al. Expressionprofiling of serous low malignant potential, low-grade,and high-grade tumors of the ovary. Cancer Res 2005;65:10602–12.47. Marston DJ, Dickinson S, Nobes CD. Rac-dependenttrans -endocytosis of ephrinBs regulates Eph-ephrincontact repulsion. Nat Cell Biol 2003;5:879–88.
Research. on July 6, 2020. © 2006 American Association for Cancercancerres.aacrjournals.org Downloaded from
Published OnlineFirst November 6, 2006; DOI: 10.1158/0008-5472.CAN-06-1327

2006;66:10709-10719. Published OnlineFirst November 6, 2006.Cancer Res Giancarlo Castellano, James F. Reid, Paola Alberti, et al. Cancer Identified in Multiple Gene Expression StudiesNew Potential Ligand-Receptor Signaling Loops in Ovarian
Updated version
10.1158/0008-5472.CAN-06-1327doi:
Access the most recent version of this article at:
Material
Supplementary
http://cancerres.aacrjournals.org/content/suppl/2006/11/09/66.22.10709.DC1
Access the most recent supplemental material at:
Cited articles
http://cancerres.aacrjournals.org/content/66/22/10709.full#ref-list-1
This article cites 46 articles, 17 of which you can access for free at:
Citing articles
http://cancerres.aacrjournals.org/content/66/22/10709.full#related-urls
This article has been cited by 4 HighWire-hosted articles. Access the articles at:
E-mail alerts related to this article or journal.Sign up to receive free email-alerts
Subscriptions
Reprints and
To order reprints of this article or to subscribe to the journal, contact the AACR Publications
Permissions
Rightslink site. (CCC)Click on "Request Permissions" which will take you to the Copyright Clearance Center's
.http://cancerres.aacrjournals.org/content/66/22/10709To request permission to re-use all or part of this article, use this link
Research. on July 6, 2020. © 2006 American Association for Cancercancerres.aacrjournals.org Downloaded from
Published OnlineFirst November 6, 2006; DOI: 10.1158/0008-5472.CAN-06-1327