NEWMARKET SCHOOL FACILITIES SURVEY
34
DRAFT NEWMARKET SCHOOL FACILITIES SURVEY Tracy A. Fowler, M.A. Andrew E. Smith, Ph.D. University of New Hampshire Survey Center April 16, 2008
Transcript of NEWMARKET SCHOOL FACILITIES SURVEY

DRAFT
NEWMARKET SCHOOL FACILITIESSURVEY
Tracy A. Fowler, M.A.Andrew E. Smith, Ph.D.
University of New HampshireSurvey Center
April 16, 2008

The University of New Hampshire
Survey Center
The UNH Survey Center is an independent, non-partisan academic survey research organization anda division of the UNH Carsey Institute.
The Survey Center conducts telephone, mail, e-mail,Internet, and intercept surveys, as well as focusgroups and other qualitative research for universityresearchers, government agencies, public non-profitorganizations, private businesses, and media clients.
Our senior staff have over 40 years experience indesigning and conducting custom research on abroad range of political, social, health care, and otherpublic policy issues.
Dr. Andrew E. Smith, DirectorUNH Survey CenterThompson HallDurham, New Hampshire 03824603/862-2226 (voice)603/862-1488 (FAX)[email protected]

Table of Contents
Executive Summary .........................................................................1Figures.............................................................................................3
Technical Report........................................................................T - 1
Appendix A:Detailed Tabular Results ...........................................................A - 1
Appendix B:Open-Ended Responses ............................................................ B 1
Appendix C:Questionnaire ............................................................................C - 1

University of New Hampshire 1 Newmarket School FacilitiesSurvey Center April, 2008
Executive Summary
The University of New Hampshire Survey Center conducted a survey for the Newmarket, NH SchoolDepartment. The specific areas of interest were opinions regarding the current and potential future junior, seniorhigh school facilities. Five-hundred and ten (510) randomly selected Newmarket adults were interviewed bytelephone between March 29 and April 5, 2008. The margin of sampling error for the survey is +/- 4.4%. (SeeTechnical Report below for a more detailed description of survey methods.) The following figures display surveyresults, detailed tabular results can be found in Appendix A, Appendix B contains the open ended responses, andAppendix C contains the survey instrument.
Satisfaction with Current School Facilities· A small majority (51%) express dissatisfaction (27% very dissatisfied and 24 percent dissatisfied ) with the
current junior and senior high school building, 24 percent are satisfied (3% very satisfied and 21%satisfied ), 19 percent say they are neutral, and 5 percent say they don t know. Figure 1
· Residents between the ages of 30 to 49, those who are college graduates, households with children andhouseholds with children currently at the junior, senior high school are most likely to be dissatisfied withthe current facility.
· Residents who report being very knowledgeable about the school boards effort to find a good solution andthose who report a great deal of trust in the current board and administration are more likely to bedissatisfied with the current building.
Options for School Facilities· The majority of Newmarket residents oppose (62%) closing the senior high school and sending students to a
high school in a neighboring community (48% strongly oppose and 14% somewhat oppose ), 29 percentfavor tuitioning (14% strongly favor and 15% somewhat favor ), 7 percent say they are neutral, and 2percent say they don t know. Figure 2· Residents with a high school education or less, households with children in the junior, senior high school,
and those who only occasionally or never vote in local elections are most likely to oppose tuitioning.· Residents who report a great deal of trust in the current board and administration are most likely to oppose
tuitioning.
· The majority of Newmarket residents favor (57%) building a new facility for the junior, senior high schoolstudents (34% strongly favor and 23% somewhat favor ), 36 percent oppose a new facility (27% stronglyoppose and 9% somewhat oppose ), 6 percent say they are neutral, and 2 percent say they don t know.Figure 3· Residents between the ages of 30 to 49, households with children, households with children currently at
the junior, senior high school, and those who usually vote in local elections are most likely to favorbuilding a new facility.
· Residents who report a great deal of trust in the current board and administration and those who aredissatisfied with the current facility are most likely to favor building a new facility.
· The majority of Newmarket residents favor (61%) refurbishing the current facility for the junior, senior highschool students (35% strongly favor and 26% somewhat favor ), 32 percent oppose a refurbishing thecurrent facility (16% strongly oppose and 16% somewhat oppose ), 5 percent say they are neutral, and 3percent say they don t know. Figure 4· Younger adults (18 to 29) and those between 50 and 59, residents with a high school education or less,
households with three or more adults and households with no children are most likely to favor refurbishingthe current facility.
· Residents who are satisfied or neutral with the current facility are most likely to favor refurbishing thecurrent facility.

University of New Hampshire 2 Newmarket School FacilitiesSurvey Center April, 2008
· The majority of Newmarket residents favor (59%) purchasing property for future school needs (36% stronglyfavor and 23% somewhat favor ), 32 percent oppose purchasing property (22% strongly oppose and 10%somewhat oppose ), 6 percent say they are neutral, and 2 percent say they don t know. Figure 5
· Adults between 30 and 39, those who usually, occasionally or never vote, and households with children aremost likely to favor purchasing property for future school needs.
· Residents who report a great deal of trust in the current board and administration and those who aredissatisfied with the current facility are most likely to favor purchasing property for future needs.
· Newmarket residents were asked, of the four options, which is most favorable, 35% said refurbishing thecurrent facility, 32 percent said building a new facility, 18 percent said tuitioning out and 10 percent saidpurchasing property for future needs. Figure 6· Young adults (18 to 39), households with children and those who are dissatisfied with the current facility
are most likely to favor building a new facility.· Adults between 50 to 59, those with a high school education or less, households with three or more adults,
and those who are satisfied with the current facility are most likely to favor refurbishing.· When the top 2 responses were combined, again, refurbishing was considered most favorable followed
by building a new facility.
School Board· Approximately one-quarter of Newmarket residents (27%) say they are very knowledgeable of the School
Boards effort to find a good solution to facility needs at the junior, senior high school and a majority (52%)say they are somewhat knowledgeable, 14 percent say they are not very knowledgeable and 6 percent say theyare not at all knowledgeable. Figure 7· Households with a child in the junior, senior high school, those who always vote in local elections,
households with three or more children, and those who trust the board and administration are most likely tobe very knowledgeable of the school boards effort to find a good solution to facility needs.
· If a bond article were to be placed on the March 2009 ballot similar to the last proposal of 32 million, themajority of Newmarket residents would vote against it (53%), 41 percent would vote for it and 6 percent saythey don t know how they would vote. Figure 8· Young adults (18 to 49), those with at least a college degree, households with children currently in the
junior, senior high school, households with one or two children, those who are dissatisfied with the currentbuilding and those who report a great deal of trust in the board and current administration are most likelyto say they would vote FOR the bond article.
· Older adults (50 or older), those with less than a college degree, households with no children, those whoare satisfied or neutral with the current facility and those with very little or no trust in the board and currentadministration are most likely to vote AGAINST the bond article.
· Of those who said they would vote FOR the bond article, 50 percent said the primary reason is a new junior,senior high school is necessary, 20 percent said it is needed to help improve the quality of the education, 10percent say renovating will not be enough, 5 percent say it is a good use of tax dollars, 3 percent say it is worththe cost, 10 percent gave some other reason, and 3 percent say they don t know. Figure 9· Residents between 30 and 39 years old, those who usually vote and households with three or more children
are most likely to say the reason they would vote FOR the article is a new building is necessary.
· Of those who said they would vote AGAINST the bond article, the plurality (37%) say the primary reason is itis too expensive, 14 percent say it is an unfair tax burden, 12 percent say renovating the current facility issufficient, 8 percent say it is a bad use of tax dollars, 5 percent say a new facility is not necessary. Figure 10· Residents between 30 and 39 years old, those with post graduate work, households with one child, those
who are dissatisfied with the current facility and those with very little or no trust in the board and currentadministration are most likely to say the reason they would vote AGAINST the article is a new building istoo expensive.

University of New Hampshire 3 Newmarket School FacilitiesSurvey Center April, 2008
Trust· Only 15 percent of Newmarket residents express a great deal of trust with the current Newmarket school board
and administration in making the right decision about the future of the Newmarket junior, senior high school.Forty-three percent have some trust, 18 percent have not much, 15 percent say they have none at all, and 8percent say they don t know. Figure 11· Residents between 30 and 39 years old, households with two children, those who are dissatisfied with the
current facility and those report they are very knowledgeable are most likely to say they trust the schoolboard and current administration a great deal.
· Younger adults (18 to 29) are most likely to say they only trust the school board and current administrationsome.
Demographics· The majority of Newmarket residents say they always vote in town elections (64%), 21 percent say they usually
vote and 15 percent say they occasionally or never vote.· Residents between the ages of 40 to 49 or 60 or older, those with post graduate work and those who report
they are very knowledgeable of the school boards effort to find a good solution to facility needs are mostlikely to always vote.

University of New Hampshire 4 Newmarket School FacilitiesSurvey Center April, 2008
Figure 1: Overall, how satisfied are you with the current junior, senior high school building?
Figure 2: Do you favor or oppose closing the Senior High School in Newmarket that is grades 9through 12 and arranging to send those students to a high school in a neighboringcommunity?
3%
21% 19%24% 27%
5%
0%
10%
20%
30%
40%
50%
60%
70%
80%
90%
100%
Very Satisfied Satisfied Neither Dissatisfied VeryDissatisfied
Don'tKnow/Not
Sure
14% 15%7%
14%
48%
2%0%
10%20%30%40%50%60%70%80%90%
100%
StronglyFavor
SomewhatFavor
Neutral SomewhatOppose
StronglyOppose
Don'tKnow

University of New Hampshire 5 Newmarket School FacilitiesSurvey Center April, 2008
Figure 3: Do you favor or oppose building a new facility for junior, senior high schoolstudents?
Figure 4: Do you favor or oppose refurbishing the current facility at the junior, senior high school?
34%
23%
6% 9%
27%
2%0%
10%20%30%40%50%60%70%80%90%
100%
StronglyFavor
SomewhatFavor
Neutral SomewhatOppose
StronglyOppose
Don'tKnow/Not
Sure
35%26%
5%
16% 16%
3%0%
10%
20%
30%
40%
50%
60%
70%
80%
90%
100%
StronglyFavor
SomewhatFavor
Neutral SomewhatOppose
StronglyOppose
Don't Know

University of New Hampshire 6 Newmarket School FacilitiesSurvey Center April, 2008
Figure 5: Do you favor or oppose investing in purchasing property for future school needs?
Figure 6: Of the four options presented which would you rank as the most favorable? Would you say sending high school students to a neighboring school building a new facility refurbishingthe existing facility or not doing anything now, but buying property for future schoolneeds?
2%
4%
3%
32%
56%
45%
27%
2%
2%
1%
10%
35%
32%
18%
1%
4%
2%
32%
30%
18%
14%
0% 10% 20% 30% 40% 50% 60% 70% 80% 90% 100%
Don't know
Other
None of the above
Purchase for futureexpansion
Refurbishing current facility
Build new facility
Tuitioning out
Top 2 Responses Combined 1st Response 2nd Response
36%
23%
6%10%
22%
2%0%
10%
20%
30%
40%
50%
60%
70%
80%
90%
100%
StronglyFavor
SomewhatFavor
Neutral SomewhatOppose
StronglyOppose
Don't Know

University of New Hampshire 7 Newmarket School FacilitiesSurvey Center April, 2008
Figure 7: How knowledgeable would you say you are of the Newmarket School Board s effort to find agood solution to facility needs at the junior, senior High School?
Figure 8: If a school bond article to build a new Newmarket junior/senior high school, similar to thelast proposal of $32 million plus inflation of 5%, were included on the March 2009 localelection ballot, do you think you would vote for or against such an article?
27%
52%
14%6%
0%10%20%30%40%50%60%70%80%90%
100%
VeryKnowledgeable
SomewhatKnowledgeable
Not VeryKnowledgeable
Not at allknowledgeable
41%
53%
6%
0%
10%
20%
30%
40%
50%
60%
70%80%
90%
100%
Would Vote For Would Vote Against Don't Know/Not Sure

University of New Hampshire 8 Newmarket School FacilitiesSurvey Center April, 2008
Figure 9: What would you say are the main reasons why you would vote FOR the bond article for anew Newmarket junior, senior high school?
Figure 10: What would you say are the main reasons why you would vote AGAINST the bond articlefor a new Newmarket junior, senior high school?
10%
2%
1%
1%
1%
14%
2%
8%
4%
37%
4%
12%
5%
15%
3%
3%
1%
4%
24%
3%
15%
8%
46%
9%
18%
9%
0% 10% 20% 30% 40% 50% 60% 70% 80% 90% 100%
Other
Don't Know enough about the plan
Don't trust board/admin
Will not benefit me or my family
Will not help improve quality of education
Unfair tax burden
Don't know how much property tax
Bad use of tax dollars
Need to know more about costs involved
Too expensive
Want more information about renovating/expansion
Renovating existing building will be sufficient
New junior, senior building is not necessary
First Response Multiple Responses
3%
10%
20%
5%
3%
10%
50%
3%
20%
30%
10%
14%
20%
59%
0% 10% 20% 30% 40% 50% 60% 70% 80% 90% 100%
Don't know/Not Sure
Other(specify)
Needed to help improve quality of education
Good use of tax dollars
Worth the cost
Rennovating existing building will not be sufficient
New junior, senior high school is necessary
1st Reason Multiple Responses

University of New Hampshire 9 Newmarket School FacilitiesSurvey Center April, 2008
Figure 11: How much do you trust the current Newmarket school board and administration in makingthe right decision about the future of the Newmarket junior, senior High School?
15%
43%
18% 15%8%
0%10%20%30%40%50%60%70%80%90%
100%
A great deal Some Not Much Not at all Don'tKnow/Not
Sure

University of New Hampshire T - 1 Newmarket School FacilitiesSurvey Center April, 2008
TECHNICAL REPORT
How the Sample Was Selected
The Newmarket, NH School Facilities Survey was a survey of randomly selected adults in the Town
of Newmarket, NH. This survey was conducted using a procedure called Random Digit Dialing (RDD)
which is described below.
A sample of households in the area was selected by a procedure known as random digit dialing. The
way this works is as follows. First, with the aid of the computer, one of the three-digit telephone exchanges
that are currently used in the area (e.g., 772) is randomly selected. The computer then randomly selects one
of the "working blocks"--the first two of the last four numbers in a telephone number (e.g., 64)--and attaches
it to the randomly selected exchange. Finally, the computer program then generates a two-digit random
number between 00 and 99 (e.g., 57) which is attached to the previously selected prefix (772), and the
previously selected working block (64) resulting in a complete telephone number -- i.e., 772-6457. This
procedure is then repeated numerous times by the computer to generate more random numbers, so that we
have a sufficient quantity to conduct the survey. The end result is that each household in the area in which
there is a telephone has an equally likely chance of being selected into the sample.
The random sample used in the Newmarket School Facilities Survey was purchased from ScientificTelephones Samples (STS), Foothill Ranch, California. STS screens each selected telephone number toeliminate non-working numbers, disconnected numbers, and business numbers to improve the efficiency ofthe sample, reducing the amount of time interviewers spend calling non-usable numbers.
Each of these randomly generated telephone numbers is called by one of our interviewers from acentrally supervised facility at the UNH Survey Center. If the number called is found not to be a residentialone, it is discarded and another random number is called. If it is a residential number, the interviewer thenrandomly selects a member of the household by asking to speak with the adult currently living in thehousehold who has had the most recent birthday. This selection process ensures that every adult (18 years ofage or older) in the household has an equally likely chance of being included in the survey. No substitutionsare allowed. If, for example, the randomly selected adult is not at home when the household is first contacted,the interviewer cannot substitute by selecting someone else who just happens to be there at the time. Instead,he or she must make an appointment to call back when the randomly selected adult is at home. In this way,respondent selection bias is minimized.

University of New Hampshire T - 2 Newmarket School FacilitiesSurvey Center April, 2008
When the Interviewing Was Done
Newmarket adults in the Newmarket School Facilities Survey were interviewed between March 29
and April 5, 2008. Each selected respondent was called by a professional UNH Survey Center interviewer
from a centrally supervised facility at the UNH Survey Center. Telephone calls during the field period were
made between 9:00 AM and 9:00 PM.
Response Rates
Interviews were completed with 510 randomly selected adults in Newmarket from a sample of 2919
randomly selected telephone numbers. Using American Association for Public Opinion (AAPOR) Response
Rate 4, the response rate for the Newmarket School Facilities survey was 53.4 percent. The formula to
calculate standard AAPOR response rate is:
_____________I______________((I+P) + (R+NC+O) + e(UH+UO))
I=Complete Interviews, P=Partial Interviews, R=Refusal and break off, NC=Non Contact, O=Other,e=estimated portion of cases of unknown eligibility that are eligible, UH=Unknown household,UO=Unknown other.
Weighting of Data
The data have been weighted to account for known biases of telephone surveys. The data in the
Newmarket School Facilities survey are weighted by the number of adults and telephone lines within
households to equalize the chances that any one adult would be selected for inclusion. The data are also
weighted by respondent sex.

University of New Hampshire T - 3 Newmarket School FacilitiesSurvey Center April, 2008
Sampling Error
The Newmarket School Facilities Survey, like all surveys, is subject to sampling error due to the fact
that all residents in the area were not interviewed. For those questions asked of four hundred (400) or so
respondents, the error is +/-4.9%. For those questions where fewer than 400 persons responded, the sampling
error can be calculated as follows:
______Sampling error = +/- (1.96) |P(1-P)
\| N
Where P is the percentage of responses in the answer category being evaluated and N is the total
number of persons answering the particular question.
For example, suppose you had the following distribution of answers to the question, "Should the state
spend more money on road repair even if that means higher taxes?" Assume 1,000 respondents answered the
question as follows:
YES - 47%NO - 48%DON'T KNOW - 5%
The sampling error for the "YES" percentage of 47% would be ________
+/-(1.96) |(47)(53) = +/-3.1%;\| 1,000
for the "NO" percentage of 48% it would be ________
+/-(1.96) |(48)(52) = +/-3.1%;\| 1,000
and for the "DON'T KNOW" percentage of 5% it would be ________
+/-(1.96) |(5)(95) = +/-1.4%;\| 1,000
In this case we would expect the true population figures to be within the following ranges:
YES 43.9% - 50.1% (i.e., 47% +/-3.1%)NO 44.9% - 51.1% (i.e., 48% +/-3.1%)DON'T KNOW 3.6% - 6.4% (i.e., 5% +/-1.4%)

University of New Hampshire Newmarket Cable TelevisionSurvey Center October, 2007
APPENDIX A:Detailed Tabular Results

The University of New Hampshire A - 1 Newmarket School FacilitiesSurvey Center April, 2008
Q1: Overall, how satisfied are you with the current junior, senior high school building
___________________________________________________________________________________________________________________________________________________________________Very Satisfied Neither Dissatisfied Very Don t Know/ Number
Satisfied Dissatisfied Not Sure Responding___________________________________________________________________________________________________________________________________________________________________All Newmarket Residents 3% 21% 19% 24% 27% 5% 506
Age 18 to 29 5% 26% 35% 23% 9% 2% 48 30 to 39 0% 8% 12% 28% 44% 9% 83 40 to 49 1% 12% 20% 22% 43% 2% 131 50 to 59 6% 30% 14% 29% 16% 5% 121 60 or older 6% 30% 23% 21% 11% 10% 113
Sex Male 5% 25% 16% 26% 22% 5% 250 Female 2% 18% 21% 23% 31% 5% 256
Education High school or less 5% 32% 20% 20% 18% 5% 119 Technical school/Some college 3% 27% 21% 24% 19% 5% 135 College graduate 4% 15% 18% 27% 34% 3% 157 Postgraduate work 0% 11% 16% 27% 36% 10% 95
Has children in Jr/Sr HS Yes 1% 24% 9% 33% 31% 1% 95 No 4% 21% 21% 22% 26% 6% 411
Votes in town elections Always vote 4% 22% 14% 27% 27% 5% 322 Usually vote 3% 20% 21% 21% 32% 2% 107 Occasionally/never vote 1% 18% 37% 17% 12% 15% 73
adults in Household One 7% 24% 22% 15% 23% 9% 46 Two 3% 20% 17% 28% 26% 6% 345 Three or more 3% 23% 22% 19% 30% 3% 115
Children in Household None 5% 27% 22% 22% 16% 7% 289 One 0% 14% 15% 28% 39% 3% 97 Two 2% 12% 15% 22% 46% 3% 87 Three or More 0% 17% 11% 36% 34% 2% 33
Knowledge of Solution Very Knowledgeable 3% 22% 12% 23% 39% 1% 139 Somewhat Knowledgeable 3% 21% 18% 28% 26% 3% 263 Not Very/Not At All/DK 2% 21% 31% 18% 11% 16% 102
Trust Board & Admin A Great Deal 0% 5% 10% 25% 57% 4% 78 Some 3% 22% 17% 31% 25% 3% 216 Not Much/Not At All/DK 5% 26% 24% 18% 18% 9% 211
___________________________________________________________________________________________________________________________________________________________________

The University of New Hampshire A - 2 Newmarket School FacilitiesSurvey Center April, 2008
Q2: Do you favor or oppose closing the Senior High School in Newmarket that is grades 9 through 12 and arranging to send those students to a High School in aneighboring community
___________________________________________________________________________________________________________________________________________________________________ Strongly Somewhat Neutral Somewhat Strongly Don t Know/ Number Favor Favor Oppose Oppose Not Sure Respondant___________________________________________________________________________________________________________________________________________________________________All Newmarket Residents 14% 15% 7% 14% 48% 2% 507
Age 18 to 29 6% 14% 9% 18% 50% 4% 48 30 to 39 10% 9% 11% 16% 53% 2% 83 40 to 49 14% 17% 3% 14% 50% 2% 133 50 to 59 11% 16% 9% 13% 49% 2% 120 60 or older 20% 15% 6% 12% 44% 3% 112
Sex Male 15% 17% 6% 14% 46% 2% 251 Female 13% 12% 8% 13% 51% 2% 255
Education High school or less 10% 9% 6% 13% 60% 2% 120 Technical school/Some college 14% 17% 4% 14% 50% 1% 134 College graduate 14% 15% 11% 14% 43% 3% 157 Postgraduate work 20% 18% 5% 15% 40% 2% 96
Has children in Jr/Sr HS Yes 8% 10% 4% 14% 64% 0% 95 No 15% 16% 7% 14% 45% 3% 412
Votes in town elections Always vote 17% 16% 5% 11% 48% 2% 322 Usually vote 11% 16% 7% 14% 49% 3% 107 Occasionally/never vote 5% 7% 12% 26% 48% 2% 74
adults in Household One 12% 13% 16% 17% 39% 3% 47 Two 16% 14% 6% 12% 50% 2% 345 Three or more 10% 18% 5% 17% 48% 2% 115
Children in Household None 15% 14% 8% 14% 45% 3% 290 One 12% 16% 4% 20% 45% 2% 97 Two 15% 15% 3% 2% 64% 1% 87 Three or More 7% 13% 9% 24% 47% 0% 33
Knowledge of Solution Very Knowledgeable 19% 11% 5% 13% 50% 0% 139 Somewhat Knowledgeable 14% 17% 5% 10% 52% 2% 263 Not Very/Not At All/DK 8% 14% 12% 25% 37% 5% 103
Satisfaction - Facility Satisfied 13% 19% 7% 14% 45% 1% 123 Neutral/DK 17% 16% 11% 13% 38% 4% 123 Dissatisfied 12% 12% 4% 14% 56% 2% 258
Trust Board & Admin A Great Deal 3% 3% 3% 21% 70% 0% 78 Some 9% 16% 5% 15% 52% 3% 216 Not Much/Not At All/DK 24% 18% 9% 10% 37% 2% 211___________________________________________________________________________________________________________________________________________________________________

The University of New Hampshire A - 3 Newmarket School FacilitiesSurvey Center April, 2008
Q3: Do you favor or oppose building a new facility for Junior, senior High School students
___________________________________________________________________________________________________________________________________________________________________ Strongly Somewhat Neutral Somewhat Strongly Don t Know/ Number Favor Favor Oppose Oppose Not Sure Responding___________________________________________________________________________________________________________________________________________________________________All Newmarket Residents 34% 23% 6% 9% 27% 2% 508
Age 18 to 29 30% 27% 13% 1% 25% 3% 48 30 to 39 62% 24% 5% 7% 3% 0% 83 40 to 49 49% 21% 3% 8% 18% 0% 133 50 to 59 18% 25% 8% 12% 34% 2% 120 60 or older 15% 23% 4% 12% 42% 3% 113
Sex Male 30% 26% 3% 10% 30% 1% 253 Female 38% 20% 9% 8% 23% 2% 255
Education High school or less 30% 24% 7% 11% 28% 1% 120 Technical school/Some college 26% 24% 5% 12% 31% 2% 136 College graduate 42% 22% 5% 9% 19% 3% 157 Postgraduate work 38% 23% 5% 3% 31% 1% 95
Has children in Jr/Sr HS Yes 49% 19% 7% 9% 15% 1% 95 No 31% 24% 5% 9% 29% 2% 413
Votes in town elections Always vote 31% 20% 5% 11% 31% 2% 323 Usually vote 41% 30% 4% 4% 22% 0% 107 Occasionally/never vote 37% 27% 13% 10% 11% 3% 74
adults in Household One 31% 23% 5% 10% 25% 7% 47 Two 36% 22% 5% 8% 27% 1% 346 Three or more 29% 26% 8% 11% 25% 1% 115
Children in Household None 23% 25% 6% 9% 36% 2% 291 One 47% 22% 6% 13% 10% 2% 97 Two 54% 20% 6% 4% 16% 0% 87 Three or More 44% 23% 6% 6% 21% 0% 33
Knowledge of Solution Very Knowledgeable 38% 16% 3% 12% 31% 0% 138 Somewhat Knowledgeable 35% 26% 4% 7% 27% 1% 264 Not Very/Not At All/DK 28% 25% 13% 10% 19% 5% 103
Satisfaction - Facility Satisfied 11% 22% 7% 11% 47% 2% 125 Neutral/DK 19% 21% 12% 10% 34% 4% 124 Dissatisfied 53% 25% 1% 7% 13% 0% 257
Trust Board & Admin A Great Deal 79% 18% 0% 2% 1% 1% 78 Some 35% 26% 7% 9% 21% 1% 216 Not Much/Not At All/DK 16% 22% 6% 11% 42% 2% 213___________________________________________________________________________________________________________________________________________________________________

The University of New Hampshire A - 4 Newmarket School FacilitiesSurvey Center April, 2008
Q4: Do you favor or oppose refurbishing the current facility at the Junior, senior High School
___________________________________________________________________________________________________________________________________________________________________ Strongly Somewhat Neutral Somewhat Strongly Don t Know/ Number Favor Favor Oppose Oppose Not Sure Responding___________________________________________________________________________________________________________________________________________________________________All Newmarket Residents 35% 26% 5% 16% 16% 3% 508
Age 18 to 29 41% 32% 2% 19% 4% 2% 48 30 to 39 14% 26% 1% 27% 28% 3% 82 40 to 49 30% 22% 8% 17% 23% 0% 133 50 to 59 46% 29% 4% 7% 11% 3% 121 60 or older 39% 26% 5% 14% 10% 6% 113
Sex Male 38% 26% 4% 14% 15% 2% 253 Female 31% 27% 5% 17% 17% 3% 255
Education High school or less 49% 27% 6% 11% 5% 2% 120 Technical school/Some college 38% 27% 4% 16% 12% 3% 136 College graduate 24% 25% 4% 19% 24% 2% 157 Postgraduate work 29% 25% 6% 13% 23% 4% 95
Has children in Jr/Sr HS Yes 35% 18% 10% 14% 22% 1% 95 No 35% 28% 4% 16% 15% 3% 413
Votes in town elections Always vote 38% 26% 4% 11% 18% 2% 324 Usually vote 28% 23% 2% 28% 16% 3% 107 Occasionally/never vote 31% 34% 10% 17% 4% 4% 73
adults in Household One 38% 19% 9% 17% 14% 3% 47 Two 34% 25% 4% 16% 18% 3% 346 Three or more 36% 35% 4% 14% 9% 2% 115
Children in Household None 41% 30% 4% 12% 10% 3% 292 One 22% 24% 7% 21% 22% 4% 96 Two 32% 22% 6% 16% 24% 0% 87 Three or More 26% 14% 2% 27% 28% 3% 33
Knowledge of Solution Very Knowledgeable 36% 21% 6% 12% 24% 1% 139 Somewhat Knowledgeable 35% 26% 3% 19% 16% 1% 264 Not Very/Not At All/DK 31% 34% 9% 13% 4% 9% 102
Satisfaction - Facility Satisfied 50% 31% 3% 10% 6% 0% 125 Neutral/DK 42% 29% 5% 14% 3% 8% 123 Dissatisfied 24% 23% 5% 19% 27% 2% 258
Trust Board & Admin A Great Deal 10% 19% 4% 30% 34% 2% 78 Some 34% 30% 4% 14% 16% 2% 216 Not Much/Not At All/DK 44% 26% 6% 11% 9% 3% 213___________________________________________________________________________________________________________________________________________________________________

The University of New Hampshire A - 5 Newmarket School FacilitiesSurvey Center April, 2008
Q5: Do you favor or oppose investing in purchasing property for future school needs
___________________________________________________________________________________________________________________________________________________________________ Strongly Somewhat Neutral Somewhat Strongly Don t Know/ Number Favor Favor Oppose Oppose Not Sure Responding___________________________________________________________________________________________________________________________________________________________________All Newmarket Residents 36% 23% 6% 10% 22% 2% 508
Age 18 to 29 31% 29% 6% 16% 17% 0% 48 30 to 39 55% 29% 2% 6% 7% 1% 83 40 to 49 48% 19% 7% 8% 17% 2% 133 50 to 59 31% 17% 9% 13% 29% 1% 120 60 or older 17% 30% 7% 10% 32% 4% 113
Sex Male 32% 25% 7% 12% 23% 0% 253 Female 40% 22% 6% 8% 21% 3% 255
Education High school or less 24% 28% 9% 11% 25% 3% 120 Technical school/Some college 33% 28% 6% 8% 24% 1% 136 College graduate 42% 19% 7% 13% 17% 2% 157 Postgraduate work 47% 18% 2% 8% 25% 1% 95
Has children in Jr/Sr HS Yes 45% 22% 5% 8% 17% 2% 95 No 34% 24% 7% 11% 23% 2% 413
Votes in town elections Always vote 37% 17% 7% 11% 27% 2% 323 Usually vote 41% 30% 3% 10% 16% 0% 107 Occasionally/never vote 27% 44% 11% 7% 10% 2% 74
adults in Household One 30% 27% 9% 7% 24% 4% 47 Two 39% 20% 6% 11% 22% 2% 346 Three or more 29% 33% 5% 11% 22% 0% 115
Children in Household None 26% 23% 8% 13% 27% 2% 291 One 52% 20% 5% 9% 13% 1% 97 Two 48% 25% 4% 7% 15% 1% 87 Three or More 40% 31% 4% 0% 24% 0% 33
Knowledge of Solution Very Knowledgeable 43% 13% 4% 9% 29% 1% 138 Somewhat Knowledgeable 36% 25% 5% 11% 22% 2% 264 Not Very/Not At All/DK 27% 34% 11% 10% 15% 3% 103
Satisfaction - Facility Satisfied 17% 17% 9% 13% 45% 0% 125 Neutral/DK 15% 36% 11% 11% 23% 4% 124 Dissatisfied 56% 21% 3% 8% 10% 1% 257
Trust Board & Admin A Great Deal 81% 14% 1% 4% 0% 0% 78 Some 40% 25% 6% 11% 17% 2% 216 Not Much/Not At All/DK 16% 26% 8% 12% 36% 3% 213___________________________________________________________________________________________________________________________________________________________________

The University of New Hampshire A - 6 Newmarket School FacilitiesSurvey Center April, 2008
Q6_1: Of the four options presented which would you rank as the most favorable? Would you say sending high school students to a neighboring school building a newfacility . refurbishing the existing facility . or not doing anything now, but buying property for future school needs _ First Choice
___________________________________________________________________________________________________________________________________________________________________ Tuitioning Build New Refurbishing Purchase for None of the Other Don t Know/ Number out Facility current Future Above (Specify) Not Sure Responding facility Expansion___________________________________________________________________________________________________________________________________________________________________All Newmarket Residents 18% 32% 35% 10% 1% 2% 2% 508
Age 18 to 29 9% 42% 42% 4% 1% 2% 0% 48 30 to 39 13% 65% 11% 7% 1% 2% 2% 83 40 to 49 17% 39% 28% 14% 1% 1% 1% 133 50 to 59 14% 17% 54% 11% 1% 0% 4% 121 60 or older 25% 14% 40% 11% 3% 4% 3% 112
Sex Male 20% 28% 36% 10% 2% 2% 2% 253 Female 15% 36% 35% 10% 1% 1% 2% 255
Education High school or less 15% 24% 45% 11% 2% 0% 2% 120 Technical school/Some college 17% 31% 39% 6% 2% 3% 2% 135 College graduate 20% 36% 28% 11% 1% 3% 1% 157 Postgraduate work 18% 38% 28% 13% 0% 0% 4% 96
Has children in Jr/Sr HS Yes 11% 38% 38% 13% 0% 0% 0% 95 No 19% 31% 34% 9% 2% 2% 3% 413
Votes in town elections Always vote 20% 29% 36% 10% 1% 2% 2% 324 Usually vote 19% 37% 28% 13% 4% 1% 0% 107 Occasionally/never vote 9% 40% 39% 8% 0% 0% 4% 73
adults in Household One 14% 33% 34% 12% 2% 1% 3% 47 Two 18% 36% 32% 8% 2% 2% 2% 346 Three or more 18% 20% 45% 15% 0% 0% 2% 115
Children in Household None 19% 21% 43% 10% 2% 2% 3% 291 One 19% 44% 22% 13% 0% 1% 2% 97 Two 14% 48% 30% 8% 1% 0% 0% 87 Three or More 15% 50% 18% 9% 0% 4% 4% 33
Knowledge of Solution Very Knowledgeable 18% 33% 35% 12% 0% 0% 2% 139 Somewhat Knowledgeable 19% 34% 35% 8% 2% 2% 0% 264 Not Very/Not At All/DK 16% 27% 34% 14% 1% 2% 7% 102
Satisfaction - Facility Satisfied 20% 11% 56% 9% 4% 0% 0% 125 Neutral/DK 21% 14% 41% 10% 2% 3% 8% 123 Dissatisfied 15% 51% 22% 11% 0% 2% 1% 258
Trust Board & Admin A Great Deal 1% 65% 13% 21% 0% 0% 0% 78 Some 11% 36% 38% 11% 2% 1% 2% 216 Not Much/Not At All/DK 30% 16% 41% 5% 1% 3% 3% 213___________________________________________________________________________________________________________________________________________________________________

The University of New Hampshire A - 7 Newmarket School FacilitiesSurvey Center April, 2008
Q6_2: Of the four options presented which would you rank as the most favorable? Would you say sending high school students to a neighboring school building a newfacility . refurbishing the existing facility . or not doing anything now, but buying property for future school needs _2nd Choice
___________________________________________________________________________________________________________________________________________________________________Tuitioning Build New Refurbishing Purchase for None of the Other Don t Know/ Number
out Facility current Future Above (Specify) Not Sure Responding facility Expansion___________________________________________________________________________________________________________________________________________________________________All Newmarket Residents 14% 18% 30% 32% 2% 4% 1% 353
Age 18 to 29 16% 19% 33% 32% 0% 0% 0% 33 30 to 39 11% 15% 34% 34% 3% 2% 0% 65 40 to 49 12% 18% 25% 41% 0% 4% 0% 102 50 to 59 17% 22% 28% 28% 3% 2% 0% 84 60 or older 15% 17% 34% 21% 2% 8% 3% 64
Sex Male 17% 17% 30% 29% 2% 4% 0% 173 Female 11% 19% 30% 35% 1% 3% 1% 180
Education High school or less 10% 19% 34% 32% 2% 1% 1% 84 Technical school/Some college 10% 17% 23% 37% 4% 9% 0% 96 College graduate 20% 23% 29% 27% 1% 0% 0% 102 Postgraduate work 15% 11% 37% 32% 0% 4% 1% 71
Has children in Jr/Sr HS Yes 6% 24% 24% 39% 1% 6% 0% 77 No 16% 16% 32% 30% 2% 3% 1% 275
Votes in town elections Always vote 14% 15% 31% 32% 3% 5% 0% 225 Usually vote 17% 24% 27% 30% 0% 2% 0% 79 Occasionally/never vote 9% 19% 34% 36% 0% 0% 2% 48
adults in Household One 16% 12% 28% 35% 4% 2% 3% 29 Two 11% 17% 33% 32% 2% 5% 0% 242 Three or more 22% 24% 23% 31% 0% 0% 0% 81
Children in Household None 17% 18% 29% 28% 2% 4% 1% 183 One 13% 19% 33% 31% 2% 3% 0% 78 Two 10% 17% 26% 44% 0% 2% 0% 69 Three or More 4% 14% 43% 29% 3% 6% 0% 22
Knowledge of Solution Very Knowledgeable 12% 18% 29% 36% 0% 5% 0% 92 Somewhat Knowledgeable 17% 19% 28% 33% 1% 3% 0% 185 Not Very/Not At All/DK 9% 16% 39% 26% 3% 4% 3% 73
Satisfaction - Facility Satisfied 20% 18% 29% 23% 5% 6% 0% 81 Neutral/DK 14% 21% 34% 26% 2% 3% 1% 69 Dissatisfied 11% 18% 29% 38% 1% 3% 1% 200
Trust Board & Admin A Great Deal 4% 22% 23% 49% 2% 0% 0% 62 Some 15% 16% 32% 34% 1% 2% 1% 160 Not Much/Not At All/DK 17% 19% 32% 22% 3% 7% 1% 131___________________________________________________________________________________________________________________________________________________________________

The University of New Hampshire A - 8 Newmarket School FacilitiesSurvey Center April, 2008
Q6: Of the four options presented which would you rank as the most favorable? Would you say sending high school students to a neighboring school building a newfacility . refurbishing the existing facility . or not doing anything now, but buying property for future school needs.
Multiple Responses Possible. Percentages may add to more than 100%___________________________________________________________________________________________________________________________________________________________________
Tuitioning Build New Refurbishing Purchase for None of the Other Don t Know/ Number out Facility current Future Above (Specify) Not Sure Responding facility Expansion___________________________________________________________________________________________________________________________________________________________________All Newmarket Residents 27% 45% 56% 32% 3% 4% 2% 508
Age 18 to 29 19% 55% 65% 25% 1% 2% 0% 48 30 to 39 21% 77% 38% 33% 4% 3% 2% 83 40 to 49 26% 53% 47% 45% 1% 4% 1% 133 50 to 59 26% 32% 73% 30% 3% 1% 4% 121 60 or older 33% 24% 59% 23% 4% 8% 5% 112
Sex Male 32% 40% 56% 30% 3% 5% 2% 253 Female 23% 49% 56% 35% 2% 3% 3% 255
Education High school or less 22% 37% 69% 34% 4% 1% 2% 120 Technical school/Some college 24% 43% 56% 32% 4% 9% 2% 135 College graduate 33% 51% 47% 28% 2% 3% 2% 157 Postgraduate work 30% 46% 55% 37% 0% 3% 4% 96
Has children in Jr/Sr HS Yes 15% 57% 58% 45% 1% 5% 0% 95 No 30% 42% 56% 29% 3% 4% 3% 413
Votes in town elections Always vote 29% 39% 58% 32% 3% 6% 3% 324 Usually vote 32% 55% 47% 35% 4% 2% 0% 107 Occasionally/never vote 14% 53% 61% 31% 0% 0% 6% 73
adults in Household One 24% 40% 52% 34% 5% 2% 5% 47 Two 26% 47% 55% 31% 3% 6% 2% 346 Three or more 34% 37% 61% 37% 0% 0% 2% 115
Children in Household None 29% 33% 61% 28% 4% 4% 3% 291 One 29% 59% 48% 37% 1% 4% 2% 97 Two 22% 61% 50% 43% 1% 2% 0% 87 Three or More 18% 59% 47% 29% 2% 8% 4% 33
Knowledge of Solution Very Knowledgeable 26% 45% 54% 35% 0% 3% 2% 139 Somewhat Knowledgeable 30% 47% 55% 31% 3% 4% 0% 264 Not Very/Not At All/DK 22% 38% 61% 33% 3% 5% 9% 102
Satisfaction - Facility Satisfied 33% 22% 74% 24% 7% 4% 0% 125 Neutral/DK 29% 26% 61% 25% 3% 5% 8% 123 Dissatisfied 23% 64% 45% 40% 1% 4% 1% 258
Trust Board & Admin A Great Deal 5% 82% 31% 60% 2% 0% 0% 78 Some 23% 48% 61% 36% 2% 2% 2% 216 Not Much/Not At All/DK 41% 27% 60% 19% 3% 8% 4% 213___________________________________________________________________________________________________________________________________________________________________

The University of New Hampshire A - 9 Newmarket School FacilitiesSurvey Center April, 2008
Q7: How knowledgeable would you say you are of the Newmarket School Board s effort to find a good solution to facility needs at the Junior, senior High School___________________________________________________________________________________________________________________________________________________________________ Very Somewhat Not Very Not at all Don t Know/ Number Knowledgeable Knowledgeable Knowledgeable Knowledgeable Not Sure Responding___________________________________________________________________________________________________________________________________________________________________All Newmarket Residents 27% 52% 14% 6% 0% 507
Age 18 to 29 8% 58% 27% 7% 0% 48 30 to 39 22% 57% 12% 9% 0% 83 40 to 49 35% 48% 11% 5% 1% 133 50 to 59 33% 52% 12% 3% 0% 119 60 or older 25% 49% 15% 10% 1% 113
Sex Male 26% 54% 13% 7% 0% 251 Female 29% 50% 14% 6% 1% 255
Education High school or less 17% 53% 22% 7% 1% 120 Technical school/Some college 28% 51% 13% 7% 0% 135 College graduate 29% 54% 10% 7% 0% 156 Postgraduate work 38% 49% 8% 4% 1% 96
Has children in Jr/Sr HS Yes 39% 48% 11% 2% 0% 95 No 25% 53% 14% 8% 0% 412
Votes in town elections Always vote 39% 49% 9% 3% 0% 323 Usually vote 11% 68% 13% 6% 1% 107 Occasionally/never vote 4% 42% 32% 23% 0% 73
adults in Household One 22% 42% 19% 16% 0% 47 Two 29% 52% 14% 5% 1% 345 Three or more 24% 57% 11% 7% 0% 115
Children in Household None 26% 49% 15% 9% 0% 290 One 22% 63% 10% 4% 1% 97 Two 29% 55% 15% 1% 0% 87 Three or More 50% 38% 7% 5% 0% 33
Satisfaction - Facility Satisfied 28% 53% 12% 7% 0% 123 Neutral/DK 15% 46% 21% 18% 1% 123 Dissatisfied 33% 55% 11% 1% 0% 258
Trust Board & Admin A Great Deal 50% 39% 6% 4% 0% 78 Some 17% 62% 17% 3% 0% 216 Not Much/Not At All/DK 30% 47% 12% 11% 0% 211
___________________________________________________________________________________________________________________________________________________________________

The University of New Hampshire A - 10 Newmarket School FacilitiesSurvey Center April, 2008
Q8: If a school bond article to build a new Newmarket junior/senior high school, similar to the last proposal of $32 million plus inflation of 5%, were included on theMarch 2009 local election ballot, do you think you would vote for or against such an article
___________________________________________________________________________________________________________________________________________________________________ Would Vote For Would Vote Against Don t Know/ Number Not Sure Responding___________________________________________________________________________________________________________________________________________________________________All Newmarket Residents 41% 53% 6% 508
Age 18 to 29 52% 48% 0% 48 30 to 39 71% 20% 9% 83 40 to 49 55% 40% 5% 131 50 to 59 25% 69% 7% 121 60 or older 16% 77% 7% 113
Sex Male 36% 58% 5% 251 Female 46% 48% 6% 256
Education High school or less 30% 65% 5% 120 Technical school/Some college 31% 60% 9% 135 College graduate 52% 45% 3% 157 Postgraduate work 50% 42% 8% 96
Has children in Jr/Sr HS Yes 50% 44% 6% 95 No 39% 55% 6% 413
Votes in town elections Always vote 38% 58% 5% 324 Usually vote 47% 47% 6% 107 Occasionally/never vote 46% 43% 11% 73
adults in Household One 38% 50% 12% 47 Two 43% 52% 6% 345 Three or more 36% 60% 4% 115
Children in Household None 27% 67% 6% 291 One 56% 39% 5% 97 Two 69% 29% 2% 87 Three or More 48% 37% 15% 33
Knowledge of Solution Very Knowledgeable 40% 58% 1% 139 Somewhat Knowledgeable 44% 51% 5% 264 Not Very/Not At All/DK 35% 50% 15% 102
Satisfaction - Facility Satisfied 15% 84% 2% 125 Neutral/DK 21% 66% 13% 122 Dissatisfied 63% 32% 5% 258
Trust Board & Admin A Great Deal 91% 9% 1% 78 Some 46% 48% 6% 216 Not Much/Not At All/DK 17% 75% 7% 213___________________________________________________________________________________________________________________________________________________________________

The University of New Hampshire A - 11 Newmarket School FacilitiesSurvey Center April, 2008
Q9_1: What would you say are the main reasons why you would vote FOR the bond article for a new Newmarket junior, senior High School. 1st Response
___________________________________________________________________________________________________________________________________________________________________ New Junior Rennovating Worth the Good use of Needed to Other- Don t Know/ Number Senior High existing cost tax Dollars help improve Specify Not Sure Responding School building will quality of Building is not be education Necessary sufficient___________________________________________________________________________________________________________________________________________________________________All Newmarket Residents 50% 10% 3% 5% 20% 10% 3% 207
Age 18 to 29 53% 11% 0% 0% 17% 14% 5% 25 30 to 39 62% 4% 3% 5% 18% 5% 3% 58 40 to 49 44% 11% 3% 6% 21% 13% 1% 72 50 to 59 44% 20% 0% 5% 13% 11% 7% 30 60 or older 36% 13% 8% 3% 35% 6% 0% 18
Sex Male 46% 10% 3% 4% 25% 7% 3% 91 Female 52% 10% 2% 5% 16% 12% 3% 117
Education High school or less 57% 8% 2% 0% 18% 10% 6% 36 Technical school/Some college 33% 16% 7% 6% 25% 13% 0% 42 College graduate 56% 7% 2% 8% 20% 7% 0% 81 Postgraduate work 47% 13% 0% 1% 18% 13% 8% 48
Has children in Jr/Sr HS Yes 49% 7% 0% 0% 22% 18% 4% 47 No 50% 11% 3% 6% 19% 8% 2% 160
Votes in town elections Always vote 44% 12% 2% 3% 23% 13% 2% 122 Usually vote 60% 6% 4% 7% 16% 3% 4% 50 Occasionally/never vote 57% 10% 2% 7% 17% 4% 3% 33
adults in Household One 52% 5% 8% 3% 14% 19% 0% 18 Two 49% 12% 3% 5% 21% 9% 2% 148 Three or more 51% 7% 0% 3% 20% 10% 8% 41
Children in Household None 49% 14% 3% 4% 22% 6% 3% 78 One 47% 7% 3% 7% 18% 14% 3% 54 Two 48% 9% 2% 5% 21% 10% 3% 60 Three or More 67% 6% 0% 0% 12% 15% 0% 16
Knowledge of Solution Very Knowledgeable 45% 14% 4% 2% 23% 12% 0% 56 Somewhat Knowledgeable 52% 9% 3% 7% 17% 9% 4% 115 Not Very/Not At All/DK 50% 8% 0% 3% 26% 11% 3% 36
Satisfaction - Facility Satisfied 50% 22% 0% 5% 15% 7% 0% 18 Neutral/DK 57% 11% 0% 5% 14% 3% 9% 25 Dissatisfied 49% 9% 3% 5% 21% 11% 2% 163
Trust Board & Admin A Great Deal 56% 7% 3% 1% 19% 10% 4% 71 Some 51% 14% 2% 7% 16% 7% 2% 99 Not Much/Not At All/DK 34% 6% 2% 4% 32% 19% 2% 37___________________________________________________________________________________________________________________________________________________________________
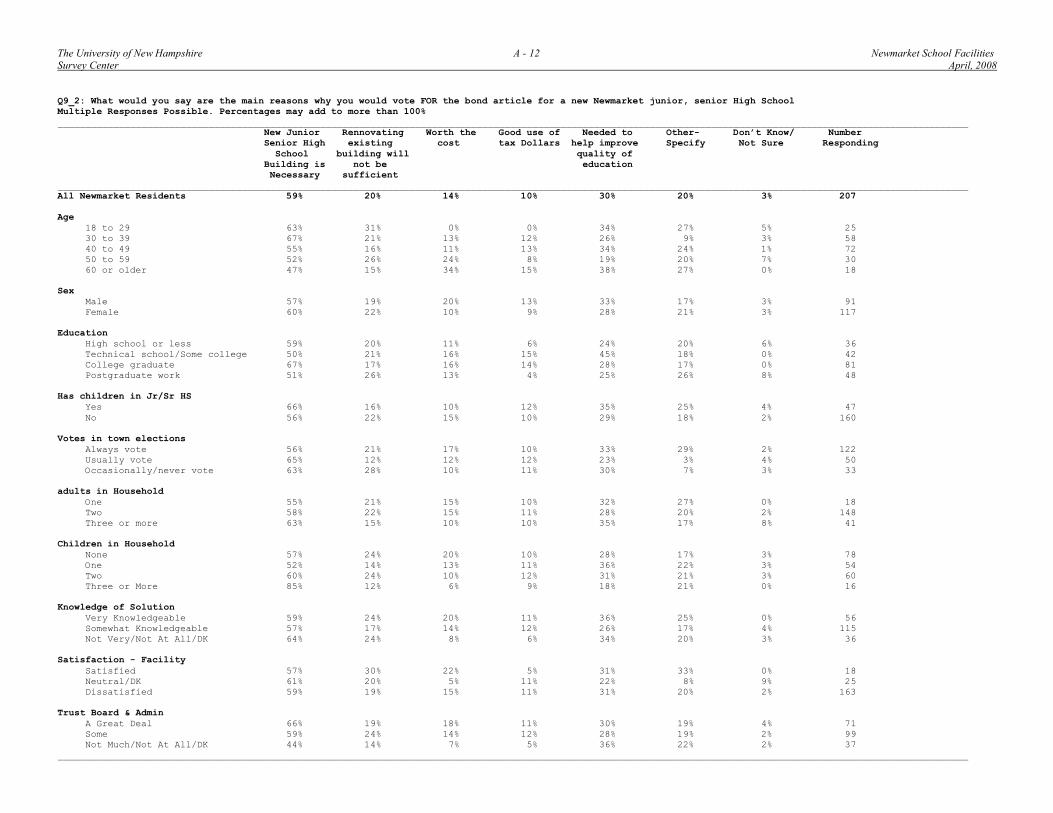
The University of New Hampshire A - 12 Newmarket School FacilitiesSurvey Center April, 2008
Q9_2: What would you say are the main reasons why you would vote FOR the bond article for a new Newmarket junior, senior High SchoolMultiple Responses Possible. Percentages may add to more than 100%___________________________________________________________________________________________________________________________________________________________________ New Junior Rennovating Worth the Good use of Needed to Other- Don t Know/ Number Senior High existing cost tax Dollars help improve Specify Not Sure Responding School building will quality of Building is not be education Necessary sufficient___________________________________________________________________________________________________________________________________________________________________All Newmarket Residents 59% 20% 14% 10% 30% 20% 3% 207
Age 18 to 29 63% 31% 0% 0% 34% 27% 5% 25 30 to 39 67% 21% 13% 12% 26% 9% 3% 58 40 to 49 55% 16% 11% 13% 34% 24% 1% 72 50 to 59 52% 26% 24% 8% 19% 20% 7% 30 60 or older 47% 15% 34% 15% 38% 27% 0% 18
Sex Male 57% 19% 20% 13% 33% 17% 3% 91 Female 60% 22% 10% 9% 28% 21% 3% 117
Education High school or less 59% 20% 11% 6% 24% 20% 6% 36 Technical school/Some college 50% 21% 16% 15% 45% 18% 0% 42 College graduate 67% 17% 16% 14% 28% 17% 0% 81 Postgraduate work 51% 26% 13% 4% 25% 26% 8% 48
Has children in Jr/Sr HS Yes 66% 16% 10% 12% 35% 25% 4% 47 No 56% 22% 15% 10% 29% 18% 2% 160
Votes in town elections Always vote 56% 21% 17% 10% 33% 29% 2% 122 Usually vote 65% 12% 12% 12% 23% 3% 4% 50 Occasionally/never vote 63% 28% 10% 11% 30% 7% 3% 33
adults in Household One 55% 21% 15% 10% 32% 27% 0% 18 Two 58% 22% 15% 11% 28% 20% 2% 148 Three or more 63% 15% 10% 10% 35% 17% 8% 41
Children in Household None 57% 24% 20% 10% 28% 17% 3% 78 One 52% 14% 13% 11% 36% 22% 3% 54 Two 60% 24% 10% 12% 31% 21% 3% 60 Three or More 85% 12% 6% 9% 18% 21% 0% 16
Knowledge of Solution Very Knowledgeable 59% 24% 20% 11% 36% 25% 0% 56 Somewhat Knowledgeable 57% 17% 14% 12% 26% 17% 4% 115 Not Very/Not At All/DK 64% 24% 8% 6% 34% 20% 3% 36
Satisfaction - Facility Satisfied 57% 30% 22% 5% 31% 33% 0% 18 Neutral/DK 61% 20% 5% 11% 22% 8% 9% 25 Dissatisfied 59% 19% 15% 11% 31% 20% 2% 163
Trust Board & Admin A Great Deal 66% 19% 18% 11% 30% 19% 4% 71 Some 59% 24% 14% 12% 28% 19% 2% 99 Not Much/Not At All/DK 44% 14% 7% 5% 36% 22% 2% 37___________________________________________________________________________________________________________________________________________________________________

The University of New Hampshire A - 13 Newmarket School FacilitiesSurvey Center April, 2008
Page 1 of 2Q10_1: What would you say are the main reasons why you would vote against the bond article for a new Newmarket junior, senior High School. 1st Response
___________________________________________________________________________________________________________________________________________________________________ New junior renovating want more too expensive need to know Bad use of Dont know how Unfair tax senior existing information more about tax dollars much property burden building is building will about costs tax not necessary be sufficient renovating involved___________________________________________________________________________________________________________________________________________________________________All Newmarket Residents 5% 12% 4% 37% 4% 8% 2% 14%
Age 18 to 29 0% 23% 0% 32% 6% 8% 3% 14% 30 to 39 0% 0% 9% 57% 0% 3% 0% 0% 40 to 49 2% 13% 3% 42% 4% 5% 4% 12% 50 to 59 7% 13% 4% 33% 3% 9% 1% 12% 60 or older 9% 11% 4% 33% 5% 9% 1% 19%
Sex Male 6% 13% 5% 37% 5% 6% 1% 14% Female 4% 11% 3% 38% 2% 10% 2% 14%
Education High school or less 4% 14% 5% 33% 3% 10% 1% 13% Technical school/Some college 8% 18% 2% 33% 1% 6% 1% 15% College graduate 6% 8% 5% 38% 4% 7% 4% 16% Postgraduate work 2% 6% 2% 53% 10% 9% 0% 8%
Has children in Jr/Sr HS Yes 0% 21% 4% 29% 5% 6% 0% 20% No 6% 11% 4% 39% 4% 8% 2% 12%
Votes in town elections Always vote 6% 12% 4% 37% 3% 8% 2% 13% Usually vote 7% 12% 4% 35% 8% 8% 3% 14% Occasionally/never vote 0% 14% 4% 39% 0% 10% 0% 19%
adults in Household One 1% 2% 4% 35% 4% 15% 3% 26% Two 7% 13% 4% 34% 4% 8% 1% 12% Three or more 4% 14% 4% 45% 3% 5% 3% 13%
Children in Household None 7% 13% 3% 37% 4% 8% 1% 14% One 4% 5% 11% 47% 4% 8% 0% 14% Two 0% 27% 0% 36% 0% 3% 3% 13% Three or More 0% 0% 0% 11% 17% 15% 11% 0%
Knowledge of Solution Very Knowledgeable 6% 16% 1% 34% 8% 12% 3% 9% Somewhat Knowledgeable 5% 11% 5% 41% 2% 5% 2% 13% Not Very/Not At All/DK 2% 10% 5% 34% 3% 8% 0% 22%
Satisfaction - Facility Satisfied 8% 19% 3% 28% 3% 11% 2% 14% Neutral/DK 2% 6% 5% 38% 3% 2% 2% 22% Dissatisfied 6% 11% 4% 47% 6% 8% 1% 4%
Trust Board & Admin A Great Deal 0% 28% 0% 58% 0% 0% 0% 7% Some 2% 16% 4% 45% 1% 7% 2% 11% Not Much/Not At All/DK 8% 9% 4% 32% 6% 9% 2% 15%

The University of New Hampshire A - 14 Newmarket School FacilitiesSurvey Center April, 2008
Page 2 of 2Q10_1: What would you say are the main reasons why you would vote against the bond article for a new Newmarket junior, senior High School _Reason 1___________________________________________________________________________________________________________________________________________________________________ will not help will not Dont trust Dont know Other Number improve benefit me or board/Admin enough about (specify) Responding quality of my family the plan education___________________________________________________________________________________________________________________________________________________________________All Newmarket Residents 1% 1% 1% 2% 10% 269
Age 18 to 29 0% 0% 0% 2% 13% 23 30 to 39 9% 0% 0% 0% 23% 16 40 to 49 2% 1% 0% 2% 11% 52 50 to 59 2% 0% 2% 3% 10% 83 60 or older 0% 1% 1% 2% 5% 87
Sex Male 1% 0% 1% 2% 9% 147 Female 2% 1% 1% 2% 10% 122
Education High school or less 2% 0% 2% 1% 13% 78 Technical school/Some college 0% 1% 2% 3% 10% 81 College graduate 0% 1% 0% 3% 9% 70 Postgraduate work 6% 0% 0% 0% 3% 41
Has children in Jr/Sr HS Yes 6% 1% 0% 2% 5% 42 No 1% 0% 1% 2% 10% 228
Votes in town elections Always vote 2% 1% 2% 1% 11% 186 Usually vote 0% 0% 0% 2% 7% 50 Occasionally/never vote 0% 0% 0% 6% 8% 31
adults in Household One 0% 2% 0% 2% 7% 24 Two 1% 1% 2% 3% 10% 177 Three or more 2% 0% 0% 0% 8% 69
Children in Household None 0% 0% 2% 2% 9% 195 One 2% 1% 0% 0% 4% 38 Two 0% 0% 0% 0% 19% 24 Three or More 23% 0% 0% 8% 15% 12
Knowledge of Solution Very Knowledgeable 2% 1% 2% 3% 5% 81 Somewhat Knowledgeable 2% 0% 1% 1% 13% 135 Not Very/Not At All/DK 0% 2% 2% 4% 9% 51
Satisfaction - Facility Satisfied 3% 0% 2% 0% 7% 104 Neutral/DK 0% 2% 0% 5% 13% 80 Dissatisfied 1% 0% 1% 2% 9% 82
Trust Board & Admin A Great Deal 0% 0% 0% 7% 0% 7 Some 1% 0% 0% 2% 10% 102 Not Much/Not At All/DK 1% 1% 2% 2% 10% 161___________________________________________________________________________________________________________________________________________________________________

The University of New Hampshire A - 15 Newmarket School FacilitiesSurvey Center April, 2008
Page 1 of 2Q10_2: What would you say are the main reasons why you would vote against the bond article for a new Newmarket junior, senior High SchoolMultiple Responses Possible. Percentages may add to more than 100%
___________________________________________________________________________________________________________________________________________________________________ New junior renovating want more too expensive need to know Bad use of Dont know how Unfair tax senior existing information more about tax dollars much property burden building is building will about costs tax not necessary be sufficient renovating involved___________________________________________________________________________________________________________________________________________________________________All Newmarket Residents 9% 18% 9% 46% 8% 15% 3% 24%
Age 18 to 29 9% 31% 0% 48% 6% 20% 3% 20% 30 to 39 0% 0% 9% 59% 9% 12% 9% 35% 40 to 49 5% 15% 7% 49% 9% 17% 4% 20% 50 to 59 11% 19% 14% 44% 3% 11% 3% 23% 60 or older 14% 18% 7% 42% 12% 15% 3% 30%
Sex Male 11% 18% 11% 48% 10% 14% 5% 25% Female 7% 17% 6% 44% 5% 16% 2% 24%
Education High school or less 11% 21% 11% 45% 9% 15% 3% 25% Technical school/Some college 10% 22% 11% 42% 3% 17% 2% 19% College graduate 7% 8% 6% 44% 8% 12% 8% 31% Postgraduate work 9% 19% 5% 62% 12% 15% 0% 23%
Has children in Jr/Sr HS Yes 5% 21% 13% 39% 10% 9% 0% 28% No 10% 17% 8% 48% 7% 16% 4% 24%
Votes in town elections Always vote 10% 18% 9% 45% 7% 14% 3% 21% Usually vote 10% 16% 11% 44% 11% 19% 5% 28% Occasionally/never vote 0% 14% 4% 52% 4% 14% 4% 38%
adults in Household One 9% 7% 6% 51% 13% 22% 6% 38% Two 11% 19% 10% 41% 7% 15% 3% 22% Three or more 6% 17% 7% 57% 8% 12% 3% 27%
Children in Household None 12% 20% 8% 48% 7% 14% 3% 25% One 4% 5% 21% 52% 13% 15% 4% 31% Two 4% 27% 0% 44% 0% 20% 3% 16% Three or More 0% 0% 0% 11% 17% 15% 11% 15%
Knowledge of Solution Very Knowledgeable 9% 21% 8% 43% 12% 19% 3% 14% Somewhat Knowledgeable 10% 17% 10% 48% 4% 13% 4% 24% Not Very/Not At All/DK 5% 15% 7% 45% 9% 14% 3% 42%
Satisfaction - Facility Satisfied 11% 22% 6% 40% 3% 18% 2% 26% Neutral/DK 6% 12% 7% 45% 10% 9% 4% 29% Dissatisfied 11% 18% 14% 55% 11% 17% 4% 17%
Trust Board & Admin A Great Deal 0% 28% 0% 79% 0% 0% 0% 37% Some 5% 23% 8% 55% 1% 11% 4% 24% Not Much/Not At All/DK 12% 13% 10% 39% 12% 18% 3% 24%

The University of New Hampshire A - 16 Newmarket School FacilitiesSurvey Center April, 2008
Page 2 of 2Q10_2: What would you say are the main reasons why you would vote against the bond article for a new Newmarket junior, senior High SchoolMultiple Responses Possible. Percentages may add to more than 100%___________________________________________________________________________________________________________________________________________________________________ will not help will not Dont trust Dont know Other Number improve benefit me or board/Admin enough about (specify) Responding quality of my family the plan education___________________________________________________________________________________________________________________________________________________________________All Newmarket Residents 4% 1% 3% 3% 15% 269
Age 18 to 29 0% 0% 0% 2% 13% 23 30 to 39 9% 0% 9% 0% 26% 16 40 to 49 3% 1% 0% 2% 24% 52 50 to 59 3% 0% 5% 3% 16% 83 60 or older 6% 1% 3% 4% 9% 87
Sex Male 4% 0% 5% 3% 13% 147 Female 4% 1% 2% 3% 18% 122
Education High school or less 3% 0% 4% 1% 17% 78 Technical school/Some college 4% 1% 3% 4% 17% 81 College graduate 2% 1% 0% 5% 11% 70 Postgraduate work 9% 0% 7% 0% 15% 41
Has children in Jr/Sr HS Yes 10% 1% 0% 2% 13% 42 No 3% 0% 4% 3% 16% 228
Votes in town elections Always vote 4% 1% 5% 2% 17% 186 Usually vote 2% 0% 0% 2% 13% 50 Occasionally/never vote 4% 0% 0% 6% 8% 31
adults in Household One 4% 2% 3% 2% 10% 24 Two 5% 1% 4% 4% 15% 177 Three or more 2% 0% 0% 0% 17% 69
Children in Household None 3% 0% 3% 3% 15% 195 One 7% 1% 4% 0% 14% 38 Two 0% 0% 6% 0% 23% 24 Three or More 23% 0% 0% 8% 15% 12
Knowledge of Solution Very Knowledgeable 6% 1% 4% 4% 12% 81 Somewhat Knowledgeable 3% 0% 3% 1% 19% 135 Not Very/Not At All/DK 4% 2% 5% 6% 9% 51
Satisfaction - Facility Satisfied 4% 0% 5% 1% 8% 104 Neutral/DK 3% 2% 1% 6% 21% 80 Dissatisfied 4% 0% 4% 2% 19% 82
Trust Board & Admin A Great Deal 0% 0% 0% 7% 21% 7 Some 3% 0% 1% 2% 11% 102 Not Much/Not At All/DK 5% 1% 5% 3% 17% 161___________________________________________________________________________________________________________________________________________________________________

The University of New Hampshire A - 17 Newmarket School FacilitiesSurvey Center April, 2008
Q11: How much do you trust the current Newmarket school board and administration in making the right decision about the future of the Newmarket junior, senior HighSchool___________________________________________________________________________________________________________________________________________________________________ A great deal Some Not Not Don t Know/ Number Much At All Not Sure Responding___________________________________________________________________________________________________________________________________________________________________All Newmarket Residents 15% 43% 18% 15% 8% 508
Age 18 to 29 13% 66% 12% 6% 3% 48 30 to 39 26% 38% 18% 7% 11% 83 40 to 49 20% 43% 16% 14% 7% 131 50 to 59 11% 45% 13% 22% 9% 121 60 or older 8% 34% 31% 17% 11% 113
Sex Male 12% 44% 19% 17% 8% 251 Female 18% 41% 18% 14% 9% 256
Education High school or less 10% 50% 19% 13% 8% 120 Technical school/Some college 15% 38% 22% 17% 8% 135 College graduate 19% 39% 18% 14% 10% 157 Postgraduate work 17% 46% 11% 19% 8% 96
Has children in Jr/Sr HS Yes 24% 41% 26% 6% 3% 95 No 13% 43% 16% 18% 10% 413
Votes in town elections Always vote 17% 39% 19% 20% 5% 324 Usually vote 9% 51% 21% 9% 10% 107 Occasionally/never vote 14% 48% 11% 7% 21% 73
adults in Household One 15% 33% 12% 26% 14% 47 Two 17% 42% 18% 14% 9% 345 Three or more 11% 49% 20% 15% 4% 115
Children in Household None 10% 41% 19% 19% 11% 291 One 22% 47% 19% 6% 6% 97 Two 26% 43% 14% 10% 6% 87 Three or More 14% 43% 17% 23% 3% 33
Knowledge of Solution Very Knowledgeable 28% 26% 20% 22% 3% 139 Somewhat Knowledgeable 12% 51% 19% 13% 6% 264 Not Very/Not At All/DK 8% 45% 13% 13% 21% 102
Satisfaction - Facility Satisfied 3% 43% 24% 22% 8% 125 Neutral/DK 9% 35% 20% 18% 18% 122 Dissatisfied 25% 46% 14% 11% 4% 258

The University of New Hampshire A - 18 Newmarket School FacilitiesSurvey Center April, 2008
Vote: How often do you vote in local elections?
___________________________________________________________________________________________________________________________________________________________________ Always Usually Occasionally/ Number Vote Vote Never Vote Responding___________________________________________________________________________________________________________________________________________________________________All Newmarket Residents 64% 21% 15% 505
Age 18 to 29 26% 29% 45% 45 30 to 39 46% 35% 19% 83 40 to 49 74% 19% 7% 133 50 to 59 69% 16% 15% 120 60 or older 77% 14% 9% 113
Sex Male 66% 19% 15% 249 Female 62% 24% 14% 255
Education High school or less 57% 19% 24% 118 Technical school/Some college 68% 18% 14% 135 College graduate 60% 27% 13% 156 Postgraduate work 75% 19% 6% 96
Has children in Jr/Sr HS Yes 71% 19% 10% 95 No 63% 22% 16% 410
adults in Household One 61% 14% 25% 47 Two 69% 19% 12% 345 Three or more 52% 30% 18% 113
Children in Household None 66% 18% 16% 289 One 57% 27% 17% 96 Two 65% 23% 12% 87 Three or More 69% 28% 3% 33
Knowledge of Solution Very Knowledgeable 90% 8% 2% 139 Somewhat Knowledgeable 60% 28% 12% 261 Not Very/Not At All/DK 39% 22% 39% 102
Satisfaction - Facility Satisfied 69% 20% 11% 123 Neutral/DK 49% 20% 31% 124 Dissatisfied 69% 23% 8% 255
Trust Board & Admin A Great Deal 73% 13% 13% 75 Some 59% 25% 16% 216 Not Much/Not At All/DK 67% 20% 13% 211___________________________________________________________________________________________________________________________________________________________________