
Newman Variable Extrusion Moistureceramics.org/.../05/newman-variable-extrusion-moisture.pdf ·...
46
“The Effects of Variable Extrusion Moisture on Extrusion, Drying, and Fired Physical Properties of a Shale Body and How Extrusions Aids Can Effect the Properties” Harold B. Newman Pine Hall Brick
Transcript of Newman Variable Extrusion Moistureceramics.org/.../05/newman-variable-extrusion-moisture.pdf ·...

“The Effects of Variable Extrusion Moisture on Extrusion,
Drying, and Fired Physical Properties of a Shale Body and
How Extrusions Aids Can Effect the Properties”Harold B. Newman
Pine Hall Brick

Topics to be Discussed
• Variable Moisture Content-Factors• Green Strength Properties• Drying Shrinkage Properties• Cold Water Absorption Properties• Body Additives
Soda Ash Lignosulfonate


OUT OF CONTROL
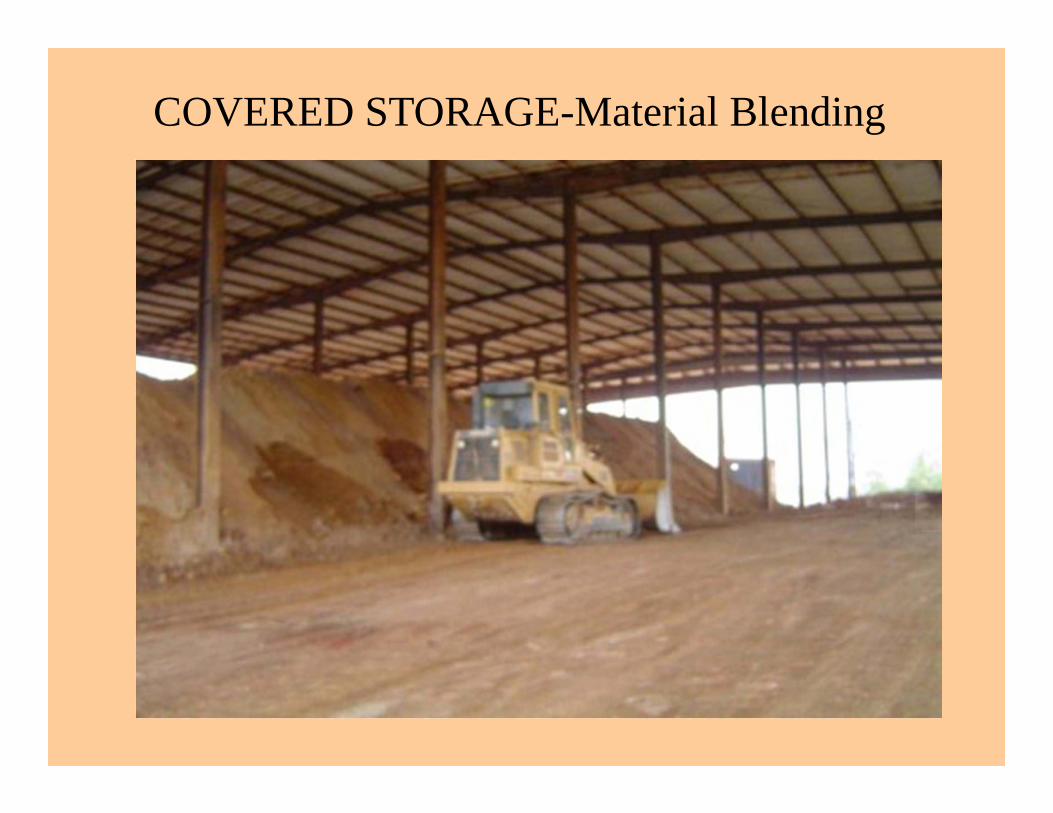
COVERED STORAGE-Material Blending
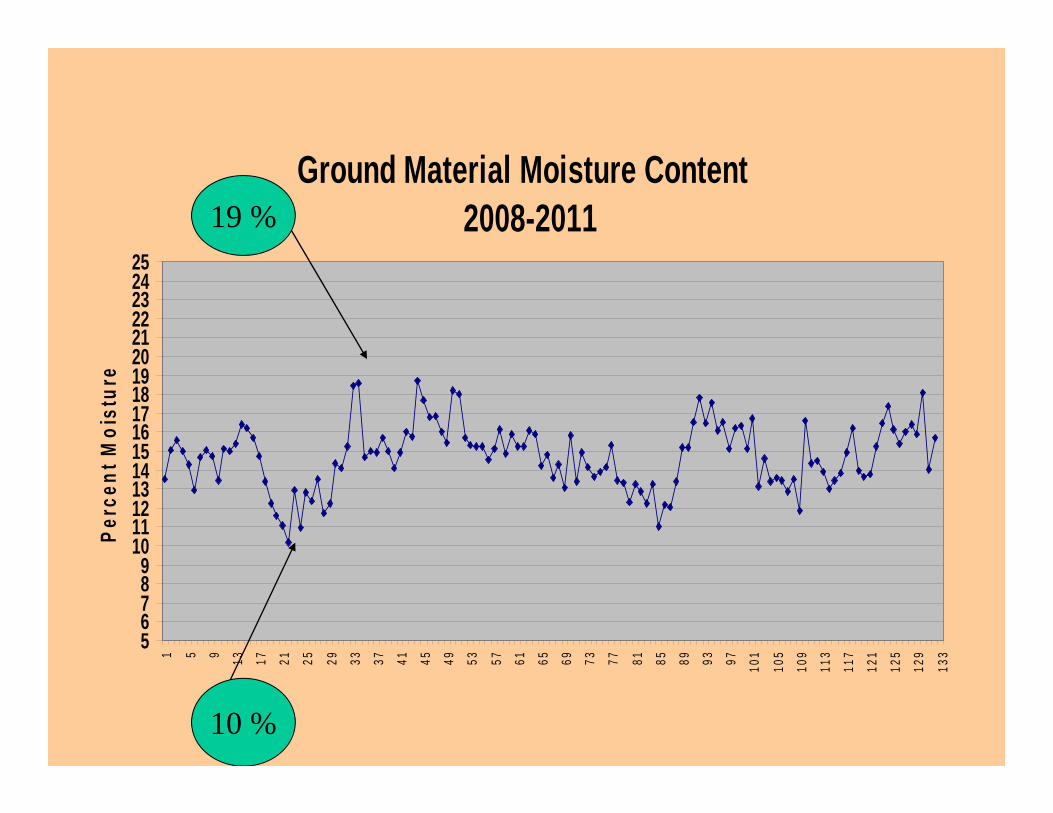
Ground Material Moisture Content 2008-2011
56789
10111213141516171819202122232425
1 5 9 13 17 21 25 29 33 37 41 45 49 53 57 61 65 69 73 77 81 85 89 93 97 101
105
109
113
117
121
125
129
133
Perc
ent M
oist
ure
10 %
19 %19 %
10 %
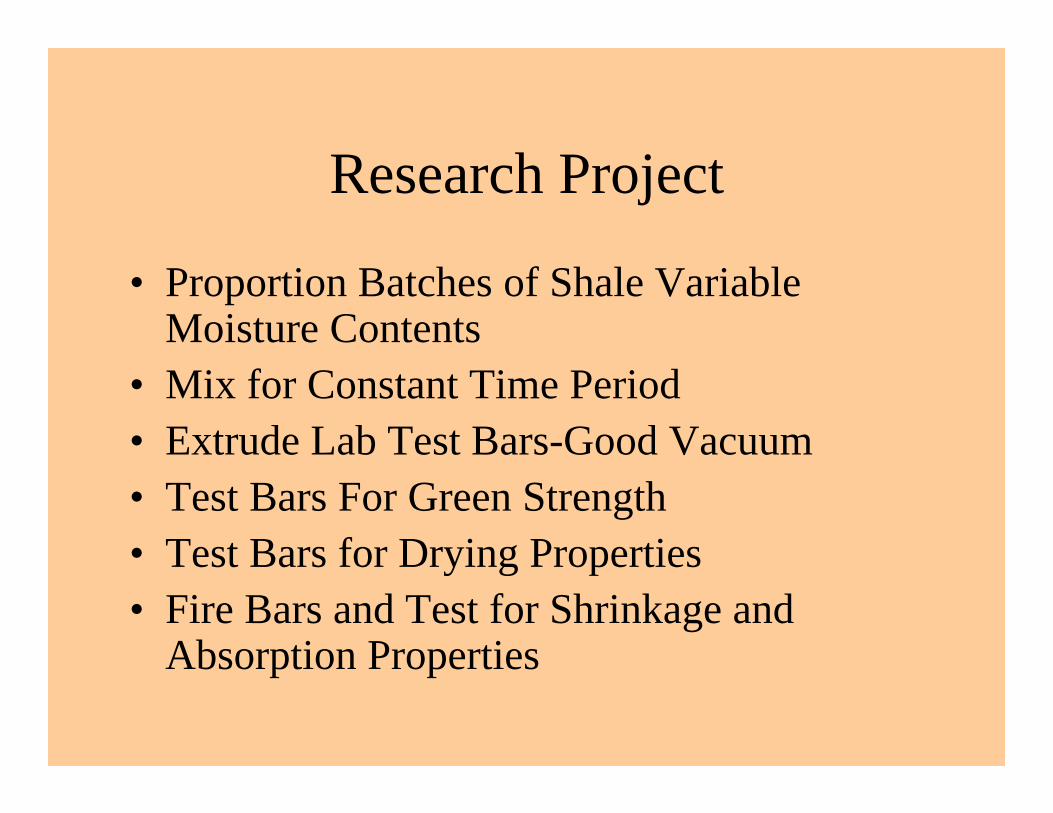
Research Project
• Proportion Batches of Shale Variable Moisture Contents
• Mix for Constant Time Period• Extrude Lab Test Bars-Good Vacuum• Test Bars For Green Strength• Test Bars for Drying Properties• Fire Bars and Test for Shrinkage and
Absorption Properties

Add to Mixer

Add Controlled Amounts of Water
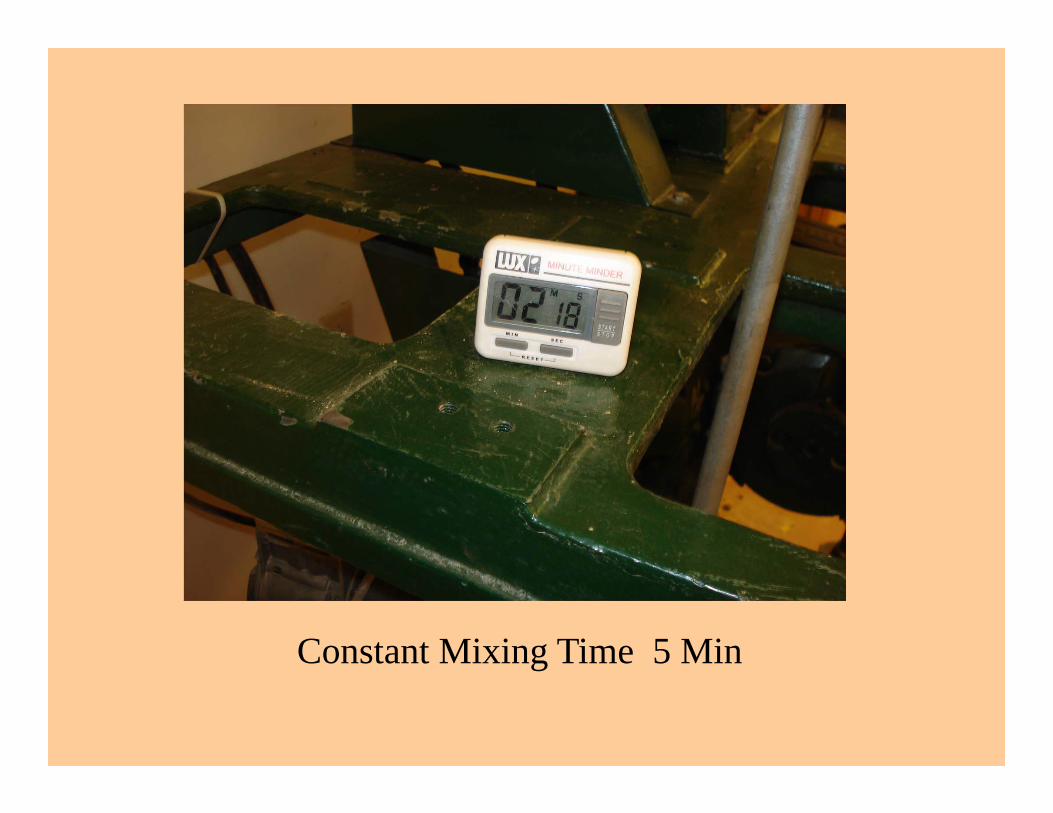
Constant Mixing Time 5 Min

Discharge Mixed Material

Check Consistency

Maintain Good Vacuum

Extrude Bars with Good Vacuum
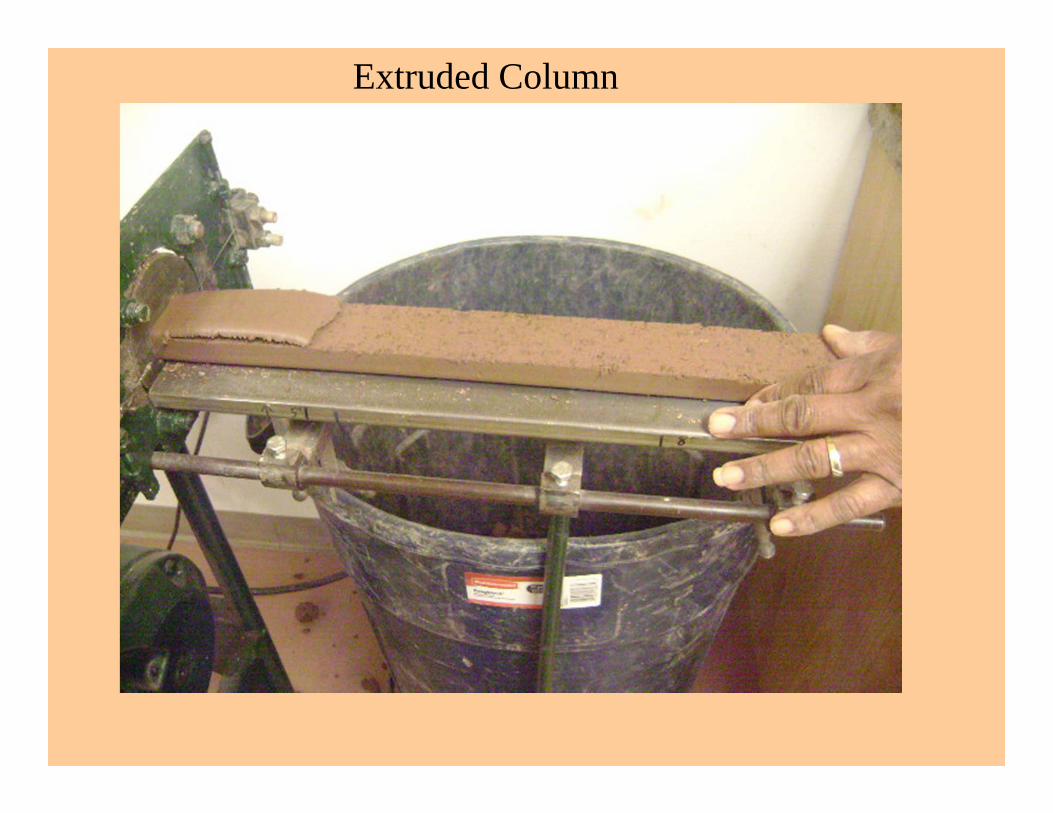
Extruded Column

Cut Sample Bars for Testing

Test Bars
• Green weight• Dry weight• Column hardness• Green strength
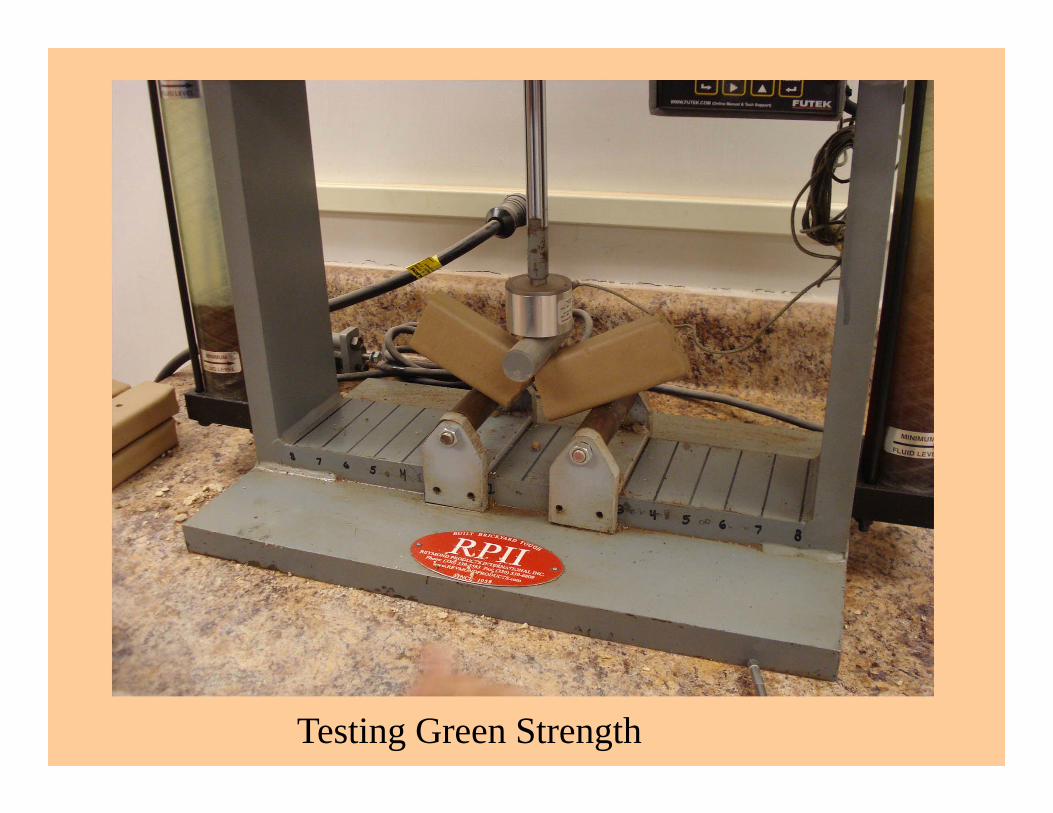
Testing Green Strength

Record the Data

Recording the Sample WeightDetermine Moisture Content

Shale Body Green Strength Vs Extrusion Moisture
101520253035404550556065
18 18.5 19 19.5 20 20.5 21 21.5 22 22.5 23 23.5 24 24.5 25 25.5 26Moisture Content
Gre
en S
treng
th
ShaleSoda Ash
Lignosulfonate

Shale Mix Body Additions Green Strength Vs Extrusion Moisture Sensitivity
21 -24 % Linear Regression Lines
y = -11x + 290R2 = 0.9934
y = -12.2x + 305.5R2 = 0.9976
y = -4.4x + 128R2 = 0.9132
0
10
20
30
40
50
60
70
18 19 20 21 22 23 24 25Moisture Content
Gre
en S
tren
gth
Shale Mix - 11
Lignosulfonate Mix -4.4
Soda Ash Mix - 12.2

SHALE MIX BODY ADDITIONS GREEN STRENGTH
21 % AND 24 % EXTRUSION MOISTURE
0
10
20
30
40
50
60
70
GR
EEN
STR
ENG
TH
21% Moisture 60 34 5024% Moisture 27 21 13
SHALE .25 % AA .2% S ASH

Shale Body Dry Shrinkage Vs Moisture Content
00.5
11.5
22.5
33.5
44.5
55.5
6
18 18.5 19 19.5 20 20.5 21 21.5 22 22.5 23 23.5 24 24.5 25 25.5 26Moisture Content
Perc
ent S
hrin
kage
Shale
Ligno
Soda Ash

SHALE MIX BODY ADDITIONS PERCENT DRY SHRINKAGE
21% AND 24 % EXTRUSION MOISTURE
0
1
2
3
4
5
6
PER
CEN
T SH
RIN
KA
GE
21% Moisture 2.9 3.46 3.8524% Moisture 4.4 4.8 4.7
SHALE .25 % AA .2% S ASH
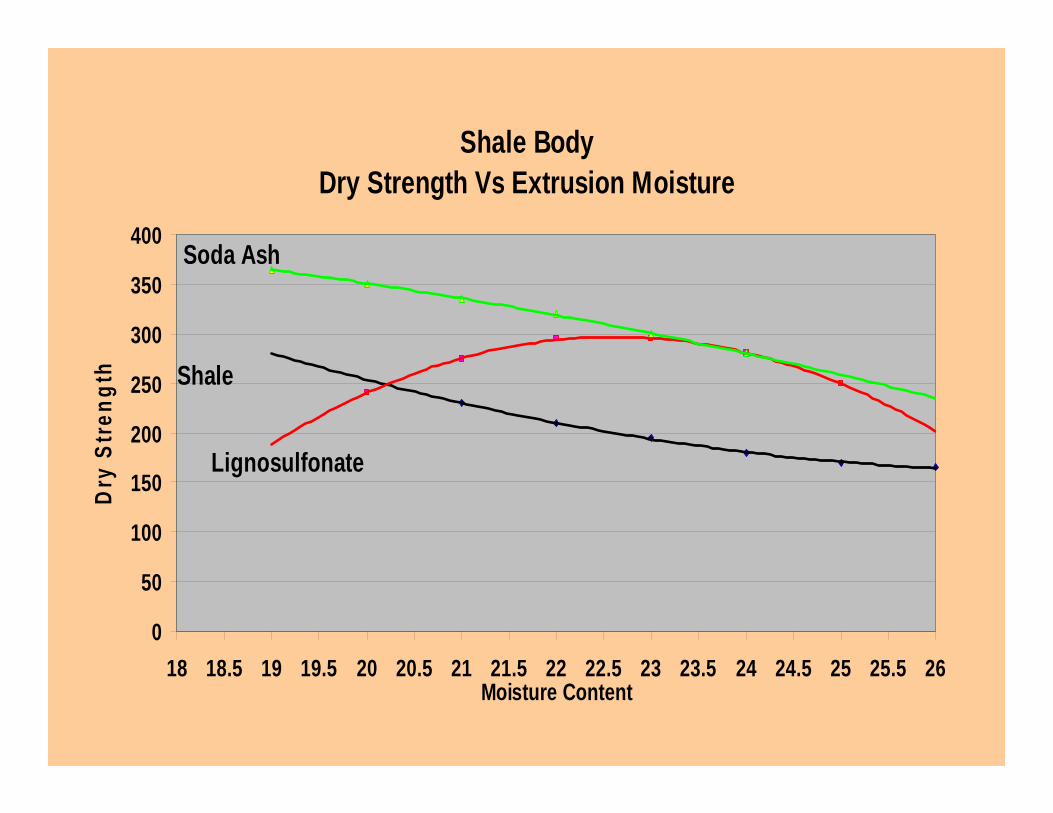
Shale Body Dry Strength Vs Extrusion Moisture
0
50
100
150
200
250
300
350
400
18 18.5 19 19.5 20 20.5 21 21.5 22 22.5 23 23.5 24 24.5 25 25.5 26Moisture Content
Dry
Str
engt
h Shale
Soda Ash
Lignosulfonate
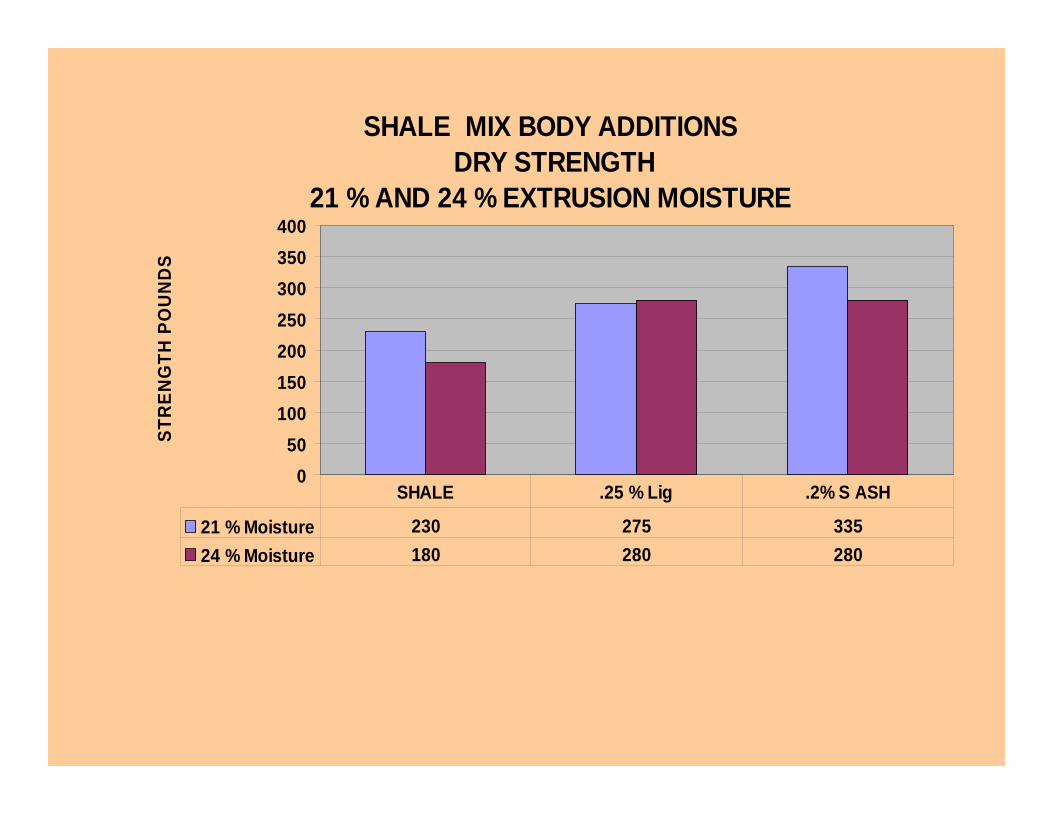
SHALE MIX BODY ADDITIONS DRY STRENGTH
21 % AND 24 % EXTRUSION MOISTURE
050
100150200250300350400
STR
ENG
TH P
OU
ND
S
21 % Moisture 230 275 33524 % Moisture 180 280 280
SHALE .25 % Lig .2% S ASH

Shale Body Cold Water Absorption Vs Extrusion Moisture
44.5
55.5
66.5
77.5
88.5
99.510
18 18.5 19 19.5 20 20.5 21 21.5 22 22.5 23 23.5 24 24.5 25 25.5 26Moisture Content
Perc
ent
Shale
Lignosulfonate
Soda Ash

SHALE MIX BODY ADDITIONS 24 HR COLD WATER ABSORPTION
21 % AND 24 % EXTRUSION MOISTURE
0123456789
PER
CEN
T A
BSO
RPT
ION
21 % Moisture 6 5.7 624 % Moisture 7.75 7.25 6.9
SHALE .25 % Lig .2 %S ASH

Shale Body Total Shrinkage Vs Extrusion Moisture
55.5
66.5
77.5
88.5
99.510
18 18.5 19 19.5 20 20.5 21 21.5 22 22.5 23 23.5 24 24.5 25 25.5 26Moisture Content
Perc
ent
Shale
Lignosulfonate
Soda Ash

PLANT STUDY
Old PlantHand Hack
Tumbled Line16 Wide Kiln

Monitor Plant Conditions
• Moisture of Ground Dirt• Moisture of Dirt Fed to Pug Mill• Manual Water Addition Rate-Die Oil Pressure• Production Rate• Vacuum Level• Green Brick Moisture• Green Strength-Penetrometer• Additive Feed Rate
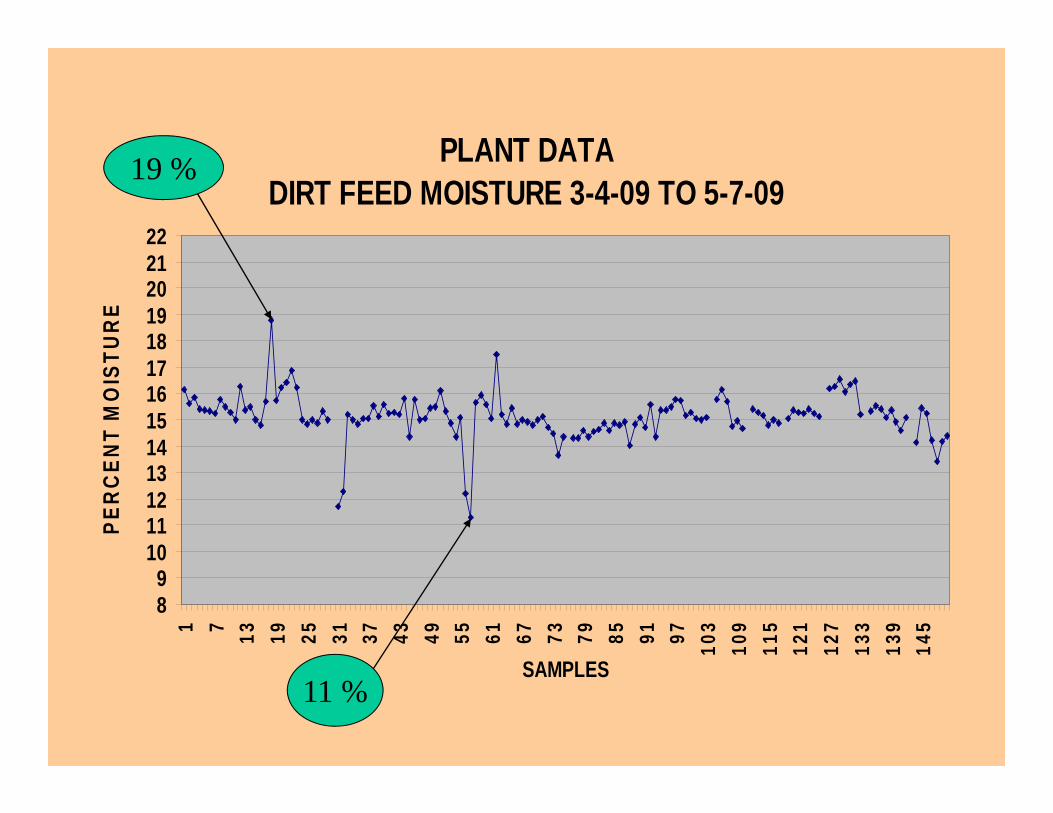
PLANT DATA DIRT FEED MOISTURE 3-4-09 TO 5-7-09
89
10111213141516171819202122
1 7 13 19 25 31 37 43 49 55 61 67 73 79 85 91 97 103
109
115
121
127
133
139
145
SAMPLES
PER
CEN
T M
OIS
TUR
E
11 %
19 %19 %
11 %
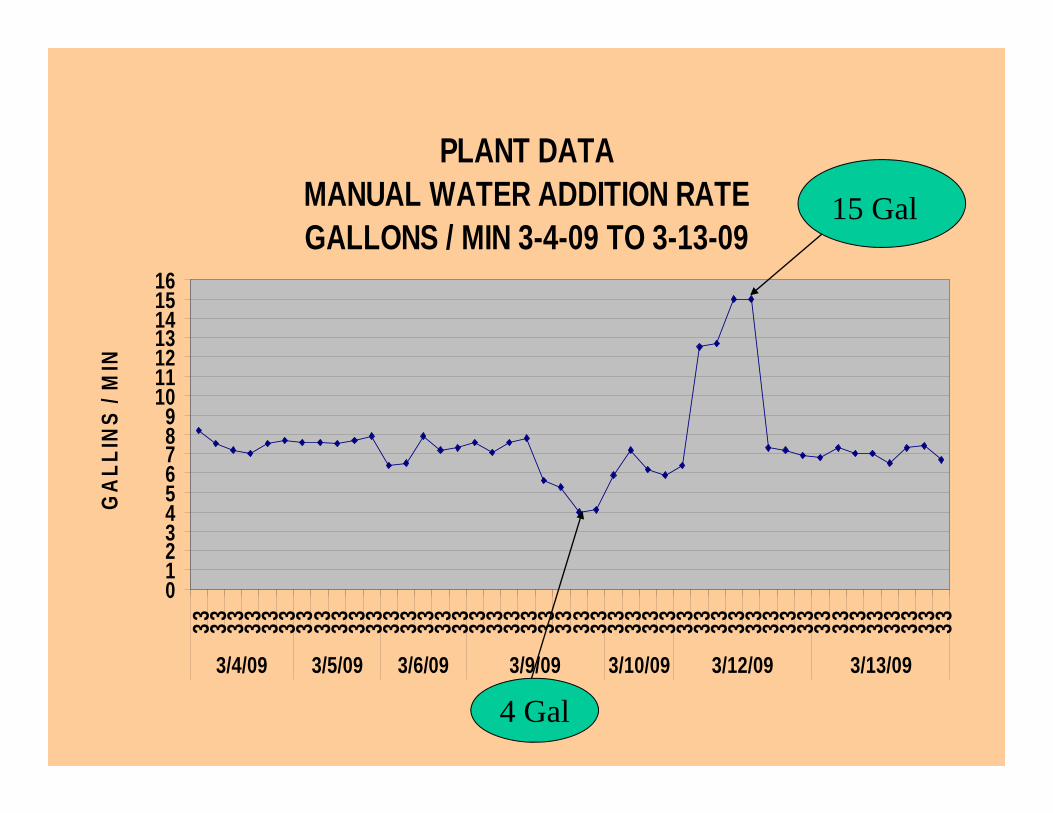
PLANT DATA MANUAL WATER ADDITION RATE GALLONS / MIN 3-4-09 TO 3-13-09
0123456789
10111213141516
33 33 33 33 33 33 33 33 33 33 33 33 33 33 33 33 33 33 33 33 33 33 33 33 33 33 33 33 33 33 33 33 33 33 33 33 33 33 33 33 33 33 33 33
3/4/09 3/5/09 3/6/09 3/9/09 3/10/09 3/12/09 3/13/09
GA
LLIN
S / M
IN
15 Gallons15 Gal
4 Gal

PLANT DATA EXTRUDED BRICK MOISTURE
3-4-09 TO 5-7-09
14.014.515.015.516.016.517.017.518.018.519.019.520.020.521.021.522.0
1 6 11 16 21 26 31 36 41 46 51 56 61 66 71 76 81 86 91 96 101
106
111
116
121
126
131
136
141
146
SAMPLES
PER
CEN
T M
OIS
TUR
E
20.5
16.5
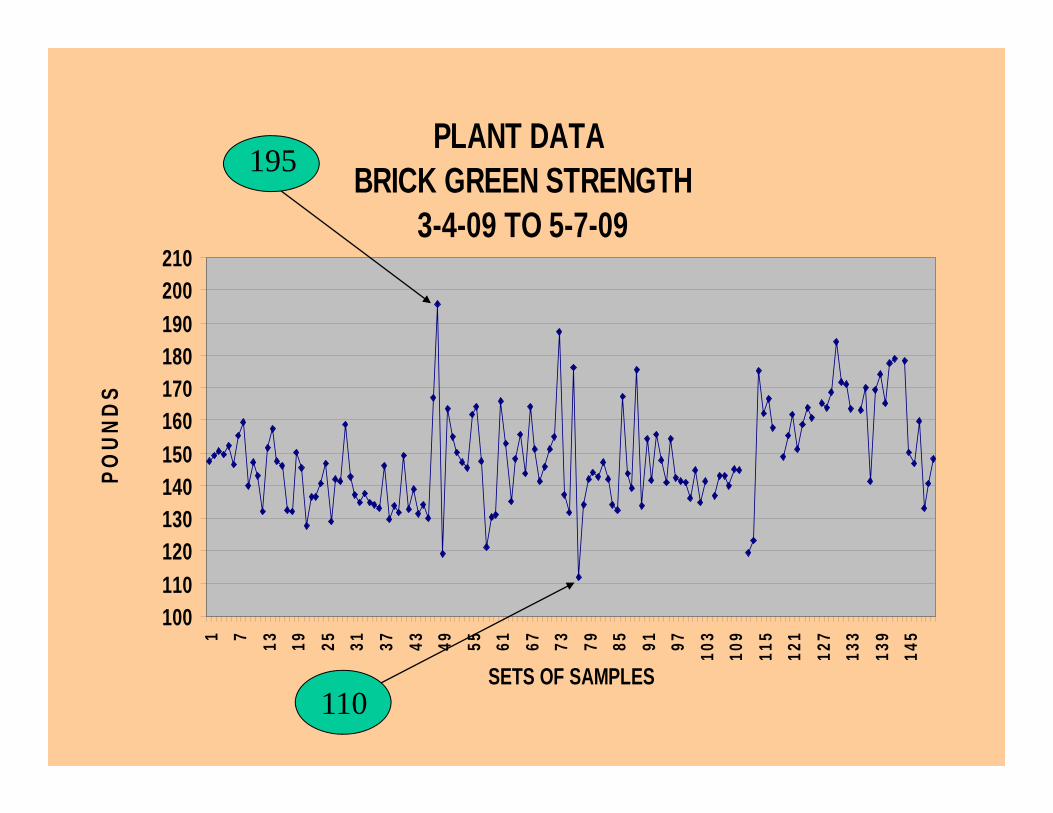
PLANT DATA BRICK GREEN STRENGTH
3-4-09 TO 5-7-09
100110120130140150160170180190200210
1 7 13 19 25 31 37 43 49 55 61 67 73 79 85 91 97 103
109
115
121
127
133
139
145
SETS OF SAMPLES
POU
ND
S
195
110

PLANT DATAPENETROMETER READINGS
3-4-09 TO 5-7-09
0.00.51.01.52.02.53.03.54.04.55.05.56.0
1 7 13 19 25 31 37 43 49 55 61 67 73 79 85 91 97 103
109
115
121
127
133
139
145
SAMPLE SETS
CO
LUM
N H
AR
DN
ESS
5.5
2.0
5.5
2.0

THINGS OUT OF CONTROL

PLANT TEST CONTROLLED MOISTURE CONTENT TEST
GREEN STRENGTH VS MOISTURE CONTENT
100110120130140150160170180190
15 15.5 16 16.5 17 17.5 18 18.5 19 19.5 20 20.5 21
PERCENT MOISTURE CONTENT
GR
EEN
STR
ENG
TH

PLANT DATAVARIED MOISTURE CONTENT
GREEN STRENGTH VS PENETROMETER
100110120130140150160170180190200
2 2.5 3 3.5 4 4.5 5 5.5 6PENETROMETER
GR
EEN
STR
ENG
TH

PLANT TESTS CONTROLLED EXTRUSION MOISTURE
GREEN STRENGTH VS EXTRUDER AMPS
5060708090
100110120130140150160170180190200210
300 350 400 450 500 550 600AMPS
POU
ND
S

Action Taken
• Installed a Moisture Control System-In House • Monitor Incoming Dirt Feed Rate and Moisture
Content• Control Water Addition and Additive Feed Rate
Based on Incoming Dirt Feed Rate• Eliminated Manual Water Feed Adjustments• Control Moisture Feed Rate Based on
Automatic Continuous Penetrometer Readings

RESULTS
• Got Control of Extrusion Process Moisture Addition Rate Additive Feed Rate Production Rate
• Set Target Penetrometer Reading at 3.9• Improved Green Brick Quality• Improved Brick Hack Quality• Allowed Control of Drying Process
• Increased Recovery Rate by 5-7 %

Potential Value 6 % Increase in Recovery
• 40 Million Brick Production
• 2.4 Million Extra Brick to Sell
• Market Value $225 / M
• Increased Revenue $540,000
• 75 Million Brick Production
• 4.5 Million Extra Brick to Sell
• Market Value $225 / M
• Increased Revenue $1,012,500

Message to Sales
“We Got Extra Brick” “You Need to Sell Them”