
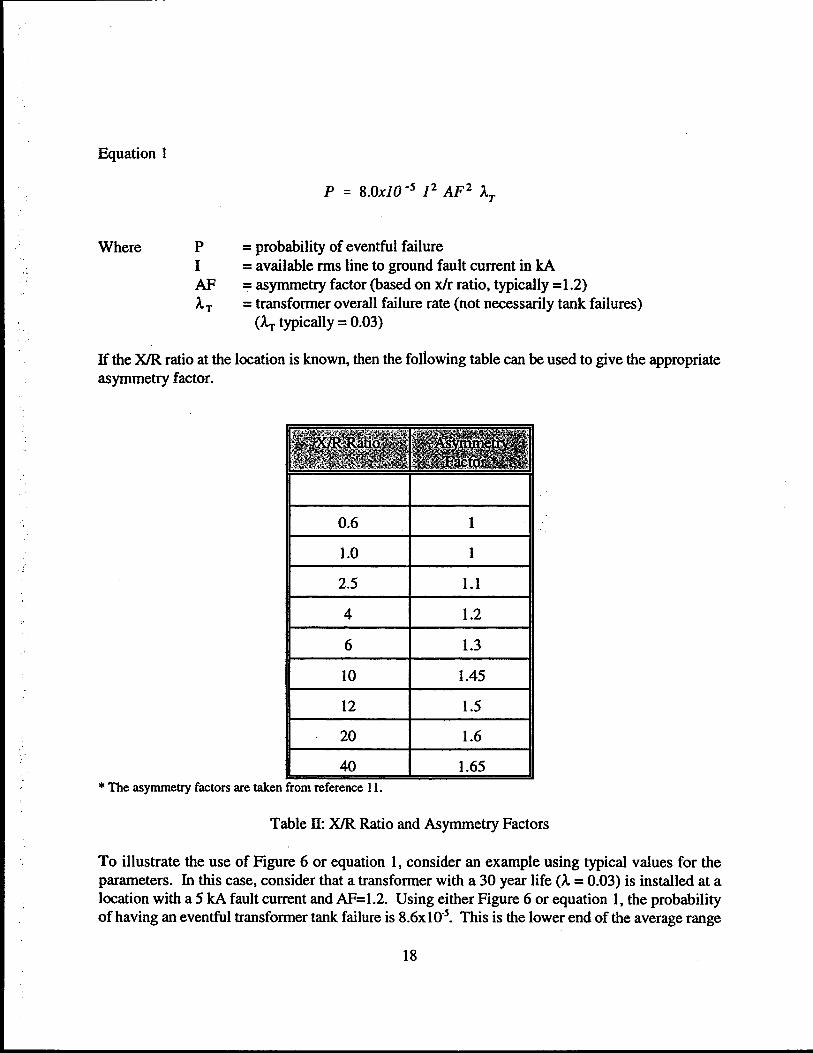
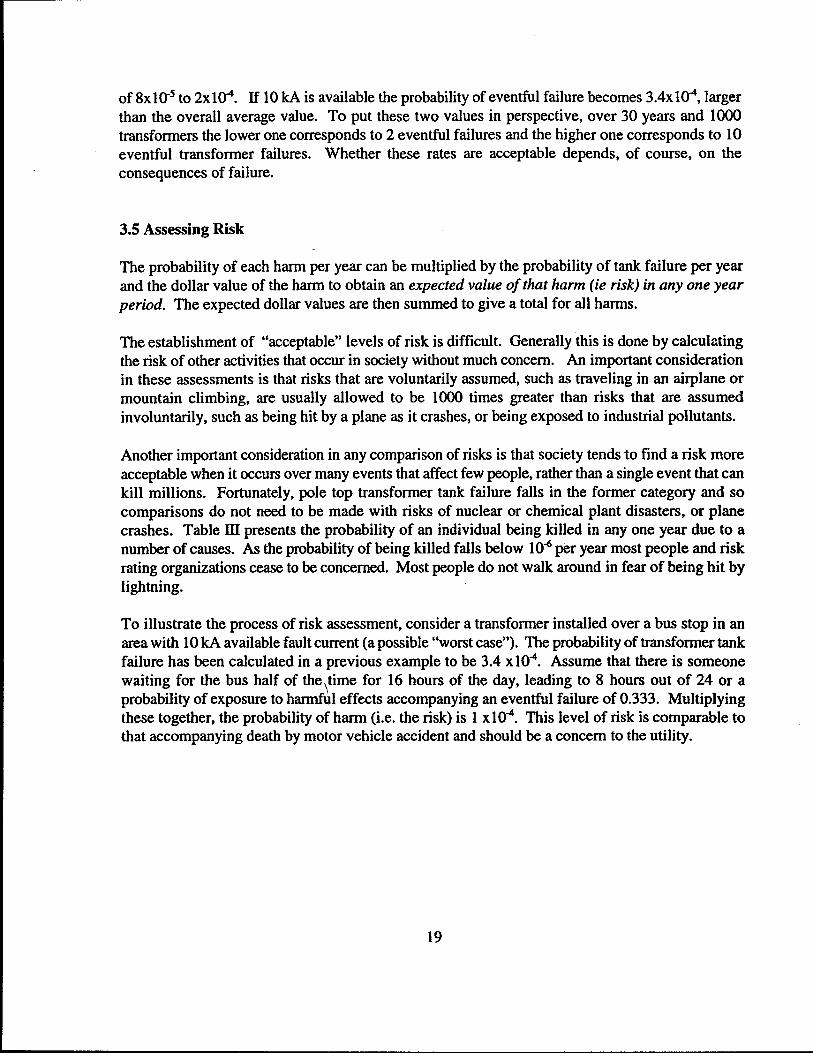
Newfoundland Power 2004 Capital Budget Application Filing Contents ... · July 25, 2003 Page 1 of 3...
231
July 25, 2003 Page 1 of 3 Newfoundland Power 2004 Capital Budget Application Filing Contents Volume I Application, Schedules and Prefiled Evidence Application Schedule A 2004 Capital Budget Summary Schedule B Capital Projects Explanations Schedule C Estimate of Future Required Expenditures on 2004 Projects Schedule D 2002 Rate Base 2003 Capital Expenditure Status Report Information Technology Strategy 2004 - 2008 2004 Capital Budget Plan Changes in Deferred Charges 2003 - 2004 Prefiled Evidence: Ludlow / Delaney Prefiled Evidence: Mulcahy / Collins Prefiled Evidence: Perry / Hutchens Volume II Expenditure Details, Reports and Studies Energy Supply Appendix 1 Hydro Plant Facility Rehabilitation Attachment A Topsail Plant Governor, Protection and Control Systems Engineering Review Attachment B Morris Plant Turbine and Stationary Seal Inspection Appendix 2 New Chelsea Hydro Plant Refurbishment Attachment A New Chelsea Plant Planned Refurbishment 2004 Substations Appendix 1 Rebuild Substations Appendix 2 Replacement and Standby Substation Equipment Appendix 3 Feeder Additions due to Load Growth and Reliability
Transcript of Newfoundland Power 2004 Capital Budget Application Filing Contents ... · July 25, 2003 Page 1 of 3...
July 25, 2003 Page 1 of 3
Newfoundland Power 2004 Capital Budget Application
Filing Contents
Volume I Application, Schedules and Prefiled Evidence
Application
Schedule A 2004 Capital Budget Summary Schedule B Capital Projects Explanations Schedule C Estimate of Future Required Expenditures on 2004 Projects Schedule D 2002 Rate Base
2003 Capital Expenditure Status Report
Information Technology Strategy 2004 - 2008
2004 Capital Budget Plan
Changes in Deferred Charges 2003 - 2004
Prefiled Evidence: Ludlow / Delaney
Prefiled Evidence: Mulcahy / Collins
Prefiled Evidence: Perry / Hutchens
Volume II Expenditure Details, Reports and Studies
Energy Supply Appendix 1 Hydro Plant Facility Rehabilitation
Attachment A Topsail Plant Governor, Protection and Control Systems Engineering Review Attachment B Morris Plant Turbine and Stationary Seal Inspection Appendix 2 New Chelsea Hydro Plant Refurbishment
Attachment A New Chelsea Plant Planned Refurbishment 2004 Substations Appendix 1 Rebuild Substations
Appendix 2 Replacement and Standby Substation Equipment
Appendix 3 Feeder Additions due to Load Growth and Reliability
July 25, 2003 Page 2 of 3
Appendix 4 Increase Corner Brook Transformer Capacity
Attachment A Power Transformer Study, City of Corner Brook
Transmission Appendix 1 Rebuild Transmission Lines
Attachment A St. John’s Transmission Ampacity Review
Volume III
Expenditure Details, Reports and Studies Distribution Appendix 1 Meters Appendix 2 Rebuild Distribution Lines
Attachment A Distribution Inspection Standards Attachment B Distribution Lightning Arrestors Attachment C Distribution Insulator Replacement Program Attachment D Current Limiting Fuses Attachment E Automatic Sleeve Replacement Attachment F Porcelain Cutout Replacement Attachment G Underground Distribution System Replacements in the St. John’s Area Appendix 3 Distribution Reliability Initiative
Attachment A A Review of Reliability (Wesleyville – 02 Feeder) Attachment B A Review of Reliability (Bay Roberts – 04 Feeder) Attachment C Pulpit Rock Substation Loading and Reliability Appendix 4 Feeder Additions and Upgrades to Accommodate Growth
Attachment A Conception Bay South Planning Study General Property Appendix 1 Tools & Equipment Appendix 2 Real Property Transportation Appendix 1 Purchase Vehicles and Aerial Devices
Attachment A Details 2004 Capital Budget Vehicle Budget
July 25, 2003 Page 3 of 3
Volume IV Expenditure Details, Reports and Studies
Information Systems Appendix 1 Application Enhancements Appendix 2 Application Environment Appendix 3 Customer Systems Replacement
Attachment A Customer Service System Replacement Analysis Appendix 4 Network Infrastructure Appendix 5 Shared Server Infrastructure
Distribution Appendix 1
NP 2004 CBA
Newfoundland Power - 2004 Capital Budget Application Page 1 of 2
Project Title: Meters Location: Various Classification: Distribution Project Cost: $1,174,000 This project consists of a number of items as noted. (a) Regular Domestic Meters and Associated Equipment
Cost: $814,000
Description: Purchase and installation of meters and associated equipment for new customers and replacement meters for existing customers.
Operating Experience: The quantity of meters for new customers is based on the Company’s forecast of customer growth. The quantity for replacement is determined using historical data.
Justification: This project is justified on the basis of customer requirements and Industry Canada regulations.
(b) AMR (Safety and Access)
Cost: $360,000
Description: This project involves installing energy and demand AMR meters in residential locations where access is restricted due to safety reasons and where meters are located inside customer premises or hard to read locations. These locations are identified across NP’s service territory.

Distribution Appendix 1
NP 2004 CBA
Newfoundland Power - 2004 Capital Budget Application Page 2 of 2
Operating Experience: Safety of Newfoundland Power employees is a number one priority. Meter readers are exposed to many hazardous environments that have serious safety implications for the reader. These result from weather conditions and inaccessible meters at customer premises. Safety related incidents potentially result in harm to employees as well as operational costs related to investigations, staff replacement, and prevention of future incidents. AMR is an important tool to help reduce the risk of injury to employees as well as the associated cost of workplace injury. Newfoundland Power will continue to install AMR meters using RF technology in identified areas where meter reading is either unsafe or difficult to access. Existing installations in similar locations have proven successful in improving safety and meter reading accuracy.
Justification: This project will improve safety for employees and meter reading accuracy
for these customers involved.

Distribution Appendix 2
NP 2004 CBA
Newfoundland Power – 2004 Capital Budget Application Page 1 of 4
Project Title: Rebuild Distribution Lines Location: Various Classification: Distribution Project Cost: $4,137,000 This project consists of a number of items as noted. (a) Feeder Upgrades
Cost: $2,802,000
Description: This project consists of correcting deficiencies that were identified during feeder inspections. The following table gives a summary of the work identified:
Components
No. of Feeders Transformers Insulators Hardware
56 1,000 17,000 9,000
Operating Experience: See the following reports outlining the deficiencies associated with various components:
Attachment
Title
Volume III, Distribution, Appendix 2, Attachment A
Newfoundland Power’s Distribution Inspection Standard
Volume III, Distribution, Appendix 2, Attachment B Distribution Lightning Arrestors Volume III, Distribution, Appendix 2, Attachment C Distribution Insulator Replacement Program Volume III, Distribution, Appendix 2, Attachment D Current Limiting Fuses Volume III, Distribution, Appendix 2, Attachment E Automatic Sleeve Replacement Volume III, Distribution, Appendix 2, Attachment F Porcelain Cutout Replacement Volume III, Distribution, Appendix 2, Attachment G
Underground Distribution Replacement in the St. John’s Area
Distribution Appendix 2
NP 2004 CBA
Newfoundland Power – 2004 Capital Budget Application Page 2 of 4
Justification: The distribution inspection program identified selected structures, hardware, insulators and transformers on various feeders that need replacement. It was determined that a certain number of these components must be replaced in 2004 for reasons of public and employee safety and system reliability.
(b) KBR-05 and SLA-06 Feeder Upgrade
Cost: $410,000
Description: This project consists of the replacement of poles, conductor and hardware on the Stamps Lane-06 distribution feeder (SLA-06) which serves the Summerville, Anderson Avenue and Wishingwell Road areas and the Kings Bridge-05 distribution feeder (KBR-05) which serves the Circular Road and Hayward Avenue areas. Operating Experience: In 2000, in conjunction with a review of feeders in the St. John’s City core area a review of these feeders was conducted. For areas with large concentrations of old poles, a number of poles were sounded for an indication of hollow heart, soft or shaley surface, etc. Poles were also viewed for large splits, snowplow damage and holes. A number of poles that looked or sounded questionable were drilled for proof of rot or other problems. Crossarms were viewed for signs of rot, moss growth or large splits. Conductor was reviewed for reasonable sag, sizing and condition of weatherproofing, where applicable. As a result of the review, it was recommended that SLA-06 and KBR-05 be upgraded.
See Requests for Information, PUB-18, Newfoundland Power 2002 Capital Budget Hearing and PUB-15-1 and 15-2 Newfoundland Power 2003 Capital Budget Application for more information.
Justification: In September 2000 the Company completed a review of these feeders and
identified selected poles, structures, hardware and conductor that need replacement. These components must be replaced in order to maintain public safety and system reliability.
(c) Replace Deteriorated Padmount Transformers and Underground Services
Cost: $120,000
Distribution Appendix 2
NP 2004 CBA
Newfoundland Power – 2004 Capital Budget Application Page 3 of 4
Description: This project consists of the replacement of 30-year old direct-buried underground services and padmount transformers in the Virginia Park, Mount Pearl and Elizabeth Park areas of the St. John’s metro area. Operating Experience: In the early to mid-1970s, several large residential developments in the St. John’s metropolitan area were serviced by way of underground distribution systems. These systems were installed using direct-buried underground cables, which have proven to be unreliable. The direct-buried systems were installed primarily in three areas: Virginia Park in the east end of St. John’s, the Newtown (Whitely Drive/Munden Drive) area of Mount Pearl and Elizabeth Park in Paradise. Customers served by these systems have experienced faults since 1978. Initially, the faults were repaired on an individual basis, however, since 1998 a concentrated replacement program has been underway. In 2004, this program will continue. In addition, a five-year replacement program for padmount transformers, which also form part of these systems, will commence. These transformers are nearing the end of their 30-year lives and the number of padmount failures has been increasing. These transformers are filled with oil and failure due to rusting results in significant clean-up efforts which cost on average $2,700 per unit in 2002 as well as interruptions in service to customers. Justification: This project is based upon improving reliability of service to customers in these areas, environmental stewardship, and reducing oil spill clean up cost. Please refer to Volume III, Distribution, Appendix 2, Attachment G, “Underground Distribution System Replacements in the St. John’s Area”, for more information on this project.
(d) Install Support for Cable Termination – Bell Island
Cost: $70,000 Description: This project consists of the construction of a retaining wall adjacent to the Bell Island end of the submarine cable termination feeding Bell Island. Operating Experience: The slope immediately adjacent to this cable termination is highly unstable, creating a safety hazard for employees and exposing critical equipment to damage from falling rock. Justification: This project is required for reasons of employee safety, protection of equipment and distribution system reliability. The cable termination is located on the beach at the toe of a steep and highly unstable cliff. Rock fragments are continuously falling

Distribution Appendix 2
NP 2004 CBA
Newfoundland Power – 2004 Capital Budget Application Page 4 of 4
down the nearby cliffs. To protect employees and equipment from falling rock, a retaining wall or other slope retaining mechanism must be constructed.
(e) Upgrade Secondary Circuits – Grand Bank/Fortune
Cost: $130,000 Description: This project consists of the replacement and reconfiguration of transformers, secondary lines and services in the communities of Grand Bank and Fortune. Operating Experience: A very high incidence of trouble calls have been experienced in recent years in the Grand Bank District. The majority of these calls relate to voltage problems, blinking lights and similar symptoms of deteriorated secondary circuits. Justification: This project is based upon reliability and productivity improvements. It will address the issue by rebuilding and reconfiguring secondary circuits in these areas. This will reduce trouble calls and improve reliability for customers served by these lines.
(f) Projects < $50,000
Cost: $605,000 Description: There are approximately 20 other projects, estimated at less than $50,000 each, that will be completed in 2004.
Operating Experience: Inspections and technical assessments have identified minor projects that need to be completed. Justification: These minor projects are necessary to address situations involving deteriorated equipment, overloaded equipment and/or line relocations that may have a negative impact on safety, reliability, customer service or the environment.

Distribution Appendix 2
Attachment A
Distribution Inspection StandardsDistribution Inspection StandardsDistribution Inspection StandardsDistribution Inspection Standards
DISTRIBUTION INSPECTION AND MAINTENANCE PROCEDURES
Table Of Contents
Table Of Contents........................................................................................................................... i Policy Statement.............................................................................................................................1
Inspection Procedures...................................................................................................................1
Inspection Type and Frequency .............................................................................................1
Ground Inspections ..................................................................................................................1
Inspection Process.....................................................................................................................2 Wood Pole Structures:.............................................................................................................2 Guys and Anchors: ..................................................................................................................2 Hardware: ................................................................................................................................2 Conductors and Accessories:..................................................................................................3 Right of Way: ..........................................................................................................................3 Grounding:...............................................................................................................................3 Structures: ................................................................................................................................3 Transformers:...........................................................................................................................3
DETAILED WOOD POLE INSPECTIONS .............................................................................4
Wood Pole Testing Frequency ................................................................................................4
Types of Wood Pole Tests........................................................................................................4 Visual Inspection:....................................................................................................................4 Sounding Test:.........................................................................................................................4 Core Sampling Test:................................................................................................................4
MAINTENANCE PROCEDURES.............................................................................................4
Maintenance Classification......................................................................................................4
MAINTENANCE REPORTS......................................................................................................5
i
Distribution Inspection Standards DISTRIBUTION INSPECTION AND MAINTENANCE PROCEDURES
1
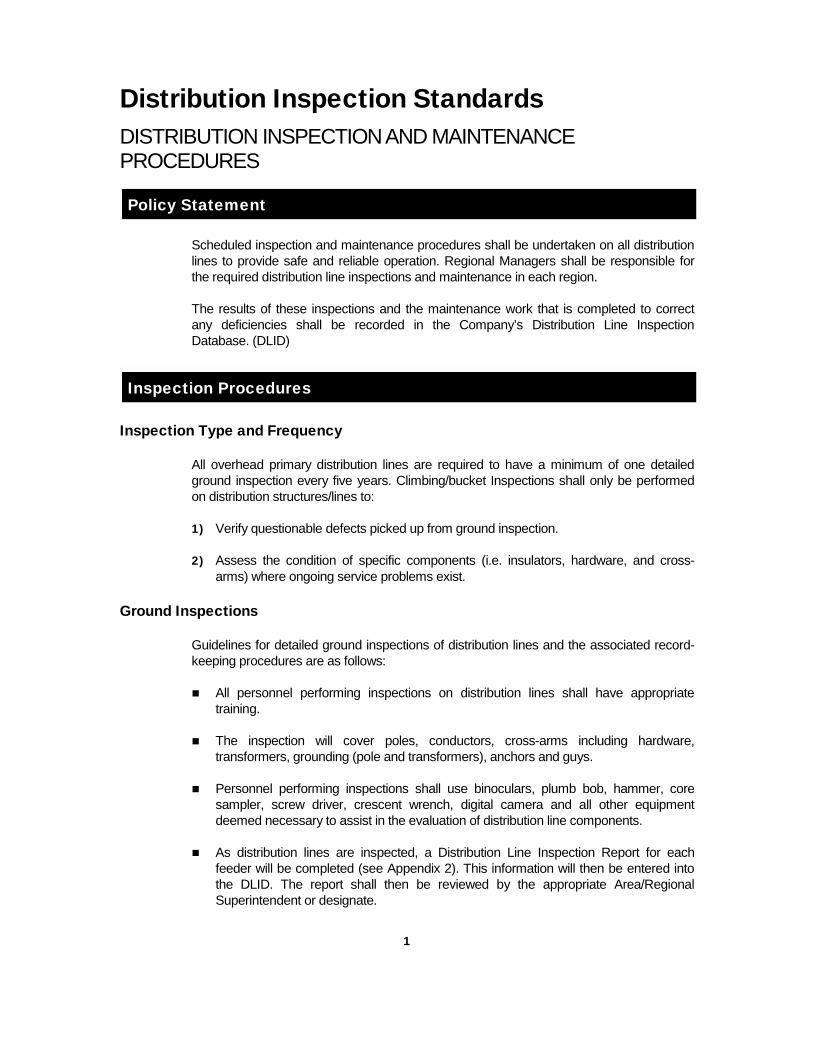
Policy Statement
Scheduled inspection and maintenance procedures shall be undertaken on all distribution lines to provide safe and reliable operation. Regional Managers shall be responsible for the required distribution line inspections and maintenance in each region.
The results of these inspections and the maintenance work that is completed to correct any deficiencies shall be recorded in the Company’s Distribution Line Inspection Database. (DLID)
Inspection Procedures
Inspection Type and Frequency
All overhead primary distribution lines are required to have a minimum of one detailed ground inspection every five years. Climbing/bucket Inspections shall only be performed on distribution structures/lines to:
1) Verify questionable defects picked up from ground inspection.
2) Assess the condition of specific components (i.e. insulators, hardware, and cross-arms) where ongoing service problems exist.
Ground Inspections
Guidelines for detailed ground inspections of distribution lines and the associated record-keeping procedures are as follows:
� All personnel performing inspections on distribution lines shall have appropriate training.
� The inspection will cover poles, conductors, cross-arms including hardware, transformers, grounding (pole and transformers), anchors and guys.
� Personnel performing inspections shall use binoculars, plumb bob, hammer, core sampler, screw driver, crescent wrench, digital camera and all other equipment deemed necessary to assist in the evaluation of distribution line components.
� As distribution lines are inspected, a Distribution Line Inspection Report for each feeder will be completed (see Appendix 2). This information will then be entered into the DLID. The report shall then be reviewed by the appropriate Area/Regional Superintendent or designate.

2
� Inspection personnel shall assign a Maintenance Priority for each deficiency identified. This priority shall establish when corrective action is required (more information on assigning priority is given in the Maintenance Procedures section).
A deficiency list shall be established and updated as defects are corrected and when new defects are identified. The purpose is to provide an up-to-date list of outstanding defects on each distribution line. Inspection personnel shall use this list for each inspection to check the status of known defects.
Inspection Process
Distribution line inspections require evaluation of the following components:
Wood Pole Structures:
� Inspect and determine condition of pole(s) at ground line and above for rotting, deterioration, splitting, cracks, breaks, burns, woodpecker holes, insect infestation and plumbness. Ensure pole is properly backfilled and not undermined (More information is given in the section – Detailed Wood Pole Inspection).
� Where applicable, inspect condition of timber cribs. Ensure crib is properly rock filled.
� Check structure for plumbness or any degree of misalignment.
� Check for structure number tags.
� Record pole numbers for structures with deficiencies.
Guys and Anchors:
� Inspect guys and pre-forms for wear, breaks, slackness and corrosion. Ensure guy guards are installed in areas that are easily accessible by the public.
� Inspect anchor rod and backfill conditions. Check for anchor rod damage. Ensure anchor is not undermined or pulling. Ensure that anchor eye is above ground level.
Hardware:
� Inspect crossarms for rot, splits, cracks and twisting that may cause the conductor to fall to the ground. Also, inspect for burn marks.
� Inspect for broken, cracked, chipped, misaligned, flashed or defective insulators. Check non-dead end insulators for uplift.
� Check for improperly installed cutouts and problematic cutouts that have been known to fail.

3
� Check hardware for any visible deficiency that may result in conductor falling to the ground.
Conductors and Accessories:
� Check for excessive sag that could result in phases slapping together causing phase-to-phase faults.
� Inspect conductors for safe clearances from buildings, roads, ground, and other power/communication lines.
� Inspect conductor for broken or frayed strands, burn marks, foreign objects.
� Inspect dead-end assemblies for any abnormal condition.
� Where required, inspect for damaged or missing conductor warning markers.
Right of Way:
� Check for danger trees that may contact the conductor, or allow someone to climb the tree contact the conductor.
� Check for encroachments by foreign structures, unauthorized excavation or fill areas, etc.
Grounding:
� Check that each transformer contains at least two independent paths to ground.
� Ensure that pole grounds exist on all poles with transformers on them. Ensure that it is rigidly supported, it has not been cut and a ground guard is present.
� Ensure that any pole that has the neutral supported by a spool is properly grounded or is identified in the inspection for replacement with a neutral bracket.
Structures:
� Inspect for safety issues.
� Inspect vertical structure to horizontal structure transition points for lower cross-arms.
Transformers:
� Inspect transformers for rust and leaks. Questionable transformers must be noted for re-inspection.
� Ensure that all transformers have PCB identification tags installed. Particularly, transformers in Protected Public Water Supply Areas contain a green PCB identification tag.
4
DETAILED WOOD POLE INSPECTIONS
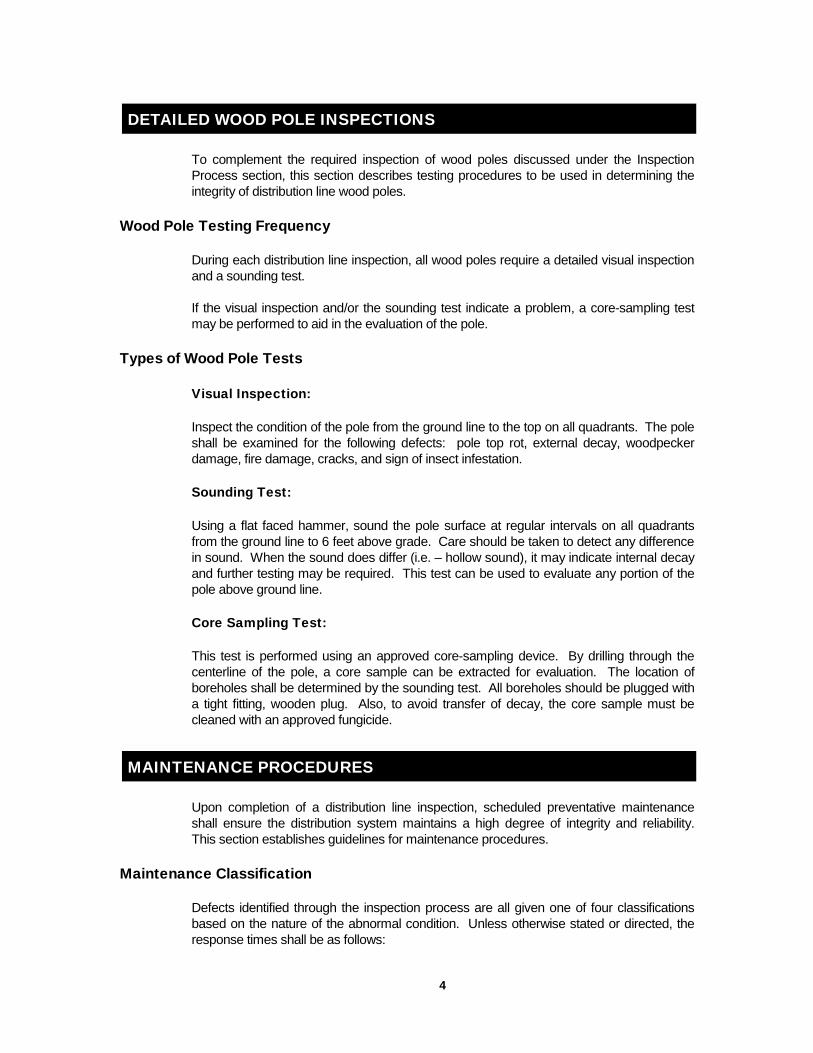
To complement the required inspection of wood poles discussed under the Inspection Process section, this section describes testing procedures to be used in determining the integrity of distribution line wood poles.
Wood Pole Testing Frequency
During each distribution line inspection, all wood poles require a detailed visual inspection and a sounding test.
If the visual inspection and/or the sounding test indicate a problem, a core-sampling test may be performed to aid in the evaluation of the pole.
Types of Wood Pole Tests
Visual Inspection:
Inspect the condition of the pole from the ground line to the top on all quadrants. The pole shall be examined for the following defects: pole top rot, external decay, woodpecker damage, fire damage, cracks, and sign of insect infestation.
Sounding Test:
Using a flat faced hammer, sound the pole surface at regular intervals on all quadrants from the ground line to 6 feet above grade. Care should be taken to detect any difference in sound. When the sound does differ (i.e. – hollow sound), it may indicate internal decay and further testing may be required. This test can be used to evaluate any portion of the pole above ground line.
Core Sampling Test:
This test is performed using an approved core-sampling device. By drilling through the centerline of the pole, a core sample can be extracted for evaluation. The location of boreholes shall be determined by the sounding test. All boreholes should be plugged with a tight fitting, wooden plug. Also, to avoid transfer of decay, the core sample must be cleaned with an approved fungicide.
MAINTENANCE PROCEDURES
Upon completion of a distribution line inspection, scheduled preventative maintenance shall ensure the distribution system maintains a high degree of integrity and reliability. This section establishes guidelines for maintenance procedures.
Maintenance Classification
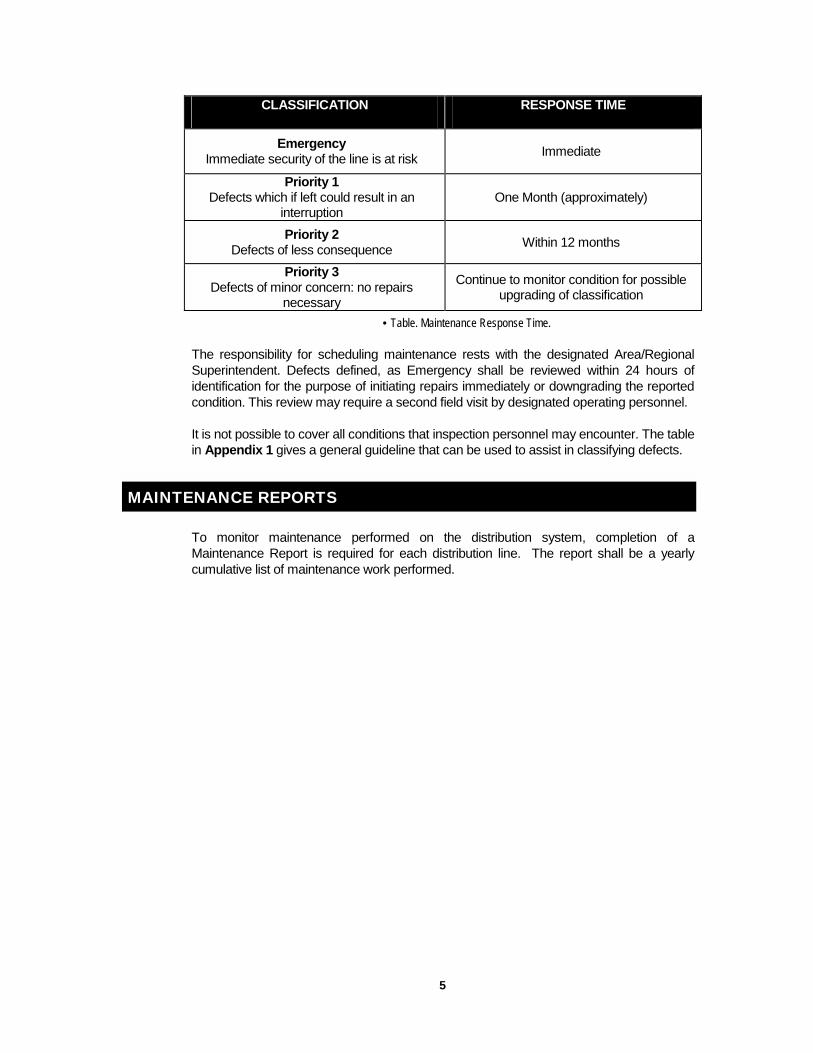
Defects identified through the inspection process are all given one of four classifications based on the nature of the abnormal condition. Unless otherwise stated or directed, the response times shall be as follows:
5
CLASSIFICATION RESPONSE TIME
Emergency Immediate security of the line is at risk Immediate
Priority 1 Defects which if left could result in an
interruption One Month (approximately)
Priority 2 Defects of less consequence Within 12 months
Priority 3 Defects of minor concern: no repairs
necessary
Continue to monitor condition for possible upgrading of classification
• Table. Maintenance Response Time.
The responsibility for scheduling maintenance rests with the designated Area/Regional Superintendent. Defects defined, as Emergency shall be reviewed within 24 hours of identification for the purpose of initiating repairs immediately or downgrading the reported condition. This review may require a second field visit by designated operating personnel.
It is not possible to cover all conditions that inspection personnel may encounter. The table in Appendix 1 gives a general guideline that can be used to assist in classifying defects.
MAINTENANCE REPORTS
To monitor maintenance performed on the distribution system, completion of a Maintenance Report is required for each distribution line. The report shall be a yearly cumulative list of maintenance work performed.

Appendix 1
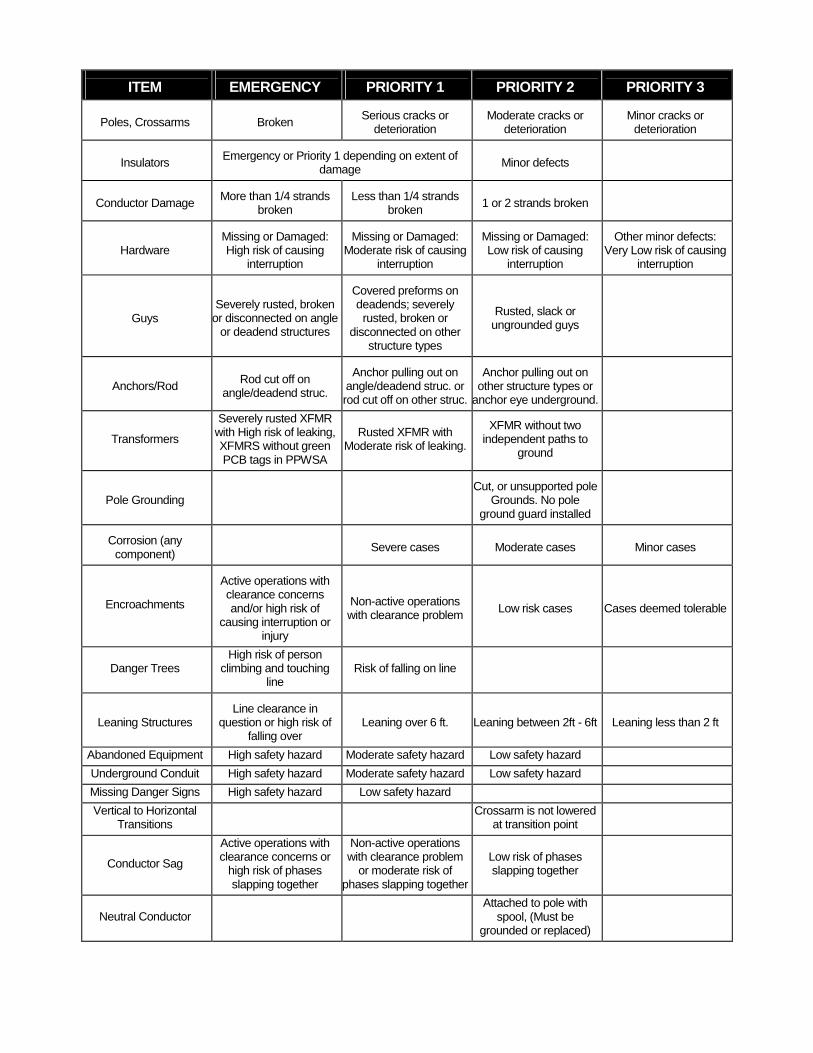
ITEM EMERGENCY PRIORITY 1 PRIORITY 2 PRIORITY 3
Poles, Crossarms
Broken
Serious cracks or deterioration
Moderate cracks or
deterioration
Minor cracks or
deterioration
Insulators
Emergency or Priority 1 depending on extent of
damage
Minor defects
Conductor Damage
More than 1/4 strands
broken
Less than 1/4 strands
broken
1 or 2 strands broken
Hardware
Missing or Damaged: High risk of causing
interruption
Missing or Damaged:
Moderate risk of causing interruption
Missing or Damaged: Low risk of causing
interruption
Other minor defects:
Very Low risk of causing interruption
Guys
Severely rusted, broken
or disconnected on angle or deadend structures
Covered preforms on deadends; severely rusted, broken or
disconnected on other structure types
Rusted, slack or
ungrounded guys
Anchors/Rod
Rod cut off on
angle/deadend struc.
Anchor pulling out on
angle/deadend struc. or rod cut off on other struc.
Anchor pulling out on
other structure types or anchor eye underground.
Transformers
Severely rusted XFMR with High risk of leaking, XFMRS without green PCB tags in PPWSA
Rusted XFMR with Moderate risk of leaking.
XFMR without two independent paths to
ground
Pole Grounding
Cut, or unsupported pole
Grounds. No pole ground guard installed
Corrosion (any
component)
Severe cases
Moderate cases
Minor cases
Encroachments
Active operations with clearance concerns and/or high risk of
causing interruption or injury
Non-active operations with clearance problem
Low risk cases
Cases deemed tolerable
Danger Trees High risk of person
climbing and touching line
Risk of falling on line
Leaning Structures
Line clearance in
question or high risk of falling over
Leaning over 6 ft.
Leaning between 2ft - 6ft
Leaning less than 2 ft
Abandoned Equipment High safety hazard Moderate safety hazard Low safety hazard Underground Conduit High safety hazard Moderate safety hazard Low safety hazard Missing Danger Signs High safety hazard Low safety hazard Vertical to Horizontal
Transitions Crossarm is not lowered at transition point
Conductor Sag
Active operations with clearance concerns or
high risk of phases slapping together
Non-active operations with clearance problem
or moderate risk of phases slapping together
Low risk of phases slapping together
Neutral Conductor Attached to pole with
spool, (Must be grounded or replaced)

Appendix 2
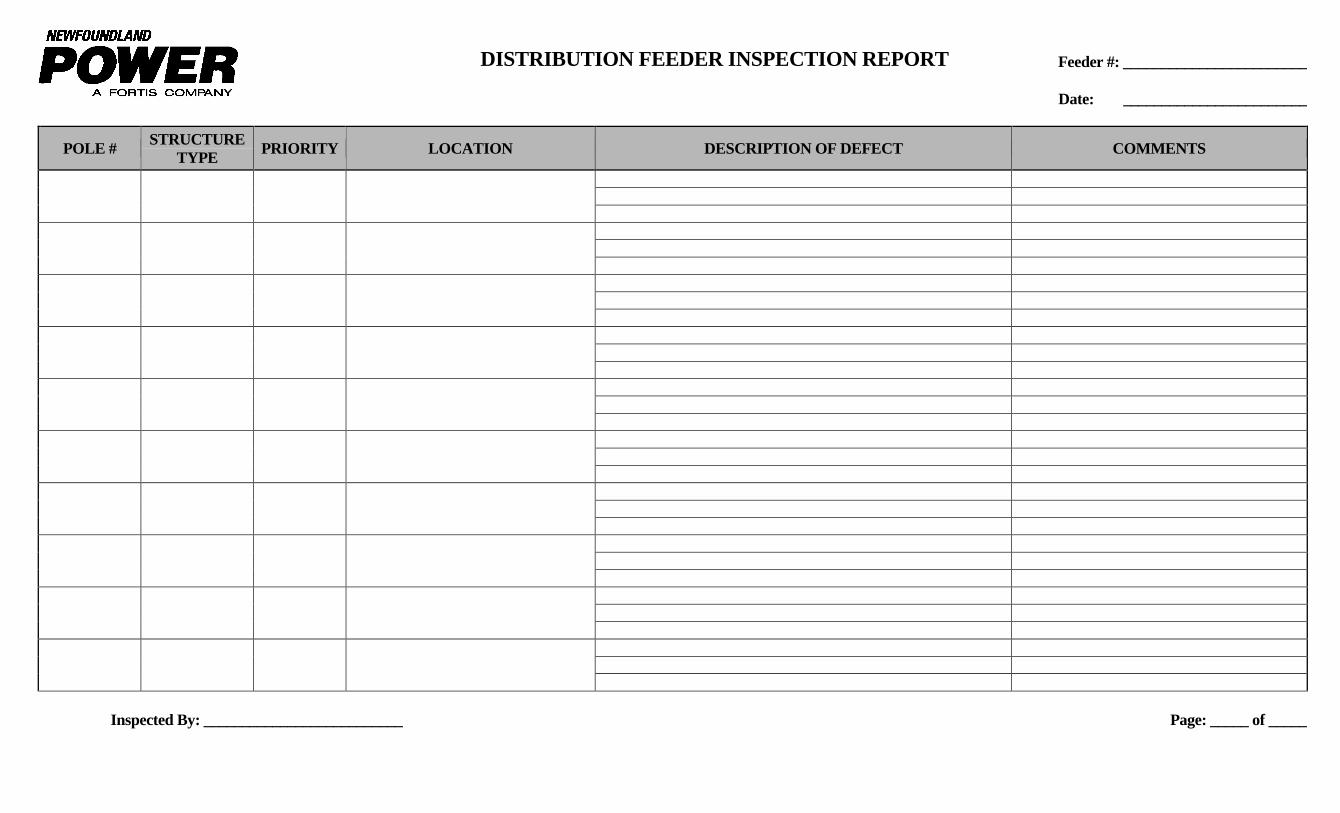
DISTRIBUTION FEEDER INSPECTION REPORT Feeder #: ________________________ Date: ________________________
POLE # STRUCTURE TYPE PRIORITY LOCATION DESCRIPTION OF DEFECT COMMENTS
Inspected By: __________________________ Page: _____ of _____

Distribution Appendix 2
Attachment B
Distribution Lightning Arrestors
Newfoundland Power Inc.
June 2003
i
Table of Contents Page Introduction .......................................................................................................................... 1 Isokeraunic Levels................................................................................................................ 1 Utility Practices – Lighting Arrestors ................................................................................ 2 Transformer Failures due to Lighting ............................................................................... 3 Existing Lightning Arrestor Installation Program ........................................................... 3 Alternatives ........................................................................................................................... 3 Summary of Recommendations .......................................................................................... 4 Appendix A - Cost Appendix B – Present Worth of Revenue Requirements Analysis
1
Introduction Damage to distribution transformers as a result of lightning storms has been a concern for Newfoundland Power for a number of years. In the early 1990’s transformer losses due to lightning prompted the Company to review the installation of lightning arrestors on distribution transformers. Prior to this, arrestors were only installed on larger, more costly equipment such as substation power transformers, reclosers, regulators and main underground cables. In 1995 a report entitled “A Study into the Feasibility of Installing Surge Arrestors on the Newfoundland Power Distribution System” was completed. This report was filed with the Public Utilities Board on November 28, 1997 in response to Request for Information, PUB-8. The report considered the number of transformer failures and evaluated the costs of installing arrestors on distribution transformers. The report recommended an arrestor installation program be implemented in Gander, Grand Falls, and Stephenville Areas based on transformer failure records which indicated that these three areas suffered the greatest number of transformer failures due to lightning, during the period 1990 to 1994. This report recommended that arrestors be installed on all transformers on selected feeders in those areas over a period of time. In 2002 several intense lightning storms swept across the province resulting in transformer failures higher than any previously recorded year, with more than 300 transformers faulted. This experience prompted a review of the existing arrestor policy to determine whether it adequately addressed the lightning/transformer loss experience. Isokeraunic Levels Lightning is by far the leading cause of damaging overvoltages on distribution systems. Lightning need not come in direct contact with power lines to cause problems, since induced charges can be introduced on to the system from nearby lightning strikes to ground. A universally accepted measure to help utilities make some determination of the incidence of lightning in their service areas is the isokeraunic level (IKL) or thunder day (TD) – defined as the number of days in a year (or month) that thunder is heard in a particular location. In some locations in Canada isokeraunic levels of 30 to 40 are experienced while levels of 100 are reached in Florida. In these areas, the use of lightning arrestors is common and considered a standard part of any electrical equipment installation. Generally, the island of Newfoundland has relatively low isokeraunic levels. Environment Canada’s Canadian Climate Normals 1971-2000 list the highest IKL at 6.4 in the Port aux Basques and Stephenville areas. Other areas of the province have lower levels, some less than 1. In St. John’s an IKL of 4.5 exists. It is understandable with these levels that one might conclude that Newfoundland is not an area very prone to lightning. However, IKL alone is a weak indicator of the damaging effects of lightning, as it does not measure the severity of lightning strikes. As such, it would be unwise to make recommendations based solely on an IKL. The number of transformers damaged by lightning storms in any one year have ranged from 22 in 2000 to 323 in 2002.
2
While it may be difficult to predict whether long term weather and lightning patterns in Newfoundland are changing, it certainly appears that the incidence and severity of lightning, at least in certain areas of the province, has increased over the past decade. Utility Practices – Lightning Arrestors Prior to the mid 1990’s, Newfoundland Power did not install arrestors on pole mounted distribution transformers. There were several reasons for this. First, the reliability of arrestors prior to the 1990’s was somewhat suspect. Porcelain housing was a safety concern for employees because catastrophic failure of arrestors resulted in the shattering of porcelain, potentially causing serious injury. However, the quality of arrestors has substantially improved in the past 10-15 years, one of the improvements being the change from a porcelain housing to a polymer housing. Today’s arrestors are highly reliable, less expensive and no longer pose a safety concern from exploding glass. Second, the island of Newfoundland was not considered to be a high isokeraunic area and protection of a relatively inexpensive piece of equipment such as distribution transformers was considered to be unnecessary. When this was considered along with the quality and safety issues, the benefits at that time were not considered great enough to warrant the installation of arrestors on pole mounted transformers. The vast majority of North American utilities install lightning arrestors on every transformer installed and consider the lightning arrestor essential for the protection and reliable operation of transformers. Since October 2002, Newfoundland Power has considered an arrestor to be an integral part of the transformer and all new transformer installations since that time have an arrestor included. In recent years Newfoundland Power has improved the standard of its pole mounted transformers. To combat the early deterioration of the transformer tank, which resulted in premature removal and costly oil spills, Newfoundland Power now uses stainless steel tanks. Similarly, arrestors will protect the transformer against damage from lightning and associated oil spills that can occur with lightning damage. Transformers are an important asset and these measures together will prolong the life of the asset, which in turn will lead to lower costs as well as increased reliability to the customer.

3
Transformer Failures due to Lightning Within Newfoundland Power’s service territory, the piece of equipment that has sustained the most failures due to lightning is the distribution transformer. Transformers range in sizes from 10 to 167 kVA for pole-mounted units, 50 to 100 kVA for 1-phase pad-mounted units and 150 to 2500 kVA for 3-phase pad-mounted units. Material costs range from $ 830 to $3560 for 10 to 167 kVA pole-mounted units; $2350 to $3240 for 50 to 100 kVA, 1-phase pad-mounted units; and $6000 to $36,960 for, 150 to 2500 kVA 3-phase pad-mounted units. The costs do not include the cost of installation which can be significant depending on circumstances. Over the past 13 years Newfoundland Power has lost in excess of 1500 transformers that have failed due to lightning, with approximately 700 of these in the last 5 years. The annual number of units that have failed range from a low of 22 units in 2000 to a high of 323 units in 2002, and the average the past 5 years has been 139 units. This translates to an average annual cost in excess of $300,0001 per year. Furthermore, it is likely that this average cost would have been higher, but for the arrestor installation program that began in 1996. Existing Lightning Arrestor Installation Program Following the 1995 study, funds were allocated annually beginning in 1996 to install arrestors on 31 feeders. The number of feeders identified for arrestor installation expanded to 72 in 1999. Approximately 5,000 transformers have arrestors installed to date under this program. Our most recent transformer loss experience (which includes the August, 2002 lightning storms) indicates that the number of feeders under this program should be further expanded to include a total of 98 feeders, representing 33% of the Company’s 300 feeders. In addition to installing arrestors on transformers in service, in late 2002 Newfoundland Power began installing arrestors on all new transformers being installed regardless of location. Alternatives This report considers three alternatives to address the increasing rate of transformer failures due to lightning. Refer to Appendix A for details of costs and Appendix B for Net Present Worth Analysis. The first alternative is not to install any more arrestors on distribution transformers. This is the “do nothing” alternative and would be expected to result in average annual transformer failures of 139 incurring costs of over $300,000 per year. The increased costs result in a cumulative present worth of annual revenue requirements over 30 years of $4,389,849. A second alternative is to install an arrestor on every in-service and new transformer over a 5 year time frame at an estimated capital cost of $6,550,796 over the 5 year period. This would 1Based on unit costs from Appendix A and 139 units.

4
involve retrofitting all existing installed transformers with arrestors. This second alternative has a cumulative present worth of revenue requirements of $6,894,379. A third alternative is a variation of the second one. This alternative places more emphasis on the assessment that lightning in Newfoundland is variable in both where it strikes and its intensity. It also recognizes that to retrofit all transformers in a relatively short time period is expensive and probably unwarranted. Consequently alternative #3 proposes a two pronged approach. First, continue to retrofit those feeders that are prone to transformer damage from lightning and, second, on a go-forward basis, install arrestors on all new transformers. It should be noted that the labour cost is minimized when the arrestor is installed as part of the original installation of the transformer. The cumulative present worth of this alternative is $2,289,967. The third alternative offers the most benefit. It both addresses the necessity of taking action in the immediate future to reduce the number of transformer failures on those feeders most prone to lightning damage and address the long term requirement of ensuring our entire distribution transformer system is adequately and reasonably protected. This alternative involves installing arrestors on feeders over the next five years as part of a Feeder Upgrade Program. This approach will minimize labour costs by combining arrestor installation with other planned feeder upgrading work. The feeders selected would be based on transformer failures due to lightning as well as the experience of operations personnel. Summary of Recommendations The following actions are recommended with respect to the installation of lightning arrestors on distribution transformers.
• As part of the annual Feeder Inspection Program identify transformers on feeders prone to lightning strikes that are not equipped with a lightning arrestor.
• In the year following the inspection, install lightning arrestors on the identified transformers.
• On an ongoing basis, continue to install lightning arrestors on all new transformer installations regardless of location.
Appendix A
Cost
1
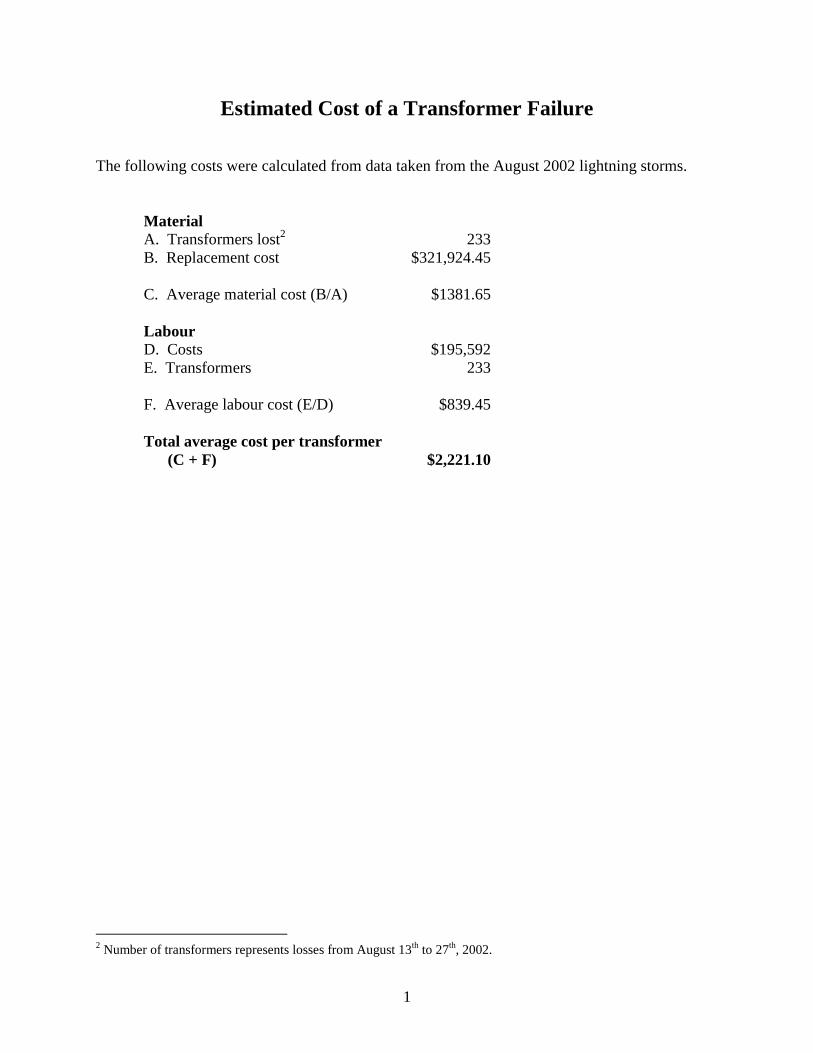
Estimated Cost of a Transformer Failure The following costs were calculated from data taken from the August 2002 lightning storms.
Material A. Transformers lost2 233 B. Replacement cost $321,924.45 C. Average material cost (B/A) $1381.65 Labour D. Costs $195,592 E. Transformers 233 F. Average labour cost (E/D) $839.45 Total average cost per transformer (C + F) $2,221.10
2 Number of transformers represents losses from August 13th to 27th, 2002.
2
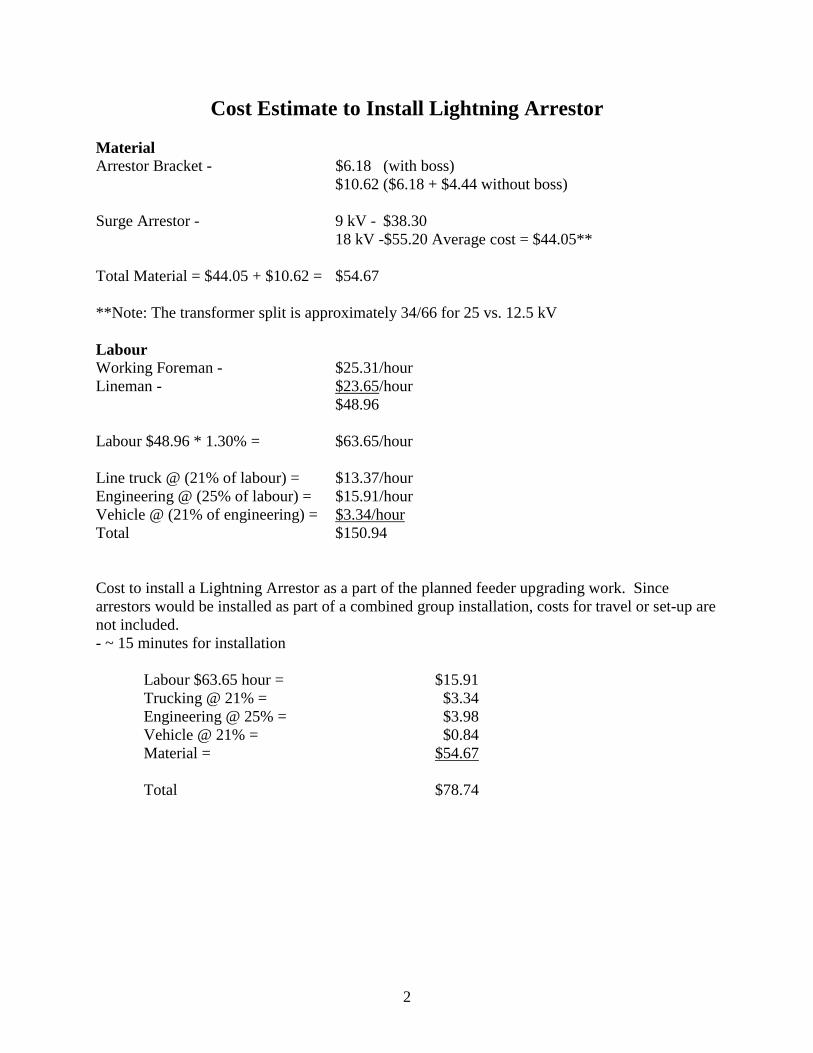
Cost Estimate to Install Lightning Arrestor Material Arrestor Bracket - $6.18 (with boss) $10.62 ($6.18 + $4.44 without boss) Surge Arrestor - 9 kV - $38.30 18 kV -$55.20 Average cost = $44.05** Total Material = $44.05 + $10.62 = $54.67 **Note: The transformer split is approximately 34/66 for 25 vs. 12.5 kV Labour Working Foreman - $25.31/hour Lineman - $23.65/hour $48.96 Labour $48.96 * 1.30% = $63.65/hour Line truck @ (21% of labour) = $13.37/hour Engineering @ (25% of labour) = $15.91/hour Vehicle @ (21% of engineering) = $3.34/hour Total $150.94
Cost to install a Lightning Arrestor as a part of the planned feeder upgrading work. Since arrestors would be installed as part of a combined group installation, costs for travel or set-up are not included. - ~ 15 minutes for installation
Labour $63.65 hour = $15.91 Trucking @ 21% = $3.34 Engineering @ 25% = $3.98 Vehicle @ 21% = $0.84 Material = $54.67 Total $78.74

3
Cost of Alternatives Alternative 1 Since this is a “do nothing” alternative, there are no costs for corrective measures. The costs under this alternative is the projected cost of losses. Cost of Transformer Failures
Average annual number of transformer failure 139 Average cost per transformer $2,2213 Average annual cost of failure $308,719
Present value (30 years) $4,389,849 Alternative 2 This alternative involves installing an arrestor on every transformer within Newfoundland Power’s service territory as a stand-alone project. Cost of Arrestor Installation
Number of Transformers 43,400 Average cost to install a lightning arrestor $150.944 Total cost $6,550,796
Present value (30 years) $6,894,379
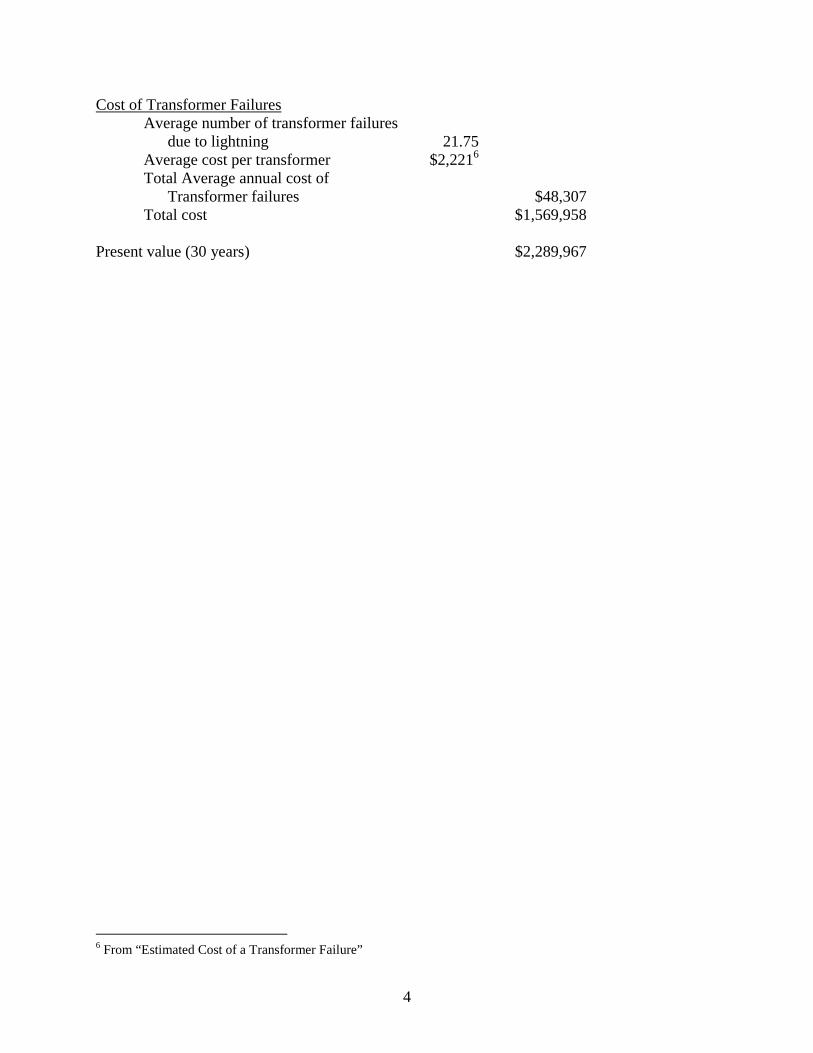
Alternative 3 This alternative includes a five year program of installing an arrestor on every transformer on distribution feeders that have experienced 3 or more lightning caused failures from 1999 to 2002 in addition to feeders previously recommended. This includes 19,325 transformers on 98 feeders. The most economical way do this would be to combine the arrestor installation project with the other feeder upgrade initiatives. In this way cost efficiencies are maximized. With this alternative, the remaining feeders are estimated to have failed on average 21.75 transformers per year. Cost of Arrestor Installation
Combined project: Number of Transformers 19,325 Average lightning arrestor cost $78.745 Total Arrester cost $1,521,651
3 From “Estimated Cost of a Transformer Failure” 4 From “Cost Estimate to Install Lightning Arrestor” 5From “Cost Estimate to Install Lightning Arrestor”
4
Cost of Transformer Failures Average number of transformer failures due to lightning 21.75 Average cost per transformer $2,2216 Total Average annual cost of Transformer failures $48,307 Total cost $1,569,958
Present value (30 years) $2,289,967
6 From “Estimated Cost of a Transformer Failure”

1
Appendix B
Present Worth of Revenue Requirements Analysis

Alternative #1 - Status Quo
Present Worth Analysis
Weighted Average Incremental Cost of Capital 8.52%Escalation Rate 1.70%PW Year 2003
--------------------------------------------------------------------------------------------------------------------------------------------------------------------------- Capital Operating Operating Net Present CumulativeRevenue Costs Benefits Benefit Worth Present
Generation Generation Generation Generation Transmission Substation Distribution Telecommunication Requirement Benefit WorthThermal Hydro Thermal Hydro25.58 yrs 49.26 yrs 25.51 yrs 49.26 yrs 30.6 yrs 38.5 yrs 30.4 yrs 15.0 yrs Benefit4% CCA 4% CCA 30% CCA 30% CCA 4% CCA 4% CCA 4% CCA 20% CCA
YEAR
2004 308,000 45,823 0 -45,823 -42,225 -42,2252005 313,236 88,118 0 0 -88,118 -74,824 -117,0502006 318,561 130,269 0 0 -130,269 -101,932 -218,9822007 323,977 172,264 0 0 -172,264 -124,210 -343,1922008 329,484 214,090 0 0 -214,090 -142,248 -485,4402009 335,085 255,735 0 0 -255,735 -156,578 -642,0182010 340,782 297,185 0 0 -297,185 -167,671 -809,6902011 346,575 338,430 0 0 -338,430 -175,951 -985,6402012 352,467 379,457 0 0 -379,457 -181,792 -1,167,4322013 358,459 420,255 0 0 -420,255 -185,530 -1,352,9632014 364,553 460,811 0 0 -460,811 -187,463 -1,540,4252015 370,750 501,113 0 0 -501,113 -187,853 -1,728,2782016 377,053 541,152 0 0 -541,152 -186,935 -1,915,2142017 383,463 580,914 0 0 -580,914 -184,916 -2,100,1302018 389,982 620,389 0 0 -620,389 -181,977 -2,282,1072019 396,611 659,565 0 0 -659,565 -178,279 -2,460,3872020 403,354 698,432 0 0 -698,432 -173,963 -2,634,3502021 410,211 736,978 0 0 -736,978 -169,152 -2,803,5032022 417,184 775,192 0 0 -775,192 -163,954 -2,967,4572023 424,276 813,063 0 0 -813,063 -158,463 -3,125,9202024 431,489 850,579 0 0 -850,579 -152,760 -3,278,6802025 438,824 887,731 0 0 -887,731 -146,915 -3,425,5952026 446,284 924,507 0 0 -924,507 -140,989 -3,566,5842027 453,871 960,895 0 0 -960,895 -135,033 -3,701,6172028 461,587 996,886 0 0 -996,886 -129,092 -3,830,7102029 469,434 1,032,467 0 0 -1,032,467 -123,203 -3,953,9132030 477,414 1,067,628 0 0 -1,067,628 -117,397 -4,071,3102031 485,530 1,102,359 0 0 -1,102,359 -111,699 -4,183,0092032 493,784 1,136,647 0 0 -1,136,647 -106,131 -4,289,1402033 502,179 1,170,481 0 0 -1,170,481 -100,710 -4,389,849
CAPITAL EXPENDITURE IN YEAR BY ASSET TYPE

Alternative #2 - Full Arrestor Impelmentation Over 5 Years
Present Worth Analysis
Weighted Average Incremental Cost of Capital 8.52%Escalation Rate 1.70%PW Year 2003
--------------------------------------------------------------------------------------------------------------------------------------------------------------------------- Capital Operating Operating Net Present CumulativeRevenue Costs Benefits Benefit Worth Present
Generation Generation Generation Generation Transmission Substation Distribution Telecommunication Requirement Benefit WorthThermal Hydro Thermal Hydro25.58 yrs 49.26 yrs 25.51 yrs 49.26 yrs 30.6 yrs 38.5 yrs 30.4 yrs 15.0 yrs Benefit4% CCA 4% CCA 30% CCA 30% CCA 4% CCA 4% CCA 4% CCA 20% CCA
YEAR
2004 1,310,159 194,919 0 -194,919 -179,616 -179,6162005 1,332,432 374,832 0 0 -374,832 -318,285 -497,9012006 1,355,083 554,134 0 0 -554,134 -433,596 -931,4972007 1,378,119 732,771 0 0 -732,771 -528,359 -1,459,8562008 1,401,547 910,689 0 0 -910,689 -605,091 -2,064,9482009 875,774 0 0 -875,774 -536,208 -2,601,1562010 856,362 0 0 -856,362 -483,158 -3,084,3142011 836,738 0 0 -836,738 -435,022 -3,519,3362012 816,911 0 0 -816,911 -391,369 -3,910,7052013 796,890 0 0 -796,890 -351,804 -4,262,5092014 776,680 0 0 -776,680 -315,962 -4,578,4712015 756,292 0 0 -756,292 -283,512 -4,861,9832016 735,730 0 0 -735,730 -254,151 -5,116,1342017 715,003 0 0 -715,003 -227,599 -5,343,7332018 694,117 0 0 -694,117 -203,604 -5,547,3372019 673,079 0 0 -673,079 -181,932 -5,729,2692020 651,894 0 0 -651,894 -162,372 -5,891,6412021 630,568 0 0 -630,568 -144,729 -6,036,3702022 609,107 0 0 -609,107 -128,827 -6,165,1972023 587,517 0 0 -587,517 -114,505 -6,279,7022024 565,802 0 0 -565,802 -101,615 -6,381,3182025 543,967 0 0 -543,967 -90,024 -6,471,3412026 522,018 0 0 -522,018 -79,609 -6,550,9502027 499,959 0 0 -499,959 -70,259 -6,621,2092028 477,794 0 0 -477,794 -61,872 -6,683,0812029 455,528 0 0 -455,528 -54,358 -6,737,4392030 433,164 0 0 -433,164 -47,631 -6,785,0702031 410,707 0 0 -410,707 -41,616 -6,826,6852032 388,160 0 0 -388,160 -36,243 -6,862,9292033 365,526 0 0 -365,526 -31,450 -6,894,379
CAPITAL EXPENDITURE IN YEAR BY ASSET TYPE
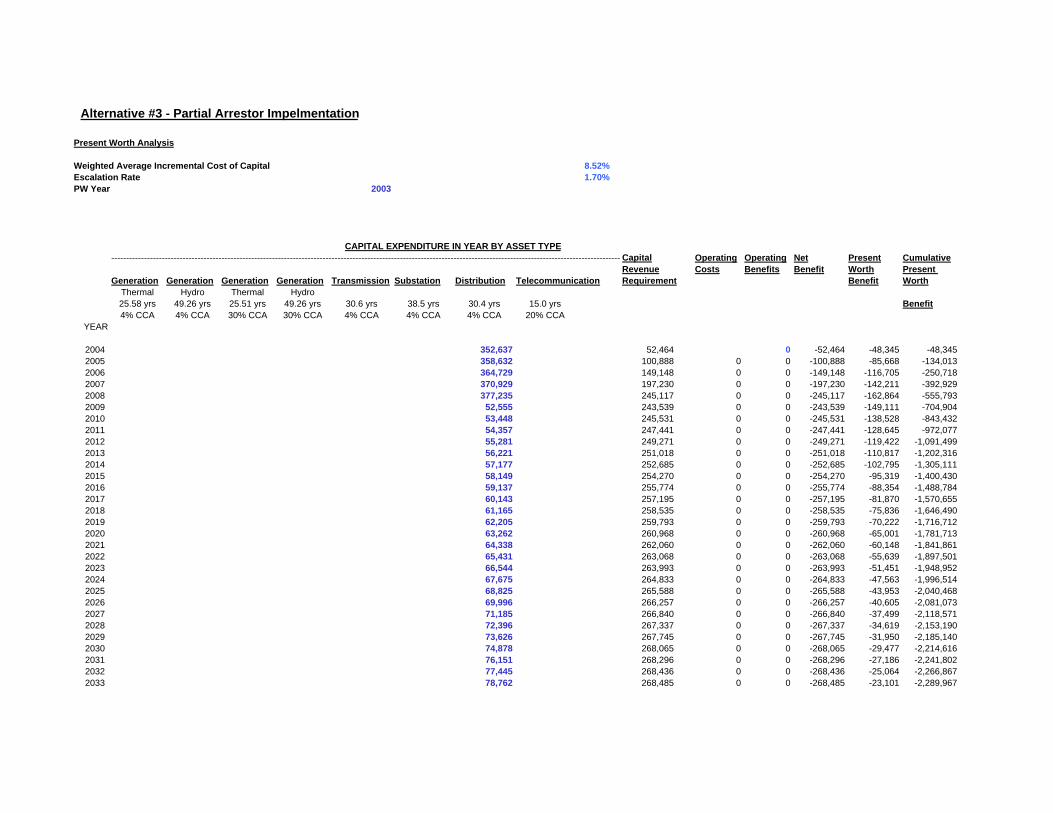
Alternative #3 - Partial Arrestor Impelmentation
Present Worth Analysis
Weighted Average Incremental Cost of Capital 8.52%Escalation Rate 1.70%PW Year 2003
--------------------------------------------------------------------------------------------------------------------------------------------------------------------------- Capital Operating Operating Net Present CumulativeRevenue Costs Benefits Benefit Worth Present
Generation Generation Generation Generation Transmission Substation Distribution Telecommunication Requirement Benefit WorthThermal Hydro Thermal Hydro25.58 yrs 49.26 yrs 25.51 yrs 49.26 yrs 30.6 yrs 38.5 yrs 30.4 yrs 15.0 yrs Benefit4% CCA 4% CCA 30% CCA 30% CCA 4% CCA 4% CCA 4% CCA 20% CCA
YEAR
2004 352,637 52,464 0 -52,464 -48,345 -48,3452005 358,632 100,888 0 0 -100,888 -85,668 -134,0132006 364,729 149,148 0 0 -149,148 -116,705 -250,7182007 370,929 197,230 0 0 -197,230 -142,211 -392,9292008 377,235 245,117 0 0 -245,117 -162,864 -555,7932009 52,555 243,539 0 0 -243,539 -149,111 -704,9042010 53,448 245,531 0 0 -245,531 -138,528 -843,4322011 54,357 247,441 0 0 -247,441 -128,645 -972,0772012 55,281 249,271 0 0 -249,271 -119,422 -1,091,4992013 56,221 251,018 0 0 -251,018 -110,817 -1,202,3162014 57,177 252,685 0 0 -252,685 -102,795 -1,305,1112015 58,149 254,270 0 0 -254,270 -95,319 -1,400,4302016 59,137 255,774 0 0 -255,774 -88,354 -1,488,7842017 60,143 257,195 0 0 -257,195 -81,870 -1,570,6552018 61,165 258,535 0 0 -258,535 -75,836 -1,646,4902019 62,205 259,793 0 0 -259,793 -70,222 -1,716,7122020 63,262 260,968 0 0 -260,968 -65,001 -1,781,7132021 64,338 262,060 0 0 -262,060 -60,148 -1,841,8612022 65,431 263,068 0 0 -263,068 -55,639 -1,897,5012023 66,544 263,993 0 0 -263,993 -51,451 -1,948,9522024 67,675 264,833 0 0 -264,833 -47,563 -1,996,5142025 68,825 265,588 0 0 -265,588 -43,953 -2,040,4682026 69,996 266,257 0 0 -266,257 -40,605 -2,081,0732027 71,185 266,840 0 0 -266,840 -37,499 -2,118,5712028 72,396 267,337 0 0 -267,337 -34,619 -2,153,1902029 73,626 267,745 0 0 -267,745 -31,950 -2,185,1402030 74,878 268,065 0 0 -268,065 -29,477 -2,214,6162031 76,151 268,296 0 0 -268,296 -27,186 -2,241,8022032 77,445 268,436 0 0 -268,436 -25,064 -2,266,8672033 78,762 268,485 0 0 -268,485 -23,101 -2,289,967
CAPITAL EXPENDITURE IN YEAR BY ASSET TYPE
Distribution Appendix 2 Attachment C
Distribution Insulator Replacement Program
Newfoundland Power Inc. June 2003
Prepared By: Peter Feehan, P.Eng.
i
Table of Contents Page Introduction .................................................................................................................... 1 History and mode of Insulator Failure......................................................................... 2 Recent Experience .......................................................................................................... 2 Hazards of Faulty Insulators......................................................................................... 4 Testing and Replacement............................................................................................... 4 Future Work ................................................................................................................... 5 Cost of Insulator Replacement ...................................................................................... 5 Recommendations .......................................................................................................... 5
1
Introduction Premature failure of porcelain insulators due to cement growth is well recognized throughout the utility industry. Most Canadian utilities, including Newfoundland Power, have experienced significant insulator failures due to this phenomenon. Newfoundland Power began to experience abnormal failures of porcelain insulation in the early 1980’s. Suspension insulators fail by radial cracks, which are sometimes contained inside the metal cap and are not visible. The crack causes a current path between the metal cap and pin and shorts out the insulator. Pin type and pin cap type (2-Piece) insulators fail by circumferential cracks. Failure is usually mechanical; the top shears off the insulator causing the conductor to float clear of the structure. Since the late 1980s the Company has replaced a significant number of defective insulators. The impact on reliability to the end of 2002 has been positive. The SAIFI and SAIDI statistics for 2002 for insulator-related outages were 0.29 and 0.43 respectively. This compares with a 10-year Company average of 0.37 and 0.54 respectively. While progress has been made in reducing outages due to insulator failure on trunk sections of distribution lines, suspension and two-piece pin-type porcelain insulators are continuing to cause outages on feeder taps. Replacement of these insulators should be performed in conjunction with the Feeder Inspections and Feeder Improvement Projects. The cost of implementing this approach is estimated at approximately $500,000 in 2004. A similar amount is anticipated in each of the next five years as these insulators are identified for replacement during feeder inspections.
2
1.0 History and Mode of Insulator Failure
Porcelain insulators with cement have been used since the turn of the last century. The cement is used to hold sections of porcelain together and to hold the porcelain to the steel hardware. Premature failure of porcelain insulators due to problems with the cement growth has occurred over many years. By the early 1960's the term "cement growth" had been used to categorize the problem. In 1976 Ontario Hydro began an investigation into the poor performance of its transmission lines. By the early 1980's Ontario Hydro had produced papers, which indicated cement growth as the most likely reason for insulator failures. Most Canadian utilities, including Newfoundland Power, have experienced insulator failures due to cement growth. Cement growth is the most accepted theory for premature failure of porcelain insulators. The volume expansion of the cement occurs in the presence of moisture and is attributed to a chemical change in the cement that occurs with age. The expansion occurs over 10 or more years. As the cement expands it produces stress on the porcelain that fails in tension by cracking. Two manufacturers have been identified as the source of the cement growth problem in Canada, Canadian Porcelain (CP) and Canadian Ohio Brass (COB). Both companies went out of business many years ago. The most common porcelain suspension insulator remaining in NP’s distribution system is the CP8080. Newfoundland Power first identified the problem on the distribution system in the early 1980's when distribution suspension insulators1 were causing outages. In the 1990's, transmission suspension insulators began causing outages. While transmission insulators were also failing in the 1980s, because there are many more units in an insulator string, outages did not occur until many insulators in the same string failed. Pin type insulators2 have also been failing. 69 kV pin types experienced significant failures in the 1980's and 23 kV and 34.5 kV pin type insulators experienced increasing failures in the 1990's. Pin-type insulators used in substations to support the bus and switches have also experienced failures since the 1980's.
2.0 Recent Experience Since the 1980’s a significant number of distribution insulators have been replaced. A 1997 report entitled the “Distribution Insulator Replacement Program” identified and prioritized critical sections of feeders for testing and replacement of insulators. The report also established a five year time period to complete the identified work. This report was filed with the PUB on December 1, 1997 in response to Request for Information NLH-10(a). The project began in earnest after 1997 when NP began its Distribution Insulator Replacement Program. The impact on reliability to the end of 2002 has been positive as
1 Suspension insulators are insulators that are commonly stacked together in a string to provide the necessary gap between an energized conductor and a pole to prevent electricity from traveling from a conductor to a pole. 2 Pin Top insulators are insulators that sit on top of a crossarm to support an energized conductor and prevent electricity from traveling from a conductor to a pole. These insulators are typically not stacked on top of each other.

3
Shown in Figure 1. The SAIFI and SAIDI statistics for 2002 for insulator-related outages were 0.29 and 0.43 respectively. This compares with a 10-year Company average of 0.37 and 0.54 respectively.
Unscheduled Distribution Insulator SAIDI
0.000.100.200.300.400.500.600.700.80
1992
1993
1994
1995
1996
1997
1998
1999
2000
2001
2002
hour
s
Unscheduled Distribution Insulator SAIFI
0.00
0.10
0.20
0.30
0.40
0.50
0.60
1992
1993
1994
1995
1996
1997
1998
1999
2000
2001
2002
Figure 1: Insulator Related SAIFI & SAIDI
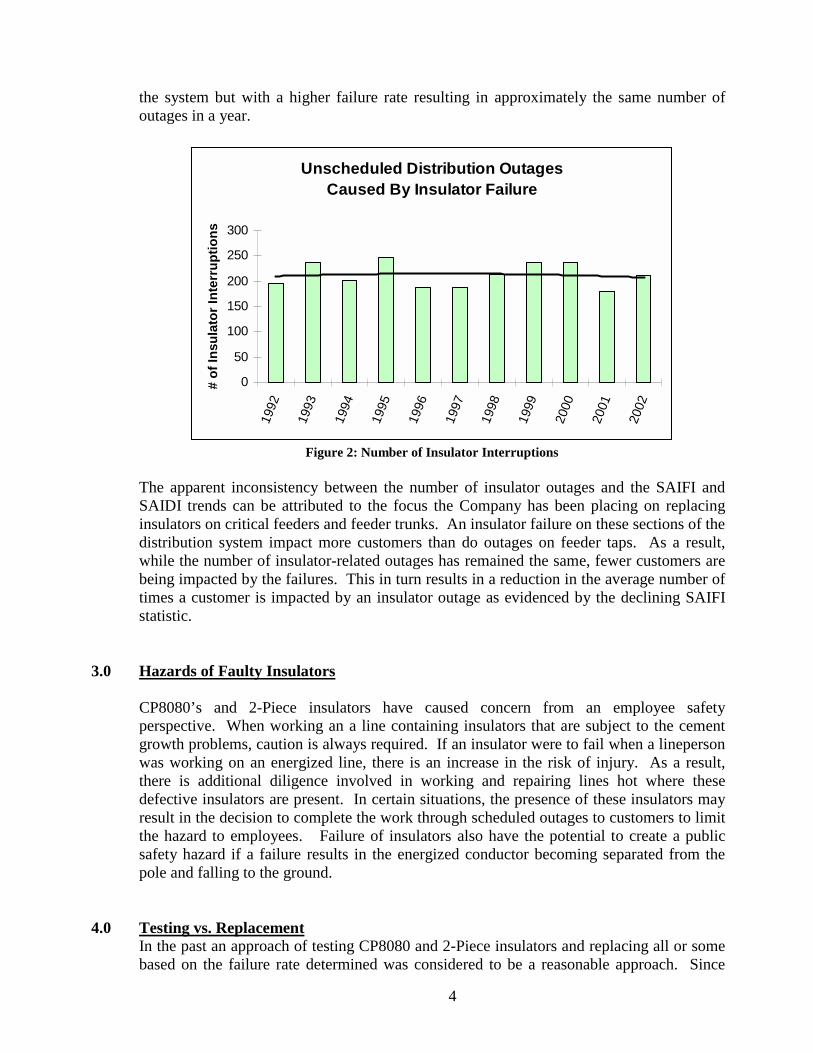
Considering the number of insulators changed out over the last five years and the overall improvement in SAIDI and SAIFI statistics related to distribution, a decreasing trend in the number of insulator related outages might be expected. Unfortunately this is not the case. As demonstrated in Figure 2, since 1992 there has not been any decrease in the number of insulator related outages. It seems likely that this is related to the fact that there are still a large number of CP8080 and 2-Piece insulators in the system on tap off lines. These are now five years older than they were when the Distribution Insulator Replacement Program started. As insulators age their failure rate goes up. Therefore, we have fewer insulators in
4
the system but with a higher failure rate resulting in approximately the same number of outages in a year.
Unscheduled Distribution OutagesCaused By Insulator Failure
0
50
100
150
200
250
300
1992
1993
1994
1995
1996
1997
1998
1999
2000
2001
2002
# of
Insu
lato
r Int
erru
ptio
ns
Figure 2: Number of Insulator Interruptions
The apparent inconsistency between the number of insulator outages and the SAIFI and SAIDI trends can be attributed to the focus the Company has been placing on replacing insulators on critical feeders and feeder trunks. An insulator failure on these sections of the distribution system impact more customers than do outages on feeder taps. As a result, while the number of insulator-related outages has remained the same, fewer customers are being impacted by the failures. This in turn results in a reduction in the average number of times a customer is impacted by an insulator outage as evidenced by the declining SAIFI statistic.
3.0 Hazards of Faulty Insulators CP8080’s and 2-Piece insulators have caused concern from an employee safety perspective. When working an a line containing insulators that are subject to the cement growth problems, caution is always required. If an insulator were to fail when a lineperson was working on an energized line, there is an increase in the risk of injury. As a result, there is additional diligence involved in working and repairing lines hot where these defective insulators are present. In certain situations, the presence of these insulators may result in the decision to complete the work through scheduled outages to customers to limit the hazard to employees. Failure of insulators also have the potential to create a public safety hazard if a failure results in the energized conductor becoming separated from the pole and falling to the ground.
4.0 Testing vs. Replacement In the past an approach of testing CP8080 and 2-Piece insulators and replacing all or some based on the failure rate determined was considered to be a reasonable approach. Since

5
1999 a new approach has been followed that involves the complete change out of problem insulators without testing. It has been concluded that time spent testing insulators on the distribution system would be more effectively spent replacing insulators, since failure rates on these insulators remain abnormally high.
5.0 Future Work The number of insulator related outages still remain unacceptable (an average of 216 per year for the last five years). The average outage duration experienced by customers is also still high at an average of 0.47 hours (28 minutes) per year over the last five years. The continued incidence of insulator failures have been confirmed by field staff who report that they are still seeing failures of two piece and CP8080 insulators. However in many areas staff have noted that these failures are becoming most common on feeder taps where the vast majority of remaining porcelain suspension and two-piece insulators remain. Given the impact on reliability due to the continued high number of 2-piece and CP8080 failures and the hazards the insulators present to line workers, a continuation of a focused insulator replacement program is recommended. This work should be completed in conjunction with the Feeder Inspections and Feeder Improvement Projects. Feeder inspections will be carried out on 20% of the feeders each year and these should identify locations where insulators should be changed out. This work should be budgeted for the following year. Based on the 20% feeder inspection target, substantially all the problem insulators will have been replaced within the next five years
6.0 Cost of Insulator Replacement In 2004, the Company plans on replacing 17,000 insulators, 11,000 in the Eastern Region and 6,000 in the Western Region. The cost of changing these insulators is estimated at $500,000 in 2004. A similar amount is anticipated in each of the next five years as these insulators are identified for replacement during feeder inspections.
7.0 Recommendations The following action is recommended with respect to the presence of CP8080 and 2-Piece insulators in the electrical system of Newfoundland Power:
As part of the annual distribution feeder inspection program, identify all 2-piece and CP8080 insulator for replacement and replace them in the following year.


Distribution Appendix 2
Attachment E
Automatic Sleeve Replacement
Newfoundland Power Inc.
Prepared by Keith Whiteway, P. Eng.
June 2003

i
Table of Contents
Page
Introduction ................................................................................................................. 1 Newfoundland Power’s Experience........................................................................... 1 Other Utilities’ Experience......................................................................................... 2 Automatic Sleeve Manufacturers .............................................................................. 2 Hazards of Automatic Sleeves.................................................................................... 2 Conclusion.................................................................................................................... 3 Recommendations ....................................................................................................... 3 Appendix A – Picture of In-Service Automatic Sleeve Appendix B – Picture of Corroded Automatic Sleeves
1
Introduction Automatic sleeves (splices) were introduced to the utility industry in the 1980’s. Previous to their introduction the main method of splicing (joining) conductors was by means of compression sleeves. These compression sleeves required the use of a specialized compression tool and were relatively labour intensive. The introduction of automatic or “quick” sleeves provided two main advantages over compression sleeves. One was the elimination of the compression tool; the automatic sleeve was installed without any tool. The other advantage was its ease of installation. It was very quick and easy to install. While the automatic sleeve was more expensive to purchase, the additional cost was more than compensated for by the gain in productivity. Newfoundland Power adopted automatic sleeves for use on a limited basis in 1993 and in 1999 approved automatic sleeves for use on the whole distribution system. However after nine years in service these automatic sleeves began showing signs of premature deterioration, in large part due to our severe environmental conditions. In late 2002, due to these problems with deterioration, Newfoundland Power discontinued the use of automatic sleeves. This report reviews the requirement for a 5-year replacement program for all in-service sleeves beginning in 2004. Newfoundland Power’s Experience The automatic sleeve was first used on the Newfoundland Power distribution system in 1993. In that year these sleeves were introduced for limited use, i.e. for one specific size conductor (#1/0) and specific applications (emergencies and hot line work). As operations personnel became more familiar with and recognized the ease of installation of these sleeves they received widespread use. By 1999 the automatic sleeve was approved for use on all distribution conductors without restriction. Refer to Appendix A for a picture of an in-service automatic sleeve. The first indication of a problem surfaced in early 2002 when an automatic sleeve failed (electrically) on a neutral conductor in the Avalon Area. An investigation showed corrosion inside the sleeve. This incident lead to the checking of additional sleeves in the area. Two were subsequently removed for inspection and both showed internal corrosion. During the fall of 2002, Newfoundland Power conducted a more comprehensive investigation into the issue of premature deterioration of automatic sleeves. A total of 35 sleeves were removed from various areas throughout the Company, both coastal and inland areas, and recently installed sleeves as well as older ones. The results from this investigation indicated widespread internal deterioration of automatic sleeves. 71% of the sleeves removed showed at least some corrosion with 37% being severely corroded. Refer to Appendix B for pictures of several of the more corroded sleeves.

2
In addition to the corrosion problem, Newfoundland Power has experienced several mechanical failures due to improper installation of the sleeve. While the sleeve is relatively easy to install, installation requires the following of specific procedures to ensure the conductor is fitted securely into the sleeve jaws. Other Utilities’ Experience Generally the experience of other utilities with automatic sleeves has been good up to this point in time. However, as a result of several recent mechanical failures of lines in service, B.C. Hydro is currently reviewing its use of automatic sleeves because of excessive corrosion and is preparing a plan to replace existing automatic sleeves in service. Similarly, Wisconsin Public Service Corp. has identified corrosion in automatic sleeves to be of concern to them and is planning further investigation. Given the relatively recent introduction of the use of automatic sleeves to the electrical industry, we may be seeing the early stages of a potentially serious problem developing for utilities. Internal corrosion will initially cause electrical failure of the automatic sleeve and eventually lead to mechanical failure (separation of the line). Automatic sleeves are in widespread use throughout utilities in North America and millions of these have been installed over the past 15-20 years. Automatic Sleeve Manufacturers When Newfoundland Power initially experienced sleeve failure due to corrosion, one of the manufacturers (Fargo) was contacted to provide an evaluation and comments. After their analysis of two corroded sleeves returned to them by Newfoundland Power, the manufacturer stated, in reference to a sleeve in service for just 5 years, “the evidence suggests that the (automatic sleeve) was nearing or had exceeded its service life in this harsh environment”. The manufacturer further states, “At the present time, we do not have an automatic (sleeve) designed specifically for these harsh environments”. The corrosion is not limited to one specific manufacturer. Deterioration occurs due to the inherent design of the automatic sleeve. There is not a sufficiently tight seal at the mouth of the sleeve to prevent the entry of moisture and contaminants into the sleeve itself. Hazards of Automatic Sleeves The main risk associated with corroded automatic sleeves is mechanical failure. This would result in line separation and the resulting hazard of an energized line dropping to the ground. This presents a public safety hazard. Additionally there is a risk to line personnel who perform energized work on lines as the separation of conductors would create a hazard to those workers.

3
For line personnel, in addition to the risk of mechanical failure, there is the risk of electrical failure of the sleeve. This is particularly hazardous if a sleeve on a neutral conductor fails. A lineman would not normally expect a sleeve to be electrically “open” and may place himself in a position to be seriously injured. Dangerously high voltage differences could be present across an electrically open sleeve on a neutral conductor. Conclusion Over the course of the past nine years approximately 10,000 automatic sleeves have been installed on Newfoundland Power’s distribution system, the majority of which were installed in the past 4-5 years. These automatic sleeves pose a serious safety hazard to employees and the public, as well as a potential to reduce customer service reliability. Based on this assessment, the sleeves should be removed from service on a scheduled basis over the next five years. The estimate to carry out the program to replace the 10,000 sleeves is $1,000,000.
Recommendations The following action is recommended with respect to automatic sleeves.
• In keeping with the decision of October 2002, discontinue automatic sleeves from further use, remove all automatic sleeves from line trucks and warehouses and return to suppliers.
• As part of the annual distribution line inspection program, identify automatic sleeves for removal from service in the following year. (20% annually of feeders are inspected).

APPENDIX A

In-service Automatic Sleeve

APPENDIX B
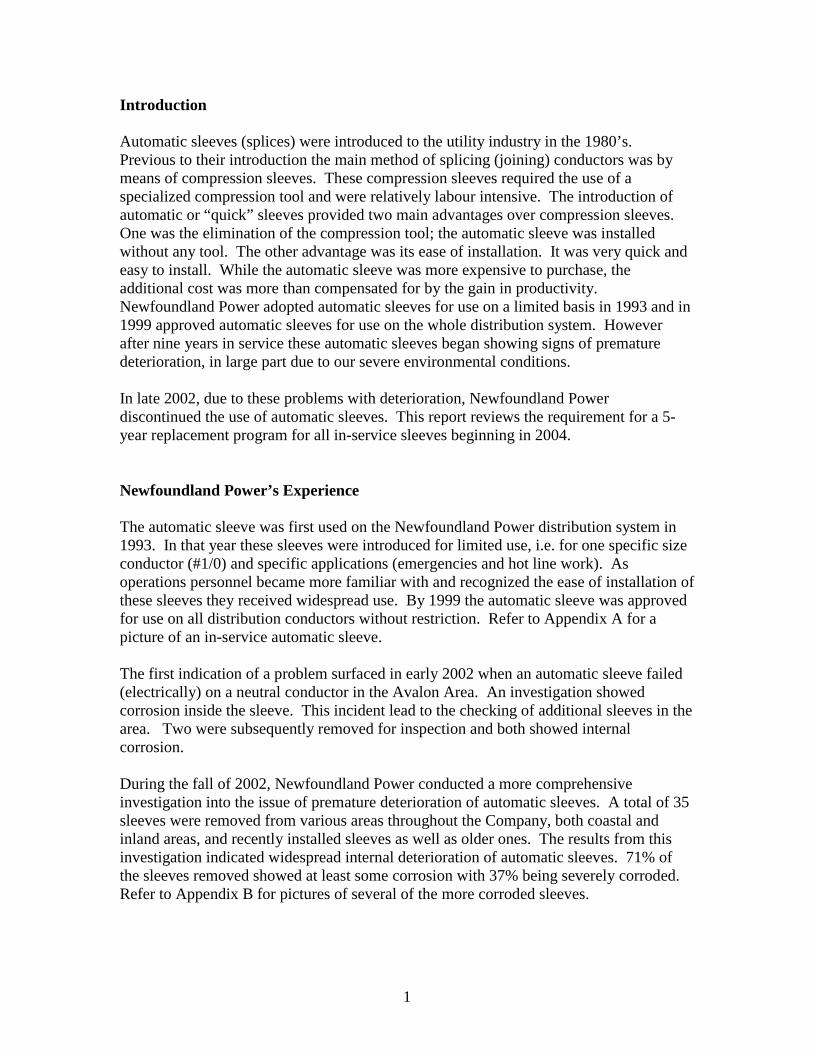
Automatic C Sleeve – Topsail Road This sleeve is a Reliable 7653 for 1/0 aluminum conductor and is date coded 93. It was removed from tap off Topsail Road, St. John’s. There is severe corrosion inside the sleeve with significant salt contamination on the jaws and conductor. The spring has rusted and almost turned to powder. This is very similar to the sleeve removed from Placentia following the open neutral.
Automatic Sleeve - Glovertown This sleeve is a Fargo GL-406 for 1/0 aluminum conductor and is date coded 01 99. It was removed from Glovertown. It was installed in 1997. There is severe corrosion on the jaws and conductor. The spring and guide cap is rusted on the left.

Automatic Sleeve – Turk’s Cove This sleeve is a Reliable 7653 for 1/0 aluminum conductor and is date coded 93. It was installed in Turk’s Cove on NCH-02 around 1993. There is severe corrosion on the jaws and conductor. The springs have rusted away.
Automatic Sleeve – Grand Bank This sleeve is a Fargo GL-406A for 1/0 aluminum conductor and is date coded 02 98. It was installed in Grand Bank on GRH-01. There is significant corrosion on the jaws and conductor.
Distribution Appendix 2
Attachment F
Porcelain Cutout Replacement
Newfoundland Power Inc.
Prepared by Keith Whiteway, P. Eng.
May 2003

i
Table of Contents
Page Introduction .................................................................................................................... 1 Newfoundland Power’s Experience.............................................................................. 1 Other Utilities’ Experience............................................................................................ 2 Hazards of Porcelain Cutouts ....................................................................................... 2 CEA Study ...................................................................................................................... 3 Alternatives to Porcelain Cutouts................................................................................. 3 Safety and Reliability ..................................................................................................... 3 Replacement of Porcelain Cutouts with Polymer Cutouts ......................................... 3 Cost to Implement a New Cutout Standard................................................................. 4 Recommendations .......................................................................................................... 4 Appendix A – Pictures of Broken Cutouts
1
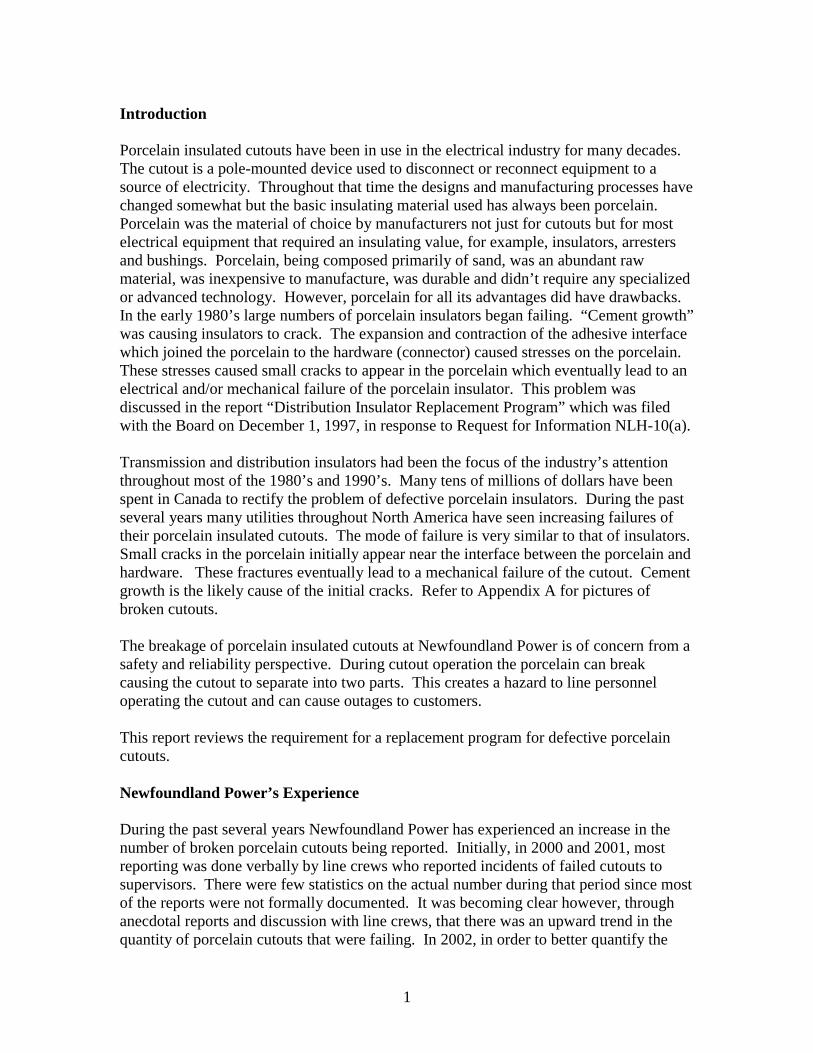
Introduction Porcelain insulated cutouts have been in use in the electrical industry for many decades. The cutout is a pole-mounted device used to disconnect or reconnect equipment to a source of electricity. Throughout that time the designs and manufacturing processes have changed somewhat but the basic insulating material used has always been porcelain. Porcelain was the material of choice by manufacturers not just for cutouts but for most electrical equipment that required an insulating value, for example, insulators, arresters and bushings. Porcelain, being composed primarily of sand, was an abundant raw material, was inexpensive to manufacture, was durable and didn’t require any specialized or advanced technology. However, porcelain for all its advantages did have drawbacks. In the early 1980’s large numbers of porcelain insulators began failing. “Cement growth” was causing insulators to crack. The expansion and contraction of the adhesive interface which joined the porcelain to the hardware (connector) caused stresses on the porcelain. These stresses caused small cracks to appear in the porcelain which eventually lead to an electrical and/or mechanical failure of the porcelain insulator. This problem was discussed in the report “Distribution Insulator Replacement Program” which was filed with the Board on December 1, 1997, in response to Request for Information NLH-10(a). Transmission and distribution insulators had been the focus of the industry’s attention throughout most of the 1980’s and 1990’s. Many tens of millions of dollars have been spent in Canada to rectify the problem of defective porcelain insulators. During the past several years many utilities throughout North America have seen increasing failures of their porcelain insulated cutouts. The mode of failure is very similar to that of insulators. Small cracks in the porcelain initially appear near the interface between the porcelain and hardware. These fractures eventually lead to a mechanical failure of the cutout. Cement growth is the likely cause of the initial cracks. Refer to Appendix A for pictures of broken cutouts. The breakage of porcelain insulated cutouts at Newfoundland Power is of concern from a safety and reliability perspective. During cutout operation the porcelain can break causing the cutout to separate into two parts. This creates a hazard to line personnel operating the cutout and can cause outages to customers. This report reviews the requirement for a replacement program for defective porcelain cutouts. Newfoundland Power’s Experience During the past several years Newfoundland Power has experienced an increase in the number of broken porcelain cutouts being reported. Initially, in 2000 and 2001, most reporting was done verbally by line crews who reported incidents of failed cutouts to supervisors. There were few statistics on the actual number during that period since most of the reports were not formally documented. It was becoming clear however, through anecdotal reports and discussion with line crews, that there was an upward trend in the quantity of porcelain cutouts that were failing. In 2002, in order to better quantify the
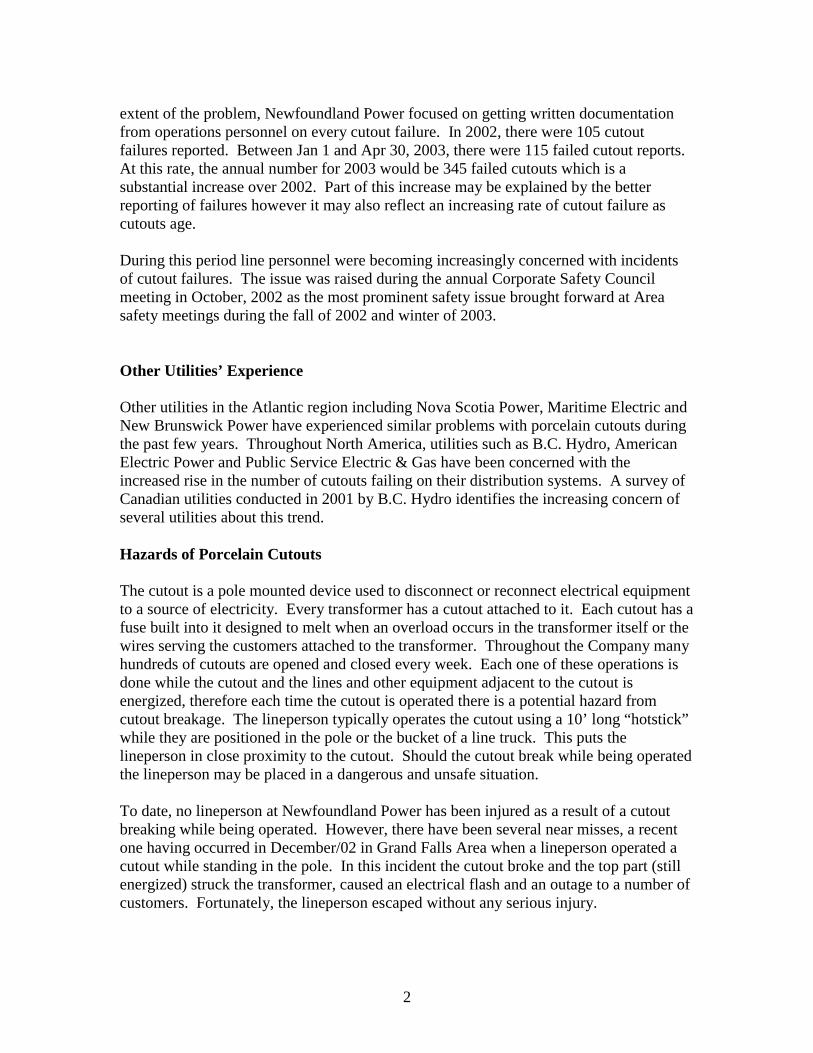
2
extent of the problem, Newfoundland Power focused on getting written documentation from operations personnel on every cutout failure. In 2002, there were 105 cutout failures reported. Between Jan 1 and Apr 30, 2003, there were 115 failed cutout reports. At this rate, the annual number for 2003 would be 345 failed cutouts which is a substantial increase over 2002. Part of this increase may be explained by the better reporting of failures however it may also reflect an increasing rate of cutout failure as cutouts age. During this period line personnel were becoming increasingly concerned with incidents of cutout failures. The issue was raised during the annual Corporate Safety Council meeting in October, 2002 as the most prominent safety issue brought forward at Area safety meetings during the fall of 2002 and winter of 2003. Other Utilities’ Experience Other utilities in the Atlantic region including Nova Scotia Power, Maritime Electric and New Brunswick Power have experienced similar problems with porcelain cutouts during the past few years. Throughout North America, utilities such as B.C. Hydro, American Electric Power and Public Service Electric & Gas have been concerned with the increased rise in the number of cutouts failing on their distribution systems. A survey of Canadian utilities conducted in 2001 by B.C. Hydro identifies the increasing concern of several utilities about this trend. Hazards of Porcelain Cutouts The cutout is a pole mounted device used to disconnect or reconnect electrical equipment to a source of electricity. Every transformer has a cutout attached to it. Each cutout has a fuse built into it designed to melt when an overload occurs in the transformer itself or the wires serving the customers attached to the transformer. Throughout the Company many hundreds of cutouts are opened and closed every week. Each one of these operations is done while the cutout and the lines and other equipment adjacent to the cutout is energized, therefore each time the cutout is operated there is a potential hazard from cutout breakage. The lineperson typically operates the cutout using a 10’ long “hotstick” while they are positioned in the pole or the bucket of a line truck. This puts the lineperson in close proximity to the cutout. Should the cutout break while being operated the lineperson may be placed in a dangerous and unsafe situation. To date, no lineperson at Newfoundland Power has been injured as a result of a cutout breaking while being operated. However, there have been several near misses, a recent one having occurred in December/02 in Grand Falls Area when a lineperson operated a cutout while standing in the pole. In this incident the cutout broke and the top part (still energized) struck the transformer, caused an electrical flash and an outage to a number of customers. Fortunately, the lineperson escaped without any serious injury.
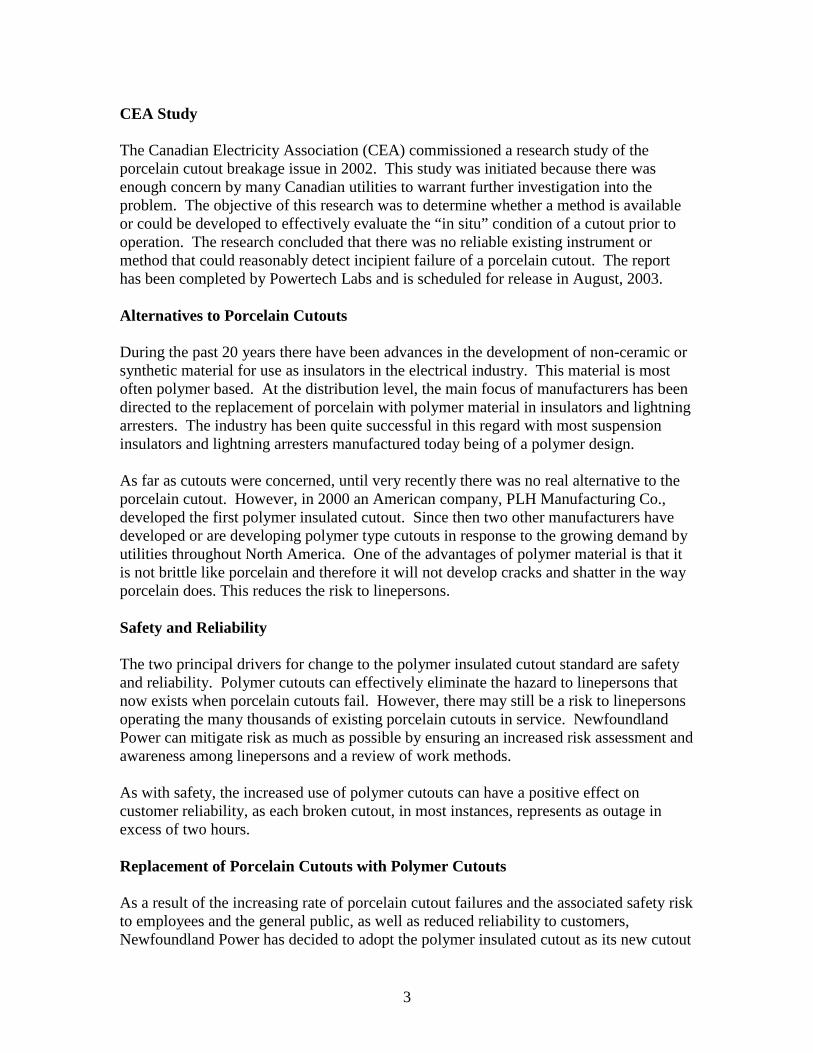
3
CEA Study The Canadian Electricity Association (CEA) commissioned a research study of the porcelain cutout breakage issue in 2002. This study was initiated because there was enough concern by many Canadian utilities to warrant further investigation into the problem. The objective of this research was to determine whether a method is available or could be developed to effectively evaluate the “in situ” condition of a cutout prior to operation. The research concluded that there was no reliable existing instrument or method that could reasonably detect incipient failure of a porcelain cutout. The report has been completed by Powertech Labs and is scheduled for release in August, 2003. Alternatives to Porcelain Cutouts During the past 20 years there have been advances in the development of non-ceramic or synthetic material for use as insulators in the electrical industry. This material is most often polymer based. At the distribution level, the main focus of manufacturers has been directed to the replacement of porcelain with polymer material in insulators and lightning arresters. The industry has been quite successful in this regard with most suspension insulators and lightning arresters manufactured today being of a polymer design. As far as cutouts were concerned, until very recently there was no real alternative to the porcelain cutout. However, in 2000 an American company, PLH Manufacturing Co., developed the first polymer insulated cutout. Since then two other manufacturers have developed or are developing polymer type cutouts in response to the growing demand by utilities throughout North America. One of the advantages of polymer material is that it is not brittle like porcelain and therefore it will not develop cracks and shatter in the way porcelain does. This reduces the risk to linepersons. Safety and Reliability The two principal drivers for change to the polymer insulated cutout standard are safety and reliability. Polymer cutouts can effectively eliminate the hazard to linepersons that now exists when porcelain cutouts fail. However, there may still be a risk to linepersons operating the many thousands of existing porcelain cutouts in service. Newfoundland Power can mitigate risk as much as possible by ensuring an increased risk assessment and awareness among linepersons and a review of work methods. As with safety, the increased use of polymer cutouts can have a positive effect on customer reliability, as each broken cutout, in most instances, represents as outage in excess of two hours. Replacement of Porcelain Cutouts with Polymer Cutouts As a result of the increasing rate of porcelain cutout failures and the associated safety risk to employees and the general public, as well as reduced reliability to customers, Newfoundland Power has decided to adopt the polymer insulated cutout as its new cutout

4
standard and eliminate any further installation of porcelain insulated cutouts. The new polymer cutouts will be used for all new installations on a go forward basis and for replacement of failed or defective cutouts. The Company’s distribution inspection program requires that all distribution feeders be inspected on a 5 year cycle. Part of this inspection process should be the identification of defective porcelain cutouts i.e. ones that have evidence of cracks but have not yet failed. These defective cutouts will be replaced as part of the feeder upgrade project in the year following their identification. Newfoundland Power should closely monitor future porcelain cutout failures to determine whether additional measures such as an accelerated cutout replacement program is warranted in the future. Cost to Implement a New Cutout Standard The Company purchases on average approximately 2,400 cutouts per year at an annual cost of approximately $140,000. By way of comparison, 2,400 polymer cutouts would cost approximately $240,000. In addition to the above, as part of the annual inspection process, it is anticipated that approximately 1,000 defective cutouts will be identified per year. The annual cost of the material and labour to replace these additional units would be approximately $140,000. Recommendations The following action is recommended with respect to porcelain cutouts.
• Adopt polymer insulated cutouts as the new cutout standard.
• Discontinue the use of porcelain cutouts.
• As part of the annual distribution line inspection program identify defective cutouts i.e. ones that have visible evidence of cracks.
• In the year following the annual inspection remove the defective cutout from service.
• Monitor future porcelain cutout failures to determine whether additional measures such as an accelerated replacement program is necessary.

APPENDIX A
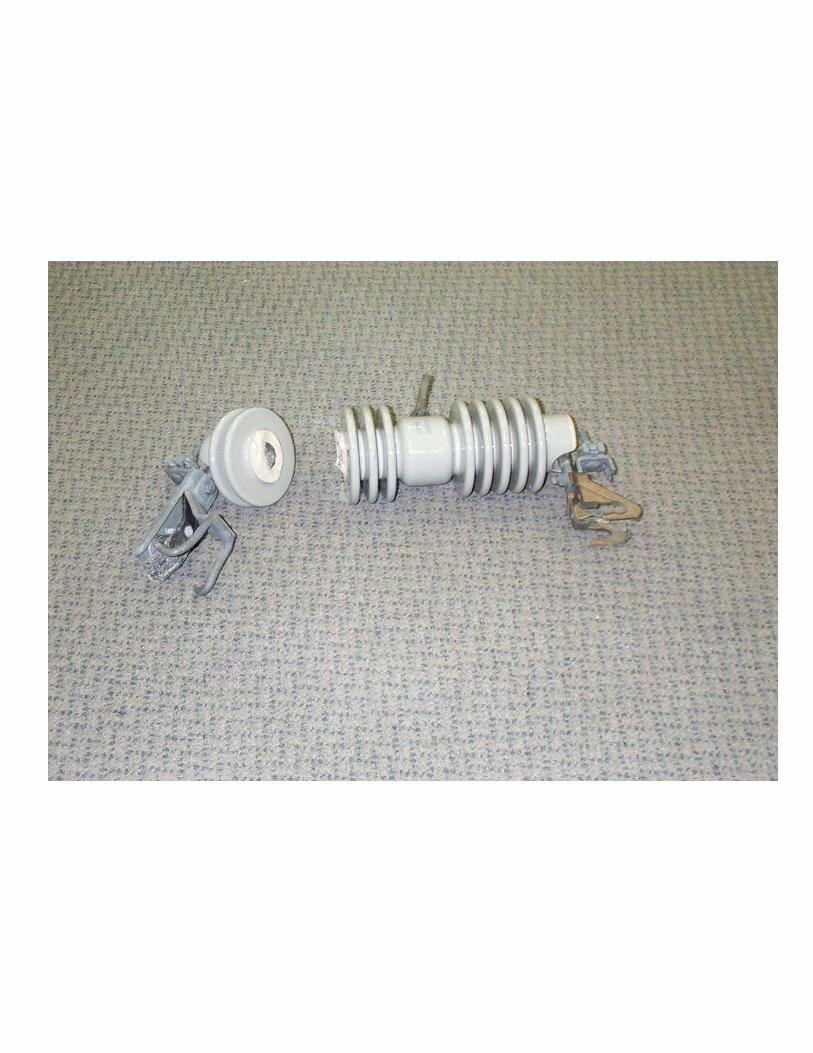
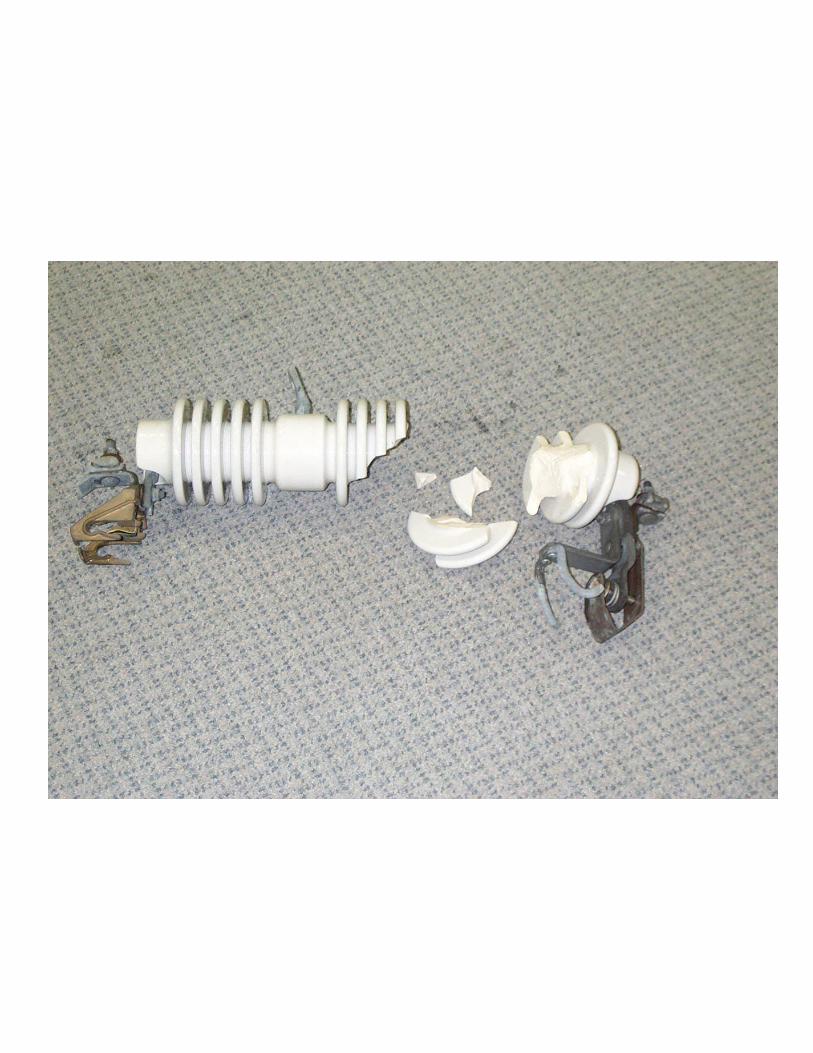
Distribution Appendix 2
Attachment G
Underground Distribution System Replacements in the St. John’s Area
Newfoundland Power Inc.
June, 2003

i
Table of Contents Page Introduction 1 Underground Service Faults 1 Padmount Transformer Failures 3 Proposed Replacement Projects 4 Conclusions 4 Summary of Recommendations 5

1
1.0 Introduction In the early to mid-1970s, several large residential developments in the St. John’s metropolitan area were serviced by way of underground distribution systems. These systems were installed using direct-buried underground cables, which have proven to be very unreliable. The direct-buried systems were installed primarily in three areas: Virginia Park in the east end of St. John’s, the Newtown (Whitely Drive/Munden Drive) area of Mount Pearl and Elizabeth Park in Paradise. Customers served by these systems have experienced frequent faults and Newfoundland Power has been repairing faults and replacing these services since 1978. In a report titled “No Splicing Policy and Accelerated Replacement Program in the Virginia Park Underground Distribution System” filed with the Public Utilities Board in September, 1997, the Company recommended an accelerated service replacement program starting in 1998. The Company had followed through on this recommendation and plans to continue for the next few years until such time that all services that have experienced a fault have been replaced. In addition, a five-year replacement program for padmount transformers, which also form part of these systems, will commence. These transformers are nearing the end of their 30-year lives and the number of padmount failures has been increasing. These transformers are filled with oil and failure due to rusting results in costly clean-up efforts and interruptions in service to customers. This report will describe the problems associated with these underground systems and the programs proposed to address these problems. 2.0 Underground Service Faults Within a very short time after the initial installations, it became apparent that direct-buried underground distribution systems were not well suited to the climate and geography of Eastern Newfoundland. A breakdown of the original number of underground services installed in each of these areas, the number of faults experienced to date and the number of services replaced are presented in the table below.
Area Services Installed Faults to Date Services Replaced Elizabeth Park 237 91 61 Mount Pearl 1,571 790 349 Virginia Park 803 521 383 Totals 2,611 1,402 793 Replacing these services requires careful excavation of the existing cable run, installation of new conduit and conductor and restoration of the property with topsoil, sods, asphalt, concrete, and/or paving stones. As many of these faults occur during the winter months when frozen ground conditions do not permit replacement, temporary connections by “daisy-chaining” with an adjacent service is often necessary. Such temporary connections are costly and can present safety concerns due to the potential for mechanical damage to

2
the exposed, at-grade cable. For these and reliability reasons, the preferred alternative is to replace these direct-buried services in a planned manner. As indicated in Figure 1 below, the numbers of faults appears to be declining. However, Figure 2 illustrates that the number of faults as a percentage of the original installations still in service remains relatively constant.
Figure 1Number of Underground Service Faults by Area
0
5
10
15
20
25
30
35
40
45
1991 1992 1993 1994 1995 1996 1997 1998 1999 2000 2001 2002 2003 YTD
Year
Num
ber o
f Fau
lts
Elizabeth Park Mount Pearl Virginia Park Totals
Figure 2Faults as a Percentage of Original (Unreplaced) Services
0.00%
0.50%
1.00%
1.50%
2.00%
2.50%
3.00%
3.50%
1991 1992 1993 1994 1995 1996 1997 1998 1999 2000 2001 2002 2003 YTD
Year
Faul
ts p
er O
rigin
al S
ervi
ce (%
)
Elizabeth Park Mount Pearl Virginia Park Total
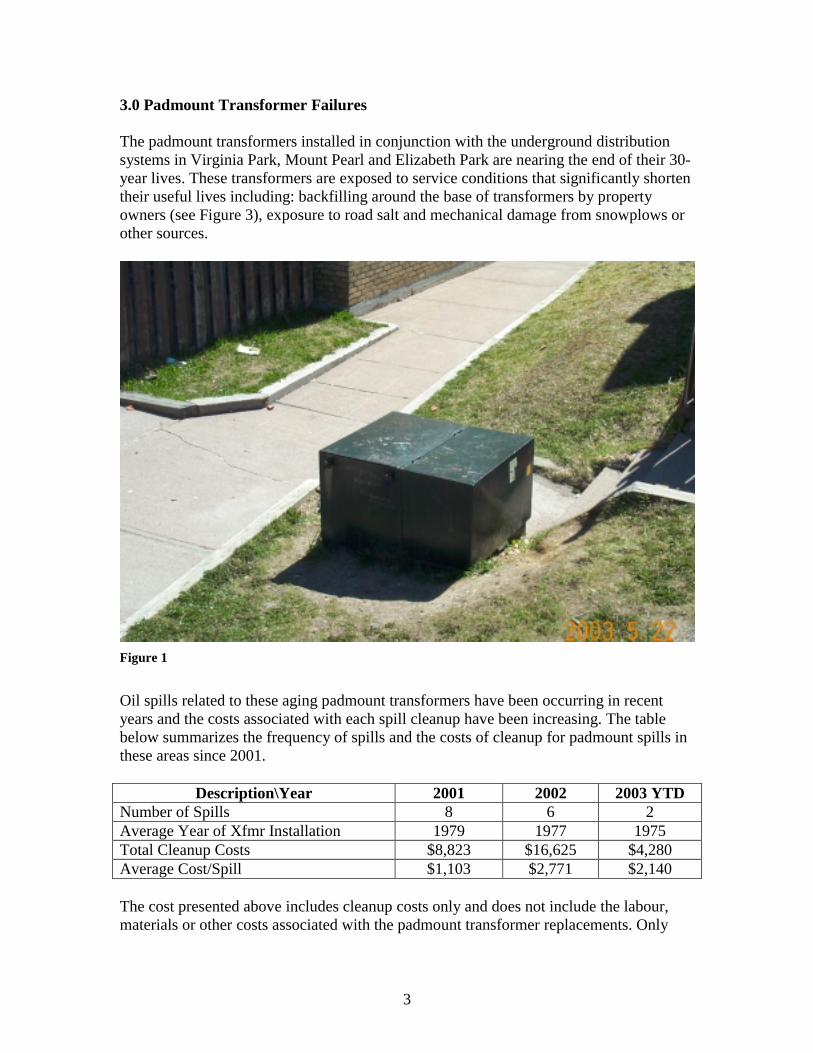
3
3.0 Padmount Transformer Failures The padmount transformers installed in conjunction with the underground distribution systems in Virginia Park, Mount Pearl and Elizabeth Park are nearing the end of their 30-year lives. These transformers are exposed to service conditions that significantly shorten their useful lives including: backfilling around the base of transformers by property owners (see Figure 3), exposure to road salt and mechanical damage from snowplows or other sources.
Figure 1
Oil spills related to these aging padmount transformers have been occurring in recent years and the costs associated with each spill cleanup have been increasing. The table below summarizes the frequency of spills and the costs of cleanup for padmount spills in these areas since 2001.
Description\Year 2001 2002 2003 YTD Number of Spills 8 6 2 Average Year of Xfmr Installation 1979 1977 1975 Total Cleanup Costs $8,823 $16,625 $4,280 Average Cost/Spill $1,103 $2,771 $2,140 The cost presented above includes cleanup costs only and does not include the labour, materials or other costs associated with the padmount transformer replacements. Only
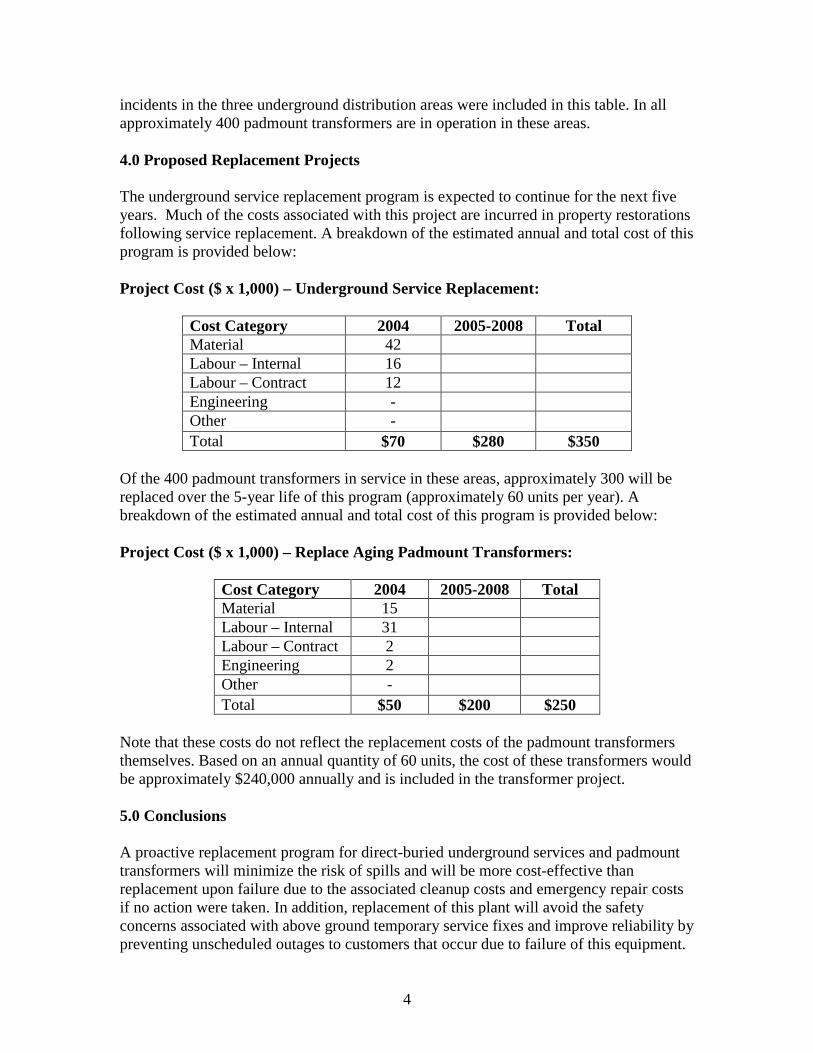
4
incidents in the three underground distribution areas were included in this table. In all approximately 400 padmount transformers are in operation in these areas. 4.0 Proposed Replacement Projects The underground service replacement program is expected to continue for the next five years. Much of the costs associated with this project are incurred in property restorations following service replacement. A breakdown of the estimated annual and total cost of this program is provided below: Project Cost ($ x 1,000) – Underground Service Replacement:
Cost Category 2004 2005-2008 Total Material 42 Labour – Internal 16 Labour – Contract 12 Engineering - Other - Total $70 $280 $350
Of the 400 padmount transformers in service in these areas, approximately 300 will be replaced over the 5-year life of this program (approximately 60 units per year). A breakdown of the estimated annual and total cost of this program is provided below: Project Cost ($ x 1,000) – Replace Aging Padmount Transformers:
Cost Category 2004 2005-2008 Total Material 15 Labour – Internal 31 Labour – Contract 2 Engineering 2 Other - Total $50 $200 $250
Note that these costs do not reflect the replacement costs of the padmount transformers themselves. Based on an annual quantity of 60 units, the cost of these transformers would be approximately $240,000 annually and is included in the transformer project. 5.0 Conclusions A proactive replacement program for direct-buried underground services and padmount transformers will minimize the risk of spills and will be more cost-effective than replacement upon failure due to the associated cleanup costs and emergency repair costs if no action were taken. In addition, replacement of this plant will avoid the safety concerns associated with above ground temporary service fixes and improve reliability by preventing unscheduled outages to customers that occur due to failure of this equipment.
5
Summary of Recommendations The following action is recommended with respect to underground services and padmount transformers.
• Continue the program of scheduled underground service replacements for the next five years or until completed.
• Implement a program to replace approximately 60 padmount transformers per year on a scheduled basis for the next five years or until all deteriorated units have been replaced.
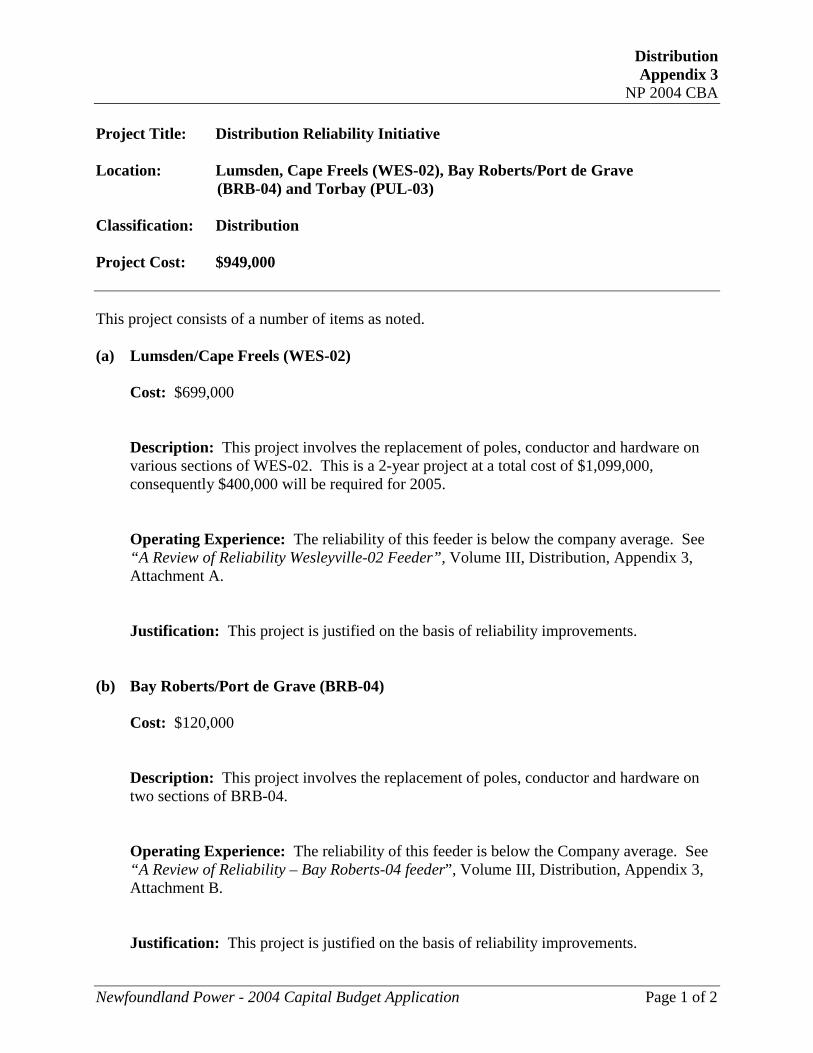
Distribution Appendix 3
NP 2004 CBA
Newfoundland Power - 2004 Capital Budget Application Page 1 of 2
Project Title: Distribution Reliability Initiative Location: Lumsden, Cape Freels (WES-02), Bay Roberts/Port de Grave
(BRB-04) and Torbay (PUL-03) Classification: Distribution Project Cost: $949,000 This project consists of a number of items as noted. (a) Lumsden/Cape Freels (WES-02)
Cost: $699,000
Description: This project involves the replacement of poles, conductor and hardware on various sections of WES-02. This is a 2-year project at a total cost of $1,099,000, consequently $400,000 will be required for 2005.
Operating Experience: The reliability of this feeder is below the company average. See “A Review of Reliability Wesleyville-02 Feeder”, Volume III, Distribution, Appendix 3, Attachment A. Justification: This project is justified on the basis of reliability improvements.
(b) Bay Roberts/Port de Grave (BRB-04)
Cost: $120,000
Description: This project involves the replacement of poles, conductor and hardware on two sections of BRB-04.
Operating Experience: The reliability of this feeder is below the Company average. See “A Review of Reliability – Bay Roberts-04 feeder”, Volume III, Distribution, Appendix 3, Attachment B. Justification: This project is justified on the basis of reliability improvements.

Distribution Appendix 3
NP 2004 CBA
Newfoundland Power - 2004 Capital Budget Application Page 2 of 2
(c) Install New Feeder – PUL-03
Cost: $130,000 – Distribution, $94,000 - Substations
Description: This project involves the construction of a distribution feeder from Pulpit Rock substation in Torbay, along Country Drive and Manning’s Hill to Torbay Road. Operating Experience: The extended length of the Pulpit Rock feeders and high customer growth is a contributing factor to the inferior service reliability in the Torbay, Flatrock and Pouch Cove area.
Justification: An engineering review, “Pulpit Rock Substation, Loading and Reliability
Review” indicates that this project is the low cost alternative to address growth and reliability issues. (See Volume III, Appendix 3, Distribution, Attachment C).
Distribution Appendix 3
Attachment A
A Review of Reliability
Wesleyville-02 Feeder
i
Reliability Review – WES-02 Feeder 1. Executive Summary ........................................................................................................ 1 2. Introduction ..................................................................................................................... 2 3. Distribution Reliability (WES-02 Feeder) ...................................................................... 2 4. Construction Standards and Defective Materials ............................................................. 2
4.1 CP 8080 and 2 Piece Insulators.............................................................................. 2
4.2 Heavy Loading vs. Normal Construction............................................................... 2 4.3 Porcelain Cutouts ................................................................................................... 3 4.4 Lightning Arrestors ................................................................................................ 3
5. WES-02 Feeder ................................................................................................................ 3 6. Outage History for WES-02............................................................................................ 4 6.1 WES-02 Feeder by Component that Failed............................................................ 5 6.2 WES-02 Feeder by Cause ...................................................................................... 6 7. Recommendations ........................................................................................................... 7 7.1 All Sections of WES-02 Feeder .......................................................................... 7 7.2 Newtown to Cape Freels ..................................................................................... 7 7.3 Cape Freels to Lumsden...................................................................................... 8 7.4 Lumsden to Deadman’s Cove ............................................................................. 8 7.5 Templeman / Pound Cove Area .......................................................................... 9 8. Conclusion....................................................................................................................... 10
Appendix A – Standard Construction
Appendix B – Heaving Loading Construction Appendix C – Section of line Newtown to Cape Freels Appendix D – Section of line Cape Freels to Lumsden Appendix E – Section of line Lumsden to Deadman’s Cove
1
1. Executive Summary
In March 2001, the Company completed a review of transmission line related outages affecting various areas of the province that were served by long radial transmission lines. The resulting report “Salt Pond Gas Turbine – Relocation Project” filed with the Public Utilities Board in response to PUB-5.4 – 2002 Capital Budget Application, identified the Bonavista North (Wesleyville) area as an area significantly affected by transmission line outages. The report recommended that the Salt Pond Gas Turbine, which was underutilized at its existing location, be relocated to the Wesleyville area to provide improvements to service reliability. This project will be completed in 2003. Unscheduled distribution line outages also have an effect on reliability. For the period 1998 to 2002, the five-year average of unscheduled distribution outages for the Wesleyville (WES-02) feeder, which services the areas from Pound Cove/Templeman to Lumsden, was a SAIFI = 3.70 and a SAIDI = 6.31 hours. This feeder has been identified as having some of the worst reliability statistics in the Company. The purpose of this report is to provide a plan of action to improve reliability of the Wesleyville (“WES-02”) feeder. The feeder was examined in sections with a detailed look at outage records, their causes and the components that failed. This was combined with comments from local operations personnel to produce recommended actions to address the problems causing unsatisfactory reliability statistics.
WES-02 feeder originates in Wesleyville Substation in New-Wes-Valley. The feeder has been prone to failure mainly due to the environmental conditions associated with its location and its length (approximately 50 km). It extends along the north east coast of the island in a section known as Bonavista North and is subject to high winds, salt spray, ice loading, and lightning strikes. Significant upgrading is recommended to address those issues. To improve the performance of this feeder, it is recommended to:
• Relocate / rebuild 10.4 km of three phase line • Relocate / rebuild 8.5 km of one phase line • Replace 30 poles / structures • Address deficiencies identified in the 2003 Feeder Inspection Report
2
Completing these projects will have a positive effect on the performance of this feeder, resulting in fewer outages to customers and lower operating costs. Due to size of the project and nature of the work, the proposal involves completing the total project over a period of two years.
2.0 Introduction
This report provides a plan to improve the reliability of WES-02 feeder located in Bonavista North. This report compares the reliability statistics of WES-02 with other feeders in the company. Also included is WES-02 information regarding the outage history, the major causes of outages and trouble areas. Recommendations are made to improve WES-02 reliability performance with the most cost effective options considered.
3.0 Distribution Reliability (WES-02 Feeder)
A report titled “2003 Corporate Distribution Reliability Review” identified feeders that consistently exhibited below average reliability. The report reviewed such data as the average annual total number of customer minutes of interruption, System Average Interruption Frequency Index (SAIFI), and the System Average Interruption Duration Index (SAIDI). The report considered whether major work had been completed on the feeder during the past year or if work was scheduled for 2003. This report concluded that WES-02 was amongst the least reliable performers in the Company and should have work completed to improve its performance. For the period 1998 to 2002, the five-year average unscheduled distribution outage statistics for WES-02 was 287,454 customer minutes, SAIFI was 3.70 and SAIDI was 6.31. The company average per feeder for the same time frame was 116,144 customer minutes, SAIFI was 1.81 and SAIDI was 2.85 hours. During 2002, the outage statistics was 420,678 customer minutes, SAIFI was 8.12 and SAIDI was 9.15 hours.
4.0 Construction Standards and Defective Materials Design, construction and material standards play a significant role in the reliability of distribution systems. The proposed work on the WES-02 feeder will incorporate the changes that have taken place with respect to standards during the past number of years.
4.1 CP 8080 and 2 piece Insulators
Since the early 1980’s, there have been many outages associated with the electrical/mechanical failure of two types of distribution insulators,

3
Canadian Porcelain (CP) 8080 insulators and Pin Cap two piece insulators. Both of these types of insulators had been widely used throughout the company and have been discussed in previous reports. The latest report entitled “Distribution Insulator Replacement Program” completed in June of 2003 recommends these types of insulators be replaced on a go forward basis over the next 5 years.
4.2 Heavy Loading vs. Normal Construction
For areas that are subject to above normal loading conditions, heavy loading design standards should be used. The heavy loading standards adds increased strength to the pole hardware to combat problems associated with additional ice and wind loading on the conductor. Additionally, the increased voltage rating of the insulators decreases the risk of an outage due to salt spray flashover. Normal construction involves using Pin Type insulators and “Tie Wire” to secure the conductor to the insulator. In wind storms tie wires have been known to break or become “untied”. Heavy loading construction utilizes line post insulators and clamps to secure the conductor. Appendices A and B show the difference in the two types of construction.
4.3 Porcelain Cutouts
A report entitled “Porcelain Cutout Replacement” reviews the problems associated with this type of fuse holder. The report recommends the adoption of an inspection and replacement program to manage this problem. Should the cutout break while being manually operated, the lineperson is placed in a dangerous and unsafe position.
4.4 Lightning Arrestors
Lighting arrestors are placed on transformer to protect the equipment from failures due to a lighting strike. A report entitled “A Study into the Feasibility of Installing Surge Arrestors on Newfoundland Power Distribution System” recommended that all transformers on WES-02 be equipped with lightning arrestors.
5.0 WES-02 Feeder
Located in the Gander operating area of the Western Region, WES-02 feeder is a 12.5 kV line that originates at the Wesleyville substation located in New-Wes-
4
Valley and serves approximately 766 customers. The three phase portion of this line extends from Pound Cove / Templeman to Lumsden with a three phase tap to Newtown. Single-phase taps serve the communities of Cape Freels and Deadman’s Bay. This line was originally constructed over a two-year period: Wesleyville Substation ---------------------------------------------------------- 1963 Newtown branch to Lumsden, Cape Freels and Deadman’s Bay --------- 1964 The three phase section from Wesleyville Substation to Newtown branch has 4/0 AASC phase conductor with a 1/0 AASC neutral conductor. Newtown tap is 3 phase all 1/0 AASC. The 3-phase section from Newtown branch to Lumsden is 4/0 AASC center phase with 1/0 AASC side phases and neutral. The single-phase tap to Cape Freels was reconductored with 1/0 AASC in 1987. The single-phase tap to Deadman’s Bay was reconductored with 4/0 AASC phase conductor and 1/0 AASC neutral in 1983. This entire feeder is in an exposed area and is subject to salt contamination, very high winds, ice loading and lightning strikes. Sections of this line follow an old abandoned road and are not easily accessible. A Distribution Feeder Inspection was completed on the feeder in early 2003. The inspection revealed a number of items to be addressed with the feeder. These include:
• The existence of two piece insulators, CP 8080 deadend insulators and porcelain cutouts.
• The requirement of lightning arrestors • Grounding and guying issues. These include the use of design
standards that have changed since the feeder was built along with items such as rusty or broken guys.
• The existence of deteriorated crossarms. These involve cracks developing in crossarms, rotting arms, woodpecker holes, etc.
6. Outage History for WES-02
The WES-02 feeder has a significant history of outages. The feeder is located 100 km from the Gander Service Centre. Sections of the highway in these areas are subject to heavy drifting, sometimes making the roads impassable for long periods of time, which has increased the outage durations. A Newfoundland Power District Crew is located in the Town of New-West-Valley. This two-person crew usually completes emergency work on this feeder. In times of multiple or major problems, additional personnel and materials are
5
sent from Gander. After regular hours during the winter months, one of the two-person district crew is normally on 24-hour Standby while in summer months, the Wesleyville and Glovertown district crews cover each other’s areas on alternate weeks. Sections of the main trunk of the feeder are located up to 450 meters off the road right-of-way (ROW), making damage difficult to find and repair during winter storms. A section of the single-phase distribution line that services Deadman’s Cove is located along the old road, which is up to 650 meters from the existing road. Most of these sections must be accessed by ATVs in the summer months. All sections located along the old road must be accessed by snowmobile during the winter months. Extreme weather plays a major role in the power outages to customers in this area. In the last 5 years, 1998 to 2002, 69% of all customer minute outages were directly related to sleet, wind, lightning and salt spray. Other problems such as service connection failure can be attributed to the effects of severe weather conditions on equipment over a prolonged period of time. A winter storm on December 27, 2002 resulted in major outages in the area. Crews were dispatched from Gander, Grand Falls and St. Johns. Repair costs for the one-day storm were approximately $45,000.
6.1 WES-02 Feeder by Component that Failed
The chart below shows a listing of the 138 problem calls received for the period from 1998 to 2002. The listing is sorted by the “Component that Failed”. In some occurrences, such as in sleet and wind storms, there are no components that failed permanently. The fuses and reclosers that operate under these conditions were operating properly. Typical of such circumstances would be wires coming too close due to wind gusts and ‘flashing over’ and similar occurrences where insulators flash over due to momentary salt spray without failing.

6
1998 - 2002
Component that Failed Number of Outages Customer Minutes
Conductor 5 140,642 Conductor Hardware 4 212,975 Regulators 1 14,817 Fuses1 59 102,788 Insulators 17 729,194 Other 4 70,780 Control Equipment at Sub2 5 86,165 Reclosers 2 19,490 Pole Hardware 2 5,000 Transformers 13 10,869 Service Wires 17 672 Cutout / Switch 8 43,877 Total 138 1,437,269
1 Fuses operated as a result of sleet, wind, and lightning. 2 Includes operations for Salt Spray.
6.2 WES-02 Feeder by Cause
The chart below also notes the 138 problem calls received for the period from 1998 to 2002. The chart sorts the problem calls by “Cause”.
1998 - 2002 Cause Number of Outages Customer Minutes
Salt Spray1 5 96,428 Wind 17 365,278 Lightning 9 3,850 Sleet 5 632,694 Broken/Defective Equip. 75 291,221 Damage Outside Party 4 1,507 Unexplained 6 53,116 Other 8 19,442 Overloaded Equipment 1 559 Animals 5 629 Fire 1 72,485 Improperly Installed Equip 1 60 Total 138 1,437,269
1 Although only five outages were reported as salt spray, most of the outages reported as wind involved salt contamination also.

7
Broken and Defective equipment include items such as insulators, conductor and hardware.
8
7.0 Recommendations Based on all the information gathered regarding WES-02, each feeder section was reviewed for location characteristics (i.e. exposed to extreme salt spray conditions, ice loading etc.). Each section of the feeder was then analyzed to see if specific causes of outages could be determined and appropriate solutions recommended.
7.1 All Sections of WES-02 Feeder
The following are recommendations that apply to each section of WES-02: 1. The whole feeder is exposed to extreme salt contamination. The following
should be adopted as a minimum standard for this feeder. • Long bushing transformers • 34 kV clamp top insulators • Standoff brackets for all cutouts
2. Replace all 8080 and 2-piece insulators.
3. Installation of lightning arrestors on all transformers. 4. Review vertical to horizontal conductor phase spacing and correct any
violations by installing mid-span poles.
5. Where extreme ice loading occurs, design new lines using heavy loading design standards.
6. Correct all deficiencies identified in the 2003 Distribution Inspection
Report.
7.2 Newtown to Cape Freels (8 km)
This section of the main feeder trunk is located away from the road by much as 450 meters. It is located in a very open area, exposed to heavy wind and salt spray. It is recommended that the line be relocated to the road R-O-W. The new line should be built to heavy loading design standards. See Appendix C for a map showing this section. The cost of this work is estimated at $464,000. Rebuilding the line to heavy loading design standards in the existing R-O-W would not improve the access to the line. Further, to rebuild in the existing R-O-W would require outages to customers, portable generation and or work using “Hot Line” methods. This would make the cost of the rebuild comparable to the cost to relocating it to the Road R-O-W.

9
7.3 Cape Freels to Lumsden (2.4 km)
This section of the main feeder trunk is located along the road. Most of the section is located along the wooded area in Windmill Brook. This area is exposed to heavy wind and salt spray. It is recommended that structures built to heavy loading design standards be installed together with reconductoring the existing side phases from 1/0 AASC to 4/0 AASC. By replacing the side phases, the potential for contact between conductors is minimized. See Appendix D for a map of the area involved. The estimated cost of this upgrading work is $117,000. Since this is a radial feeder, using portable generation best facilitates rebuilding this section of the feeder with minimal interruption to customers. There are no alternative solutions for this section of the feeder.
7.4 Lumsden to Deadman’s Cove
This single-phase section of the feeder can be broken down to three smaller subsections: one that can be relocated to poles owned by Fortis Inc.; another that should be relocated to the edge of road R-O-W. and the last section should be rebuilt in its current location. Since this is a radial feeder, using portable generation facilitates rebuilding this section of the feeder.
7.4.1 Relocate 2.6 km to existing Fortis poles Fortis currently owns a pole line along this subsection of the road. Newfoundland Power’s existing line is located along the old road, and is inaccessible during the winter. It is recommended that a new line be built, attaching to the existing Fortis poles using heavy loading design standards and retire the existing line. Under the pole agreement, Newfoundland Power would purchase these poles from Fortis. See Appendix E for a map of the area involved. The cost of this work is estimated at $116,000. Rebuilding the line to heavy loading design standards in the existing location would not improve the access to the line. To rebuild the existing line would require outages to customers, portable generation and/or work using “Hot Line” methods. This would make the cost of the rebuild comparable to the cost to relocate.
10
7.4.2 Relocate 2.4 km to the existing road This subsection of line crosses very open areas and is subject to extreme salt spray and wind. The different components of this subsection are built away from the existing road and are difficult to work on. It is recommended that all components of this subsection that are located away from the road be relocated to the road ROW. All new structures would be built to heavy loading design standards using 4/0 primary conductor. See Appendix E for a map of the area involved. The estimated cost of this work is $97,000. Rebuilding the line to heavy loading construction in the existing location would not improve the access to the line. The cost of the rebuild in the existing location is comparable to the cost to relocate. 7.4.3 Rebuild 3.5 km along the existing road This subsection of line crosses very open areas and is subject to extreme salt spray and wind. The components of this subsection are built in the existing road ROW. It is recommended that all components of this subsection that are presently built in the road ROW be upgraded using heavy loading design standards. See Appendix E for a map of the area involved. The estimated cost of this work is $104,000. There are no alternative solutions for this subsection of the feeder.
7.5 Rebuild 30 poles/structures Templeman /Pound Cove Area
This section of line crosses very open areas and is subject to extreme salt spray and wind. The 30 poles and structures in the Templeman / Pound Cove area have been identified as having problems such as deteriorated poles, deteriorated crossarms, etc. It is recommended that the 30 new structures be built to heavy loading design standards using the existing 4/0 primary conductor. Work on this section would be completed using hot line methods. The estimated cost of this work is $82,000.

11
8. Conclusion
All of WES-02 feeder should be rated as requiring the heavy loading design standard. Extreme weather conditions result in major outages to customers supplied via this feeder. To address these circumstances, all future work should adopt the following installation standards:
• Extra creepage bushing transformers • 34 kV clamp top insulators, or insulators with equivalent insulation
levels • Standoff brackets on cutouts • Replace all CP 8080 and Two-Piece Insulators • Review conductor spacing between vertical and horizontal transition
poles to identify and correct any problem areas • Review pole span lengths and install mid-span poles if necessary • Design and build new lines for heavy loading construction
Deficiencies noted in the 2003 Distribution Feeder Inspection Report should be corrected. These are known problems that could result in unscheduled outages or unsafe conditions to our customers and employees if not corrected. The cost for correcting the deficiencies in the 2003 Distribution Feeder Inspection Report is estimated to be $119,000. The relocation of major sections of the trunk feeder along with the rebuilding of known problem areas using heavy loading design standards will result in a reduction in the number and duration of outages to customers along this feeder. This project should utilize portable generation to be located in Lumsden and Deadman’s Cove to minimize the impact to customers. The estimated total cost to complete the work indicated in sections 7.2, 7.3, 7.4 and 7.5 is $980,000. Overall, the $1,099,000 investment to improve areas of the feeder with known problems will result in an improved reliability for the customers. Due to the size of the project and nature of the work, it is proposed to complete all the work over a two-year period.
• 2004 – complete work in sections 7.2, 7.4.1 and address deficiencies as per the 2003 Distribution Feeder Inspection. $699,000
• 2005 – complete work in sections 7.3, 7.4.2, 7.4.3 and 7.5 - $400,000
Improved materials and design standards that meet the local environment conditions will improve the performance of this feeder.

Appendix A Standard Construction
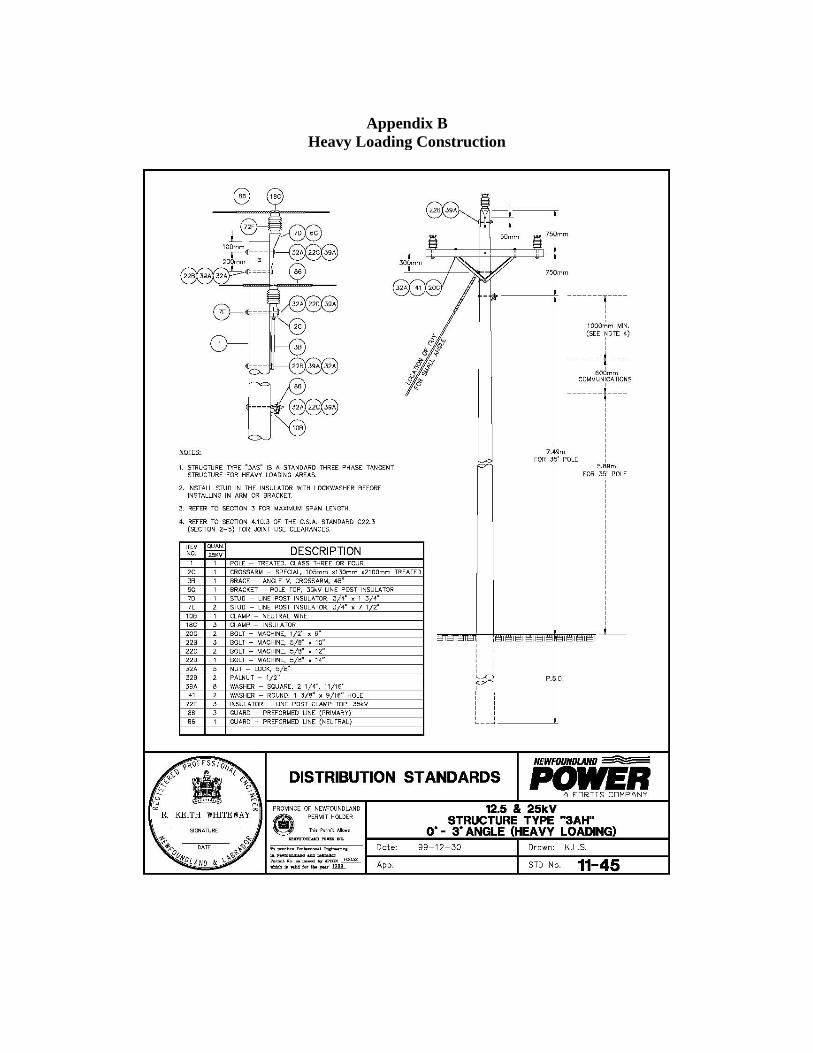
Appendix B
Heavy Loading Construction
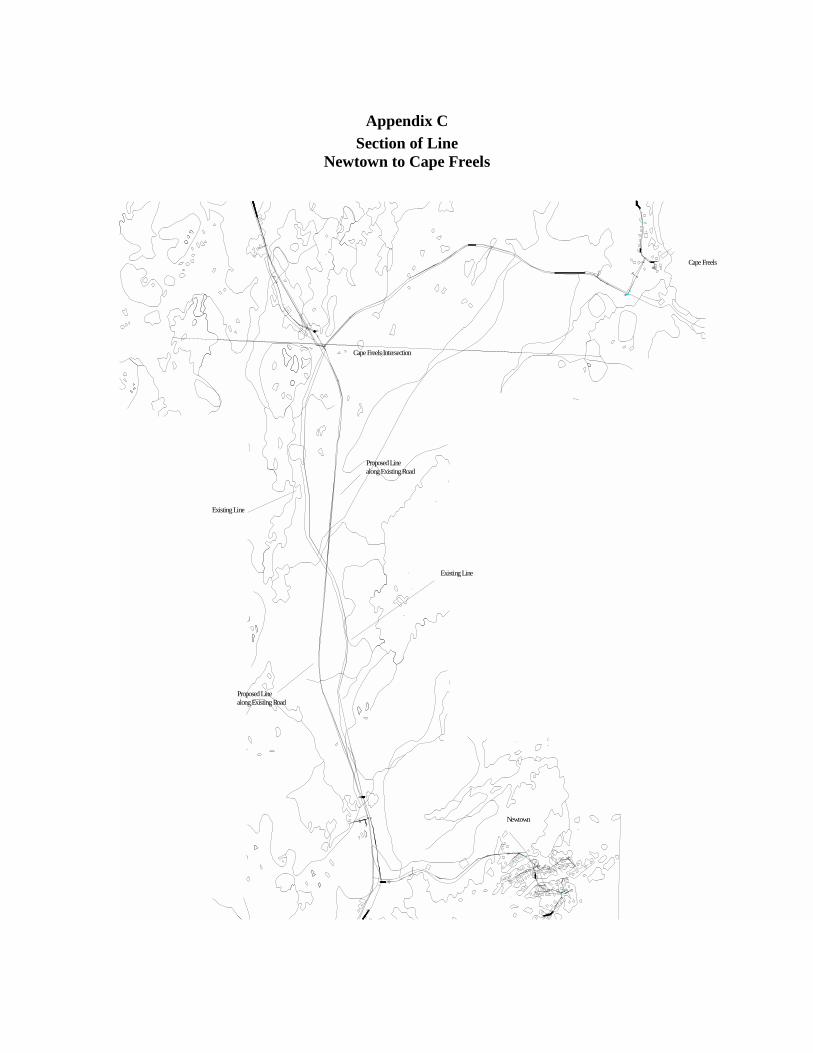
Appendix C Section of Line
Newtown to Cape Freels
Cape Freels
Existing Line
WES- 02- 56
WES- 02- 53WES- 02- 54
WES02- R1- DLW ES- 02- 56 WES02- R1- B P
Proposed Linealong Existing Road
Existing Line
Newtown
Cape Freels Intersection
Proposed Linealong Existing Road
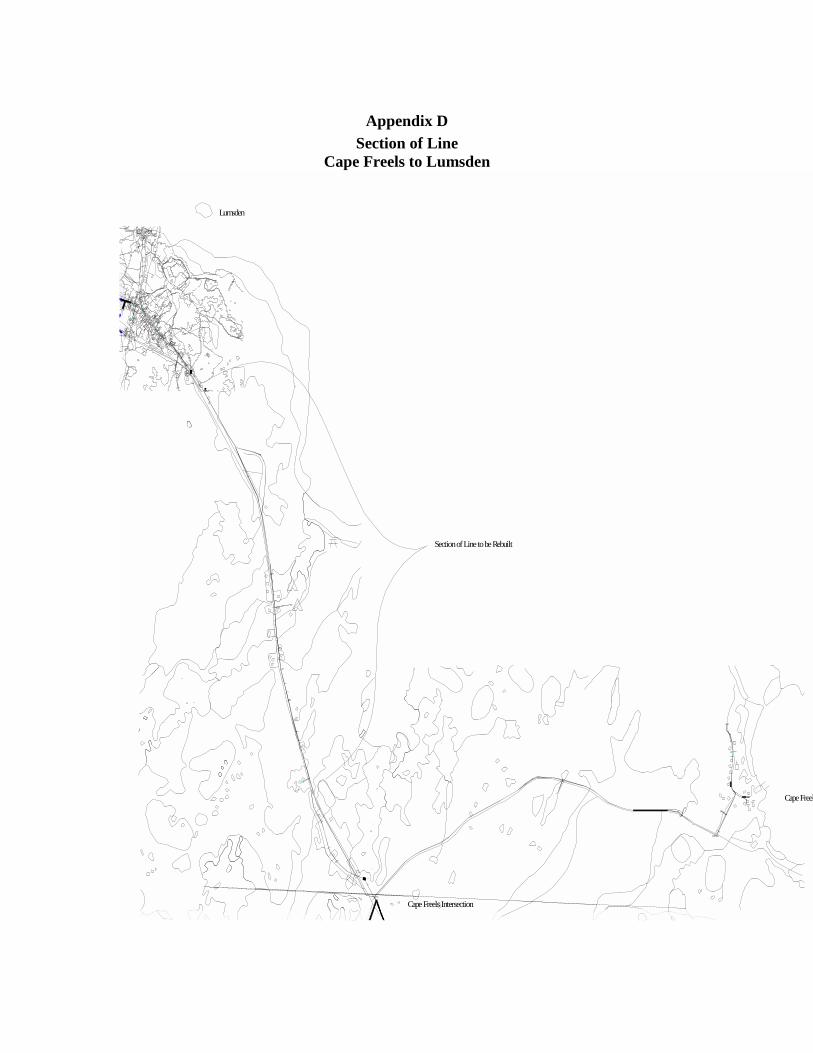
Appendix D Section of Line
Cape Freels to Lumsden
Cape Freels Intersection
Cape Freel
Lumsden
WES- 0 2 - 16 0
WES02-
VR2 - DS
WES- 0 2 - 15 7
WES-0 2-
VR2
WES- 0 2 - 1 5 8
WES02- VR2
- DLWES-
0 2-1 6 0
WES02 - VR2
- BP
Section of Line to be Rebuilt
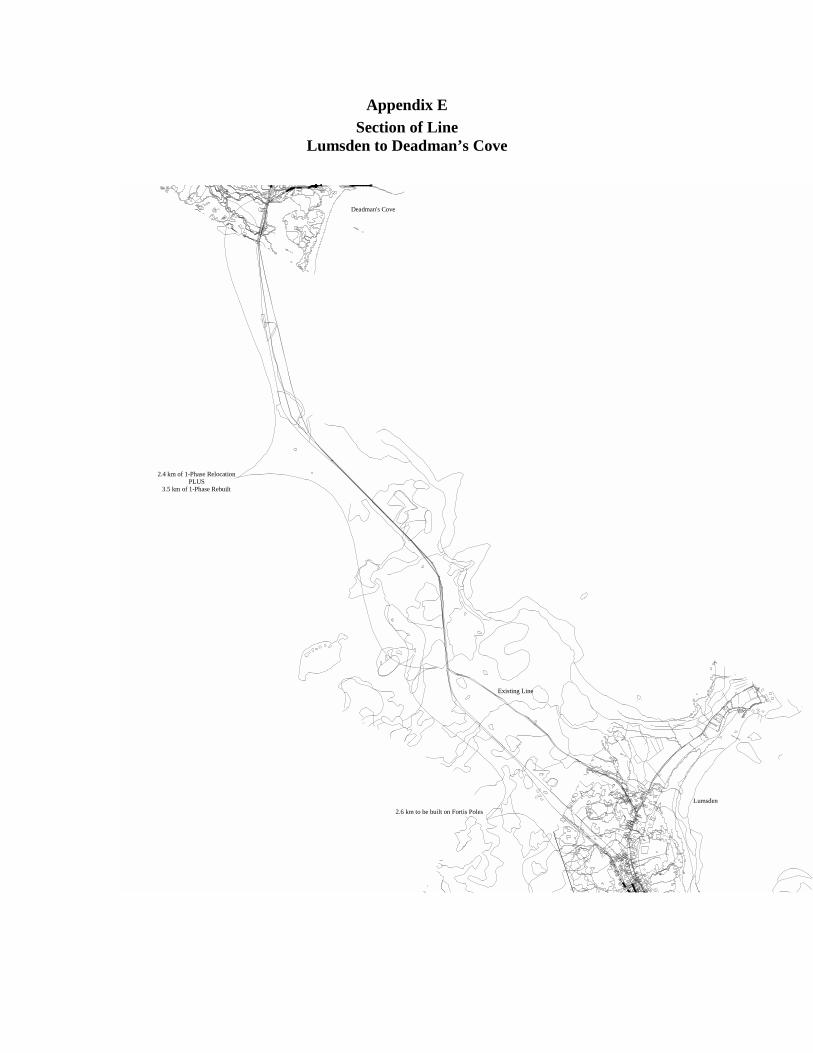
Appendix E Section of Line
Lumsden to Deadman’s Cove
2.4 km of 1-Phase RelocationPLUS
3.5 km of 1-Phase Rebuilt
2.6 km to be built on Fortis Poles
Existing Line
Lumsden
Deadman's Cove
Distribution Appendix 3
Attachment B
A Review of Reliability Bay Roberts-04 Feeder
June, 2003
i
Table of Contents
Page
Introduction .................................................................................................................... 1 Distribution Reliability (BRB-04 Feeder) .................................................................... 1 Proposed Upgrade .......................................................................................................... 3 Conclusions ..................................................................................................................... 4 Appendix A - Results of Ranking Feeders by Customer Minutes of Outage, SAIDI and SAIFI (taken from “2003 Corporate Distribution Reliability Review”)
1
1.0 Introduction Bay Roberts substation is located in the Conception Bay North town of Bay Roberts. This substation serves 3465 customers through 5 feeders. All five Bay Roberts feeders operate at a voltage of 12.5 kV. The Bay Roberts-04 feeder begins at the Bay Roberts substation and serves the southern portion of the Town of Bay Roberts (in the Country Road area). It extends along Bareneed Road through Port de Grave, terminating in Hibb’s Cove. The feeder services four fish plants, one of which is a very active plant in Port de Grave. BRB-04 is a relatively long feeder at 28.6 km that is exposed to severe weather along two relatively short sections, known as “The Beach” and “Happy Jack’s Hill”. The average age of structures, conductor and hardware on this feeder is 26 years. This report proposes a plan to improve the reliability of Bay Roberts-04 feeder (BRB-04). Reliability statistics for this feeder are presented and compared with those of other Newfoundland Power feeders. Initiatives for improving the reliability of this feeder are proposed and an action plan is recommended. 2.0 Distribution Reliability (BRB-04 Feeder) A report titled “2003 Corporate Distribution Reliability Review” (the “Report”), indicates the reliability of each Newfoundland Power feeder. The reliability indices used are average annual customer-minutes of outage, System Average Interruption Frequency Index (SAIFI), and System Average Interruption Duration Index (SAIDI). The reliability indices shown in Report are based only on unplanned distribution related outages. The Report identifies feeders that had poor distribution reliability over the 5-year period from 1998-2002 and ranks the 25 worst feeders according each of these measures. Feeders that have had substantial upgrading over the 5-year period were excluded from the rankings. A listing of the rankings is provided in Appendix A. The Report shows that customers served by BRB-04 feeder experienced an average annual SAIDI of 5.51 hours. This was nearly double the company average of 2.85 hours over the same period. BRB-04 ranked 19th in the list of worst feeders by SAIDI. The total customer minutes of outage experienced by BRB-04 customers was 327,000, almost triple the Company average of 116,000 customer minutes, and was the 17th worst performer amongst NP feeders using this measure. SAIFI for BRB-04 over this period was 1.52 interruptions/year, which is below the Company average of 1.81. The commentary in the Report draws the following conclusions regarding this feeder:

2
April 99 storm resulted in 1,166,220 customer minutes of outage, representing 71% of the average for the past five years. Outages during 2002 brought attention to two sections of the feeder that have experienced problems in the past and need to be upgraded. Upgrading these sections of the feeder are required and while being completed defective insulators and some conductor sags problems will be addressed. The following table lists by ‘component that failed’ the number of outages and customer minutes of outage on BRB-04 over a five-year period.
BRB – Outages by Component that Failed 1998 – 2002
Component that Failed Number of Outages Customer Minutes
Conductor 13 91,445 Conductor Hardware 3 323 Customer Equipment 1 10 Fuses 29 17,490 Insulators 5 204,061 Other 6 2,980 Pole 2 1,195,213 Pole Hardware 1 25 Transformers 21 120,899 Service Wires 45 2,006 Cutout / Switch 3 549 Total 129 1,635,001
In 1999, two outages caused by the failure of a number of poles along “The Beach” due to sleet can be seen to have caused a significant percentage (73%) of the total customer minutes of unscheduled distribution outages. However, a significant number of outages were also caused by conductor, insulator and transformer failures. In 2002, customers on BRB-04 experienced 268,456 customer minutes of unscheduled distribution outages. This resulted in a SAIDI of 4.42 hours and a SAIFI of 3.13 interruptions. The following table lists by ‘component that failed’ the number of outages and customer minutes of outage on BRB-04 in 2002.

3
BRB – Outages by Component that Failed
2002
Component that Failed Number of Outages Customer Minutes
Conductor 4 17,769 Conductor Hardware 0 0 Customer Equipment 0 0 Fuses 8 8,830 Insulators 2 127,261 Other 0 0 Pole 0 0 Pole Hardware 1 25 Transformers 8 113,943 Service Wires 10 358 Cutout / Switch 1 270 Total 34 268,456
3.0 Proposed Upgrade A review of this feeder has identified two specific areas of concern. “The Beach” and “Happy Jack’s Hill”. During the period 1998 – 2002, 66% of the outages affecting 50 or more customers occurred on these two sections of line. These incidents account for approximately 90% of all customer minutes of outages experienced during this period. Initiatives are proposed to address the two specific short sections of concern and the general performance of the feeder. The two specific sections, “The Beach” (approximately 1 km long) and “Happy Jack’s Hill” (approximately 1.5 km long), are to be addressed through relocating and rebuilding the line in these exposed and inaccessible areas to a higher design standard, and includes the relocation and rebuilding of approximately 25 spans of 3-phase line and re-sagging the conductor. The general performance of the feeder from the table above indicates failures of conductor, insulators and transformers. These issues will be addressed through the replacement of all two piece and CP 8080 insulators, PCB transformer phase-out, replacement of faulty cut-outs and removal of automatic sleeves. Upgrading these short sections will enhance reliability on the feeder as a whole at a relatively low cost. The cost of the proposed upgrade totals $120,000.

4
4.0 Conclusions The proposed reliability upgrade at Bay Roberts-04 feeder represents an opportunity to substantially improve the reliability of the poorly performing feeder by upgrading two sections and replacing substandard items on the remainder of the line. It is recommended that this project be included in the Company’s 2004 capital program.
5
APPENDIX “A”
Results of Ranking Feeders by Customer Minutes of Outage, SAIDI and SAIFI
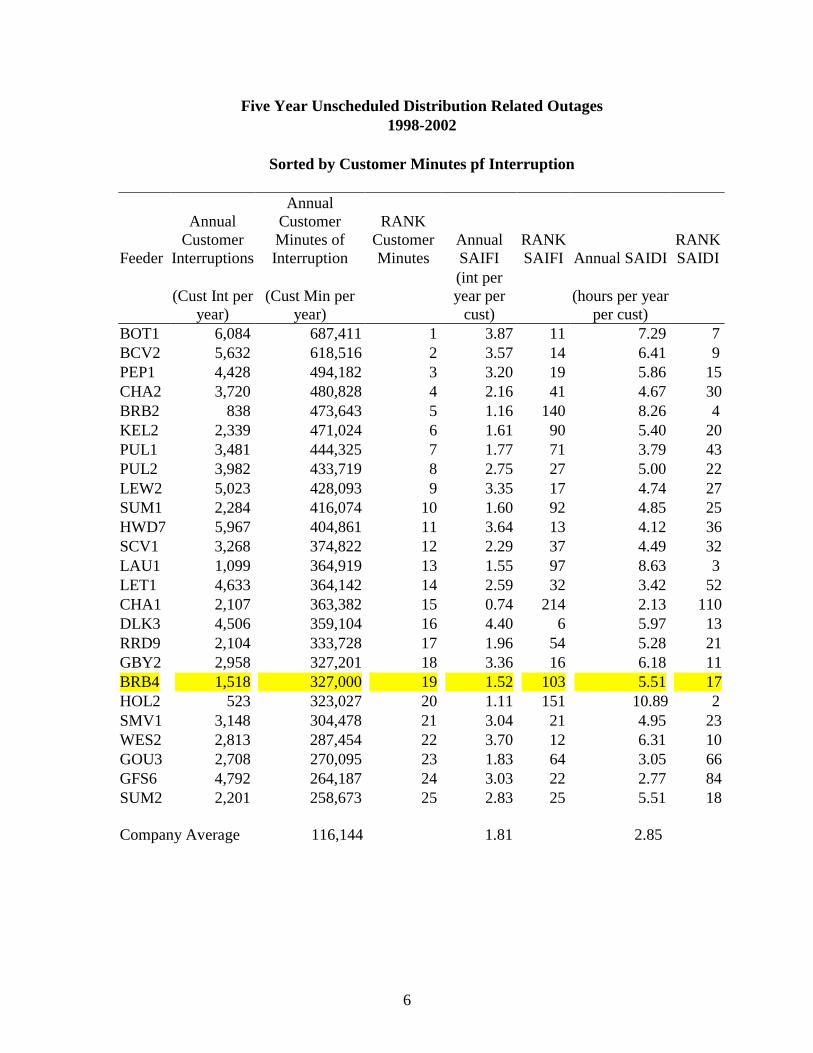
6
Five Year Unscheduled Distribution Related Outages 1998-2002
Sorted by Customer Minutes pf Interruption
Feeder
Annual Customer
Interruptions
Annual Customer Minutes of Interruption
RANK Customer Minutes
Annual SAIFI
RANK SAIFI Annual SAIDI
RANK SAIDI
(Cust Int per
year) (Cust Min per
year)
(int per year per
cust) (hours per year
per cust) BOT1 6,084 687,411 1 3.87 11 7.29 7 BCV2 5,632 618,516 2 3.57 14 6.41 9 PEP1 4,428 494,182 3 3.20 19 5.86 15 CHA2 3,720 480,828 4 2.16 41 4.67 30 BRB2 838 473,643 5 1.16 140 8.26 4 KEL2 2,339 471,024 6 1.61 90 5.40 20 PUL1 3,481 444,325 7 1.77 71 3.79 43 PUL2 3,982 433,719 8 2.75 27 5.00 22 LEW2 5,023 428,093 9 3.35 17 4.74 27 SUM1 2,284 416,074 10 1.60 92 4.85 25 HWD7 5,967 404,861 11 3.64 13 4.12 36 SCV1 3,268 374,822 12 2.29 37 4.49 32 LAU1 1,099 364,919 13 1.55 97 8.63 3 LET1 4,633 364,142 14 2.59 32 3.42 52CHA1 2,107 363,382 15 0.74 214 2.13 110 DLK3 4,506 359,104 16 4.40 6 5.97 13 RRD9 2,104 333,728 17 1.96 54 5.28 21 GBY2 2,958 327,201 18 3.36 16 6.18 11 BRB4 1,518 327,000 19 1.52 103 5.51 17 HOL2 523 323,027 20 1.11 151 10.89 2 SMV1 3,148 304,478 21 3.04 21 4.95 23 WES2 2,813 287,454 22 3.70 12 6.31 10 GOU3 2,708 270,095 23 1.83 64 3.05 66 GFS6 4,792 264,187 24 3.03 22 2.77 84 SUM2 2,201 258,673 25 2.83 25 5.51 18 Company Average 116,144 1.81 2.85

7
Five Year Unscheduled Distribution Related Outages 1998-2002
Sorted by SAIFI
Feeder
Annual Customer
Interruptions
Annual Customer Minutes of Interruption
RANK Customer Minutes
Annual SAIFI
RANK SAIFI Annual SAIDI
RANK SAIDI
(Cust Int per
year) (Cust Min per
year)
(int per year per
cust) (hours per year
per cust) STX1 5,442 153,288 59 5.87 1 2.72 85 STG2 2,305 104,835 90 5.10 2 3.87 42 STG1 1,413 55,774 140 4.69 3 3.07 64 LGL2 3,303 255,771 26 4.67 4 6.04 12 BHD1 5,051 120,673 81 4.60 5 1.96 120 DLK3 4,506 359,104 16 4.40 6 5.97 13 HUM9 1,854 102,515 93 4.30 7 3.97 40 LGL1 2,149 182,189 46 4.29 8 5.74 16 ABC1 2,949 128,408 74 4.14 9 2.97 74 GBS2 1,764 78,456 111 4.07 10 3.11 62 BOT1 6,084 687,411 1 3.87 11 7.29 7 WES2 2,813 287,454 22 3.70 12 6.31 10 HWD7 5,967 404,861 11 3.64 13 4.12 36 BCV2 5,632 618,516 2 3.57 14 6.41 9 DLK1 3,074 61,541 129 3.40 15 1.11 175 GBY2 2,958 327,201 18 3.36 16 6.18 11 LEW2 5,023 428,093 9 3.35 17 4.74 27 CAB1 3,198 235,469 30 3.27 18 4.05 39 PEP1 4,428 494,182 3 3.20 19 5.86 15 GRH3 2,493 148,278 63 3.07 20 3.05 65 SMV1 3,148 304,478 21 3.04 21 4.95 23 GFS6 4,792 264,187 24 3.03 22 2.77 84 TRP1 2,092 116,311 85 3.00 23 2.84 81 GBS1 1,798 93,875 98 2.93 24 2.69 87 SUM2 2,201 258,673 25 2.83 25 5.51 18 Company Average 116,144 1.81 2.85
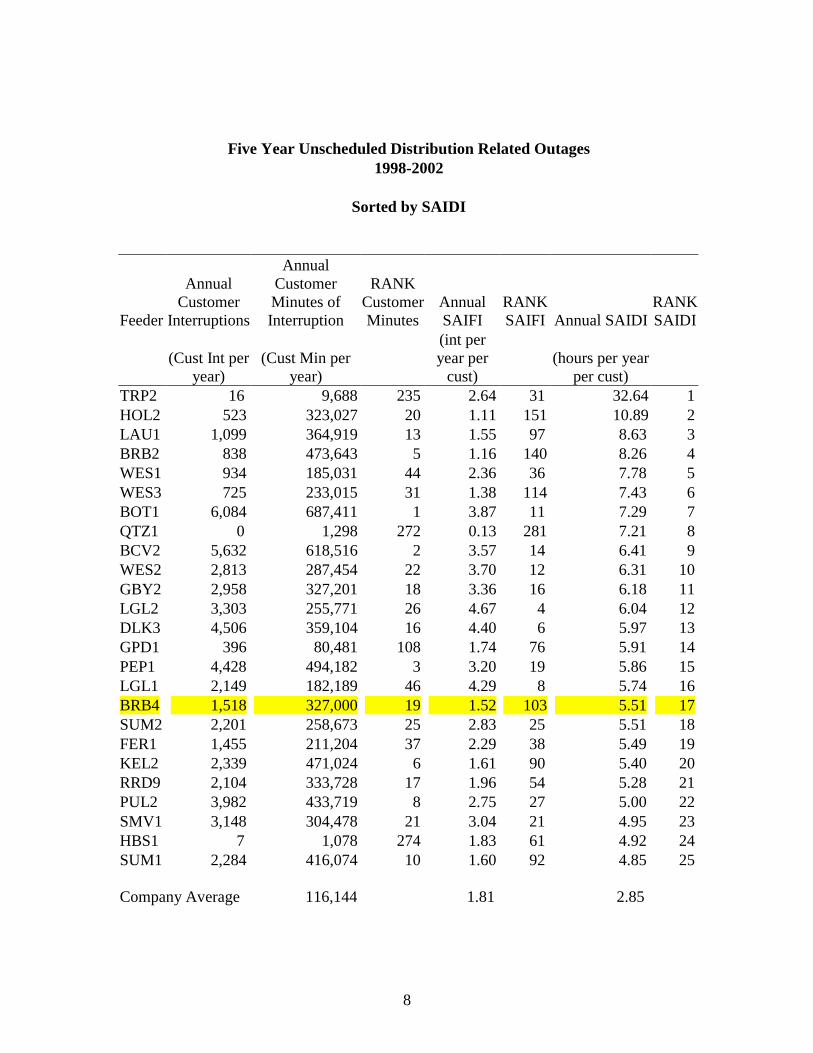
8
Five Year Unscheduled Distribution Related Outages 1998-2002
Sorted by SAIDI
Feeder
Annual Customer
Interruptions
Annual Customer Minutes of Interruption
RANK Customer Minutes
Annual SAIFI
RANK SAIFI Annual SAIDI
RANK SAIDI
(Cust Int per
year) (Cust Min per
year)
(int per year per
cust) (hours per year
per cust) TRP2 16 9,688 235 2.64 31 32.64 1 HOL2 523 323,027 20 1.11 151 10.89 2 LAU1 1,099 364,919 13 1.55 97 8.63 3 BRB2 838 473,643 5 1.16 140 8.26 4 WES1 934 185,031 44 2.36 36 7.78 5 WES3 725 233,015 31 1.38 114 7.43 6 BOT1 6,084 687,411 1 3.87 11 7.29 7 QTZ1 0 1,298 272 0.13 281 7.21 8 BCV2 5,632 618,516 2 3.57 14 6.41 9 WES2 2,813 287,454 22 3.70 12 6.31 10 GBY2 2,958 327,201 18 3.36 16 6.18 11 LGL2 3,303 255,771 26 4.67 4 6.04 12 DLK3 4,506 359,104 16 4.40 6 5.97 13 GPD1 396 80,481 108 1.74 76 5.91 14 PEP1 4,428 494,182 3 3.20 19 5.86 15 LGL1 2,149 182,189 46 4.29 8 5.74 16 BRB4 1,518 327,000 19 1.52 103 5.51 17 SUM2 2,201 258,673 25 2.83 25 5.51 18 FER1 1,455 211,204 37 2.29 38 5.49 19 KEL2 2,339 471,024 6 1.61 90 5.40 20 RRD9 2,104 333,728 17 1.96 54 5.28 21 PUL2 3,982 433,719 8 2.75 27 5.00 22 SMV1 3,148 304,478 21 3.04 21 4.95 23 HBS1 7 1,078 274 1.83 61 4.92 24 SUM1 2,284 416,074 10 1.60 92 4.85 25 Company Average 116,144 1.81 2.85

9
Distribution Appendix 3
Attachment C
Pulpit Rock Substation Loading and Reliability
June, 2003
i
Table of Contents
Page
Introduction .................................................................................................................... 1 Distribution Reliability .................................................................................................. 1 Load Growth................................................................................................................... 2 Alternatives ..................................................................................................................... 4 Discussion........................................................................................................................ 5 Recommendations .......................................................................................................... 5
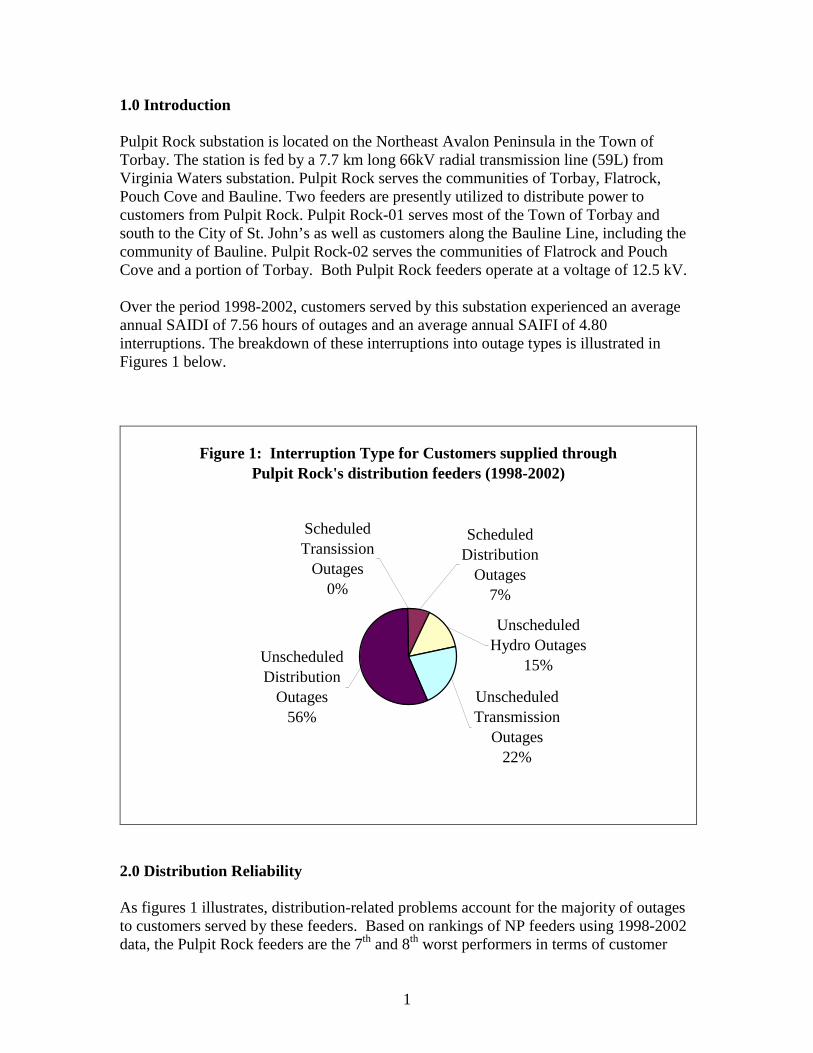
1
1.0 Introduction Pulpit Rock substation is located on the Northeast Avalon Peninsula in the Town of Torbay. The station is fed by a 7.7 km long 66kV radial transmission line (59L) from Virginia Waters substation. Pulpit Rock serves the communities of Torbay, Flatrock, Pouch Cove and Bauline. Two feeders are presently utilized to distribute power to customers from Pulpit Rock. Pulpit Rock-01 serves most of the Town of Torbay and south to the City of St. John’s as well as customers along the Bauline Line, including the community of Bauline. Pulpit Rock-02 serves the communities of Flatrock and Pouch Cove and a portion of Torbay. Both Pulpit Rock feeders operate at a voltage of 12.5 kV. Over the period 1998-2002, customers served by this substation experienced an average annual SAIDI of 7.56 hours of outages and an average annual SAIFI of 4.80 interruptions. The breakdown of these interruptions into outage types is illustrated in Figures 1 below.
Figure 1: Interruption Type for Customers supplied through Pulpit Rock's distribution feeders (1998-2002)
Unscheduled Distribution
Outages56%
Unscheduled Transmission
Outages22%
Unscheduled Hydro Outages
15%
Scheduled Distribution
Outages7%
Scheduled Transission
Outages0%
2.0 Distribution Reliability As figures 1 illustrates, distribution-related problems account for the majority of outages to customers served by these feeders. Based on rankings of NP feeders using 1998-2002 data, the Pulpit Rock feeders are the 7th and 8th worst performers in terms of customer
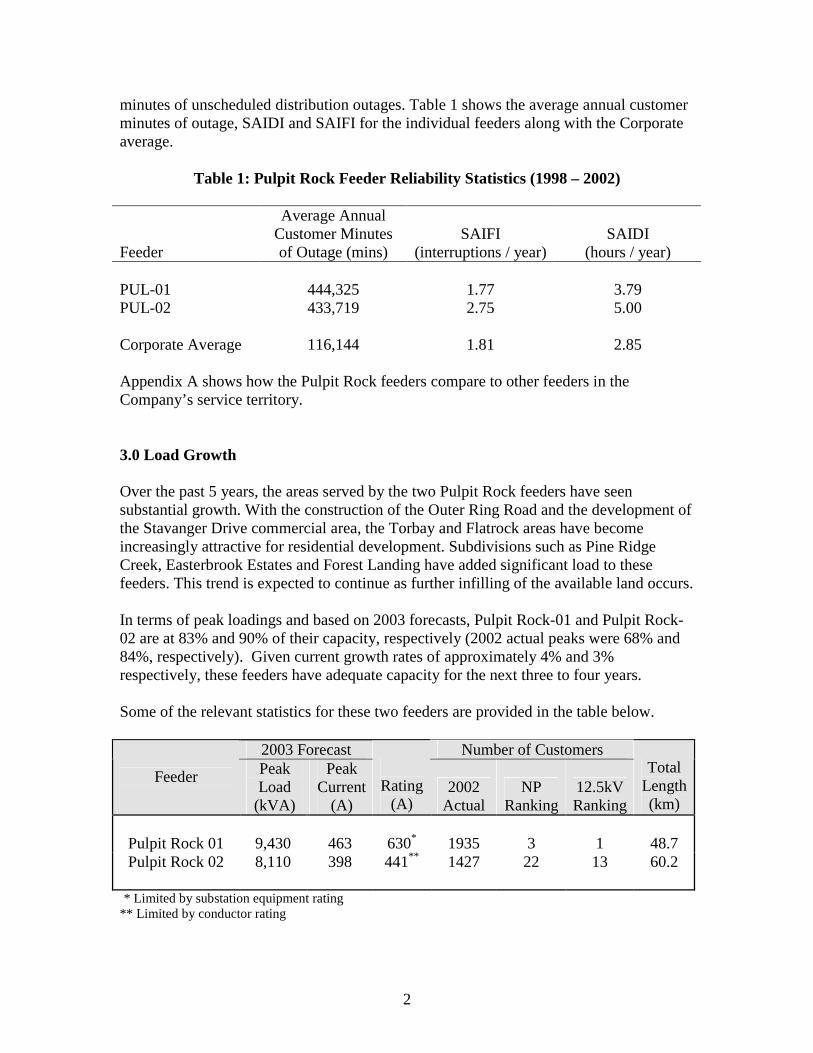
2
minutes of unscheduled distribution outages. Table 1 shows the average annual customer minutes of outage, SAIDI and SAIFI for the individual feeders along with the Corporate average.
Table 1: Pulpit Rock Feeder Reliability Statistics (1998 – 2002)
Feeder
Average Annual Customer Minutes of Outage (mins)
SAIFI (interruptions / year)
SAIDI (hours / year)
PUL-01
444,325
1.77
3.79
PUL-02 433,719 2.75 5.00 Corporate Average
116,144
1.81
2.85
Appendix A shows how the Pulpit Rock feeders compare to other feeders in the Company’s service territory. 3.0 Load Growth Over the past 5 years, the areas served by the two Pulpit Rock feeders have seen substantial growth. With the construction of the Outer Ring Road and the development of the Stavanger Drive commercial area, the Torbay and Flatrock areas have become increasingly attractive for residential development. Subdivisions such as Pine Ridge Creek, Easterbrook Estates and Forest Landing have added significant load to these feeders. This trend is expected to continue as further infilling of the available land occurs. In terms of peak loadings and based on 2003 forecasts, Pulpit Rock-01 and Pulpit Rock-02 are at 83% and 90% of their capacity, respectively (2002 actual peaks were 68% and 84%, respectively). Given current growth rates of approximately 4% and 3% respectively, these feeders have adequate capacity for the next three to four years. Some of the relevant statistics for these two feeders are provided in the table below.
2003 Forecast Number of Customers
Feeder Peak Load
(kVA)
Peak Current
(A)
Rating
(A) 2002
Actual NP
Ranking 12.5kV Ranking
Total Length (km)
Pulpit Rock 01
9,430
463
630*
1935
3
1
48.7
Pulpit Rock 02
8,110
398
441**
1427
22
13
60.2
* Limited by substation equipment rating ** Limited by conductor rating

3
This table shows how the number of customers supplied by the Pulpit Rock feeders rank in comparison to the other, approximately 300, Company feeders. The table indicates there are only two feeders that supply more customers than PUL-01 and that PUL-01 supplies more customers than any other feeder that operates at a voltage of 12.5 kV. 3.1 Maintenance and Backup Implications Taking equipment out of service for either scheduled maintenance or for emergency repairs requires the Company to ensure some level of backup is available to minimize outages to customers. The ongoing load growth at Pulpit Rock Substation is now restricting the Company’s ability to provide backup for maintenance or repair of reclosers at the Substation at certain times of the year. The combined peak load of PUL-01 and PUL-02 is forecast to be 860 Amps in 2003. This exceeds the emergency rating of either the PUL-01 recloser (850 Amps) or the PUL-02 recloser (800 Amps). As a result, the backup for recloser failure requires offloading customers from PUL-01 onto the Virginia Waters substation. However, restoring load near peak load conditions involves supplying load that temporarily exceeds normal peak load levels. This condition is referred to as cold load pick-up. This extra load will cause the total combined load to be well above 860 Amps, making the restoration of power difficult in the event of a failure of a recloser. 3.2 Reliability Implications Growth on the Pulpit Rock feeders is also a contributing factor to the inferior reliability performance of the Pulpit Rock feeders. The longer a feeder grows in terms of total length and number of customers, the greater the exposure of all customers on the feeder to incidents or faults that interrupt the entire feeder. The correlation between the number of power interruptions and length of feeders is very apparent statistically. This is illustrated graphically in figure 3 below. As noted in section 2.0, the performance of the two feeders supplied from the Pulpit Rock Substation ranks poorly against other feeders within the Company’s system. Continued growth and consequent increase in feeder length will contribute to a worsening of the reliability along the feeders. A review of the condition of the feeders and a review of the outage statistics has not identified any upgrading that will significantly improve the performance of these feeders.

4
Figure 3: SAIDI vs Feeder Length
0
50
100
150
200
250
- 2.0 4.0 6.0 8.0 10.0 12.0 14.0 16.0 18.0 20.0
SAIDI (hours/yr)
Tota
l Fee
der L
engt
h (k
m)
Trend Line
4.0 Alternatives To address the concerns associated with load growth, feeder backup, and line length, three alternatives were considered. These are:
1. Construct a third feeder that will supply a portion of the load currently being supplied by PUL-01 and PUL-02.
2. Construct a new substation and associated feeders to serve a subset of the existing Pulpit Rock service area.
3. Reconductor Pulpit Rock-02 feeder and replace the two existing Pulpit Rock feeder reclosers with breakers to increase capacity.
The first alternative will reduce the load on the existing feeders, creating a significant increase in the ability of the Pulpit Rock feeders to meet future load growth. Splitting the load between three feeders, instead of two, improves the backup capacity available for maintenance and repair of equipment. It will also improve the overall capacity of the distribution system by approximately 50%. The reconfiguration of the feeders will also decrease the length of each feeder and consequently improve the reliability of the supply to customers. The overall cost estimate for this option is $224,000. A schematic showing the modification to the Pulpit Rock feeders is shown in Appendix B. The second option requires constructing a new substation and splitting PUL-02 into two feeders. One of the new feeders would be capable of offloading a portion of PUL-01 and consequently increase the capacity of all the existing feeders. This option however, was not considered in detail as the cost of a new substation and associated transmission

5
equipment would be in excess of $2 million, substantially more than the cost of option 1 or option 3. A third option is to increase the capacity of PUL-02 by replacing the conductor along a major portion of the feeder (19 km), and replacing the reclosers at the substation with breakers. This option will nearly double the capacity of the existing distribution system and alleviate the concerns with backup. However, the option will not deal with feeder line length and consequently will not have as positive an impact on reliability as will option 1. The overall estimate for this option is $680,000. 5.0 Discussion By comparing the alternatives the following observations can be made:
• Option 2 requires a new substation and is significantly more expensive than the other two alternatives. This option can be eliminated simply on the basis of cost.
• Both Option 1 and 3 will significantly increase the capacity of the existing
distribution facilities. This will address the overloads that are projected within the next five years and will alleviate concerns over equipment backup. While option 3 provides the greater capacity increase, Option 1 should provide adequate capacity well into the future. Given the current growth rate of about 3.5 percent per year, it will be 15 to 20 years before further capacity additions are required to the distribution system.
• Option 1 will reduce the length of the Pulpit Rock distribution feeders and
consequently improve the reliability
• Option 3 is more expensive than option 1 and will not reduce the length of either of the Pulpit Rock Feeders. Consequently, option 3 would not make a significant improvement to the reliability of the existing system.
6.0 Recommendations Based on the above considerations, it is recommended that a third feeder be constructed out of Pulpit Rock substation in 2004 to improve reliability and provide greater capacity on the distribution system to handle growth in the area served.

APPENDIX “A”
Results of Ranking Feeders by Customer Minutes of Outage, SAIDI and SAIFI

Five Year Average Unscheduled Distribution Related Outages 1998-2002
Sorted by Customer Minutes of Interruptions
Feeder
Annual Customer
Interruptions
Annual Customer Minutes of Interruption
RANK Customer Minutes
Annual SAIFI
RANK SAIFI Annual SAIDI
RANK SAIDI
(Cust Int per
year) (Cust Min per
year)
(int per year per
cust) (hours per year
per cust) BOT1 6,084 687,411 1 3.87 11 7.29 7 BCV2 5,632 618,516 2 3.57 14 6.41 9 PEP1 4,428 494,182 3 3.20 19 5.86 15 CHA2 3,720 480,828 4 2.16 41 4.67 30 BRB2 838 473,643 5 1.16 140 8.26 4 KEL2 2,339 471,024 6 1.61 90 5.40 20 PUL1 3,481 444,325 7 1.77 71 3.79 43 PUL2 3,982 433,719 8 2.75 27 5.00 22 LEW2 5,023 428,093 9 3.35 17 4.74 27 SUM1 2,284 416,074 10 1.60 92 4.85 25 HWD7 5,967 404,861 11 3.64 13 4.12 36 SCV1 3,268 374,822 12 2.29 37 4.49 32 LAU1 1,099 364,919 13 1.55 97 8.63 3 LET1 4,633 364,142 14 2.59 32 3.42 52 CHA1 2,107 363,382 15 0.74 214 2.13 110 DLK3 4,506 359,104 16 4.40 6 5.97 13 RRD9 2,104 333,728 17 1.96 54 5.28 21 GBY2 2,958 327,201 18 3.36 16 6.18 11 BRB4 1,518 327,000 19 1.52 103 5.51 17 HOL2 523 323,027 20 1.11 151 10.89 2 SMV1 3,148 304,478 21 3.04 21 4.95 23 WES2 2,813 287,454 22 3.70 12 6.31 10 GOU3 2,708 270,095 23 1.83 64 3.05 66 GFS6 4,792 264,187 24 3.03 22 2.77 84 SUM2 2,201 258,673 25 2.83 25 5.51 18 Company Average 116,144 1.81 2.85

Five Year Average Unscheduled Distribution Related Outages 1998-2002
Sorted by SAIFI
Feeder
Annual Customer
Interruptions
Annual Customer Minutes of Interruption
RANK Customer Minutes
Annual SAIFI
RANK SAIFI Annual SAIDI
RANK SAIDI
(Cust Int per
year) (Cust Min per
year)
(int per year per
cust) (hours per year
per cust) STX1 5,442 153,288 59 5.87 1 2.72 85 STG2 2,305 104,835 90 5.10 2 3.87 42 STG1 1,413 55,774 140 4.69 3 3.07 64 LGL2 3,303 255,771 26 4.67 4 6.04 12 BHD1 5,051 120,673 81 4.60 5 1.96 120 DLK3 4,506 359,104 16 4.40 6 5.97 13 HUM9 1,854 102,515 93 4.30 7 3.97 40 LGL1 2,149 182,189 46 4.29 8 5.74 16 ABC1 2,949 128,408 74 4.14 9 2.97 74 GBS2 1,764 78,456 111 4.07 10 3.11 62 BOT1 6,084 687,411 1 3.87 11 7.29 7 WES2 2,813 287,454 22 3.70 12 6.31 10 HWD7 5,967 404,861 11 3.64 13 4.12 36 BCV2 5,632 618,516 2 3.57 14 6.41 9 DLK1 3,074 61,541 129 3.40 15 1.11 175 GBY2 2,958 327,201 18 3.36 16 6.18 11 LEW2 5,023 428,093 9 3.35 17 4.74 27 CAB1 3,198 235,469 30 3.27 18 4.05 39 PEP1 4,428 494,182 3 3.20 19 5.86 15 GRH3 2,493 148,278 63 3.07 20 3.05 65 SMV1 3,148 304,478 21 3.04 21 4.95 23 GFS6 4,792 264,187 24 3.03 22 2.77 84 TRP1 2,092 116,311 85 3.00 23 2.84 81 GBS1 1,798 93,875 98 2.93 24 2.69 87 SUM2 2,201 258,673 25 2.83 25 5.51 18 Company Average 116,144 1.81 2.85
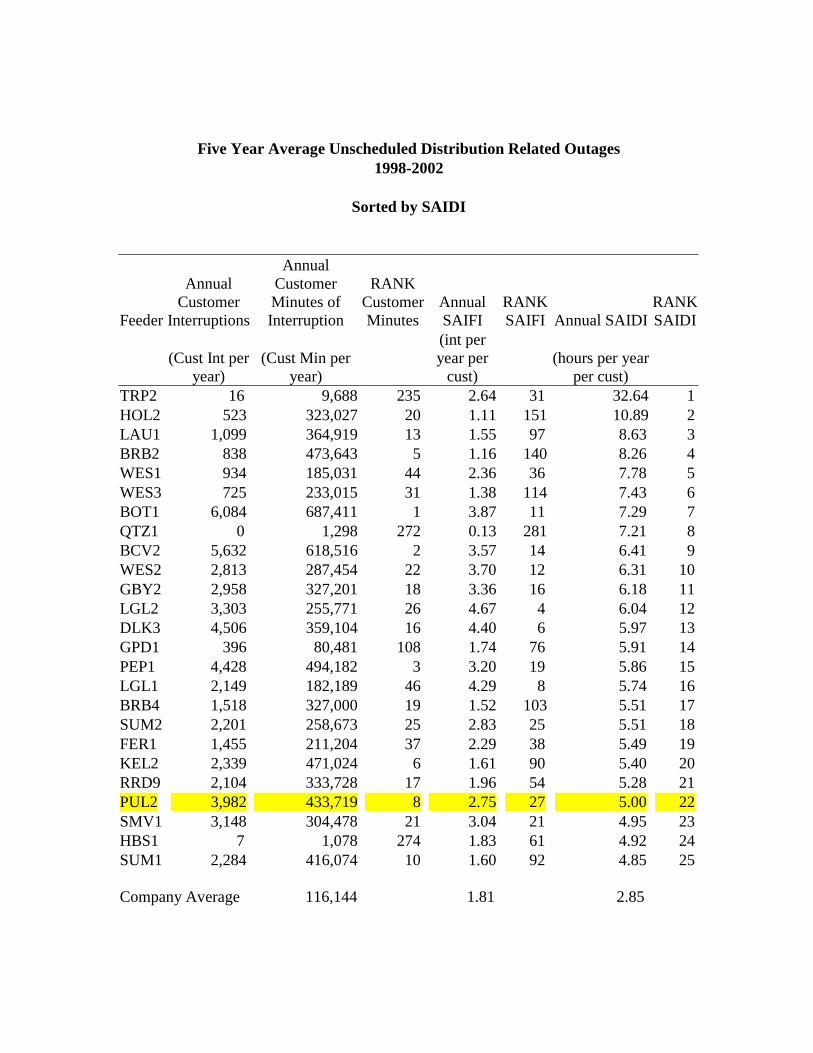
Five Year Average Unscheduled Distribution Related Outages 1998-2002
Sorted by SAIDI
Feeder
Annual Customer
Interruptions
Annual Customer Minutes of Interruption
RANK Customer Minutes
Annual SAIFI
RANK SAIFI Annual SAIDI
RANK SAIDI
(Cust Int per
year) (Cust Min per
year)
(int per year per
cust) (hours per year
per cust) TRP2 16 9,688 235 2.64 31 32.64 1 HOL2 523 323,027 20 1.11 151 10.89 2 LAU1 1,099 364,919 13 1.55 97 8.63 3 BRB2 838 473,643 5 1.16 140 8.26 4 WES1 934 185,031 44 2.36 36 7.78 5 WES3 725 233,015 31 1.38 114 7.43 6 BOT1 6,084 687,411 1 3.87 11 7.29 7 QTZ1 0 1,298 272 0.13 281 7.21 8 BCV2 5,632 618,516 2 3.57 14 6.41 9 WES2 2,813 287,454 22 3.70 12 6.31 10 GBY2 2,958 327,201 18 3.36 16 6.18 11 LGL2 3,303 255,771 26 4.67 4 6.04 12 DLK3 4,506 359,104 16 4.40 6 5.97 13 GPD1 396 80,481 108 1.74 76 5.91 14 PEP1 4,428 494,182 3 3.20 19 5.86 15 LGL1 2,149 182,189 46 4.29 8 5.74 16 BRB4 1,518 327,000 19 1.52 103 5.51 17 SUM2 2,201 258,673 25 2.83 25 5.51 18 FER1 1,455 211,204 37 2.29 38 5.49 19 KEL2 2,339 471,024 6 1.61 90 5.40 20 RRD9 2,104 333,728 17 1.96 54 5.28 21 PUL2 3,982 433,719 8 2.75 27 5.00 22 SMV1 3,148 304,478 21 3.04 21 4.95 23 HBS1 7 1,078 274 1.83 61 4.92 24 SUM1 2,284 416,074 10 1.60 92 4.85 25 Company Average 116,144 1.81 2.85

APPENDIX “B”
Proposed Pulpit Rock Feeder Modifications

Existing PUL-01
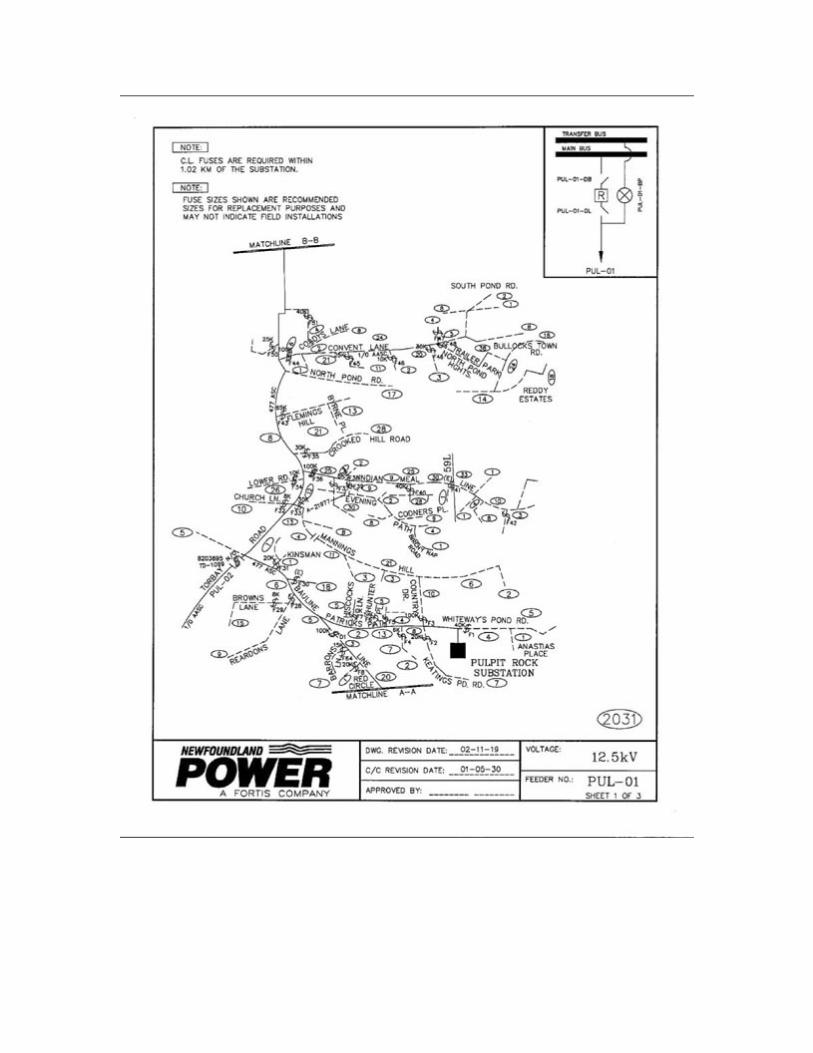
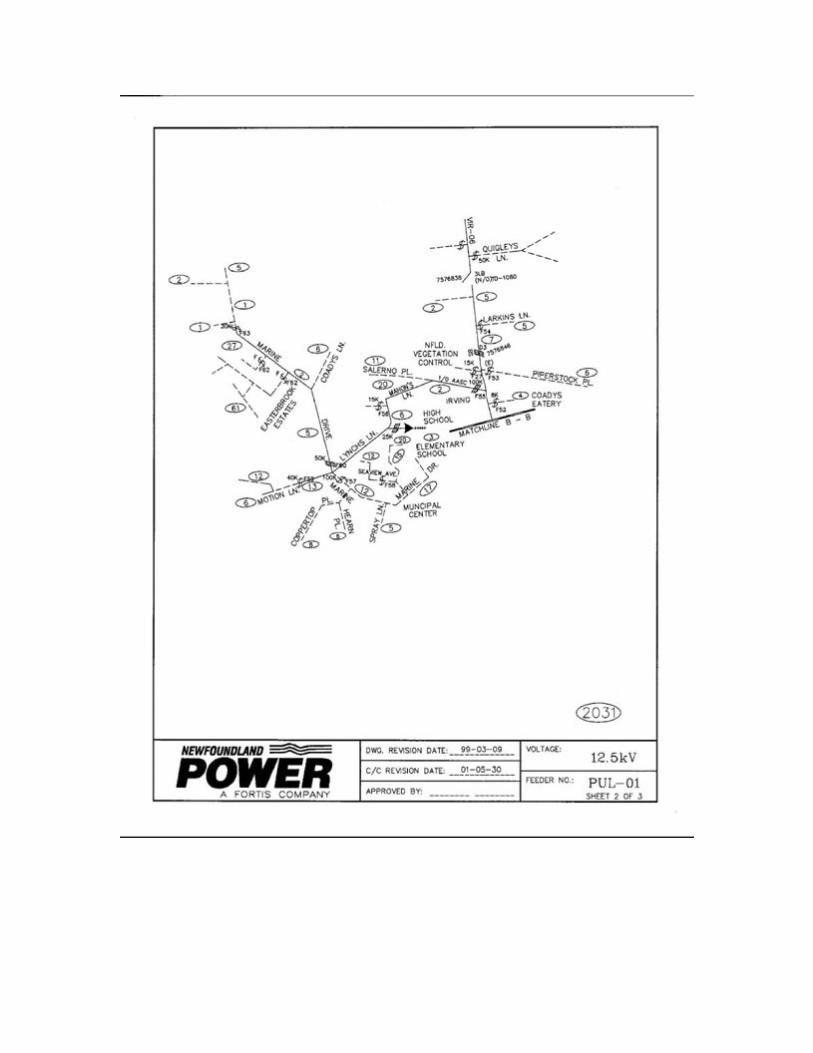

Existing PUL-02


Proposed PUL-01


Proposed PUL-02


Proposed PUL-03
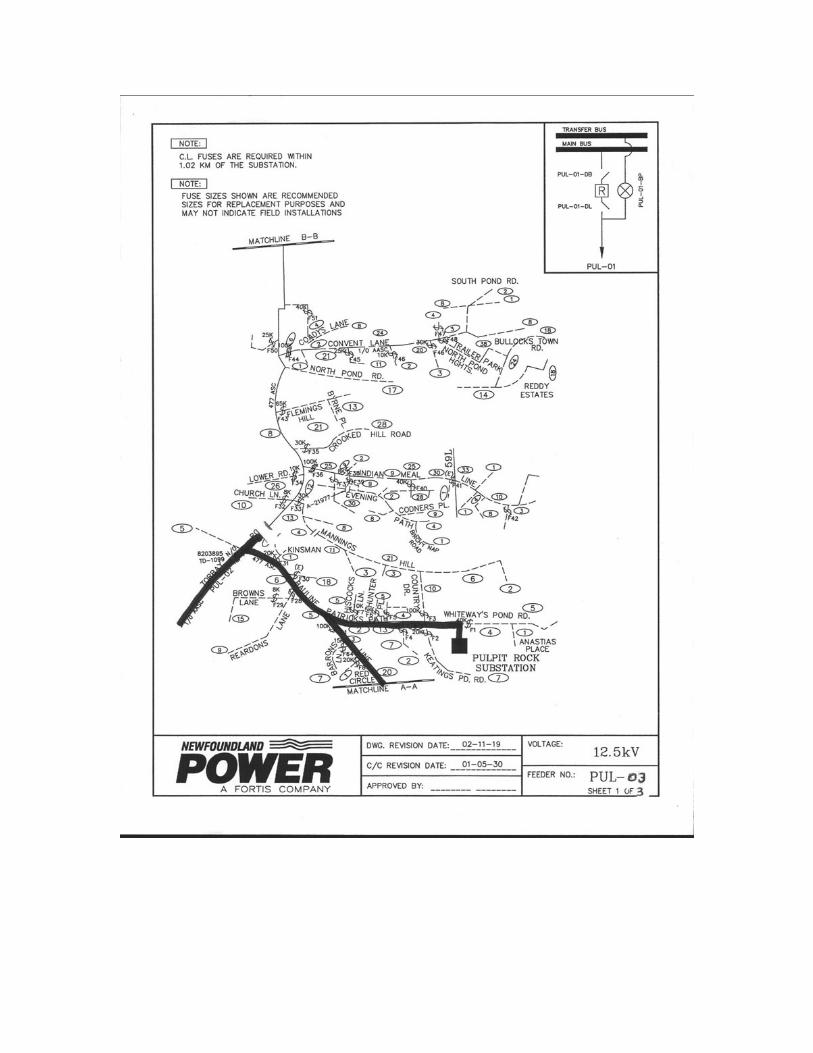
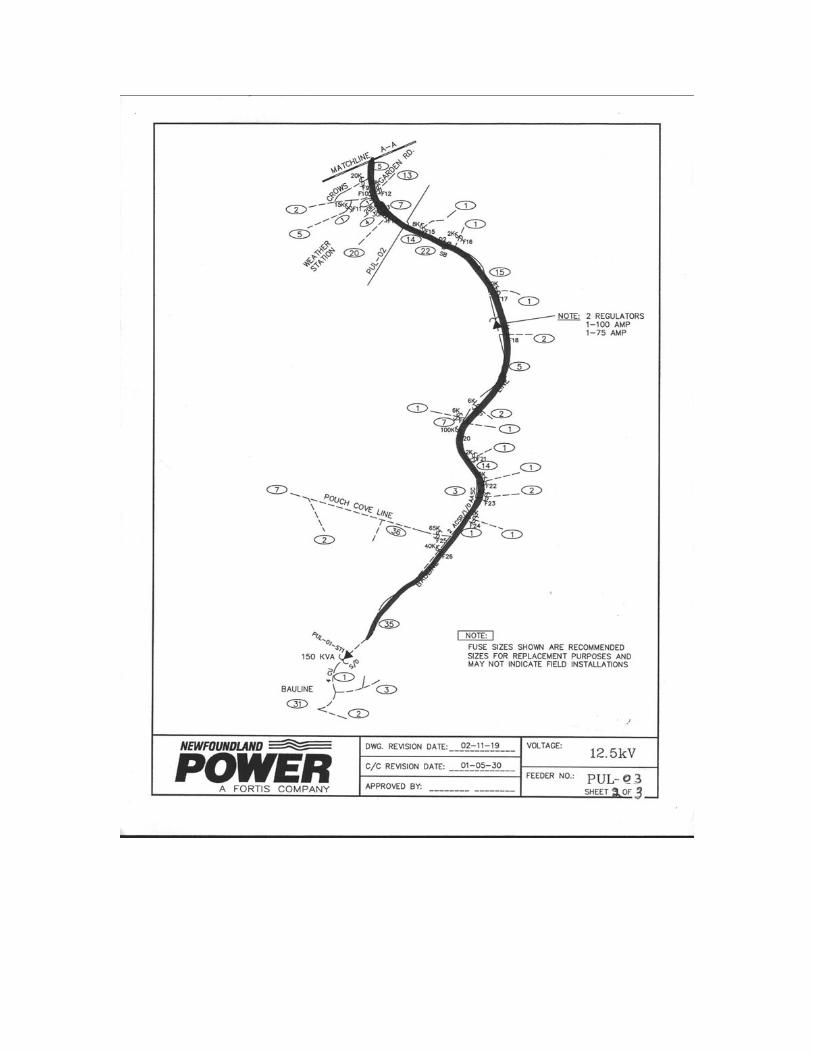

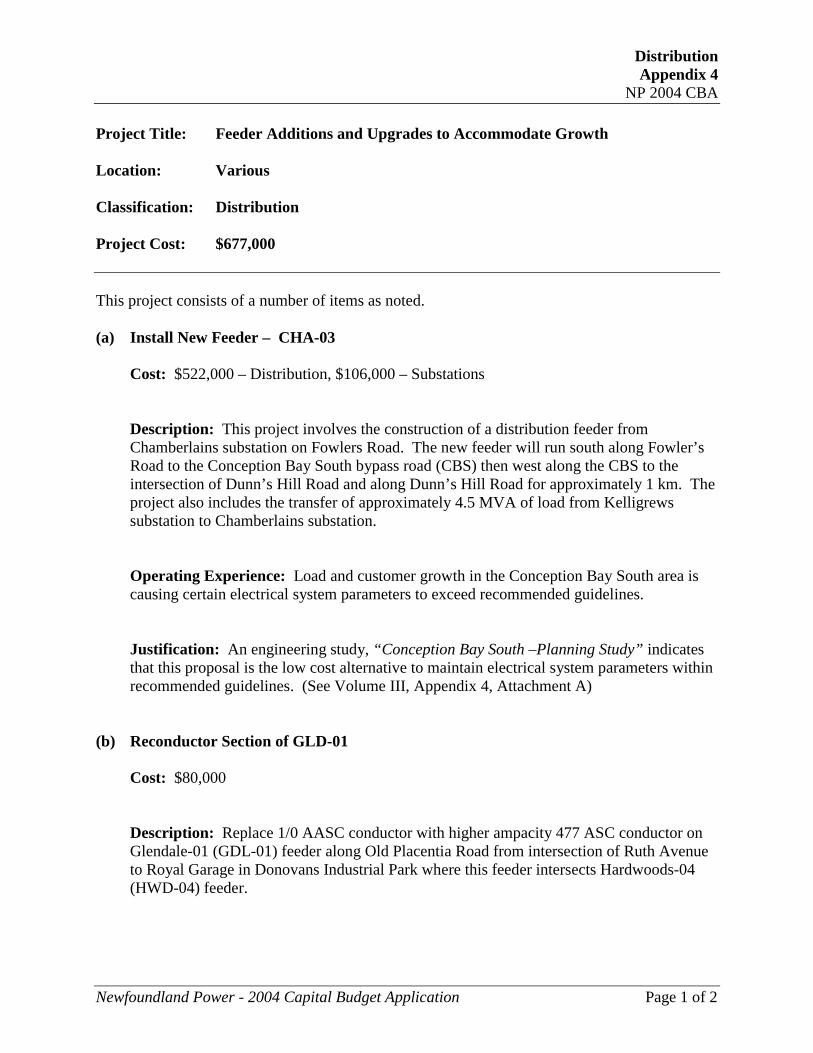
Distribution Appendix 4
NP 2004 CBA
Newfoundland Power - 2004 Capital Budget Application Page 1 of 2
Project Title: Feeder Additions and Upgrades to Accommodate Growth Location: Various Classification: Distribution Project Cost: $677,000 This project consists of a number of items as noted. (a) Install New Feeder – CHA-03
Cost: $522,000 – Distribution, $106,000 – Substations
Description: This project involves the construction of a distribution feeder from Chamberlains substation on Fowlers Road. The new feeder will run south along Fowler’s Road to the Conception Bay South bypass road (CBS) then west along the CBS to the intersection of Dunn’s Hill Road and along Dunn’s Hill Road for approximately 1 km. The project also includes the transfer of approximately 4.5 MVA of load from Kelligrews substation to Chamberlains substation.
Operating Experience: Load and customer growth in the Conception Bay South area is causing certain electrical system parameters to exceed recommended guidelines. Justification: An engineering study, “Conception Bay South –Planning Study” indicates that this proposal is the low cost alternative to maintain electrical system parameters within recommended guidelines. (See Volume III, Appendix 4, Attachment A)
(b) Reconductor Section of GLD-01
Cost: $80,000
Description: Replace 1/0 AASC conductor with higher ampacity 477 ASC conductor on Glendale-01 (GDL-01) feeder along Old Placentia Road from intersection of Ruth Avenue to Royal Garage in Donovans Industrial Park where this feeder intersects Hardwoods-04 (HWD-04) feeder.
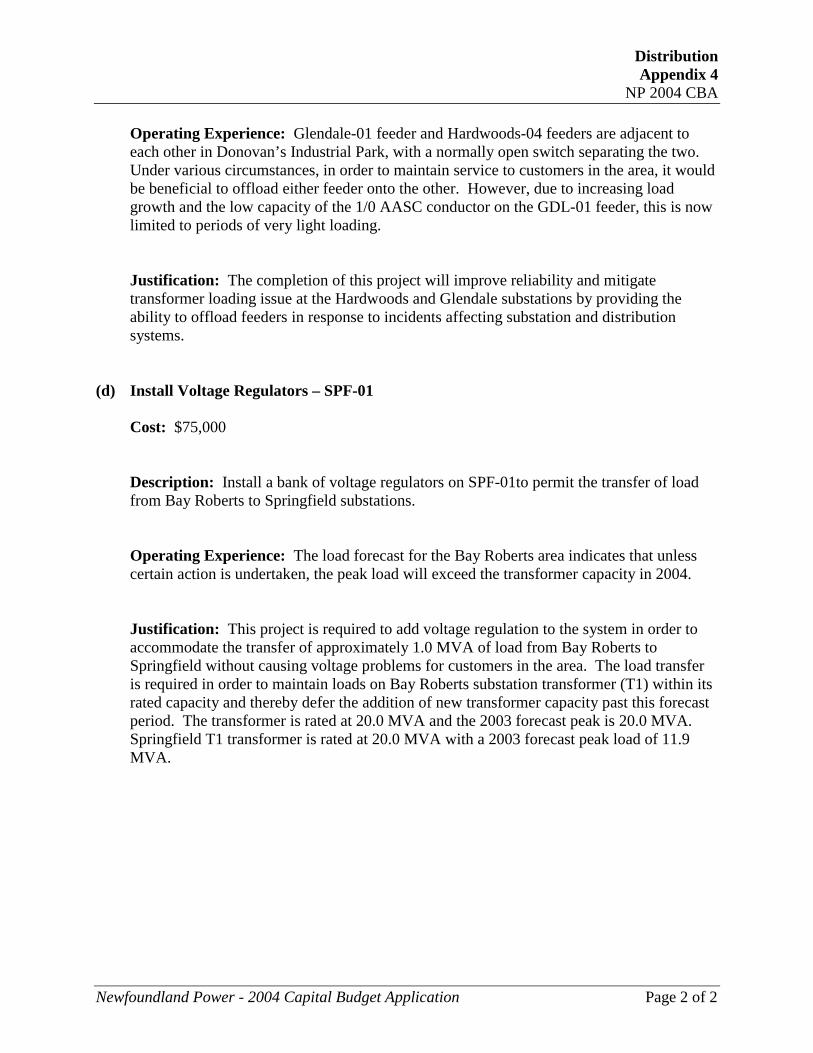
Distribution Appendix 4
NP 2004 CBA
Newfoundland Power - 2004 Capital Budget Application Page 2 of 2
Operating Experience: Glendale-01 feeder and Hardwoods-04 feeders are adjacent to each other in Donovan’s Industrial Park, with a normally open switch separating the two. Under various circumstances, in order to maintain service to customers in the area, it would be beneficial to offload either feeder onto the other. However, due to increasing load growth and the low capacity of the 1/0 AASC conductor on the GDL-01 feeder, this is now limited to periods of very light loading. Justification: The completion of this project will improve reliability and mitigate transformer loading issue at the Hardwoods and Glendale substations by providing the ability to offload feeders in response to incidents affecting substation and distribution systems.
(d) Install Voltage Regulators – SPF-01 Cost: $75,000 Description: Install a bank of voltage regulators on SPF-01to permit the transfer of load from Bay Roberts to Springfield substations. Operating Experience: The load forecast for the Bay Roberts area indicates that unless certain action is undertaken, the peak load will exceed the transformer capacity in 2004. Justification: This project is required to add voltage regulation to the system in order to accommodate the transfer of approximately 1.0 MVA of load from Bay Roberts to Springfield without causing voltage problems for customers in the area. The load transfer is required in order to maintain loads on Bay Roberts substation transformer (T1) within its rated capacity and thereby defer the addition of new transformer capacity past this forecast period. The transformer is rated at 20.0 MVA and the 2003 forecast peak is 20.0 MVA. Springfield T1 transformer is rated at 20.0 MVA with a 2003 forecast peak load of 11.9 MVA.

Distribution Appendix 4
Attachment A
Newfoundland Power Inc.
Conception Bay South
Planning Study
Memo From: G. Emberley To: G. Durnford Subject: Update to the Conception Bay South Planning Study Date: July 3, 2003 ------------------------------------------------------------------------------------------------------------ The winter 2003 Conception Bay South Planning Study was based on load forecast completed in the fall / winter. Since that time the 2002/ 2003 winter peak demand has occurred and the peak demands experienced in the Conception Bay South substations of Kelligrews and Seal Cove were significantly higher than was expected and used in the report. As a result, the conversions necessary to prevent overloads on the Kelligrews and Seal Cove transformers must be constructed in 2004 rather than the 2007, as was noted in the report. The conversion will now be done in conjunction with the 2004 construction of the CHA-03 feeder. A copy of the St. John’s area 2003 substation forecast is attached. The rapid growth being experienced in the CBS area has increased the importance of building CHA-03 in 2004. The economic efficiency of doing so is now enhanced relative to the alternative in the Conception Bay South Planning Study whereby adding transformer capacity to 2007 would now be moved to 2004 if that alternative were chosen. Building the CHA-03 feeder in 2004 along with the conversion of Kelligrews load to 25 kV effectively defers the requirement to add transformer capacity at Kelligrews from 2004 to well beyond the 5-year capital budget period.

Operating Transformer 2002 Max. Voltage Capacity - MVA Peak Forecasted Undiversified Peak - MVA XFMR.
Substation (Notes) Des. (kV) Rating Existing MVA 2003 2004 2005 2006 2007 2008 Util.
Big Pond (13) T1 12.47 8.4/11.2 11.2 7.5 8.0 8.0 8.0 8.0 9.2 9.3 83%Broad Cove (8 & 10) T1 12.47 15/20/25 25.0 22.9 24.7 25.0 24.3 24.7 24.4 24.9 100%Cape Broyle T1 12.47 5.0/6.7 5.0 2.3 2.5 2.5 2.5 2.5 2.6 2.6 52%Chamberlains (6 & 11) T1 24.94 15/20/25 25.0 24.2 13.2 15.7 16.0 16.5 19.0 19.7 79%Chamberlains T2 24.94 15/20/25 25.0 13.2 15.7 16.0 16.5 19.0 19.7 79%Fermeuse T1 12.47 3.0/4.0 4.0 2.6 2.8 2.8 2.9 2.9 3.0 3.0 75%Glendale (3, 5 & 9) T1 12.47 15/20/25 25.0 22.2 24.7 23.8 23.8 16.6 16.8 17.0 99%Glendale T2 12.47 15/20/25 25.0 22.2 24.9 24.0 23.9 16.7 16.9 17.1 99%Glendale T3 12.47 15/20/25 25.0 16.7 16.9 17.1 68%Goulds (5 & 14) T2 12.47 15/20 20.0 8.1 8.9 11.0 11.4 11.8 12.3 15.1 75%Goulds T3 12.47 10/13.3 13.3 8.4 9.0 9.2 9.2 9.4 9.5 9.7 73%Hardwoods (3, 4 & 9) T1 12.47 15/20 20.0 19.6 19.5 19.8 19.8 19.0 19.3 19.6 99%Hardwoods T2 12.47 15/20 20.0 19.6 19.4 19.7 19.7 18.9 19.2 19.5 99%Hardwoods (8, 10 & 11) T3 24.94 15/20/25 25.0 17.3 19.4 20.5 22.6 23.9 22.0 23.3 96%Holyrood 02 1.7 1.8 1.8 1.9 1.9 1.9 1.9 Kelligrews (6, 7 & 12) T1 12.47 11.25/14.95 15.0 13.4 14.6 11.8 12.0 12.3 13.6 14.0 97%Kenmount (4) T1 24.94 15/20/25 25.0 16.9 18.4 18.7 18.7 18.9 19.1 19.4 78%Kenmount T2 24.94 15/20/25 25.0 17.3 19.2 19.4 19.5 19.7 19.9 20.2 81%King's Bridge T1 4.16 7.5/10 10.0 7.2 7.7 7.8 7.8 7.8 7.9 8.0 80%King's Bridge T2 4.16 7.5/10 10.0 7.2 7.7 7.7 7.7 7.8 7.9 8.0 80%King's Bridge T3 12.47 15/20/25 25.0 18.7 20.1 20.3 20.4 20.6 20.9 21.2 85%Mobile (13) T2 12.47 5.0/6.7 6.7 5.9 6.4 6.5 6.6 6.6 6.3 6.5 99%Molloy's Lane (14) T1 12.47 15/20/25 25.0 22.0 24.2 24.4 24.4 24.6 24.9 24.0 100%Molloy's Lane T2 12.47 15/20/25 25.0 22.0 22.9 23.1 23.1 23.3 23.5 22.7 94%Oxen Pond T1 12.47 10/13.3 13.3 8.5 9.1 9.3 9.3 9.4 9.5 9.7 73%Pepperrell T1 12.47 15/20/25 25.0 20.9 22.4 22.6 22.6 22.8 23.1 23.4 94%Petty Harbour T1 4.16 3.0/4.0 3.0 2.4 2.6 2.6 2.7 2.7 2.7 2.8 94%Pulpit Rock T1 12.47 15/20/25 25.0 17.5 18.9 19.4 19.6 20.0 20.4 20.9 84%Ridge Road T1 4.16 1.7/2.2 2.2 0.8 0.9 0.9 0.9 0.9 0.9 0.9 40%Ridge Road T2 12.47 15/20 20.0 13.6 15.9 16.3 16.6 17.0 17.5 18.1 91%Ridge Road T3 12.47 15/20 20.0 17.2 17.6 18.1 18.4 18.8 19.4 20.0 100%Seal Cove (7 & 12) T2 12.47 11.2 11.2 10.6 11.5 10.7 10.8 11.1 10.3 10.5 103%St. John's Main T4 4.16 7.5/10 7.5 2.1 2.2 2.3 2.3 2.3 2.3 2.3 31%
Eastern Region - St. John's Area2003 Five Year Forecast
Sch B, DW, App 4, Attach A, Memo, Attach A.xls 1 of 2

St. John's Main T2 12.47 15/20/25 25.0 20.7 20.4 20.7 20.7 20.9 21.1 21.4 86%St. John's Main T1 12.47 15/20/25 25.0 19.4 22.5 22.8 22.8 23.0 23.3 23.6 94%Stamps Lane T1 4.16 10/13.3 13.3 10.0 10.7 10.8 10.8 10.8 11.0 11.1 83%Stamps Lane T3 12.47 15/20/25 25.0 19.8 22.8 23.0 23.0 23.2 23.5 23.8 95%Stamps Lane T4 12.47 15/20/25 25.0 18.4 19.8 20.2 20.3 20.6 21.0 21.4 86%Virginia Waters T1 12.47 15/20/25 25.0 22.1 16.4 16.9 17.3 17.8 18.5 19.2 77%Virginia Waters T2 12.47 15/20/25 25.0 21.6 15.0 15.5 15.9 16.3 16.9 17.6 70%Virginia Waters T3 12.47 15/20/25 25.0 16.4 16.9 17.3 17.8 18.5 19.2 77%
MEMORIAL UNIVERSITY 16.0 16.1 16.2 16.2 16.2 16.2 16.2TOTAL - MVA 550.8 594.4 604.5 609.5 619.4 632.4 645.7
SYSTEM TRANSFORMER LOADINGS(Base Case Load Flow Model)
Operating Transformer 2002 Max. Voltage Capacity - MVA Peak Forecasted Undiversified Peak - MVA XFMR.
Substation Des. (kV) Rating Existing MVA 2003 2004 2005 2006 2007 2008 Util.
GOULDS T1 66-33 10 10.0 3.4 2.3 2.3 2.2 2.2 2.1 2.1 23%
Notes:(1) Substation forecast based on 2002 to 2007 energy forecast released Feb 4, 2003.(2) 2008 data is based on the same load growth experienced in 2007.(3) 2003 - Transfer 2.0 MVA from HWD-12.5 kW bus to GDL.(4) 2003 - 1.0 MVA of HWD 12.5 converted to 25kV and transferred to KEN.(5) 2004 - 2.0 MVA transferred from GDL to GOU-T2.(6) 2004 - 4.0 MVA of KEL 12.5 converted to 25 kV and transferred to CHA - PENDING Final Approval of CBS Study.(7) 2004 - 1.0 MVA transferred from SCV to KEL - PENDING Final Approval of CBS Study.(8) 2005 - 1.1 MVA of BCV 12.5 converted to 25kV and transferred to HWD.(9) 2006 - 2 MVA transferred from HWD 12.kV Bus to GDL and install 25 MVA unit at GDL.(10) 2007 - 0.75 MVA of BCV 12.5 converted to 25kV and transferred to HWD.(11) 2007 - 4.0 MVA of HWD T3 transferred to CHA.(12) 2007 - 1.0 MVA of SCV transferred to KEL.(13) 2007 - 1.0 MVA of MOB transferred to BIG and install Rads at BIG.(14) 2008 - 2.5 MVA of MOL transferred to GOU-T2.
Sch B, DW, App 4, Attach A, Memo, Attach A.xls 2 of 2
i
Table of Contents
Page
Introduction ............................................................................................................. 1
Description of the Existing System......................................................................... 1
Load Forecast and Growth Projections .................................................................. 2
Development of Alternatives .................................................................................. 5
Technical Criteria ........................................................................................ 5
Planning Methodology and Development of Alternatives.......................... 5
Alternative # 1............................................................................................. 6
Alternative # 2............................................................................................. 7
Alternative # 3............................................................................................. 8
Economic Analysis.................................................................................................. 8
Sensitivity Analysis................................................................................................. 9
Conclusion and Recommendations ......................................................................... 9
Appendices
A Load Forecast
B Economic Analysis
C High/Low Substation Forecast
D High/Low Economic Analysis
E Alternative Detailed Costs & Timing
1
Introduction The purpose of this study is to recommend the distribution system alternative that best meets the electrical demands of Conception Bay South (CBS). The 2003 installation of an additional 25 MVA transformer at Chamberlains (CHA) substation addressed an existing transformer over loading issue. This study is initiated by two issues: concerns arising from the high number of customers supplied from CHA-01 feeder and transformer loading concerns for the Kelligrews and Seal Cove substations. This study projects the electrical demands for the CBS area to the year 2022, develops alternatives to meet these demands, and ensures the alternatives meet acceptable technical criteria. Further, an economic analysis for each alternative establishes the relative ranking of the alternatives with respect to the least cost approach for customer revenue requirement. Description of Existing System Over the past ten years, the town of Conception Bay South (CBS) has experienced one of the fastest growth rates in the province. All indications are that this growth rate will be sustained into the future. As a result, Newfoundland Power must ensure that its infrastructure will service this community as it grows with a reliable and economic electrical distribution system. Three substations, Chamberlains (CHA), Kelligrews (KEL) and Seal Cove (SCV) service the town of CBS with a total substation transformer capacity of 51 MVA. A schematic diagram of the transmission and distribution systems supplying the area is shown in Figure 1. In the east end of CBS, Chamberlains substation (CHA) is located on Fowler’s Road and has two feeders, CHA-01 and CHA-02, both operating at 25KV. The CHA-01 feeder services the developing subdivisions to the south of the substation and extends along the CBS highway as far as Dunn’s Hill Road in Kelligrews. The CHA-02 feeder extends north from the substation and spans from Topsail Pond to Holy Spirit School along the CBS Highway. As of February 2002, CHA-01 and CHA-02 were supplying 3,082 and 985 customers respectively. At present there is no backup capability for the CHA-01 feeder. Chamberlains substation has a 66/25 KV 25 MVA power transformer connected via a loop system by transmission lines 49L and 79L from Hardwoods (HWD) substation and 51L from the KEL substation. An additional 2.2 MVA of capacity is also paralleled with CHA-02 from the Topsail Generating Plant. The Kelligrews substation (KEL) is located on Middle Bite Road in Kelligrews with two feeders KEL-01 and KEL-02, both operating at 12.5 KV. The KEL-01 feeder extends north from the substation to the CBS highway and then it extends west
2
as far as Hynes’ Road in Seal Cove where it is back to back with the SCV-01 feeder. The KEL-02 feeder runs north from the substation to the CBS Highway and then it travels east where it is back to back with CHA-01 at Dunn’s Hill Road. The Kelligrews Substation contains a 66/12.5 kV, 14.95 MVA power transformer and has a loop system via 51L and 52L transmission lines from Chamberlains and Seal Cove substations. The Seal Cove substation (SCV) is located near Garden Road in Seal Cove along the Conception Bay Highway. This substation has two feeders, SCV-01 and SCV-02, both operating at 12.5 KV. The SCV-01 feeder travels east along the CBS highway as far as Hynes’ Road in Kelligrews where it is back to back with KEL-01. The SCV-02 feeder runs west along the CBS highway where it is back to back with HOL-02 in the town of Holyrood. The Seal Cove substation uses a 66/12.5 KV 11.2 MVA power transformer. Power is delivered to the substation by transmission lines 52L from KEL substation and 38L from Duff’s Steam Plant in Holyrood. There is also a pair of generators at the Seal Cove substation with a capacity of 4 MVA. They are generating power at 2.4 KV and are tied directly into the 66 KV bus. Since this only affects the transmission system and has no impact on the output of SCV-T2, it will not be a factor in this study. As this area continues to grow, Newfoundland Power must ensure it has a sufficient supply of reliable power that meets the needs of the community. As Chamberlains substation demand has already reached the capacity of the existing 25 MVA power transformer, a new 66-25 KV, 25 MVA power transformer has been scheduled for installation at Chamberlains substation this year. Over the past few years, concerns have also been raised by operations personnel regarding the large number of customers (3,082) presently served through the CHA-01 feeder with little system backup. These concerns centre on the ability to re-energize the feeder under cold load situation and the reliability impact from serving such a large number of customers on one feeder.
Load Forecast and Growth Projections Base case values for the load forecast for each individual feeder were based on historical data for years 1993 to 2002. Throughout the past ten years, the maximum yearly peaks for each feeder has varied. However, after analyzing all of the data, a base case historical demand was determined for each feeder. It was determined that some of the maximum yearly values were the result of cold pick up and appropriate adjustments were made. Growth projections for the community of Conception Bay South were developed through the analysis of historical data provided by the town’s development control coordinator. This information was then taken and used to create a load forecast for a 20-year period. In addition, from the base case, a medium, high and low

3
forecast was projected. Most growth for the town in the past has been mainly as a result of residential development; any commercial expansion has been to service the residential sector. Therefore, the forecast was based mainly on the residential growth experienced over the past ten years. It was determined that the growth in the east end and the central part of the town has proceeded at a faster rate than that experienced in the west end of the town. This trend is expected to continue over the next five years. Based on these assumptions, a load forecast growth rate of 2% per year was used for Chamberlains and Kelligrews substations and a forecast of 1.2% per year was used for the Seal Cove substation. This same growth rate was used to project to the year 2022. In addition, high and low forecasts were developed to judge the sensitivity of the alternatives analysis to load forecast variability. The base forecast is noted in Appendix A, with high and low forecasts noted in Appendix C.
Development of Alternatives Technical Criteria The following technical criteria were established to ensure acceptable operating standards for distribution feeders:
1. The minimum steady state feeder voltage should not fall below 116 volts
on a 120-volt base. 2. The number of customers served through a distribution feeder without
backup capability should not exceed 3000. 3. The steady state substation power transformer loading should not exceed
the nameplate rating. 4. The recloser normal peak loading should be restricted to permit adequate
cold load pickup. In the Kelligrews and Seal Cove instance this would be 500 amps per phase (10.8 MVA at 12.5 kV).
5. The conductor loading should not exceed the ampacity rating established in the Company’s Distribution Planning Guidelines
Planning Methodology and the Development of Alternatives The planning methodology is the process whereby the forecasted electrical demands are serviced through developing alternatives that meet the technical criteria. These alternatives are then evaluated using economic analysis and other judgement factors. Based on this analysis a preferred alternative is recommended. As the load forecast extended to 2022, capital additions are projected from 2004 to 2022.
4
The number of customers currently served by CHA-01 without backup at 3,082 now exceeds the technical criteria. Alternatives are developed that permit backup of CHA-01 as the number of customers supplied via this feeder continue to grow beyond 3,000. This is done by adding another feeder to Chamberlains substation (CHA-03) and extending it south along the new highway. As CHA-01 extends south along the old CBS highway, there will be tie points between CHA-01 and CHA-03, providing the backup to CHA-01. Kelligrews feeders cannot provide this backup, as the feeder voltages supplied through Chamberlains and Kelligrews substations are different. In reviewing the load forecast, it is apparent that the Kelligrews substation transformer load is exceeding capacity in the short term (2007). The 2003 transformer capacity addition at Chamberlains has resulted in significant transformer capacity being available at Chamberlains. The 2007 transformer capacity deficit at Kelligrews can be met through either adding transformer capacity at Kelligrews or transferring load from Kelligrews substation to Chamberlains substation and deferring the transformer capacity addition to the Kelligrews substation. Three alternatives are developed and are grouped into these two categories. Two of the three alternatives include the construction of a new CHA-03 feeder from the CHA substation. This is to address the large number of customers presently serviced through the CHA-01 feeder and to meet technical criteria number 2. However, alternative # 3 evaluates the system without the construction of this CHA-03 feeder in order to determine the cost of meeting this criterion. A description of each alternative follows: Alternative #1 The first alternative has as its initial element the 2004 construction of a new 25 kV feeder (CHA-03) from the Chamberlains substation. A 66-25/12.5, 15 MVA power transformer is added at the Kelligrews substation in 2007. A recloser is replaced with a breaker at the Kelligrews substation in 2014 to avoid overloading the recloser. To avoid adding additional transformer capacity at the Seal Cove substation, a transfer of 2 MVA of load from SCV-01 to KEL-01 would be required, starting with 1.0 MVA in the year 2007. The new CHA-03 feeder would extend south along Fowler’s Road to the new CBS By-Pass Road, then it would extend west along the CBS By-Pass Road to the intersection of Dunn’s Hill Road. At the same time the section extending out Mineral Road where it intersects with Conception Bay Highway would be upgraded and re-conductored. This would permit CHA-01 & CHA-03 to be paralleled and provide backup. Construction of the new CHA-03 feeder would include the following:

5
1. The reconductoring of the existing line along Fowler’s Road and Mineral Road to three phase 477 mcm.
2. The extension of the Cherry Hill subdivision tap to the intersection of the By-Pass Road. This would allow this new subdivision with a potential of 200 residential lots to be fed from this new feeder.
3. The upgrading of a section of line running down Southshore Drive from single phase to three phase and the construction of two spans of single phase line to connect Cambridge Crescent with Sweetenwater Avenue. This would allow for all of the existing residential development south of the substation to be fed from this new feeder.
4. The construction of a 3.8 km three phase line along the CBS By-Pass Road with 477 mcm conductor to Mineral Road.
The new CHA-03 feeder could tap into any of the various distribution lines that intersect the CBS By-Pass Road to balance the load between CHA-01 and CHA-03. The most important feature is the availability of backup on CHA-01 and the reduction of the number of customers on any one feeder.
Alternative # 1 Cost 1 Year Construction of CHA-03 feeder - (Distribution) 304,884 2004
Construction of CHA-03 feeder - (Substation) 106,000 2004
Add additional 66-25/12.5, 15 MVA transformer at KEL Substation - (Substation)
1,184,758 2007
Replace KEL-02-R with a breaker - (Substation) 112,994 2014
Transfer 1.0 MVA from SCV-01 to KEL-01 07 & 15
Total capital cost 1,708,636 1 Current dollars – see Appendix E. Alternative #2 The second alternative is similar to alternative #1. The exception is the 2007 conversion of a portion (4.5 MVA) of KEL-02 load from 12.5 kV to 25 kV and transferring this converted load to CHA-01. This would delay the requirement of the new 66-25/12.5, 15 MVA power transformer at Kelligrews substation for 10 years. The section to be converted would include all of the KEL-02 feeder beyond the tap to Peachytown Road to the end of the feeder. This would be the maximum load that could be transferred at this time. If the actual load growth is somewhat greater than expected, the transformer capacity at Chamberlains substation would be fully utilized by 2022. The 2004 construction of a new CHA-03 25 kV feeder would be extended to Dunn’s Hill Road (an additional 0.9 km). To avoid adding additional transformer

6
capacity at the Seal Cove substation, a transfer of 2 MVA of load from SCV-01 to KEL-01 would still be required starting in year 2007.
Alternative # 2 Cost 1 Year
RequiredConstruction of CHA-03 feeder - (Distribution) 342,000 2004
Construction of CHA-03 feeder - (Substation) 106,000 2004
Convert a portion of KEL-02 to 25 kV & transfer to CHA-01 - (Distribution) 180,000 2007
Add additional 66-25/12.5, 15 MVA transformer at KEL Substation - (Substation) 1,184,758 2017
Transfer 1.0 MVA from SCV-01 to KEL-01 07 & 15
Total capital cost 1,812,758 1 Current dollars – see Appendix E.
Alternative #3 The third alternative is similar to alternative # 1 without the construction of a new Chamberlains feeder. It does not change the existing feeders configuration, but adds additional transformer capacity at Kelligrews when required. Load from SCV-01 is transferred to KEL-01 as the transformer capacity at SCV reaches its limit. Alternative #3 does not meet the technical requirement limiting the number of customers per feeder to 3,000. It is considered to judge the cost of meeting this criteria through comparison with the other two alternatives.
Alternative # 3 Cost 1 Year
RequiredAdd additional 66-25/12.5, 15 MVA transformer at KEL Substation - (Substation)
1,184,758 2007
Replace KEL-02-R with a breaker - (Substation) 112,994 2014
Transfer 1.0 MVA from SCV-01 to KEL-01 07 & 15
Total construction cost 1,297,752 1 Current dollars – see Appendix E. Economic Analysis In order to compare the economic impact of the alternatives, a net present value calculation of customer revenue requirement was completed for each alternative.
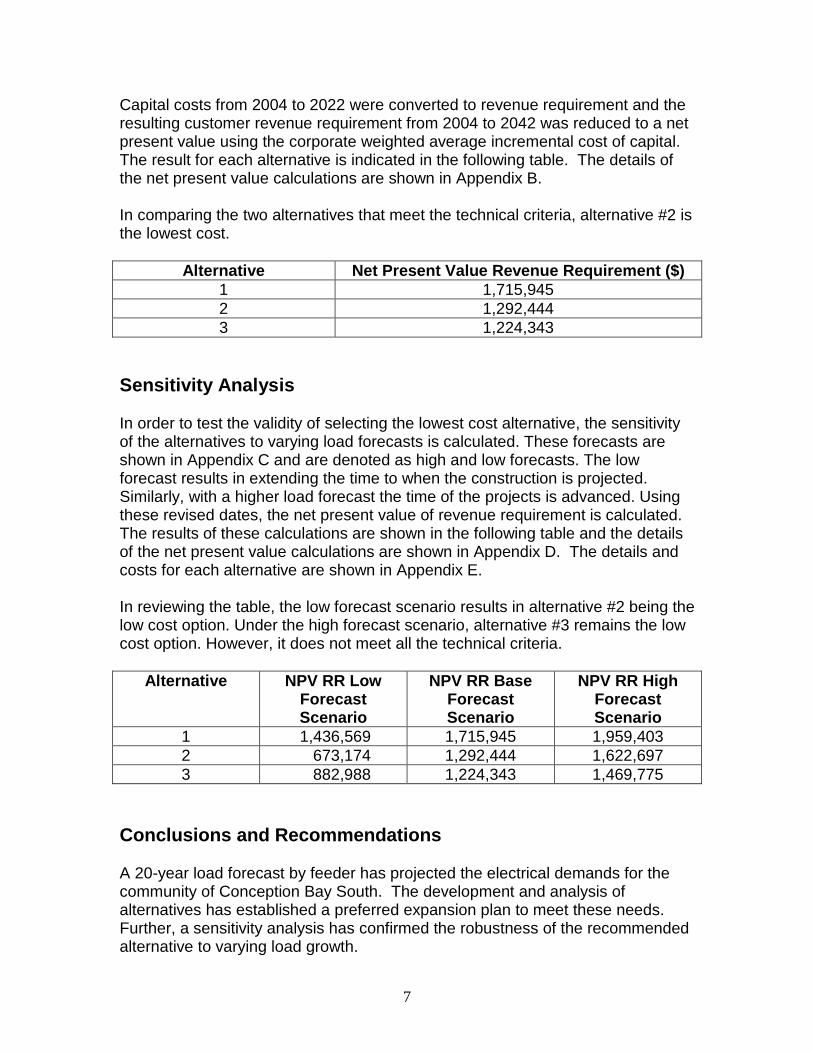
7
Capital costs from 2004 to 2022 were converted to revenue requirement and the resulting customer revenue requirement from 2004 to 2042 was reduced to a net present value using the corporate weighted average incremental cost of capital. The result for each alternative is indicated in the following table. The details of the net present value calculations are shown in Appendix B. In comparing the two alternatives that meet the technical criteria, alternative #2 is the lowest cost.
Alternative Net Present Value Revenue Requirement ($) 1 1,715,945 2 1,292,444 3 1,224,343
Sensitivity Analysis In order to test the validity of selecting the lowest cost alternative, the sensitivity of the alternatives to varying load forecasts is calculated. These forecasts are shown in Appendix C and are denoted as high and low forecasts. The low forecast results in extending the time to when the construction is projected. Similarly, with a higher load forecast the time of the projects is advanced. Using these revised dates, the net present value of revenue requirement is calculated. The results of these calculations are shown in the following table and the details of the net present value calculations are shown in Appendix D. The details and costs for each alternative are shown in Appendix E. In reviewing the table, the low forecast scenario results in alternative #2 being the low cost option. Under the high forecast scenario, alternative #3 remains the low cost option. However, it does not meet all the technical criteria.
Alternative NPV RR Low Forecast Scenario
NPV RR Base Forecast Scenario
NPV RR High Forecast Scenario
1 1,436,569 1,715,945 1,959,403 2 673,174 1,292,444 1,622,697 3 882,988 1,224,343 1,469,775
Conclusions and Recommendations A 20-year load forecast by feeder has projected the electrical demands for the community of Conception Bay South. The development and analysis of alternatives has established a preferred expansion plan to meet these needs. Further, a sensitivity analysis has confirmed the robustness of the recommended alternative to varying load growth.

8
The lowest cost alternative that meets all of the technical criteria is alternative #2. It includes the 2004 construction of the CHA-03 feeder, the 2007 conversion of 4.5 MVA of KEL-02 feeder load from 12.5 kV to 25 kV and the transfer of this converted load to CHA-01 and to CHA-03 feeders. This alternative, in addition to meeting the technical criteria and the projected loads, will defer the need for additional transformer capacity at Kelligrews and Seal Cove substations to well beyond the 5-year capital budget horizon.
Appendix A
Load Forecast

Feeders Base Peaks 2002 2003 2004 2006 2008 2010 2012 2014 2016 2018 2020 2022SCV-01 7632 7919 8014 8110 8306 7495 7675 7861 8051 7233 7408 7586 7770SCV-02 2232 2681 2713 2746 2812 2880 2949 3021 3094 3168 3245 3323 3403
Sub Total 9864 10600 10727 10856 11118 10374 10625 10881 11144 10401 10652 10910 11173
SCV T2 Capacity 11200 11200 11200 11200 11200 11200 11200 11200 11200 11200 11200 11200TFMR Requirements -600 -473 -344 -82 -826 -575 -319 -56 -799 -548 -290 -27
KEL-01 5107 5209 5313 5419 5638 6886 7164 7454 7755 9088 9455 9837 10235KEL-02 8402 8570 8741 8916 9276 9651 10041 10447 10869 11308 11765 12240 12735
Sub Total 13509 13779 14055 14336 14915 16537 17206 17901 18624 20396 21220 22077 22969
KEL T1 Capacity 14950 14950 14950 14950 14950 14950 14950 14950 14950 14950 14950 14950TFMR Requirements -1171 -895 -614 -35 1587 2256 2951 3674 5446 6270 7127 8019
CHA-01 13969 15423 15731 16046 16694 17369 18071 18801 19560 20350 21172 22028 22918CHA-02 9300 9663 9856 10053 10460 10882 11322 11779 12255 12750 13265 13801 14359
Sub Total 23269 25086 25588 26099 27154 28251 29392 30580 31815 33100 34438 35829 37276
CHA Capacity 50000 50000 50000 50000 50000 50000 50000 50000 50000 50000 50000 50000TFMR Requirements -24914 -24412 -23901 -22846 -21749 -20608 -19420 -18185 -16900 -15562 -14171 -12724
1.20%2.00%2.00%
2.5 mva of load transferred from CHA-02 to HWD-08 feeder in 2001
Estimated Load Forecast (Medium)
CHA Substation GrowthCHA-01 is based on a 1997 peak of 13969 kvaCHA-02 is based on a 2000 peak of 9288 kva
SCV-01 is based on a 2001 peak of 7632 kvaSCV Substation Growth SCV-02 is based on a 1994 peak of 2232 kvaKEL Pond Substation Growth
New 25.0 mva TFMR being installed at CHA this year1.5 mva of load was transferred from KEL-01 to SCV-01 in 1999
Sch B, DW, App 4, Attach A, App A.xlsPage 1 of 1

Appendix B
Economic Analysis

Present Worth Analysis - Alternative #1- Medium Forecast
Weighted Average Incremental Cost of Capital 8.52%Escalation Rate 1.70%
CAPITAL EXPENDITURE IN YEAR BY ASSET TYPECapital Operating Operating Net Present CumulativeRevenue Costs Benefits Benefit Worth Present
Substation Distribution Requirement Benefit Worth
38.5 yrs 30.4 yrs Benefit4% CCA 4% CCA
YEAR
2004 106,000 304,884 60,045 0 0 -60,045 -55,331 -55,3312005 54,381 0 0 -54,381 -46,177 -101,5082006 53,311 0 0 -53,311 -41,715 -143,2232007 1,246,214 224,889 0 0 -224,889 -162,155 -305,3772008 207,319 0 0 -207,319 -137,749 -443,1272009 203,672 0 0 -203,672 -124,702 -567,8282010 199,970 0 0 -199,970 -112,823 -680,6512011 196,217 0 0 -196,217 -102,014 -782,6652012 192,413 0 0 -192,413 -92,182 -874,8472013 188,561 0 0 -188,561 -83,244 -958,0912014 133,741 203,193 0 0 -203,193 -82,661 -1,040,7532015 197,483 0 0 -197,483 -74,031 -1,114,7832016 193,226 0 0 -193,226 -66,748 -1,181,5312017 188,923 0 0 -188,923 -60,138 -1,241,6692018 184,577 0 0 -184,577 -54,142 -1,295,8112019 180,190 0 0 -180,190 -48,705 -1,344,5162020 175,762 0 0 -175,762 -43,778 -1,388,2942021 171,295 0 0 -171,295 -39,316 -1,427,6102022 166,792 0 0 -166,792 -35,277 -1,462,8872023 162,253 0 0 -162,253 -31,622 -1,494,5092024 157,680 0 0 -157,680 -28,318 -1,522,8282025 153,074 0 0 -153,074 -25,333 -1,548,1612026 148,437 0 0 -148,437 -22,637 -1,570,7982027 143,769 0 0 -143,769 -20,204 -1,591,0012028 139,073 0 0 -139,073 -18,009 -1,609,0112029 134,349 0 0 -134,349 -16,032 -1,625,0422030 129,598 0 0 -129,598 -14,251 -1,639,2932031 124,821 0 0 -124,821 -12,648 -1,651,9412032 120,020 0 0 -120,020 -11,207 -1,663,1472033 115,196 0 0 -115,196 -9,912 -1,673,0592034 86,259 0 0 -86,259 -6,839 -1,679,8982035 93,176 0 0 -93,176 -6,808 -1,686,7052036 89,321 0 0 -89,321 -6,014 -1,692,7192037 85,450 0 0 -85,450 -5,301 -1,698,0202038 81,562 0 0 -81,562 -4,663 -1,702,6832039 77,659 0 0 -77,659 -4,091 -1,706,7742040 73,740 0 0 -73,740 -3,580 -1,710,3542041 69,807 0 0 -69,807 -3,123 -1,713,4772042 59,876 0 0 -59,876 -2,468 -1,715,945
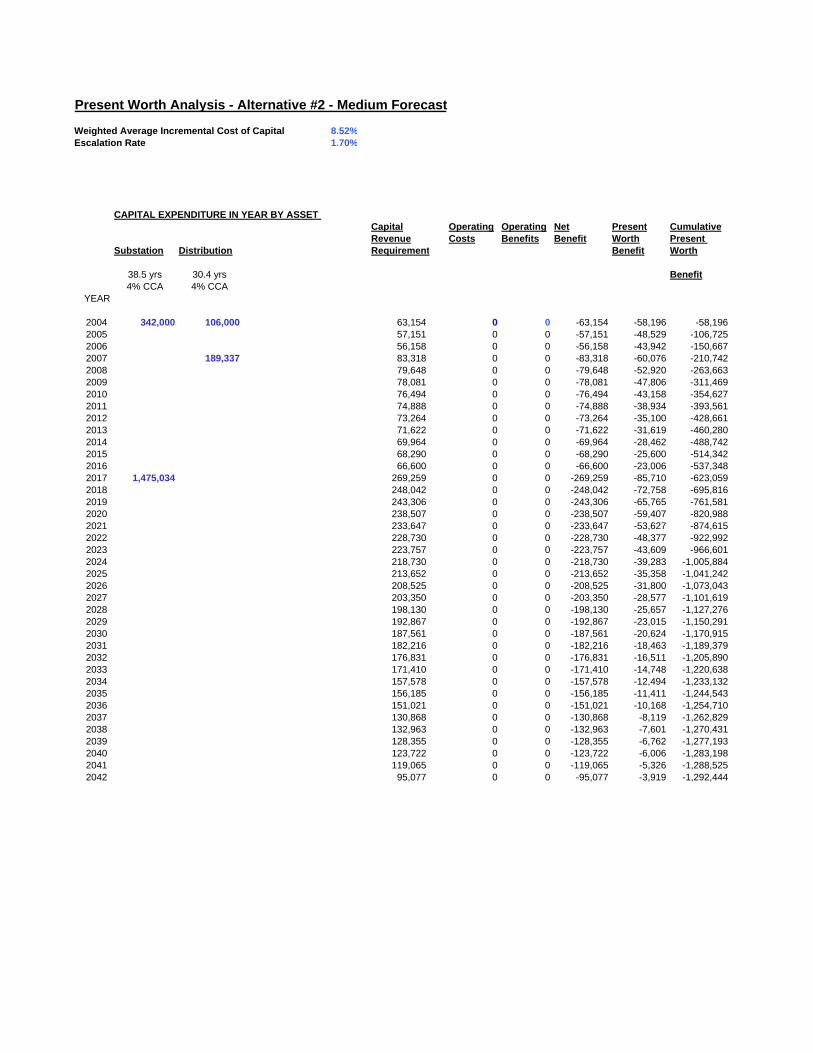
Present Worth Analysis - Alternative #2 - Medium Forecast
Weighted Average Incremental Cost of Capital 8.52%Escalation Rate 1.70%
Capital Operating Operating Net Present CumulativeRevenue Costs Benefits Benefit Worth Present
Substation Distribution Requirement Benefit Worth
38.5 yrs 30.4 yrs Benefit4% CCA 4% CCA
YEAR
2004 342,000 106,000 63,154 0 0 -63,154 -58,196 -58,1962005 57,151 0 0 -57,151 -48,529 -106,7252006 56,158 0 0 -56,158 -43,942 -150,6672007 189,337 83,318 0 0 -83,318 -60,076 -210,7422008 79,648 0 0 -79,648 -52,920 -263,6632009 78,081 0 0 -78,081 -47,806 -311,4692010 76,494 0 0 -76,494 -43,158 -354,6272011 74,888 0 0 -74,888 -38,934 -393,5612012 73,264 0 0 -73,264 -35,100 -428,6612013 71,622 0 0 -71,622 -31,619 -460,2802014 69,964 0 0 -69,964 -28,462 -488,7422015 68,290 0 0 -68,290 -25,600 -514,3422016 66,600 0 0 -66,600 -23,006 -537,3482017 1,475,034 269,259 0 0 -269,259 -85,710 -623,0592018 248,042 0 0 -248,042 -72,758 -695,8162019 243,306 0 0 -243,306 -65,765 -761,5812020 238,507 0 0 -238,507 -59,407 -820,9882021 233,647 0 0 -233,647 -53,627 -874,6152022 228,730 0 0 -228,730 -48,377 -922,9922023 223,757 0 0 -223,757 -43,609 -966,6012024 218,730 0 0 -218,730 -39,283 -1,005,8842025 213,652 0 0 -213,652 -35,358 -1,041,2422026 208,525 0 0 -208,525 -31,800 -1,073,0432027 203,350 0 0 -203,350 -28,577 -1,101,6192028 198,130 0 0 -198,130 -25,657 -1,127,2762029 192,867 0 0 -192,867 -23,015 -1,150,2912030 187,561 0 0 -187,561 -20,624 -1,170,9152031 182,216 0 0 -182,216 -18,463 -1,189,3792032 176,831 0 0 -176,831 -16,511 -1,205,8902033 171,410 0 0 -171,410 -14,748 -1,220,6382034 157,578 0 0 -157,578 -12,494 -1,233,1322035 156,185 0 0 -156,185 -11,411 -1,244,5432036 151,021 0 0 -151,021 -10,168 -1,254,7102037 130,868 0 0 -130,868 -8,119 -1,262,8292038 132,963 0 0 -132,963 -7,601 -1,270,4312039 128,355 0 0 -128,355 -6,762 -1,277,1932040 123,722 0 0 -123,722 -6,006 -1,283,1982041 119,065 0 0 -119,065 -5,326 -1,288,5252042 95,077 0 0 -95,077 -3,919 -1,292,444
CAPITAL EXPENDITURE IN YEAR BY ASSET
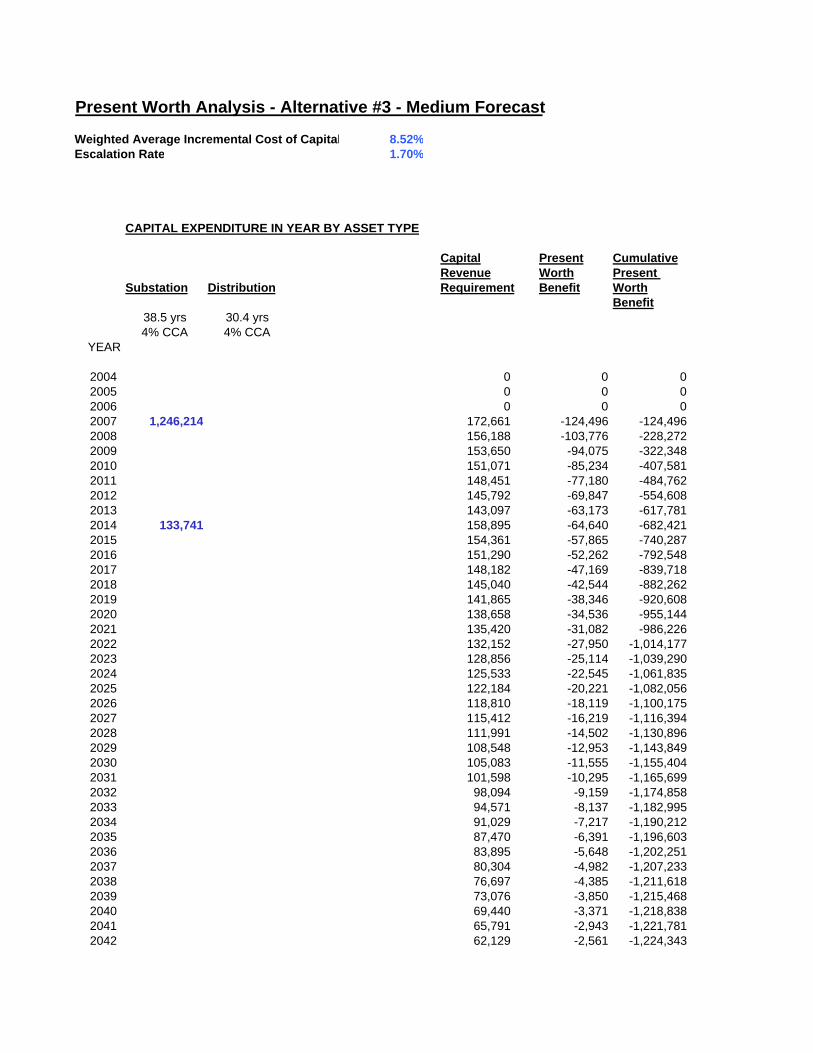
Present Worth Analysis - Alternative #3 - Medium Forecast
Weighted Average Incremental Cost of Capital 8.52%Escalation Rate 1.70%
Capital Present CumulativeRevenue Worth Present
Substation Distribution Requirement Benefit WorthBenefit
38.5 yrs 30.4 yrs4% CCA 4% CCA
YEAR
2004 0 0 02005 0 0 02006 0 0 02007 1,246,214 172,661 -124,496 -124,4962008 156,188 -103,776 -228,2722009 153,650 -94,075 -322,3482010 151,071 -85,234 -407,5812011 148,451 -77,180 -484,7622012 145,792 -69,847 -554,6082013 143,097 -63,173 -617,7812014 133,741 158,895 -64,640 -682,4212015 154,361 -57,865 -740,2872016 151,290 -52,262 -792,5482017 148,182 -47,169 -839,7182018 145,040 -42,544 -882,2622019 141,865 -38,346 -920,6082020 138,658 -34,536 -955,1442021 135,420 -31,082 -986,2262022 132,152 -27,950 -1,014,1772023 128,856 -25,114 -1,039,2902024 125,533 -22,545 -1,061,8352025 122,184 -20,221 -1,082,0562026 118,810 -18,119 -1,100,1752027 115,412 -16,219 -1,116,3942028 111,991 -14,502 -1,130,8962029 108,548 -12,953 -1,143,8492030 105,083 -11,555 -1,155,4042031 101,598 -10,295 -1,165,6992032 98,094 -9,159 -1,174,8582033 94,571 -8,137 -1,182,9952034 91,029 -7,217 -1,190,2122035 87,470 -6,391 -1,196,6032036 83,895 -5,648 -1,202,2512037 80,304 -4,982 -1,207,2332038 76,697 -4,385 -1,211,6182039 73,076 -3,850 -1,215,4682040 69,440 -3,371 -1,218,8382041 65,791 -2,943 -1,221,7812042 62,129 -2,561 -1,224,343
CAPITAL EXPENDITURE IN YEAR BY ASSET TYPE
Appendix C
High / Low Forecast

Feeders Base Peaks 2002 2003 2004 2006 2008 2010 2012 2014 2016 2018 2020 2022SCV-01 7632 7919 7967 8014 8111 8208 8307 7407 7496 7587 7678 7770 7864SCV-02 2232 2681 2697 2713 2746 2779 2812 2846 2881 2915 2950 2986 3022
Sub Total 9864 10600 10664 10728 10857 10987 11120 10253 10377 10502 10628 10756 10886
SCV T2 Capacity 11200 11200 11200 11200 11200 11200 11200 11200 11200 11200 11200 11200TFMR Requirements -600 -536 -472 -343 -213 -80 -947 -823 -698 -572 -444 -314
KEL-01 5107 5209 5261 5314 5421 5529 5641 6754 6890 7028 7169 7314 7461KEL-02 8402 8570 8656 8742 8918 9097 9280 9467 9657 9851 10049 10251 10457
Sub Total 13509 13779 13917 14056 14338 14627 14921 16221 16547 16879 17218 17565 17918
KEL T1 Capacity 14950 14950 14950 14950 14950 14950 14950 14950 14950 14950 14950 14950TFMR Requirements -1171 -1033 -894 -612 -323 -29 1271 1597 1929 2268 2615 2968
CHA-01 13969 15423 15577 15733 16049 16372 16701 17037 17379 17728 18085 18448 18819CHA-02 9300 9663 9760 9857 10055 10257 10464 10674 10889 11107 11331 11558 11791
Sub Total 23269 25086 25337 25590 26105 26629 27165 27711 28268 28836 29415 30007 30610
CHA Capacity 50000 50000 50000 50000 50000 50000 50000 50000 50000 50000 50000 50000TFMR Requirements -24914 -24663 -24410 -23895 -23371 -22835 -22289 -21732 -21164 -20585 -19993 -19390
0.60%1.00%1.00%
1.5 mva of load was transferred from KEL-01 to SCV-01 in 19992.5 mva of load transferred from CHA-02 to HWD-08 feeder in 2001
Estimated Load Forecast (Low Side)
CHA Substation Growth
SCV Substation Growth KEL Pond Substation Growth
New 25.0 mva TFMR being installed at CHA this year
Sch B, DW, App 4, Attach A, App C.xls Page 1 of 2

Feeders Base Peaks 2002 2003 2004 2006 2008 2010 2012 2014 2016 2018 2020 2022SCV-01 7632 7919 8062 8207 7505 7777 8060 7335 7601 6877 7127 7386 6636SCV-02 2232 2681 2729 2778 2879 2984 3092 3205 3321 3442 3567 3696 3830
Sub Total 9864 10600 10791 10985 10384 10761 11152 10539 10922 10319 10694 11082 10467
SCV T2 Capacity 11200 11200 11200 11200 11200 11200 11200 11200 11200 11200 11200 11200TFMR Requirements -600 -409 -215 -816 -439 -48 -661 -278 -881 -506 -118 -733
KEL-01 5107 5209 5365 5526 6863 7281 7724 9225 9786 11382 12075 12811 14621KEL-02 8402 8570 8827 9092 9646 10233 10856 11517 12219 12963 13752 14590 15478
Sub Total 13509 13779 14192 14618 16508 17514 18580 20742 22005 24345 25828 27401 30099
KEL T1 Capacity 14950 14950 14950 14950 14950 14950 14950 14950 14950 14950 14950 14950TFMR Requirements -1171 -758 -332 1558 2564 3630 5792 7055 9395 10878 12451 15149
CHA-01 13969 15423 15886 16362 17359 18416 19537 20727 21990 23329 24749 26257 27856CHA-02 9300 9663 9953 10251 10876 11538 12241 12986 13777 14616 15506 16451 17452
Sub Total 23269 25086 25839 26614 28235 29954 31778 33713 35767 37945 40256 42707 45308
CHA Capacity 50000 50000 50000 50000 50000 50000 50000 50000 50000 50000 50000 50000TFMR Requirements -24914 -24161 -23386 -21765 -20046 -18222 -16287 -14233 -12055 -9744 -7293 -4692
1.80%3.00%3.00%
1.5 mva of load was transferred from KEL-01 to SCV-01 in 1999
Estimated Load Forecast (High Side)
CHA Substation Growth
SCV Substation Growth KEL Pond Substation Growth
New 25.0 mva TFMR being installed at CHA this year
2.5 mva of load transferred from CHA-02 to HWD-08 feeder in 2001
Sch B, DW, App 4, Attach A, App C.xls Page 2 of 2

Appendix D
High / Low Economic Analysis

Present Worth Analysis - Alternative #1 - High Load Forecast
Weighted Average Incremental Cost of Capital 8.52%Escalation Rate 1.70%PW Year
Capital Operating Operating Net Present CumulativeRevenue Costs Benefits Benefit Worth Present
Substation Distribution Requirement Benefit Worth
38.5 yrs 30.4 yrs Benefit4% CCA 4% CCA
YEAR
2004 106,000 304,884 60,045 0 0 -60,045 -55,331 -55,3312005 1,204,899 221,318 0 0 -221,318 -187,930 -243,2622006 204,321 0 0 -204,321 -159,876 -403,1382007 200,784 0 0 -200,784 -144,774 -547,9122008 197,194 0 0 -197,194 -131,022 -678,9342009 193,551 0 0 -193,551 -118,505 -797,4392010 125,020 207,180 0 0 -207,180 -116,890 -914,3292011 201,787 0 0 -201,787 -104,910 -1,019,2392012 197,747 0 0 -197,747 -94,737 -1,113,9762013 193,658 0 0 -193,658 -85,494 -1,199,4702014 189,522 0 0 -189,522 -77,100 -1,276,5702015 185,343 0 0 -185,343 -69,480 -1,346,0502016 133,741 199,650 0 0 -199,650 -68,967 -1,415,0172017 193,619 0 0 -193,619 -61,633 -1,476,6492018 189,044 0 0 -189,044 -55,452 -1,532,1012019 184,426 0 0 -184,426 -49,850 -1,581,9512020 179,768 0 0 -179,768 -44,776 -1,626,7272021 175,072 0 0 -175,072 -40,183 -1,666,9102022 170,337 0 0 -170,337 -36,027 -1,702,9372023 165,567 0 0 -165,567 -32,268 -1,735,2052024 160,762 0 0 -160,762 -28,872 -1,764,0772025 155,924 0 0 -155,924 -25,805 -1,789,8822026 151,055 0 0 -151,055 -23,036 -1,812,9182027 146,155 0 0 -146,155 -20,539 -1,833,4572028 141,225 0 0 -141,225 -18,288 -1,851,7452029 136,268 0 0 -136,268 -16,261 -1,868,0062030 131,283 0 0 -131,283 -14,436 -1,882,4422031 126,273 0 0 -126,273 -12,795 -1,895,2372032 121,237 0 0 -121,237 -11,320 -1,906,5572033 116,178 0 0 -116,178 -9,996 -1,916,5532034 87,007 0 0 -87,007 -6,898 -1,923,4512035 93,688 0 0 -93,688 -6,845 -1,930,2962036 89,599 0 0 -89,599 -6,032 -1,936,3292037 85,492 0 0 -85,492 -5,304 -1,941,6322038 81,368 0 0 -81,368 -4,652 -1,946,2842039 77,229 0 0 -77,229 -4,068 -1,950,3532040 73,074 0 0 -73,074 -3,547 -1,953,9002041 68,905 0 0 -68,905 -3,082 -1,956,9822042 58,737 0 0 -58,737 -2,421 -1,959,403
CAPITAL EXPENDITURE IN YEAR BY ASSET TYPE

Present Worth Analysis - Alternative #2 - High Forecast
Weighted Average Incremental Cost of Capital 8.52%Escalation Rate 1.70%
Capital Operating Operating Net Present CumulativeRevenue Costs Benefits Benefit Worth Present
Substation Distribution Requirement Benefit WorthBenefit
38.5 yrs 30.4 yrs4% CCA 4% CCA
YEAR
2004 106,000 342,000 65,567 0 0 -65,567 -60,420 -60,4202005 183,060 86,619 0 0 -86,619 -73,552 -133,9712006 82,885 0 0 -82,885 -64,856 -198,8272007 81,184 0 0 -81,184 -58,537 -257,3642008 79,462 0 0 -79,462 -52,797 -310,1612009 77,720 0 0 -77,720 -47,585 -357,7462010 75,959 0 0 -75,959 -42,856 -400,6022011 74,180 0 0 -74,180 -38,566 -439,1682012 1,355,805 260,228 0 0 -260,228 -124,671 -563,8392013 240,492 0 0 -240,492 -106,170 -670,0092014 235,901 0 0 -235,901 -95,967 -765,9762015 231,249 0 0 -231,249 -86,689 -852,6652016 138,327 245,703 0 0 -245,703 -84,876 -937,5412017 239,108 0 0 -239,108 -76,113 -1,013,6532018 234,004 0 0 -234,004 -68,640 -1,082,2932019 228,844 0 0 -228,844 -61,856 -1,144,1502020 223,630 0 0 -223,630 -55,701 -1,199,8512021 218,363 0 0 -218,363 -50,119 -1,249,9702022 213,046 0 0 -213,046 -45,060 -1,295,0302023 207,681 0 0 -207,681 -40,476 -1,335,5062024 202,269 0 0 -202,269 -36,327 -1,371,8322025 196,813 0 0 -196,813 -32,572 -1,404,4042026 191,314 0 0 -191,314 -29,176 -1,433,5802027 185,775 0 0 -185,775 -26,107 -1,459,6862028 180,196 0 0 -180,196 -23,335 -1,483,0212029 174,579 0 0 -174,579 -20,832 -1,503,8532030 168,926 0 0 -168,926 -18,575 -1,522,4282031 163,238 0 0 -163,238 -16,540 -1,538,9692032 157,517 0 0 -157,517 -14,708 -1,553,6772033 151,764 0 0 -151,764 -13,058 -1,566,7352034 118,959 0 0 -118,959 -9,432 -1,576,1662035 111,902 0 0 -111,902 -8,176 -1,584,3422036 114,298 0 0 -114,298 -7,695 -1,592,0372037 110,216 0 0 -110,216 -6,838 -1,598,8752038 106,112 0 0 -106,112 -6,066 -1,604,9412039 101,989 0 0 -101,989 -5,373 -1,610,3142040 97,846 0 0 -97,846 -4,750 -1,615,0642041 93,684 0 0 -93,684 -4,191 -1,619,2552042 83,520 0 0 -83,520 -3,443 -1,622,697
CAPITAL EXPENDITURE IN YEAR BY ASSET T
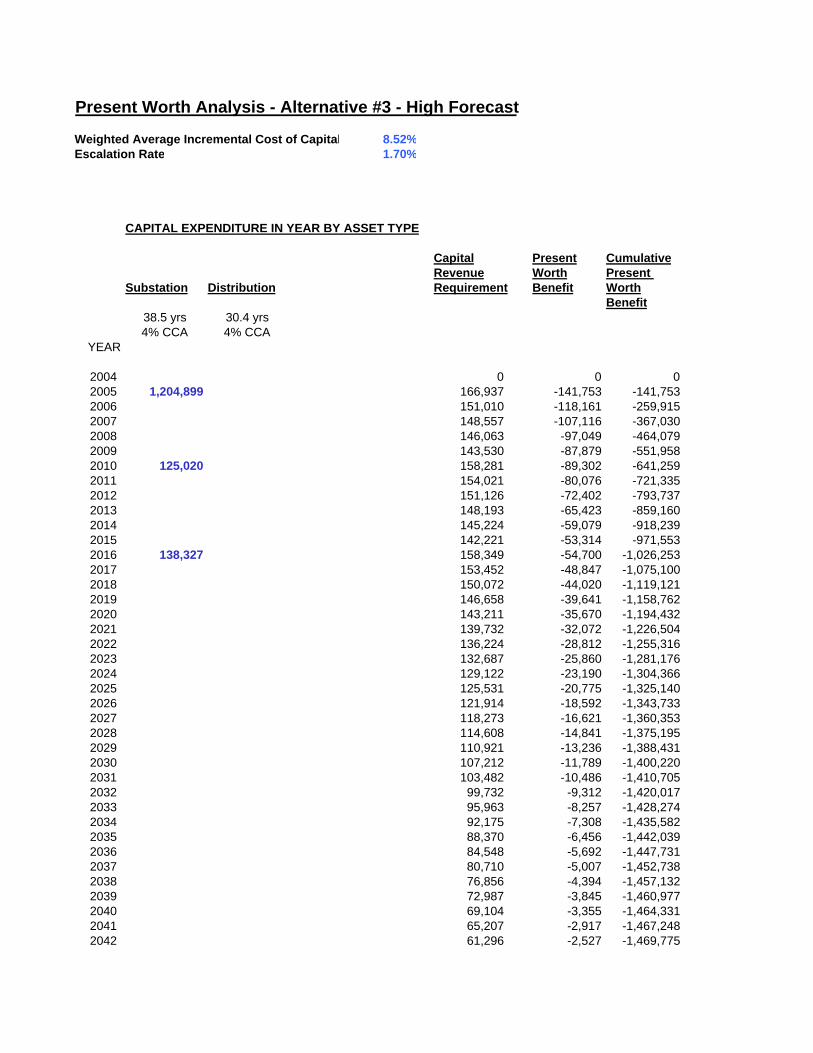
Present Worth Analysis - Alternative #3 - High Forecast
Weighted Average Incremental Cost of Capital 8.52%Escalation Rate 1.70%
Capital Present CumulativeRevenue Worth Present
Substation Distribution Requirement Benefit WorthBenefit
38.5 yrs 30.4 yrs4% CCA 4% CCA
YEAR
2004 0 0 02005 1,204,899 166,937 -141,753 -141,7532006 151,010 -118,161 -259,9152007 148,557 -107,116 -367,0302008 146,063 -97,049 -464,0792009 143,530 -87,879 -551,9582010 125,020 158,281 -89,302 -641,2592011 154,021 -80,076 -721,3352012 151,126 -72,402 -793,7372013 148,193 -65,423 -859,1602014 145,224 -59,079 -918,2392015 142,221 -53,314 -971,5532016 138,327 158,349 -54,700 -1,026,2532017 153,452 -48,847 -1,075,1002018 150,072 -44,020 -1,119,1212019 146,658 -39,641 -1,158,7622020 143,211 -35,670 -1,194,4322021 139,732 -32,072 -1,226,5042022 136,224 -28,812 -1,255,3162023 132,687 -25,860 -1,281,1762024 129,122 -23,190 -1,304,3662025 125,531 -20,775 -1,325,1402026 121,914 -18,592 -1,343,7332027 118,273 -16,621 -1,360,3532028 114,608 -14,841 -1,375,1952029 110,921 -13,236 -1,388,4312030 107,212 -11,789 -1,400,2202031 103,482 -10,486 -1,410,7052032 99,732 -9,312 -1,420,0172033 95,963 -8,257 -1,428,2742034 92,175 -7,308 -1,435,5822035 88,370 -6,456 -1,442,0392036 84,548 -5,692 -1,447,7312037 80,710 -5,007 -1,452,7382038 76,856 -4,394 -1,457,1322039 72,987 -3,845 -1,460,9772040 69,104 -3,355 -1,464,3312041 65,207 -2,917 -1,467,2482042 61,296 -2,527 -1,469,775
CAPITAL EXPENDITURE IN YEAR BY ASSET TYPE
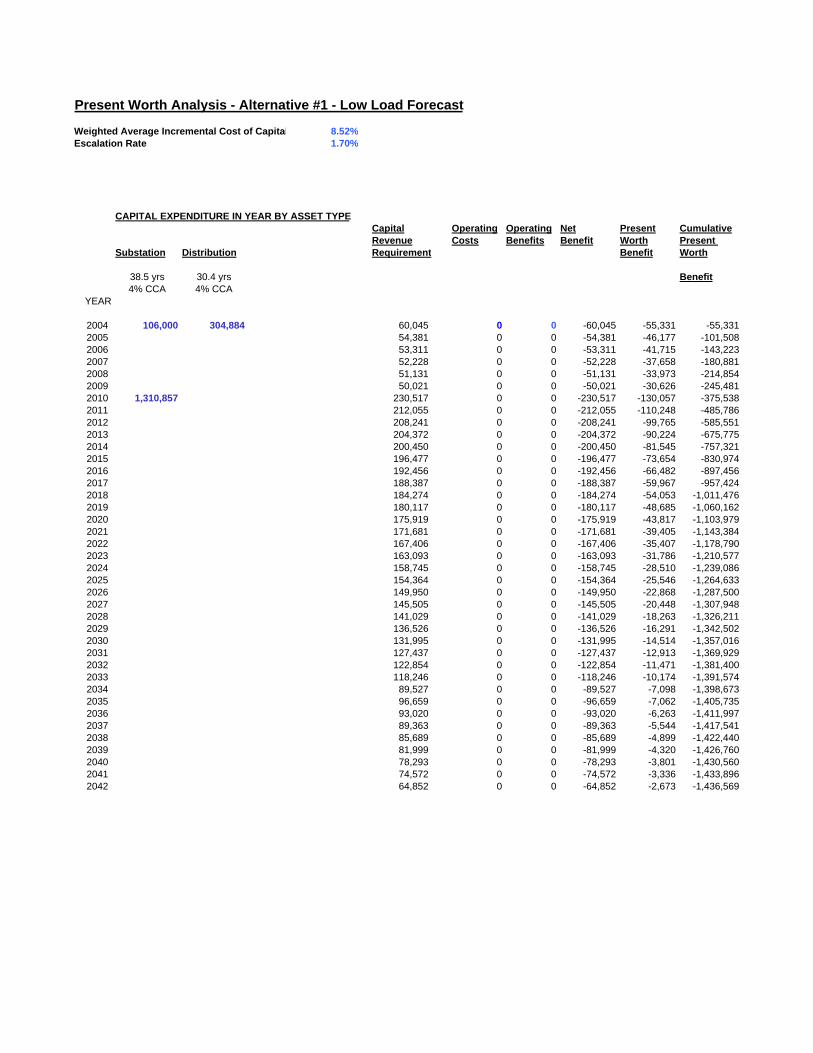
Present Worth Analysis - Alternative #1 - Low Load Forecast
Weighted Average Incremental Cost of Capital 8.52%Escalation Rate 1.70%
Capital Operating Operating Net Present CumulativeRevenue Costs Benefits Benefit Worth Present
Substation Distribution Requirement Benefit Worth
38.5 yrs 30.4 yrs Benefit4% CCA 4% CCA
YEAR
2004 106,000 304,884 60,045 0 0 -60,045 -55,331 -55,3312005 54,381 0 0 -54,381 -46,177 -101,5082006 53,311 0 0 -53,311 -41,715 -143,2232007 52,228 0 0 -52,228 -37,658 -180,8812008 51,131 0 0 -51,131 -33,973 -214,8542009 50,021 0 0 -50,021 -30,626 -245,4812010 1,310,857 230,517 0 0 -230,517 -130,057 -375,5382011 212,055 0 0 -212,055 -110,248 -485,7862012 208,241 0 0 -208,241 -99,765 -585,5512013 204,372 0 0 -204,372 -90,224 -675,7752014 200,450 0 0 -200,450 -81,545 -757,3212015 196,477 0 0 -196,477 -73,654 -830,9742016 192,456 0 0 -192,456 -66,482 -897,4562017 188,387 0 0 -188,387 -59,967 -957,4242018 184,274 0 0 -184,274 -54,053 -1,011,4762019 180,117 0 0 -180,117 -48,685 -1,060,1622020 175,919 0 0 -175,919 -43,817 -1,103,9792021 171,681 0 0 -171,681 -39,405 -1,143,3842022 167,406 0 0 -167,406 -35,407 -1,178,7902023 163,093 0 0 -163,093 -31,786 -1,210,5772024 158,745 0 0 -158,745 -28,510 -1,239,0862025 154,364 0 0 -154,364 -25,546 -1,264,6332026 149,950 0 0 -149,950 -22,868 -1,287,5002027 145,505 0 0 -145,505 -20,448 -1,307,9482028 141,029 0 0 -141,029 -18,263 -1,326,2112029 136,526 0 0 -136,526 -16,291 -1,342,5022030 131,995 0 0 -131,995 -14,514 -1,357,0162031 127,437 0 0 -127,437 -12,913 -1,369,9292032 122,854 0 0 -122,854 -11,471 -1,381,4002033 118,246 0 0 -118,246 -10,174 -1,391,5742034 89,527 0 0 -89,527 -7,098 -1,398,6732035 96,659 0 0 -96,659 -7,062 -1,405,7352036 93,020 0 0 -93,020 -6,263 -1,411,9972037 89,363 0 0 -89,363 -5,544 -1,417,5412038 85,689 0 0 -85,689 -4,899 -1,422,4402039 81,999 0 0 -81,999 -4,320 -1,426,7602040 78,293 0 0 -78,293 -3,801 -1,430,5602041 74,572 0 0 -74,572 -3,336 -1,433,8962042 64,852 0 0 -64,852 -2,673 -1,436,569
CAPITAL EXPENDITURE IN YEAR BY ASSET TYPE

Present Worth Analysis - Alternative #2 - Low Forecast
Weighted Average Incremental Cost of Capital 8.52%Escalation Rate 1.70%
Capital Operating Operating Net Present CumulativeRevenue Costs Benefits Benefit Worth Present
Substation Distribution Requirement Benefit WorthBenefit
38.5 yrs 30.4 yrs4% CCA 4% CCA
YEAR
2004 106,000 342,000 65,567 0 0 -65,567 -60,420 -60,4202005 59,384 0 0 -59,384 -50,425 -110,8452006 58,210 0 0 -58,210 -45,548 -156,3932007 57,022 0 0 -57,022 -41,115 -197,5082008 55,818 0 0 -55,818 -37,088 -234,5952009 54,601 0 0 -54,601 -33,431 -268,0262010 53,371 0 0 -53,371 -30,112 -298,1372011 202,544 82,261 0 0 -82,261 -42,768 -340,9052012 78,173 0 0 -78,173 -37,451 -378,3562013 76,338 0 0 -76,338 -33,701 -412,0572014 74,485 0 0 -74,485 -30,301 -442,3592015 72,614 0 0 -72,614 -27,221 -469,5802016 70,727 0 0 -70,727 -24,432 -494,0122017 68,824 0 0 -68,824 -21,908 -515,9192018 66,905 0 0 -66,905 -19,625 -535,5452019 64,971 0 0 -64,971 -17,562 -553,1062020 63,023 0 0 -63,023 -15,698 -568,8042021 61,062 0 0 -61,062 -14,015 -582,8192022 59,087 0 0 -59,087 -12,497 -595,3162023 57,099 0 0 -57,099 -11,128 -606,4442024 55,100 0 0 -55,100 -9,896 -616,3402025 53,089 0 0 -53,089 -8,786 -625,1262026 51,066 0 0 -51,066 -7,788 -632,9132027 49,033 0 0 -49,033 -6,891 -639,8042028 46,990 0 0 -46,990 -6,085 -645,8892029 44,937 0 0 -44,937 -5,362 -651,2512030 42,874 0 0 -42,874 -4,714 -655,9662031 40,803 0 0 -40,803 -4,134 -660,1002032 38,722 0 0 -38,722 -3,616 -663,7162033 36,633 0 0 -36,633 -3,152 -666,8682034 7,515 0 0 -7,515 -596 -667,4642035 18,631 0 0 -18,631 -1,361 -668,8252036 17,680 0 0 -17,680 -1,190 -670,0152037 16,726 0 0 -16,726 -1,038 -671,0532038 15,769 0 0 -15,769 -901 -671,9542039 14,808 0 0 -14,808 -780 -672,7342040 13,843 0 0 -13,843 -672 -673,4062041 -3,127 0 0 3,127 140 -673,2672042 -2,253 0 0 2,253 93 -673,174
CAPITAL EXPENDITURE IN YEAR BY ASSET T
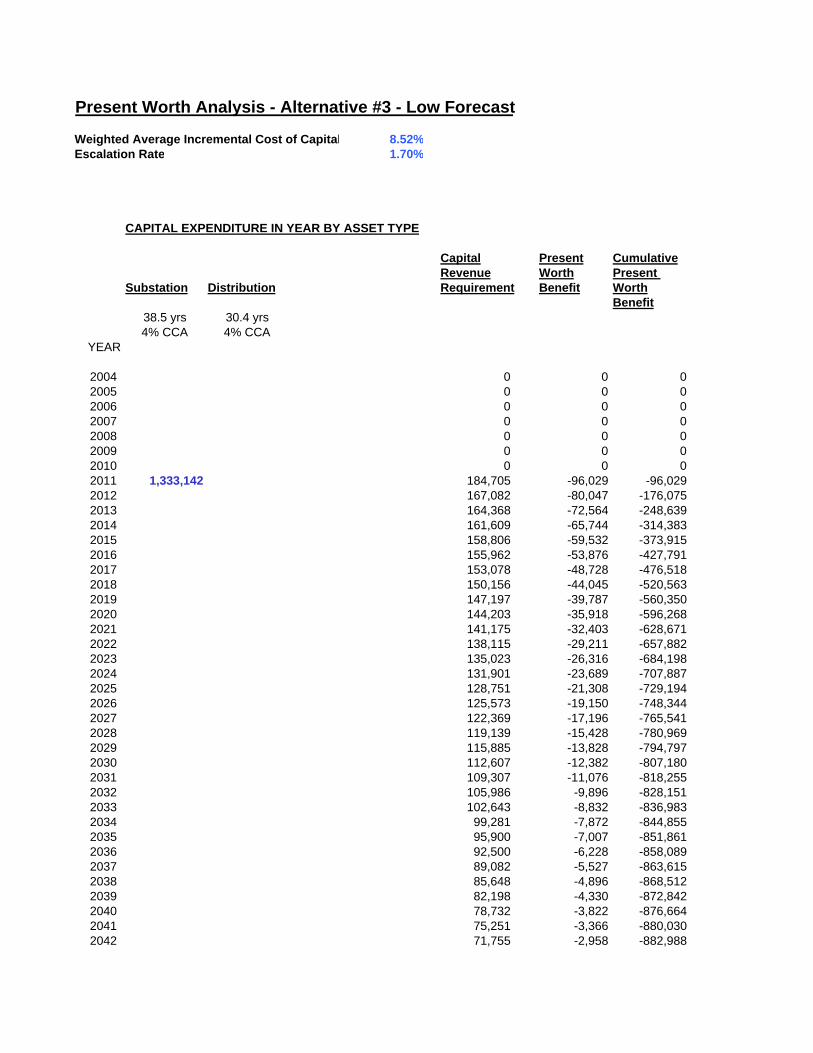
Present Worth Analysis - Alternative #3 - Low Forecast
Weighted Average Incremental Cost of Capital 8.52%Escalation Rate 1.70%
Capital Present CumulativeRevenue Worth Present
Substation Distribution Requirement Benefit WorthBenefit
38.5 yrs 30.4 yrs4% CCA 4% CCA
YEAR
2004 0 0 02005 0 0 02006 0 0 02007 0 0 02008 0 0 02009 0 0 02010 0 0 02011 1,333,142 184,705 -96,029 -96,0292012 167,082 -80,047 -176,0752013 164,368 -72,564 -248,6392014 161,609 -65,744 -314,3832015 158,806 -59,532 -373,9152016 155,962 -53,876 -427,7912017 153,078 -48,728 -476,5182018 150,156 -44,045 -520,5632019 147,197 -39,787 -560,3502020 144,203 -35,918 -596,2682021 141,175 -32,403 -628,6712022 138,115 -29,211 -657,8822023 135,023 -26,316 -684,1982024 131,901 -23,689 -707,8872025 128,751 -21,308 -729,1942026 125,573 -19,150 -748,3442027 122,369 -17,196 -765,5412028 119,139 -15,428 -780,9692029 115,885 -13,828 -794,7972030 112,607 -12,382 -807,1802031 109,307 -11,076 -818,2552032 105,986 -9,896 -828,1512033 102,643 -8,832 -836,9832034 99,281 -7,872 -844,8552035 95,900 -7,007 -851,8612036 92,500 -6,228 -858,0892037 89,082 -5,527 -863,6152038 85,648 -4,896 -868,5122039 82,198 -4,330 -872,8422040 78,732 -3,822 -876,6642041 75,251 -3,366 -880,0302042 71,755 -2,958 -882,988
CAPITAL EXPENDITURE IN YEAR BY ASSET TYPE
Appendix E
Alternative Detailed Costs and Scheduling
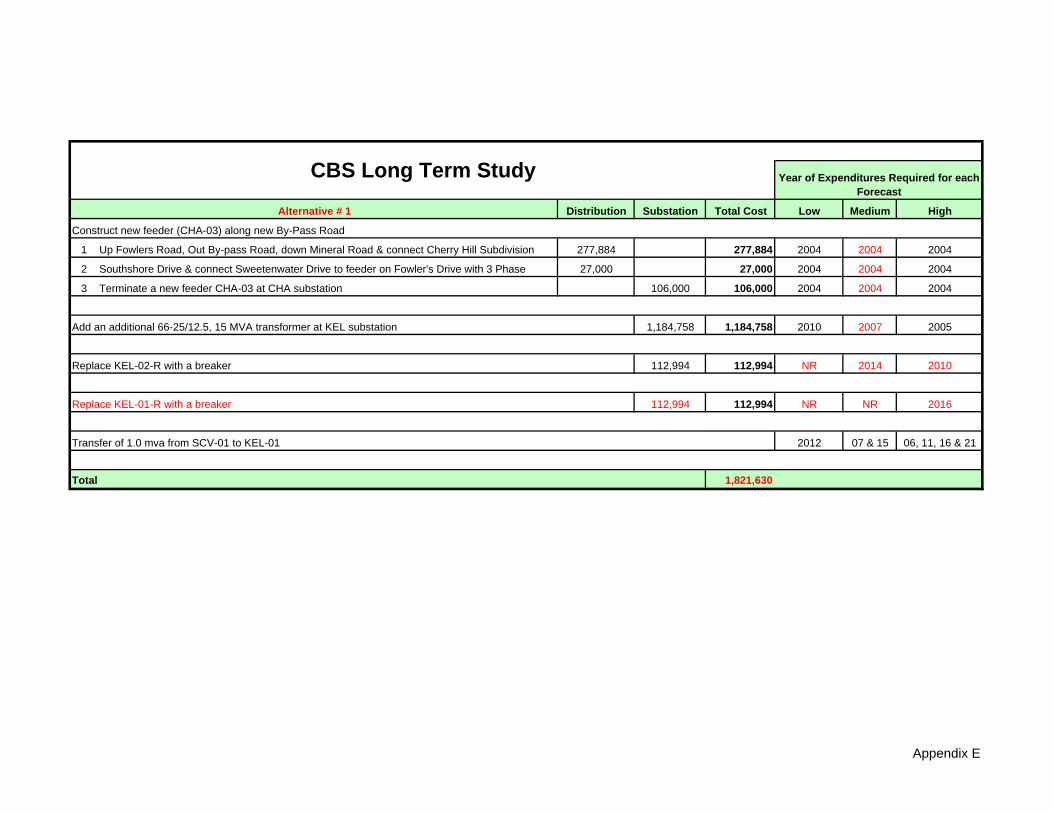
Distribution Substation Total Cost Low Medium High
1 Up Fowlers Road, Out By-pass Road, down Mineral Road & connect Cherry Hill Subdivision 277,884 277,884 2004 2004 2004
2 Southshore Drive & connect Sweetenwater Drive to feeder on Fowler's Drive with 3 Phase 27,000 27,000 2004 2004 2004
3 Terminate a new feeder CHA-03 at CHA substation 106,000 106,000 2004 2004 2004
1,184,758 1,184,758 2010 2007 2005
112,994 112,994 NR 2014 2010
112,994 112,994 NR NR 2016
Transfer of 1.0 mva from SCV-01 to KEL-01 2012 07 & 15 06, 11, 16 & 21
1,821,630
CBS Long Term Study Year of Expenditures Required for each Forecast
Alternative # 1
Construct new feeder (CHA-03) along new By-Pass Road
Total
Replace KEL-01-R with a breaker
Add an additional 66-25/12.5, 15 MVA transformer at KEL substation
Replace KEL-02-R with a breaker
Appendix E
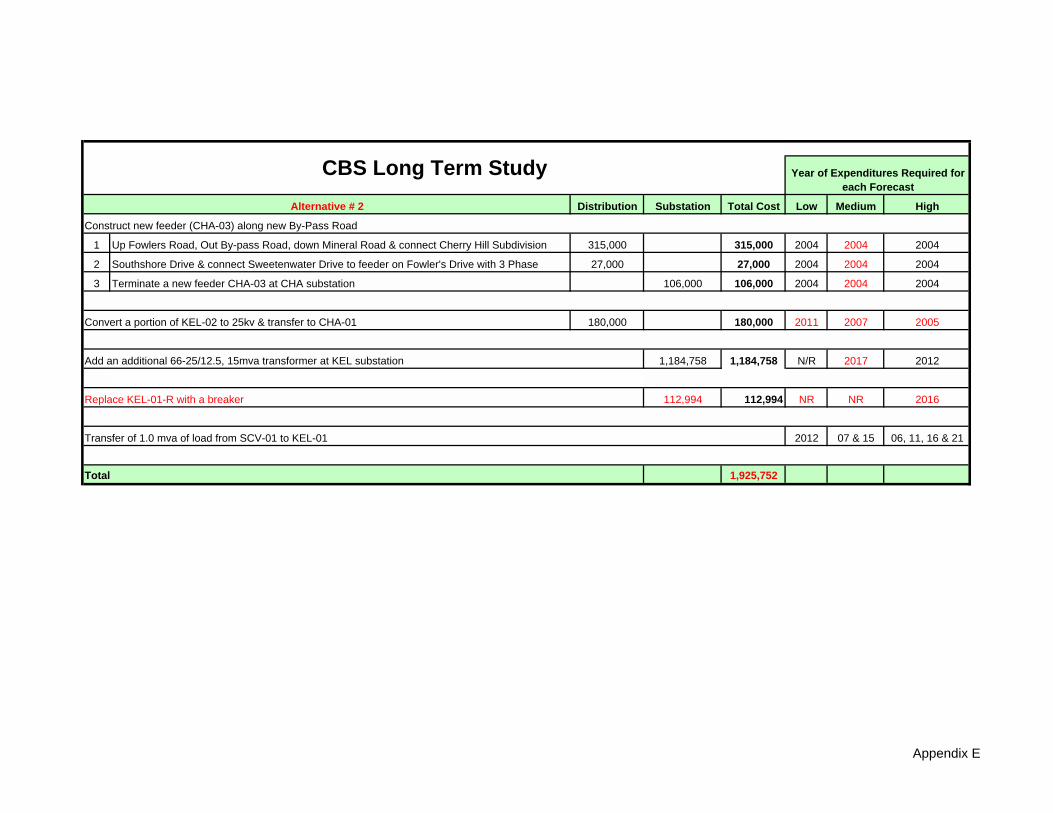
Distribution Substation Total Cost Low Medium High
1 Up Fowlers Road, Out By-pass Road, down Mineral Road & connect Cherry Hill Subdivision 315,000 315,000 2004 2004 2004
2 Southshore Drive & connect Sweetenwater Drive to feeder on Fowler's Drive with 3 Phase 27,000 27,000 2004 2004 2004
3 Terminate a new feeder CHA-03 at CHA substation 106,000 106,000 2004 2004 2004
180,000 180,000 2011 2007 2005
1,184,758 1,184,758 N/R 2017 2012
112,994 112,994 NR NR 2016
Transfer of 1.0 mva of load from SCV-01 to KEL-01 2012 07 & 15 06, 11, 16 & 21
1,925,752Total
Convert a portion of KEL-02 to 25kv & transfer to CHA-01
Add an additional 66-25/12.5, 15mva transformer at KEL substation
Replace KEL-01-R with a breaker
CBS Long Term Study Year of Expenditures Required for each Forecast
Alternative # 2
Construct new feeder (CHA-03) along new By-Pass Road
Appendix E
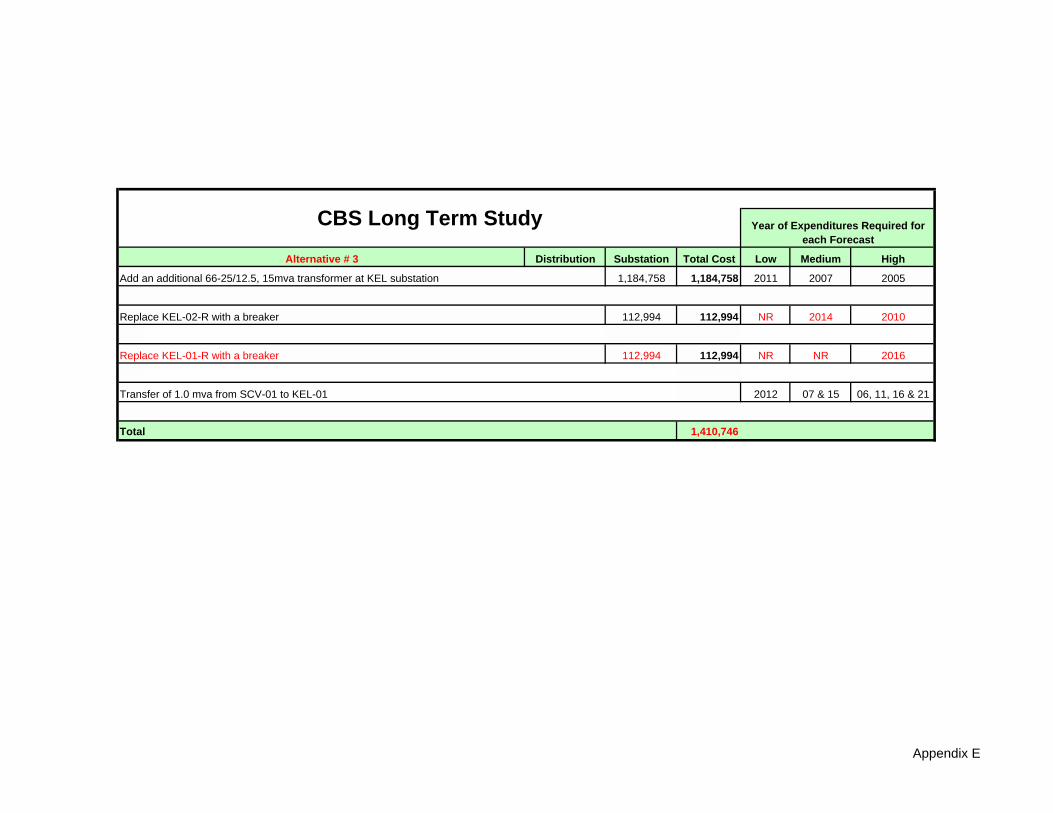
Distribution Substation Total Cost Low Medium High
1,184,758 1,184,758 2011 2007 2005
112,994 112,994 NR 2014 2010
112,994 112,994 NR NR 2016
Transfer of 1.0 mva from SCV-01 to KEL-01 2012 07 & 15 06, 11, 16 & 21
1,410,746Total
Add an additional 66-25/12.5, 15mva transformer at KEL substation
CBS Long Term Study Year of Expenditures Required for each Forecast
Alternative # 3
Replace KEL-01-R with a breaker
Replace KEL-02-R with a breaker
Appendix E

General Property Appendix 1
NP 2004 CBA
Newfoundland Power – 2004 Capital Budget Application Page 1 of 3
Project Title: Tools & Equipment Location: Company offices, service buildings and vehicles Classification: General Property Project Cost: $535,000 --------------------------------------------------------------------------------------------------------------------- This project consists of a number of items as noted. (a) Regional Tools and Equipment
Cost: $235,000
Description: Replacement of tools and equipment utilized by line and support staff in the day-to-day operations of the Company. Operating Experience: Line tools and equipment include those used by line staff, electrical maintenance staff, and engineering and field technical staff. These tools are maintained on a regular basis, however, over time they degrade and wear out, especially hot line equipment which must meet rigorous safety requirements. Concerns have also been expressed by linepersons related to the difficulty of using certain types of cutting & compression hand tools. Where feasible, such tools will be replaced with battery and hydraulic alternatives to improve productivity and working conditions.
Justification: Proper tools and equipment are required for the efficient and effective management of the electrical system as well as the safety of line workers and the public.
(b) Head Office Tools & Equipment
Cost: $250,000
General Property Appendix 1
NP 2004 CBA
Newfoundland Power – 2004 Capital Budget Application Page 2 of 3
Description: This project includes both engineering test equipment and tools typically used by electrical maintenance personnel. Engineering test equipment includes items to perform systems calibration, commissioning and testing of protection equipment and data communications testing and analysis. The 2004 equipment requirements are one Relay Test Set, one Antenna Tester, and one Communication Protocol Test set. Equipment for the electrical maintenance personnel is required for staff at the Electrical Maintenance Centre (EMC) and at various smaller shops across the island. The following are the items required for 2004:
1 – Motion Analyzer (c/w adaptors and controller) 1 – Transformer Turns Ratio Tester 3 – 10 A Ductor (c/w long leads) 2 – 5 kV Megger 1 – Oil Test Set 2 – Compression Tool 1 – Metal thickness Meter 3 – 1 kV Handheld Megger / Multimeter 1 – 20" 30 ton Spreader Bar 1 – Variac 1 – Load Cell Tester
Operating Experience: Engineering test equipment is used to verify the operation of the protection and remote control of the power system. The protection and remote control is required to create a safe working environment for field staff. The relay test equipment is used to verify a protection system’s operation prior to its going into service and to diagnose problems once the protection equipment is in operation.
Engineering test equipment is also required to verify data communications systems for wireless communications and serial communications. The antenna system test equipment is used to verify proper installation and operation of antenna systems. Newfoundland Power is using wireless communications for SCADA control in a number of areas. At present we do not have test equipment of this type so the response to correcting problems is not optimum. The PC-based protocol analyzer is used for serial communications installations and for trouble shooting the SCADA remote control systems. The electrical maintenance group is responsible for the integrity and reliability of the equipment located in 137 substations across the Company’s service territory. The electrical maintenance equipment includes power transformers, breakers, reclosers, voltage regulators, metering tanks, three phase pad mount transformers and step down
General Property Appendix 1
NP 2004 CBA
Newfoundland Power – 2004 Capital Budget Application Page 3 of 3
transformers. The main repair facility is the EMC while smaller repair shops are located at other strategic geographic locations. Diagnostic testing and repair of the various types of equipment requires specialized tools and test equipment such as circuit breaker motion analyzers, insulation resistance testers (meggers), oil dielectric testers, recloser testers, transformer ratio testers, low resistance ohmmeters (ductors), SF6 gas reclaimers, vacuum pumps, oil filters, hand held gas monitors, potential indicators, fault locators, battery testers, etc. Innovations in tools and test equipment often lead to better diagnostic tools that result in less equipment failures. As well, normal deterioration and the inability to maintain obsolete test equipment require that some of these items be replaced every year.
Justification: The test equipment noted above are the base tools required to design, verify and maintain reliable operation of the electric power system and associated equipment. The relay test set is required to design, verify and maintain a reliable protection system that properly isolates power system faults and maintains worker safety. The communications test equipment is required to design, verify and maintain a reliable SCADA communications network. The electrical maintenance test equipment is required to ensure the integrity and reliability of the equipment located in the Company’s 137 substations across its service territory.
(c) Furniture
Cost: $50,000
Description: Replacement of chairs and furniture that have deteriorated.
Operating Experience: The Company has approximately 660 full time employee equivalents. The office furniture utilized by these employees deteriorates through normal use and needs to be replaced.
Justification: Proper furniture is necessary for a safe and productive work environment.
General Property Appendix 2
NP 2004 CBA
Newfoundland Power – 2004 Capital Budget Application Page 1 of 1
Project Title: Real Property Location: Electrical Maintenance Facility, Salt Pond Service Building, Gander
Office, Corner Brook Service Building, And Stephenville Office Classification: General Property Project Cost: $174,000 This project consists of 1 item greater than $50,000 and several items estimated at less than $50,000 each.
(a) Stephenville – Replace Roof
Cost: $65,000
Description: Replace the roof of the Stephenville office building.
Operating Experience: The existing roof has developed leaks and is showing signs of damage. Following a severe windstorm in the spring of 2003 approximately 3000 sq ft had to be replaced.
Justification: In order to provide a safe and healthy work environment the existing roof system has to be replaced. The existing system was damaged by high winds (winter 2003) and 3000 sq ft. has been replaced. The remainder of the roof was identified at that time to be in jeopardy of failing if not replaced.
(b) Projects < $50,000. Cost: $109,000 Description: Listed are projects estimated at less than $50,000.
1. Gander – Replace Roof 2. Electrical Maintenance Facility – Retractable Enclosure 3. Salt Pond – Renovations to Service Building
4. Corner Brook – Transformer Ramp
Transportation Appendix 1
NP 2004 CBA
Newfoundland Power – 2004 Capital Budget Application Page 1 of 1
Project Title: Purchase Vehicles and Aerial Devices Location: Various Classification: Transportation Project Cost: $3,487,000 Operating Experience: See Volume III, Transportation, Appendix 1, Attachment A for details on the vehicles being replaced in 2004.
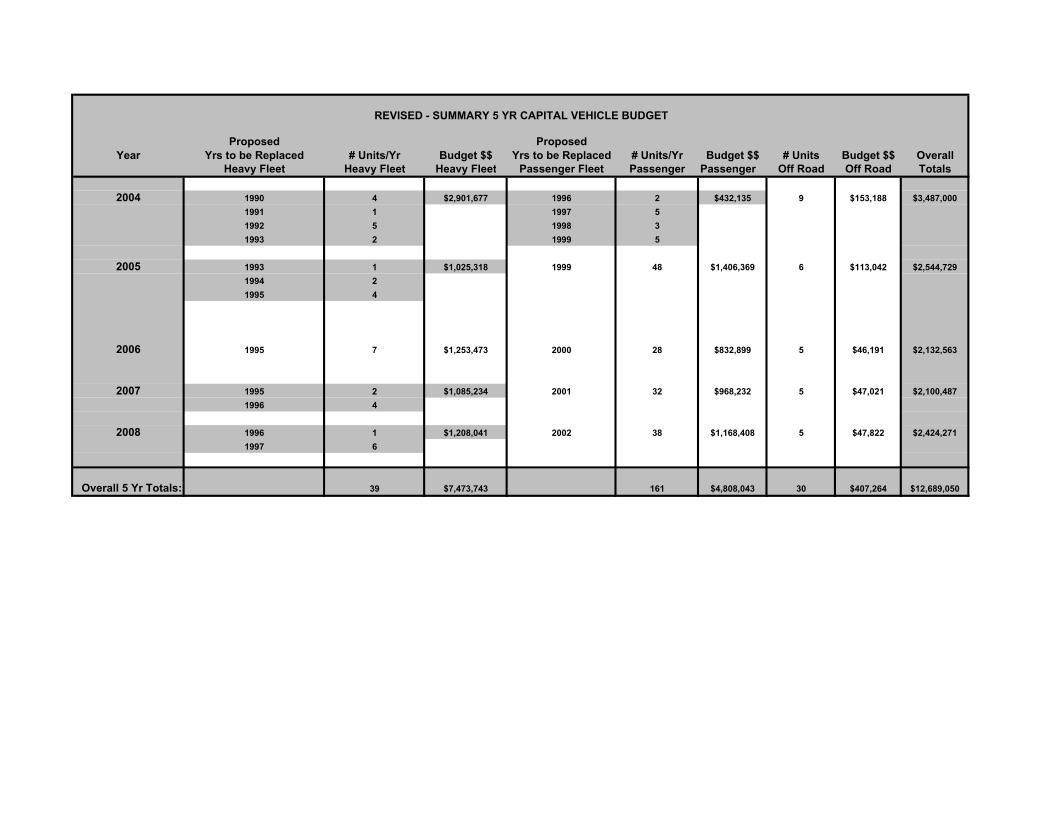
Proposed ProposedYear Yrs to be Replaced # Units/Yr Budget $$ Yrs to be Replaced # Units/Yr Budget $$ # Units Budget $$ Overall
Heavy Fleet Heavy Fleet Heavy Fleet Passenger Fleet Passenger Passenger Off Road Off Road Totals
2004 1990 4 $2,901,677 1996 2 $432,135 9 $153,188 $3,487,0001991 1 1997 51992 5 1998 31993 2 1999 5
2005 1993 1 $1,025,318 1999 48 $1,406,369 6 $113,042 $2,544,7291994 21995 4
2006 1995 7 $1,253,473 2000 28 $832,899 5 $46,191 $2,132,563
2007 1995 2 $1,085,234 2001 32 $968,232 5 $47,021 $2,100,4871996 4
2008 1996 1 $1,208,041 2002 38 $1,168,408 5 $47,822 $2,424,2711997 6
Overall 5 Yr Totals: 39 $7,473,743 161 $4,808,043 30 $407,264 $12,689,050
REVISED - SUMMARY 5 YR CAPITAL VEHICLE BUDGET

DETAILS - 2004 CAPITAL VEHICLE BUDGET
Heavy FleetLast Odom Odom Maint Hist
Unit # Dept Name Year Make/Model Vehicle Type Aerial Info Reading Date Reading May 02-Apr 03066B EASTERN ST. JOHN'S 1990 GMC CAB & CHASSIS Light Duty Aerial May-03 123521 $14,166.64113B EASTERN ST. JOHN'S 1990 INTERNATIONAL Medium Duty Aerial Altec 450H DBL Bucket Material Handler May-03 161803 $23,894.24311B WESTERN CLARENVILLE 1990 INTERNATIONAL Medium Duty Aerial Altec 450H DBL Bucket Material Handler May-03 257397 $8,862.11354B WESTERN CLARENVILLE 1990 INTERNATIONAL Medium Duty Aerial Pitman 1342 Digger Derrick May-03 193227 $12,096.33088B WESTERN STEPHENVILLE 1991 INTERNATIONAL C&C Medium Duty Aerial Altec AM450H Material Handler May-03 103487 $23,507.83135C WESTERN STEPHENVILLE 1992 GMC TOPKICK CAB & CHASSIS Medium Duty Aerial Altec AM550H DBL Bucket Material Handler May-03 319979 $19,685.56116B WESTERN CLARENVILLE 1992 GMC TOPKICK CAB & CHASSIS Medium Duty Aerial Altec 550H DBL Bucket Material Handler May-03 208993 $16,747.87008C WESTERN GANDER 1992 INTERNATIONAL C&C Medium Duty Aerial Altec Am438H Material Handler May-03 309868 $21,866.55245B EASTERN CARBONEAR 1992 GMC TOPKICK CAB & CHASSIS Medium Duty Aerial Altec 550H DBL Bucket Material Handler May-03 231505 $17,134.87277B WESTERN GRAND FALLS 1992 GMC TOPKICK CAB & CHASSIS Medium Duty Aerial Altec AM550H DBL Bucket Material Handler May-03 207021 $18,055.57355C WESTERN GANDER 1993 INTERNATIONAL C&C Medium Duty Aerial Altec AM550H DBL Bucket Material Handler May-03 287022 $26,269.30218B WESTERN GRAND FALLS 1993 FREIGHTLINER Medium Duty Aerial Altec Am438H Material Handler May-03 199976 $31,141.01
Totals: 12
PassengerLast Odom Odom Maint Hist
Unit # Dept Name Year Make Model Vehicle Type Reading Date Reading May 02-Apr 03117D EASTERN ST. JOHN'S 1996 FORD TRUCK RANGER P/UP LIGHT DUTY TRUCK 2003/05/05 142120 $1,637.06317C MATERIALS MANAGEMENT 1996 FORD TRUCK E150 C/V VAN 2003/03/07 63967 $1,693.49151D HUMAN RESOURCES 1997 FORD TRUCK WINDSTAR VAN 2003/04/22 152240 $2,153.48714A MATERIALS MANAGEMENT 1997 PONTIAC TRANSPORT VAN 2003/04/28 99763 $2,036.04111C EASTERN ST. JOHN'S 1997 FORD TRUCK F150 P/UP LIGHT DUTY TRUCK 2003/05/05 164840 $1,982.27234D EASTERN CARBONEAR 1997 CHEVROLET CHEV S10 4X4 LIGHT DUTY TRUCK 2003/04/03 157484 $3,064.80288B WESTERN GANDER 1997 FORD TRUCK RANGER P/ LIGHT DUTY TRUCK 2003/03/31 155870 $2,510.42264D INFORMATION SYSTEMS 1998 CHEVROLET BLAZER 4X SUV 2003/03/21 203350 $1,710.88361D EASTERN ST. JOHN'S 1998 FORD TRUCK F150 P/UP LIGHT DUTY TRUCK 2003/03/19 176410 $3,339.83089D WESTERN GRAND FALLS 1998 FORD TRUCK FORD F150 LIGHT DUTY TRUCK 2003/03/21 169980 $4,007.62297E EASTERN BURIN 1999 CHEVROLET CHEV S10 LIGHT DUTY TRUCK 2003/04/25 169380 $9,117.05212E WESTERN CLARENVILLE 1999 FORD TRUCK F150 P/UP LIGHT DUTY TRUCK 2003/05/08 180930 $5,428.95239C WESTERN STEPHENVILLE 1999 DODGE TRUCK RAM 1500 LIGHT DUTY TRUCK 2003/03/14 189040 $6,599.66185D EASTERN BURIN 1999 DODGE TRUCK RAM 1500 LIGHT DUTY TRUCK 2002/12/16 158620 $6,904.68166E WESTERN GRAND FALLS 1999 CHEVROLET CHEV S10 LIGHT DUTY TRUCK 2003/05/07 193350 $6,796.56
Totals: 15
Off Road
Unit # Dept Name Unit Type Comments
EASTERN/ WESTERN 5 ATVsEASTERN/ WESTERN 3 SnowmobilesEASTERN 1 Reel Trailer
Totals: 9