New Zealand Regions, 1986-2001 Incomes - The University of Waikato
40
New Zealand Regions, 1986-2001: Incomes Pool, I., Baxendine, S., Cochrane, W., Lindop, J. University of Waikato Te Whare Wānanga ō Waikato HAMILTON NEW ZEALAND DISCUSSION PAPERS Population Studies Centre No 58 November 2005
Transcript of New Zealand Regions, 1986-2001 Incomes - The University of Waikato

New Zealand Regions, 1986-2001:
Incomes
Pool, I., Baxendine, S., Cochrane, W., Lindop, J.
University of Waikato
Te Whare Wānanga ō Waikato HAMILTON NEW ZEALAND
DISCUSSION
PAPERS
Population Studies Centre No 58 November 2005

The Population Studies Centre was established at the University of Waikato in 1982. POPULATIONS STUDIES CENTRE DISCUSSION PAPERS are intended as a forum for the publication of selected papers on research within the Centre, for the discussion and comment within the research community and among policy analysts prior to more formal refereeing and publication. Discussion Papers can be obtained in pdf form from the centre’s website at http://www.waikato.ac.nz/wfass/populationstudiescentre The views expressed in this discussion paper are those of the authors and do not reflect any official position on the part of the Centre. © Population Studies Centre University of Waikato Private Bag 3105 Hamilton New Zealand www.waikato.ac.nz/wfass/populationstudiescentre [email protected] ISBN: 1-877149-61-6
- i -
NEW ZEALAND REGIONS, 1986-2001:
INCOMES
Pool, I., Baxendine, S., Cochrane, W., Lindop, J.
November 2005 Abstract This paper investigates income trends in the Regions of New Zealand between 1986 and 2001. It also looks at additional factors of age and ethnicity which have a bearing on the results. Investigations of median, upper and lower quartiles and inter-quartile ranges of personal income calculated from census data showed increasing inequalities between the regions. The distribution of income around New Zealand is also investigated. Auckland and Wellington increasingly have higher incomes than the other regions. Keywords: Personal Income, Regions, New Zealand Acknowledgements Catherine Hodder, Jacquie Lidgard and Sarah Howard provided editing assistance. Support for this analysis comes from a grant from the Foundation for Research Science and Technology (FRST). This is part of the FRST-funded New Demographic Directions Programme. The paper will be included in a monograph entitled Developing Underdevelopment and Geographical Disparities: A Social Demography of New Zealand Regions. (Hamilton: Population Studies Centre) that will synthesise the results presented in topic-specific discussion papers. For a full list of this specific series, please see at the back of this booklet.
- ii -
Table of Contents Table of Contents....................................................................................................................... ii List of Tables ....................................................................................................................... ii List of Figures ...................................................................................................................... iii 1 Introduction .......................................................................................................................1 2 Incomes ........................................................................................................................1 3 Standardised Median Incomes and Change Over Time, 1986 to 2001 .............................3 3.1 Change in Median Income, 1986 to 2001................................................................5 3.2 Change in Median Income by Ethnicity, 1986 to 2001 ...........................................6 4 Regional Incomes by Age Group and Ethnicity between 1986 and 2001.........................9 4.1 Young Working Age Population (15-24 Years) ......................................................9 4.2 Middle Working Age Group (25-44 Years)...........................................................10 4.3 Mature Working Age Group (45-64 Years)...........................................................11 4.4 Income Differentials at Active Ages: a Summary .................................................11 4.5 Retired Age Group (65 Years and Over) ...............................................................12 5 Income by Labour Force Status by Age Group...............................................................13 5.1 Full-time Employed ...............................................................................................13 5.2 Part-time Employed ...............................................................................................15 6 Quartile Incomes .............................................................................................................17 6.1 Ethnicity .................................................................................................................20 7 Regional Gross Personal Incomes...................................................................................22 8 Conclusion ......................................................................................................................23 Appendix ......................................................................................................................25 References ......................................................................................................................31 List of Tables Table 1 Standardised Median Incomes (in 1996 Dollars), by Region, 1986-2001..............4 Table 2 Standardised Median Incomes (in 1996 Dollars), by Ethnicity and Region,
1986-2001 ...............................................................................................................7 Table 3 Median Incomes (in 1996 Dollars) by Age Group and Ethnicity, New Zealand,
1986-2001 ...............................................................................................................9 Table 4 Median Incomes (in 1996 Dollars) for those Employed Full-time, by Age Group
and Region, 1986-2001.........................................................................................14 Table 5 Median Incomes (in 1996 Dollars) for those Employed Part-time, by Age Group
and Region, 1986-2001.........................................................................................16 Table 6 Standardised Quartile Incomes and Inter-Quartile Ranges (in 1996 Dollars), by
Region, 1986-2001................................................................................................18 Table 7 Standardised Incomes (in 1996 Dollars) for Maori and Pakeha: Quartiles and
Inter-Quartile Ranges, by Region, 1986 and 2001 ...............................................21 Table 8 Income Distribution around New Zealand by Region, 1986 and 2001 ................22 Appendix Table 1 Percentage of Personal Income Not Specified by Age Group and
Overall Standardised Rate, New Zealand, 1986-2001..........................................25 Appendix Table 2 Standardised (including Ethnicity) Median Incomes (in 1996 Dollars),
Total Population, by Region, 1986 and 2001 .......................................................25 Appendix Table 3 Median Incomes (in 1996 Dollars) by Age Group and Region,
1996-2001 .............................................................................................................26

- iii -
Appendix Table 4 Median Incomes (in 1996 Dollars) by Age Group and Ethnicity, Urban Area of Auckland and Wellington Metropoli, Sub-regions of Bay of Plenty, 2001 ..........................................................................................................30
List of Figures Figure 1 Standardised Median Incomes (in 1996 Dollars) Difference from New Zealand, by Region, 1986 and 2001 .......................................................................................5 Figure 2 Standardised Inter-Quartile Ranges for Personal Income (1996 Dollars), by
Region, 1986-2001.................................................................................................19


- 1 -
1. Introduction This working paper is part of a large project, funded by the Foundation for Research, Science and Technology (FoRST), being undertaken by the Population Studies Centre. This project explores the links between different sorts of population transitions, social transformations of various kinds and changes in the political economy of New Zealand’s regions between the 1980s and the dawn of the 21st century. It relates to a period of rapid change at the end of which the regional architecture of the country was very different from the way it had been in 1985. The trends also represented a radical departure from what preceded these last two decades. This particular discussion paper, using data from the five yearly Census of Population and Dwellings collected by Statistics New Zealand, examines the personal income of the population between regions in New Zealand1. 2. Incomes2 A rise in income inequality in New Zealand over the period 1986-96 has been well documented (for example, Department of Statistics 1991; Martin 1997; Martin 1998). Like numerous other topics of research most of the discussion and literature have been confined to the national level, a major exception to this being the papers by Karagedikli et al. (2000; 2003). Many factors have been cited as causing increases in income inequality, primarily restructuring and associated with this increasing unemployment, and changes in the age structure and composition of the population (Amey 1997; Dixon 1996; Easton 1996; Morrison 1996). The aim of this paper is to provide a description of regional income differentials between 1986 and 2001. There is no attempt to determine causes of income inequality. In some senses the present paper could be seen as being similar to studies by Karagedikli et al. (2000; 2003); our work was being carried out at roughly the same time, but this paper offers a contribution to a wide study of regional differences (Pool et al. forthcoming-a). We employed different and less refined indices – medians, quartiles etc. and against Gini coefficients – albeit that these indices all have common statistical bases. Despite some methodological differences our results essentially confirm theirs, which in itself is gratifying. This analysis of income trends is comprehensive, it details age and ethnic differences, even the summary rates used here are standardised to take age composition into account. This is important as New Zealand regions have markedly different age distributions (Pool et al 2005d). The period 1986 to 2001 has seen major restructuring in all public policy areas. Both endogenous and exogenous factors have led to these changes in New Zealand. Changes in the levels of incomes should be seen in light of these broader processes. Important factors that directly influence changes in incomes are the social processes of work. Other papers in this series (Pool et al. forthcoming-d; Pool et al. forthcoming-e) have outlined two important 1 Other topics covered in this series of discussion papers are listed in the end piece to this paper. The
culmination of this project will be the publishing in early 2005 as a monograph synthesizing the various themes explored in this series of working papers (Pool et al. forthcoming-a).
2 The data used in this paper are specially designed tables from Statistics New Zealand, based on the 1986 to 2001 Censuses.

- 2 -
trends that have occurred within the labour force of New Zealand both nationally and sub-nationally. Firstly, there has been the reinforcement of long-term quantitative shifts within the labour force, from a situation where primary and secondary industries were the major sectors in terms of number of workers, to where the tertiary sector employs much of the labour force, and then recently there have been changes in the distribution within the tertiary sector. The second factor was a shift in the more qualitative aspects of work, notably the increasing importance of part-time work. These changes in the labour force and in the industrial structure have had an impact on social organisation and cohesion. The present paper looks at how the economy affects the social world through the mechanism of income patterns, through trends and differentials in levels, and in inequalities. Evidence on regional differences in these factors allows one to infer the occurrence of “social exclusion” – the areas that have not shared fully in the developments seen in mainstream New Zealand. Regional patterns of social exclusion are seen as a major social policy issue in Europe. Their economic policy is seen as relating to the production of wealth; social policy to its distribution (European Commission/European Foundation for the Improvement of Living and Working Conditions 1996). There is yet another dimension to this. Within both “included” and “excluded” regions there will also be intra-regional inequalities. Here the analysis attempts to determine whether regions facing exclusion are also exposed to more or less inequality than those that are in the mainstream. This is a further related question here. The restructuring 1986-96 increased inequalities and, eliminated many jobs across a wide range of sectors (Pool et al. forthcoming-d; Pool et al. forthcoming-e). Moreover, the gap between demographic supply and available jobs, and unemployment, fell heavily on the young, on ethnic minorities and on the more peripheral regions. It was carried out with no regard for human capital implications – financial restructuring, underpinned by ideologies favouring privatisation a diminishing of the role of the state and managerialism was the driver. Yet this was a period in which the last large baby-boom cohorts, born around 1970 were reaching labour force ages, a situation which human capital questions must be at the forefront of policy, yet were ignored in the rush to restructure (Honey 1998; Pool 1999). Another large new entrant cohort is about to reach labour force ages in the near future (Pool et al. 2005d). The implications of this at the national level have already been discussed elsewhere (Pool 2003). Three methodological points need summarising here. Measuring changes over time in incomes requires finding a standard by which changes in the value of the dollar can be controlled. To overcome this problem a conventional strategy has been adopted: the Consumer Price Index was used to calculate an adjustment factor so that incomes can be compared over time3. This paper uses census data on incomes as they cover the entire population (ie they are not sample data). Thus issues of sampling error, problems of cell-size encountered when
3 The adjustment factors to adjust to 1996 dollars were as follows: 1986 1.644, 1991 1.0962 and 2001 0.9282.
These adjusted were worked out using the Consumer Price Index in March 1986 was at 647 points from a base of 1000 points in December 1993, with March 1996 it was 1063 points, resulting in an adjustment factor of 1.644. A similar principle was used for 1991 and 2001. This does not allow for regional differences in purchasing power. We have to assume that purchasing power was uniform for all regions.

- 3 -
analysing Household Economic Survey data disaggregated to a regional level do not arise here (Martin 1997, 1998; Karagedlikli et al 2000,2003). That said however, there is an additional problem of the census not collecting data on incomes by source (e.g., wages, salaries, commissions, dividends, etc.). Most importantly both benefit and market incomes are included without any means of disaggregation. Thus this paper relates to all incomes and not just earnings – from an analytical standpoint4 this is not a problem. Nevertheless, it must be recognised that for some regions, superannuation payments and even other benefits are an important source of all income. To analyse this factor, incomes by age are presented later in the paper. One problem with the present analysis is that it is difficult to take account of regional5 differences in cost structures. Thus it is not possible to extrapolate from these data and suggest definitely, say that on average, populations in Auckland and Wellington have a better standard of living than do their counterparts elsewhere. But it must be recalled that factors affecting expenditure in one region may be different from another: housing in Auckland, say, as against transport and communications in more isolated regions. That said this argument becomes somewhat academic when intra-regional income differentials are looked at. For basic needs whether one is Māori or Pakeha it costs the same to live in any region. If one then looks at households, these intra-regional differences open up further (Cochrane et al. forthcoming). There is another purely technical issue. The per cent of the people who do not specify their income has grown over time from just over five per cent in 1986 and 1991 to 11 per cent in 2001 for New Zealand, as is shown in Appendix Table 1. The percentage not specified for Maori is over double that of Pakeha in 2001: six and 13 per cent respectively. When looking at data on “not specified” by age the two tail-end groups 15-24 and 65 years and over had the highest percentage, and this was especially so for Maori. In the coming sections “not specified” answers are excluded in the computations. 3. Standardised Median Incomes6 and Changes Over Time, 1986 to 2001 At the national level incomes were lower in 2001 than in 1986, But beyond that Table 1 shows the median incomes for each Regional Council area in New Zealand between 1986 and 2001. These can be directly compared as they are standardised to the same population. The overall New Zealand level adjusted to 1996 levels was highest in 1986, dropping by $2,000 in 1991 and even further 1996, then increasing again to 2001, though still not to the same levels as had been seen in 1986. The median incomes of the regions are quite diverse showing a range of approximately $5,400 in both 1986 and 1996 between the lowest and the
4 The interest here is issues of social and economic equity rather than some of the questions economists ask
which are more monetary/financial. 5 We analyse 15 regions instead of the usual 16. Nelson and Tasman are combined into one as they operate
essentially as one entity other than administratively. As local body reorganisation (1989) was on the basis of river catchments not communities of social and economic interest, anomalies occur. For example, Nelson urban area has some of its population in the Tasman region.
6 Median incomes measure the level for the 50th percentile in a given population. They are used as an indication of the “average” income in particular regions (Martin 1998; Shryock et al. 1976). The results are standardised for age and gender to 1996 the total New Zealand population so as to eliminate these composition effects in the overall results.
- 4 -
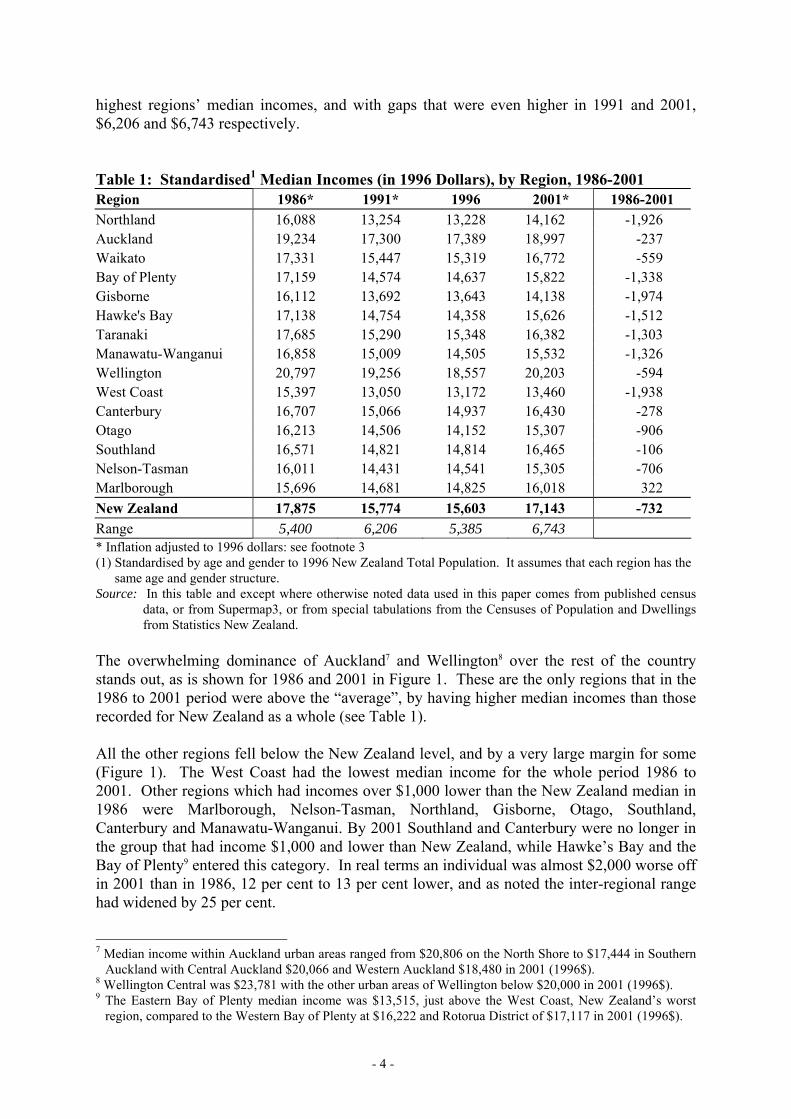
highest regions’ median incomes, and with gaps that were even higher in 1991 and 2001, $6,206 and $6,743 respectively. Table 1: Standardised1 Median Incomes (in 1996 Dollars), by Region, 1986-2001 Region 1986* 1991* 1996 2001* 1986-2001 Northland 16,088 13,254 13,228 14,162 -1,926 Auckland 19,234 17,300 17,389 18,997 -237 Waikato 17,331 15,447 15,319 16,772 -559 Bay of Plenty 17,159 14,574 14,637 15,822 -1,338 Gisborne 16,112 13,692 13,643 14,138 -1,974 Hawke's Bay 17,138 14,754 14,358 15,626 -1,512 Taranaki 17,685 15,290 15,348 16,382 -1,303 Manawatu-Wanganui 16,858 15,009 14,505 15,532 -1,326 Wellington 20,797 19,256 18,557 20,203 -594 West Coast 15,397 13,050 13,172 13,460 -1,938 Canterbury 16,707 15,066 14,937 16,430 -278 Otago 16,213 14,506 14,152 15,307 -906 Southland 16,571 14,821 14,814 16,465 -106 Nelson-Tasman 16,011 14,431 14,541 15,305 -706 Marlborough 15,696 14,681 14,825 16,018 322 New Zealand 17,875 15,774 15,603 17,143 -732 Range 5,400 6,206 5,385 6,743 * Inflation adjusted to 1996 dollars: see footnote 3 (1) Standardised by age and gender to 1996 New Zealand Total Population. It assumes that each region has the
same age and gender structure. Source: In this table and except where otherwise noted data used in this paper comes from published census
data, or from Supermap3, or from special tabulations from the Censuses of Population and Dwellings from Statistics New Zealand.
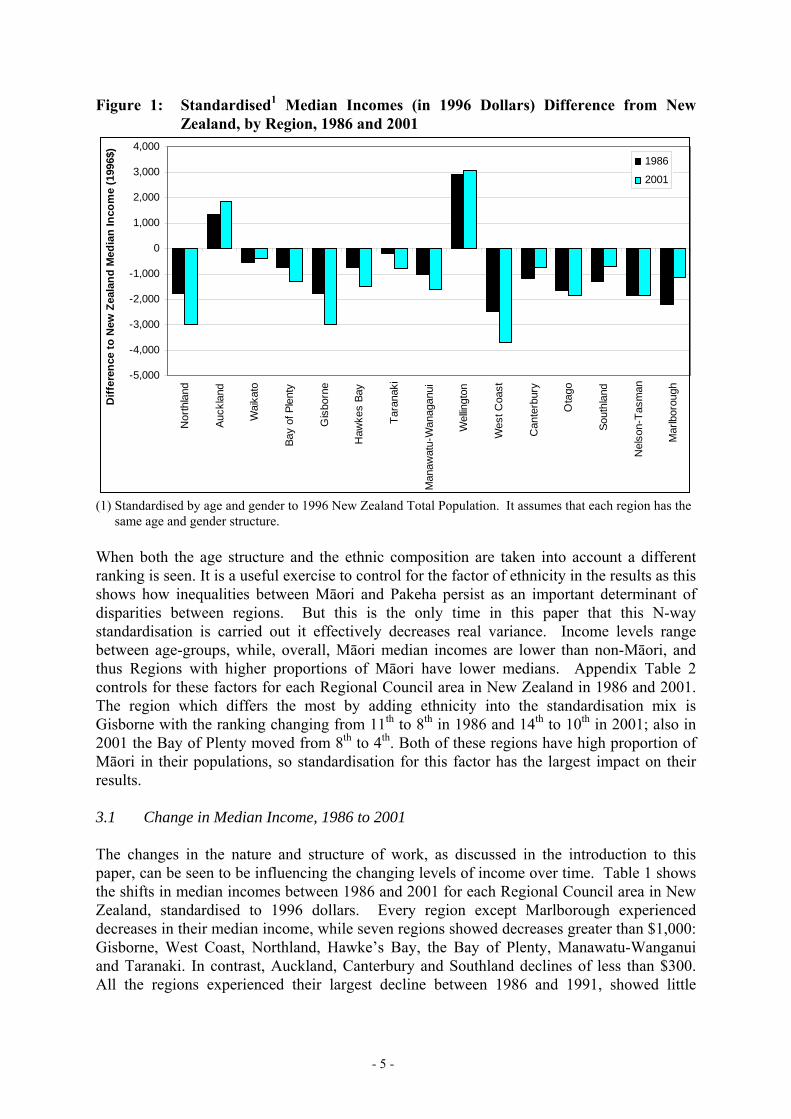
The overwhelming dominance of Auckland7 and Wellington8 over the rest of the country stands out, as is shown for 1986 and 2001 in Figure 1. These are the only regions that in the 1986 to 2001 period were above the “average”, by having higher median incomes than those recorded for New Zealand as a whole (see Table 1). All the other regions fell below the New Zealand level, and by a very large margin for some (Figure 1). The West Coast had the lowest median income for the whole period 1986 to 2001. Other regions which had incomes over $1,000 lower than the New Zealand median in 1986 were Marlborough, Nelson-Tasman, Northland, Gisborne, Otago, Southland, Canterbury and Manawatu-Wanganui. By 2001 Southland and Canterbury were no longer in the group that had income $1,000 and lower than New Zealand, while Hawke’s Bay and the Bay of Plenty9 entered this category. In real terms an individual was almost $2,000 worse off in 2001 than in 1986, 12 per cent to 13 per cent lower, and as noted the inter-regional range had widened by 25 per cent.
7 Median income within Auckland urban areas ranged from $20,806 on the North Shore to $17,444 in Southern
Auckland with Central Auckland $20,066 and Western Auckland $18,480 in 2001 (1996$). 8 Wellington Central was $23,781 with the other urban areas of Wellington below $20,000 in 2001 (1996$). 9 The Eastern Bay of Plenty median income was $13,515, just above the West Coast, New Zealand’s worst
region, compared to the Western Bay of Plenty at $16,222 and Rotorua District of $17,117 in 2001 (1996$).
- 5 -
Figure 1: Standardised1 Median Incomes (in 1996 Dollars) Difference from New Zealand, by Region, 1986 and 2001
-5,000
-4,000
-3,000
-2,000
-1,000
0
1,000
2,000
3,000
4,000
Nor
thla
nd
Auck
land
Wai
kato
Bay
of P
lent
y
Gis
born
e
Haw
kes
Bay
Tara
naki
Man
awat
u-W
anag
anui
Wel
lingt
on
Wes
t Coa
st
Can
terb
ury
Ota
go
Sout
hlan
d
Nel
son-
Tasm
an
Mar
lbor
ough
Diff
eren
ce to
New
Zea
land
Med
ian
Inco
me
(199
6$)
1986
2001
(1) Standardised by age and gender to 1996 New Zealand Total Population. It assumes that each region has the
same age and gender structure. When both the age structure and the ethnic composition are taken into account a different ranking is seen. It is a useful exercise to control for the factor of ethnicity in the results as this shows how inequalities between Māori and Pakeha persist as an important determinant of disparities between regions. But this is the only time in this paper that this N-way standardisation is carried out it effectively decreases real variance. Income levels range between age-groups, while, overall, Māori median incomes are lower than non-Māori, and thus Regions with higher proportions of Māori have lower medians. Appendix Table 2 controls for these factors for each Regional Council area in New Zealand in 1986 and 2001. The region which differs the most by adding ethnicity into the standardisation mix is Gisborne with the ranking changing from 11th to 8th in 1986 and 14th to 10th in 2001; also in 2001 the Bay of Plenty moved from 8th to 4th. Both of these regions have high proportion of Māori in their populations, so standardisation for this factor has the largest impact on their results. 3.1 Change in Median Income, 1986 to 2001 The changes in the nature and structure of work, as discussed in the introduction to this paper, can be seen to be influencing the changing levels of income over time. Table 1 shows the shifts in median incomes between 1986 and 2001 for each Regional Council area in New Zealand, standardised to 1996 dollars. Every region except Marlborough experienced decreases in their median income, while seven regions showed decreases greater than $1,000: Gisborne, West Coast, Northland, Hawke’s Bay, the Bay of Plenty, Manawatu-Wanganui and Taranaki. In contrast, Auckland, Canterbury and Southland declines of less than $300. All the regions experienced their largest decline between 1986 and 1991, showed little

- 6 -
change between 1991 and 1996, but had increases of varying levels occurring between 1996 and 2001. Nationally, real income rose by more than $1,500 between 1996 and 2001, but this was still insufficient to bring it up to 1986 levels. Four regions experienced an increase of less than $1,000 between 1996 and 2001 West Coast, Gisborne, Nelson-Tasman and Northland. 3.2 Changes in Median Income by Ethnicity, 1986 to 2001 Incomes separately standardised10 for the Pakeha and Māori ethnic groups reflect the pattern for specific ages to be covered in the next section of this paper. The levels for New Zealand for Pakeha are higher than Māori. Moreover, this gap has widened from under $3,000 in 1986 to over $5,000 in 2001. The two main points are firstly, that median incomes for both ethnic groups in Auckland11 and Wellington12 are substantially higher than elsewhere in New Zealand, particularly Northland and the West Coast (Table 2). Secondly, outside Auckland and Wellington in 2001, median incomes for Māori are higher in the South Island except on the West Coast than for the remaining North Island regions. Systematically across New Zealand, Māori receive lower incomes than do Pakeha in the same region (Table 2). In the regions where Māori constitute a high proportion of the population, for example Northland, the Bay of Plenty, Gisborne, and Hawke's Bay, there is a large inter-ethnic difference. That said, the inter-regional differences for both ethnicities are so great that median incomes for Māori in Wellington and Auckland are higher than those for Pakeha in six regions in 2001, Northland, Manawatu-Wanganui, the West Coast, Otago, Nelson-Tasman and Marlborough. For the fifteen year period 1986 to 2001 for all the regions Māori systematically went through a decline, though by varying degrees. Auckland had the smallest decrease with Marlborough and Wellington also having declines of under $1,000 (see Table 2). There is a large number of regions with drops of over $2,000: Northland, the Bay of Plenty, Gisborne, Hawke’s Bay, Taranaki, Manawatu-Wanganui, Southland and Nelson-Tasman. The situation for Pakeha was qualitatively different from that experienced by Maori. Where Maori everywhere went through declines, for Pakeha over the fifteen year period there was a mix of regions which had increases and decreases. Auckland had by far the largest increase of $2,700 occurring, though, only since 1996, while Waikato, Wellington, Canterbury, Southland and Marlborough all had rises of under $1,000. The region with the largest decrease for Pakeha was the West Coast with $1,879, a result expected because of the structure and quality of work in this region (Pool et al. forthcoming-d; Pool et al. forthcoming-e)). The remaining regions had decreases but below $1,000.
10 Standardised by age and gender to the 1996 total population, so that results are comparable to the same
standard population both over time and between ethnic groups. 11 For Māori, the North Shore ($19,231) median income was substantially higher than for the other three urban
areas of Auckland ($15,977-16,927). For Pakeha, median income ranged from Central Auckland at $25,772 to Western Auckland of $21,027 in 2001 (1996$). Rank orders were thus different for Maori and Pakeha.
12 For Pakeha, the median income ranged from $25,977 in Central Wellington to $19,888 in Upper Hutt with Porirua and Lower Huttt around $21,500 in 2001 (1996$). For Māori, Central Wellington was $19,963, Upper Hutt $18,067, Lower Hutt $16,754 and Porirua $15,459. For Pakeha and Māori the ranking was thus different.

- 7 -
Table 2: Standardised1 Median Incomes (in 1996 Dollars), by Ethnicity and Region, 1986-2001
Region 1986* 1991* 1996 2001* 1986-2001 Pakeha Northland 16,729 14,472 14,406 16,040 -689 Auckland 20,293 19,411 20,208 23,017 2,724 Waikato 17,866 16,385 16,868 18,407 541 Bay of Plenty 17,947 15,764 16,139 17,615 -332 Gisborne 17,389 15,661 15,961 16,980 -409 Hawke's Bay 17,645 15,622 15,375 17,020 -625 Taranaki 18,021 15,830 16,191 17,171 -849 Manawatu-Wanganui 17,156 15,551 15,117 16,446 -710 Wellington 21,756 20,674 20,031 21,987 231 West Coast 15,513 13,179 13,310 13,634 -1,879 Canterbury 16,853 15,276 15,462 17,069 217 Otago 16,329 14,663 14,411 15,694 -634 Southland 16,642 15,112 15,152 16,877 235 Nelson-Tasman 16,099 14,580 14,741 15,649 -451 Marlborough 15,756 14,824 14,941 16,211 456 New Zealand 18,364 16,626 16,991 18,694 331 Range 6,243 7,495 6,898 9,383 Māori Northland 14,098 10,393 10,606 11,778 -2,320 Auckland 16,601 13,523 14,723 16,555 -45 Waikato 14,656 11,302 12,207 12,894 -1,762 Bay of Plenty 14,695 10,903 12,190 12,569 -2,126 Gisborne 14,254 10,849 11,333 12,094 -2,161 Hawke's Bay 15,228 11,381 12,094 12,814 -2,414 Taranaki 14,924 11,291 12,315 12,814 -2,110 Manawatu-Wanganui 15,263 11,932 12,653 13,104 -2,159 Wellington 17,625 14,432 14,693 16,785 -840 West Coast 13,499 11,225 12,123 12,138 -1,361 Canterbury 15,682 12,595 13,378 14,013 -1,669 Otago 15,325 11,932 12,787 13,729 -1,596 Southland 15,742 12,168 12,971 13,518 -2,224 Nelson-Tasman 15,780 12,603 13,673 13,348 -2,431 Marlborough 15,404 13,329 13,885 14,767 -637 New Zealand 15,517 12,008 12,963 13,647 -1,870 Range 4,125 4,038 4,117 5,007 (continues on next page)

- 8 -
Table 2: (continued) Region 1986* 1991* 1996 2001* 1986-2001
Difference: Pakeha less Māori Northland 2,631 4,078 3,799 4,262 1,631 Auckland 3,693 5,888 5,484 6,462 2,769 Waikato 3,210 5,083 4,661 5,513 2,303 Bay of Plenty 3,252 4,861 3,949 5,046 1,794 Gisborne 3,134 4,812 4,628 4,886 1,752 Hawke's Bay 2,418 4,240 3,281 4,206 1,789 Taranaki 3,096 4,538 3,876 4,357 1,261 Manawatu-Wanganui 1,893 3,619 2,464 3,341 1,448 Wellington 4,131 6,242 5,338 5,203 1,071 West Coast 2,013 1,954 1,187 1,496 -518 Canterbury 1,170 2,680 2,085 3,056 1,886 Otago 1,004 2,731 1,624 1,966 962 Southland 900 2,944 2,181 3,358 2,458 Nelson-Tasman 320 1,977 1,068 2,300 1,980 Marlborough 351 1,495 1,056 1,444 1,093 New Zealand 2,847 4,618 4,028 5,047 2,201 Range 3,811 4,747 4,429 5,018 * Inflation adjusted to 1996 dollars: see footnote 3 (1) Standardised by age and gender to 1996 total population so results are comparable to the same standard
population. The major shifts in income occurred in the five-year period 1986 to 1991 where, in all the regions, both Māori and Pakeha experienced decreases in median incomes (Table 2), although these changes were less extreme for Pakeha than for Māori. Nationally Pakeha median incomes declined in this quinquennium by $1,738, whereas for Māori the figure was $3,509. The region with the smallest decrease was Auckland, where the median incomes of Pakeha decreased by only $882 between 1986 and 1991. In contrast, the experience of Māori in Auckland was very different, for their median income there decreased by 19 per cent ($3,078) in this five-year period. In most regions inter-ethnic differences opened up over the period 1986-91, but were more extreme in northern regions than southern. There was then generally a modest pick up for Māori in both 1991-96 and 1996-2001 though not reaching 1986 levels. For Pakeha the regions had a mixture of results between 1991-96 whereas all regions increased between 1996-2001. Although all the regions showed a decrease in median income for Māori and a mixture of results for Pakeha from 1986 to 2001, within each ethnic group at a regional level the differences in 2001 were larger than in 1986. For Pakeha the range of median incomes in 1986 was $6,243 between Wellington and West Coast. By 2001 this difference had increased to $9,383, and the region with the highest median income had changed to Auckland. For Māori the range of median incomes increased from $4,125 in 1986 to $5,007 in 2001. In 1986 the highest region had been Wellington and the lowest the West Coast, with the lowest region changing to Northland by 2001. When the extremes of the major metropolitan centres of Wellington and Auckland are excluded, the ranges for the regional median incomes of both ethnic populations are much smaller, In 2001 inter- regional differences reduce by more than $3,300 for Pakeha and by more than $2,000 for Māori when Wellington and Auckland

- 9 -
are excluded from analysis13. 4. Regional Incomes by Age Groups and Ethnicity between 1986 and 2001 In this section incomes are examined for each functional age group within the working ages for both Pakeha and Māori and also for the total population (including Pakeha and Maori and the other ethnic groups). Table 3 presents national level data, but for reasons of space, detailed regional data are tabulated in the Appendix Table 3. The age structure of a population is a key determinant of income, as personal incomes tend to increase with age until individuals start pulling out of full time work. But an important dimension in the New Zealand’s policy making context is the difference in income between Māori and Pakeha in the key working ages. Some recent studies have also started to examine such variables as differences in household structures and more importantly labour force status as explanations for these distinctions (for example, Martin 1997, 1998; Dixon 1996; Morrison 1996). Table 3: Median Incomes (in 1996 Dollars) by Age Group and Ethnicity, New
Zealand, 1986-2001
Ethnicity Age Group (years) 1986* 1991* 1996 2001* Change
1986-2001 Pakeha 15-24 14,029 9,566 8,069 7,022 -7,007
25-44 24,858 24,015 25,136 26,619 1,761 45-64 20,745 18,996 21,855 24,569 3,824 65+ 12,197 11,783 12,172 12,340 143
Māori 15-24 12,734 8,077 6,783 6,626 -6,108 25-44 19,470 15,672 16,848 18,438 -1,031 45-64 17,699 12,983 14,862 17,091 -608 65+ 10,951 9,883 10,378 10,827 -124
Total 15-24 13,640 8,938 7,054 6,142 -7,498 25-44 23,657 22,078 22,796 24,295 638 45-64 20,321 18,118 20,609 22,978 2,658 65+ 12,131 11,584 12,037 12,175 44
Pak-Mao 15-24 1,295 1,489 1,285 396 -899 25-44 5,388 8,343 8,287 8,180 2,792 45-64 3,045 6,014 6,993 7,478 4,432 65+ 1,246 1,900 1,794 1,513 267
* Inflation adjusted to 1996 dollars: see footnote 3 4.1 Young Working Age Population (15-24 Years) At these ages levels of income are low and differentials relatively limited. Moreover, a major change shown in Table 3 has taken place, the substantial drop in the inflation-adjusted median income for both young Pakeha and young Māori. Overall this drop reached around 50 per cent between 1986 and 2001. This probably reflects to a degree the increased numbers in this age group choosing to continue in tertiary education rather than electing to begin their working life as unemployed14. But against this, the numbers of 15-24 year olds in part-time 13 The ranges excluding Auckland and Wellington for Pakeha are $2,508, $3,206, $3,558 and $4,773 for 1986,
1991, 1996 and 2001 respectively, and Maori are $2,281, $2,936, $3,279 and $2,989 for the same years. 14 The fact that in the census no distinction is made between market and non-market income sources, means that
- 10 -
work has tripled over this period (Pool et al. forthcoming-e). These two points are not, of course, contradictory. In 2001, at the youngest age group (15-24 years), seven of the fifteen regions had incomes above the New Zealand median (see Appendix Table 3). Of these seven regions the highest medians were in Wellington and in three of the four South Island rural regions which do not have universities: West Coast, Southland and Marlborough. For Pakeha and Māori aged 15-24 years, in five of the fifteen regions median incomes were above that for New Zealand: Auckland, Wellington, Canterbury and Marlborough. Those regions that differed on an ethnic basis were the West Coast (Pakeha above) and Manawatu-Wanganui (Māori above). The variations in median income between Pakeha and Māori for the 15-24 year age group ranged around $1,300 from 1986 to 1996, when levels at this age group were much higher, but then reduced to around $400 in 2001. In 2001 the regions with the biggest gaps between Pakeha and Māori median incomes in favour of Pakeha in this age group were on the West Coast and in Southland (over $1,000), two regions that are predominately rural. The regions in which Māori had higher income than Pakeha were Gisborne, Canterbury, Manawatu-Wanganui and Nelson-Tasman. This may be simply that proportionately fewer Maori than Pakeha were in full-time study, but, instead were earning or on benefits. 4.2 Middle Working Age Group (25-44 Years) This is the most critical age group because these are the family-building years. Thus, variations in income point to differences in levels of wellbeing. The median income adjusted for inflation for the total population had an increase of $638 between 1986 and 2001 (Table 3). This is an increase of three per cent, and contrast with the decrease of the younger age group (more than 50 per cent). The 25-44 year age group experienced a drop between 1986 and 1991 and only a small increase between 1991 and 1996, but then a significant increment by 2001. But Māori and Pakeha income dynamics differed: Pakeha level increased by $1,761, but Māori incomes dropped by $1,032 for New Zealand as a whole. Pakeha had only a slight drop to 1991 then increased again, whereas Māori had a large drop to 1991 of nearly $4,000 then increased again, but not to regain their initial ground. The explanations that may apply at 15-24 years do not relate to this age group. The range of median incomes for both Māori and Pakeha aged 25 to 44 years illustrates the regional diversity within New Zealand (see Appendix Table 3). For Pakeha the range between the highest and lowest region has increased from just over $9,000 in 1986 to just under $13,000 in 2001. The range between the regions has been less for Māori increasing from $5,500 in 1986 to $8,700 in 2001. There were also regional shifts in ranking at these ages, with Gisborne, Northland and the West Coast typically being far and away the lowest for total population incomes. For Māori in 1986 the same pattern was seen. By 2001, the lowest median income at this age group was
the entire population must be used as a denominator. Thus, for example, persons reporting “full-time study” are included here. This may be less problematic than it may seem because, today, many students, even those enrolled “full-time”, have jobs, and are in “full-time” employment.

- 11 -
in Northland followed by Gisborne for Māori. The highest regions for Māori in 2001 were Wellington15 and Auckland16. In 1986 the lowest Pakeha median income was in Marlborough ($20,568) and the highest income was in Wellington ($29,623). In 2001 the highest Pakeha median income was in Auckland ($32,111) followed by Wellington and the lowest Pakeha median income was for West Coast ($19,271). At this age group the regional differences in median incomes between Pakeha and Māori are marked. In 2001 in Auckland, the Māori median income was $9,340 below that for Pakeha, and most North Island regions show similar levels of disparity though not quite as high, whereas the gaps are considerably less in the South Island. The Wellington and Auckland regions had consistently high levels of income for each ethnic groups compared to their peers elsewhere for the whole period 1986 to 2001. If these two regions are excluded, the ranges of regional median incomes are less for both ethnic groups and especially for Pakeha. 4.3 Mature Working Age Group (45 to 64 years) The regional and ethnic patterns for the 45-64 years age group are similar to the two younger age groups (see Appendix Table 3). The income levels for the 45-64 years age group in each region were generally lower than the incomes for the 25-44 years age group. For New Zealand there was an increase of $2,657 in median income from 1986 to 2001 (Table 3). This was, however, due to increases in the incomes of the Pakeha majority of over $3,800, as Māori had a decrease of $600. The gap between the median income for Pakeha and Māori was substantial for all regions for 1991 to 2001. In 1986 all the South Island regions had higher income for Māori than Pakeha (note though that numbers are small for Māori). Moreover, while Pakeha incomes increased in every region except the West Coast, those for Māori decreased in every region except Auckland, Wellington and Canterbury, sometimes significantly so. In Wellington17 in 1986 the ethnic difference was $5,408 and by 2001 this difference had increased to $7,300 even though this region had the highest median income for Māori for both years and Pakeha in 1986. The largest difference was Gisborne at $9,675 in 2001. 4.4 Income Differentials at Active Ages: a Summary There are two regional patterns that are applicable across all three active age groups. Firstly, in most cases both Auckland and Wellington have the highest incomes for both ethnic groups. In 1986 Wellington had had the highest median income across all three age groups for Pakeha whereas Auckland had the highest in 2001. For Māori, Wellington had the highest for 15-24 years in 1986 with Southland being the highest for the two other age
15 For the total population incomes in Wellington Central ($33,411) were significantly higher than the other
urban areas with Porirua ($24,729) being the lowest (see Appendix Table 4). This is a similar pattern for Māori though at a lower level. For Pakeha the lowest is Upper Hutt with Wellington Central being the highest.
16 For the total population the median income was highest on the North Shore and in Central Auckland (see Appendix Table 4). For Pakeha, Central Auckland was significantly higher than for the other urban areas of Auckland.
17 The Wellington Central median income was substantially higher than those in the other urban areas of Wellington (see Appendix Table 4). The gap between Pakeha and Māori was $10,000 in Porirua and Wellington Central in 2001 (1996$).

- 12 -
groups. In 2001 Auckland had the highest for 15-24 years with Wellington having the highest for the other age groups. Secondly, while there are proportionally fewer Māori in many South Island regions, those that live there tend to have higher incomes than Māori living in the North Island. Median incomes for Māori tend to be lower in the regions with large concentrations of Māori. This has a noticeable effect on the median income of the overall population. Thirdly, however, the overall picture by age and ethnicity is not very positive at all. In most regions, at most ages, Pakeha have higher, normally very much higher incomes. 4.5 Retired Age Group (65 Years and Over) The regional patterns of income for those aged 65 years and older is different from the pattern for the younger age groups as can be seen in Appendix Table 3. Because of the muted differences less attention is given to an analysis of this age-group than others. Differentials are dampened down as an effect of universal superannuation. There was a small increase in median income ($44) for the total population in the fifteen years period. There was an initial drop from 1986 to 1991 of over $500 then an increase. The differentials between Pakeha and Māori were less marked than at active ages. The range between regions is considerably less than at the other age groups (e.g., 25-44 years and 45-64 years), although the range did increase between 1986 and 2001. As the range is relatively small the regional differences are much more muted compared to the regional differences for the other age groups. Once again, Māori have lower median incomes than Pakeha for all regions with the gap being larger in the North Island regions. However, the income gap between the Pakeha and Māori is much smaller at this age group than at the younger ones. In Wellington in 1986 this gap was $1,476, and widened slightly to $1,619 in 2001. At this age group, Wellington had the highest income and West Coast had the lowest. Of other regions, Auckland is around the national average, as is Gisborne. This last noted similarity is found only for this age group and may reflect internal migration at different ages within this age group. For example, as noted in other papers those in the younger ages of elderly, the 'young-old', have different characteristics from those of the 'oldest-old', those aged over 75 years (Bedford et al. forthcoming; Pool et al. 2005c). People approaching older ages could be leaving Gisborne to live in other areas perhaps closer to family or services, thus increasing the median incomes of those aged 65 years and older in the Gisborne region. Equally well, although the Gisborne region overall has higher proportion of Māori, at older ages this factor is less marked. This argument assumes, not unreasonably, that on average incomes tend to decline as people reach much older ages.

- 13 -
5. Income by Labour Force Status by Age Group In this section the median income of those people who are working full- or part-time in the three working age groups is considered. This is to detect any real difference in what employed people are earning by removing the effect of those not employed. In interpreting these results, therefore, it is important to note that they related to the reference age-group and work-force status. Income as derived from the census is from all sources of income not just paid employment. 5.1 Full-time Employed Between 1986 and 2001 there was a steady decline in the national inflation adjusted median income for full-time employed 15-24 year olds (see Table 4), as youths working full-time are typically less skilled now. The median for this age group is over one-third less than the median income of each of the other two age groups. From 1986 to 2001 for the 25-44 and 45-64 years age group the median income went up, but with all the increase occurring between 1996 and 2001. Table 4 presents data on regions, by age, for each census 1986-2001. These reflect, to a significant degree the overall trends discussed earlier in the paper. Most importantly inter-regional ranges increased. The median income for full-time workers in all three age groups in Gisborne, Northland and West Coast was notably low for the period. In 2001 the median incomes for Hawke’s Bay, Nelson-Tasman and Marlborough was also low since these regions have fewer people across the age groups in highly paid professional jobs (Pool et al. forthcoming-d). For the whole period 1986 to 2001 those employed full-time in Wellington and Auckland had the highest median incomes at all age groups. Taking inflation into account the median income in these two regions for the active age group 25-64 years has increased by around $3,000 from 1986 to 2001. The higher median incomes in Wellington18 and Auckland19 are related to the higher levels of skills of workers in these two regions (Pool et al. forthcoming-d). However, for the 15-24 year age group the median income for Wellington actually declined. Between 1986 and 2001 for those working full-time in the 15-24 years age group the lowest median income, for Gisborne, dropped by over $3,500. There was as noted earlier a corresponding increase in the range across all the regions for this fifteen year period, in the case of 15-24 years almost doubling.
18 Wellington Central had a median income for full-time workers that were significantly higher than the other
three urban areas especially at 25-44 and 45-64 years. For example, at 25-44 years, Wellington Central’s was $40,804 were the other three urban areas were below $34,000 in 2001 (1996$).
19 Central Auckland and North Shore have higher median incomes for full-time workers than do Western and Southern Auckland, especially for 25-44 and 45-64 years. For example, at 25-44 years Central Auckland’s is $37,188, North Shore’s is $36,844 compared to Western Auckland’s at $32,974 and Southern Auckland’s at $31,709 in 2001 (1996$).

- 14 -
Table 4: Median Incomes (in 1996 Dollars) for those Employed Full-time, by Age Group and Region, 1986-2001
Age Group (Years) Region
15-24 25-44 45-64 15-24 25-44 45-64 1986* 1991* Northland 18,163 27,967 27,850 17,451 25,936 25,175 Auckland 20,303 31,692 32,014 20,820 31,985 31,740 Waikato 18,632 29,323 30,042 18,378 29,026 28,387 Bay Of Plenty 18,338 29,473 29,982 17,793 28,458 27,798 Gisborne 17,488 26,115 27,210 15,698 25,414 25,983 Hawke's Bay 18,439 29,137 29,909 16,851 27,211 27,666 Taranaki 18,965 30,136 29,885 17,953 28,868 28,529 Manawatu-Wanganui 19,150 29,253 28,952 18,596 28,081 27,880
Wellington 21,291 33,407 33,819 21,820 34,416 33,852 West Coast 19,113 27,181 27,666 17,509 26,208 26,053 Canterbury 18,988 29,688 29,687 18,326 28,937 28,266 Otago 18,928 29,265 29,113 17,694 27,833 27,620 Southland 18,917 29,504 28,859 17,403 27,779 26,702 Nelson-Tasman 17,730 27,128 27,824 16,634 26,062 25,781 Marlborough 18,123 28,043 26,586 17,174 26,787 25,483 New Zealand 19,450 30,461 30,662 19,231 30,067 29,588 Range 3,802 7,292 7,233 6,122 9,001 8,677 1996 2001* Northland 15,705 26,639 26,593 15,650 28,059 28,100 Auckland 20,395 32,708 33,816 20,835 34,673 35,318 Waikato 17,329 29,622 30,072 17,454 31,205 31,817 Bay Of Plenty 16,911 28,984 29,226 16,931 30,085 30,444 Gisborne 15,106 26,512 27,260 13,973 26,717 27,314 Hawke's Bay 15,316 27,286 28,016 15,229 28,104 28,770 Taranaki 17,587 29,697 30,095 17,555 30,700 31,589 Manawatu-Wanganui 17,685 28,282 28,810 17,401 29,165 29,764
Wellington 20,495 34,489 35,073 19,902 36,107 36,416 West Coast 16,815 27,098 27,113 16,332 27,113 26,941 Canterbury 18,032 29,197 29,599 17,757 30,676 30,763 Otago 16,696 28,031 28,609 16,204 28,743 29,711 Southland 17,204 28,420 28,416 16,985 29,635 29,803 Nelson-Tasman 16,894 27,011 27,294 15,412 27,502 27,630 Marlborough 16,495 26,705 25,795 15,220 27,461 26,680 New Zealand 18,444 30,318 30,909 18,414 32,171 32,395 Range 5,389 7,977 9,278 6,862 9,390 9,735
* Inflation adjusted to 1996 dollars: see footnote 3

- 15 -
5.2 Part-time Employed Between 1986 and 2001 for the total national population there was very significant decline in the inflation adjusted median income for the 15-24 years age group employed part-time as is seen in Table 5. For the other two age groups the median income increased, though at the 45-64 years age group there was an initial increase then a slight decline. The range across the regions decreased for the 15-24 years age group from 1986 to 2001 with the 2001 range being quite narrow. But at the 25-44 years age group the range has remained reasonably similar and at the 45-64 years age group there was an increase. Unlike in the case of full-time work, incomes for part-time jobs showed no clear regional pattern at 15-24 years. At the 25-64 years age groups, Auckland20 and Wellington21 had the highest median income for part-time workers over the whole period and there was an increase of approximately $2,000 for 25-44 years between 1986 and 2001 for both Auckland and Wellington, and around $1,000 for 45-64 years. At the same age groups West Coast had the lowest median income. In 1986 Nelson-Tasman and Marlborough had low median incomes at these age groups, and in 2001 Otago and Southland had low median incomes.
20 Central Auckland had a higher level of median income for part-time workers than did the other three urban
areas of Auckland. 21 Wellington Central had a higher level of median income for part-time workers than did the other three urban
areas of Wellington.

- 16 -
Table 5: Median Incomes (in 1996 Dollars) for those Employed Part-time, by Age Group and Region, 1986-2001
Age Group (Years) Region 15-24 25-44 45-64 15-24 25-44 45-64
1986* 1991* Northland 5,989 11,127 12,924 4,618 12,071 12,850 Auckland 4,686 11,652 13,536 4,844 12,955 14,471 Waikato 5,312 10,923 12,779 4,571 12,167 13,679 Bay Of Plenty 4,665 10,457 12,591 3,866 11,660 12,714 Gisborne 5,630 11,234 12,999 4,111 10,768 12,290 Hawke's Bay 5,790 10,902 12,627 3,234 11,163 12,066 Taranaki 4,892 11,102 13,546 3,756 11,779 13,447 Manawatu-Wanganui 5,872 10,299 11,730 4,439 11,085 12,406
Wellington 5,107 11,532 13,536 4,497 12,607 14,649 West Coast 3,681 8,782 10,576 3,107 9,794 10,688 Canterbury 5,501 10,030 11,953 4,871 10,721 12,092 Otago 5,951 10,297 11,793 5,389 10,905 11,824 Southland 6,583 10,785 12,724 3,787 10,674 11,148 Nelson-Tasman 3,863 9,641 11,707 3,818 10,822 11,727 Marlborough 5,726 9,033 11,827 4,111 10,426 12,267 New Zealand 5,187 10,879 12,712 4,581 11,792 13,225 Range 2,902 2,870 2,970 2,282 3,161 3,961 1996 2001* Northland 3,389 11,497 12,526 3,174 12,480 12,382 Auckland 3,913 12,839 14,370 3,916 13,780 14,788 Waikato 3,672 12,152 13,543 3,671 12,810 13,113 Bay Of Plenty 3,528 11,799 12,858 3,379 12,635 13,012 Gisborne 3,450 11,202 12,381 3,267 12,220 12,452 Hawke's Bay 3,297 11,134 12,465 3,193 12,206 12,297 Taranaki 3,399 11,984 12,875 3,217 12,205 12,453 Manawatu-Wanganui 3,823 11,340 12,307 3,753 12,157 12,381
Wellington 3,970 12,601 14,341 4,016 13,651 14,310 West Coast 3,508 9,815 10,695 3,198 10,942 10,420 Canterbury 3,849 11,083 12,048 3,809 11,995 12,316 Otago 3,822 10,959 11,944 3,900 11,850 11,977 Southland 3,335 10,561 11,887 3,269 11,538 11,998 Nelson-Tasman 3,359 11,096 12,283 3,168 11,587 12,784 Marlborough 3,265 10,721 12,356 3,123 11,365 12,330 New Zealand 3,762 11,837 13,112 3,726 12,710 13,098 Range 705 3,024 3,674 892 2,837 4,368
* Inflation adjusted to 1996 dollars: see footnote 3

- 17 -
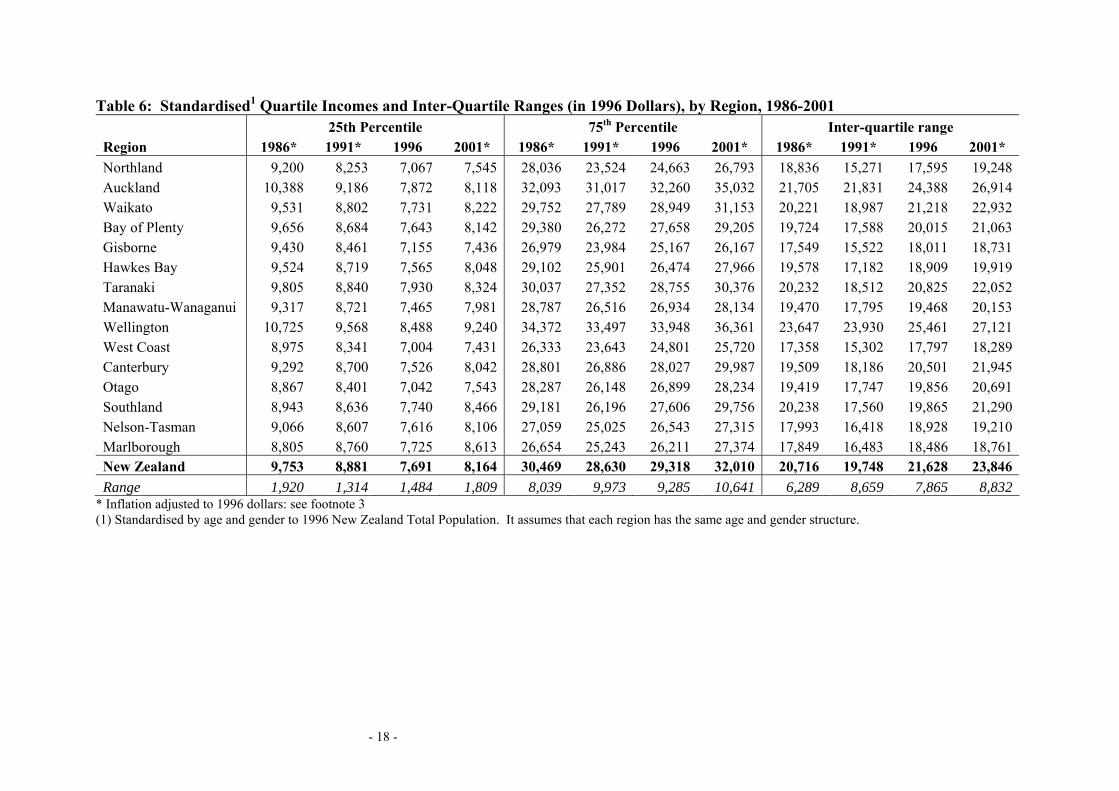
6. Quartile Incomes This paper has already shown that the distribution of incomes between and within regions is far from equitable. It now turns to a more refined measure of spread. Table 6 looks at percentiles, the 25th and below representing the lowest incomes and the 75th and above the highest22. The inter-quartile range for incomes between the 25th and 75th percentiles, also presented in Table 6, indicates the spread seen for the middle 50 per cent of the population23. These indices give indications of the nature and spread of, and inequalities in the levels of income in each region. Generally in both 1986 and 2001, the ranking of regions by their inter-quartile ranges (IQR) is the same ranking as found in the same regions for the 75th percentile (Table 6). The 25th and 75th percentiles and the IQR are highly correlated to each other, whether using Spearman’s rank or Pearson’s technique. However, the ranges between the regions for the 75th percentile are typically much larger than those at the 25th percentile. At the 75th percentile the range in 1986 was $8,039, and by 2001 this had increased to $10,641, a clear indication of considerable regional differences. In contrast, the range for the 25th percentile in 1986 was only $1,920, and in 2001 was lower at $1,809, indicating little variance between the regions for the lowest income groups in regional populations. This means that not only did the better off regions become even more advantaged overall, but intra-regional differentials in their relative gains (by comparison with others) over the period became even more marked. In contrast, for low income groups inter-regionally differences declined slightly. For New Zealand as a whole the level of income at the 75th percentile (in 1996 dollars) increased from $30,469 in 1986 to $32,010 in 2001, a 5 per cent change. There had been an initial decrease between 1986 to 1991 of $1,839, then a small increase from 1991 and 1996, but with a larger increase between 1996 and 2001 of over $2,500. But the level of income at the 25th percentile (in 1996 dollars) declined from $9,753 in 1986 to $8,164 in 2001, a significant reduction of 16 per cent. There had been a very significant drop overall in excess of $2,000 between 1986 and 1996 (ie. 21 per cent of 1986 income), but with some recovery to 2001. This reflects the reductions in the proportions in the labour force in full time work, as well as benefit cuts introduced in the December 1990 mini-budget. These income shifts are very significant socially. The best-off increased by 5 per cent in real terms; the poorest saw relative decreases of 16 per cent and their absolute decrease ($1,589) exceeded the absolute increase of the best-off ($1,541).
22 The 25th percentile is what 25th person income of one to 100 people from lowest to highest. The 75th
percentile is what the 75th person income of one to 100 people from lowest to highest. 23 The difference between the 25th and 75th percentile is the inter-quartile range (that is the population that earns
above the 25th percentile and below the 75th percentile).
- 18 -
Table 6: Standardised1 Quartile Incomes and Inter-Quartile Ranges (in 1996 Dollars), by Region, 1986-2001 25th Percentile 75th Percentile Inter-quartile range Region 1986* 1991* 1996 2001* 1986* 1991* 1996 2001* 1986* 1991* 1996 2001* Northland 9,200 8,253 7,067 7,545 28,036 23,524 24,663 26,793 18,836 15,271 17,595 19,248 Auckland 10,388 9,186 7,872 8,118 32,093 31,017 32,260 35,032 21,705 21,831 24,388 26,914 Waikato 9,531 8,802 7,731 8,222 29,752 27,789 28,949 31,153 20,221 18,987 21,218 22,932 Bay of Plenty 9,656 8,684 7,643 8,142 29,380 26,272 27,658 29,205 19,724 17,588 20,015 21,063 Gisborne 9,430 8,461 7,155 7,436 26,979 23,984 25,167 26,167 17,549 15,522 18,011 18,731 Hawkes Bay 9,524 8,719 7,565 8,048 29,102 25,901 26,474 27,966 19,578 17,182 18,909 19,919 Taranaki 9,805 8,840 7,930 8,324 30,037 27,352 28,755 30,376 20,232 18,512 20,825 22,052 Manawatu-Wanaganui 9,317 8,721 7,465 7,981 28,787 26,516 26,934 28,134 19,470 17,795 19,468 20,153 Wellington 10,725 9,568 8,488 9,240 34,372 33,497 33,948 36,361 23,647 23,930 25,461 27,121 West Coast 8,975 8,341 7,004 7,431 26,333 23,643 24,801 25,720 17,358 15,302 17,797 18,289 Canterbury 9,292 8,700 7,526 8,042 28,801 26,886 28,027 29,987 19,509 18,186 20,501 21,945 Otago 8,867 8,401 7,042 7,543 28,287 26,148 26,899 28,234 19,419 17,747 19,856 20,691 Southland 8,943 8,636 7,740 8,466 29,181 26,196 27,606 29,756 20,238 17,560 19,865 21,290 Nelson-Tasman 9,066 8,607 7,616 8,106 27,059 25,025 26,543 27,315 17,993 16,418 18,928 19,210 Marlborough 8,805 8,760 7,725 8,613 26,654 25,243 26,211 27,374 17,849 16,483 18,486 18,761 New Zealand 9,753 8,881 7,691 8,164 30,469 28,630 29,318 32,010 20,716 19,748 21,628 23,846 Range 1,920 1,314 1,484 1,809 8,039 9,973 9,285 10,641 6,289 8,659 7,865 8,832
* Inflation adjusted to 1996 dollars: see footnote 3 (1) Standardised by age and gender to 1996 New Zealand Total Population. It assumes that each region has the same age and gender structure.
- 19 -
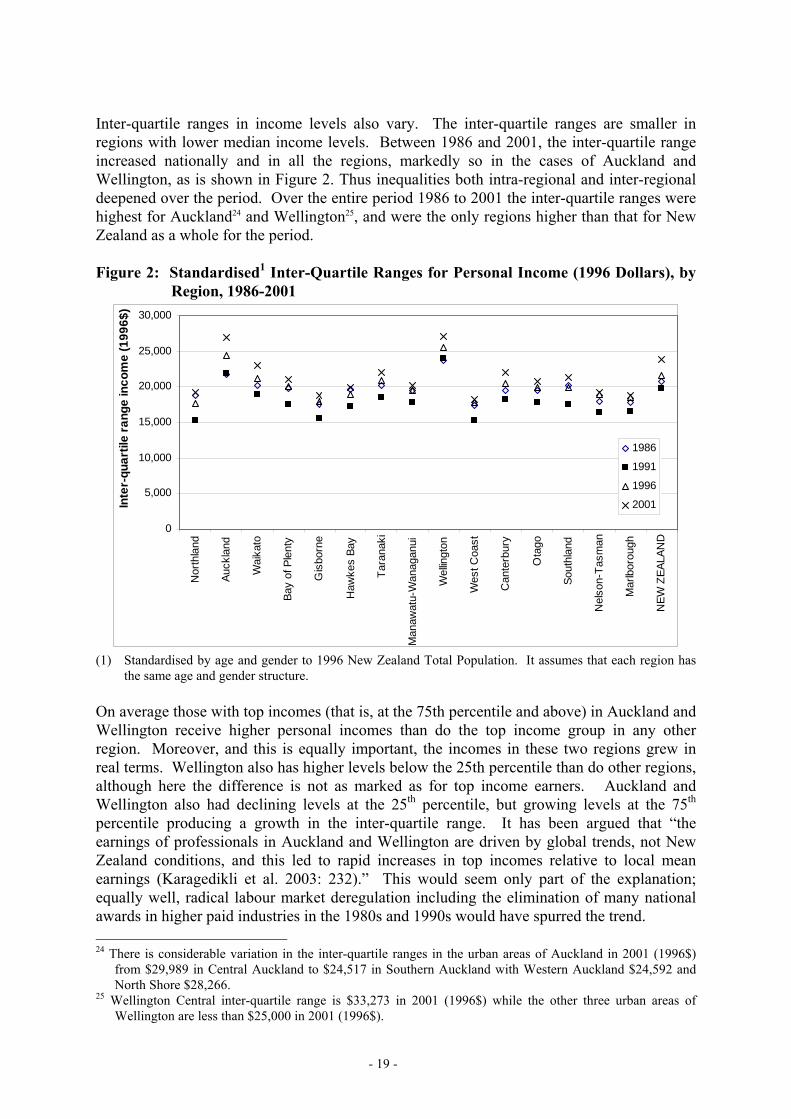
Inter-quartile ranges in income levels also vary. The inter-quartile ranges are smaller in regions with lower median income levels. Between 1986 and 2001, the inter-quartile range increased nationally and in all the regions, markedly so in the cases of Auckland and Wellington, as is shown in Figure 2. Thus inequalities both intra-regional and inter-regional deepened over the period. Over the entire period 1986 to 2001 the inter-quartile ranges were highest for Auckland24 and Wellington25, and were the only regions higher than that for New Zealand as a whole for the period. Figure 2: Standardised1 Inter-Quartile Ranges for Personal Income (1996 Dollars), by
Region, 1986-2001
0
5,000
10,000
15,000
20,000
25,000
30,000
Nor
thla
nd
Auck
land
Wai
kato
Bay
of P
lent
y
Gis
born
e
Haw
kes
Bay
Tara
naki
Man
awat
u-W
anag
anui
Wel
lingt
on
Wes
t Coa
st
Can
terb
ury
Ota
go
Sout
hlan
d
Nel
son-
Tasm
an
Mar
lbor
ough
NEW
ZEA
LAN
D
Inte
r-qu
artil
e ra
nge
inco
me
(199
6$)
1986
1991
1996
2001
(1) Standardised by age and gender to 1996 New Zealand Total Population. It assumes that each region has
the same age and gender structure. On average those with top incomes (that is, at the 75th percentile and above) in Auckland and Wellington receive higher personal incomes than do the top income group in any other region. Moreover, and this is equally important, the incomes in these two regions grew in real terms. Wellington also has higher levels below the 25th percentile than do other regions, although here the difference is not as marked as for top income earners. Auckland and Wellington also had declining levels at the 25th percentile, but growing levels at the 75th percentile producing a growth in the inter-quartile range. It has been argued that “the earnings of professionals in Auckland and Wellington are driven by global trends, not New Zealand conditions, and this led to rapid increases in top incomes relative to local mean earnings (Karagedikli et al. 2003: 232).” This would seem only part of the explanation; equally well, radical labour market deregulation including the elimination of many national awards in higher paid industries in the 1980s and 1990s would have spurred the trend. 24 There is considerable variation in the inter-quartile ranges in the urban areas of Auckland in 2001 (1996$)
from $29,989 in Central Auckland to $24,517 in Southern Auckland with Western Auckland $24,592 and North Shore $28,266.
25 Wellington Central inter-quartile range is $33,273 in 2001 (1996$) while the other three urban areas of Wellington are less than $25,000 in 2001 (1996$).

- 20 -
For the period 1986 to 2001 the 75th percentiles for Gisborne and West Coast were low, while incomes in this percentile for Marlborough were low in 1986 and Northland between 1991 and 2001. The inter-quartile ranges were also limited for these regions reflecting more the low figure for the 75th percentile than the 25th percentile. Also these regions had low median incomes. Northland and Hawke’s Bay saw considerable drops in their 75th percentile figure between 1986 and 2001 censuses, as to a lesser degree did the Bay of Plenty, Gisborne, Manawatu-Wanganui, West Coast and Otago. In summary, the overall picture is one of even more rapidly increasing inequality than the national figures show. Both intra-regional and intra-regional differentials have opened up. In part, this is because in some regions even the higher paid have seen losses in the real dollar values of incomes at the 75th percentile, and in all regions the lowest income groups have seen declines, as represented by drops in the values at the 25th percentile. 6.1 Ethnicity When examined on an ethnic basis, there is an inter-ethnic difference in the inter-quartile range of over $6,500 in 2001 between Pakeha and Māori for New Zealand as a whole, and for the 75th percentile the dollar difference is even more marked ($8,317); Pakeha at the 75th percentile earned one third more than their Māori peers. The data are presented in Table 7. This difference had increased from 1986 when the gap between Pakeha and Māori was just under $6,000 for the inter-quartile range, and far more importantly for the 75th percentile it was only $6,269. Between 1986 and 2001 the incomes of Maori at the 75th percentile of that ethnic group barely changed, whereas, for Pakeha there was an increase. Intra-ethnic, inter-quartile ranges are much smaller for Māori than for Pakeha. For Pakeha this is mainly due to the higher incomes of those at the 75th percentile, rather than the lower incomes at the 25th percentile, as ethnic differences are low at the 25th percentile. In 1986, no region across New Zealand had a difference at the 25th percentile between ethnic groups of more than $1,000. Thus what was a national pattern held true for every region. By 2001, this gap had increased with the largest of $2,105 being in the Waikato, whereas for the majority of the South Island regions it fell below $1,000. Regional differences in 2001 for Māori at the 75th percentile are also less than for Pakeha (ranges of $8,525 and $13,430 respectively). Nevertheless, these ranges had increased from $5,747 for Māori and $9,281 for Pakeha in 1986. In Wellington and Auckland, which are predominately metropolitan areas the differences between Māori and Pakeha at the 75th percentile are particularly wide, and this is reflected in the inter-quartile ranges for both ethnic groups in these two regions. For the Pakeha population in 2001 the regions with the lowest inter-quartile income ranges were the West Coast, Marlborough and Nelson-Tasman, running between $18,444 and $19,453. These were the same regions which had had low inter-quartile ranges in 1986. Table 7: Standardised1 Incomes (in 1996 Dollars) for Māori and Pakeha: Quartiles and

- 21 -
Inter-Quartile Ranges, by Region, 1986 and 2001 25th Percentile 75th Percentile Inter-quartile range Regions
Pakeha Māori Pakeha Māori Pakeha Māori 1986* Northland 9,313 8,763 29,368 22,822 20,055 14,058 Auckland 10,525 9,998 33,809 26,078 23,283 16,080 Waikato 9,669 8,772 30,534 24,363 20,865 15,590 Bay of Plenty 9,830 9,021 30,418 24,642 20,588 15,621 Gisborne 9,601 9,034 29,417 21,810 19,816 12,776 Hawke's Bay 9,582 9,084 29,946 24,569 20,364 15,485 Taranaki 9,894 8,921 30,468 24,566 20,574 15,645 Manawatu-Wanganui 9,342 9,129 29,370 24,566 20,029 15,437 Wellington 10,813 10,490 35,820 27,557 25,008 17,067 West Coast 8,991 8,893 26,540 22,742 17,548 13,850 Canterbury 9,308 9,560 29,088 24,879 19,780 15,318 Otago 8,902 8,992 28,516 25,839 19,614 16,846 Southland 8,933 8,996 29,359 26,776 20,426 17,780 Nelson-Tasman 9,042 9,966 27,250 23,824 18,208 13,858 Marlborough 8,767 9,546 26,865 25,229 18,098 15,683 New Zealand 9,805 9,368 31,301 25,032 21,496 15,664 Range 2,045 1,726 9,281 5,747 7,459 5,004 2001* Northland 8,216 6,484 29,146 21,061 20,930 14,577 Auckland 10,006 8,159 39,417 29,104 29,410 20,946 Waikato 8,993 6,888 33,087 24,086 24,094 17,198 Bay of Plenty 8,877 6,850 31,541 23,424 22,664 16,574 Gisborne 8,366 6,610 30,240 20,734 21,875 14,124 Hawke's Bay 8,636 6,929 30,090 23,052 21,454 16,123 Taranaki 8,688 6,902 31,466 23,903 22,778 17,002 Manawatu-Wanganui 8,361 7,166 29,587 23,885 21,226 16,719 Wellington 9,874 8,400 38,883 29,259 29,009 20,860 West Coast 7,543 6,706 25,987 22,717 18,444 16,012 Canterbury 8,413 7,568 30,773 25,812 22,359 18,244 Otago 7,774 6,925 28,720 25,241 20,946 18,316 Southland 8,602 7,394 30,354 25,463 21,751 18,069 Nelson-Tasman 8,239 7,591 27,692 23,698 19,453 16,107 Marlborough 8,640 8,236 27,582 25,409 18,941 17,172 New Zealand 8,984 7,300 33,962 25,645 24,978 18,344 Range 2,464 1,915 13,430 8,525 10,966 6,821 * Inflation adjusted to 1996 dollars: see footnote 3 (1) This table has been directly standardised for regional age and gender differences. These results are
comparable between ethnic groups. Intra-ethnic income inequality, as measured by inter-quartile ranges, is least for the Māori populations in Northland and Gisborne. This is not due to the Māori population of these

- 22 -
regions earning high incomes on average, but instead to generally depressed income levels. For example, 50 percent of the Māori population in Northland only earned between $6,484 and $21,061 in the 12 month period before the 2001 Census (1996$). In contrast, 50 percent of the Pakeha population of Auckland earned between $10,006 and $39,417 in the same time period. 7. Regional Gross Personal Incomes So far, the emphasis has been on levels and inequalities for and between groups and regions, an analysis that has pointed to marked social inequalities. But incomes are also a very important determinant of regional product through consumption, savings and investment. Thus it is also useful to estimate aggregate effect26. The share of the national aggregate of personal incomes gained by each region can then be compared with the population distribution. In Table 8 the ratios between the per cent of the national gross personal income generated in any region and the per cent of the New Zealand population living there are presented. Regions that have a ratio greater than one receive a disproportionate share of the national personal income and, those below one less than their share. Table 8: Income Distribution around New Zealand by Region, 1986 and 2001 Percentage of
Gross National Personal Income(1)
Percentage of National Population
Ratio of Percentage Income/Population
1986 2001 1986 2001 1986 2001 Northland 3.4 3.1 3.8 3.7 0.91 0.84 Auckland 29.0 33.9 26.8 31.0 1.08 1.09 Waikato 9.3 9.1 9.8 9.6 0.94 0.95 Bay Of Plenty 5.4 5.8 5.8 6.4 0.93 0.90 Gisborne 1.2 0.9 1.4 1.2 0.86 0.78 Hawke's Bay 3.9 3.3 4.3 3.8 0.91 0.87 Taranaki 3.2 2.6 3.3 2.8 0.97 0.96 Manawatu-Wanganui 6.3 5.1 6.8 5.9 0.92 0.87 Wellington 13.9 13.4 12.0 11.3 1.15 1.18 West Coast 0.9 0.7 1.0 0.8 0.87 0.83 Canterbury 12.7 12.4 13.2 12.9 0.96 0.96 Otago 5.1 4.4 5.5 4.9 0.93 0.91 Southland 2.9 2.3 3.2 2.4 0.92 0.95 Nelson-Tasman 1.9 2.0 2.1 2.2 0.91 0.90 Marlborough 0.9 1.0 1.0 1.1 0.88 0.90 New Zealand 100.0 100.0 100.0 100.0 -- -- (1) Income per region = Average (mean) Personal Income x Population 15 years and over. The region which stands out in this respect is Auckland, where not only do individuals have high median incomes, but where there is also the second highest positive ratio between
26 Ideally the regional product should be used here, but no reliable data are available. In any case the aggregate
of personal incomes is an indication of liquidity and thus the spending power of the regional population, whereas the product includes all goods and services, and thus may comprise some factors that have little direct effect on regional spending power (e.g., the costs of repairing an environmental disaster). The estimates here must be taken merely as indicative or regional patterns.

- 23 -
income and population, the region with a highest ratio is Wellington. What is notable is that all other regions have a ratio between income and population that is below one. The lowest ratio occurs in Gisborne for both 1986 and 2001, with the West Coast also being low for both years. In 1986 the other area with a low ratio had been Marlborough in 2001, this was true for Northland, Hawke’s Bay and Manawatu-Wanganui. Finally, the ratio for both Auckland and Wellington increased between 1986 and 2001, markedly so for Wellington. All other regions except Canterbury, Southland and Marlborough showed decreases. In some cases, especially Gisborne the decrease in the ratio was marked. 8. Conclusion This paper has identified at a population level both the forgotten and favoured New Zealanders. In income terms New Zealand is composed of two sets of regional populations, haves and have nots and some of the latter, say Northland, Gisborne and the West Coast have very depressed incomes by comparison with national levels. Within regions there are also inequalities. In general, as well as when data are disaggregated by age and ethnicity and by regions, adjusting to 1996 dollar values, personal incomes went down then from 1996 rose, but generally not back to 1986 levels. At the same time inequalities rose. To add to this regional aggregate incomes, relative to population, were also unequally distributed, and this increased over the 15 years. These findings generally confirm those of Karagedikli and his collegues (2000 and 2003), where they studied regional inequalities between 1981 and 1996 though their results were not standardised27. In our work here we do not look at the 1981 results. But Karagedikli et. al. showed that there were significant declines in income from 1981 to 1986, indicating that the decreases did not just start in 1986 but earlier. In passing it should be noted that the period 1981-86 saw changes in wages and salaries distorted by the wage-price freeze, that had a perverse benefit of reducing ethnic inequalities (Martin 1998). They also confirm a key finding here, that there was an increasing divergence between, on the one hand, Auckland and Wellington and, on the other hand the rest of New Zealand. Their results showing that inequalities within regions increased between 1986 and 1996, especially for Auckland and Wellington. The differences in income between ethnic groups are due to a mix of different factors. But critical to this is the combination of the disadvantaged position of Māori in terms of employment status (Pool et al. forthcoming-e) and the structural place of Māori within the labour market (Pool et al. forthcoming-d). This complex mix is then further confounded by regional factors. The growing disparity between, on the one hand, Auckland and Wellington, especially the latter, and, on the other hand, the remaining regions, especially some peripheral areas is a clear indicator of differences in development. Two or three regions prospered, some stood still, but some suffered the development of under-development.
27 The index used here is less refined than their’s in one sense, but more so in another as the data used in this
paper have been standardised by age and sex. They used Gini Coefficients, Deciles and Gender-Specific Average Incomes.

- 24 -
At an aggregate level in terms of the access of regions to the national income there is also inequality. Auckland and Wellington gained disproportional and increasing tranches of the national personal income. In this regard every other region was proportionately disfavoured, and most lost significant ground relatively over the decade. Thus the income data here show critical end results of the restructuring of human capital and the building up of inequalities over the last 15 to 20 years. The personal income dimension of financial capital has also become far more inequitable. But as seen this has also had aggregate (region-wide) effects in terms of the quality and under-use of human capital (discouraged workers reported in Pool et al. forthcoming-e), the clustering of the highly skilled into Auckland in particular, and the concentration of gross personal income there and in Wellington. In other papers in this series the effects of these human and financial capital questions will be looked at for families (Cochrane et al. forthcoming; Pool et al. 2005b), but it is necessary to analyse the generation of new flows of human capital – education and training. We do this in a companion study (Pool et al. 2005a).
- 25 -
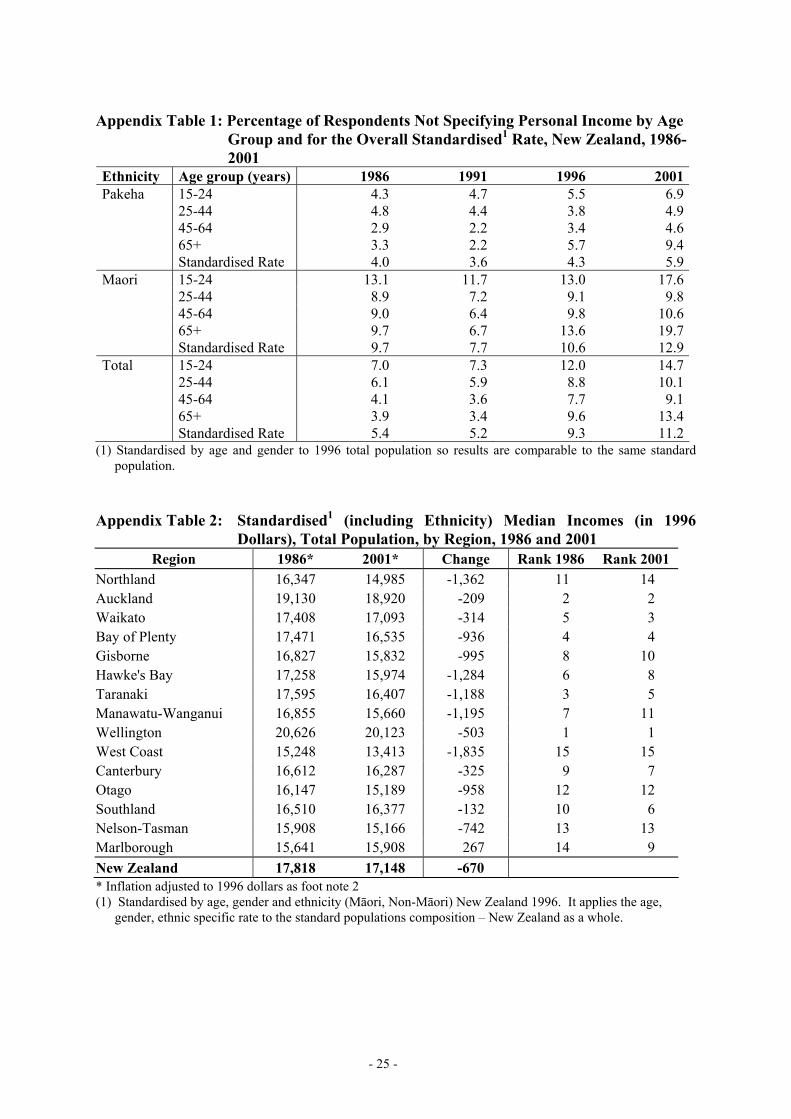
Appendix Table 1: Percentage of Respondents Not Specifying Personal Income by Age
Group and for the Overall Standardised1 Rate, New Zealand, 1986-2001
Ethnicity Age group (years) 1986 1991 1996 2001Pakeha 15-24 4.3 4.7 5.5 6.9 25-44 4.8 4.4 3.8 4.9 45-64 2.9 2.2 3.4 4.6 65+ 3.3 2.2 5.7 9.4 Standardised Rate 4.0 3.6 4.3 5.9Maori 15-24 13.1 11.7 13.0 17.6 25-44 8.9 7.2 9.1 9.8 45-64 9.0 6.4 9.8 10.6 65+ 9.7 6.7 13.6 19.7 Standardised Rate 9.7 7.7 10.6 12.9Total 15-24 7.0 7.3 12.0 14.7 25-44 6.1 5.9 8.8 10.1 45-64 4.1 3.6 7.7 9.1 65+ 3.9 3.4 9.6 13.4 Standardised Rate 5.4 5.2 9.3 11.2
(1) Standardised by age and gender to 1996 total population so results are comparable to the same standard population.
Appendix Table 2: Standardised1 (including Ethnicity) Median Incomes (in 1996
Dollars), Total Population, by Region, 1986 and 2001 Region 1986* 2001* Change Rank 1986 Rank 2001
Northland 16,347 14,985 -1,362 11 14 Auckland 19,130 18,920 -209 2 2 Waikato 17,408 17,093 -314 5 3 Bay of Plenty 17,471 16,535 -936 4 4 Gisborne 16,827 15,832 -995 8 10 Hawke's Bay 17,258 15,974 -1,284 6 8 Taranaki 17,595 16,407 -1,188 3 5 Manawatu-Wanganui 16,855 15,660 -1,195 7 11 Wellington 20,626 20,123 -503 1 1 West Coast 15,248 13,413 -1,835 15 15 Canterbury 16,612 16,287 -325 9 7 Otago 16,147 15,189 -958 12 12 Southland 16,510 16,377 -132 10 6 Nelson-Tasman 15,908 15,166 -742 13 13 Marlborough 15,641 15,908 267 14 9 New Zealand 17,818 17,148 -670 * Inflation adjusted to 1996 dollars as foot note 2 (1) Standardised by age, gender and ethnicity (Māori, Non-Māori) New Zealand 1996. It applies the age,
gender, ethnic specific rate to the standard populations composition – New Zealand as a whole.

- 26 -
Appendix Table 3: Median Incomes (in 1996 Dollars) by Age Group and Region, 1986-2001 a) 15-24 years
Pakeha Māori Total Region 1986* 1991* 1996 2001* 1986* 1991* 1996 2001* 1986* 1991* 1996 2001*
Northland 13,181 8,294 6,992 5,447 11,249 7,284 5,391 5,030 12,581 7,713 6,048 5,097 Auckland1,2 15,514 11,379 9,708 8,268 14,138 9,368 8,581 8,164 14,832 9,931 7,444 6,064 Waikato 13,240 9,364 7,764 6,915 11,367 7,753 5,977 6,205 12,752 8,727 6,925 6,262 Bay of Plenty2 13,837 9,152 8,009 6,173 11,390 7,662 5,785 5,861 13,019 8,345 6,814 5,872 Gisborne 13,690 8,482 7,026 4,568 10,767 7,655 5,309 5,474 12,260 7,907 5,809 5,011 Hawkes Bay 13,699 8,877 7,258 5,724 11,234 7,411 5,829 5,226 13,036 8,157 6,559 5,386 Taranaki 14,196 9,035 7,861 6,182 12,272 7,424 6,031 5,613 13,848 8,527 7,293 5,817 Manawatu-Wanaganui 13,032 8,700 7,148 6,522 12,287 7,833 6,676 6,721 12,793 8,330 6,751 6,235 Wellington1,2 15,576 10,879 8,268 7,789 14,489 9,368 7,322 7,478 14,994 9,984 7,456 7,084 West Coast 14,220 9,929 8,093 7,743 12,331 7,892 7,130 6,575 14,046 9,665 7,968 7,546 Canterbury 13,309 9,035 7,921 7,034 13,347 8,467 7,235 7,352 13,180 8,849 7,261 6,463 Otago 11,513 7,521 5,854 5,287 10,796 7,682 5,677 5,062 11,220 7,465 5,421 4,919 Southland 14,177 9,123 8,509 6,956 12,828 7,796 7,103 5,802 13,960 8,811 8,138 6,697 Nelson-Tasman 13,304 9,147 8,458 6,236 12,912 7,667 8,450 6,371 13,209 8,939 8,146 6,117 Marlborough 13,172 10,664 9,479 7,710 12,468 8,007 7,838 7,625 13,135 10,262 9,069 7,560 New Zealand 14,029 9,566 8,069 7,022 12,734 8,077 6,783 6,626 13,640 8,938 7,054 6,142 Range 4,063 3,858 3,854 3,700 3,722 2,085 3,272 3,135 3,774 2,797 3,648 2,642
* Inflation adjusted to 1996 dollars: see footnote 3 (1) Auckland, and to a lesser extent Wellington, results are affected by a large proportion who are not Māori or Pakeha. (2) Sub-regional information for Auckland, Bay of Plenty and Wellington for 2001 is in Appendix Table 4.

- 27 -
b) 25-44 years Pakeha Māori Total Region
1986* 1991* 1996 2001* 1986* 1991* 1996 2001* 1986* 1991* 1996 2001* Northland 21,959 19,098 19,826 22,245 17,862 12,981 12,907 14,119 20,676 16,830 16,811 18,923 Auckland1 28,185 28,287 29,030 32,111 20,162 17,903 20,702 22,771 25,621 24,543 25,211 26,824 Waikato 23,497 23,127 24,502 25,650 18,669 14,873 15,076 16,794 22,548 21,200 22,017 23,322 Bay of Plenty1 23,474 21,879 23,081 24,392 18,474 14,219 14,606 15,737 22,057 19,373 20,262 21,446 Gisborne 22,365 21,161 22,176 23,320 17,257 13,519 13,606 14,140 20,004 17,196 17,434 18,035 Hawkes Bay 23,060 21,158 21,766 23,467 18,807 14,732 14,302 15,948 22,009 19,359 19,371 20,916 Taranaki 23,886 21,876 23,266 24,015 19,137 14,652 15,455 16,845 23,284 20,845 22,030 22,902 Manawatu-Wanaganui 22,778 21,510 21,995 22,939 19,180 15,434 16,160 16,972 22,053 20,212 20,473 21,316 Wellington1 29,623 29,388 28,924 31,186 21,884 19,442 20,858 22,815 27,835 27,202 26,749 28,475 West Coast 20,600 18,458 18,524 19,271 16,562 14,517 14,375 15,235 20,356 18,099 18,080 18,818 Canterbury 22,766 21,797 23,078 24,300 20,487 17,012 18,350 19,510 22,486 21,254 22,200 23,366 Otago 22,473 21,137 21,851 23,065 21,393 16,632 17,786 19,251 22,281 20,738 21,271 22,498 Southland 22,469 21,071 22,223 23,693 22,106 15,735 17,010 18,896 22,445 20,396 21,471 23,092 Nelson-Tasman 20,686 19,662 20,418 20,891 18,230 15,483 16,308 17,074 20,485 19,341 19,869 20,400 Marlborough 20,568 20,176 21,012 21,822 19,637 15,955 18,140 18,815 20,453 19,792 20,640 21,342 New Zealand 24,858 24,015 25,136 26,619 19,470 15,672 16,848 18,438 23,657 22,078 22,796 24,295 Range 9,055 10,930 10,506 12,840 5,544 6,461 7,951 8,696 7,831 10,371 9,937 10,440
* Inflation adjusted to 1996 dollars: see footnote 3 (1) Sub-regional information for Auckland, Bay of Plenty and Wellington for 2001 is in Appendix Table 4.

- 28 -
c) 45-64 years Pakeha Māori Total Region
1986* 1991* 1996 2001* 1986* 1991* 1996 2001* 1986* 1991* 1996 2001* Northland 18,680 15,507 17,310 20,121 15,070 10,393 10,932 12,766 17,946 14,224 15,501 18,274 Auckland1 23,013 22,680 26,257 29,543 18,657 15,093 18,498 21,131 22,031 20,802 23,669 25,568 Waikato 20,519 18,954 21,816 24,378 16,819 11,918 13,931 15,645 20,052 17,857 20,491 22,837 Bay of Plenty1 19,687 16,713 19,456 22,163 16,760 11,237 13,794 14,838 19,121 15,758 18,278 20,626 Gisborne 20,003 18,333 20,916 23,409 15,899 11,466 12,209 13,734 18,503 15,649 17,431 19,370 Hawkes Bay 19,837 17,514 19,432 22,080 17,515 12,444 13,875 15,593 19,456 16,550 18,308 20,784 Taranaki 20,421 18,321 20,486 22,836 17,028 11,204 13,776 15,216 20,176 17,689 19,707 21,955 Manawatu-Wanaganui 19,386 17,415 19,232 21,665 17,844 12,906 14,238 15,375 19,230 16,876 18,491 20,653 Wellington1 25,808 24,591 26,250 28,773 20,400 17,728 19,021 21,473 25,016 23,424 24,706 26,660 West Coast 16,852 13,671 14,818 16,666 17,468 12,561 13,000 13,591 16,839 13,622 14,688 16,438 Canterbury 18,129 16,113 19,364 22,283 18,365 15,005 17,235 19,210 18,112 16,043 19,068 21,715 Otago 18,465 15,979 18,495 21,545 19,360 14,269 17,215 18,981 18,455 15,947 18,347 21,271 Southland 19,013 16,328 18,906 21,975 23,094 15,492 17,120 18,409 19,250 16,290 18,696 21,583 Nelson-Tasman 17,471 15,227 18,055 20,108 17,640 13,246 17,084 16,689 17,447 15,127 17,877 19,873 Marlborough 16,484 15,229 16,769 19,677 19,408 15,153 17,001 17,454 16,634 15,175 16,806 19,456 New Zealand 20,745 18,996 21,855 24,569 17,699 12,983 14,862 17,091 20,321 18,118 20,609 22,978 Range 9,324 10,920 11,439 12,877 8,024 7,335 8,089 8,707 8,383 9,802 10,019 10,223
* Inflation adjusted to 1996 dollars: see footnote 3 (1) Sub-regional information for Auckland, Bay of Plenty and Wellington for 2001 is in Appendix Table 4.
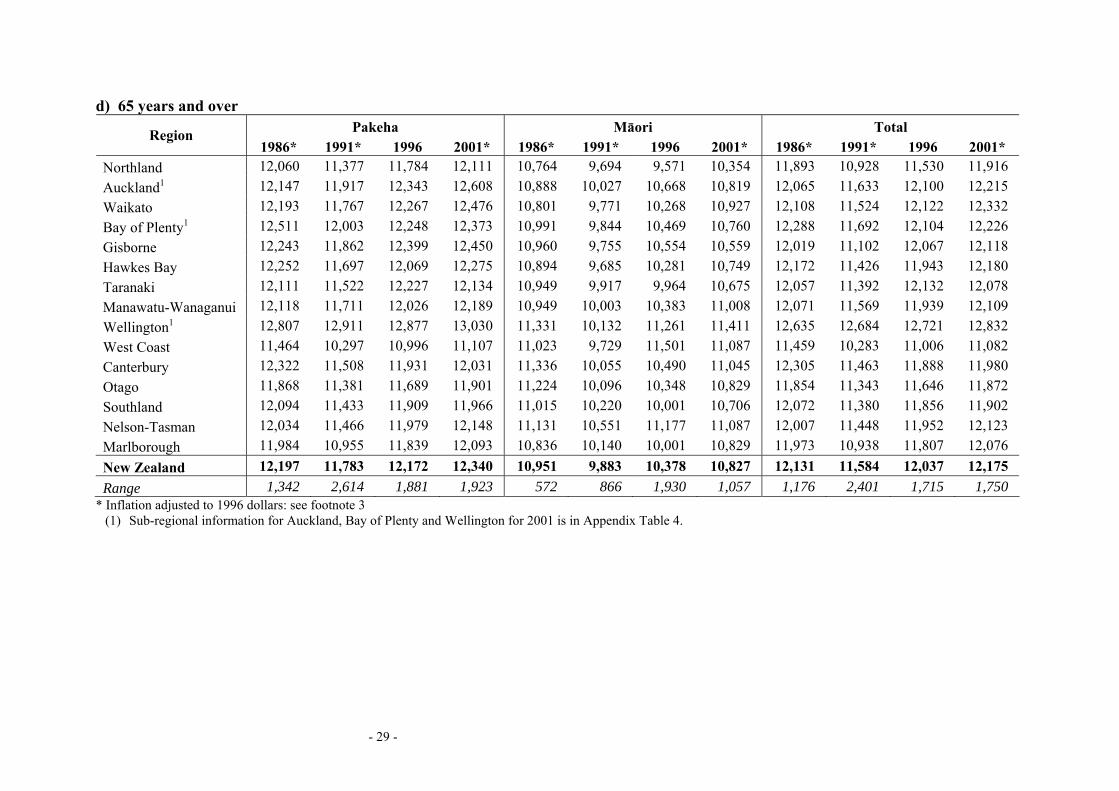
- 29 -
d) 65 years and over Pakeha Māori Total Region
1986* 1991* 1996 2001* 1986* 1991* 1996 2001* 1986* 1991* 1996 2001* Northland 12,060 11,377 11,784 12,111 10,764 9,694 9,571 10,354 11,893 10,928 11,530 11,916 Auckland1 12,147 11,917 12,343 12,608 10,888 10,027 10,668 10,819 12,065 11,633 12,100 12,215 Waikato 12,193 11,767 12,267 12,476 10,801 9,771 10,268 10,927 12,108 11,524 12,122 12,332 Bay of Plenty1 12,511 12,003 12,248 12,373 10,991 9,844 10,469 10,760 12,288 11,692 12,104 12,226 Gisborne 12,243 11,862 12,399 12,450 10,960 9,755 10,554 10,559 12,019 11,102 12,067 12,118 Hawkes Bay 12,252 11,697 12,069 12,275 10,894 9,685 10,281 10,749 12,172 11,426 11,943 12,180 Taranaki 12,111 11,522 12,227 12,134 10,949 9,917 9,964 10,675 12,057 11,392 12,132 12,078 Manawatu-Wanaganui 12,118 11,711 12,026 12,189 10,949 10,003 10,383 11,008 12,071 11,569 11,939 12,109 Wellington1 12,807 12,911 12,877 13,030 11,331 10,132 11,261 11,411 12,635 12,684 12,721 12,832 West Coast 11,464 10,297 10,996 11,107 11,023 9,729 11,501 11,087 11,459 10,283 11,006 11,082 Canterbury 12,322 11,508 11,931 12,031 11,336 10,055 10,490 11,045 12,305 11,463 11,888 11,980 Otago 11,868 11,381 11,689 11,901 11,224 10,096 10,348 10,829 11,854 11,343 11,646 11,872 Southland 12,094 11,433 11,909 11,966 11,015 10,220 10,001 10,706 12,072 11,380 11,856 11,902 Nelson-Tasman 12,034 11,466 11,979 12,148 11,131 10,551 11,177 11,087 12,007 11,448 11,952 12,123 Marlborough 11,984 10,955 11,839 12,093 10,836 10,140 10,001 10,829 11,973 10,938 11,807 12,076 New Zealand 12,197 11,783 12,172 12,340 10,951 9,883 10,378 10,827 12,131 11,584 12,037 12,175 Range 1,342 2,614 1,881 1,923 572 866 1,930 1,057 1,176 2,401 1,715 1,750
* Inflation adjusted to 1996 dollars: see footnote 3 (1) Sub-regional information for Auckland, Bay of Plenty and Wellington for 2001 is in Appendix Table 4.

- 30 -
Appendix Table 4: Median Incomes (in 1996 Dollars) by Age Group and Ethnicity, Urban Areas of the Auckland and Wellington Metropolis, Sub-regions of Bay of Plenty, 2001*
Pakeha Māori Total Sub-Region 15-24 25-44 45-64 65+ 15-24 25-44 45-64 65+ 15-24 25-44 45-64 65+
Auckland Urban Areas North Shore 7,295 31,952 30,298 12,833 8,857 25,914 25,053 11,791 5,478 29,160 28,151 12,661 Western Auckland 8,722 29,231 27,203 11,837 8,639 23,112 22,590 10,889 7,099 25,797 24,599 11,540 Central Auckland 9,209 36,289 32,902 13,094 8,752 24,603 20,905 11,143 6,322 29,098 26,780 12,523 Southern Auckland 8,278 30,897 29,254 12,345 7,604 21,108 20,420 10,353 5,675 24,191 23,671 11,770 Bay of Plenty Sub-regions Western Bay of Plenty 5,868 23,746 21,333 12,468 5,814 16,160 16,197 11,010 5,735 21,934 20,589 12,387 Eastern Bay of Plenty 5,887 24,431 22,013 12,055 4,656 13,223 12,587 10,264 4,931 18,092 18,078 11,739 Rotorua District 7,066 26,191 24,928 12,310 6,996 18,010 16,829 11,093 6,752 22,879 22,959 12,136 Wellington Urban Areas Porirua 6,397 30,531 30,210 12,455 6,436 20,795 20,288 10,559 6,017 24,729 25,307 11,982 Wellington Central 8,606 36,069 35,155 14,381 8,898 27,652 25,267 12,130 7,736 33,411 32,102 13,718 Upper Hutt 7,190 27,754 27,055 12,310 7,973 23,994 23,919 10,889 6,927 26,476 26,162 12,234 Lower Hutt 7,681 29,559 27,863 12,856 7,473 22,334 20,884 12,221 7,068 26,829 25,719 12,654
* Inflation adjusted to 1996 dollars: see footnote 3

- 31 -
References
Amey, B. W. (1997). The Effects of Economic Restructuring on the Maori Family 1981-1991. Unpublished Masters Thesis, University of Waikato.
Bedford, R., Ho, E., Lidgard, J., & Muntz, M. (forthcoming). New Zealand Regions, 1986-2001: Population Mobility, Population Studies Centre Discussion Paper Series. Hamilton: University of Waikato.
Cochrane, W., Pool, I., & Baxendine, S. (forthcoming). New Zealand Regions, 1986-2001: Household Incomes, Joblessness and Parenting, Population Studies Centre Discussion Paper Series. Hamilton: University of Waikato.
Department of Statistics (1991). New Zealand Social Trends: Income. Wellington, New Zealand.: Department of Statistics.
Dixon, S. (1996). The Distribution of Earnings in New Zealand 1984-1995. In P. Morrison (Ed.), Labour, Employment and Work in New Zealand: Proceedings of the Sixth Conference. Victoria University of Wellington: Department of Geography, Victoria University of Wellington, New Zealand.
Easton, B. (1996). Income Distribution. In B. Silverstone, A. Bollard & R. Lattimore (Eds.), A Study of Economic Reform: The Case of New Zealand. Amsterdam: North-Holland.
European Commission/European Foundation for the Improvement of Living and Working Conditions (1996). Working on European Social Policy. Luxembourg: Office for Official Publications of the European Communities.
Honey, J. (1998). Baby-Boom Backwash: A Demographic Perspective of the Employment Opportunities of the "Disadvantaged Generation", University of Waikato.
Karagedikli, O., Mare, D., & Poot, J. (2000). Disparities and Despair: Changes in Regional Income Distributions in New Zealand 1981-1996. Australasian Journal of Regional Studies, 6(3), 323-347.
Karagedikli, Ö., Maré, D., & Poot, J. (2003). Changes in New Zealand Regional Income Distributions 1981-1996. In E. T. Gomez & R. Stephens (Eds.), The State, Economic Development and Ethnic Co-existence in Malaysia and New Zealand, Center for Economic Development and Ethnic Relations, (pp. 221-244). University of Malaya, Kuala Lumpur.
Martin, B. (1997). Away from Equality: Change in Personal Incomes, 1951 to 1991, Population Studies Centre Discussion Paper Number 20. University of Waikato, Hamilton: Population Studies Centre.
— (1998). Incomes of Individuals and Families in New Zealand, 1951 to 1996. Unpublished Ph.D. Thesis, University of Waikato.
Morrison, P. (1996). A Regional Labour Market Profile. In P. Morrison (Ed.), Labour, Employment and Work in New Zealand: Proceedings of the Sixth Conference. Victoria University of Wellington: Geography Dept., Victoria University of Wellington, New Zealand.
Pool, I. (1999). People (=Population) and Public Policy in New Zealand. New Zealand Population Review, 25(1&2), 57-79.
Pool, I. (2003). Ageing, Population Waves, Disordered Cohorts and Policy. New Zealand Population Review, 29(1), 19-40.
Pool, I., Baxendine, S., Bedford, R., Cochrane, W., Lidgard, J., & Lindop, J. (forthcoming-a). Developing Underdevelopment and Geographical Disparities: A Social Demography of New Zealand Regions. Hamilton: Population Studies Centre.

- 32 -
Pool, I., Baxendine, S., Cochrane, W., & Lindop, J. (2005a). New Zealand Regions, 1986-2001: Education and Qualifications, Population Studies Centre Discussion Paper Series. No. 56. Hamilton: University of Waikato.
Pool, I., Baxendine, S., Cochrane, W., & Lindop, J. (2005b). New Zealand Regions, 1986-2001: Household and Families, and their Dwellings, Population Studies Centre Discussion Paper Series. No. 55. Hamilton: University of Waikato.
Pool, I., Baxendine, S., Cochrane, W., & Lindop, J. (forthcoming d) New Zealand Regions, 1986-2001: Industries and Occupations, Population Studies Centre Discussion Paper Series. Hamilton: University of Waikato.
Pool, I., Baxendine, S., Cochrane, W., & Lindop, J. (forthcoming-e). New Zealand Regions, 1986-2001: Labour Market Aspects of Human Capital, Population Studies Centre Discussion Paper Series. Hamilton: University of Waikato.
Pool, I., Baxendine, S., Cochrane, W., & Lindop, J. (2005c). New Zealand Regions, 1986-2001: Population Dynamics, Population Studies Centre Discussion Paper Series. No. 52. Hamilton: University of Waikato.
Pool, I., Baxendine, S., Cochrane, W., & Lindop, J. (2005d) New Zealand Regions, 1986-2001: Population Structures, Population Studies Centre Discussion Paper Series. No. 53. Hamilton: University of Waikato.
Shryock, H. S., Siegel, J. S., & Assoicates (1976). The Methods and Materials of Demography. New York: Academic Press.
Discussion Papers in this series Discussion Paper No.
Title
52 New Zealand Regions, 1986-2001: Population Dynamics 53 New Zealand Regions, 1986-2001: Population Structures 54 New Zealand Regions, 1986-2001: Population Geography 55 New Zealand Regions, 1986-2001: Households and Families, and their
Dwellings 56 New Zealand Regions, 1986-2001: Education and Qualifications 58 New Zealand Regions, 1986-2001: Incomes New Zealand Regions, 1986-2001: Labour Market Aspects of Human Capital New Zealand Regions, 1986-2001: Industries and Occupations New Zealand Regions, 1986-2001: Population Mobility New Zealand Regions, 1986-2001: Household Incomes, Joblessness and
Parenting New Zealand Regions, 1986-2001: Dependency and Development of Social
Capital New Zealand Regions, 1986-2001: Hospitalisation and some of its Health
Contexts

- 33 -
Population Studies Centre Discussion Papers
28 Pool, I. and Honey, J. The Scientific Workforce: Implications for New Zealand’s Future Science Infrastructure, November 1998
29 Lidgard, J. Ho, E., Chen, Y-Y, Goodwin, J. and Bedford, R. Immigrants from Korea, Taiwan and Hong Kong in New Zealand in the mid-1990s: Macro and Micro Perspectives, November 1998
30 Bedford, R., Ho, E. & Skeldon, R. The Asian Financial Crisis and Migration: Perspectives From the Asian Region and New Zealand, December 1998
31 Hillcoat-Nallétamby, S., Dharmalingam, A., Koopman-Boyden, P. & Pool, I. Family Solidarity and the ‘Sandwich Generations’ in New Zealand February 1999
32 Joseph, Alun E. Toward an Understanding of the Interrelated Dynamics of Change in Agriculture and Rural Communities, March 1999
33 Marsault, Anyes, Retirement Provision for New Zealand Women: The Relative Role of Demographic Influences, August 1999
34 Ho, E., Bedford, R. & Bedford, C. Migrants in their Family Contexts: Application of a Methodology, June 2000
35 Martin, B. Sub-National Income Differentials, 1986-1996, July 2000 36 Bedford, R. Perspectives on International Migration, Urban Social Transformation and the Research/Policy
Interface, October 2000 37 Bedford, R., Ho, E. & Lidgard, J. International Migration in New Zealand: Context, Components and Policy
Issues October 2000 38 Bedford R., Lidgard, J. with Mclaughlin, B., Newell, J. Demographic Change and Employment in the Central
North Island, 1986-1996, April 2001 39 Hutton, D. Solo Parenting in New Zealand: who are the Children? August 2001 40 Honey, J. New Zealand Jobs, 1976-1996: A Demographic Accounting, September 2001 41 Lidgard, H. & McLeay, C. Researching Characteristics of People Moving Into and Out of the Western Bay
of Plenty and Tauranga Districts: Some Methodological Issues, April 2002 42 Pool, I. Transfers of Capital and Shifts in New Zealand’s Regional Population Distribution, 1840-1996.
June 2002 43 Pool, I. Why Were New Zealand Levels of Life-Expectation so High at the Dawn of the Twentieth Century?
September 2002 44 Pool, I., Baxendine, S. & Cochrane, B. Components of Regional Population Growth, 1986-2001 May 2004 45 Joseph, A., Lidgard, J. & Bedford R. Rural Trajectories: Diversification and Farm-Community Linkages in
Whakatane District, 1999-2003 July 2004 46 Hillcoat-Natéllamby, S. & Dharmalingam, A. Solidarity across generations in New Zealand: factors
influencing parental support for children within a three-generational context, October 2004. 47 Longhi, S., Nijkamp P., Poot, J. A Meta-Analytic Assessment of the Effect of Immigration on Wages.
December 2004. 48 Cochrane, B. & Poot, J. Measuring the Economic Impact of Immigration: A Scoping Paper, February 2005. 49 Hillcoat-Nallétamby, H & Baxendine, S. The ‘Ins and Outs’ of Work – Diversity or Homogeneity in New
Zealand Women’s Employment Patterns? March 2005. 50 Baxendine, S., Cochrane, B., Dharmalingam, A., Hillcoat-Nallétamby, S. & Poot, J. The New Zealand
Population: A Synopsis of Trends and Projections 1991 – 2016 May 2005. 51 Baxendine, S., Cochrane, B., Poot, J. Demographic Change and Transport Needs in the Waikato Region.
September 2005. 52 Pool, I., Baxendine, S., Cochrane, W., & Lindop, J. New Zealand Regions, 1986-2001: Population Dynamics.
September 2005. 53 Pool, I., Baxendine, S., Cochrane. W., & Lindop, J. New Zealand Regions, 1986-2001: Population
Structures. October 2005. 54 Pool, I., Baxendine, S., Cochrane, W., & Lindop, J. New Zealand Regions, 1986-2001: Population
Geography. October 2005. 55 Pool, I., Baxendine, S., Cochrane, W., & Lindop, J. New Zealand Regions, 1986-2001: Households and
Families and their Dwellings. October 2005. 56 Pool, I., Baxendine, S., Cochrane, W., & Lindop, J. New Zealand Regions, 1986-2001: Education and
Qualifications. October 2005. 57 Baxendine, S., Cochrane, B. & Poot, J. Description and Spatial Analysis of Employment Change in New
Zealand Regions 1986-2001. November 2005. 58 Pool, I., Baxendine, S., Cochrane, W., & Lindop, J. New Zealand Regions, 1986-2001: Incomes. November
2005. Copies (if still in print) can be requested from the Administrative Secretary of the Population Studies Centre at the University of Waikato, Private Bag 3105 Hamilton, New Zealand. Email:[email protected]. Discussion Paper # 33 onwards can be downloaded at http://www.waikato.ac.nz/wfass/populationstudiescentre/discussion-papers.shtml

- 34 -
ISBN: 1-877149-61-6