New Zealand Hake Trawl Fishery PUBLIC CERTIFICATION … · INTERTEK FISHERIES CERTIFICATION ... OS...
231
INTERTEK FISHERIES CERTIFICATION (IFC) NZ Hake Fishery PCR Intertek Fisheries Certification page i INTERTEK FISHERIES CERTIFICATION September 2014 Ref: 82552 New Zealand Hake Trawl Fishery PUBLIC CERTIFICATION REPORT V5 Authors: J Akroyd, G Pilling Conformity Assessment Body: Client: Intertek Fisheries Certification Deepwater Group Limited 10A Victory Park Seafood Industry House Victory Road 74 Cambridge Terrace Derby Private Bag 24901 United Kingdom Wellington 6142 DE24 8ZF New Zealand
-
Upload
phungthien -
Category
Documents
-
view
215 -
download
0
Transcript of New Zealand Hake Trawl Fishery PUBLIC CERTIFICATION … · INTERTEK FISHERIES CERTIFICATION ... OS...
INTERTEK FISHERIES CERTIFICATION (IFC)
NZ Hake Fishery PCR Intertek Fisheries Certification page i
INTERTEK FISHERIES CERTIFICATION
September 2014
Ref: 82552
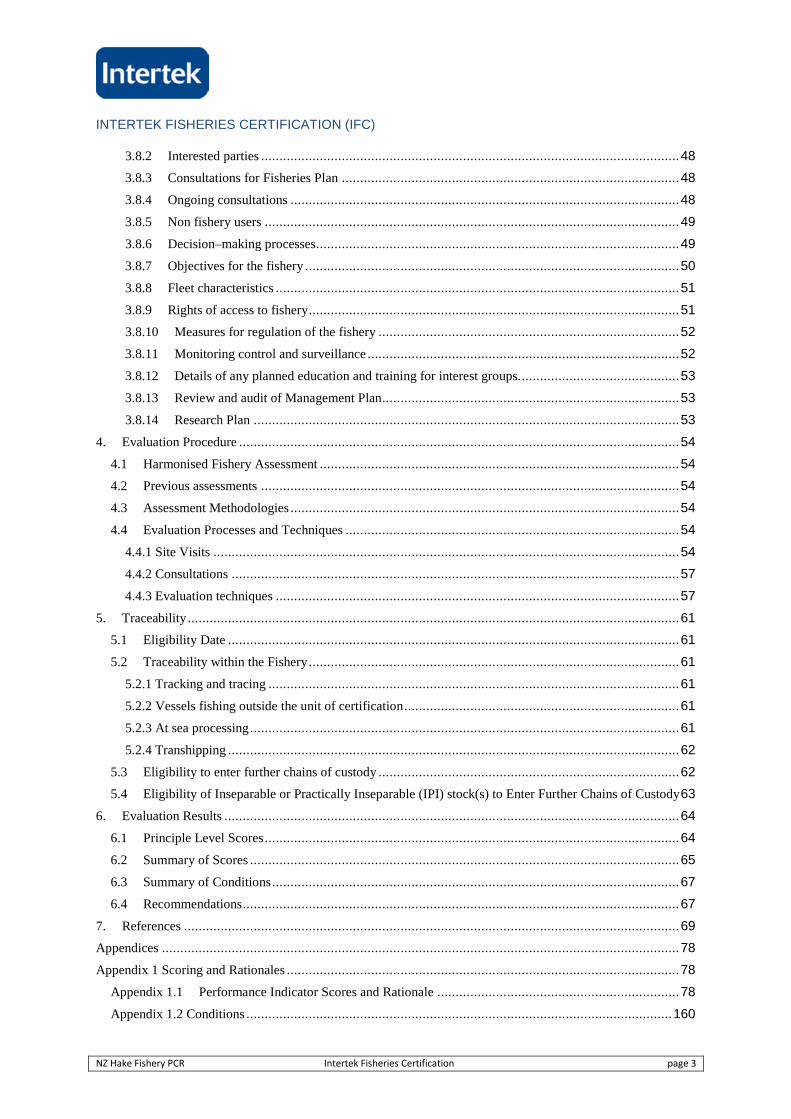
New Zealand Hake Trawl Fishery
PUBLIC CERTIFICATION REPORTV5
Authors: J Akroyd, G Pilling
Conformity Assessment Body: Client:
Intertek Fisheries Certification Deepwater Group Limited10A Victory Park Seafood Industry HouseVictory Road 74 Cambridge TerraceDerby Private Bag 24901United Kingdom Wellington 6142DE24 8ZF New Zealand
INTERTEK FISHERIES CERTIFICATION (IFC)
NZ Hake Fishery PCR Intertek Fisheries Certification page 2
ContentsTables.......................................................................................................................................................4
Glossary of Acronyms and Abbreviations ....................................................................................................5
1. Executive Summary ............................................................................................................................6
1.1 The Intertek Fisheries Certification assessment team........................................................................6
1.2 Process used .................................................................................................................................6
1.3 The main strengths and weaknesses of the client’s operation ............................................................6
1.4 The determination reached.............................................................................................................7
1.5 Scores for each MSC Principle.......................................................................................................7
1.6 Conditions and timescales..............................................................................................................7
2. Authorship and Peer Reviewers ...........................................................................................................8
2.1 Team members .............................................................................................................................8
2.2 Peer Reviewers .............................................................................................................................8
3. Description of the Fishery .................................................................................................................10
3.1 Units of certification and scope of certification sought ...................................................................10
3.1.2 Description of eligible fishers................................................................................................11
3.1.3 Scope of Assessment in Relation to Enhanced Fisheries ..........................................................11
3.1.4 Scope of Assessment in Relation to Introduced Species Based Fisheries (ISBF) ........................12
3.2 Overview of the fishery ...............................................................................................................12
3.2.1 Management operation .........................................................................................................12
3.2.2 Species types .......................................................................................................................12
3.3 Management history, fishing practices, historical fishing levels ......................................................13
3.3.1 Fleet and Gear Description....................................................................................................13
3.3.2 History of fishing and management........................................................................................15
3.3.3 User rights ...........................................................................................................................17
3.4 Principle One: Target Species Background....................................................................................18
3.4.1 Summary of the fishery.........................................................................................................18
3.4.2 Stock assessment and the status of stocks ...............................................................................19
3.4.3 Assessments and Information ................................................................................................19
3.5 Management advice ....................................................................................................................24
3.5.1 Overview.............................................................................................................................24
3.6 Low trophic level ........................................................................................................................27
3.7 Principle Two: Ecosystem Background.........................................................................................28
3.7.1 The aquatic ecosystem, its status and any particularly sensitive areas, habitats or ecosystemfeatures influencing or affected by the fishery ....................................................................................28
3.7.2 The retained, bycatch and endangered, threatened or protected (ETP) species including their statusand relevant management history ......................................................................................................30
3.8 Principle Three: Management System Background ........................................................................47
3.8.1 The management system .......................................................................................................47
INTERTEK FISHERIES CERTIFICATION (IFC)
NZ Hake Fishery PCR Intertek Fisheries Certification page 3
3.8.2 Interested parties ..................................................................................................................48
3.8.3 Consultations for Fisheries Plan ............................................................................................48
3.8.4 Ongoing consultations ..........................................................................................................48
3.8.5 Non fishery users .................................................................................................................49
3.8.6 Decision–making processes...................................................................................................49
3.8.7 Objectives for the fishery ......................................................................................................50
3.8.8 Fleet characteristics ..............................................................................................................51
3.8.9 Rights of access to fishery.....................................................................................................51
3.8.10 Measures for regulation of the fishery ..................................................................................52
3.8.11 Monitoring control and surveillance .....................................................................................52
3.8.12 Details of any planned education and training for interest groups............................................53
3.8.13 Review and audit of Management Plan.................................................................................53
3.8.14 Research Plan ....................................................................................................................53
4. Evaluation Procedure ........................................................................................................................54
4.1 Harmonised Fishery Assessment ..................................................................................................54
4.2 Previous assessments ..................................................................................................................54
4.3 Assessment Methodologies ..........................................................................................................54
4.4 Evaluation Processes and Techniques ...........................................................................................54
4.4.1 Site Visits ...............................................................................................................................54
4.4.2 Consultations ..........................................................................................................................57
4.4.3 Evaluation techniques ..............................................................................................................57
5. Traceability......................................................................................................................................61
5.1 Eligibility Date ...........................................................................................................................61
5.2 Traceability within the Fishery.....................................................................................................61
5.2.1 Tracking and tracing ................................................................................................................61
5.2.2 Vessels fishing outside the unit of certification...........................................................................61
5.2.3 At sea processing.....................................................................................................................61
5.2.4 Transhipping ...........................................................................................................................62
5.3 Eligibility to enter further chains of custody ..................................................................................62
5.4 Eligibility of Inseparable or Practically Inseparable (IPI) stock(s) to Enter Further Chains of Custody63
6. Evaluation Results ............................................................................................................................64
6.1 Principle Level Scores.................................................................................................................64
6.2 Summary of Scores .....................................................................................................................65
6.3 Summary of Conditions...............................................................................................................67
6.4 Recommendations.......................................................................................................................67
7. References .......................................................................................................................................69
Appendices .............................................................................................................................................78
Appendix 1 Scoring and Rationales ...........................................................................................................78
Appendix 1.1 Performance Indicator Scores and Rationale ..................................................................78
Appendix 1.2 Conditions ....................................................................................................................160
INTERTEK FISHERIES CERTIFICATION (IFC)
NZ Hake Fishery PCR Intertek Fisheries Certification page 4
Appendix 2 Peer reviewers reports .........................................................................................................161
Appendix 3. Stakeholder submissions......................................................................................................190
2009 Stakeholders Interviews .............................................................................................................190
2012 Interviews .................................................................................................................................196
Written submissions made by stakeholders ..........................................................................................207
Appendix 4. Surveillance Frequency .......................................................................................................229
Appendix 5. Client Agreement................................................................................................................230
Appendix 5.1 Objections Process ........................................................................................................231
Figures
Figure 1 : Location of NZ Hake fisheries management areas .............................................................. 11
Figure 2 : Quota management areas (QMAs) HAK1, 4, 7 and 10........................................................ 15
Figure 3. Identified colonies of Black Corals from records within New Zealand waters ..................... 43
Figure 4: Identified colonies of Errina from records within New Zealand waters. .............................. 43
Figure 5 Maps of the 20-class version of the 2005 general purpose Marine Environment Classificationand Benthic Optimised Marine Environment Classification. ............................................................... 44
Figure 6: Map showing the general location of benthic protection areas within NZ EEZ.................... 46
Tables
Table 1: Table of Scores ........................................................................................................................ 7
Table 2 : Reported hake catches (t) from 1975 to 1987–88.. ................................................................ 16
Table 3: Reported landings (t) of hake by fish stock ..........................................................................17
Table 4: Reference points and current state of stock for hake. . ........................................................... 20
Table 5 : Current catches, TACCs and results of projections for tested catches ..................................25
Table 6: Top ten retained and bycatch species from the hake-targeted trawl fishery. .......................... 31
Table 7: Overview of the status of the stocks of the QMS species ..................................................... 35
Table 8 : Summary of all bird captures in hake trawl fisheries............................................................. 38
Table 9: Summary of all bird captures in hoki fisheries .......................................................................39
Table 10: Summary of New Zealand fur seal captures in hake trawl fisheries. ....................................41
Table 11: Swept area of hake-targeted tows between 1989-90 and 2009-10.......................................46
Table 12 : List of stakeholders consulted during the 2009 assessment................................................. 55
Table 13 : List of stakeholders consulted during 2013 assessment...................................................... 56
Table 14 : Final Principle Scores ..........................................................................................................64
INTERTEK FISHERIES CERTIFICATION (IFC)
NZ Hake Fishery PCR Intertek Fisheries Certification page 5
Glossary of Acronyms and Abbreviations
ACE Annual Catch EntitlementB0 Unfished Equilibrium BiomassBPA Benthic Protection AreaCAB Conformance Assessment BodyCAY Current Annual YieldCITES Convention on International Trade in Endangered SpeciesCPUE Catch per Unit EffortCR Certification RequirementsDOC New Zealand Department of ConservationDWG Deep Water Group LtdEEZ Exclusive Economic ZoneETP Endangered, Threatened, Protected SpeciesEU European UnionF Fishing MortalityFAO Food and Agriculture Organisation of the United NationsFCV Foreign Charter VesselsFAM Fisheries Assessment MethodologyHAK HakeHOK HokiINMARC Interim Nearshore Marine ClassificationIPI Inseparable or Practically InseparableLFR Licensed Fish ReceiversLIN LingLTL Low Trophic LevelMCMC Markov Chain Monte Carlo MethodMCS Monitor, Control and SurveillanceMCY Maximum Constant YieldMFish New Zealand Ministry of FisheriesMHR Monthly Harvest ReturnsMPD Maximum Posterior DensityMPI Ministry forPrimary IndustriesMSY Maximum Sustainable YieldsNIWA National Institute of Water and Atmospheric ResearchNPA National Plan of ActionsNZ New ZealandOS Ocean SurveyPSA Productivity Sensitivity AnalysisQMA Quota Management AreaQMS Quota Management SystemRFMO Regional Fisheries Management OrganisationsSPRFMO South Pacific Regional Fisheries Management OrganisationsTAC Total Allowable CatchTACC Total Allowable Commercial CatchTCEPR Trawl Catch, Effort and Processing ReturnUTF Underwater topographical featuresVME Vulnerable Marine EcosystemVMP Vessel Management PlansVMS Vessel Monitoring SystemWWF World Wildlife Fund
INTERTEK FISHERIES CERTIFICATION (IFC)
NZ Hake Fishery PCR Intertek Fisheries Certification page 6
1. Executive Summary
1.1 The Intertek Fisheries Certification assessment team
An assessment of the New Zealand hake trawl fishery using Marine Stewardship Council (MSC)Principles and Criteria was carried out in 2009 by a team of three Intertek Moody Marine assessors:Dr Paul Medley (Principle 1), Dr. Graham Pilling (Principle 2) and Jo Akroyd (Principle 3) withAndrew Hough as Lead Assessor. At the client’s request the assessment process was put on hold andthen recommenced in 2013, with two of the original assessors: Jo Akroyd (Lead and P3) and GrahamPilling (P1 and P2). Paul Knapman joined as Project Director. In the course of this assessmentIntertek Moody Marine changed its name to Intertek Fisheries Certification (IFC).
1.2 Process used
A site visit was made to Nelson and Wellington, New Zealand in June 2009, and an evaluation of theNew Zealand hake fishery was undertaken against the MSC “Principles and criteria for sustainablefishing (November 2002)”. Information gathered during this site visit was then used in conjunctionwith other available literature to produce a draft report and score the fishery against the MSCPerformance Indicators. The MSC Fisheries Assessment Methodology (FAM) v1 (January 2008) wasused. The draft report and scores of the fishery were then presented to the client, Deepwater Group(DWG), for review. The client determined that it would delay the assessment process until particularissues within the fishery had been addressed. In August 2013 the client requested that the assessmentbe resumed. To ensure the assessment was brought up to date with current information and to givestakeholders a further opportunity to participate in the assessment process, a second site visit toWellington took place in September 2013. Two of the original assessors from IMM (Jo Akroyd andGraham Pilling) formed the IFC assessment team. During this site visit the assessment team madeitself available to stakeholders and reviewed all additional information relevant to the hake fisherybefore preparing this version (v2) of the preliminary client draft assessment report. Part C of the MSCCertification Requirements V1.3 January 2013, the default assessment tree, the MSC Guidance to theMSC Certification Requirements V1.3 and the MSC full assessment report template were used for thisassessment.
1.3 The main strengths and weaknesses of the client’s operation
The New Zealand hake trawl fishery has been managed under the New Zealand Quota ManagementSystem (QMS) since its introduction in 1986. Since then there have been many improvements in themanagement of the fishery. There are now well-defined and documented processes for most of theoperations. The amount of data available to evaluate consistency with the MSC Criteria is also asignificant strength. The New Zealand hoki fishery has been MSC certified since 2001. Many of theoperators and managers are the same for both fisheries.
There is a partnership approach to fisheries management between the DWG and the Ministry forPrimary Industries1 (MPI), underpinned by a Memorandum of Understanding. The two parties havedeveloped a single joint-management framework with agreed strategic and operational priorities andwork plans.
The strong communication and on-going liaison between DWG and their operators is an importantfactor.
1On July 1, 2011 the Ministry of Fisheries (MFish) merged with the Ministry of Agriculture and Forestry. The new Ministry
became the Ministry for Primary Industries (MPI) on 30 April 2012.
INTERTEK FISHERIES CERTIFICATION (IFC)
NZ Hake Fishery PCR Intertek Fisheries Certification page 7
In recent years, the client has supported a shift away from prescriptive regulatory fisheriesmanagement to a strong focus on more collaborative fisheries management, including industryimplementation of operational plans which are monitored and audited by Government.
1.4 The determination reached
It has been determined by Intertek Fisheries Certification that this fishery should be certified inaccordance to the MSC principles and criteria.
There are no conditions
1.5 Scores for each MSC Principle
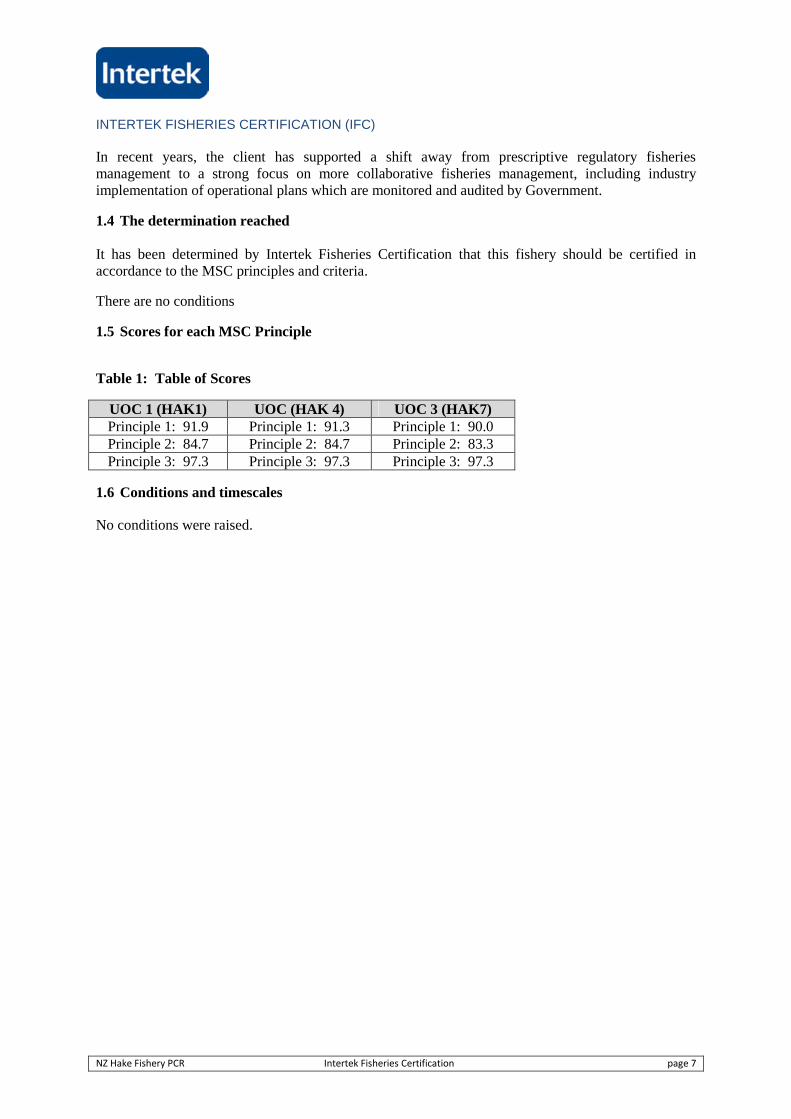
Table 1: Table of Scores
UOC 1 (HAK1) UOC (HAK 4) UOC 3 (HAK7)Principle 1: 91.9 Principle 1: 91.3 Principle 1: 90.0Principle 2: 84.7 Principle 2: 84.7 Principle 2: 83.3Principle 3: 97.3 Principle 3: 97.3 Principle 3: 97.3
1.6 Conditions and timescales
No conditions were raised.
INTERTEK FISHERIES CERTIFICATION (IFC)
NZ Hake Fishery PCR Intertek Fisheries Certification page 8
2. Authorship and Peer Reviewers
2.1 Team members
Jo Akroyd: Expert Advisor P3 and Lead Assessor. Jo is a fisheries management and marineecosystem consultant with extensive international and Pacific experience. She has worked at seniorlevels in both the public and private sector as a fisheries manager and marine policy expert. Jo waswith the Ministry of Agriculture and Fisheries in New Zealand for 20 years. Starting as a fisheriesscientist, she was promoted to senior chief fisheries scientist, then Fisheries Management Officer, andthe Assistant Director, Marine Research. She was awarded a Commemoration Medal in 1990 inrecognition of her pioneering work in establishing New Zealand’s fisheries quota managementsystem. Among her current contracted activities, she is involved internationally in fishery certificationof offshore, inshore and shellfish fisheries as Fisheries Management Specialist and Lead Assessor forthe Intertek Fisheries Certification audit team. She has carried out the Marine Stewardship Council’s(MSC) certification assessment for sustainable fisheries. Examples include New Zealand (hoki,southern blue whiting, albacore, scallops), Fiji (longline albacore) Japan (pole and line tuna, flatfish,snowcrab, scallops), China (scallops), and Antarctica (Ross Sea tooth fishery).
Dr Graham Pilling: P1 and P2 Expert Advisor. Currently a senior fisheries scientist at theSecretariat of the Pacific Community, Graham has over nineteen years’ experience working intropical, temperate and polar marine and freshwater ecosystems, gaining in depth experience in thepractical assessment and management of pelagic and demersal fisheries through a wide range ofmethodologies, and the provision of scientific advice to fisheries managers around the world.Fisheries studied include industrial tuna fisheries and artisanal reef fisheries in the tropics and ArabianGulf. The impacts of anthropogenic influences such as oil spill events and climate change on fishstocks and fisheries have been examined. Graham has designed and developed models to simulate thelong-term impacts of uncertainty in stock biology and assessments on fisheries management, andmethods to assess and manage data poor fisheries. He has also reviewed international biological stockassessments for scientific rigor. Chair of STECF SGMED (2008) and FAO GFCM stock assessmentmeetings for assessment of demersal species within the Mediterranean Sea (2008 and 2009), and chairof the FAO meeting on data poor fisheries (2010). Member of a large number of Marine StewardshipCouncil accreditation teams assessing fisheries for sustainability against the MSC principles. Hasplayed a key role at international commissions in tropical and polar regions. His work has contributedsignificantly to the institutional strengthening of fisheries institutions in the tropics.
Paul Knapman: General Manager/Project Director. Paul is the General Manager and a LeadAssessor for Intertek Fisheries Certification. He has extensive experience of the fishing industry inNorth America and Europe. He was previously a fisheries consultant working in Europe and Canada;Head of a UK inshore fisheries management organization; a senior policy advisor to the UKgovernment on fisheries and environmental issues; and a fisheries officer.
2.2 Peer Reviewers
Dr. Rob Blyth-Skyrme
Rob has worked in aquaculture and then in marine fisheries science, management and policy since1996. Rob started his career in finfish mariculture, before switching to a focus on wild fisheries.Following his PhD which focussed on fisheries management and the environmental effects of fishing,he moved to Eastern Sea Fisheries Joint Committee, the largest inshore fisheries managementorganization in England, where he became the Deputy Chief Fishery Officer. He then became a senioradvisor to the UK Government on marine fisheries and environmental issues, leading a team dealingwith fisheries policy, science and nationally significant fisheries and environmental casework. He has
INTERTEK FISHERIES CERTIFICATION (IFC)
NZ Hake Fishery PCR Intertek Fisheries Certification page 9
extensive experience of running and providing lead input to workshops and management fora at anational level, and has published a number of papers in peer-reviewed international journals. Rob nowruns Ichthys Marine Ecological Consulting Ltd., a marine fisheries and environmental consultancy.From late 2008, he based the company in Hawaii, but he returned to the UK in summer 2013 tocontinue the business. In addition to other fisheries and environmental consultancy work, Rob hasundertaken all facets of MSC work as a Lead Assessor and expert team member, across variedfisheries including those for Alaska pollock, Pacific cod, Alaska salmon, North Pacific albacore,Grand Bank yellowtail flounder, Arctic surfclams and European mussels.
Dr. Johanna Pierre
Johanna completed her BSc (Hons) in Zoology at the University of Canterbury, New Zealand, andfollowed that with a PhD in ecology and environmental biology at the University of Alberta, Canada.In the course of conducting her PhD research on the ecological impacts of forestry activities innorthern Canada, she became especially interested in working at the environment - economicinterface. After completing a post-doctoral fellowship in biodiversity science at the University ofTokyo, Japan, Johanna returned to New Zealand to work at the Department of Conservation (DOC).During her time at DOC, Johanna focussed on the environmental effects of fishing. This includedleading a team producing science, policy and management tools for the New Zealand commercialfisheries environment. As well as working with New Zealand-based stakeholders, Johanna maintainedextensive international engagement, for example, with Regional Fisheries Management Organisations,as New Zealand representative for the Agreement on the Conservation of Albatrosses and Petrels, andas a practising scientist. Johanna went on to lead New Zealand's science and innovation engagementwith Asia for the Ministry of Science and Innovation. She now consults fulltime, currently focussingon marine science and fisheries issues.
INTERTEK FISHERIES CERTIFICATION (IFC)
NZ Hake Fishery PCR Intertek Fisheries Certification page 10
3. Description of the Fishery
3.1 Units of certification and scope of certification sought
Intertek Fisheries Certification (IFC) can verify that this fishery is not being conducted under a controversialunilateral exemption to an international agreement and so conforms to Principle 3, Criterion A1 (MSCCertification Requirements v1.3 January 2013 (CR)). Fishing operations do not use destructive fishing practicessuch as fishing with poisons or explosions so conform to Principle 3, Criterion B14 (MSC CR 1.3)
The Units of Certification (UoC) for the assessment
UoC 1Species: Hake (Merluccius australis)Geographical Area: HAK1 (see Figure 1 below)Method of Capture: TrawlManagement System: NZ Quota Management System (Ministry for Primary Industries [MPI])Client Group: NZ Deepwater Group Ltd
UoC 2Species: Hake (Merluccius australis)Geographical Area: HAK4 (see Figure 1 below)Method of Capture: TrawlManagement System: NZ Quota Management System (MPI)Client Group: NZ Deepwater Group Ltd
UoC 3Species: Hake (Merluccius australis)Geographical Area: HAK7 (see Figure 1 below)Method of Capture: TrawlManagement System: NZ Quota Management System (MPI)Client Group: NZ Deepwater Group Ltd
3.1.1 Rationale for UoCs
The MSC requirements specify that the UoC is "The target stock(s) combined with the fishingmethod/gear and practice (including vessel/s) pursuing that stock”.
The target stock and the fishing method are the same for each UoC. However, there are threegeographical management areas requiring three UoCs.
Current management divides the fishery into three fish stocks: (a) the Challenger QMA (HAK 7), (b)the Chatham Rise QMA (HAK 4) and (c), the remainder of the EEZ comprising the Auckland,Central, Southeast (Coast), Southland and Sub-Antarctic QMAs (HAK 1). An administrative fishstock (with no recorded landings) exists for the Kermadec QMA (HAK 10).
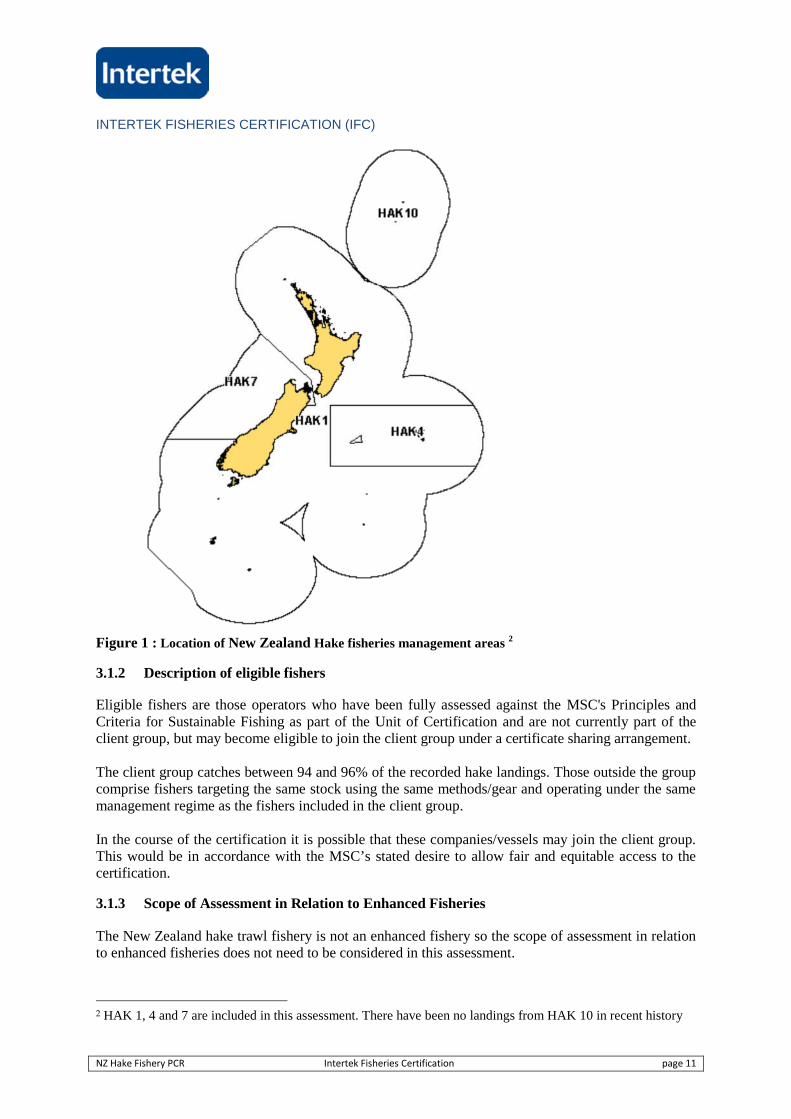
The location of the hake fishery geographical areas is shown in Figure 1 below.
INTERTEK FISHERIES CERTIFICATION (IFC)
NZ Hake Fishery PCR Intertek Fisheries Certification page 11
Figure 1 : Location of New Zealand Hake fisheries management areas 2
3.1.2 Description of eligible fishers
Eligible fishers are those operators who have been fully assessed against the MSC's Principles andCriteria for Sustainable Fishing as part of the Unit of Certification and are not currently part of theclient group, but may become eligible to join the client group under a certificate sharing arrangement.
The client group catches between 94 and 96% of the recorded hake landings. Those outside the groupcomprise fishers targeting the same stock using the same methods/gear and operating under the samemanagement regime as the fishers included in the client group.
In the course of the certification it is possible that these companies/vessels may join the client group.This would be in accordance with the MSC’s stated desire to allow fair and equitable access to thecertification.
3.1.3 Scope of Assessment in Relation to Enhanced Fisheries
The New Zealand hake trawl fishery is not an enhanced fishery so the scope of assessment in relationto enhanced fisheries does not need to be considered in this assessment.
2 HAK 1, 4 and 7 are included in this assessment. There have been no landings from HAK 10 in recent history
INTERTEK FISHERIES CERTIFICATION (IFC)
NZ Hake Fishery PCR Intertek Fisheries Certification page 12
3.1.4 Scope of Assessment in Relation to Introduced Species Based Fisheries (ISBF)
Merluccius australis are native to New Zealand and so the assessment is not required to consider thefishery against the ISBF criteria.
3.2 Overview of the fishery
3.2.1 Management operation
DWG was formed in September 2005. The company is an amalgamation of EEZ fisheries quotaowners in New Zealand. It is a non-profit organisation. Fisheries managed by DWG are those targetedcommercially and usually fished at depths between 200 and 1,200 m. These include hoki, hake, ling,orange roughy, oreo dory, squid and jack mackerel.
Prior to September 2005, there were separate management companies for each of the hoki, squid andorange roughy fisheries in New Zealand. In 2005, the three companies agreed to amalgamate, andcombine all deepwater interests in a single management company with a mission to optimise thesustainable economic value of New Zealand deepwater fisheries.
Activities of the DWG include: representing the interests of quota holders with Government and government departments; undertaking fisheries research and stock assessment programs; implementing and monitoring fisheries management programs; working on multiple fronts to manage and minimise any adverse environmental affects; ensuring integrity at all levels of process and engagement; and maintaining fisheries management standards that meet or exceed those required for MSC
Certification.
The New Zealand deepwater fisheries industry involves more than 50 seafood companies, whichbetween them operate more than 60 commercial vessels and collectively employ more than 15,000people.
3.2.2 Species types
New Zealand hake belongs to the Merlucciidae family. Hake are widely distributed throughout themiddle depths of the New Zealand EEZ, mostly south of 40° S. Adults are mainly distributed from250–800 m, but some have been found as deep as 1200 m, while juveniles (0+) are found in inshoreregions shallower than 250 m.
Hake are taken mainly by large trawlers. It is a relatively high value fishery. The largest hake fisheryhas been off the west coast of the South Island (HAK 7). This fishery has traditionally consisted ofby-catch in the much larger hoki fishery but in recent years it has also become an important targetfishery. In the last five years about 77% of hake taken was targeted.
The Chatham Rise hake fishery (HAK 4) has also changed from a by-catch of the hoki fishery to atarget fishery; about 75% of hake has been caught as a target species in the last five years.
Over the last five years about 57% of hake caught in HAK 1 has also been as a target fishery and mostof the catch has come from the Sub-Antarctic.
INTERTEK FISHERIES CERTIFICATION (IFC)
NZ Hake Fishery PCR Intertek Fisheries Certification page 13
3.3 Management history, fishing practices, historical fishing levels
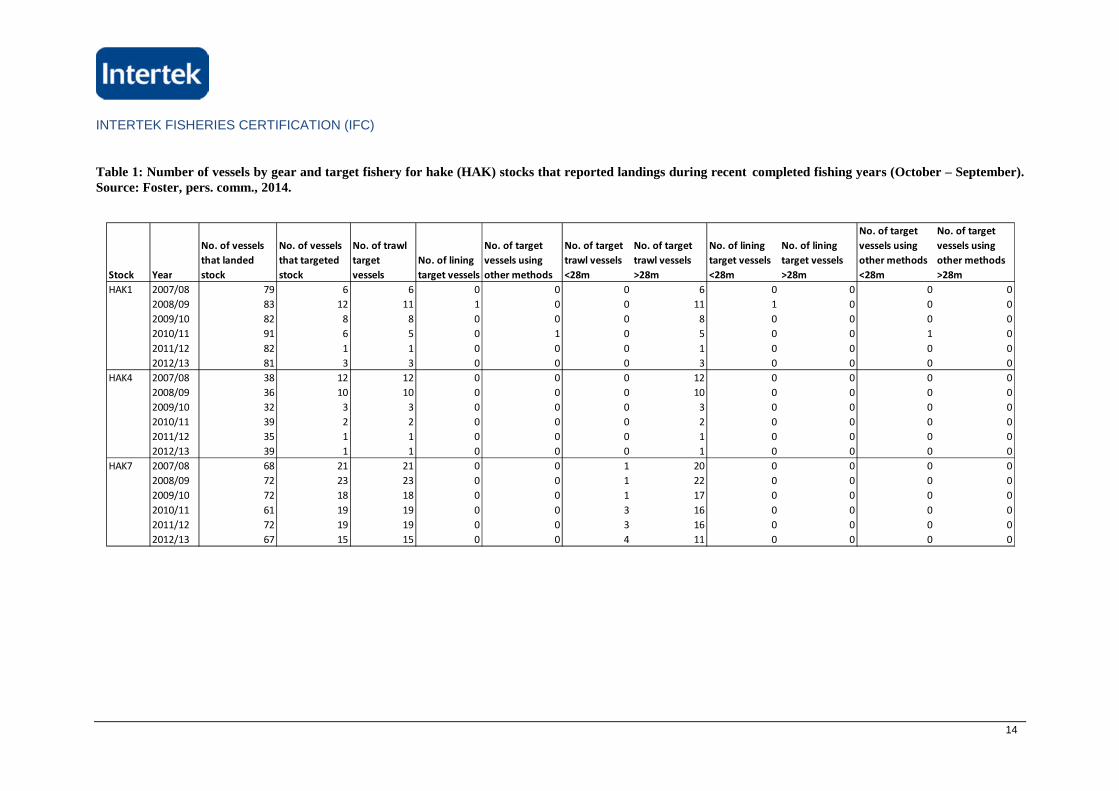
3.3.1 Fleet and Gear DescriptionThe fleets for the deep and mid-water fisheries of hake consist of trawls (Table 1).
The trawl vessels utilise high aspect ratio multipurpose doors which allow bottom or midwateroperation. Vessels exclusively use Furuno CN22/24 net monitoring system electronics, whichmonitors the headline height, groundrope/seabed relationship and water temperature. Some of thefleet have Scanmar or Simrad net monitoring of door spread and codend “fullness”, but none havetrawl sonar, as cabled systems are currently illegal.
Bottom trawl nets are of single or twin-rig and of two types:
Alfredo derivatives which are characterised by low twine surface area (small nets), lowheadline height (3-5m), short groundrope (20-30m), small mesh (max 300mm, min 100mm)and medium groundrigs (300-450mm rubber bobbins).
“Korean” type multipurpose trawls which are characterised by similar headline height andmesh sizes to Alfredo types, but longer groundrope and wings and small groundrope rigs.
The mid-water trawls tend to be domestic in origin with a wide range of sizes measured by eitherheadline length or headline opening (opening from 25-75m). They have an all nylon net with ropeconstruction in the forepanel mesh in body and weights to open the net. Mesh sizes range from 65m to100mm and can be used as pelagic or semi-pelagic gear.
“Kapron” trawls are used by the Russian/Ukraine fleet. The nets are of nylon construction with 12mmaximum mesh size and a 60m maximum opening. They are a multipurpose trawl used on widevariety of species.
The hake fishery has a minimum mesh size of 100mm for the cod end mesh.
INTERTEK FISHERIES CERTIFICATION (IFC)
14
Table 1: Number of vessels by gear and target fishery for hake (HAK) stocks that reported landings during recent completed fishing years (October – September).Source: Foster, pers. comm., 2014.
Stock Year
No. of vessels
that landed
stock
No. of vessels
that targeted
stock
No. of trawl
target
vessels
No. of lining
target vessels
No. of target
vessels using
other methods
No. of target
trawl vessels
<28m
No. of target
trawl vessels
>28m
No. of lining
target vessels
<28m
No. of lining
target vessels
>28m
No. of target
vessels using
other methods
<28m
No. of target
vessels using
other methods
>28m
2007/08 79 6 6 0 0 0 6 0 0 0 0
2008/09 83 12 11 1 0 0 11 1 0 0 0
2009/10 82 8 8 0 0 0 8 0 0 0 0
2010/11 91 6 5 0 1 0 5 0 0 1 0
2011/12 82 1 1 0 0 0 1 0 0 0 0
2012/13 81 3 3 0 0 0 3 0 0 0 0
2007/08 38 12 12 0 0 0 12 0 0 0 0
2008/09 36 10 10 0 0 0 10 0 0 0 0
2009/10 32 3 3 0 0 0 3 0 0 0 0
2010/11 39 2 2 0 0 0 2 0 0 0 0
2011/12 35 1 1 0 0 0 1 0 0 0 0
2012/13 39 1 1 0 0 0 1 0 0 0 0
2007/08 68 21 21 0 0 1 20 0 0 0 0
2008/09 72 23 23 0 0 1 22 0 0 0 0
2009/10 72 18 18 0 0 1 17 0 0 0 0
2010/11 61 19 19 0 0 3 16 0 0 0 0
2011/12 72 19 19 0 0 3 16 0 0 0 0
2012/13 67 15 15 0 0 4 11 0 0 0 0
HAK1
HAK4
HAK7
INTERTEK FISHERIES CERTIFICATION (IFC)
NZ Hake Fishery PCR Intertek Fisheries Certification page 15
3.3.2 History of fishing and management
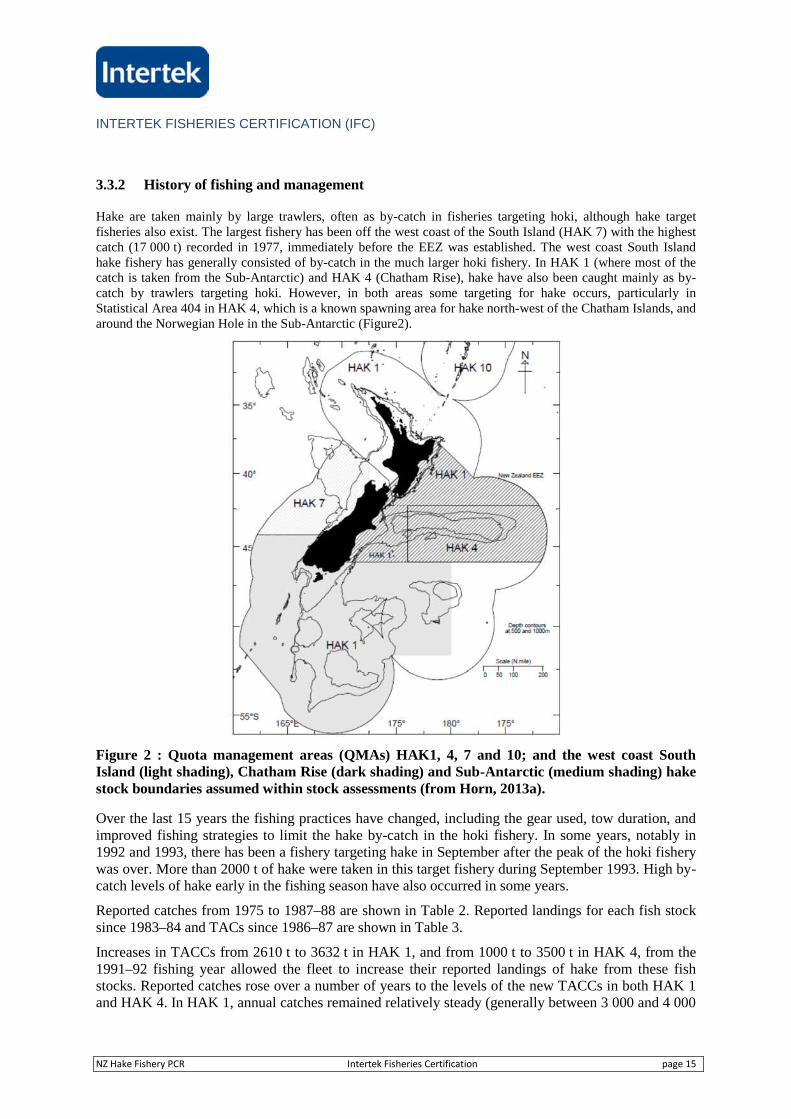
Hake are taken mainly by large trawlers, often as by-catch in fisheries targeting hoki, although hake targetfisheries also exist. The largest fishery has been off the west coast of the South Island (HAK 7) with the highestcatch (17 000 t) recorded in 1977, immediately before the EEZ was established. The west coast South Islandhake fishery has generally consisted of by-catch in the much larger hoki fishery. In HAK 1 (where most of thecatch is taken from the Sub-Antarctic) and HAK 4 (Chatham Rise), hake have also been caught mainly as by-catch by trawlers targeting hoki. However, in both areas some targeting for hake occurs, particularly inStatistical Area 404 in HAK 4, which is a known spawning area for hake north-west of the Chatham Islands, andaround the Norwegian Hole in the Sub-Antarctic (Figure2).
Figure 2 : Quota management areas (QMAs) HAK1, 4, 7 and 10; and the west coast SouthIsland (light shading), Chatham Rise (dark shading) and Sub-Antarctic (medium shading) hakestock boundaries assumed within stock assessments (from Horn, 2013a).
Over the last 15 years the fishing practices have changed, including the gear used, tow duration, andimproved fishing strategies to limit the hake by-catch in the hoki fishery. In some years, notably in1992 and 1993, there has been a fishery targeting hake in September after the peak of the hoki fisherywas over. More than 2000 t of hake were taken in this target fishery during September 1993. High by-catch levels of hake early in the fishing season have also occurred in some years.
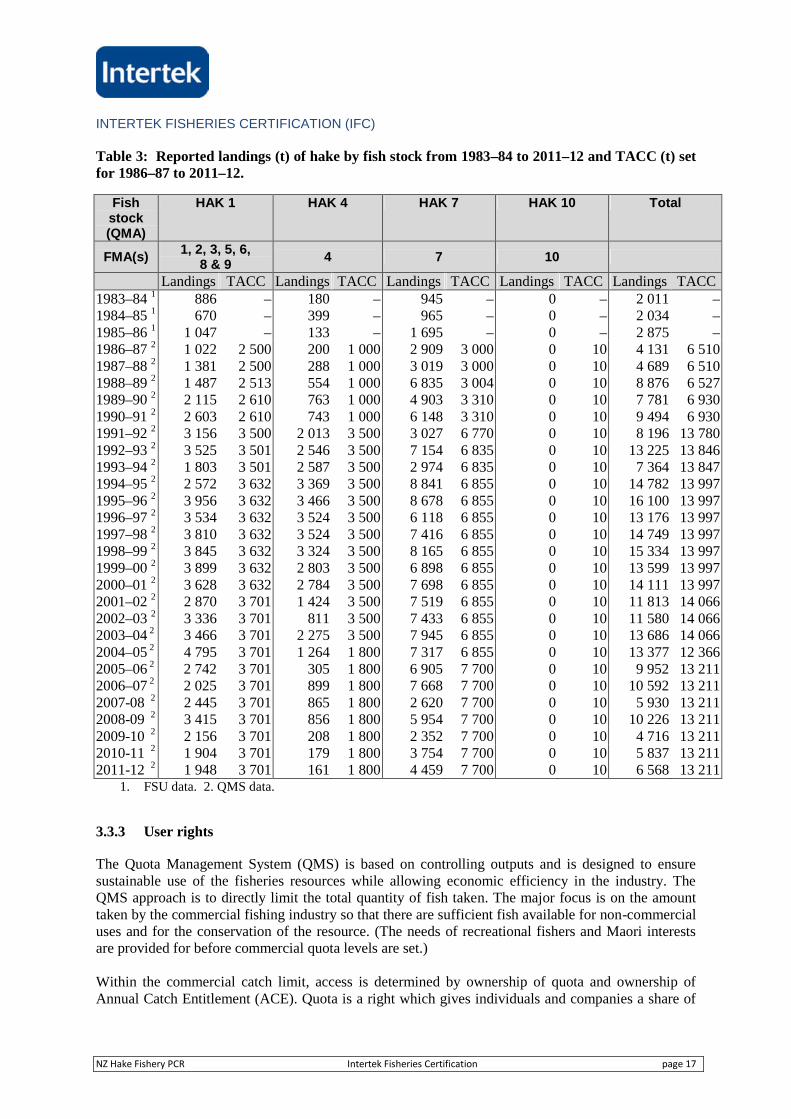
Reported catches from 1975 to 1987–88 are shown in Table 2. Reported landings for each fish stocksince 1983–84 and TACs since 1986–87 are shown in Table 3.
Increases in TACCs from 2610 t to 3632 t in HAK 1, and from 1000 t to 3500 t in HAK 4, from the1991–92 fishing year allowed the fleet to increase their reported landings of hake from these fishstocks. Reported catches rose over a number of years to the levels of the new TACCs in both HAK 1and HAK 4. In HAK 1, annual catches remained relatively steady (generally between 3 000 and 4 000
INTERTEK FISHERIES CERTIFICATION (IFC)
NZ Hake Fishery PCR Intertek Fisheries Certification page 16
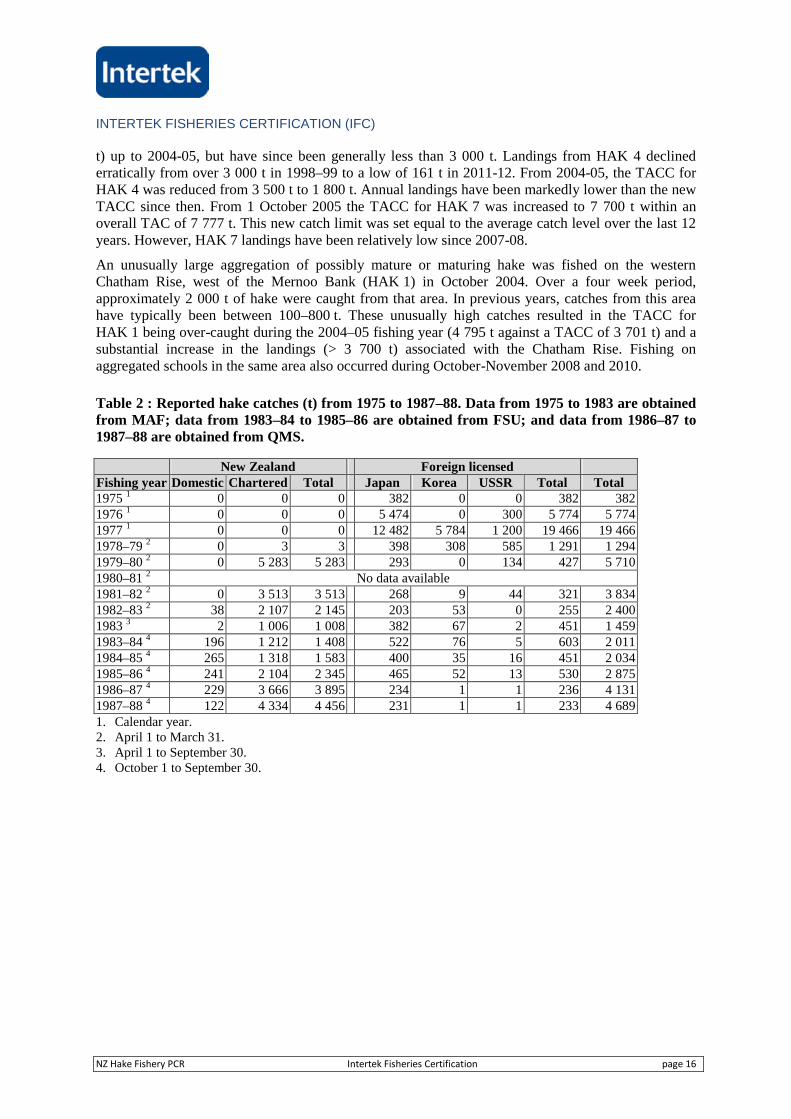
t) up to 2004-05, but have since been generally less than 3 000 t. Landings from HAK 4 declinederratically from over 3 000 t in 1998–99 to a low of 161 t in 2011-12. From 2004-05, the TACC forHAK 4 was reduced from 3 500 t to 1 800 t. Annual landings have been markedly lower than the newTACC since then. From 1 October 2005 the TACC for HAK 7 was increased to 7 700 t within anoverall TAC of 7 777 t. This new catch limit was set equal to the average catch level over the last 12years. However, HAK 7 landings have been relatively low since 2007-08.
An unusually large aggregation of possibly mature or maturing hake was fished on the westernChatham Rise, west of the Mernoo Bank (HAK 1) in October 2004. Over a four week period,approximately 2 000 t of hake were caught from that area. In previous years, catches from this areahave typically been between 100–800 t. These unusually high catches resulted in the TACC forHAK 1 being over-caught during the 2004–05 fishing year (4 795 t against a TACC of 3 701 t) and asubstantial increase in the landings (> 3 700 t) associated with the Chatham Rise. Fishing onaggregated schools in the same area also occurred during October-November 2008 and 2010.
Table 2 : Reported hake catches (t) from 1975 to 1987–88. Data from 1975 to 1983 are obtainedfrom MAF; data from 1983–84 to 1985–86 are obtained from FSU; and data from 1986–87 to1987–88 are obtained from QMS.
New Zealand Foreign licensedFishing year Domestic Chartered Total Japan Korea USSR Total Total1975 1 0 0 0 382 0 0 382 3821976 1 0 0 0 5 474 0 300 5 774 5 7741977 1 0 0 0 12 482 5 784 1 200 19 466 19 4661978–79 2 0 3 3 398 308 585 1 291 1 2941979–80 2 0 5 283 5 283 293 0 134 427 5 7101980–81 2 No data available1981–82 2 0 3 513 3 513 268 9 44 321 3 8341982–83 2 38 2 107 2 145 203 53 0 255 2 4001983 3 2 1 006 1 008 382 67 2 451 1 4591983–84 4 196 1 212 1 408 522 76 5 603 2 0111984–85 4 265 1 318 1 583 400 35 16 451 2 0341985–86 4 241 2 104 2 345 465 52 13 530 2 8751986–87 4 229 3 666 3 895 234 1 1 236 4 1311987–88 4 122 4 334 4 456 231 1 1 233 4 6891. Calendar year.2. April 1 to March 31.3. April 1 to September 30.4. October 1 to September 30.
INTERTEK FISHERIES CERTIFICATION (IFC)
NZ Hake Fishery PCR Intertek Fisheries Certification page 17
Table 3: Reported landings (t) of hake by fish stock from 1983–84 to 2011–12 and TACC (t) setfor 1986–87 to 2011–12.
Fishstock(QMA)
HAK 1 HAK 4 HAK 7 HAK 10 Total
FMA(s)1, 2, 3, 5, 6,
8 & 94 7 10
Landings TACC Landings TACC Landings TACC Landings TACC Landings TACC1983–84 1 886 – 180 – 945 – 0 – 2 011 –1984–85 1 670 – 399 – 965 – 0 – 2 034 –1985–86 1 1 047 – 133 – 1 695 – 0 – 2 875 –1986–87 2 1 022 2 500 200 1 000 2 909 3 000 0 10 4 131 6 5101987–88 2 1 381 2 500 288 1 000 3 019 3 000 0 10 4 689 6 5101988–89 2 1 487 2 513 554 1 000 6 835 3 004 0 10 8 876 6 5271989–90 2 2 115 2 610 763 1 000 4 903 3 310 0 10 7 781 6 9301990–91 2 2 603 2 610 743 1 000 6 148 3 310 0 10 9 494 6 9301991–92 2 3 156 3 500 2 013 3 500 3 027 6 770 0 10 8 196 13 7801992–93 2 3 525 3 501 2 546 3 500 7 154 6 835 0 10 13 225 13 8461993–94 2 1 803 3 501 2 587 3 500 2 974 6 835 0 10 7 364 13 8471994–95 2 2 572 3 632 3 369 3 500 8 841 6 855 0 10 14 782 13 9971995–96 2 3 956 3 632 3 466 3 500 8 678 6 855 0 10 16 100 13 9971996–97 2 3 534 3 632 3 524 3 500 6 118 6 855 0 10 13 176 13 9971997–98 2 3 810 3 632 3 524 3 500 7 416 6 855 0 10 14 749 13 9971998–99 2 3 845 3 632 3 324 3 500 8 165 6 855 0 10 15 334 13 9971999–00 2 3 899 3 632 2 803 3 500 6 898 6 855 0 10 13 599 13 9972000–01 2 3 628 3 632 2 784 3 500 7 698 6 855 0 10 14 111 13 9972001–02 2 2 870 3 701 1 424 3 500 7 519 6 855 0 10 11 813 14 0662002–03 2 3 336 3 701 811 3 500 7 433 6 855 0 10 11 580 14 0662003–04 2 3 466 3 701 2 275 3 500 7 945 6 855 0 10 13 686 14 0662004–05 2 4 795 3 701 1 264 1 800 7 317 6 855 0 10 13 377 12 3662005–06 2 2 742 3 701 305 1 800 6 905 7 700 0 10 9 952 13 2112006–07 2 2 025 3 701 899 1 800 7 668 7 700 0 10 10 592 13 2112007-08 2 2 445 3 701 865 1 800 2 620 7 700 0 10 5 930 13 2112008-09 2 3 415 3 701 856 1 800 5 954 7 700 0 10 10 226 13 2112009-10 2 2 156 3 701 208 1 800 2 352 7 700 0 10 4 716 13 2112010-11 2 1 904 3 701 179 1 800 3 754 7 700 0 10 5 837 13 2112011-12 2 1 948 3 701 161 1 800 4 459 7 700 0 10 6 568 13 211
1. FSU data. 2. QMS data.
3.3.3 User rights
The Quota Management System (QMS) is based on controlling outputs and is designed to ensuresustainable use of the fisheries resources while allowing economic efficiency in the industry. TheQMS approach is to directly limit the total quantity of fish taken. The major focus is on the amounttaken by the commercial fishing industry so that there are sufficient fish available for non-commercialuses and for the conservation of the resource. (The needs of recreational fishers and Maori interestsare provided for before commercial quota levels are set.)
Within the commercial catch limit, access is determined by ownership of quota and ownership ofAnnual Catch Entitlement (ACE). Quota is a right which gives individuals and companies a share of
INTERTEK FISHERIES CERTIFICATION (IFC)
NZ Hake Fishery PCR Intertek Fisheries Certification page 18
the TACC for a particular species in a defined area. Quota can be bought or sold. ACE is generated inproportion to the amount of quota owned by an individual of company at the start of each fishing year,and is the right to harvest a particular species in a defined area in that quota year. ACE "disappears" atthe end of each fishing year.
The QMS is also being used in dealing with Maori claims to commercial fisheries. The Governmenthas purchased quota and transferred it to the Te Ohu Kai Moana (TOKM, i.e., Treaty of WaitangiFisheries Commission) in recognition of Maori rights to the commercial fishery. TOKM distributesquota to iwi (Maori tribes). When the initial species were introduced into the QMS (e.g. hake) 10%was given to Maori. 20% of commercial quotas of all new species now brought into the QMS aregiven to the TOKM to distribute.
3.4 Principle One: Target Species Background
3.4.1 Summary of the fishery
Hake are widely distributed throughout the middle depths of the New Zealand EEZ, mostly south of40oS. Adults are mainly distributed from 250–800m, but some have been found as deep as 1200m,while juveniles (0+) are found in inshore regions shallower than 250m.
The New Zealand hake reach a maximum age of at least 25 years. Males, which rarely exceed 100 cmtotal length (TL), do not grow as large as females, which can grow to 120 cm TL or more. Both sexesreach sexual maturity between 6 and 10 years of age, at lengths of about 67–75 cm TL (males) and75–85 cm TL (females). Colman (1998) suggested that hake reached 50% maturity at between 6–8years for HAK 1, and 7–8 years for HAK 4. New estimates indicate that Chatham Rise hake reach50% maturity at about 5.5 years for males and 7 years for females, Sub-Antarctic hake at about 6years for males and 6.5 years for females, and WCSI hake at about 4.5 years for males and 5 years forfemales (Horn & Francis 2010).
Horn (1997) validated the use of otoliths readings to age hake, and produced von Bertalanffy growthparameters. Growth parameters have been updated by Horn (2008) using both the von Bertalanffy andSchnute growth models. The Schnute model was found to fit the data better. Readings of otoliths havebeen used in age-length keys to scale length frequency distributions for hake collected from trawlsurveys in HAK 1 and HAK 4 and from commercial vessels in the HAK 1, HAK 4, and HAK 7fisheries to produce catch at age distributions. Growth rates were found to be slightly different amongthe stocks with rates highest on the west coast of South Island (HAK 7), and lowest in the sub-Antarctic (HAK 1).
Dunn et al. (2000) estimated natural mortality as 0.18 y-1 for females and 0.20 y-1 for males, slightlyreduced from the previous estimates of 0.20 y-1 for females and 0.22 y-1 for males. Generally lowernatural mortality estimates tend to be more precautionary because they tend to increase the estimate ofthe size of the unexploited stock.
Data collected by observers on commercial trawlers and data from trawl surveys suggest that there areat least three main spawning areas for hake (Colman 1998). The best known area is off the west coastof the South Island, where the season can extend from June to October, usually with a peak inSeptember. Spawning also occurs to the west of the Chatham Islands during a prolonged period fromat least September to January. Spawning on the Campbell Plateau, primarily to the north-east of theAuckland Islands, occurs from September to February with a peak in September–October. Spawningfish have been recorded occasionally on the Puysegur Bank, with a seasonality that appears similar tothat on the Campbell Plateau (Colman 1998).
Juvenile hake have been taken in coastal waters on both sides of the South Island and on the CampbellPlateau. They reach a length of about 15–20 cm total length at one year old and about 35 cm totallength at 2 years (Colman 1998).
INTERTEK FISHERIES CERTIFICATION (IFC)
NZ Hake Fishery PCR Intertek Fisheries Certification page 19
3.4.2 Stock assessment and the status of stocks
Three main hake spawning areas have been identified: off the west coast of the South Island, on theChatham Rise and on the Campbell Plateau. Juvenile hake are found in all three areas. There aredifferences in size frequencies of hake between the west coast and other areas, and differences ingrowth parameters between all three areas (Horn 1997; Horn 2008). There is good evidence,therefore, to suggest that at least three separate stocks exist in the EEZ.
Present management divides the fishery into three fish stocks: (a) the Challenger QMA (HAK 7), (b)the Chatham Rise QMA (HAK 4) and (c), the remainder of the EEZ comprising the Auckland,Central, Southeast (Coast), Southland and Sub-Antarctic QMAs (HAK 1). An administrative fishstock (with no recorded landings) exists for the Kermadec QMA (HAK 10).
3.4.3 Assessments and Information
Stock assessments are fully described in reports (Horn 2013a, b) and in the recent Plenary Reports.Details are not reproduced here, but an outline of the approach and implications for meeting the MSCstandard are provided. Stock assessments are available from 2011 for the Sub-Antarctic stock (Horn2013a), 2012 for the Chatham Rise stock (Horn 2013b), and 2013 for the west coast South Islandstock. In stock assessment modelling the Chatham stock was considered to include the whole of theChatham Rise (including the western end currently forming part of the HAK 1 management area).The Sub-Antarctic stock was considered to comprise the Southland and Sub-Antarctic managementareas. Although fisheries management areas around the North Island are also included in HAK 1, fewhake are caught in these areas.
Fishery independent surveys provide the main abundance information for stock assessments, butstandardised CPUE has also been used as an abundance index for HAK7. Comprehensive trawlsurveys have been conducted annually on the Sub-Antarctic (HAK 1) and Chatham Rise (HAK 4)stocks, but are only sporadically available for the West Coast South Island (HAK 7) stock. Thesurveys use a random stratified sampling design and routinely collect acoustic as well as trawl data(e.g. Stevens et al., 2012).
The catch history used in the stock assessments includes the revised estimates of catch reported byDunn (2003) and updated by Devine (2008). Catch biomass has been recorded accurately except forsome area misreporting discovered in 2001. Dunn (2003) provided revised estimates of the totallandings by stocks, estimating that the level of hake over-reporting on the Chatham Rise (and henceunder-reporting on the west coast South Island) was between 16 and 23% (700–1000 t annually) oflandings during 1994–95 and 2000–01, mainly in June, July, and September. Probable levels of areamisreporting prior to 1994–95 and between the west coast South Island and sub-Antarctic wereestimated as small (Dunn 2003). There is no evidence of similar area misreporting since 2000–01(Devine 2009). The misreporting problem is not significant enough to affect stock assessments. Dueto the isolated location, activity of the legal fishery and enforcement, IUU fishing is not significant.
In earlier years, before the introduction of higher TACCs in 1991–92, there is some evidence tosuggest that catches of hake were not fully reported. Comparison of catches between vessels with andwithout observers, particularly in HAK 7 from 1988–89 to 1990–91, suggested that actual catcheswere probably considerably higher than those reported. For these years, the ratio of hake to hoki in thecatch of vessels carrying observers was significantly higher than in the catch of vessels not carryingobservers (Colman and Vignaux 1992). The actual hake catch in HAK 7 for these years was estimatedby multiplying the total hoki catch (which was assumed to be correctly reported by vessels both withand without observers) by the ratio of hake to hoki in the catch of vessels carrying observers. Thisresulted in raised estimates of the hake catch, from 6 835 t to 8 696 t in 1988-89, 4 903 t to 8 741 t in1989–90, and from 6 189 t to 8 246 t in for 1990–91. More recently, the level of such misreporting
INTERTEK FISHERIES CERTIFICATION (IFC)
NZ Hake Fishery PCR Intertek Fisheries Certification page 20
has not been estimated and no such corrections have been applied to either the HAK 1 or HAK 4fishery.
Age compositions and length compositions are available from the surveys and commercial catches(Horn and Sutton 2012). Commercial catch sampling takes place through the observer programme andis available for all stocks, but does not necessarily form a complete time series. Otolith ageing hasbeen validated (Horn and Sutton 2012).
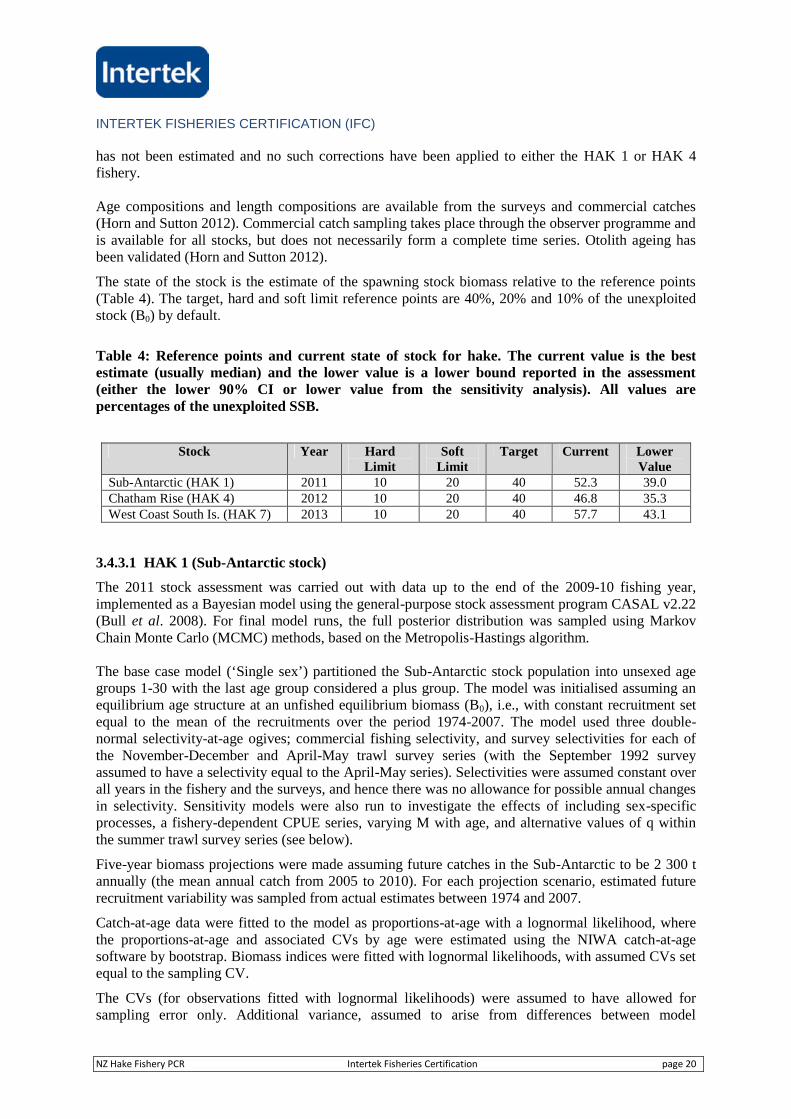
The state of the stock is the estimate of the spawning stock biomass relative to the reference points(Table 4). The target, hard and soft limit reference points are 40%, 20% and 10% of the unexploitedstock (B0) by default.
Table 4: Reference points and current state of stock for hake. The current value is the bestestimate (usually median) and the lower value is a lower bound reported in the assessment(either the lower 90% CI or lower value from the sensitivity analysis). All values arepercentages of the unexploited SSB.
Stock Year HardLimit
SoftLimit
Target Current LowerValue
Sub-Antarctic (HAK 1) 2011 10 20 40 52.3 39.0Chatham Rise (HAK 4) 2012 10 20 40 46.8 35.3West Coast South Is. (HAK 7) 2013 10 20 40 57.7 43.1
3.4.3.1 HAK 1 (Sub-Antarctic stock)
The 2011 stock assessment was carried out with data up to the end of the 2009-10 fishing year,implemented as a Bayesian model using the general-purpose stock assessment program CASAL v2.22(Bull et al. 2008). For final model runs, the full posterior distribution was sampled using MarkovChain Monte Carlo (MCMC) methods, based on the Metropolis-Hastings algorithm.
The base case model (‘Single sex’) partitioned the Sub-Antarctic stock population into unsexed agegroups 1-30 with the last age group considered a plus group. The model was initialised assuming anequilibrium age structure at an unfished equilibrium biomass (B0), i.e., with constant recruitment setequal to the mean of the recruitments over the period 1974-2007. The model used three double-normal selectivity-at-age ogives; commercial fishing selectivity, and survey selectivities for each ofthe November-December and April-May trawl survey series (with the September 1992 surveyassumed to have a selectivity equal to the April-May series). Selectivities were assumed constant overall years in the fishery and the surveys, and hence there was no allowance for possible annual changesin selectivity. Sensitivity models were also run to investigate the effects of including sex-specificprocesses, a fishery-dependent CPUE series, varying M with age, and alternative values of q withinthe summer trawl survey series (see below).
Five-year biomass projections were made assuming future catches in the Sub-Antarctic to be 2 300 tannually (the mean annual catch from 2005 to 2010). For each projection scenario, estimated futurerecruitment variability was sampled from actual estimates between 1974 and 2007.
Catch-at-age data were fitted to the model as proportions-at-age with a lognormal likelihood, wherethe proportions-at-age and associated CVs by age were estimated using the NIWA catch-at-agesoftware by bootstrap. Biomass indices were fitted with lognormal likelihoods, with assumed CVs setequal to the sampling CV.
The CVs (for observations fitted with lognormal likelihoods) were assumed to have allowed forsampling error only. Additional variance, assumed to arise from differences between model
INTERTEK FISHERIES CERTIFICATION (IFC)
NZ Hake Fishery PCR Intertek Fisheries Certification page 21
simplifications and real world variation (process error), was added to the sampling variance for thesurvey biomass indices and proportion-at-age data in all model runs. The process error was estimatedfrom MPD runs of the each model. The values for process error were then fixed for the MCMC runs.
Year class strengths were assumed known (and equal to one) for years prior to 1974 and after 2007,when inadequate or no catch-at-age data were available. Otherwise year class strengths wereestimated under the assumption that the estimates from the model should average one.
Research survey biomass estimates used were from 1992-1994, 1996, 1998, 2001-2010 (2012 and2013 estimates not used within the assessment), together with sample CVs for estimates bar those in1996 and 1998.
The assessment model’s prior distributions were intended to be relatively uninformed, and wereestimated with wide bounds. The exceptions were the choice of informative priors for the survey qs(catchability); these were estimated by assuming that q was the product of areal availability, verticalavailability, and vulnerability. A simple simulation was conducted that estimated a distribution ofpossible values for the relativity constant by assuming that each of these factors was uniformlydistributed. A prior was then determined by assuming that the resulting, sampled, distribution waslognormally distributed. That prior had mean 0.16 and CV. 0.79, with bounds assumed to be 0.01–0.40. Note that the values of survey relativity constants are dependent on the selectivity parameters,and the absolute catchability can be determined by the product of the selectivity by age and sex, andthe relativity constant q.
Penalty functions were used a) to constrain the model so that any combination of parameters thatresulted in a stock size that was so low that the historical catch could not have been taken wasstrongly penalised, b) to ensure that all estimated year class strengths averaged 1, and c) to smooth theyear class strengths estimated over the period 1974 to 1979.
Estimates of biomass were produced for an agreed base case run (the Single sex model using thedefined biological parameters and model input parameters). In addition, four sensitivities wereinvestigated: (1) splitting the summer survey series into early (1992-2006) and recent (2007-09) serieswith independent qs, (2) including sex in the partition, (3) including the trawl CPUE series, and (4)estimating M as a double-exponential function, thus allowing M to vary with age. For all runs, MPDfits were obtained and qualitatively evaluated, and MCMC estimates of the median posterior and 95%percentile credible intervals were determined for current and virgin biomass, and projected states.However, only the estimates from the base case and estimate M runs are reported in detail here. Theother three sensitivities produced estimates of stock status that were little different to those from thereported models.
The estimated MCMC marginal posterior distributions from the base case model indicated thatsuggested that the Sub-Antarctic stock was characterised by a group of relatively strong year classesin the late 1970s, a very strong year class in 1980, followed by a period of average to less thanaverage recruitment through to 2004. Estimates from 2005 to 2007 were above average.Consequently, biomass estimates for the stock declined, particularly through the early 1990s, but arecurrently exhibiting an upturn. Biomass estimates for the stock appeared relatively healthy, withestimated current biomass from the two reported models at about 50% of B0. Annual exploitationrates (catch over vulnerable biomass) were low (less than 0.1) in all years as a consequence of thehigh estimated stock size in relationship to the level of relative catches.
Projected future annual catches of 2 300 t, in tandem with some recent stronger than average yearclasses, are projected to allow stock size to increase by about 50% by 2016. However, the lack ofcontrast in abundance indices since 1991 indicates that while the status of the Sub-Antarctic stock isprobably similar to that in the early 1990s, the absolute level of current biomass is very uncertain.
The assessment relied on biomass data from the Sub-Antarctic trawl survey series. The summersurvey series was not well fitted and had clear patterns in the residuals. It was also apparent that there
INTERTEK FISHERIES CERTIFICATION (IFC)
NZ Hake Fishery PCR Intertek Fisheries Certification page 22
can be marked changes in catchability between adjacent pairs of surveys. Estimated trawl surveycatchability constants were very low (about 2-6% based on door-spread swept area estimates),suggesting that the absolute catchability of the Sub-Antarctic trawl surveys is extremely low. Whilethis is not confirmed, it is consistent with hake being relatively more abundant over rough ground(that is likely to be avoided during a trawl survey), and the fact that hake tend to school off thebottom, particularly during their spring–summer spawning season, hence reducing their availability tothe bottom trawl.
Horn (2013a) noted that “the stock is probably being well monitored by the November-Decembertrawl survey series. While the stock status appears to be reasonably well defined, estimates of past andcurrent absolute stock size are very uncertain owing to poor contrast in the relative abundance series.Because of the high uncertainty in estimates of absolute biomass, yield estimates are also veryuncertain. However, there are probably no current sustainability issues for this stock.”
3.4.3.2 HAK 4 (Chatham Rise stock)
The 2012 stock assessment was carried out with data up to the end of the 2010-11 fishing year (Horn,2013b), using the latest version of CASAL v2.22 (Bull et al., 2008). The assessment used researchtime series of abundance indices (trawl surveys of the Chatham Rise from 1992 to 2012), catch-at-agefrom the trawl survey series and the commercial fishery since 1990-91, a CPUE series from theeastern trawl fishery, and estimates of biological parameters. The model structure and assessmentmethod was broadly the same as that described above for the HAK1 stock.
No CPUE was included, and a constant M was used. The models were initialised assuming anequilibrium age structure at an unfished equilibrium biomass (B0), i.e., with constant recruitment setequal to the mean of the recruitments over the period 1975-2006. There were three double-normalselectivity-at-age ogives; east and west commercial fishing selectivities and a survey selectivity forthe Chatham Rise January trawl survey series. Selectivities were assumed constant over all years inboth fisheries and the survey, and hence there was no allowance for possible annual changes inselectivity. The age at full selectivity for the trawl survey series was parameterised to be most likelyin the range 8±2 years. This range was determined by visual examination of the at-age plots, and wasimplemented because unconstrained selectivity resulted in age at full selectivity being older than mostof the fish caught in the survey series.
Five-year biomass projections were made assuming future catches on the Chatham Rise equal to theHAK 4 TACC of 1800 t. For the projection, estimated future recruitment variability was sampledfrom actual estimates between 1984 and 2009, a period including the full range of recruitmentsuccesses.
Catch-at-age observations were available for each survey on the Chatham Rise and for commercialtrawl fisheries on the eastern and western Rise from observer data in some years. The catch historiesincluded the revised estimates of catch reported by Dunn (2003).
Year class strengths were assumed known (and equal to one) for years before 1975 and after 2009,where inadequate or no catch-at-age data were available. Otherwise year class strengths wereestimated under the assumption that the estimates from the model should average one.
Research survey biomass estimates used were from 1992-2012, together with sample CVs for eachestimate.
The priors for B0 and year class strengths were intended to be relatively uninformed, and had widebounds. Priors for the trawl fishery selectivity parameters were assumed to be uniform. Priors for thetrawl survey selectivity parameters were assumed to have a normal-by-stdev distribution, with a verytight distribution set for age at full selectivity, but an essentially uniform distribution for otherselectivity function parameters aL and aR. The prior for the survey q was informative and estimatedusing the same approach as for HAK1.
INTERTEK FISHERIES CERTIFICATION (IFC)
NZ Hake Fishery PCR Intertek Fisheries Certification page 23
Estimates of biomass were produced for an agreed base case run (research survey abundance series,constant M). Sensitivity models were run to investigate the effects of estimating M, including theCPUE series, and removing constraints on the survey selectivity ogive. Stock status from these threemodels was not markedly different to the base case.
Estimated MCMC marginal posterior distributions from the base case model indicated that year classstrength on the Chatham Rise stock was characterised by a group of relatively strong relative yearclass strengths in the late 1970s to early 1980s, and again in the early 1990s, followed by a period ofrelatively poor recruitment (except for 2002). Consequently, biomass increased slightly during the late1980s, then declined to about 2005. The growth of the strong 2002 year class has resulted in a recentslight upturn in biomass. Current stock biomass was estimated at about 47% of B0. Annualexploitation rates (catch over vulnerable biomass) were low (less than 0.1) up to 1993 and since 2007,but moderate (although probably less than 0.25) in the intervening period.
Base case model projections assuming a future annual catch of 1 800 t suggest that biomass willdecline to about 38% of B0 by 2017. There was little risk (i.e., < 1%) that the stock would fall below20% B0 in the next five years under this catch scenario. Note that 1 800 t is higher than recent annuallandings from the stock (they have averaged about 1 070 t in the last five years), but lower than whatcould be taken (if all the HAK 4 TACC plus some HAK 1 catch from the western Rise was taken).
CAY (Current Annual Yield) estimates were not reported because of the uncertainty of the estimatesof absolute biomass.
3.4.3.3 HAK 7 (West coast, South Island)
A new assessment for HAK 7 was carried out in 2013 using fisheries data up to the end of the 2011–12 fishing year (Horn, 2013b). The model structure was the same as that used for HAK 1 describedabove, but some changes were introduced to better meet the requirements for fitting the available data.The assessment used catch-at-age from the commercial fishery since 1989–90, two comparableresearch surveys (in 2000 and 2012), a CPUE series from 2001 to 2011, and estimates of biologicalparameters. The selected CPUE series incorporated data since the change in 2001 to a new regulatoryand reporting regime (involving ACE), and so was considered less likely to be biased by variations infishing behaviour and catch reporting behaviour.
The stock assessment for HAK 7 had been last updated using data up to the end of the 2008-09 fishingyear (Horn 2011). Commercial catch-at-age was the only input data series at that time. No time seriesof biomass indices were incorporated in the model; no fishery-independent series were available andCPUE indices were considered unreliable. However a CPUE series was used in the 2013 model.
The 2013 model was initialised assuming an equilibrium age structure at an unfished equilibriumbiomass (B0) in 1974, i.e., with constant recruitment set equal to the mean of the recruitments over theperiod 1973–2007. M was considered constant, and selectivities were assumed constant over all yearsin the fishery and the surveys; hence there was no allowance for possible annual changes inselectivity. Sensitivities to the base model investigated the effect of estimating M as an age-dependentfunction, and the effect of excluding the research survey data.
Five-year biomass projections were made assuming future WCSI catches of 4500 t annually (themean annual catch since 2007-08) and 7700 t annually (the TACC). For each projection scenario,estimated future recruitment variability was sampled from actual estimates from 1995 to 2006, aperiod including both high and low recruitment success, but excluding the most recent estimated yearclass (2007).
Commercial fishery catch-at-age observations were available for 1979 (fishing by RV Wesermünde)and 1989-90 to 2010-11 (observer data). Research survey biomass and proportions-at-age data (from2000 and 2012) were also fitted in the model, together with sample CVs for each year.
INTERTEK FISHERIES CERTIFICATION (IFC)
NZ Hake Fishery PCR Intertek Fisheries Certification page 24
The priors for B0 and year class strengths were intended to be relatively uninformed, and had widebounds. Priors for all selectivity parameters were assumed to be uniform. The prior for the survey qwas informative and was estimated using the Sub-Antarctic hake survey priors as a starting point (seedescription under HAK1) because the survey series in both areas used the same vessel and fishinggear. However, the WCSI survey area in the 200–800 m depth range in strata 0004 A–C and 0012 A–C comprised 12 928 km2; seabed area in that depth range in the entire HAK 7 biological stock area(excluding the Challenger Plateau) is estimated to be about 24 000 km2. So because biomass fromonly 54% of the WCSI hake habitat was included in the indices, the Chatham Rise prior on μ wasmodified accordingly (i.e., 0.16 × 0.54 = 0.09), and the bounds reduced to [0.01, 0.25]. Priors for allselectivity parameters were assumed to be uniform.
Estimates of biomass were produced for an agreed base case run (CPUE and survey abundance series,constant M). In addition, two sensitivities were investigated: (1) estimating M as a double exponentialfunction thus allowing M to vary with age, and (2) excluding the research survey biomass series.
WCSI year class strength estimates exhibited a relatively low level of between-year variation,although there was a period of generally less than average recruitment from 1993 to 2003, followedby four years of relatively strong year classes. Estimated biomass declined throughout the late 1970sowing to relatively high catch levels, then increased through the mid 1980s concurrent with a markeddecline in catch. Biomass then steadily declined from 1988 to 2007 owing to higher levels ofexploitation and the recruitment of year classes that were generally of below-average strength. Theincrease since 2006 is a consequence of the recruitment of the above-average year classes since 2004.Estimated current biomass from the base model was 58% B0. Annual exploitation rates (catch overvulnerable biomass) were low to moderate (less than 0.2) up to about 1999, but increased to 0.2 to 0.4in 1977 and throughout the 2000s, and have subsequently declined. The exploitation rate thatproduced a biomass equal to 40%B0 was 0.34.
Deterministic BMSY was also calculated as 26% B0. However, this was not felt to be a suitable targetfor management of the HAK 7 fishery. First, it assumes a harvest strategy that involves perfectknowledge (catch, biological information, stock assessment accuracy), a constant-exploitationmanagement strategy, and perfect management implementation. Second, it assumes perfectknowledge of the stock-recruit relationship, which is actually very poorly known. Third, the estimatedvalue is close to the default soft limit of 20%B0 and hence biomass may occasionally fall below thisdefault soft limit according to the Harvest Strategy Standard. Thus, the actual target needs to be abovethis theoretical optimum; but the extent to which it needs to be above has not been determined.
Estimates of the status of the WCSI stock suggest that there has been a steady increase in stock sizesince 2007, when it was about 30% B0.
Projections assuming future catches similar to recent levels (i.e., 4 500 t annually) will probably allowthe stock to grow slightly in the next five years, while catches at the level of the TACC (7 700 t) willprobably cause the stock to decline slightly but still be above the management target (40% B0) in2017.
3.5 Management advice
3.5.1 Overview
The stated objective is to have the stock fluctuating around the management target (40% ofunexploited biomass), but with some acceptable, but undefined, variation. A formal time-constrainedrebuilding plan is to be implemented if the soft limit is reached (i.e. is a 'trigger' reference point foraction to avoid the stock falling below the 'hard' limit reference point) and the hard limit defines tolevel below which the fishery should be considered for closure. The rebuilding plan requires that thehake biomass be rebuilt to the target level with an acceptable probability. The rebuild should be
INTERTEK FISHERIES CERTIFICATION (IFC)
NZ Hake Fishery PCR Intertek Fisheries Certification page 25
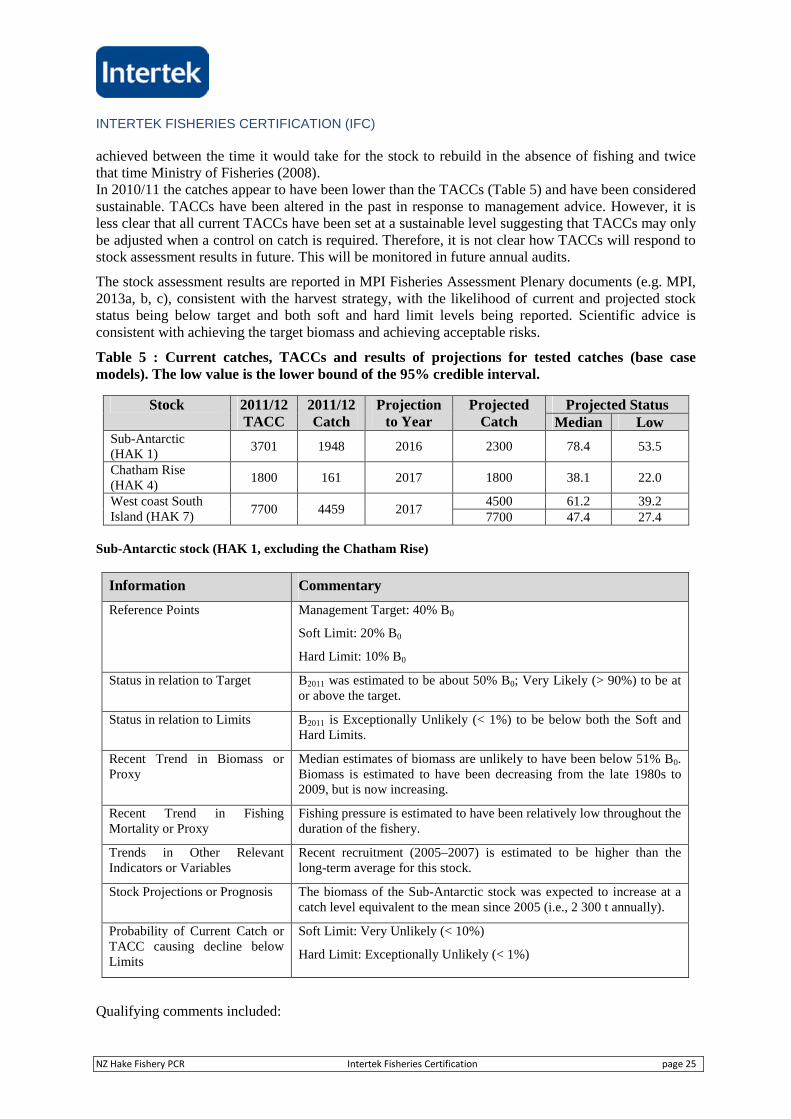
achieved between the time it would take for the stock to rebuild in the absence of fishing and twicethat time Ministry of Fisheries (2008).In 2010/11 the catches appear to have been lower than the TACCs (Table 5) and have been consideredsustainable. TACCs have been altered in the past in response to management advice. However, it isless clear that all current TACCs have been set at a sustainable level suggesting that TACCs may onlybe adjusted when a control on catch is required. Therefore, it is not clear how TACCs will respond tostock assessment results in future. This will be monitored in future annual audits.
The stock assessment results are reported in MPI Fisheries Assessment Plenary documents (e.g. MPI,2013a, b, c), consistent with the harvest strategy, with the likelihood of current and projected stockstatus being below target and both soft and hard limit levels being reported. Scientific advice isconsistent with achieving the target biomass and achieving acceptable risks.
Table 5 : Current catches, TACCs and results of projections for tested catches (base casemodels). The low value is the lower bound of the 95% credible interval.
Stock 2011/12TACC
2011/12Catch
Projectionto Year
ProjectedCatch
Projected StatusMedian Low
Sub-Antarctic(HAK 1)
3701 1948 2016 2300 78.4 53.5
Chatham Rise(HAK 4)
1800 161 2017 1800 38.1 22.0
West coast SouthIsland (HAK 7)
7700 4459 20174500 61.2 39.27700 47.4 27.4
Sub-Antarctic stock (HAK 1, excluding the Chatham Rise)
Information Commentary
Reference Points Management Target: 40% B0
Soft Limit: 20% B0
Hard Limit: 10% B0
Status in relation to Target B2011 was estimated to be about 50% B0; Very Likely (> 90%) to be ator above the target.
Status in relation to Limits B2011 is Exceptionally Unlikely (< 1%) to be below both the Soft andHard Limits.
Recent Trend in Biomass orProxy
Median estimates of biomass are unlikely to have been below 51% B0.Biomass is estimated to have been decreasing from the late 1980s to2009, but is now increasing.
Recent Trend in FishingMortality or Proxy
Fishing pressure is estimated to have been relatively low throughout theduration of the fishery.
Trends in Other RelevantIndicators or Variables
Recent recruitment (2005–2007) is estimated to be higher than thelong-term average for this stock.
Stock Projections or Prognosis The biomass of the Sub-Antarctic stock was expected to increase at acatch level equivalent to the mean since 2005 (i.e., 2 300 t annually).
Probability of Current Catch orTACC causing decline belowLimits
Soft Limit: Very Unlikely (< 10%)
Hard Limit: Exceptionally Unlikely (< 1%)
Qualifying comments included:
INTERTEK FISHERIES CERTIFICATION (IFC)
NZ Hake Fishery PCR Intertek Fisheries Certification page 26
Four sensitivity model runs reported in a FAR but not in the Plenary Report all producedsimilar estimates of stock status to the base case (i.e., B2011 = 45–67% B0).
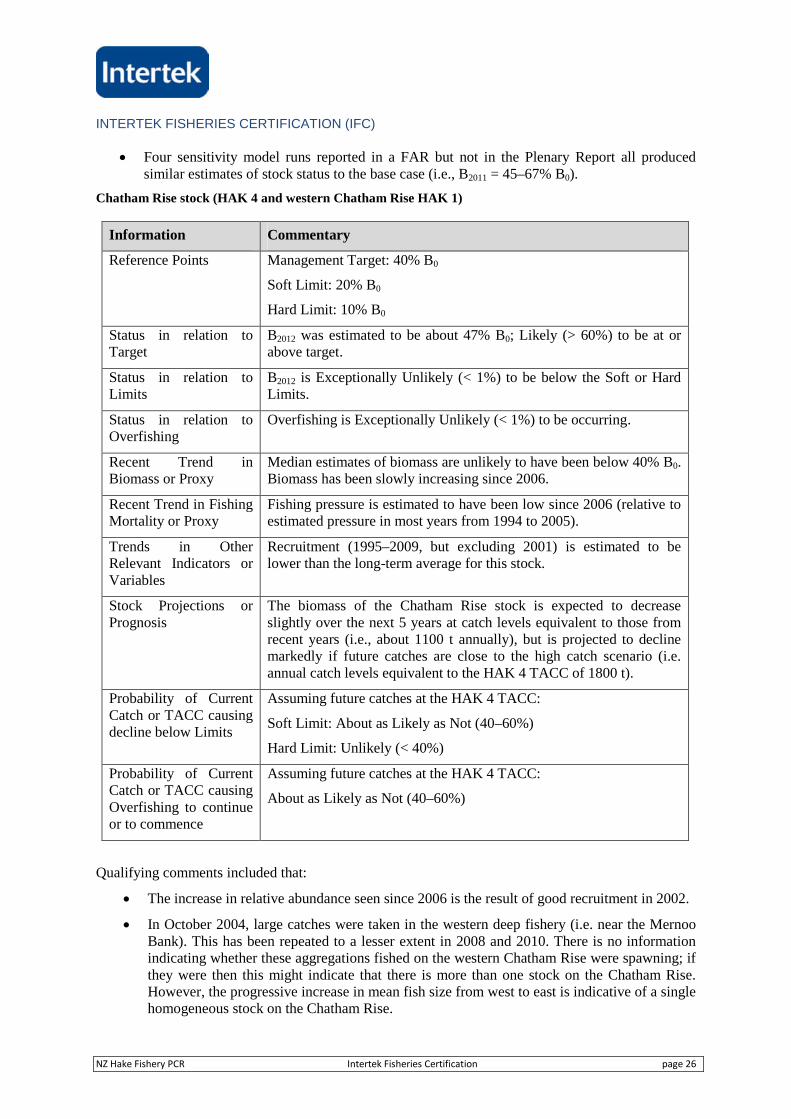
Chatham Rise stock (HAK 4 and western Chatham Rise HAK 1)
Information Commentary
Reference Points Management Target: 40% B0
Soft Limit: 20% B0
Hard Limit: 10% B0
Status in relation toTarget
B2012 was estimated to be about 47% B0; Likely (> 60%) to be at orabove target.
Status in relation toLimits
B2012 is Exceptionally Unlikely (< 1%) to be below the Soft or HardLimits.
Status in relation toOverfishing
Overfishing is Exceptionally Unlikely (< 1%) to be occurring.
Recent Trend inBiomass or Proxy
Median estimates of biomass are unlikely to have been below 40% B0.Biomass has been slowly increasing since 2006.
Recent Trend in FishingMortality or Proxy
Fishing pressure is estimated to have been low since 2006 (relative toestimated pressure in most years from 1994 to 2005).
Trends in OtherRelevant Indicators orVariables
Recruitment (1995–2009, but excluding 2001) is estimated to belower than the long-term average for this stock.
Stock Projections orPrognosis
The biomass of the Chatham Rise stock is expected to decreaseslightly over the next 5 years at catch levels equivalent to those fromrecent years (i.e., about 1100 t annually), but is projected to declinemarkedly if future catches are close to the high catch scenario (i.e.annual catch levels equivalent to the HAK 4 TACC of 1800 t).
Probability of CurrentCatch or TACC causingdecline below Limits
Assuming future catches at the HAK 4 TACC:
Soft Limit: About as Likely as Not (40–60%)
Hard Limit: Unlikely (< 40%)
Probability of CurrentCatch or TACC causingOverfishing to continueor to commence
Assuming future catches at the HAK 4 TACC:
About as Likely as Not (40–60%)
Qualifying comments included that:
The increase in relative abundance seen since 2006 is the result of good recruitment in 2002.
In October 2004, large catches were taken in the western deep fishery (i.e. near the MernooBank). This has been repeated to a lesser extent in 2008 and 2010. There is no informationindicating whether these aggregations fished on the western Chatham Rise were spawning; ifthey were then this might indicate that there is more than one stock on the Chatham Rise.However, the progressive increase in mean fish size from west to east is indicative of a singlehomogeneous stock on the Chatham Rise.
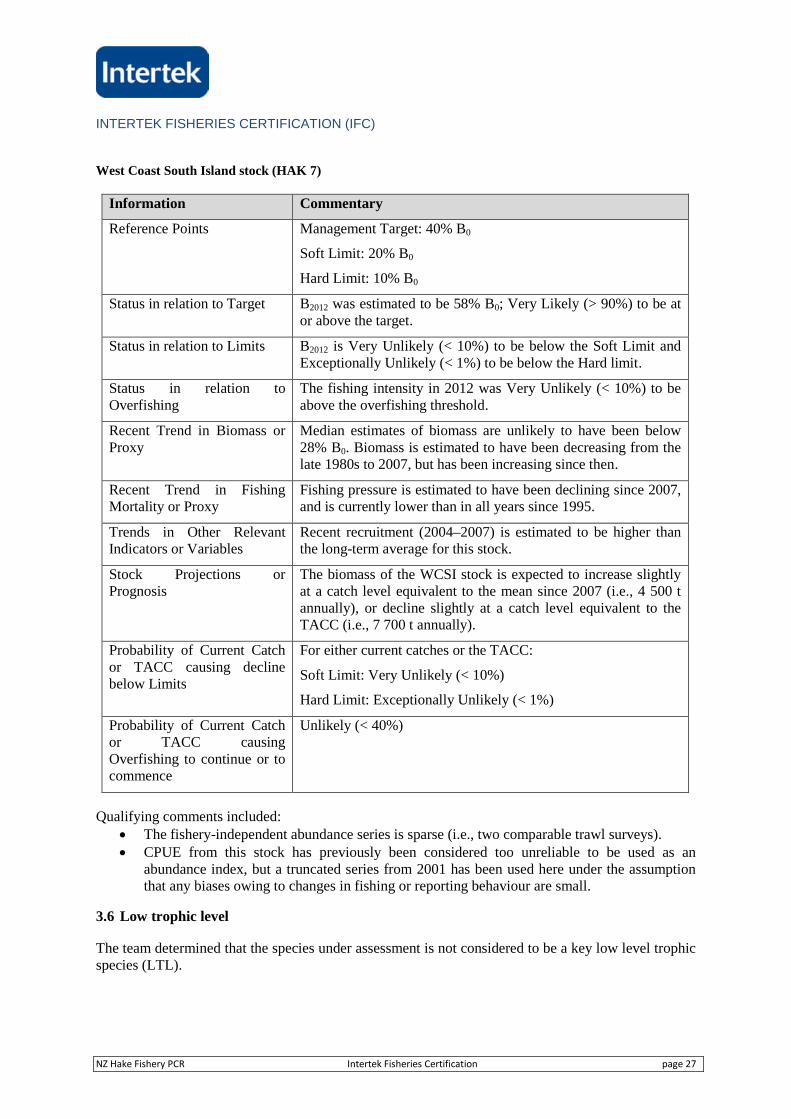
INTERTEK FISHERIES CERTIFICATION (IFC)
NZ Hake Fishery PCR Intertek Fisheries Certification page 27
West Coast South Island stock (HAK 7)
Information Commentary
Reference Points Management Target: 40% B0
Soft Limit: 20% B0
Hard Limit: 10% B0
Status in relation to Target B2012 was estimated to be 58% B0; Very Likely (> 90%) to be ator above the target.
Status in relation to Limits B2012 is Very Unlikely (< 10%) to be below the Soft Limit andExceptionally Unlikely (< 1%) to be below the Hard limit.
Status in relation toOverfishing
The fishing intensity in 2012 was Very Unlikely (< 10%) to beabove the overfishing threshold.
Recent Trend in Biomass orProxy
Median estimates of biomass are unlikely to have been below28% B0. Biomass is estimated to have been decreasing from thelate 1980s to 2007, but has been increasing since then.
Recent Trend in FishingMortality or Proxy
Fishing pressure is estimated to have been declining since 2007,and is currently lower than in all years since 1995.
Trends in Other RelevantIndicators or Variables
Recent recruitment (2004–2007) is estimated to be higher thanthe long-term average for this stock.
Stock Projections orPrognosis
The biomass of the WCSI stock is expected to increase slightlyat a catch level equivalent to the mean since 2007 (i.e., 4 500 tannually), or decline slightly at a catch level equivalent to theTACC (i.e., 7 700 t annually).
Probability of Current Catchor TACC causing declinebelow Limits
For either current catches or the TACC:
Soft Limit: Very Unlikely (< 10%)
Hard Limit: Exceptionally Unlikely (< 1%)
Probability of Current Catchor TACC causingOverfishing to continue or tocommence
Unlikely (< 40%)
Qualifying comments included: The fishery-independent abundance series is sparse (i.e., two comparable trawl surveys). CPUE from this stock has previously been considered too unreliable to be used as an
abundance index, but a truncated series from 2001 has been used here under the assumptionthat any biases owing to changes in fishing or reporting behaviour are small.
3.6 Low trophic level
The team determined that the species under assessment is not considered to be a key low level trophicspecies (LTL).
INTERTEK FISHERIES CERTIFICATION (IFC)
NZ Hake Fishery PCR Intertek Fisheries Certification page 28
3.7 Principle Two: Ecosystem Background
This section provides background on the ecosystem components considered under Principle 2. Itprovides a general overview of the characteristics of the ecosystem within the New Zealand EEZ, andthe information, studies and management that is being carried out. It should be noted that moredetailed examinations of information are presented within the Scoring Guidepost Appendix 1.
3.7.1 The aquatic ecosystem, its status and any particularly sensitive areas, habitats orecosystem features influencing or affected by the fishery
The New Zealand EEZ extends over 30o of latitude, and covers sub-tropical to sub-Antarctic marineecosystems. Consequently, it is an extremely diverse area biologically, and in terms of habitats. Hakeoccur widely through New Zealand’s EEZ, and fishing takes place in three main areas: West CoastSouth Island (HAK7), the Chatham Rise (HAK4) and sub-Antarctic (southerly HAK1). The ChathamRise and Sub-Antarctic areas share many key ecosystem characteristics (e.g. primary productivity,depth, benthos, fish (Pinkerton 2011a)).
Oceanography and primary productivity within the New Zealand EEZ has been well studied throughresearch projects and remote sensing studies. Fairly comprehensive benthic surveys have beenperformed of seabed types around the New Zealand continental shelf and seamounts. Analyses havedeveloped a Marine Environmental Classification (MEC; Snelder et al., 2005), a Benthic OptimisedMarine Environment Classification (BOMEC, Leathwick et al. 2009) and sediment distributions inthe New Zealand EEZ using categorical definitions, along with the Interim Nearshore MarineClassification (INMARC) developed by DOC (e.g. Leathwick et al., 2006). Further projects mappingthe biodiversity of seabeds and the spatial and temporal extent of fishing are underway throughNIWA. These include the ongoing ‘Chatham/Challenger’ project, which aims to map and comparehabitats and diversity of sea-bed communities in fishable depths at key locations across the ChathamRise and the Challenger Plateau (Probert and Grove, 1998; McKnight and Probert, 1997). The projectis employing both acoustic mapping approaches and underwater camera work to map biodiversity andhabitat types. In turn, the Ocean Survey 20/20 (OS 20/20) project aims to map the seafloor habitatsand biodiversity of New Zealand’s marine environment across large areas of the EEZ, butconcentrating on the Chatham Rise and Challenger Plateau, and on-going studies are expandingknowledge of the distribution of cold water corals ( Bowden et al., 2011). The location of other keyvulnerable habitat types (smokers, hydrothermal vents etc.) is known.
Data from surveys, logbooks and the observer programme are available to allow the location ofimpacts by the fishery on habitat types to be identified. In turn, the footprint of the fishery is wellestablished through VMS records and the Trawl Catch, Effort and Processing Return (TCEPR) data.Bottom trawling that targets the hoki/hake/ling fishery complex is carried out most extensively in theareas of the Chatham Rise and the sub-Antarctic, with effort also concentrated on the west coast of theSouth Island, commonly in depths of around 200-800m.
The main impacts from demersal trawls on the benthic habitat concentrate on the removals of mobileand sessile species, and the disturbance and modification of the structure of the seafloor. Studieselsewhere in the world (e.g. Thrush and Dayton 2002; Clark and Rowden 2009) have demonstratedthat repeated trawl disturbance can alter the benthic community by damaging or removingmacrofauna, with the potential encouragement of anaerobic bacterial growth. A loss of sedimentdiversity can also occur, while processes such as nutrient transfer, oxygenation and productivity canalso be impaired. The cumulative impact of trawling on the seabed will also depend upon the degreeof previous trawling; there being a reduced impact per trawl over time.
INTERTEK FISHERIES CERTIFICATION (IFC)
NZ Hake Fishery PCR Intertek Fisheries Certification page 29
The rate of recovery depends on the nature of the benthic habitat, with more mobile sediments such asmud and sand in high energy environments recovering faster than, for example, rocky sediments withslow growing organisms in low energy environments. This is the subject of continued studies withinthe New Zealand EEZ (e.g. projects BEN2007/01, BEN2007/04). In the Chatham Rise and sub-Antarctic regions, the majority of trawling is within higher-energy sediments such as sandy silt andclay, although some lower-energy areas exist in these regions (see section 3.7.2.7). Impacts onunderwater topographical features (UTFs) have been identified (Clark and Rowden, 2009).Effectively, through Seamount closures or as a result of being within BPAs, 80% of the seamountswithin the New Zealand EEZ are closed to demersal trawling. These closures confer effective habitatprotection. Closures occur largely outside the areas fished intensively for hake (Ministry of Fisheries2010a). Finally, Benthic Protection Areas, which close over 30% of the New Zealand EEZ todemersal trawling were established in 2007 for the purpose of benthic biodiversity protection (Helsonet al. 2010, but see Leathwick et al. 2008).
Management of the hake fishery has not yet included an extensive assessment of ‘significant’ habitats.However, relevant information in this regard includes areas of particular importance for fisherysustainability (e.g. for spawning, or occupied by juvenile hake), spatial overlays of trawl tracks withmarine environment and/or biological classifications. Currently, the best single tool currentlyavailable to characterising the likely impacts of bottom trawling on benthic organisms within differenthabitat categories is the Benthic-Optimised Marine Environment Classification (BOMEC) for NewZealand waters (Leathwick et al. 2009; Leathwick et al. 2010). However, BOMEC is not in and ofitself a spatial map delineating different benthic habitats. It has not been ‘ground truthed’ against thespatial disposition of extant benthic habitats in the real world and hence should be viewed with somecaution. Using the fifteen classes categorised therein, Black and Wood (2011) overlaid demersaltrawl tracks comprising hoki fishing effort for each fishing year from 1989/90 – 2009/10. Resultingexposure to demersal trawling is summarised in Black et al. (2013). This analysis highlights the arealextent and intensity of demersal trawling for hake, e.g., trawling covers parts of the same habitatclasses inter-annually, and the most extensively trawled BOMEC class is 8, where from 1989/90 -2009/10, 5.3% was trawled. Black and Wood (2011) overlaid demersal trawl tracks within eachFisheries Management Area to highlight the areal extent and intensity of demersal trawling for hake(e.g., trawling covers parts of the same habitat classes inter-annually). Results from Black (2013)indicate that within the 400-800m depth area, where most of the hake fishing takes place, 3.5% of thearea was contacted once or more between 1989-90 and 2009-10, (between 0-400m 1.34% wascontacted over the same period). Of the entire fishable region within the EEZ for hake (1,408,210km2), 1.25% has been contacted once or more by bottom trawls, between 1989-90 and 2009-10.The impact of trawling for conservation and species diversity/persistence can be limited if trawlingaffects small proportions of a habitat type within an area. Trawling of small proportions of eachhabitat type may therefore be acceptable, and impact on benthic ecosystems reduced, in this situationas the biodiversity is maintained in neighbouring areas.
The New Zealand Government closed 17 BPAs (Benthic Protection Areas) within the New ZealandEEZ (Exclusive Economic Zone) to bottom trawl fishing methods in perpetuity as of late 2007 (seeFigure 5 for distribution). These areas comprise over 1.2 million km2 of seabed. Protection is alsoprovided under the accord to 52% of all UTFs within the New Zealand EEZ and 88% of identifiedhydrothermal vents. Demersal trawling and dredging is prohibited in these areas (pelagic fishing anddemersal longlining being allowed). Regulations promulgated pursuant to the Fisheries Act (1996)implemented the closure of seamounts in 2001, representing 100,997 km2
(http://www.mfe.govt.nz/environmental-reporting/oceans/protected-areas/management-tools.html).This is discussed further under Section 3.7.2.7.
The ecosystem structure around New Zealand has been examined through the collection and analysisof stomach contents in key fish species (juveniles and adults) on the Chatham Rise and sub-Antarctic
INTERTEK FISHERIES CERTIFICATION (IFC)
NZ Hake Fishery PCR Intertek Fisheries Certification page 30
regions of the New Zealand EEZ (e.g. Livingston and Stevens, 2004). This includes the dietary habitsof hake. Dunn et al. (2010) found that the diet of hake on the Chatham Rise was dominated by teleostfishes, in particular Macrouridae (rattails). Macrouridae accounted for 44% of the prey weight andconsisted of at least six species, of which javelinfish, Lepidorhynchus denticulatus, was mostfrequently identified. Hoki were less frequent prey, but being relatively large accounted for 37% ofprey by weight. Squid were found in 7% of the stomachs, and accounted for 5% of the prey byweight. Crustacean prey were predominantly natant decapods, with pasiphaeid prawns occurring in19% of the stomachs.
The structure of the mid-water food web is broadly understood for the Chatham Rise and Sub-Antarctic areas through numerous studies, which underpin existing and developing ecosystem models(Bradford-Grieve et al., 2003; ENV 2006/04, ZBD 2004/02; Pinkerton, 2011a). No model has yetbeen developed for the west coast South Island. Given the different ecosystems covered by existingmodels and studies, information is adequate to understand the functions of the key elements of theecosystem. Information from the Ministry for Primary Industries’ fisheries observer programme, andthe logbooks (for the main 5 species in the catch) as well as continued sampling of stomachs, allowthe main consequences for the ecosystem to be inferred.
The developed Ecopath models allow the impacts of the fishery on components to be examined, hakebeing a component of fish groups within the model, although this analysis has not yet been performed.
The Chatham Rise fishery is best understood in this respect, and an ecosystem model has beendeveloped for this fishery (Pinkerton 2011a). Changes include declines in the mean trophic level ofcommercial and trawl survey catches and changes in species abundance (Tuck et al. 2009, Pinkerton2011b) although this may be a consequence of the data analysed in these coming from when thebiomass of hoki was declining. The ecosystem supporting the hake fishery in the Sub-Antarctic area isless well studied than that on the Chatham Rise. On-going change is reported from the Sub-Antarcticecosystem, including declining mean trophic level (Tuck et al. 2009). Again, a key driver of thisobserved change is expected to have been the decline in hoki (rather than hake) biomass. At an EEZlevel, the impacts of fisheries’ removals on ecosystem productivity have also been examined. Theeffects of fisheries were assessed, preliminarily, to be sustainable in an energetic context (Knight et al.2011). However, with the recovery of hoki stocks and key species being removed at levels close to orabove BMSY, there would be a sizeable proportion of biomass remaining in the ecosystem, andremovals at this level are unlikely to lead to serious harm.
In summary, the two most significant ecosystem-level considerations in the hake fishery are theeffects of removal of hoki biomass from the system through the hake-related fishery, and the impactsof demersal trawling activity on the benthos and benthic habitats. Retained, bycatch, and ETP speciesare considered further below.
Other fisheries overlap with the hake fishery spatially, such as trawl fisheries targeting hoki and ling(Ministry of Fisheries 2011a). Consequently, while considered separately for the purposes of thisassessment, trawl activity in all these fisheries will naturally have additive effects on the marineecosystems that support them.
3.7.2 The retained, bycatch and endangered, threatened or protected (ETP) species includingtheir status and relevant management history
Data on catch rates and the relative abundance of non-target species in the fishery are available fromthree main sources:
The TCEPR forms, which provide green-weight catch totals for the top five species

INTERTEK FISHERIES CERTIFICATION (IFC)
NZ Hake Fishery PCR Intertek Fisheries Certification page 31
(dependent on vessel size and fishing method) on a fishing-event basis, and daily summary ofTACC species caught.
The Ministry for Primary Industries’ fisheries observer data, which provides catch weight forall QMS and non-QMS species caught, on an observed tow-by-tow basis. This providesaccurate and verifiable information, if on variable and patchy coverage). The observersmonitored around 22.75% of trawls in 2010/2011in the HAK/HOK/LIN trawl fishery.(Ramm2012b).
Fishery independent trawl surveys on the Chatham Rise and Sub-Antarctic regions, provideabundance estimates of finfish, cartilaginous fish, and squid species, as well as catch weightsof macro-invertebrates. Further inshore surveys also provide some information on TACCstocks.
3.7.2.1 Retained and bycatch species
The hake fishery is a component of New Zealand’s Deepwater and Middle-depth fisheries whichtarget a range of species (Ministry of Fisheries, 2010a). Data from the observer programme were usedto assess the main retained and discarded non-target species within the catches by management area.These data were available for a five-year period from 2007/08 to 2011/12, and therefore represent theaverage catch levels over a significant time period. Temporal trends in the data could not be identifiedas a result, but the data period does reduce the impact of year-to-year fluctuations on results. Ballaraet al. (2010) also provides an overview of catches and discards in the hoki/hake/ling fishery.
The top ten species (retained and bycatch) within hake-targeted trawl fisheries by management area,based upon observer data from a five-year period from 2007/08 to 2011/12. Proportion of QMSspecies in catch by weight noted. Full tables are available at http://www.deepwater.co.nz/our-species/hake/msc-assessment-of-new-zealand-hake-fisheries/.
Table 6: Top ten (by weight) retained and bycatch species from the hake-targeted trawl fishery.Source: MPI Observer data. Non-QMS species noted with a * (which do not have to beretained). Percentage values reflect the proportion these species contribute to catch totals byweight.
HAK1 HAK4 HAK7Hoki Hoki HokiLing Silver warehou RibaldoWhite warehou Javelinfish* LingSpiny dogfish Sea perch Javelinfish*Silver warehou Ling Rattails*Rattails* Rattails* Silver warehouJavelinfish* Barracouta White warehouSquid Bellowsfish* Conger eel*Ribaldo Alfonsino Lookdown doryLeafscale gulper shark* Spiny dogfish Sea perch97.7% 93.3% 94.9%
It is noted that hake- (and ling-) targeted fishing is undertaken as a part of the main hoki fishery. Thekey bycatch species within these fisheries are generally comparable to those caught within the relatedhoki fishery (which are hake (Merluccius australis), ling (Genypterus blacodes), silver warehou(Seriolella punctata), and frostfish (Lepidopus caudatus) and the non-commercial spiny dogfish(Squalus acanthias) and rattails (Macrouridae)). While some specific differences are found, and theassessment performed here is based upon retained species levels within the hake-targeted fishery,
INTERTEK FISHERIES CERTIFICATION (IFC)
NZ Hake Fishery PCR Intertek Fisheries Certification page 32
examination of the retained species levels within the hoki/hake/ling fishery relative to sustainablelevels is recommended.
Retained species are, by regulation, the Quota Management System (QMS) species, which areenumerated and retained on board (except '6th schedule' species like spiny dogfish, which areenumerated before return to the sea as per Schedule 6 of the Fisheries Act 1996: Stocks which may bereturned to the sea or other waters in accordance with stated requirements). The main QMS speciesare the subject of analytical stock assessments and active management that is based upon formalisedbiologically based limits. For the remaining QMS species, the TACC system, which aims to limit theoverall catch of species, combined with the ‘deemed value’ process, represents the managementstrategy for these species.
Information is sufficient to quantitatively estimate outcome status with a high degree of certainty forthe majority of main (>5% of catch) QMS species caught, by target fishery and management area.However, information for some main QMS species and other QMS species is more limited andquantitative estimates of outcome status are not routinely developed, although qualitative assessmentshave been performed for particular species; trends in the abundance of key retained species that areadequately sampled by trawl surveys on the Chatham Rise and Sub-Antarctic have been reportedfollowing each survey. In theory action would be initiated if negative trends in particular species wereidentified. The potentially low statistical power of the survey data for some species is noted.
The New Zealand system identifies species by 'tier', Tier 1 being target species, Tier 2 being key non-target (bycatch) WMS species and tier 3 being non-QMS species.
For non-QMS species (Tier 3 species) stock assessments are not performed, and assessments of thepotential impact of the fishery on population levels are highly uncommon. These species are notmanaged under the TACC process, although the increasing number of species within the QMS systemdemonstrates that substantial catches of non-QMS species tends to lead to the establishment of theirQMS status, and hence become subject to more formalised monitoring and must be retained on boardvessels. Species can be added to the QMS under Section 17B of the Fisheries Act and/or the speciesmanaged under Section 11 of the Act (see also the QMS Introduction Process Standard; MPI (2008)).Section 17B of the Act requires that stocks or species be added to the QMS if the existingmanagement is not ensuring sustainability or is not providing for utilization. Under the Act, ‘ensuringsustainability’ means ‘maintaining the potential of fisheries resources to meet the reasonablyforeseeable needs of future generations and avoiding, remedying, or mitigating any adverse effects offishing on the aquatic environment’ while ‘utilisation’ means ‘conserving, using, enhancing anddeveloping a fisheries resource to enable people to provide for their social, economic, and culturalwellbeing’. Two recent species introductions into the QMS were Patagonian toothfish (Ministry ofFisheries, 2010c) and attached bladder kelp (Ministry of Fisheries, 2010d). The latter was added to theQMS inter alia because the Ministry of Fisheries concluded that there was increasing demand for thespecies. While the QMS Introduction Process Standard provides a framework, further formalisation ofthe procedure for moving non-QMS species within the QMS framework, and monitoring ‘minor’ (lesscommon, e.g. <5% of catch weigh) QMS species status and trends, given the information collected,would improve the situation. As noted, this has been performed for specific species, and could beprioritised based upon identification of key low-productivity species through a formalisedProductivity-Sensitivity Analysis (as indicated within the framework).
Given that formal assessments of non-QMS species are not performed, for the purposes of the currentassessment, this has required a number of assumptions to be made. We have assumed that whereassessments or qualitative evaluations are lacking, a species may be at risk where they represent >5%of the total catch, or are caught at levels greater than 10 tonnes per year where this species isconsidered of low productivity (identified through a Productivity-Sensitivity Analysis (PSA)). We
INTERTEK FISHERIES CERTIFICATION (IFC)
NZ Hake Fishery PCR Intertek Fisheries Certification page 33
recognise that a species may have low abundance and high catchability, which may lead to incorrectestimation of status using these criteria. This approach is comparable to that taken under P1, inseparating the determination of outcome from the management approach and information necessary tounderpin that management.
Table 7 summarizes the available information on the status of retained species which constitute over1% of the observed catch during 2007-08 to 2011-12. Of those species representing the 'main' retainedspecies (>5% of the catch):
Hoki is assessed as two stocks (HOK1 and HOK10) but only the former overlaps with theareas of hake examined here. HOK1 is estimated to be above both the soft limit and targetwith high probability (>90%).
Ling is assessed as five stocks (Chatham Rise (LIN3&4), Sub-Antarctic (LIN5&6), WestCoast South Island (LIN7WC), Cook Strait (LIN7CK) and Bounty Plateau (LIN6B). Allstocks are estimated to be above the soft limit with high probability > 90% and all stocks areassessed to be likely or highly likely to be above the target reference point.
Silver warehou represented ~9% of the catch weight of hake-targeted tows in HAK4 (a sub-set of the SWA4 area). Biomass indices from R.V. Tangaroa fishery-independent trawlsurveys in QMAs 3 (part), 4 and 5 since 1991 are variable between years and have high CVs.They were therefore unsuitable for stock assessment. The Plenary report noted that "In mostyears from 2000-01 to 2008-09 catches in SWA 3 and SWA 4 were well above the TACCsas fishers landed catches well in excess of ACE holdings. The sustainability of currentTACCs and recent catch levels for these fish stocks is not known, and it is not known if theywill allow the stocks to move towards a size that will support the maximum sustainableyield." 2% (~20t) of the observed catch within this area was from hake-targeted tows.
No non-retained (non-QMS) species constituted more than 5% of the catch during 2007-08 to 2011-12, while two species often constituted more than 1% of the catch, being rattails and javelinfish. Noassessments exist for these species. However, data on trends in biomass are available from surveys onthe Chatham Rise. Both species are very well monitored by these surveys. Javelin fish appear to beincreasing, while the most abundant rattail species, Bollons’ rattail, exhibits no trend, at least on theChatham Rise (O’Driscoll et al. 2011).
In relation to Tier 2 species (key bycatch species), it will not always be easy to implement specificharvest strategies. Management Action 28 in the Annual Operational Plan (MPI, 2012) for thedeepwater fisheries (Ministry of Fisheries 2011h) aims to develop management procedures for silverwarehou and white warehou. These species were selected taking account of their size and extent.Fisheries characterizations, e.g. for silver warehou (Parker and Fu 2011), could provide additionalinformation for lesser species. They involve analysing all available data including: (a) survey data, (b)catch-effort information, and (c) observer data. Catch-effort data can be used to inform spatialdistribution as well as how and when a species is caught. Observer data provide better biological datasuch as length and perhaps age-compositions. In principle, changes in the age-compositions amongyears can be used to estimate changes in fishing mortality over time.
As noted above, Tier 3 species (non-QMS species, usually discarded) can be added to the QMSsystem under Section 17B of the Fisheries Act and/or the species managed under Section 11 of theAct (see also the QMS Introduction Process Standard) if a sustainability problem is detected.
It is difficult to detect whether there is a sustainability concern for many Tier 2 (QMS) and Tier 3(non-QMS) species (e.g. MPI 2013a, b, c) but as noted in the National Deepwater plan (Ministry of
INTERTEK FISHERIES CERTIFICATION (IFC)
NZ Hake Fishery PCR Intertek Fisheries Certification page 34
Fisheries, 2011) management of species based on CPUE and size-based trends are underway. Anumber of projects related to improving the information base for Tier 2 and Tier 3 species are eitherplanned or underway, including a project (DEE2011-03) to conduct Level 1 risk assessments for Tier3 species which could lead to additional research being conducted (see Management Action #16 of theAnnual Operational Plan for Deepwater Fisheries 2012/13; MPI, 2012b). Furthermore, the use ofCPUE time series and size classes are becoming more frequent for Tier 2 species (MPI, 2013a, b, c).
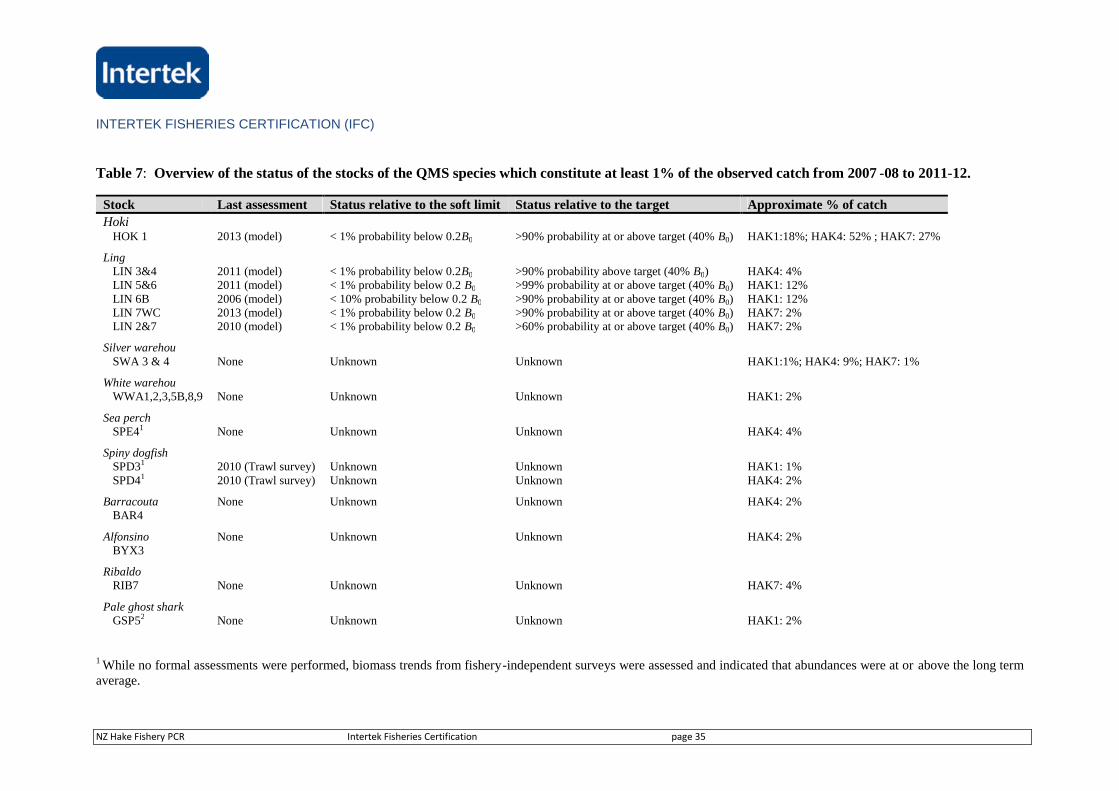
INTERTEK FISHERIES CERTIFICATION (IFC)
NZ Hake Fishery PCR Intertek Fisheries Certification page 35
Table 7: Overview of the status of the stocks of the QMS species which constitute at least 1% of the observed catch from 2007 -08 to 2011-12.
Stock Last assessment Status relative to the soft limit Status relative to the target Approximate % of catch
HokiHOK 1 2013 (model) < 1% probability below 0.2B0 >90% probability at or above target (40% B0) HAK1:18%; HAK4: 52% ; HAK7: 27%
LingLIN 3&4 2011 (model) < 1% probability below 0.2B0 >90% probability above target (40% B0) HAK4: 4%LIN 5&6 2011 (model) < 1% probability below 0.2 B0 >99% probability at or above target (40% B0) HAK1: 12%LIN 6B 2006 (model) < 10% probability below 0.2 B0 >90% probability at or above target (40% B0) HAK1: 12%LIN 7WC 2013 (model) < 1% probability below 0.2 B0 >90% probability at or above target (40% B0) HAK7: 2%LIN 2&7 2010 (model) < 1% probability below 0.2 B0 >60% probability at or above target (40% B0) HAK7: 2%
Silver warehouSWA 3 & 4 None Unknown Unknown HAK1:1%; HAK4: 9%; HAK7: 1%
White warehouWWA1,2,3,5B,8,9 None Unknown Unknown HAK1: 2%
Sea perchSPE41 None Unknown Unknown HAK4: 4%
Spiny dogfishSPD31 2010 (Trawl survey) Unknown Unknown HAK1: 1%SPD41 2010 (Trawl survey) Unknown Unknown HAK4: 2%
Barracouta None Unknown Unknown HAK4: 2%BAR4
Alfonsino None Unknown Unknown HAK4: 2%BYX3
RibaldoRIB7 None Unknown Unknown HAK7: 4%
Pale ghost sharkGSP52 None Unknown Unknown HAK1: 2%
1 While no formal assessments were performed, biomass trends from fishery-independent surveys were assessed and indicated that abundances were at or above the long termaverage.
INTERTEK FISHERIES CERTIFICATION (IFC)
NZ Hake Fishery PCR
3.7.2.2 ETP species
The Wildlife Act 1953 gives absolute protection to wildlife throughout New Zealand and itssurrounding marine Exclusive Economic Zone. All marine mammals (including all seal, dolphin andwhale species) are fully protected throughout New Zealand and its EEZ under the Marine MammalsProtection Act 1978. The result of this is that almost all native birds and all marine mammals andmarine reptiles (including visiting turtles and sea snakes) are fully protected in New Zealand (underone of two Acts), and out as far as the edge of the EEZ. The exceptions are a small number of nativebirds managed as game birds, and a few other native birds that are partially protected. Just one nativebird, the black-backed gull, is currently unprotected. In addition, Schedule 7A of the Wildlife Act listscertain marine species that are legally protected, i.e., all species in the orders Antipatharia (blackcorals), Gorgonacea (gorgonian corals), and Scleractinia (stony corals) and the family Stylasteridae(hydrocorals). Fish protected under the Wildlife Act include the oceanic whitetip, basking, deepwaternurse, white pointer, and whale sharks, manta and spinetail devilrays, and two groupers. CITES listedspecies include the New Zealand fur seal, elephant seal, a number of cetaceans, basking, Great white,scalloped hammerhead and porbeagle sharks, as well as black coral (Antipatharia spp)(http://www.doc.govt.nz/about-doc/role/international/endangered-species/cites-species/nz-cites-listed-species/).
The national requirements for ETP protection in New Zealand law notes that while interactions arenot forbidden the law requires interactions to be reported on MPI’s Non-fish and Protected SpeciesCatch Return form. The long-term aim is to minimise mortalities where possible, with zerointeractions being the aspirational objective as described in the National Plan of Action. The reportscombined observer information provides good information on the potential effects of the fishery onETP species. No specific limits on interactions have been set; activities aimed at minimisinginteractions are underway.
It is recognised that the hake fishery is a sub-set of the hoki/hake/ling-targeted fishery. Catch rates ofthese different components of the effort have been examined. Given that the area-based breakdownbetween species-specific fisheries management areas is different (not all areas correspond), it isdifficult to assess area-specific overall ETP interactions within the hoki/hake/ling complex. Thetarget-fishery-specific area data are used here, although it is recommended that analysis across thefishery complex is performed in future.
Information is available on ETP species interactions through the on-going observer programme onboard vessels. This information is analysed based upon the identified ‘target’ fishery.
For the hake fishery, interactions focus on seabirds, marine mammals, and cold water corals.
3.7.2.3 Seabirds
Bird interactions in the hake fishery have been analysed in a number of studies (e.g. Abraham andThompson, 2011), which provide detailed breakdowns of interactions and model the likely impact ofthe total fishing fleet based upon data from observed vessels. Note that the estimates of capturesdetailed below and in provided references include recorded captures in the net, on the warps, ortangled in line, and hence includes observed warp strikes, and captures are also estimated by fishingmethod, being categorised by whether they were warp captures, net captures, or reported caughtthrough some other means (see https://data.dragonfly.co.nz/psc/v20121101/birds/hake-trawl/all-vessels/eez/all/ for a breakdown by year and interaction type for the hake trawl fishery). They excludeanimals that landed on the deck or collided with the vessel’s superstructure (Abraham and Thompson,2011).
INTERTEK FISHERIES CERTIFICATION (IFC)
NZ Hake Fishery PCR Intertek Fisheries Certification page 37
Population estimation studies are also underway for both birds and marine mammals, which willallow the likely impact of interactions on ETP species populations to be evaluated. In turn, ecologicalrisk assessment studies for birds have been completed (Richard et al., 2009), which allow evaluationsto focus on potentially more at risk species. These data have been used within the current study toevaluate the potential impact of the fishery on ETP bird and marine mammal populations. In turn,National Plans of Action have been developed for birds and sharks . These have been completed andthe Plans published.
Across the deepwater trawl fleet managed by the DWG, vessels >28 m now have Vessel ManagementPlans in place, which document their fish waste management procedures. The implementation ofthese plans is audited by onboard observers and DWG staff when vessels are in port. By law, trawlersover 28 m in length fishing in New Zealand waters are required to use at least one of three specifieddevices to reduce seabird interactions with trawl warps: paired streamer lines, a bird baffler, or a warpscarer (New Zealand Gazette 2010). The efficacy of these devices has been examined in New Zealand(Middleton and Abraham 2007) and internationally (e.g., Bull 2009; Løkkeborg 2011). Streamer linesare the most effective in reducing seabird strikes on trawl warps. The increasing number of trawlvessels operating in HAK7 of sizes smaller than 28 m is noted (see Table 1). Vessel size is includedwithin the models used to estimate seabird interactions (Abraham and Thompson, 2011) and hencewill be incorporated within the analysis of overall interaction rates discussed below. However, giventhe lack of requirements for bird (and other ETP) interaction mitigation approaches for these vessels,a recommendation for the collection and analysis of specific information on ETP interactions for thisvessel size class has been generated to confirm interaction rates and develop appropriate mitigationapproaches if and as required.
General mitigation approaches that are being employed by trawlers, supported through legislation,include voluntary industry-led codes of practice, detailed in Vessel Management Plans.
Vessel Management Plans are developed on a vessel-specific basis. These include methodologies tolimit offal discharge during periods of vulnerability for birds. This approach in reducing interactionsallows mitigation methods to be adapted to a particular vessel’s operations, but may not eliminateinteractions. Cleaning of the net before shooting is also required. Studies on trawl net interactionmitigation processes have been undertaken (Clement and Associates 2009).
Reporting practices are also in place, so that bird captures trigger action by DWG and are reported toMPI. The majority of seabird interactions with the hake fishery involve Salvin’s albatrosses, Buller’salbatrosses, white-capped albatrosses, cape petrels, Westland petrels, sooty shearwaters, prions, andwhite-chinned petrels (Table 8; Abraham and Thompson 2011. Note that this information is updatedregularly). A Level 1 risk assessment (based on expert knowledge) concluded that the hoki/hake/lingfishery did not represent an especially high risk for seabird populations, as long as effectivemanagement measures, including effective mitigation, are in place (Rowe 2013). Richard andAbraham (2013) provide a Level 2 risk assessment (based on semi-quantitative approaches, followingHobday et al., 2007) which identifies at-risk species caught in New Zealand commercial fisheries.This was used to support the updated National Plan of Action – Seabirds (2013, see below).
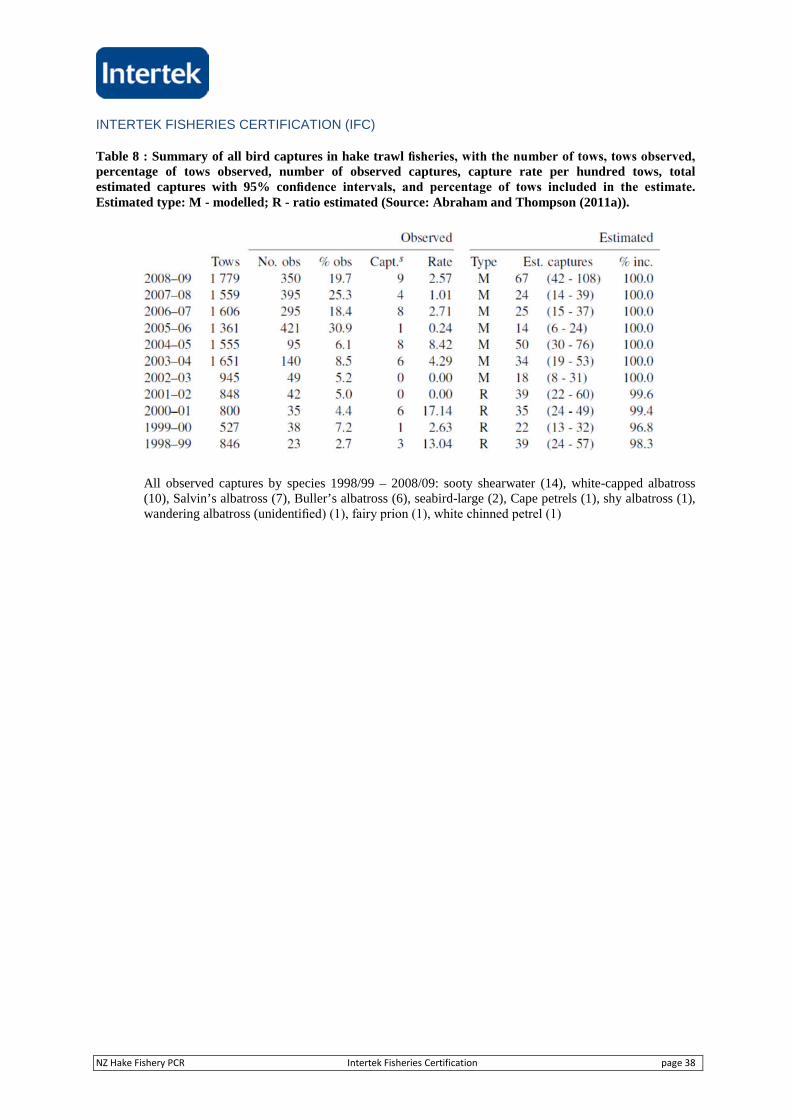
INTERTEK FISHERIES CERTIFICATION (IFC)
NZ Hake Fishery PCR Intertek Fisheries Certification page 38
Table 8 : Summary of all bird captures in hake trawl fisheries, with the number of tows, tows observed, percentage of tows observed, number of observed captures, capture rate per hundred tows, totalestimated captures with 95% confidence intervals, and percentage of tows included in the estimate. Estimated type: M - modelled; R - ratio estimated (Source: Abraham and Thompson (2011a)).
All observed captures by species 1998/99 – 2008/09: sooty shearwater (14), white-capped albatross(10), Salvin’s albatross (7), Buller’s albatross (6), seabird-large (2), Cape petrels (1), shy albatross (1),wandering albatross (unidentified) (1), fairy prion (1), white chinned petrel (1)
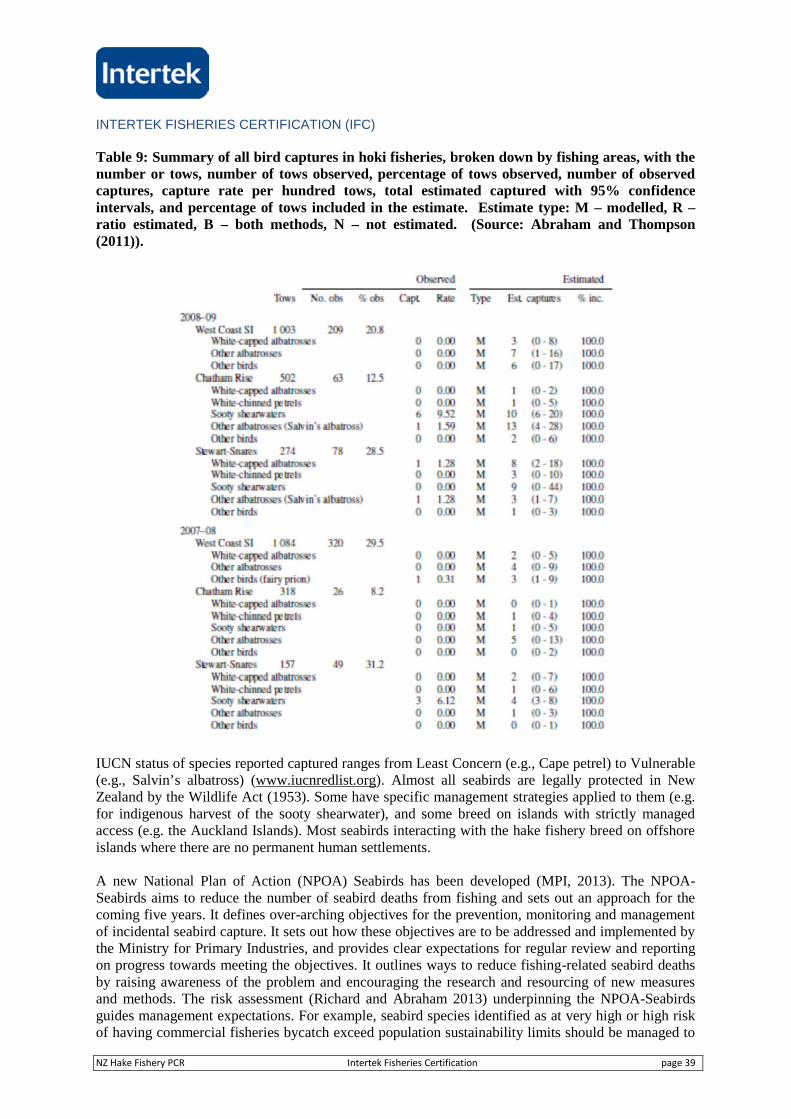
INTERTEK FISHERIES CERTIFICATION (IFC)
NZ Hake Fishery PCR Intertek Fisheries Certification page 39
Table 9: Summary of all bird captures in hoki fisheries, broken down by fishing areas, with thenumber or tows, number of tows observed, percentage of tows observed, number of observedcaptures, capture rate per hundred tows, total estimated captured with 95% confidenceintervals, and percentage of tows included in the estimate. Estimate type: M – modelled, R –ratio estimated, B – both methods, N – not estimated. (Source: Abraham and Thompson(2011)).
IUCN status of species reported captured ranges from Least Concern (e.g., Cape petrel) to Vulnerable(e.g., Salvin’s albatross) (www.iucnredlist.org). Almost all seabirds are legally protected in NewZealand by the Wildlife Act (1953). Some have specific management strategies applied to them (e.g.for indigenous harvest of the sooty shearwater), and some breed on islands with strictly managedaccess (e.g. the Auckland Islands). Most seabirds interacting with the hake fishery breed on offshoreislands where there are no permanent human settlements.
A new National Plan of Action (NPOA) Seabirds has been developed (MPI, 2013). The NPOA-Seabirds aims to reduce the number of seabird deaths from fishing and sets out an approach for thecoming five years. It defines over-arching objectives for the prevention, monitoring and managementof incidental seabird capture. It sets out how these objectives are to be addressed and implemented bythe Ministry for Primary Industries, and provides clear expectations for regular review and reportingon progress towards meeting the objectives. It outlines ways to reduce fishing-related seabird deathsby raising awareness of the problem and encouraging the research and resourcing of new measuresand methods. The risk assessment (Richard and Abraham 2013) underpinning the NPOA-Seabirdsguides management expectations. For example, seabird species identified as at very high or high riskof having commercial fisheries bycatch exceed population sustainability limits should be managed to
INTERTEK FISHERIES CERTIFICATION (IFC)
NZ Hake Fishery PCR Intertek Fisheries Certification page 40
a lower risk category by 2018. Species in these categories that are reported caught in the hake fisheryinclude white-capped albatross, Buller’s albatross and Salvin’s albatross.
The level of understanding of seabird populations and ecology is highly variable, and depends on anumber of factors, including accessibility of breeding islands and the severity of perceived threats.For example, despite being captured in many New Zealand fisheries, Salvin’s albatross is a less wellstudied species, due to the largest population breeding on the remote and inhospitable Bounty Islands.Population studies have commenced on a number of seabird species affected by fisheries, includingthe hake fishery, during the last 5-10 years (e.g. white-capped albatross and white-chinned petrel).There are also a small number of longer term studies, e.g. of Buller’s albatross on the Snares Islands.Albatrosses and petrels generally lay a single egg each breeding event, and many don’t breed everyyear. Adult survival is the most important parameter determining population trends.
Seabird captures in the hake fishery account for approximately 3% of seabirds caught in New Zealandoffshore trawl fisheries in 2007/08 and 2008/09 (Abraham and Thompson 2011b; Table 14). Capturesof potentially at-risk species require particularly careful monitoring to ensure that the impact of thehake fishery does not threaten sustainability.
3.7.2.4 Marine mammals
Like all marine mammals in New Zealand waters, fur seals are legally protected. The population ofNew Zealand fur seals is widely believed to be increasing although there are no robust populationcount data available. Baird (2011) summarises current knowledge relating to population status. Thelongest term data set is from three rookeries on the West Coast of New Zealand’s South Island. Atthese sites, surveys of pup production have occurred since the 1990s. Summary findings from thiswork indicate net declines in pup production between the 1990s and 2000s. In contrast, work aroundKaikoura and Banks Peninsula (east coast of the South Island) suggests populations there areincreasing/expanding. Despite the lack of accurate population assessments, the life historycharacteristics of fur seals are well understood (see Baird 2011 for an extensive review).
Fur seals are caught in trawl and other fisheries around New Zealand. Numerically across all fisheries,they are the most captured New Zealand protected species. Captures of fur seals in the hake fisheryoccur in all fishing areas (Table 10), and estimated total captures peaked in 2007-08 at 53 individualsacross all fisheries (mean estimate of 28 in 2008-09). This represents 5-7% of the total estimated trawlcaptures of New Zealand fur seals in those years. Estimated total captures in hake target trawls havedecreased in the fishing years since 2008/09, with a total of 8 fur seals estimated caught the 2011/12fishing year3. Other fisheries capturing fur seals include trawl fisheries targeting hoki, southern bluewhiting, and surface longline fisheries (Ramm 2010, 2011).
No interactions have been noted with sea lions within the hake fisheries (Abraham and Thompson,2011). A marine mammal risk assessment is scheduled for 2014.
There are no specific regulations defining mitigation approaches for marine mammal interactionswithin this fishery. All vessels managed under the DWG are required to follow specific operatingprocedures to reduce the risk of seal captures. Procedures are described in the Operating Procedures:Marine Mammals, based on data analyses and expert opinion (Deepwater Group 2011c). Theserequire the rapid reporting of mortalities so that action can be taken. In turn, operating procedures arealso provided to minimise the danger period when the trawl net is close to the surface, shallow turnswhile trawling, and to avoid discharging offal (as in the VMP for bird bycatch mitigation). Somevessels avoid shooting nets where marine mammals are present (Rowe, 2009). Reporting practices arein place, so that marine mammal captures trigger action by DWG and are reported to MPI. Currentresearch and management priorities for fur seals include better assessments of capture levels in Cook
3 https://data.dragonfly.co.nz/psc/v20130304/about.html
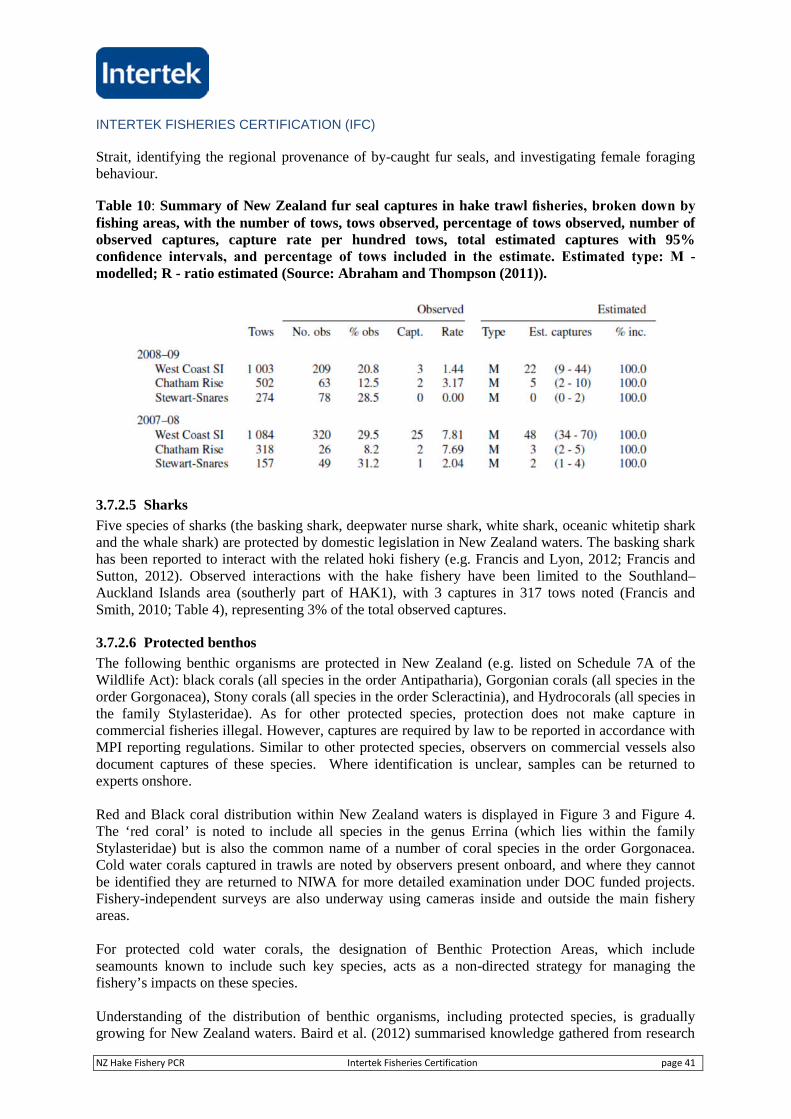
INTERTEK FISHERIES CERTIFICATION (IFC)
NZ Hake Fishery PCR Intertek Fisheries Certification page 41
Strait, identifying the regional provenance of by-caught fur seals, and investigating female foragingbehaviour.
Table 10: Summary of New Zealand fur seal captures in hake trawl fisheries, broken down by fishing areas, with the number of tows, tows observed, percentage of tows observed, number ofobserved captures, capture rate per hundred tows, total estimated captures with 95%confidence intervals, and percentage of tows included in the estimate. Estimated type: M -modelled; R - ratio estimated (Source: Abraham and Thompson (2011)).
3.7.2.5 Sharks
Five species of sharks (the basking shark, deepwater nurse shark, white shark, oceanic whitetip sharkand the whale shark) are protected by domestic legislation in New Zealand waters. The basking sharkhas been reported to interact with the related hoki fishery (e.g. Francis and Lyon, 2012; Francis andSutton, 2012). Observed interactions with the hake fishery have been limited to the Southland–Auckland Islands area (southerly part of HAK1), with 3 captures in 317 tows noted (Francis andSmith, 2010; Table 4), representing 3% of the total observed captures.
3.7.2.6 Protected benthos
The following benthic organisms are protected in New Zealand (e.g. listed on Schedule 7A of theWildlife Act): black corals (all species in the order Antipatharia), Gorgonian corals (all species in theorder Gorgonacea), Stony corals (all species in the order Scleractinia), and Hydrocorals (all species inthe family Stylasteridae). As for other protected species, protection does not make capture incommercial fisheries illegal. However, captures are required by law to be reported in accordance withMPI reporting regulations. Similar to other protected species, observers on commercial vessels alsodocument captures of these species. Where identification is unclear, samples can be returned toexperts onshore.
Red and Black coral distribution within New Zealand waters is displayed in Figure 3 and Figure 4.The ‘red coral’ is noted to include all species in the genus Errina (which lies within the familyStylasteridae) but is also the common name of a number of coral species in the order Gorgonacea.Cold water corals captured in trawls are noted by observers present onboard, and where they cannotbe identified they are returned to NIWA for more detailed examination under DOC funded projects.Fishery-independent surveys are also underway using cameras inside and outside the main fisheryareas.
For protected cold water corals, the designation of Benthic Protection Areas, which includeseamounts known to include such key species, acts as a non-directed strategy for managing thefishery’s impacts on these species.
Understanding of the distribution of benthic organisms, including protected species, is graduallygrowing for New Zealand waters. Baird et al. (2012) summarised knowledge gathered from research
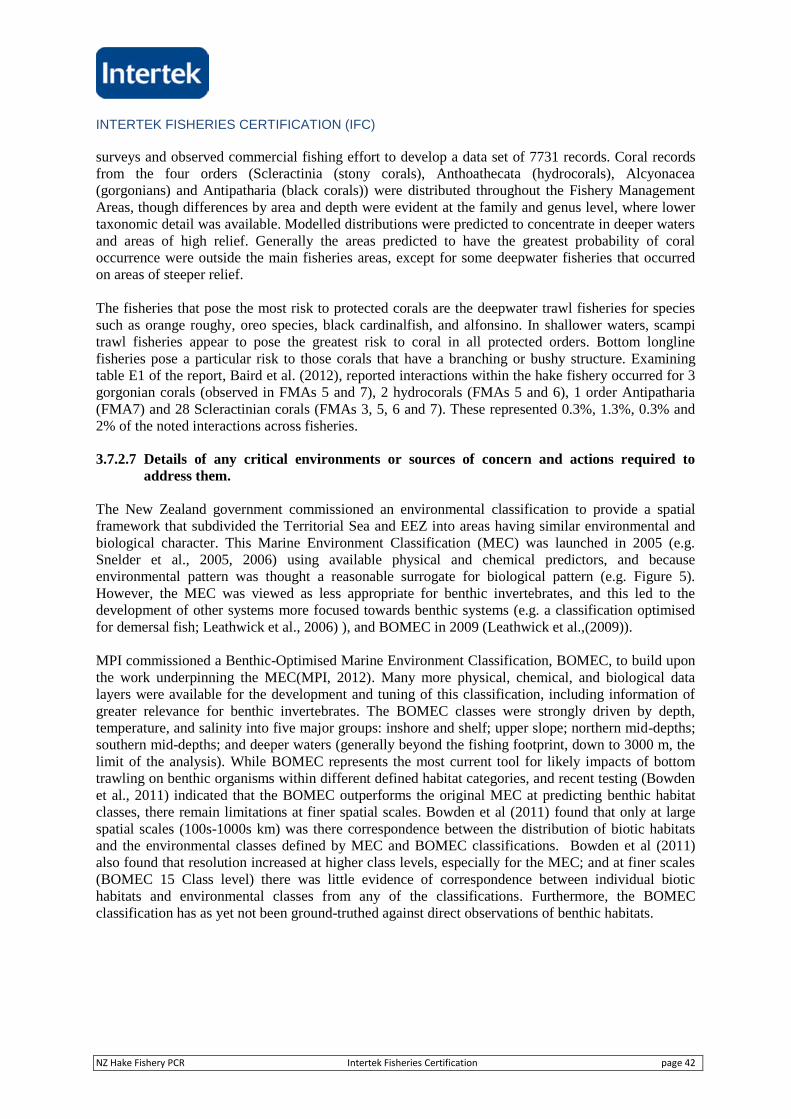
INTERTEK FISHERIES CERTIFICATION (IFC)
NZ Hake Fishery PCR Intertek Fisheries Certification page 42
surveys and observed commercial fishing effort to develop a data set of 7731 records. Coral recordsfrom the four orders (Scleractinia (stony corals), Anthoathecata (hydrocorals), Alcyonacea(gorgonians) and Antipatharia (black corals)) were distributed throughout the Fishery ManagementAreas, though differences by area and depth were evident at the family and genus level, where lowertaxonomic detail was available. Modelled distributions were predicted to concentrate in deeper watersand areas of high relief. Generally the areas predicted to have the greatest probability of coraloccurrence were outside the main fisheries areas, except for some deepwater fisheries that occurredon areas of steeper relief.
The fisheries that pose the most risk to protected corals are the deepwater trawl fisheries for speciessuch as orange roughy, oreo species, black cardinalfish, and alfonsino. In shallower waters, scampitrawl fisheries appear to pose the greatest risk to coral in all protected orders. Bottom longlinefisheries pose a particular risk to those corals that have a branching or bushy structure. Examiningtable E1 of the report, Baird et al. (2012), reported interactions within the hake fishery occurred for 3gorgonian corals (observed in FMAs 5 and 7), 2 hydrocorals (FMAs 5 and 6), 1 order Antipatharia(FMA7) and 28 Scleractinian corals (FMAs 3, 5, 6 and 7). These represented 0.3%, 1.3%, 0.3% and2% of the noted interactions across fisheries.
3.7.2.7 Details of any critical environments or sources of concern and actions required toaddress them.
The New Zealand government commissioned an environmental classification to provide a spatialframework that subdivided the Territorial Sea and EEZ into areas having similar environmental andbiological character. This Marine Environment Classification (MEC) was launched in 2005 (e.g.Snelder et al., 2005, 2006) using available physical and chemical predictors, and becauseenvironmental pattern was thought a reasonable surrogate for biological pattern (e.g. Figure 5).However, the MEC was viewed as less appropriate for benthic invertebrates, and this led to thedevelopment of other systems more focused towards benthic systems (e.g. a classification optimisedfor demersal fish; Leathwick et al., 2006) ), and BOMEC in 2009 (Leathwick et al.,(2009)).
MPI commissioned a Benthic-Optimised Marine Environment Classification, BOMEC, to build uponthe work underpinning the MEC(MPI, 2012). Many more physical, chemical, and biological datalayers were available for the development and tuning of this classification, including information ofgreater relevance for benthic invertebrates. The BOMEC classes were strongly driven by depth,temperature, and salinity into five major groups: inshore and shelf; upper slope; northern mid-depths;southern mid-depths; and deeper waters (generally beyond the fishing footprint, down to 3000 m, thelimit of the analysis). While BOMEC represents the most current tool for likely impacts of bottomtrawling on benthic organisms within different defined habitat categories, and recent testing (Bowdenet al., 2011) indicated that the BOMEC outperforms the original MEC at predicting benthic habitatclasses, there remain limitations at finer spatial scales. Bowden et al (2011) found that only at largespatial scales (100s-1000s km) was there correspondence between the distribution of biotic habitatsand the environmental classes defined by MEC and BOMEC classifications. Bowden et al (2011)also found that resolution increased at higher class levels, especially for the MEC; and at finer scales(BOMEC 15 Class level) there was little evidence of correspondence between individual biotichabitats and environmental classes from any of the classifications. Furthermore, the BOMECclassification has as yet not been ground-truthed against direct observations of benthic habitats.
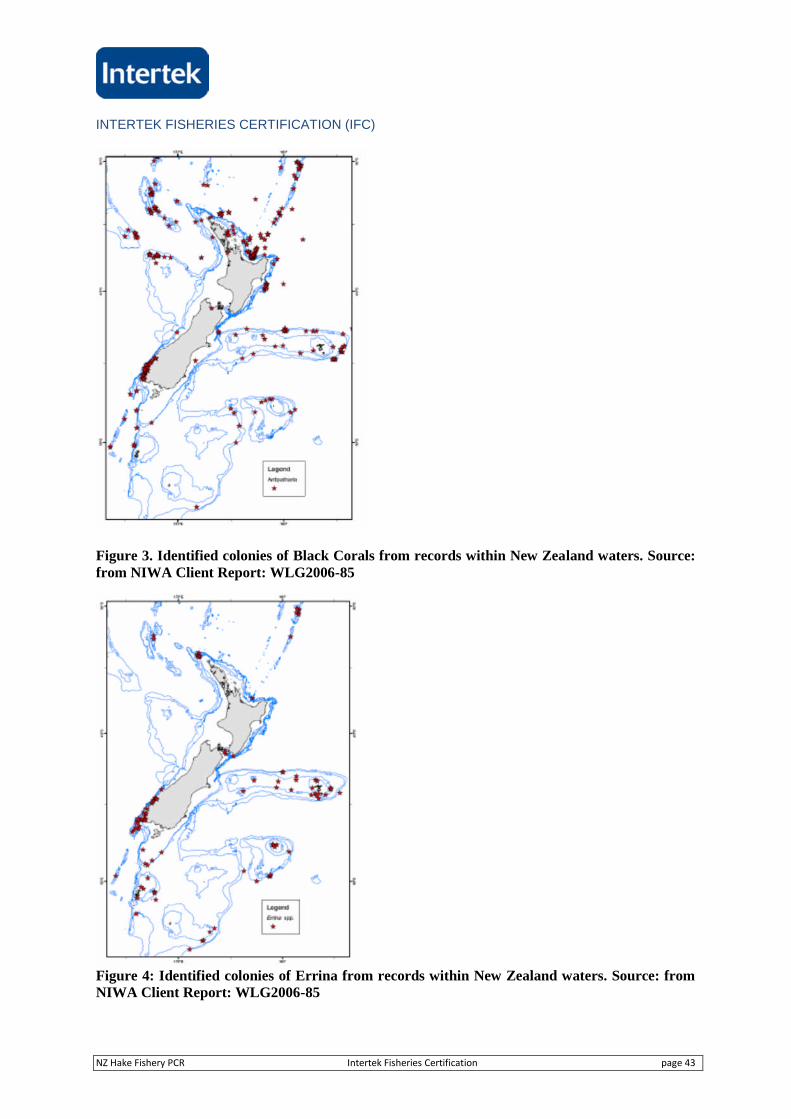
INTERTEK FISHERIES CERTIFICATION (IFC)
NZ Hake Fishery PCR Intertek Fisheries Certification page 43
Figure 3. Identified colonies of Black Corals from records within New Zealand waters. Source:from NIWA Client Report: WLG2006-85
Figure 4: Identified colonies of Errina from records within New Zealand waters. Source: fromNIWA Client Report: WLG2006-85
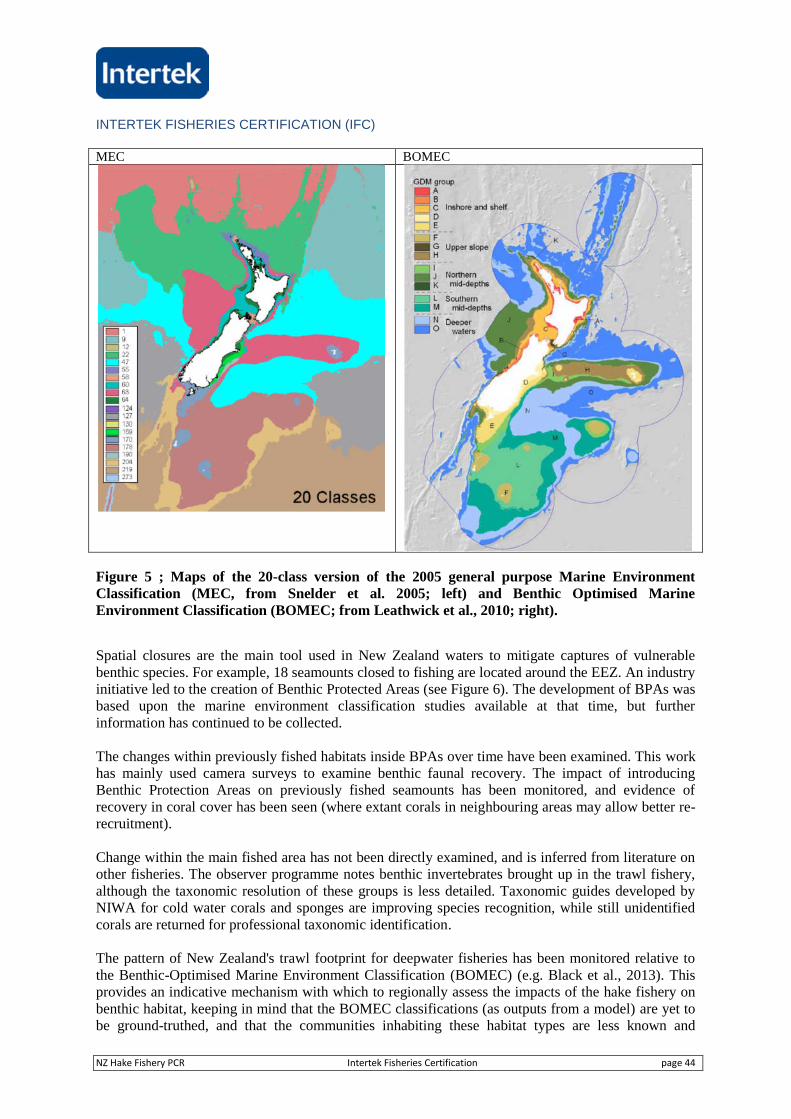
INTERTEK FISHERIES CERTIFICATION (IFC)
NZ Hake Fishery PCR Intertek Fisheries Certification page 44
MEC BOMEC
Figure 5 ; Maps of the 20-class version of the 2005 general purpose Marine EnvironmentClassification (MEC, from Snelder et al. 2005; left) and Benthic Optimised MarineEnvironment Classification (BOMEC; from Leathwick et al., 2010; right).
Spatial closures are the main tool used in New Zealand waters to mitigate captures of vulnerablebenthic species. For example, 18 seamounts closed to fishing are located around the EEZ. An industryinitiative led to the creation of Benthic Protected Areas (see Figure 6). The development of BPAs wasbased upon the marine environment classification studies available at that time, but furtherinformation has continued to be collected.
The changes within previously fished habitats inside BPAs over time have been examined. This workhas mainly used camera surveys to examine benthic faunal recovery. The impact of introducingBenthic Protection Areas on previously fished seamounts has been monitored, and evidence ofrecovery in coral cover has been seen (where extant corals in neighbouring areas may allow better re-recruitment).
Change within the main fished area has not been directly examined, and is inferred from literature onother fisheries. The observer programme notes benthic invertebrates brought up in the trawl fishery,although the taxonomic resolution of these groups is less detailed. Taxonomic guides developed byNIWA for cold water corals and sponges are improving species recognition, while still unidentifiedcorals are returned for professional taxonomic identification.
The pattern of New Zealand's trawl footprint for deepwater fisheries has been monitored relative tothe Benthic-Optimised Marine Environment Classification (BOMEC) (e.g. Black et al., 2013). Thisprovides an indicative mechanism with which to regionally assess the impacts of the hake fishery onbenthic habitat, keeping in mind that the BOMEC classifications (as outputs from a model) are yet tobe ground-truthed, and that the communities inhabiting these habitat types are less known and
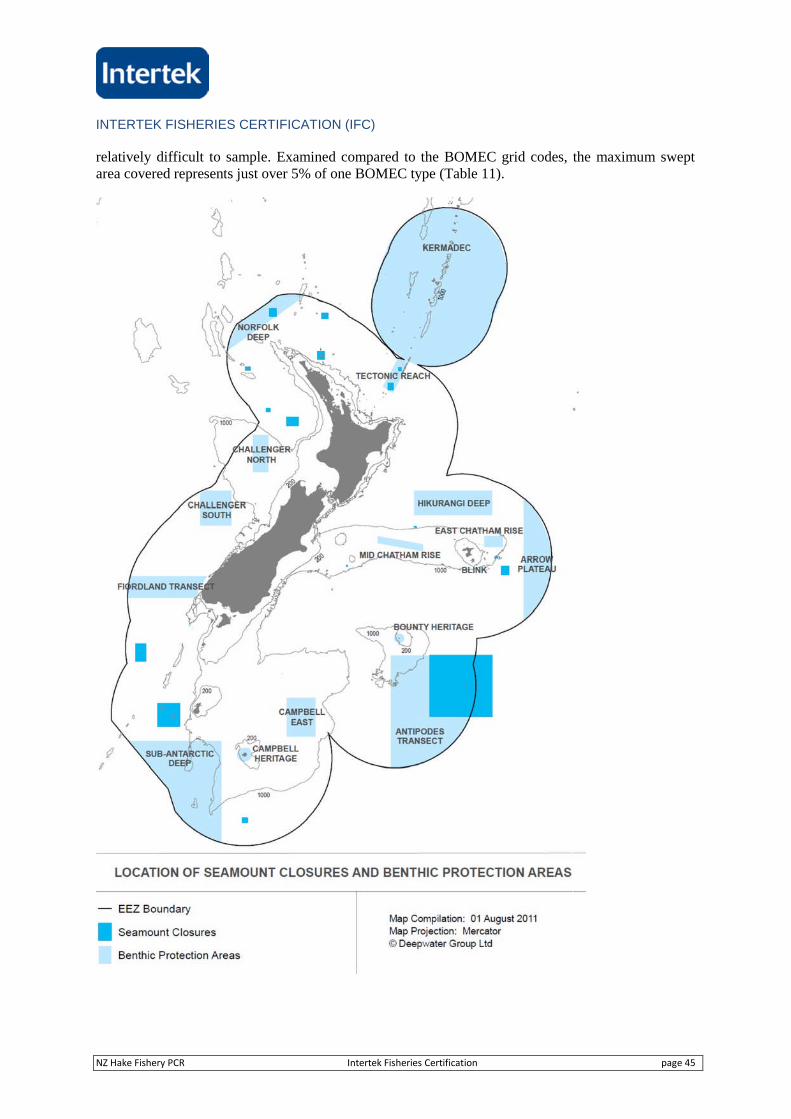
INTERTEK FISHERIES CERTIFICATION (IFC)
NZ Hake Fishery PCR Intertek Fisheries Certification page 45
relatively difficult to sample. Examined compared to the BOMEC grid codes, the maximum sweptarea covered represents just over 5% of one BOMEC type (Table 11).
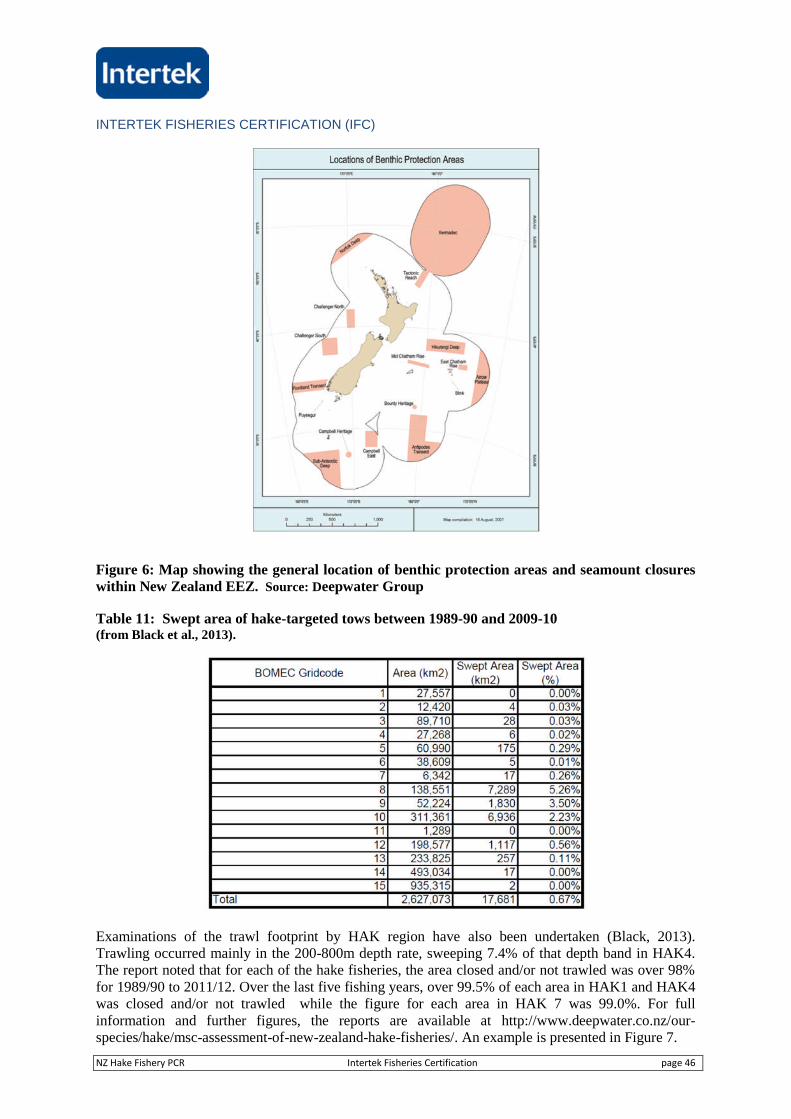
INTERTEK FISHERIES CERTIFICATION (IFC)
NZ Hake Fishery PCR Intertek Fisheries Certification page 46
Figure 6: Map showing the general location of benthic protection areas and seamount closureswithin New Zealand EEZ. Source: Deepwater Group
Table 11: Swept area of hake-targeted tows between 1989-90 and 2009-10(from Black et al., 2013).
Examinations of the trawl footprint by HAK region have also been undertaken (Black, 2013).Trawling occurred mainly in the 200-800m depth rate, sweeping 7.4% of that depth band in HAK4.The report noted that for each of the hake fisheries, the area closed and/or not trawled was over 98%for 1989/90 to 2011/12. Over the last five fishing years, over 99.5% of each area in HAK1 and HAK4was closed and/or not trawled while the figure for each area in HAK 7 was 99.0%. For fullinformation and further figures, the reports are available at http://www.deepwater.co.nz/our-species/hake/msc-assessment-of-new-zealand-hake-fisheries/. An example is presented in Figure 7.
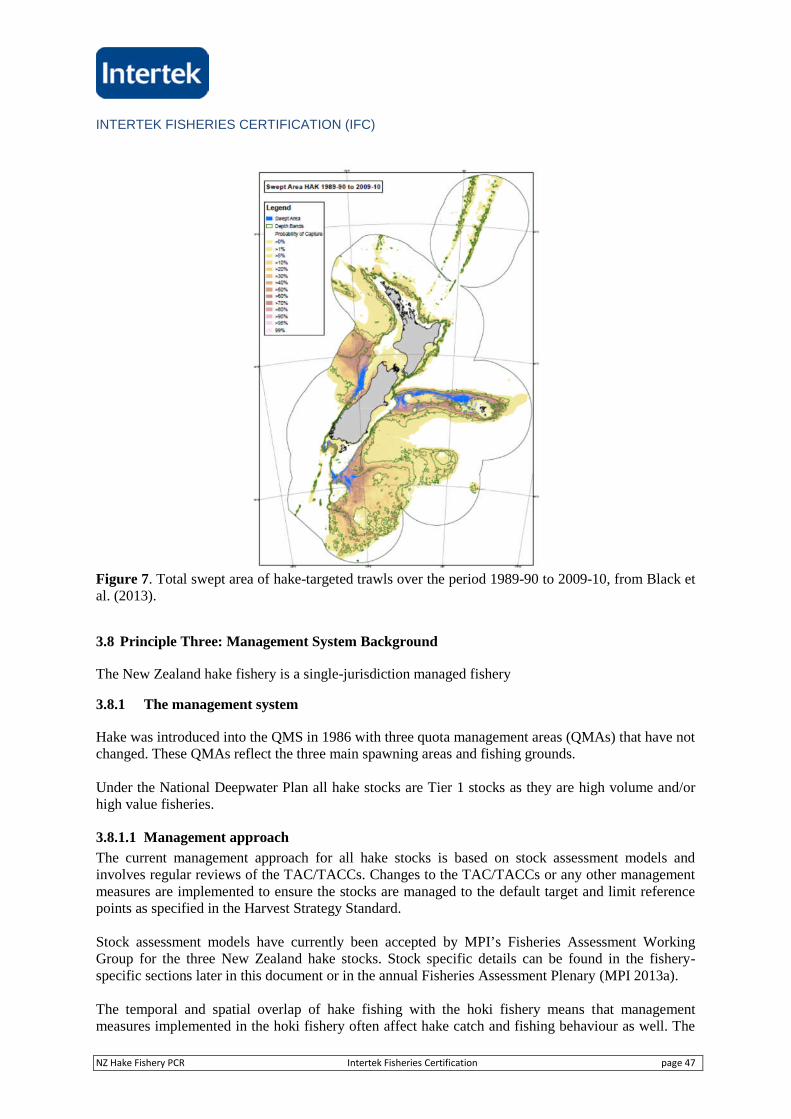
INTERTEK FISHERIES CERTIFICATION (IFC)
NZ Hake Fishery PCR Intertek Fisheries Certification page 47
Figure 7. Total swept area of hake-targeted trawls over the period 1989-90 to 2009-10, from Black etal. (2013).
3.8 Principle Three: Management System Background
The New Zealand hake fishery is a single-jurisdiction managed fishery
3.8.1 The management system
Hake was introduced into the QMS in 1986 with three quota management areas (QMAs) that have notchanged. These QMAs reflect the three main spawning areas and fishing grounds.
Under the National Deepwater Plan all hake stocks are Tier 1 stocks as they are high volume and/orhigh value fisheries.
3.8.1.1 Management approach
The current management approach for all hake stocks is based on stock assessment models andinvolves regular reviews of the TAC/TACCs. Changes to the TAC/TACCs or any other managementmeasures are implemented to ensure the stocks are managed to the default target and limit referencepoints as specified in the Harvest Strategy Standard.
Stock assessment models have currently been accepted by MPI’s Fisheries Assessment WorkingGroup for the three New Zealand hake stocks. Stock specific details can be found in the fishery-specific sections later in this document or in the annual Fisheries Assessment Plenary (MPI 2013a).
The temporal and spatial overlap of hake fishing with the hoki fishery means that managementmeasures implemented in the hoki fishery often affect hake catch and fishing behaviour as well. The
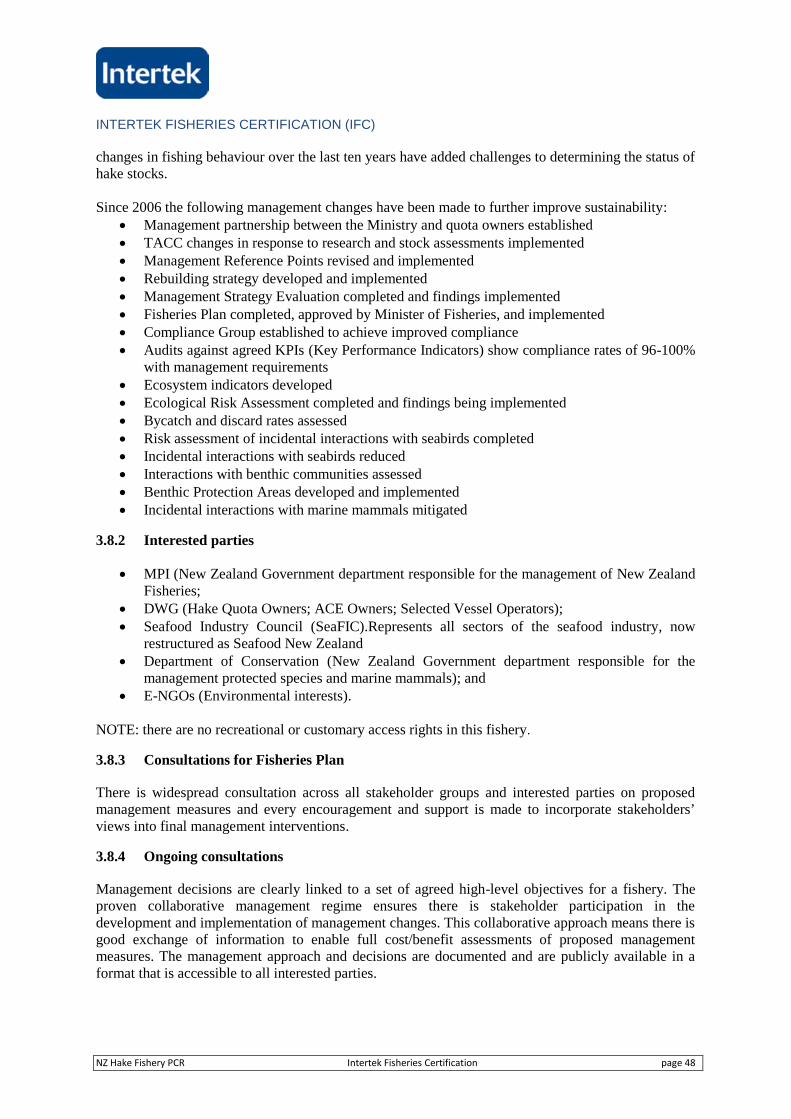
INTERTEK FISHERIES CERTIFICATION (IFC)
NZ Hake Fishery PCR Intertek Fisheries Certification page 48
changes in fishing behaviour over the last ten years have added challenges to determining the status ofhake stocks.
Since 2006 the following management changes have been made to further improve sustainability: Management partnership between the Ministry and quota owners established TACC changes in response to research and stock assessments implemented Management Reference Points revised and implemented Rebuilding strategy developed and implemented Management Strategy Evaluation completed and findings implemented Fisheries Plan completed, approved by Minister of Fisheries, and implemented Compliance Group established to achieve improved compliance Audits against agreed KPIs (Key Performance Indicators) show compliance rates of 96-100%
with management requirements Ecosystem indicators developed Ecological Risk Assessment completed and findings being implemented Bycatch and discard rates assessed Risk assessment of incidental interactions with seabirds completed Incidental interactions with seabirds reduced Interactions with benthic communities assessed Benthic Protection Areas developed and implemented Incidental interactions with marine mammals mitigated
3.8.2 Interested parties
MPI (New Zealand Government department responsible for the management of New ZealandFisheries;
DWG (Hake Quota Owners; ACE Owners; Selected Vessel Operators); Seafood Industry Council (SeaFIC).Represents all sectors of the seafood industry, now
restructured as Seafood New Zealand Department of Conservation (New Zealand Government department responsible for the
management protected species and marine mammals); and E-NGOs (Environmental interests).
NOTE: there are no recreational or customary access rights in this fishery.
3.8.3 Consultations for Fisheries Plan
There is widespread consultation across all stakeholder groups and interested parties on proposedmanagement measures and every encouragement and support is made to incorporate stakeholders’views into final management interventions.
3.8.4 Ongoing consultations
Management decisions are clearly linked to a set of agreed high-level objectives for a fishery. Theproven collaborative management regime ensures there is stakeholder participation in thedevelopment and implementation of management changes. This collaborative approach means there isgood exchange of information to enable full cost/benefit assessments of proposed managementmeasures. The management approach and decisions are documented and are publicly available in aformat that is accessible to all interested parties.
INTERTEK FISHERIES CERTIFICATION (IFC)
NZ Hake Fishery PCR Intertek Fisheries Certification page 49
3.8.5 Non fishery users
Section 12 of the 1996 Fisheries Act includes a range of specific consultation requirements, and theadditional requirement to provide for input and participation of tangata whenua4 in particularcircumstances. There are three aspects to this section:
a) Under Section 12(a) of the 1996 Act, the Minister of Fisheries is required to consult withthose classes of persons having an interest (including, but not limited to, Maori,environmental, commercial and recreational interests) in the stock or the effects of fishing onthe aquatic environment in the area concerned;
b) Section 12(1)(b) outlines the Crown’s commitments to provide for the input and participationof tangata whenua. Involving tangata whenua in fisheries management decisions reflects theprovisions in the Treaty of Waitangi (Fisheries Claims) Settlement Act 1992, and theCrown’s commitment to its partner.
c) Section 12(1)(b)(ii) requires that the Minister have particular regard for the exercise ofkaitiakitanga in relation to the people of the area.
Section 12 only relates to certain sections of the 1996 Act. There are many other sections of the 1996Act that require the Minister or MPI Chief Executive to consult with stakeholders before making adecision. There are also other MPI activities where consultation is encouraged, e.g., setting of policiesand guidelines.
Although the consultation requirements set out in Section 12 specifically relate to sustainabilitydecisions, the general principles outlined can be applied to all consultation activities.
engagement with scientific service providers (including: National Institute of Water andAtmospheric Research Limited (NIWA), GNS Science, Dragonfly, 42oS, InnovativeSolutions Ltd, Cawthron Institute,);
MPI and DWG Partnership Agreement (See DWG (2010) Memorandum of Understandingbetween the MPI and the Deepwater Group: Continuing a partnership between the MPI andthe deepwater fishing industry for the management of New Zealand’s deepwater fisheries);
eNGOs – as required and for specified matters (e.g. ERA), and the Science Working Groups(Middle depth, Deepwater and Aquatic Environment Working Groups).
3.8.6 Decision–making processes
Consultation is required wherever it is prescribed under Section 12 or another section of the 1996Fisheries Act. Consultation may also be required in cases where it is not legislatively mandated, suchas on policy statements or standards.
Other considerations that will influence whether to consult include:a) whether consultation is required on any decision that is likely to materially affect the ability
or interest of a person in fisheries resources;b) the degree to which the outcome of a decision may affect the interests of a particular group of
stakeholders, e.g., a significant change in livelihood or business practices. Note that thisimpact may not necessarily depend on the number of people affected. However, the mannerof consultation will vary depending on whether only one person is potentially affected, or twoor more;
c) the appropriateness of limiting consultation (e.g., considerations of legal risk, stakeholderrelationships and impacts on the quality of informed decision-making);
d) the nature of the proposed measure, whether the amendment is substantive or technical;e) the benefits of consulting the widest number of stakeholders for the longest period possible,
including considerations of stakeholder buy-in and improvements to Ministry processes and
4Māori term of the indigenous peoples of New Zealand and literally means "people of the land", from tangata,'people' and whenua land
INTERTEK FISHERIES CERTIFICATION (IFC)
NZ Hake Fishery PCR Intertek Fisheries Certification page 50
quality of decision-making. In general MPI will consult widely and for long periods ondecisions that affect stakeholders.
f) the management framework, (e.g., development of the Statement of Intent, the developmentof Environmental Performance Standards, and the development of Fisheries ManagementPlans).
Administrative law also provides some guidance to the decision-maker. A decision to consult or notto consult, and any decision made after consultation, must be made in accordance with the principlesof administrative law, and in accordance with Fisheries Act obligations. These principles requiredecision-makers to act:
in accordance with law; reasonably; and fairly, in accordance with the principles of natural justice.
Decisions not made in accordance with these requirements may be challenged.
The requirement to act fairly is most relevant to consultation. Decision-makers must follow properprocesses to ensure that those individuals or groups affected by their decisions are given naturaljustice. A decision can be challenged if a decision-maker is biased in such a way that prevents him orher from fairly considering the issue with an open mind. Examples include where a decision-makerhas a financial interest in the issue or has already made up his or her mind before considering relevantinformation (i.e., predetermination). Any statements or conduct which may suggest a closed mind orpredetermination – in the sense that decision-makers are not open to persuasion or argument - shouldbe avoided.
3.8.7 Objectives for the fishery
The Fisheries Plan (MPI, 2010d) outlines the objectives for the all deepwater and middle-depthfisheries.
The hake-fishery specific chapter of the National Deepwater Plan has specific objectives tailored tothe hake fisheries that are achievable, and which directly guide actions in the hake fisheries. These arethen specified within the Annual Operational Plan (AOP) by year. These fishery specific objectivesare subject to the Annual Review report and are measureable.
Utilisation-focused Operational Objectives
OO1.1 Support the hake fisheries in achieving and maintaining credible third party certification andensure any Conditions of Certification are met within the required timeframeOO1.2 Enable quota owners to develop and implement a harvest regime that will maximise the valueobtained from hake fisheries within sustainability limitsOO1.3 Ensure satisfactory levels of compliance are achieved in hake fisheriesOO1.4 Ensure all research planned under the 10 Year Research Programme which is used to informthe management of hake fisheries continues to be peer reviewed, meets the requirements of theResearch Standard, and is delivered in time to inform management decisions before the start of eachOctober fishing year
Environment-focused Operational Objectives
OO2.1 Develop an agreed harvest strategy for hake fisheries including a stock rebuild strategy that isconsistent with the Harvest Strategy StandardOO2.2 Implement appropriate spatial management measures to address any adverse effects of fishingfor hake on the benthic habitatOO2.3 Ensure that incidental seabird mortalities in hake fisheries are mitigated and minimised
INTERTEK FISHERIES CERTIFICATION (IFC)
NZ Hake Fishery PCR Intertek Fisheries Certification page 51
OO2.4 Ensure that incidental marine mammal mortalities in hake fisheries are mitigated andminimisedOO2.5 Monitor incidental bycatch of Tier 3 species in hake fisheries
3.8.8 Fleet characteristics
The hake fishery was initiated in the 1970s by Japanese trawl vessels which were soon joined byRussian and Korean vessels. The fishery was initially mostly bycatch in the hoki fishery, but when thehoki quota was cut in the early 2000s, hake targeting increased. Currently, about 75% of the totalcatch is from the hake target fishery. Hake is caught almost entirely using bottom and midwater trawlgear, with a small amount caught in bottom longline fisheries for ling.
The commercial fisheries for hake have changed measurably in the past ten years, including changesin fleet structure (some major hake fishing vessels left the fishery in the mid-2000s), average towspeed and duration, and the locations fished. Target fisheries for hake use slightly different fishinggear than that used to fish for hoki meaning that vessels that target hoki do not have the sameefficiency in catching hake even when it is targeted. Hoki fisheries have also become more targetedwith the development of techniques to avoid bycatch of hake. This has resulted in lower catches ofhake in hoki fisheries, even as hoki catches increase. See Table 1.
3.8.9 Rights of access to fishery
Since 1986, the major commercial fisheries in New Zealand fisheries waters have been managedthrough a QMS based on ITQs. A fishing permit is required to fish for QMS and non-QMS species,all fishing vessels must be registered, and all fishing permit holders are required to furnish accuratemonthly returns on locations fished, fishing gear used, catches of main species, information onprocessing and landing of catches and to reconcile these against ACE.
The Fisheries Act 1996 (the Act) requires that, prior to setting management measures for hake, theMinister of Fisheries shall consult with persons having an interest in the stock or the effects of fishingon the aquatic environment in the area in which the fishery takes place, including Maori,environmental, commercial and recreational interests. In addition, the Act requires that in setting aTAC under section 13, the Minister shall have regard to such social, cultural and economic factors(s)he considers relevant.
Social and cultural factors include those related to the harvesting of hake by all parties; commercial,recreational and customary. However, there is little recreational or customary fishing for hake. Thereare no recreational or customary allowances for any hake fishstock.
Social and cultural factors also include the non-extractive value of healthy hake and key bycatchstocks and the values associated with an aquatic environment that is not adversely impacted on byhake fishing activity. These intrinsic values must also be considered when determining theappropriate management measures for a fishery.
INTERTEK FISHERIES CERTIFICATION (IFC)
NZ Hake Fishery PCR Intertek Fisheries Certification page 52
3.8.10 Measures for regulation of the fishery
MPI and the DWG to work in partnership outlining the priority areas and workplan to better managedeepwater fisheries. The two parties have developed a single joint-management framework withagreed strategic and operational priorities and workplans and timeframes.
The partnership was formed to: advise the Minister of Fisheries on clear and agreed objectives for the deepwater fisheries; advise the Minister of Fisheries on management measures to support these objectives; define service requirements to support these objectives; ensure efficient delivery and value from these services; and provide consistent and agreed advice to the Minister wherever possible.
The partnership is focused on determining the maximum economic yield of the deepwater fisheries bysetting catch limits that maximise returns over the long term within the constraints of ecologicalsustainability. This collaborative approach to fisheries management has an industry-wide impact onthe behaviour of seafood companies by way of creating a "self management" responsibility amongstindustry participants.
This co-operation between seafood companies replaces historical competitive behaviours, improvesindustry wide management initiatives and subsequent compliance with standards and outcomes set,monitored and audited by government.
3.8.11 Monitoring control and surveillance
Vessel registrationSection 103 of the Fisheries Act 1996 requires vessels to be registered in the Fishing Vessel Registerin order to take fish, aquatic life, or seaweed for sale, in New Zealand fisheries waters.
Permitting of commercial fishersAny person who wishes to take fish for the purpose of sale can only do so under the authority of acommercial fishing permit issued under Section 91 of the Fisheries Act 1996 (the Act). Commercialfishers are required to:
fish from a registered fishing vessel; keep records of all catch, effort and landings; report regularly to the Ministry their effort and landings; not discard quota species (with limited, documented exceptions); land catch to approved licensed fish receivers (LFRs) (with limited, documented exceptions);
and furnish Monthly Harvest Returns (MHRs) to MPI detailing all the catches made for that
month by the permit holder, as they may fish from more than one vessel.
Foreign Charter Vessels (FCVs)Foreign Charter Vessels (FCVs) are vessels owned or operated by an overseas entity under contract orcharter to a New Zealand company. While FCVs remain flagged to a foreign State during thetime of the charter, their registration status makes them subject to New Zealand's law and fisheriesmanagement regime, including an obligation to meet all the requirements listed above, while fishingin New Zealand waters. All products and fishing activities on board such vessels are the responsibilityof the New Zealand permit holder, who may be prosecuted for any non-compliance.
General approachIn recent years the industry has supported a shift away from prescriptive regulatory fisheriesmanagement to a strong focus on more collaborative fisheries management, including industry
INTERTEK FISHERIES CERTIFICATION (IFC)
NZ Hake Fishery PCR Intertek Fisheries Certification page 53
implementation of operational plans which are monitored and audited by government. Thiscollaboration includes all stakeholders and shareholders in the DWG along with government and non-government organisations and interested parties.
3.8.12 Details of any planned education and training for interest groups.
With respect to avoiding or mitigating interactions with ETP species, DWG has implemented a rangeof non-regulatory measures and supplementary measures. As part of this DWG has an EnvironmentalLiaison Officer whose role is to:
ensure each vessel’s management plan is implemented and up to date; assist with development and implementation if required; lecture vessel operators, skippers (on all trawlers >28m and from 2011 all trawlers <28m in
the Cook Strait) on best practice; and provide a best practice manual.
3.8.13 Review and audit of Management Plan
The hake-fishery specific chapter of the National Deepwater Plan has specific objectives tailored tothe hake fisheries that are achievable, and which directly guide actions in the hake fisheries. These arethen specified within the Annual Operational Plan (AOP) by year. Progress against the objectives inthe plan is reviewed annually and reported in the Annual Review Report. The objectives also guideannual planning in the Annual Operational Plan, however, the fish plan itself is only reviewed every 5years and is not amended during the annual processes.
3.8.14 Research Plan
The 10 Year Research Programme for deepwater fisheries sets out the research and monitoringapproach for hake over the next 10 years. The research and monitoring approach differs by fisherybased on the available information. All three hake fisheries have accepted stock assessments. The 10Year Research Program includes projects to assess all HAK stocks regularly and continue to collectthe required information to be able to complete stock assessments for all stocks.
INTERTEK FISHERIES CERTIFICATION (IFC)
NZ Hake Fishery PCR Intertek Fisheries Certification page 54
4. Evaluation Procedure
4.1 Harmonised Fishery Assessment
Other hake fisheries have been either certified or are under assessment. These include: the SouthAfrican hake trawl, the Pacific hake mid-water trawl and the Grupo regal Spain hake longline whichare certified and the Cornish hake gill net and Denmark northsea hake fisheries which are under MSCassessment. This fishery is not considered to overlap with any of these fisheries.
The New Zealand hake fishery does overlap with the MSC certified hoki fishery and the NZ lingfishery, currently under assessment. The hake and the ling fishery assessments are occurring at thesame time.
The hake fishery assessment has been harmonised with hoki and ling in the following ways:- The same default assessment tree has been used for hoki, hake and ling.- Consistency of outcomes has been ensured so as not to undermine the integrity of the MSC
fishery assessments. In scoring the fishery the assessment team looked to provide consistencyof scoring outcome for PIs, reviewed the scoring rationales for the hoki fishery and, whereappropriate, i.e. under P2 and P3 in particular, took them into account.
- As the NZ hake and ling fishery are occurring at the same time important steps in theassessment have been harmonised, e.g. site visits, stakeholder inputs, client meetings,assessment planning, coordinated process steps and timing of reports.
- Fisheries information has been shared between fisheries.- Conclusions, where appropriate, are consistent between the three fisheries with respect to
evaluation, scoring and conditions. This is especially relevant for Principle 3 for all speciesand Principle 2 for hoki, hake and ling trawl UoCs.
4.2 Previous assessments
This fishery has not been previously MSC certified.
4.3 Assessment Methodologies
This assessment of the New Zealand hake fishery has been carried out using the MSC CertificationRequirements v 1.3 14 January 2013.
The full assessment reporting template has been used without any adjustments.
The default assessment tree has been used without any adjustments.
4.4 Evaluation Processes and Techniques
4.4.1 Site Visits
A number of stakeholders who previously expressed an interest in the New Zealand deepwater andmiddle depth species certification were contacted prior to the commencement of this latestreassessment. Other potential new stakeholders were also contacted. The full list of those individualsand organisations contacted is contained below in Table 12 for 2009 and Table 13 for 2013.
Inspection of the fishery focused on the practicalities of fishing operations, the mechanisms andeffectiveness of management agencies and the scientific assessment of the fisheries.
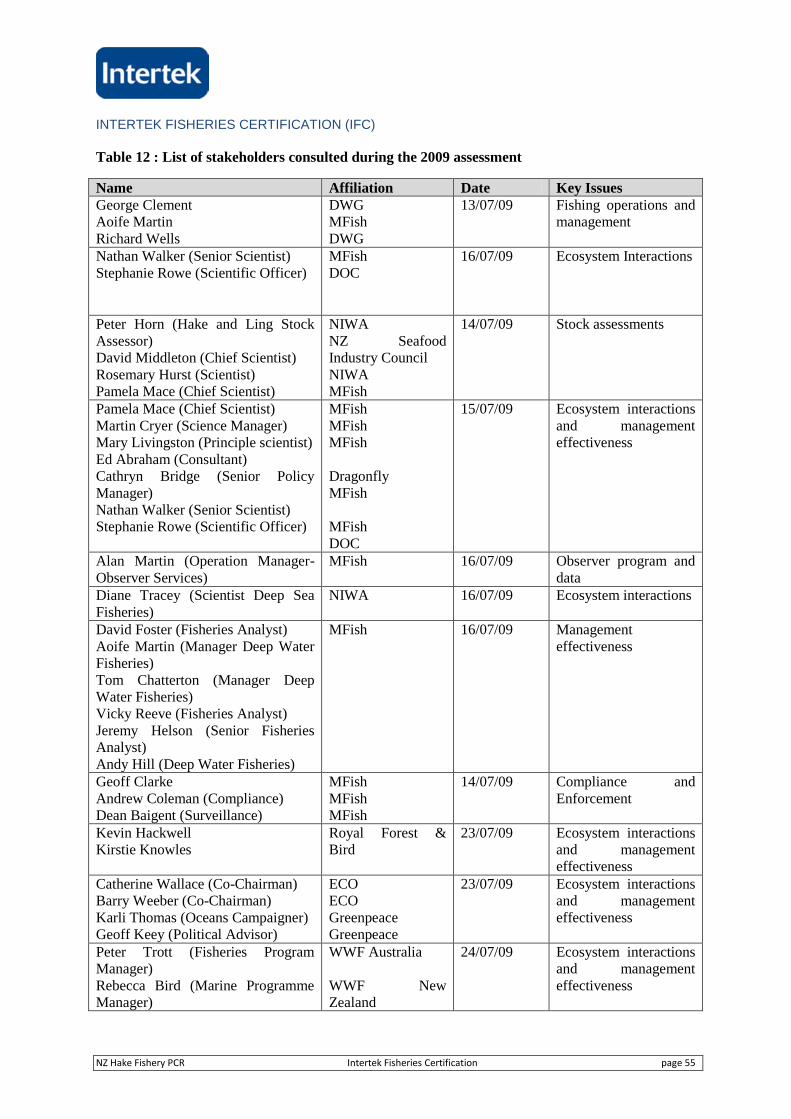
INTERTEK FISHERIES CERTIFICATION (IFC)
NZ Hake Fishery PCR Intertek Fisheries Certification page 55
Table 12 : List of stakeholders consulted during the 2009 assessment
Name Affiliation Date Key IssuesGeorge ClementAoife MartinRichard Wells
DWGMFishDWG
13/07/09 Fishing operations andmanagement
Nathan Walker (Senior Scientist)Stephanie Rowe (Scientific Officer)
MFishDOC
16/07/09 Ecosystem Interactions
Peter Horn (Hake and Ling StockAssessor)David Middleton (Chief Scientist)Rosemary Hurst (Scientist)Pamela Mace (Chief Scientist)
NIWANZ SeafoodIndustry CouncilNIWAMFish
14/07/09 Stock assessments
Pamela Mace (Chief Scientist)Martin Cryer (Science Manager)Mary Livingston (Principle scientist)Ed Abraham (Consultant)Cathryn Bridge (Senior PolicyManager)Nathan Walker (Senior Scientist)Stephanie Rowe (Scientific Officer)
MFishMFishMFish
DragonflyMFish
MFishDOC
15/07/09 Ecosystem interactionsand managementeffectiveness
Alan Martin (Operation Manager-Observer Services)
MFish 16/07/09 Observer program anddata
Diane Tracey (Scientist Deep SeaFisheries)
NIWA 16/07/09 Ecosystem interactions
David Foster (Fisheries Analyst)Aoife Martin (Manager Deep WaterFisheries)Tom Chatterton (Manager DeepWater Fisheries)Vicky Reeve (Fisheries Analyst)Jeremy Helson (Senior FisheriesAnalyst)Andy Hill (Deep Water Fisheries)
MFish 16/07/09 Managementeffectiveness
Geoff ClarkeAndrew Coleman (Compliance)Dean Baigent (Surveillance)
MFishMFishMFish
14/07/09 Compliance andEnforcement
Kevin HackwellKirstie Knowles
Royal Forest &Bird
23/07/09 Ecosystem interactionsand managementeffectiveness
Catherine Wallace (Co-Chairman)Barry Weeber (Co-Chairman)Karli Thomas (Oceans Campaigner)Geoff Keey (Political Advisor)
ECOECOGreenpeaceGreenpeace
23/07/09 Ecosystem interactionsand managementeffectiveness
Peter Trott (Fisheries ProgramManager)Rebecca Bird (Marine ProgrammeManager)
WWF Australia
WWF NewZealand
24/07/09 Ecosystem interactionsand managementeffectiveness
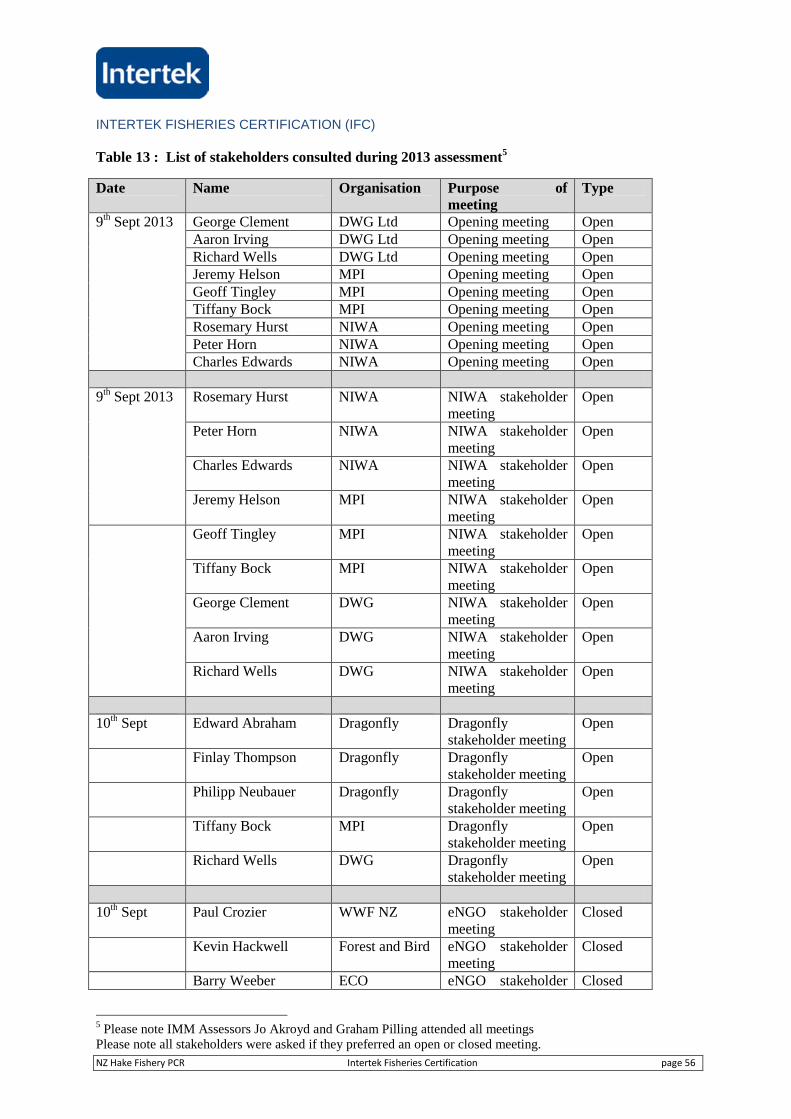
INTERTEK FISHERIES CERTIFICATION (IFC)
NZ Hake Fishery PCR Intertek Fisheries Certification page 56
Table 13 : List of stakeholders consulted during 2013 assessment5
Date Name Organisation Purpose ofmeeting
Type
9th Sept 2013 George Clement DWG Ltd Opening meeting OpenAaron Irving DWG Ltd Opening meeting OpenRichard Wells DWG Ltd Opening meeting OpenJeremy Helson MPI Opening meeting OpenGeoff Tingley MPI Opening meeting OpenTiffany Bock MPI Opening meeting OpenRosemary Hurst NIWA Opening meeting OpenPeter Horn NIWA Opening meeting OpenCharles Edwards NIWA Opening meeting Open
9th Sept 2013 Rosemary Hurst NIWA NIWA stakeholdermeeting
Open
Peter Horn NIWA NIWA stakeholdermeeting
Open
Charles Edwards NIWA NIWA stakeholdermeeting
Open
Jeremy Helson MPI NIWA stakeholdermeeting
Open
Geoff Tingley MPI NIWA stakeholdermeeting
Open
Tiffany Bock MPI NIWA stakeholdermeeting
Open
George Clement DWG NIWA stakeholdermeeting
Open
Aaron Irving DWG NIWA stakeholdermeeting
Open
Richard Wells DWG NIWA stakeholdermeeting
Open
10th Sept Edward Abraham Dragonfly Dragonflystakeholder meeting
Open
Finlay Thompson Dragonfly Dragonflystakeholder meeting
Open
Philipp Neubauer Dragonfly Dragonflystakeholder meeting
Open
Tiffany Bock MPI Dragonflystakeholder meeting
Open
Richard Wells DWG Dragonflystakeholder meeting
Open
10th Sept Paul Crozier WWF NZ eNGO stakeholdermeeting
Closed
Kevin Hackwell Forest and Bird eNGO stakeholdermeeting
Closed
Barry Weeber ECO eNGO stakeholder Closed
5 Please note IMM Assessors Jo Akroyd and Graham Pilling attended all meetingsPlease note all stakeholders were asked if they preferred an open or closed meeting.
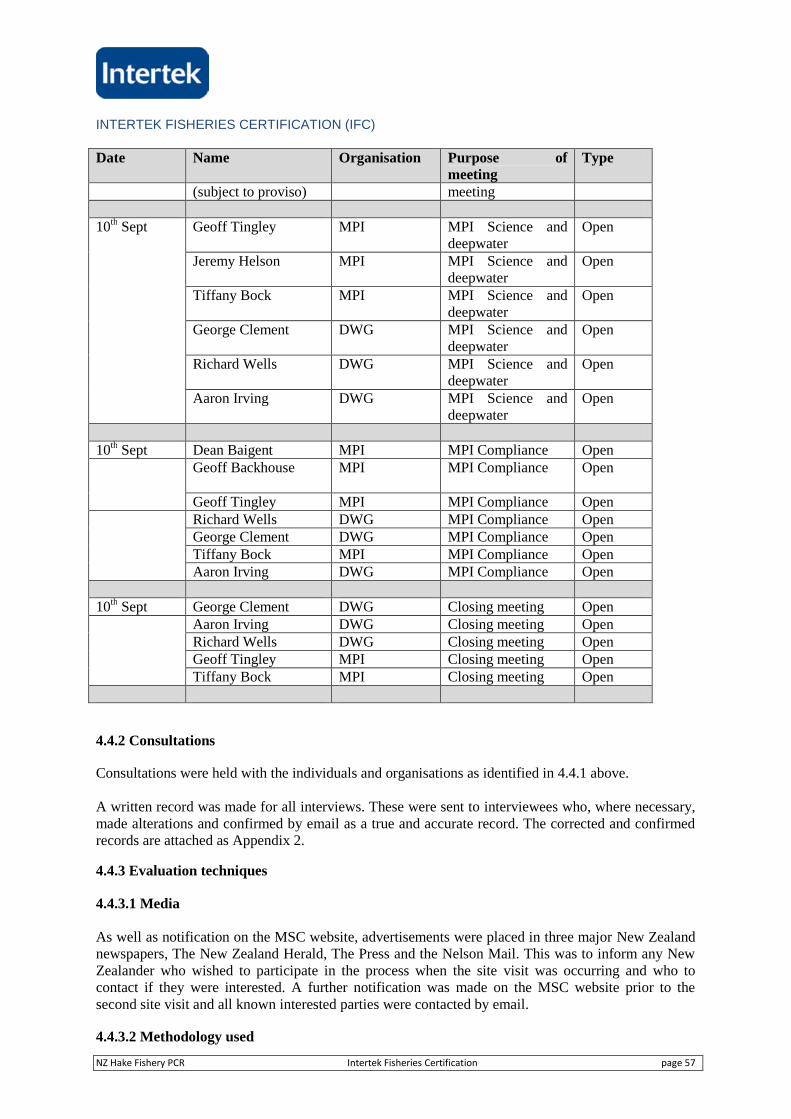
INTERTEK FISHERIES CERTIFICATION (IFC)
NZ Hake Fishery PCR Intertek Fisheries Certification page 57
Date Name Organisation Purpose ofmeeting
Type
(subject to proviso) meeting
10th Sept Geoff Tingley MPI MPI Science anddeepwater
Open
Jeremy Helson MPI MPI Science anddeepwater
Open
Tiffany Bock MPI MPI Science anddeepwater
Open
George Clement DWG MPI Science anddeepwater
Open
Richard Wells DWG MPI Science anddeepwater
Open
Aaron Irving DWG MPI Science anddeepwater
Open
10th Sept Dean Baigent MPI MPI Compliance OpenGeoff Backhouse MPI MPI Compliance Open
Geoff Tingley MPI MPI Compliance OpenRichard Wells DWG MPI Compliance OpenGeorge Clement DWG MPI Compliance OpenTiffany Bock MPI MPI Compliance OpenAaron Irving DWG MPI Compliance Open
10th Sept George Clement DWG Closing meeting OpenAaron Irving DWG Closing meeting OpenRichard Wells DWG Closing meeting OpenGeoff Tingley MPI Closing meeting OpenTiffany Bock MPI Closing meeting Open
4.4.2 Consultations
Consultations were held with the individuals and organisations as identified in 4.4.1 above.
A written record was made for all interviews. These were sent to interviewees who, where necessary,made alterations and confirmed by email as a true and accurate record. The corrected and confirmedrecords are attached as Appendix 2.
4.4.3 Evaluation techniques
4.4.3.1 Media
As well as notification on the MSC website, advertisements were placed in three major New Zealandnewspapers, The New Zealand Herald, The Press and the Nelson Mail. This was to inform any NewZealander who wished to participate in the process when the site visit was occurring and who tocontact if they were interested. A further notification was made on the MSC website prior to thesecond site visit and all known interested parties were contacted by email.
4.4.3.2 Methodology used
INTERTEK FISHERIES CERTIFICATION (IFC)
NZ Hake Fishery PCR Intertek Fisheries Certification page 58
All recognised stakeholders including government agencies, industry, eNGOs and research providerswere contacted prior to the re-assessment and encouraged to participate in the re-assessment processto ensure that the CAB would be exposed to a working knowledge of the management and fishingoperations.
Inspection of the fishery focused on the practicalities of fishing operations, the mechanisms andeffectiveness of management agencies and the scientific assessment of the fisheries.
4.4.3.3 Scoring process
After the team compiled and analysed all relevant information (including technical, written andanecdotal sources), the fishery was scored against the Performance Indicators and Scoring Guideposts(PISGs) in the default assessment tree. The team:
discussed evidence together; weighed up the balance of evidence; and used its judgement to agree a final score following the processes below.
In summary the team used a group consensus approach.
4.4.3.4 Decision rule
The team scored individual performance indicators by applying the following:
If any one or more of the SG60 scoring issues was not met, the fishery would fail and there would beno further scoring. If all of the SG60 scoring issues were met, the PI would achieve at least a 60 score.
The team assessed each of the scoring issues at the SG80 level. If all of the SG80 scoring issues weremet, the PI scored 80. If any of the scoring issues under the SG80 were not met an intermediate score(65, 70 or 75) was allocated, reflecting the overall performance against the different SG80 scoringissues.
In order to achieve an 80 score, all of the 60 scoring issues and all of the 80 issues had to be met andeach scoring issue justified by supporting rationale.
If all of the SG80 scoring issues were met, the PI achieved at least an 80 score and the team assessedeach of the scoring issues at the SG100 level. If not all of the SG100 scoring issues were met the PIwas given an intermediate score (85, 90 or 95) reflecting overall performance against the differentSG100 scoring issues.
In order to achieve a 100 score, all of the 60 issues, all of the 80 issues, and all of the 100 issuesneeded to be met and each scoring issue justified by supporting rationale.
In Principle 2, the team scored PIs comprised of differing scoring elements (species or habitats) thatcomprised part of a component affected by the fishery. If any single scoring element failedsubstantially to meet SG80, the overall score for that element became less than 80 and a conditionraised. The score given reflected the number of elements that failed, and the level of their failure,rather than being derived directly as a numerical average of the individual scores for all elements.Scores were determined for each scoring element by applying the process as above.
Table C2 MSC certification requirements v 1.1 October 2011, was used to determine the overall scorefor the PI from the scores of the different scoring elements.
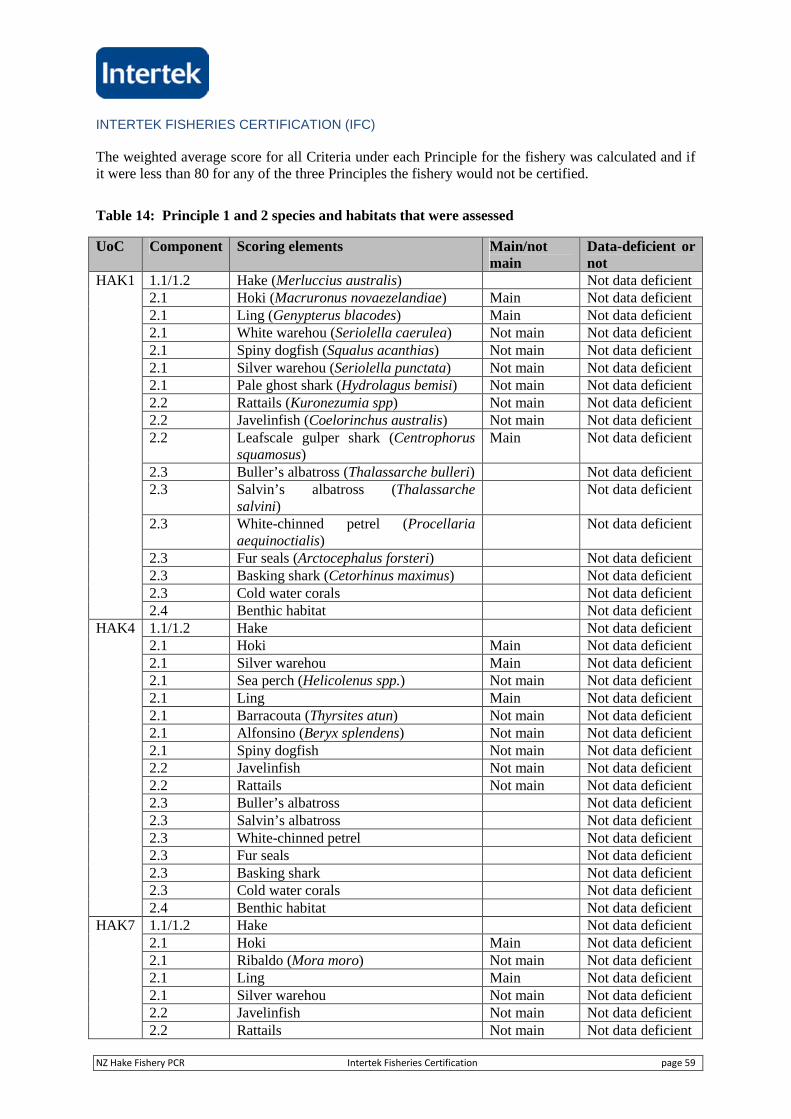
INTERTEK FISHERIES CERTIFICATION (IFC)
NZ Hake Fishery PCR Intertek Fisheries Certification page 59
The weighted average score for all Criteria under each Principle for the fishery was calculated and ifit were less than 80 for any of the three Principles the fishery would not be certified.
Table 14: Principle 1 and 2 species and habitats that were assessed
UoC Component Scoring elements Main/notmain
Data-deficient ornot
HAK1 1.1/1.2 Hake (Merluccius australis) Not data deficient2.1 Hoki (Macruronus novaezelandiae) Main Not data deficient2.1 Ling (Genypterus blacodes) Main Not data deficient2.1 White warehou (Seriolella caerulea) Not main Not data deficient2.1 Spiny dogfish (Squalus acanthias) Not main Not data deficient2.1 Silver warehou (Seriolella punctata) Not main Not data deficient2.1 Pale ghost shark (Hydrolagus bemisi) Not main Not data deficient2.2 Rattails (Kuronezumia spp) Not main Not data deficient2.2 Javelinfish (Coelorinchus australis) Not main Not data deficient2.2 Leafscale gulper shark (Centrophorus
squamosus)Main Not data deficient
2.3 Buller’s albatross (Thalassarche bulleri) Not data deficient2.3 Salvin’s albatross (Thalassarche
salvini)Not data deficient
2.3 White-chinned petrel (Procellariaaequinoctialis)
Not data deficient
2.3 Fur seals (Arctocephalus forsteri) Not data deficient2.3 Basking shark (Cetorhinus maximus) Not data deficient2.3 Cold water corals Not data deficient2.4 Benthic habitat Not data deficient
HAK4 1.1/1.2 Hake Not data deficient2.1 Hoki Main Not data deficient2.1 Silver warehou Main Not data deficient2.1 Sea perch (Helicolenus spp.) Not main Not data deficient2.1 Ling Main Not data deficient2.1 Barracouta (Thyrsites atun) Not main Not data deficient2.1 Alfonsino (Beryx splendens) Not main Not data deficient2.1 Spiny dogfish Not main Not data deficient2.2 Javelinfish Not main Not data deficient2.2 Rattails Not main Not data deficient2.3 Buller’s albatross Not data deficient2.3 Salvin’s albatross Not data deficient2.3 White-chinned petrel Not data deficient2.3 Fur seals Not data deficient2.3 Basking shark Not data deficient2.3 Cold water corals Not data deficient2.4 Benthic habitat Not data deficient
HAK7 1.1/1.2 Hake Not data deficient2.1 Hoki Main Not data deficient2.1 Ribaldo (Mora moro) Not main Not data deficient2.1 Ling Main Not data deficient2.1 Silver warehou Not main Not data deficient2.2 Javelinfish Not main Not data deficient2.2 Rattails Not main Not data deficient
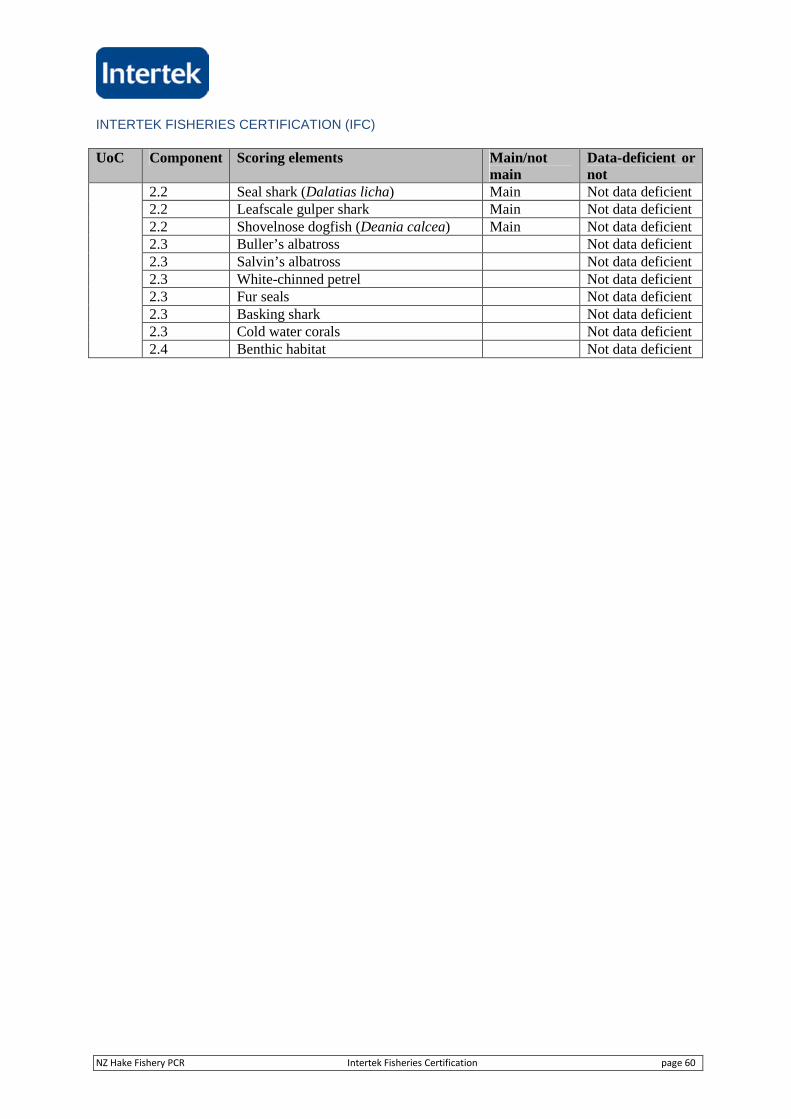
INTERTEK FISHERIES CERTIFICATION (IFC)
NZ Hake Fishery PCR Intertek Fisheries Certification page 60
UoC Component Scoring elements Main/notmain
Data-deficient ornot
2.2 Seal shark (Dalatias licha) Main Not data deficient2.2 Leafscale gulper shark Main Not data deficient2.2 Shovelnose dogfish (Deania calcea) Main Not data deficient2.3 Buller’s albatross Not data deficient2.3 Salvin’s albatross Not data deficient2.3 White-chinned petrel Not data deficient2.3 Fur seals Not data deficient2.3 Basking shark Not data deficient2.3 Cold water corals Not data deficient2.4 Benthic habitat Not data deficient
INTERTEK FISHERIES CERTIFICATION (IFC)
NZ Hake Fishery PCR Intertek Fisheries Certification page 61
5. Traceability
5.1 Eligibility Date
The client has aked that in order for client group members to gain the maximum benefit of thecertification the actual eligibility date is taken as 6 months prior to the publication of the PublicComment Draft Report (PCDR). The PCDR was published on 3rd June 2014, therefore, the actualeligibility date is 3rd December 2013. It should be noted that any client group member wishing to takeadvantage of the actual eligibility date will need to meet and be able to demonstrate the necessarychain of custody requirements were in place.
5.2 Traceability within the Fishery
Existing fisheries management requirements include the clear identification of species, quantity,fishing method and area of capture by all vessels landing fish from the fishery. All catches arereported in logbooks and in catch and effort landing returns. On-board observer coverage alsomonitors, cross checks and verifies catches and landings with the vessels logbook.
Cross referencing of VMS data with logbooks, observer and aerial and at-sea surveillance reports alsoensures that fish is reported from the correct area of capture. All landings are monitored by a docksidemonitoring program. Vessels have to advise MPI before landing and maybe subject to monitoring byenforcement officers.
5.2.1 Tracking and tracing
As with the certified hoki fishery, clear traceability and tracking is already in place and proceduresand audits are regularly carried out. Procedures that are in place include, “when fish product isbrought onto a factory site that is not from a MSC fishery or not from a site with a chain of custodycertification for (a) reprocessing, or (b) future sale, it must be brought on to inventory with theappropriate quality status and a logistic status. The narrative will read “Not MSC certified”. This willprevent its movement without proper control.” (DWG, Quality Manual).
If a vessel were fishing outside the UoC there are systems in place to record that fact. All factorytrawlers in New Zealand are operating under New Zealand Food Safety Authority (NZFSA) and NewZealand Fisheries Act rules and regulations. As such they are required to both land all catch of QMSspecies (such as hake) and ensure that any fish that will not be fit for human consumption, e.g.through damage or accidental contamination, is not able to be inadvertently sold into market. Thisdrives the need for all vessels to be able to mark, ‘ring-fence’ and inventory product or products on areasonably regular basis. This is coupled with the fact that all vessels produce a wide range of speciesand products, all of which are needed to be marked by date and numerous other information and ableto be sorted on arrival in port and inventoried for market and export purposes. Both physical andelectronic inventory management is inherent in the systems that these vessels operate.
5.2.2 Vessels fishing outside the unit of certification
No hake caught outside New Zealand EEZ is processed in New Zealand. New Zealand vessels do notfish for hake outside New Zealand’s EEZ.
5.2.3 At sea processing
At-sea processing occurs on all the major factory ships participating in this fishery. At-sea processingincludes the sorting, heading and gutting, filleting, freezing, reduction to surimi and packaging ofhake.
INTERTEK FISHERIES CERTIFICATION (IFC)
NZ Hake Fishery PCR Intertek Fisheries Certification page 62
There are two levels of process technology in the fleet.1. Fully integrated weighing labelling systems which barcode every carton on production and
before storage in the ship’s hold. This data is downloaded on arrival, reconciled on landingfigures and thus final inventory is arrived at. This system allows the tagging of product lineswhich is non-certified so that it is barcoded as non-certified and trackable and separable everafter simply by scanning. Onshore systems in load-out audit exports.
2. The rest of the fleet practice standard practice where all product (by carton) is labelled as perMPI and NZFSA requirements. The outer markings are used to separate and inventory allproduct on landing. All hake landed in New Zealand is under this MSC assessment.
The risk of substitution is considered to be well-managed and therefore negligible. In any case, allhake caught in New Zealand are under consideration for this MSC assessment. Under MPI regulationsevery container in which fish is packaged on a licenced fish receiver’s premise shall be marked withspecies name, date, licenced fish receivers name, processed state, area fished.
5.2.4 Transhipping
Transhipping is rare in the hake fishery. However if it did occur there is legislation in place to ensurethe potential traceability risks associated with any transhipping are minimal.
Section 110, of the Fisheries Act states:Fish taken in New Zealand fisheries waters must be landed in New Zealand—(1) No person shall land, at any place outside New Zealand, any fish… taken in New Zealandfisheries waters unless… has the prior approval of the chief executive and is in accordance with anyconditions imposed… .
(2) For the purposes of subsection (1) of this section, fish, aquatic life, or seaweed shall be deemed tohave been landed at a place outside New Zealand if—
(a) It is transported beyond the outer limits of the exclusive economic zone by the vessel that tookit; or
(b) It is taken… and transferred to a vessel and then transported… beyond the outer limits of theexclusive economic zone without having been lawfully purchased or acquired by a licensedfish receiver in New Zealand before transportation; or
(c) It is transhipped… to another vessel.
(3) The conditions that may be imposed on any approval granted under subsection (1) of this sectioninclude conditions relating to one or more of the following:
(a) The vessel that will take the fish, aquatic life, or seaweed:(b) Any vessel, which will receive the fish, aquatic life, or seaweed:(c) The manner and conditions under which the storage, transportation, transhipment, recording,
reporting, landing, and disposal of the fish, aquatic life, or seaweed will take place.
If transhipment takes place, the CoC is not compromised due to checks including records andlabelling that are in place.
5.3 Eligibility to enter further chains of custody
To be eligible to carry the MSC logo, product from the certified fishery must enter into separateChain of Custody certifications from first point of landing.
The main points of landing for this fishery are all major New Zealand ports.
The scope of this certification ends at the points of landing. Downstream certification of the product
INTERTEK FISHERIES CERTIFICATION (IFC)
NZ Hake Fishery PCR Intertek Fisheries Certification page 63
would require appropriate certification of storage and handling facilities at these locations.
IFC determined that the systems within the fishery for tracking and tracing are sufficient, fish and fishproducts from the fishery may enter into further certified chains of custody and, as such, be eligible tocarry the MSC ecolabel.
The eligible parties to use the fisheries certificate are shareholders of the Deepwater Group. Currently99.5% of total hake quota is held by DWG shareholders. Anyone who owns hake quota has theopportunity to become a DWG shareholder.
5.4 Eligibility of Inseparable or Practically Inseparable (IPI) stock(s) to Enter Further Chainsof Custody
There are no IPI stocks involved with this fishery.
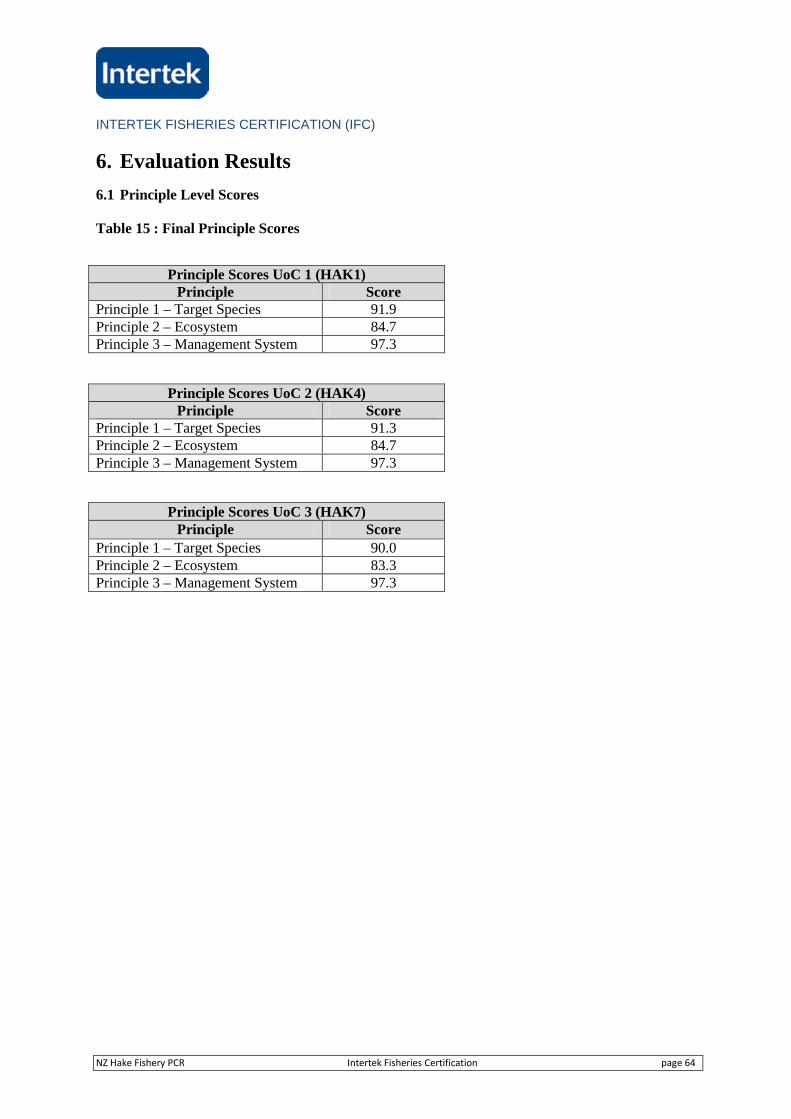
INTERTEK FISHERIES CERTIFICATION (IFC)
NZ Hake Fishery PCR Intertek Fisheries Certification page 64
6. Evaluation Results
6.1 Principle Level Scores
Table 15 : Final Principle Scores
Principle Scores UoC 1 (HAK1)Principle Score
Principle 1 – Target Species 91.9Principle 2 – Ecosystem 84.7Principle 3 – Management System 97.3
Principle Scores UoC 2 (HAK4)Principle Score
Principle 1 – Target Species 91.3Principle 2 – Ecosystem 84.7Principle 3 – Management System 97.3
Principle Scores UoC 3 (HAK7)Principle Score
Principle 1 – Target Species 90.0Principle 2 – Ecosystem 83.3Principle 3 – Management System 97.3
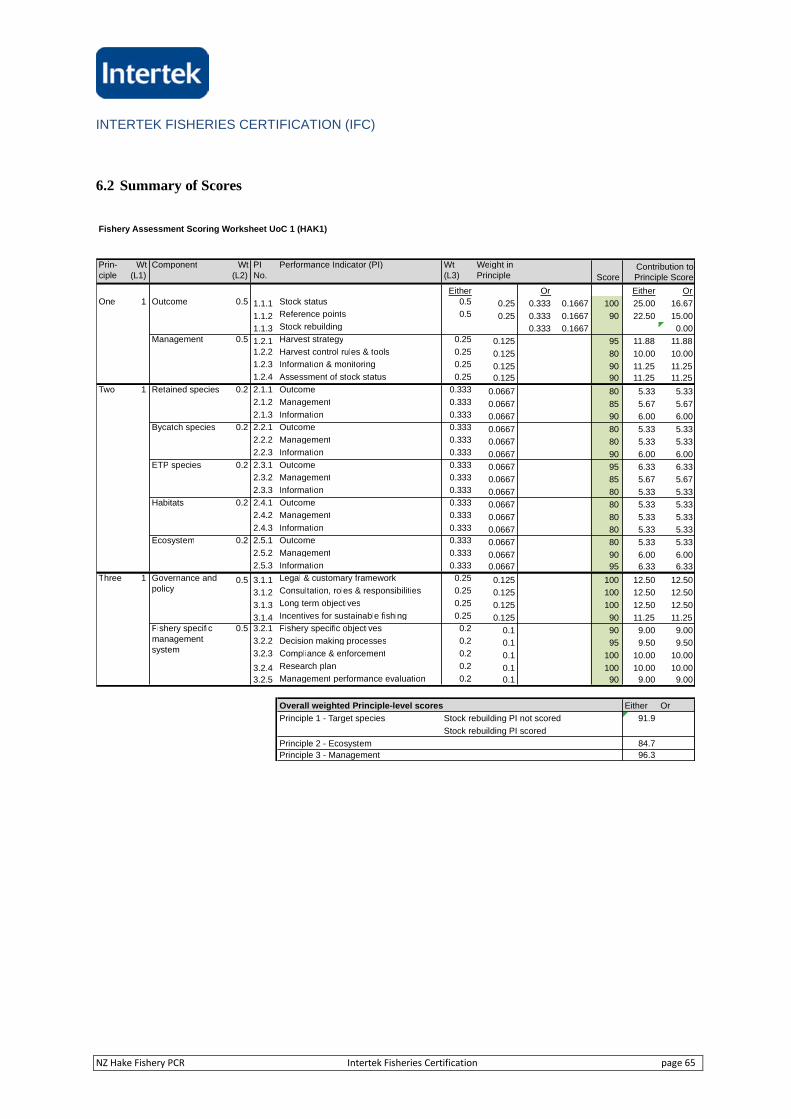
INTERTEK FISHERIES CERTIFICATION (IFC)
NZ Hake Fishery PCR Intertek Fisheries Certification page 65
6.2 Summary of Scores
Fishery Assessment Scoring Worksheet UoC 1 (HAK1)
Prin-ciple
Wt(L1)
Component Wt(L2)
PINo.
Performance Indicator (PI) Wt(L3)
Weight inPrinciple Score
Either Or Either OrOne 1 0.5 1.1.1 Stock status 0.5 0.25 0.333 0.1667 100 25.00 16.67
1.1.2 Reference points 0.5 0.25 0.333 0.1667 90 22.50 15.00
1.1.3 Stock rebuilding 0.333 0.1667 0.000.5 1.2.1 Harvest strategy 0.25 0.125 95 11.88 11.88
1.2.2 Harvest control rules & tools 0.25 0.125 80 10.00 10.001.2.3 Information & monitoring 0.25 0.125 90 11.25 11.251.2.4 Assessment of stock status 0.25 0.125 90 11.25 11.25
Two 1 0.2 2.1.1 Outcome 0.333 0.0667 80 5.33 5.332.1.2 Management 0.333 0.0667 85 5.67 5.672.1.3 Information 0.333 0.0667 90 6.00 6.00
0.2 2.2.1 Outcome 0.333 0.0667 80 5.33 5.332.2.2 Management 0.333 0.0667 80 5.33 5.332.2.3 Information 0.333 0.0667 90 6.00 6.00
0.2 2.3.1 Outcome 0.333 0.0667 95 6.33 6.332.3.2 Management 0.333 0.0667 85 5.67 5.672.3.3 Information 0.333 0.0667 80 5.33 5.33
0.2 2.4.1 Outcome 0.333 0.0667 80 5.33 5.332.4.2 Management 0.333 0.0667 80 5.33 5.332.4.3 Information 0.333 0.0667 80 5.33 5.33
0.2 2.5.1 Outcome 0.333 0.0667 80 5.33 5.332.5.2 Management 0.333 0.0667 90 6.00 6.002.5.3 Information 0.333 0.0667 95 6.33 6.33
Three 1 0.5 3.1.1 Legal & customary framework 0.25 0.125 100 12.50 12.50
3.1.2 Consultation, roles & responsibilities 0.25 0.125 100 12.50 12.50
3.1.3 Long term objectives 0.25 0.125 100 12.50 12.50
3.1.4 Incentives for sustainable fishing 0.25 0.125 90 11.25 11.250.5 3.2.1 Fishery specific objectives 0.2 0.1 90 9.00 9.00
3.2.2 Decision making processes 0.2 0.1 95 9.50 9.503.2.3 Compliance & enforcement 0.2 0.1 100 10.00 10.00
3.2.4 Research plan 0.2 0.1 100 10.00 10.00
3.2.5 Management performance evaluation 0.2 0.1 90 9.00 9.00
Overall weighted Principle-level scores Either Or
Principle 1 - Target species Stock rebuilding PI not scored 91.9
Stock rebuilding PI scored
Principle 2 - Ecosystem 84.7
Principle 3 - Management 96.3
Contribution toPrinciple Score
Retained species
Management
Outcome
Governance andpolicy
Fishery specificmanagementsystem
Ecosystem
Habitats
ETP species
Bycatch species
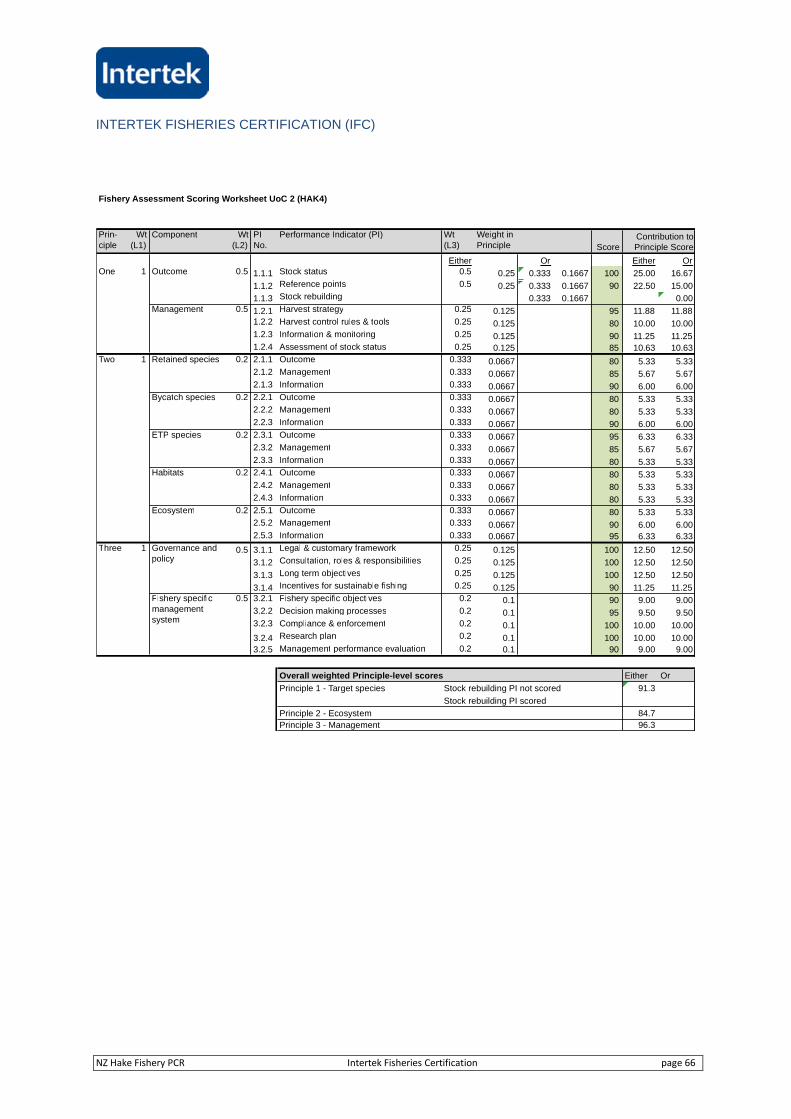
INTERTEK FISHERIES CERTIFICATION (IFC)
NZ Hake Fishery PCR Intertek Fisheries Certification page 66
Fishery Assessment Scoring Worksheet UoC 2 (HAK4)
Prin-ciple
Wt(L1)
Component Wt(L2)
PINo.
Performance Indicator (PI) Wt(L3)
Weight inPrinciple Score
Either Or Either OrOne 1 0.5 1.1.1 Stock status 0.5 0.25 0.333 0.1667 100 25.00 16.67
1.1.2 Reference points 0.5 0.25 0.333 0.1667 90 22.50 15.00
1.1.3 Stock rebuilding 0.333 0.1667 0.000.5 1.2.1 Harvest strategy 0.25 0.125 95 11.88 11.88
1.2.2 Harvest control rules & tools 0.25 0.125 80 10.00 10.001.2.3 Information & monitoring 0.25 0.125 90 11.25 11.251.2.4 Assessment of stock status 0.25 0.125 85 10.63 10.63
Two 1 0.2 2.1.1 Outcome 0.333 0.0667 80 5.33 5.332.1.2 Management 0.333 0.0667 85 5.67 5.672.1.3 Information 0.333 0.0667 90 6.00 6.00
0.2 2.2.1 Outcome 0.333 0.0667 80 5.33 5.332.2.2 Management 0.333 0.0667 80 5.33 5.332.2.3 Information 0.333 0.0667 90 6.00 6.00
0.2 2.3.1 Outcome 0.333 0.0667 95 6.33 6.332.3.2 Management 0.333 0.0667 85 5.67 5.672.3.3 Information 0.333 0.0667 80 5.33 5.33
0.2 2.4.1 Outcome 0.333 0.0667 80 5.33 5.332.4.2 Management 0.333 0.0667 80 5.33 5.332.4.3 Information 0.333 0.0667 80 5.33 5.33
0.2 2.5.1 Outcome 0.333 0.0667 80 5.33 5.332.5.2 Management 0.333 0.0667 90 6.00 6.002.5.3 Information 0.333 0.0667 95 6.33 6.33
Three 1 0.5 3.1.1 Legal & customary framework 0.25 0.125 100 12.50 12.50
3.1.2 Consultation, roles & responsibilities 0.25 0.125 100 12.50 12.50
3.1.3 Long term objectives 0.25 0.125 100 12.50 12.50
3.1.4 Incentives for sustainable fishing 0.25 0.125 90 11.25 11.250.5 3.2.1 Fishery specific objectives 0.2 0.1 90 9.00 9.00
3.2.2 Decision making processes 0.2 0.1 95 9.50 9.503.2.3 Compliance & enforcement 0.2 0.1 100 10.00 10.00
3.2.4 Research plan 0.2 0.1 100 10.00 10.00
3.2.5 Management performance evaluation 0.2 0.1 90 9.00 9.00
Overall weighted Principle-level scores Either Or
Principle 1 - Target species Stock rebuilding PI not scored 91.3
Stock rebuilding PI scored
Principle 2 - Ecosystem 84.7
Principle 3 - Management 96.3
Habitats
Ecosystem
Governance andpolicy
Fishery specificmanagementsystem
Contribution toPrinciple Score
Outcome
Management
Retained species
Bycatch species
ETP species
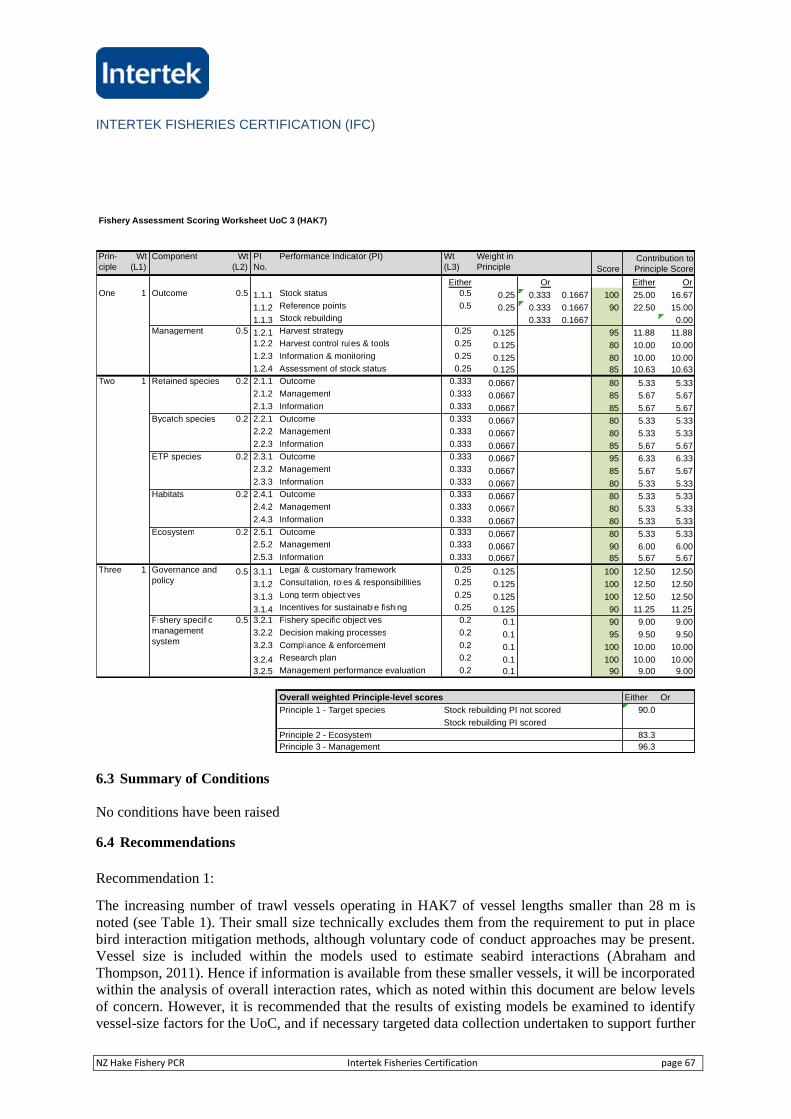
INTERTEK FISHERIES CERTIFICATION (IFC)
NZ Hake Fishery PCR Intertek Fisheries Certification page 67
6.3 Summary of Conditions
No conditions have been raised
6.4 Recommendations
Recommendation 1:
The increasing number of trawl vessels operating in HAK7 of vessel lengths smaller than 28 m isnoted (see Table 1). Their small size technically excludes them from the requirement to put in placebird interaction mitigation methods, although voluntary code of conduct approaches may be present.Vessel size is included within the models used to estimate seabird interactions (Abraham andThompson, 2011). Hence if information is available from these smaller vessels, it will be incorporatedwithin the analysis of overall interaction rates, which as noted within this document are below levelsof concern. However, it is recommended that the results of existing models be examined to identifyvessel-size factors for the UoC, and if necessary targeted data collection undertaken to support further
Fishery Assessment Scoring Worksheet UoC 3 (HAK7)
Prin-ciple
Wt(L1)
Component Wt(L2)
PINo.
Performance Indicator (PI) Wt(L3)
Weight inPrinciple Score
Either Or Either OrOne 1 0.5 1.1.1 Stock status 0.5 0.25 0.333 0.1667 100 25.00 16.67
1.1.2 Reference points 0.5 0.25 0.333 0.1667 90 22.50 15.00
1.1.3 Stock rebuilding 0.333 0.1667 0.000.5 1.2.1 Harvest strategy 0.25 0.125 95 11.88 11.88
1.2.2 Harvest control rules & tools 0.25 0.125 80 10.00 10.001.2.3 Information & monitoring 0.25 0.125 80 10.00 10.001.2.4 Assessment of stock status 0.25 0.125 85 10.63 10.63
Two 1 0.2 2.1.1 Outcome 0.333 0.0667 80 5.33 5.332.1.2 Management 0.333 0.0667 85 5.67 5.672.1.3 Information 0.333 0.0667 85 5.67 5.67
0.2 2.2.1 Outcome 0.333 0.0667 80 5.33 5.332.2.2 Management 0.333 0.0667 80 5.33 5.332.2.3 Information 0.333 0.0667 85 5.67 5.67
0.2 2.3.1 Outcome 0.333 0.0667 95 6.33 6.332.3.2 Management 0.333 0.0667 85 5.67 5.672.3.3 Information 0.333 0.0667 80 5.33 5.33
0.2 2.4.1 Outcome 0.333 0.0667 80 5.33 5.332.4.2 Management 0.333 0.0667 80 5.33 5.332.4.3 Information 0.333 0.0667 80 5.33 5.33
0.2 2.5.1 Outcome 0.333 0.0667 80 5.33 5.332.5.2 Management 0.333 0.0667 90 6.00 6.002.5.3 Information 0.333 0.0667 85 5.67 5.67
Three 1 0.5 3.1.1 Legal & customary framework 0.25 0.125 100 12.50 12.50
3.1.2 Consultation, roles & responsibilities 0.25 0.125 100 12.50 12.50
3.1.3 Long term objectives 0.25 0.125 100 12.50 12.50
3.1.4 Incentives for sustainable fishing 0.25 0.125 90 11.25 11.250.5 3.2.1 Fishery specific objectives 0.2 0.1 90 9.00 9.00
3.2.2 Decision making processes 0.2 0.1 95 9.50 9.503.2.3 Compliance & enforcement 0.2 0.1 100 10.00 10.00
3.2.4 Research plan 0.2 0.1 100 10.00 10.00
3.2.5 Management performance evaluation 0.2 0.1 90 9.00 9.00
Overall weighted Principle-level scores Either Or
Principle 1 - Target species Stock rebuilding PI not scored 90.0
Stock rebuilding PI scored
Principle 2 - Ecosystem 83.3
Principle 3 - Management 96.3
Habitats
Ecosystem
Governance andpolicy
Fishery specificmanagementsystem
Contribution toPrinciple Score
Outcome
Management
Retained species
Bycatch species
ETP species
INTERTEK FISHERIES CERTIFICATION (IFC)
NZ Hake Fishery PCR Intertek Fisheries Certification page 68
analyses of ETP interactions for this vessel size class within the UoC be performed. Where resultsshow a basis for concern, appropriate mitigation approaches should be considered.
INTERTEK FISHERIES CERTIFICATION (IFC)
NZ Hake Fishery PCR Intertek Fisheries Certification page 69
7. References
Abraham, E.R. and Thompson, F.N. (2011). Summary of the capture of seabirds, marine mammals,
and turtles in New Zealand commercial fisheries 1998-1999 to 2008-09. New Zealand aquatic
environment and biodiversity report No. 80.
Akroyd, J., Pierre, J. and Punt, A. (2012) NZ Hoki Fisheries: 2nd [MSC] Reassessment: Public
Certification Report, Version 5. September 2012. Ref: MML-F-030. Intertek Moody Marine. 297p
Bagley, N.W. and O’Driscoll, R.L. (2012). Trawl survey of hoki, hake, and ling in the Southland and
Sub-Antarctic areas, November–December 2009 (TAN0911). New Zealand Fisheries Assessment
Report 2012/05. 72p.
Bagley, N.W.; O’Driscoll, R.L. and Oeffner, J. (2013). Trawl survey of hoki and middle-depth
species in the Southland and Sub-Antarctic areas, November–December 2011 (TAN1117). New
Zealand Fisheries Assessment Report 2013/23. 70 p.
Baird, S.J. (2008). Net captures of seabirds during trawl fishing operations in New Zealand waters.
NIWA Client Report WLG2008-22. 51p.
Baird, S.J. (2011). New Zealand fur seals - summary of current knowledge. New Zealand Aquatic
Environment and Biodiversity Report No. 72. 51p.
Baird, S.J., Tracey, D., Mormede, S. and Clark, M. (2012). The distribution of protected corals in
New Zealand waters. NIWA client report for DOC, No: WLG2012-43. 95p.
Baker, B., Jensz, K., Cawthorn, M. and Cunningham, R. (2009). Census of New Zealand fur seals on
the West Coast of New Zealand's South Island. Latitude 42 Environmental Consultants report for the
Deepwater Group Ltd. 22p.
Ballara, S.L., O'Driscoll, R.L., and Anderson, O.F. (2010). Fish discards and non-target fish catch in
the trawl fisheries for hoki, hake and ling in New Zealand waters. New Zealand Aquatic Environment
and Biodiversity Report No. 48. 100p.
Ballara, S.L. (2012). Descriptive analysis of the fishery for hake (Merluccius australis) in HAK 1, 4
and 7 from 1989–90 to 2009–10, and a catch-per-unit-effort (CPUE) analysis for Sub-Antarctic hake.
New Zealand Fisheries Assessment Report 2012/02. 47p.
Black, J., Wood, R., Berthelsen, T. and Tilney, R. (2013). Monitoring New Zealand's trawl footprint
for deepwater fisheries: 1989-90 to 2009-10. New Zealand Aquatic Environment and Biodiversity
Report No. 110. 61p.
Black, J. (2013). Hake and ling trawl footprint analysis: 1989/90 - 2011/12. Letter to Deepwater
Group Ltd, 5/9/13.
Blackwell, R.G. (2010). Distribution and abundance of deepwater sharks in New Zealand waters,
2000–01 to 2005–06. New Zealand Aquatic Environment and Biodiversity Report No. 57.
INTERTEK FISHERIES CERTIFICATION (IFC)
NZ Hake Fishery PCR Intertek Fisheries Certification page 70
Bowden, D., Compton, T.J., Snelder, T.H. and Hewitt, J.E. (2011). Evaluation of the New Zealand
Marine Environment Classifications using Ocean Survey 20/20 data from Chatham Rise and
Challenger Plateau. New Zealand Aquatic Environment and Biodiversity Report No. 77.
Boyd, I. (2011). Ecological risk assessment of the New Zealand hoki fisheries. Report for the
Deepwater Group Limited, Nelson, March 2011.
Bradford-Grieve, J.M., Probert, P.K., Nodder, S.D., Thompson, D., Hall, J., Hanchet, S., Boyd, P.,
Zeldis, J., Baker, A.N., Best, H.A., Broekhuizen, N., Childerhouse, S., Clark, M., Hadfield, M., Safi,
K., and Wilkinson, I. (2003). Pilot trophic model for subantarctic water over the Southern Plateau,
New Zealand: a low biomass, high transfer efficiency system. Journal of Experimental Marine
Biology and Ecology 289, 223– 262.
Bull, L.S. 2009. New mitigation measures reducing seabird by-catch in trawl fisheries. Fish andFisheries 10: 408–427.
Bull, B., Francis, R.I.C.C., Dunn, A., McKenzie, A., Gilbert, D.J., Smith, M.H. and Bian, R. (2008).
CASAL (C++ algorithmic stock assessment laboratory): CASAL User Manual v2.20- 2008/02/14.
NIWA Technical Report 130. 275 p.
Bull, B., Francis, R.I.C.C., Dunn, A., McKenzie, A., Gilbert, D.J., Smith, M.H. and Bian, R. (2012).
CASAL (C++ algorithmic stock assessment laboratory): CASAL User Manual v2.30-2012/03/21.
NIWA Technical Report 135. 280 p.
Clark M.R. and Rowden, A.A. (2009). Effect of deepwater trawling on the macro-invertebrate
assemblages of seamounts on the Chatham Rise, New Zealand. Deep Sea Research Part 1:
Oceanographic Research Papers 56: 1540-1554.
Clement and Associates. (2009). MIT2006/02 Final report: Mitigating seabird net captures intrawl fisheries. Department of Conservation, Wellington, New Zealand. Available fromhttp://www.doc.govt.nz/publications/conservation/marine-and-coastal/conservation-services-programme/csp-reports/archive/2008-2009/mit2006-02-final-report-mitigating-seabird-net-captures-in-trawl-fisheries/
Colman, J.A. (1998). Spawning areas and size and age at maturity of hake (Merluccius australis) in
the New Zealand Exclusive Economic Zone. New Zealand Fisheries Assessment Research Document
98/2. 17 p. (Unpublished report held in NIWA library, Wellington.)
Colman, J.A. and Vignaux, M. (1992). Assessment of New Zealand hake (Merluccius australis)
stocks for the 1992–93 fishing year. New Zealand Fisheries Assessment Research Document 92/17.
23 p. (Unpublished report held in NIWA library, Wellington.)
Colman, J.A. (1988a). Hake. New Zealand Fisheries Assessment Research Document 1988/31. 23 p.
Colman, J.A. (1998b). Spawning areas and size and age at maturity of hake (Merluccius australis) in
the New Zealand Exclusive Economic Zone. New Zealand Fisheries Assessment Research Document
1998/2. 17 p.
Deepwater Group Ltd. (2009). Vessel Management Plan (VMP) Deepwater Factory Trawler over 28
m. Version 4.0.
INTERTEK FISHERIES CERTIFICATION (IFC)
NZ Hake Fishery PCR Intertek Fisheries Certification page 71
Deepwater Group Ltd. (2010). Memorandum of Understanding between the Ministry of Fisheries and
the Deepwater Group. Continuing a partnership between the Ministry of Fisheries and the deepwater
fishing industry for the management of New Zealand’s deepwater fisheries. December 2010. 12p.
Deepwater Group Ltd. (2011a). Operating Procedures: Marine Mammals. Version 7. 1 October 2011.
Deepwater group Ltd. (2011b). Reporting Operational Procedures (v5) 2011-12.
Department of Conservation (2005). Marine Protected Areas: Policy and Implementation Plan. 25p.
Department of Conservation (2012). Conservation Services Programme Annual Plan 2012/13. 66p.
Devine, J. (2009). Descriptive analysis of the commercial catch and effort data for New Zealand hake
(Merluccius australis) for the 1989–90 to 2005–06 fishing years. New Zealand Fisheries Assessment
Report 2009/21. 74 p.
Dunn A. (2003) Revised estimates of landings of hake (Merluccius australis) for the west coast South
Island, Chatham Rise, and sub-Antarctic stocks in the fishing years 1989-90 to 2000-01. New Zealand
Fisheries Assessment Report 2003/39. 36 p.
Dunn A., Horn P.L., Cordue, P.L. and Kendrick, T.H. (2000) Stock assessment of hake (Merluccius
australis) for the 1999–2000 fishing year. New Zealand Fisheries Assessment Report 2000/50. 50 p.
Francis, M. and Sutton, P. (2012). Basking Shark Bycatch Review Final Report (Draft) for DOC
Contract 4346. 38 p.
Francis, M. and Lyon, W. (2012). Review of commercial fishery interactions and population
information for eight New Zealand protected fish species. Final Report for DOC Contract 4345. 74 p.
Francis, R.I.C.C., Hurst, R.J. and Renwick, J.A. (2001). An evaluation of catchability assumptions in
New Zealand stock assessments. New Zealand Fisheries Assessment Report 2001/1. 37 p.
Francis, R.I.C.C., Haist, V., and Bull, B. (2003). Assessment of hoki (Macruronus novaezelandiae) in
2002 using a new model. New Zealand Fisheries Assessment Report 2003/6. 69 p.
Froude, V.A., and Smith, R. (2004). Area-based restrictions in the New Zealand marine environment.
Department of Conservation MCU Report.
Hamilton, S. and Baker, B. (2010). Assessment of the impact of selected fisheries mortality on New
Zealand fur seal populations using the Potential Biological Removal (PBR) approach. Latitude 42
Environmental Consultants report for the Deepwater Group Ltd. 37 p.
Helser, T.E., and Martell, S. (2007). Stock Assessment of Pacific Hake (Whiting) in U.S. and
Canadian Waters in 2007. Report of the U.S.–Canada Pacific hake Joint Technical Committee (JTC).
Hewitt, J., Julian, K. and Bone, E.K. (2011). Chatham–Challenger Ocean Survey 20/20 Post-Voyage
Analyses: Objective 10 – Biotic habitats and their sensitivity to physical disturbance. New Zealand
Aquatic Environment and Biodiversity Report No. 81. 36 p.
INTERTEK FISHERIES CERTIFICATION (IFC)
NZ Hake Fishery PCR Intertek Fisheries Certification page 72
Hobday, A.J., Smith, A., Webb, H., Daley, R., Wayte, S., Bulman, C., et al. (2007). Ecological risk
assessment for the effects of fishing: methodology. Unpublished report (R04/1072) held by the
Australian Fisheries Management Authority, Canberra
Horn, P.L. (1997). An ageing methodology, growth parameters, and estimates of mortality for hake
(Merluccius australis) from around the South Island, New Zealand. Marine and Freshwater Research
48(3): 201–209.
Horn, P.L. (2008). Stock assessment of hake (Merluccius australis) in the Sub-Antarctic for the
2007–08 fishing year. New Zealand Fisheries Assessment Report 2008/49. 66 p.
Horn, P.L. (2013a). Stock assessment of hake (Merluccius australis) in the Sub-Antarctic (part of
HAK 1) for the 2011–12 fishing year. New Zealand Fisheries Assessment Report 2013/5. 56 p.
Horn, P.L. (2013b). Stock assessment of hake (Merluccius australis) on the Chatham Rise (HAK 4)
and off the west coast of South Island (HAK 7) for the 2012–13 fishing year. New Zealand Fisheries
Assessment Report 2013/31. 62 p.
Horn, P.L. and Francis, R.I.C.C. (2010). Stock assessment of hake (Merluccius australis) on the
Chatham Rise for the 2009–10 fishing year. New Zealand Fisheries Assessment Report 2010/14. 65 p.
Horn, P.L. and Dunn, M.R. 2010. Inter-annual variability in the diets of hoki, hake, and ling on the
Chatham Rise from 1990 to 2009. New Zealand Aquatic Environment and Biodiversity Report No.
54.
Horn, P.L. and Sutton, C.P. (2012). Catch-at-age for hake (Merluccius australis) and ling (Genypterus
blacodes) in the 2009–10 fishing year and from a trawl survey in summer 2010–11, with a summary
of all available data sets. New Zealand Fisheries Assessment Report 2012/3. 53 p.
Kazmierow B., Booth, K. and Mossman, E. (2010) Commercial Fishers Compliance Decision
Making: Perceptions, Experiences and Factors Influencing Regulatory Compliance. Report Prepared
for Ministry of Fisheries. 106 p.
Knight, B., Sinner, J. and Jiant, W. (2011). Sustainability of NZ's deepwater fisheries from an
energetics perspective - an update. Cawthron Institute Report 2044. 42 p.
Leathwick J., Francis, M. and Julian, K. (2006). Development of a demersal fish community
classification for New Zealand’s Exclusive Economic Zone. Prepared for Department of
Conservation. NIWA Client Report HAM2006-062. Hamilton.
Leathwick, J.R., Rowden, A,A., Nodder, S, Gorman, R, Bardsley, S, Pinkerton, M, Baird, S.J.,Hadfield, M, Currie, K. and A. Goh. 2009. Benthic-optimised marine environment classification forNew Zealand waters. Final Research Report for BEN2006-01. Ministry of Fisheries, Wellington.
Lock, K and Leslie, S. (2007), New Zealand's Quota Management System: A History of the First 20
Years, Motu Working Paper 07-02. Motu Economic and Public Policy Research (April 2007). 75 p.
Løkkeborg S. 2011. Best practices to mitigate seabird bycatch in longline, trawl and gillnetfisheries—efficiency and practical applicability. Marine Ecology Progress Series 435: 285-303.
INTERTEK FISHERIES CERTIFICATION (IFC)
NZ Hake Fishery PCR Intertek Fisheries Certification page 73
MacDiarmid, A., Thompson, D. and Oliver, M. (2005). Potential Ecosystem Interactions of the Hoki
Trawl Fishery. NIWA Client Report: WLG2005-77.
McKnight, D.G. and Probert, P.K. (1997). Epibenthic communities on the Chatham Rise, New
Zealand. New Zealand Journal of Marine and Freshwater Research 31, 505-513.
Middleton, D.A.J. and Abraham, E.R. 2007. The efficacy of warp strike mitigation devices: trails inthe 2006 squid fishery. Final Research Report IPA2006-02, Ministry of Fisheries, Wellington.Available at: http://fs.fish.govt.nz/Page.aspx?pk=113&dk=22910.
Ministry of Fisheries. (2005). Introduction of new stocks into the Quota Management System on 1
October 2007. Consultation Document. 22 December 2005. 62 p.
Ministry of Fisheries. (2008a). Harvest Strategy Standard for New Zealand fisheries. 30 p.
Ministry of Fisheries (2008b). Identification of candidate stocks for QMS introduction - standards and
organisational procedures. 28 p.
Ministry of Fisheries (2008c). QMS introduction process standard - executive summary. 19 p.
Ministry of Fisheries (2009a). Stakeholder Consultation Process Standard. Ministry of Fisheries,
Wellington.
Ministry of Fisheries (2009b). Compliance Information Sheet 01. Misreporting. Ministry of Fisheries,
Wellington.
Ministry of Fisheries. (2010a). Introduction of Bladder Kelp Seaweed, Macrocystispyrifera (KBB), in
Fisheries Management Areas 3 and 4 into the Quota Management System on 1 October 2010.
Ministry of Fisheries. (2010b). Introduction of Patagonian Toothfish (PTO) into the Quota
Management System on 1 October 2010: Final Advice Paper.
Ministry of Fisheries. (2010c). Research Specifications for the 10-year Research programme for
Deepwater Fisheries. Document dated 28 July 2010.
Ministry of Fisheries (2010d). National Fisheries Plan for Deepwater and Middle-depth Fisheries.
Ministry of Fisheries, Wellington.
Ministry of Fisheries (2010e). Statement of Intent. July 2010 – June 2015. Ministry of Fisheries,
Wellington.
Ministry of Fisheries (2010f). National Fisheries Plan for Deepwater and Middle-depth fisheries, Part
1A. 59 p. Ministry of Fisheries, Wellington.
Ministry of Fisheries (2010g) 10 Year Research Programme for Deepwater Fisheries. Ministry of
Fisheries. 148 p.
Ministry of Fisheries (2010h). Compliance Information Sheet 03. Accuracy of reporting. Ministry of
Fisheries, Wellington.
Ministry of Fisheries (2010i). Compliance Information Sheet 06. Seabird Mitigation Devices.
Ministry of Fisheries, Wellington.
INTERTEK FISHERIES CERTIFICATION (IFC)
NZ Hake Fishery PCR Intertek Fisheries Certification page 74
Ministry of Fisheries (2010j). Compliance Information Sheet 07. Benthic Protection and Seamount
Closures.Ministry of Fisheries, Wellington.
Ministry of Fisheries (2010k). Overview of New Zealand Fishery Science Peer Review Processes.
Ministry of Fisheries. 10 June 2010. 24 p.
Ministry of Fisheries (2010 l). Review of Regulatory Measures and other Management Controls for 1
December 2010. Volume 2: Initial Position Papers and Submissions.
Ministry of Fisheries (2011a).Terms of Reference for Fisheries Assessment Working Groups
(FAWGs) in 2011. Undated document.
Ministry of Fisheries. (2011b). Review of Sustainability Measures and Other Management Controls
for Deepwater Fisheries. Final Position Paper - September 2011.
Ministry of Fisheries. (2011c). Operational guidelines for New Zealand’s harvest strategy standard.
Revision 1. June 2011.
Ministry of Fisheries. (2011d). Draft policy for addressing the fishing-related mortality of seabirds in
New Zealand fisheries waters. May 2011.
Ministry of Fisheries. (2011e). Research and Science Information Standard for the New Zealand
Fisheries. Ministry of Fisheries. October 2008. 30 p.
Ministry for Primary Industries. (2012a). Aquatic Environment and Biodiversity Annual Review
2012. Compiled by the Fisheries Management Science Team, Ministry for Primary Industries,
Wellington. 387 p.
Ministry for Primary Industries. (2012b). Annual Operational Plan for deepwater fisheries for
2012/13. 71 p. Ministry for Primary Industries, Wellington.
Ministry for Primary Industries. (2012c). Introduction of all school shark stocks to Schedule 6 of the
Fisheries Act 1996. Regulatory Impact Statement. 9 p.
Ministry for Primary Industries. (2013a). Fisheries Assessment Plenary, Vol. 1. May 2013. 466 p.
Ministry for Primary Industries, Wellington.
Ministry for Primary Industries. (2013b). Fisheries Assessment Plenary, Vol. 2. May 2013. 474 p.
Ministry for Primary Industries, Wellington.
Ministry for Primary Industries. (2013c). Fisheries Assessment Plenary, Vol. 3. May 2013. 436 p.
Ministry for Primary Industries, Wellington.
Ministry for Primary Industries. (2013d). Draft National Plan of Action for the conservation and
management of sharks (NPOA-Sharks) 2013. 36 p. Ministry for Primary Industries, Wellington.
Ministry for Primary Industries. (2013e). National Fishing Plan Deepwater and Middle-depth
Fisheries Part 1B – Hake. Draft.
Ministry for Primary Industries. (2013f). Annual Review Report: Deepwater Fisheries 2011-12. June
2013. 78 p.
INTERTEK FISHERIES CERTIFICATION (IFC)
NZ Hake Fishery PCR Intertek Fisheries Certification page 75
Ministry for Primary Industries. (2013g). Fisheries Observer Tables 2010-11 & 2011-12
MSC. (2012). MSC Certification Requirements. V1.3. 355 p.
New Zealand Gazette. (2010). Fisheries Commercial Regulations 2001: Seabird scaring devices
circular 2010 (No. F517). No. 29. New Zealand Government.
Pierre, J.P., Abraham, E.R., Middleton, D.A.J., Cleal, J., Bird, R., Walker, N.A. and Waugh, S.M.
(2010). Reducing interactions between seabirds and fisheries: Responses to foraging patches
provided by fish waste batches. Biological Conservation 143: 2779-2788.
Pierre, J.P., Abraham, E.R., Cleal, J. and Middleton, D.A.J. 2012. Controlling trawler waste discharge
to reduce seabird mortality. Fisheries Research 131-133: 30-38.
Pinkerton, M.H. (2011a). A balanced trophic model of the Chatahm Rise, New Zealand. Accessed at:
http://www.niwa.co.nz/sites/default/files/chatham-model_32.pdf
Pinkerton, M.H. (2011b). Hoki ecological risk assessment: ecosystem and food-web effects. NIWA
unpublished report. 8p.
Pricewaterhouse Coopers. 2008. Fisheries 2030 – Vision, result areas and action plan.
Probert, P.K. and Grove, S.L. (1998). Macrobenthic assemblages of the continental shelf and upper
slope off the west coast of South Island, New Zealand. Journal of the Royal Society of New Zealand
28, 259-280.
Punt, A. E., Smith, A. D. M., Smith, D. C., Tuck, G. N., and Klaer, N. L. (2013). Selecting relative
abundance proxies for BMSY and BMEY. – ICES Journal of Marine Science, doi.10.1093
Ramm, K. (2012). Conservation Services Programme Observer Report: 1 July 2010 to 30 June 2011.
Richard, Y., Abraham, E.R. and Filippi, D. (2009). Assessment of the risk to seabird populations from
New Zealand commercial fisheries. Final Research Report prepared for the Ministry of Fisheries
(project IPA2009/19, Objective 1 Milestone 4; project IPA2009/20, Objective 1, Milestone 4).
Richards, Y. and Abraham, E.R. (2013a) Risk of commercial fisheries to New Zealand seabird
populations. New Zealand Aquatic Environment and Biodiversity Report No. 109. 62p. Ministry for
Primary Industries.
Richards, Y. and Abraham, E.R. (2013b) Application of potential biological removal methods to
seabird populations. New Zealand Aquatic Environment and Biodiversity Report No. 108. 34p.
Rowe, S.J. (2010). Conservation Services Programme observer report 1 July 2007 to 30 June 2008.
DOC Marine Conservation Services Series 4. 98p.
Snelder, T.H., Leathwick, J.R., Dey, K.L., Weatherhead, M.A., Fenwick, G.D., Francis, M.P.,
Gorman, R.M., Grieve, J.M., Hadfield, M.G., Hewitt, J.E., Hume, T., Richardson, K.M., Rowden,
A.A., Uddstrom, M.J., Wild, M., and Zeldis, J.R. (2005) The New Zealand Marine Environment
Classification. Ministry for the Environment. Wellington.
INTERTEK FISHERIES CERTIFICATION (IFC)
NZ Hake Fishery PCR Intertek Fisheries Certification page 76
Snelder, T.H., Leathwick, J.R., Dey, K.L., Rowden, A.A., Weatherhead, M.A., Fenwick, G.D.,
Francis, M.P., Gorman, R.M., Grieve, J.M., Hadfield, M.G., Hewitt, J.E., Richardson, K.M.,
Uddstrom, M.J., and Zeldis, J.R. (2006). Development of an ecological marine classification in the
New Zealand region. Environmental Management 39: 12–29.
Stevens, D.W., Hurst, R.J. and Bagley, N.W. (2011). Feeding habits of New Zealand fishes: aliterature review and summary of research trawl database records 1960 to 2000. New Zealand AquaticEnvironment and Biodiversity Report No. 85. 218 p.
Stevens, D.W., O’Driscoll, R.L., Dunn, M.R., Ballara, S.L., and Horn, P.L. (2012). Trawl survey ofhoki and middle depth species on the Chatham Rise, January 2011 (TAN1101). New ZealandFisheries Assessment Report 2012/10. 98 p.
Thompson, F.N., Abraham, E.R. and Oliver, M.D. (2010). Estimation of fur seal bycatch in NewZealand trawl fisheries, 2002-03 to 2007-08. New Zealand Aquatic Environment and BiodiversityReport No. 56. 29 p.
Thompson, F.N., Berkenbusch, K. and Abraham, E.R. (2013a). Marine mammal bycatch in NewZealand trawl fisheries, 1995–96 to 2010–11. New Zealand Aquatic Environment and BiodiversityReport No. 105. 77 p.
Thompson, F.N., Abraham, E.R. and Berkenbusch, K. (2013b). Common dolphin (Delphinus delphis)bycatch in New Zealand commercial trawl fisheries. PLoS ONE 8(5): e64438.doi:10.1371/journal.pone.0064438.
Thrush, S.F. and Dayton, P.K. (2002). Disturbance to marine benthic habitats by trawling anddredging: implications for marine biodiversity. Annual Review of Ecology and Systematics 33: 449-473.
Tuck, I., Cole, R. and Devine, J. (2009). Ecosystem indicators for New Zealand fisheries. AquaticEnvironment and Biodiversity report No. 42.
NZ Legislation
Fisheries Act 1996
Fisheries (Benthic Protection Areas) Regulations 2007 (SR 2007/308)
Fisheries (Commercial Fishing) Regulations 2001 (SR 2001/ 253)
Fisheries (Commercial Fishing Amendment) Regulations No 2. 2009
Fisheries (Reporting) Regulations 2001 (SR 2001/188)
Fisheries (Satellite Vessel Monitoring) Regulations 1993 (SR 193/354)
Maori Fisheries Act 2004
Marine Mammals Protection Act 1978
Marine Reserves Act 1971
Treaty of Waitangi (Fisheries Claims) Settlement Act 1992 No 121
Wildlife Act 1953

INTERTEK FISHERIES CERTIFICATION (IFC)
NZ Hake Fishery PCR Intertek Fisheries Certification page 77
INTERTEK FISHERIES CERTIFICATION (IFC)
NZ Hake Fishery PCR Intertek Fisheries Certification page 78
Appendices
Appendix 1 Scoring and Rationales
Appendix 1.1 Performance Indicator Scores and Rationale
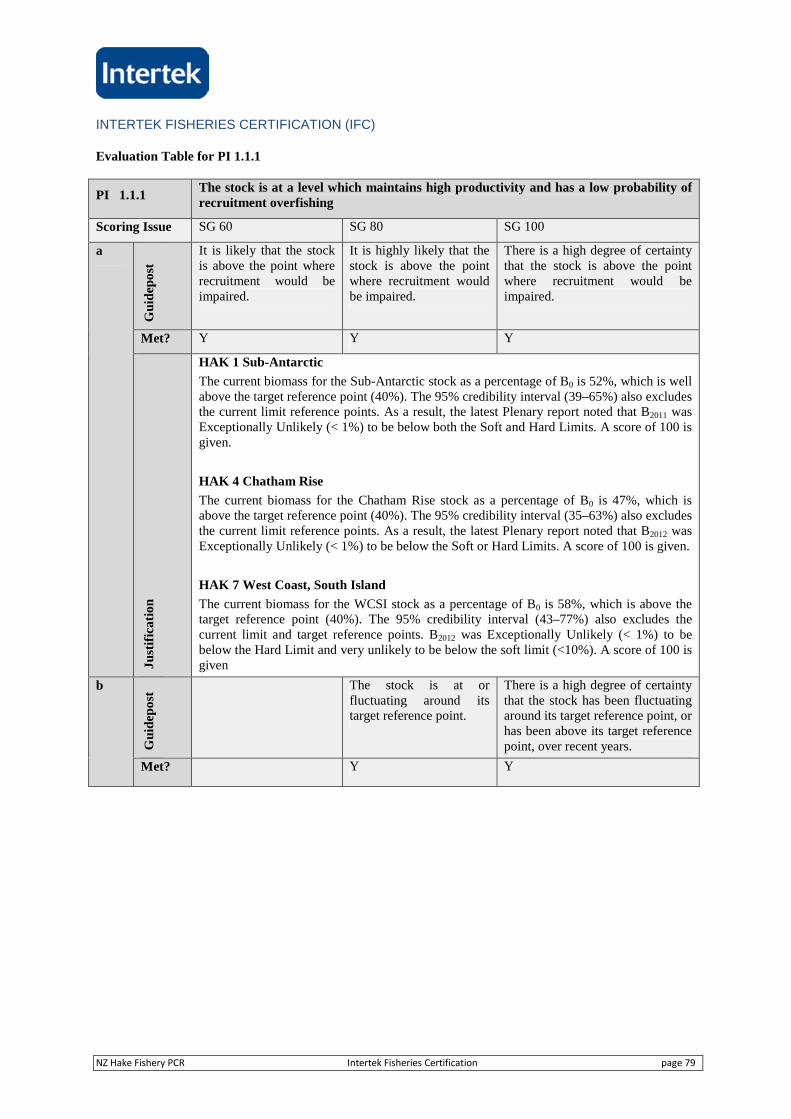
INTERTEK FISHERIES CERTIFICATION (IFC)
NZ Hake Fishery PCR Intertek Fisheries Certification page 79
Evaluation Table for PI 1.1.1
PI 1.1.1The stock is at a level which maintains high productivity and has a low probability ofrecruitment overfishing
Scoring Issue SG 60 SG 80 SG 100
a
Gu
idep
ost
It is likely that the stockis above the point whererecruitment would beimpaired.
It is highly likely that thestock is above the pointwhere recruitment wouldbe impaired.
There is a high degree of certaintythat the stock is above the pointwhere recruitment would beimpaired.
Met? Y Y Y
Ju
stif
ica
tio
n
HAK 1 Sub-Antarctic
The current biomass for the Sub-Antarctic stock as a percentage of B0 is 52%, which is wellabove the target reference point (40%). The 95% credibility interval (39–65%) also excludesthe current limit reference points. As a result, the latest Plenary report noted that B2011 wasExceptionally Unlikely (< 1%) to be below both the Soft and Hard Limits. A score of 100 isgiven.
HAK 4 Chatham Rise
The current biomass for the Chatham Rise stock as a percentage of B0 is 47%, which isabove the target reference point (40%). The 95% credibility interval (35–63%) also excludesthe current limit reference points. As a result, the latest Plenary report noted that B2012 wasExceptionally Unlikely (< 1%) to be below the Soft or Hard Limits. A score of 100 is given.
HAK 7 West Coast, South Island
The current biomass for the WCSI stock as a percentage of B0 is 58%, which is above thetarget reference point (40%). The 95% credibility interval (43–77%) also excludes thecurrent limit and target reference points. B2012 was Exceptionally Unlikely (< 1%) to bebelow the Hard Limit and very unlikely to be below the soft limit (<10%). A score of 100 isgiven
b
Gu
idep
ost
The stock is at orfluctuating around itstarget reference point.
There is a high degree of certaintythat the stock has been fluctuatingaround its target reference point, orhas been above its target referencepoint, over recent years.
Met? Y Y
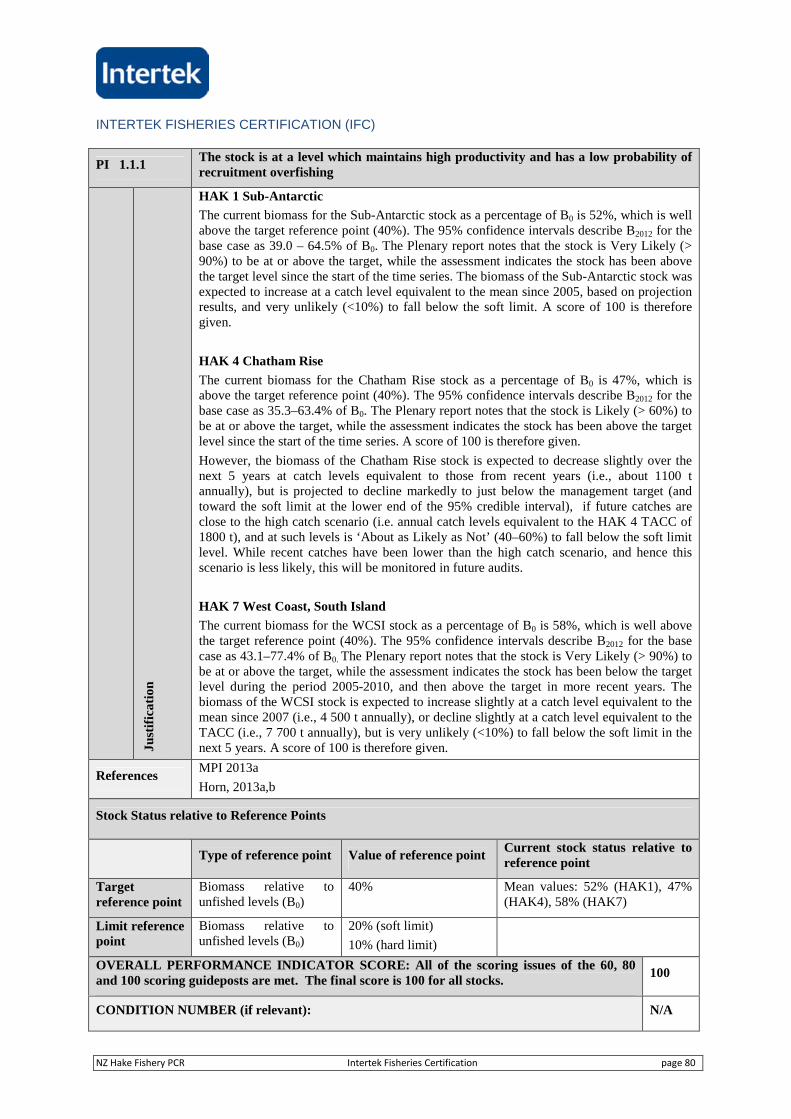
INTERTEK FISHERIES CERTIFICATION (IFC)
NZ Hake Fishery PCR Intertek Fisheries Certification page 80
PI 1.1.1The stock is at a level which maintains high productivity and has a low probability ofrecruitment overfishing
Ju
stif
ica
tio
n
HAK 1 Sub-Antarctic
The current biomass for the Sub-Antarctic stock as a percentage of B0 is 52%, which is wellabove the target reference point (40%). The 95% confidence intervals describe B2012 for thebase case as 39.0 – 64.5% of B0. The Plenary report notes that the stock is Very Likely (>90%) to be at or above the target, while the assessment indicates the stock has been abovethe target level since the start of the time series. The biomass of the Sub-Antarctic stock wasexpected to increase at a catch level equivalent to the mean since 2005, based on projectionresults, and very unlikely (<10%) to fall below the soft limit. A score of 100 is thereforegiven.
HAK 4 Chatham Rise
The current biomass for the Chatham Rise stock as a percentage of B0 is 47%, which isabove the target reference point (40%). The 95% confidence intervals describe B2012 for thebase case as 35.3–63.4% of B0. The Plenary report notes that the stock is Likely (> 60%) tobe at or above the target, while the assessment indicates the stock has been above the targetlevel since the start of the time series. A score of 100 is therefore given.
However, the biomass of the Chatham Rise stock is expected to decrease slightly over thenext 5 years at catch levels equivalent to those from recent years (i.e., about 1100 tannually), but is projected to decline markedly to just below the management target (andtoward the soft limit at the lower end of the 95% credible interval), if future catches areclose to the high catch scenario (i.e. annual catch levels equivalent to the HAK 4 TACC of1800 t), and at such levels is ‘About as Likely as Not’ (40–60%) to fall below the soft limitlevel. While recent catches have been lower than the high catch scenario, and hence thisscenario is less likely, this will be monitored in future audits.
HAK 7 West Coast, South Island
The current biomass for the WCSI stock as a percentage of B0 is 58%, which is well abovethe target reference point (40%). The 95% confidence intervals describe B2012 for the basecase as 43.1–77.4% of B0. The Plenary report notes that the stock is Very Likely (> 90%) tobe at or above the target, while the assessment indicates the stock has been below the targetlevel during the period 2005-2010, and then above the target in more recent years. Thebiomass of the WCSI stock is expected to increase slightly at a catch level equivalent to themean since 2007 (i.e., 4 500 t annually), or decline slightly at a catch level equivalent to theTACC (i.e., 7 700 t annually), but is very unlikely (<10%) to fall below the soft limit in thenext 5 years. A score of 100 is therefore given.
ReferencesMPI 2013a
Horn, 2013a,b
Stock Status relative to Reference Points
Type of reference point Value of reference pointCurrent stock status relative toreference point
Targetreference point
Biomass relative tounfished levels (B0)
40% Mean values: 52% (HAK1), 47%(HAK4), 58% (HAK7)
Limit referencepoint
Biomass relative tounfished levels (B0)
20% (soft limit)
10% (hard limit)
OVERALL PERFORMANCE INDICATOR SCORE: All of the scoring issues of the 60, 80and 100 scoring guideposts are met. The final score is 100 for all stocks.
100
CONDITION NUMBER (if relevant): N/A

INTERTEK FISHERIES CERTIFICATION (IFC)
NZ Hake Fishery PCR Intertek Fisheries Certification page 81
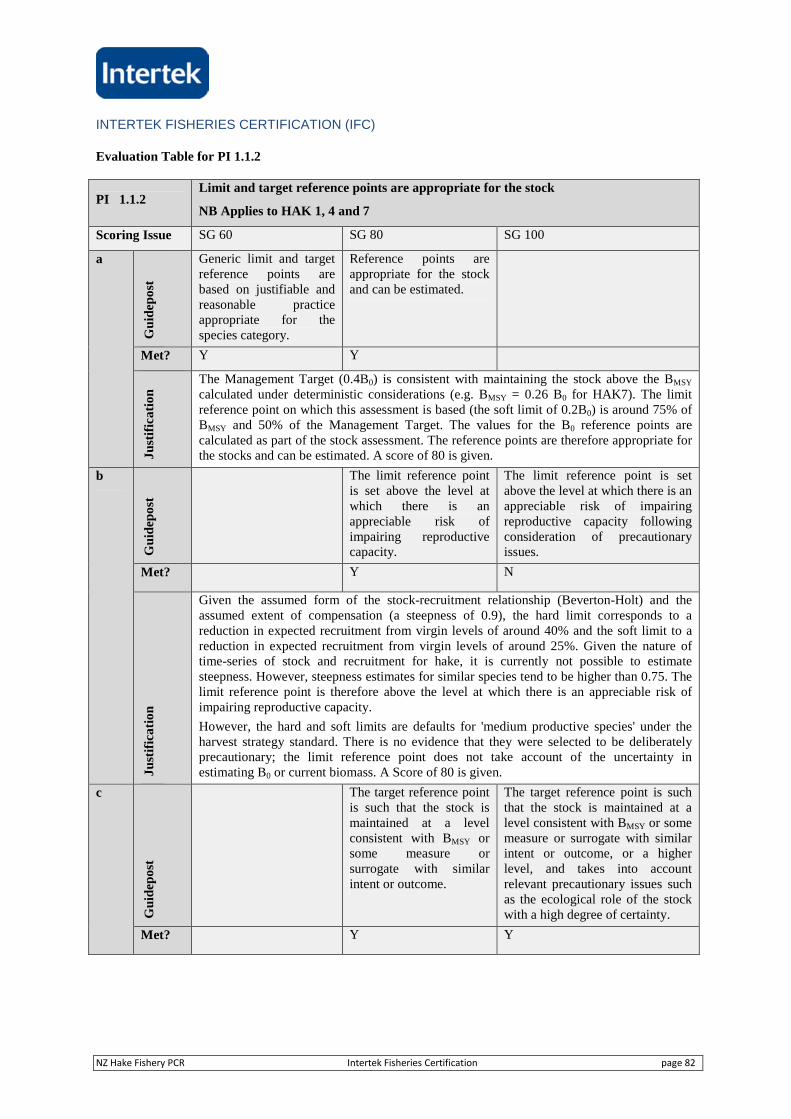
INTERTEK FISHERIES CERTIFICATION (IFC)
NZ Hake Fishery PCR Intertek Fisheries Certification page 82
Evaluation Table for PI 1.1.2
PI 1.1.2Limit and target reference points are appropriate for the stock
NB Applies to HAK 1, 4 and 7
Scoring Issue SG 60 SG 80 SG 100
a
Gu
idep
ost
Generic limit and targetreference points arebased on justifiable andreasonable practiceappropriate for thespecies category.
Reference points areappropriate for the stockand can be estimated.
Met? Y Y
Ju
stif
ica
tio
n
The Management Target (0.4B0) is consistent with maintaining the stock above the BMSY
calculated under deterministic considerations (e.g. BMSY = 0.26 B0 for HAK7). The limitreference point on which this assessment is based (the soft limit of 0.2B0) is around 75% ofBMSY and 50% of the Management Target. The values for the B0 reference points arecalculated as part of the stock assessment. The reference points are therefore appropriate forthe stocks and can be estimated. A score of 80 is given.
b
Gu
idep
ost
The limit reference pointis set above the level atwhich there is anappreciable risk ofimpairing reproductivecapacity.
The limit reference point is setabove the level at which there is anappreciable risk of impairingreproductive capacity followingconsideration of precautionaryissues.
Met? Y N
Ju
stif
ica
tio
n
Given the assumed form of the stock-recruitment relationship (Beverton-Holt) and theassumed extent of compensation (a steepness of 0.9), the hard limit corresponds to areduction in expected recruitment from virgin levels of around 40% and the soft limit to areduction in expected recruitment from virgin levels of around 25%. Given the nature oftime-series of stock and recruitment for hake, it is currently not possible to estimatesteepness. However, steepness estimates for similar species tend to be higher than 0.75. Thelimit reference point is therefore above the level at which there is an appreciable risk ofimpairing reproductive capacity.
However, the hard and soft limits are defaults for 'medium productive species' under theharvest strategy standard. There is no evidence that they were selected to be deliberatelyprecautionary; the limit reference point does not take account of the uncertainty inestimating B0 or current biomass. A Score of 80 is given.
c
Gu
idep
ost
The target reference pointis such that the stock ismaintained at a levelconsistent with BMSY orsome measure orsurrogate with similarintent or outcome.
The target reference point is suchthat the stock is maintained at alevel consistent with BMSY or somemeasure or surrogate with similarintent or outcome, or a higherlevel, and takes into accountrelevant precautionary issues suchas the ecological role of the stockwith a high degree of certainty.
Met? Y Y
INTERTEK FISHERIES CERTIFICATION (IFC)
NZ Hake Fishery PCR Intertek Fisheries Certification page 83
PI 1.1.2Limit and target reference points are appropriate for the stock
NB Applies to HAK 1, 4 and 7
Ju
stif
ica
tio
n
While 0.4B0 is often used as a proxy for MSY, and is the basis for the Harvest StrategyStandard, in the case of the biological assumptions made for hake the management Target(0.4B0) is actually higher than deterministic estimates of BMSY (e.g. BMSY = 0.26 B0 forHAK7). This is primarily because these estimates are based on the assumption of perfectinformation about the fishery and the population, and because targeting a deterministic BMSY
would lead to an undesirably high probability of breaching the soft limit (as noted in stockassessment documents). The Management Target is precautionary in the sense that itreduces the risk of the stock dropping below the soft and hard limits, and the targetreference point will maintain the stock above BMSY. A score of 100 is therefore given.
d
Gu
idep
ost
For key low trophic levelstocks, the targetreference point takes intoaccount the ecologicalrole of the stock.
Met? Not relevant
Ju
stif
ica
tio
n
Hake does not satisfy the criteria for a LTL species: (a) family Merlucciidae does not appearin the list of “key LTL species” in MSC Certification Requirements, and (b) the diet of hakeis not predominantly plankton and hake do not have the biological characteristics of LTLspecies identified in the MSC Certification Requirements.
References
Horn, 2013a,b
MPI, 2013a
Helser and Martell, 2007
Punt et al., 2013
Ministry of Fisheries, 2008
MSC, 2012
OVERALL PERFORMANCE INDICATOR SCORE: The score is 90 because all of thescoring issues for the 80 scoring guidepost are met as is one of the two scoring issues for the100 scoring guidepost.
90
CONDITION NUMBER (if relevant):
INTERTEK FISHERIES CERTIFICATION (IFC)
NZ Hake Fishery PCR Intertek Fisheries Certification page 84
Evaluation Table for PI 1.1.3
PI 1.1.3
Where the stock is depleted, there is evidence of stock rebuilding within a specifiedtimeframe
NB Applies to HAK 1,4 and 7
Scoring Issue SG 60 SG 80 SG 100
a
Gu
idep
ost
Where stocks aredepleted rebuildingstrategies, which have areasonable expectation ofsuccess, are in place.
Where stocks are depleted,strategies are demonstrated to berebuilding stocks continuously andthere is strong evidence thatrebuilding will be complete withinthe specified timeframe.
Met? (Y/N) (Y/N)
Ju
stif
ica
tio
n
The three stocks are currently above the target reference point level, so rebuilding is notnecessary and this performance indicator does not apply.
b
Gu
idep
ost
A rebuilding timeframeis specified for thedepleted stock that is theshorter of 30 years or 3times its generation time.For cases where 3generations is less than 5years, the rebuildingtimeframe is up to 5years.
A rebuilding timeframe isspecified for the depletedstock that is the shorter of20 years or 2 times itsgeneration time. For caseswhere 2 generations isless than 5 years, therebuilding timeframe isup to 5 years.
The shortest practicable rebuildingtimeframe is specified which doesnot exceed one generation time forthe depleted stock.
Met? (Y/N) (Y/N) (Y/N)
Ju
stif
ica
tio
n
N/A
c
Gu
idep
ost
Monitoring is in place todetermine whether therebuilding strategies areeffective in rebuildingthe stock within aspecified timeframe.
There is evidence thatthey are rebuildingstocks, or it is highlylikely based on simulationmodelling or previousperformance that theywill be able to rebuild thestock within a specifiedtimeframe.
Met? (Y/N) (Y/N)
INTERTEK FISHERIES CERTIFICATION (IFC)
NZ Hake Fishery PCR Intertek Fisheries Certification page 85
PI 1.1.3
Where the stock is depleted, there is evidence of stock rebuilding within a specifiedtimeframe
NB Applies to HAK 1,4 and 7
Ju
stif
ica
tio
n
N/A
References[List any references here]
OVERALL PERFORMANCE INDICATOR SCORE: N/A
CONDITION NUMBER (if relevant):
INTERTEK FISHERIES CERTIFICATION (IFC)
NZ Hake Fishery PCR Intertek Fisheries Certification page 86
Evaluation Table for PI 1.2.1
PI 1.2.1 There is a robust and precautionary harvest strategy in place
Scoring Issue SG 60 SG 80 SG 100
a
Gu
idep
ost
The harvest strategy isexpected to achieve stockmanagement objectivesreflected in the target andlimit reference points.
The harvest strategy isresponsive to the state ofthe stock and theelements of the harveststrategy work togethertowards achievingmanagement objectivesreflected in the target andlimit reference points.
The harvest strategy is responsiveto the state of the stock and isdesigned to achieve stockmanagement objectives reflectedin the target and limit referencepoints.
Met? Y Y Y
Ju
stif
ica
tio
n
The harvest strategy for hake is consistent with the New Zealand Harvest Strategy Standard,HSS. The strategy aims to “provide a consistent and transparent framework for settingfishery and stock targets and limits and associated fisheries management measures, so thatthere is a high probability of achieving targets, a very low probability of breaching limits,and acceptable probabilities of rebuilding stocks that nevertheless become depleted, in atimely manner”. The harvest strategy standard specifies probabilities for each of theseoutcomes and includes the definition of (a) a target level about which a fishery or stockshould fluctuate, (b) a soft limit that triggers a requirement for a formal, time-constrainedrebuilding plan, and (c) a hard limit below which fisheries should be considered for closure.
The HSS requires a rebuilding plan when a stock is depleted to be below the soft limit (orfishery closure if the stock is estimated to be below the hard limit). This contrasts with theMSC guidelines for PI 1.1.3 which consider a stock to be depleted when it is consistentlybelow the target reference point. However, under the HSS objectives, managementmeasures and controls should result in the stock fluctuating about the target level. How thatis to be achieved for stocks between the target and soft limit is not explicitly prescribed inthe HSS. A recent management decision for scampi illustrates management actions for astock projected to drop below the soft limit, suggesting that the harvest strategy will reactbefore a stock drops below the limit reference point.
The harvest strategy standard was established following extensive consultation and review(including international peer-review of a draft of the standard). A review was undertaken in2007 of the fisheries stock assessment process and the sustainability advice and found thatbroadly the process worked well. It also identified some weaknesses in implementation.
The stock assessment documents report stock status relative to the reference points andquantify the implications of future TACC levels. It is noted that the standard does notaddress issues pertinent to multispecies catches, since hake is taken as bycatch in the hokifishery. However, it should be noted that the TACC, ACE and Deemed Value systemprovides a flexible framework which should in theory allow management of these issues.
The harvest strategy is therefore responsive to the state of the stock and is designed toachieve stock management objectives, as reflected by the target and limit reference points.A score of 100 is given.
b
Gu
idep
ost
The harvest strategy islikely to work based onprior experience orplausible argument.
The harvest strategy maynot have been fully testedbut evidence exists that itis achieving itsobjectives.
The performance of the harveststrategy has been fully evaluatedand evidence exists to show that itis achieving its objectivesincluding being clearly able tomaintain stocks at target levels.
Met? Y Y N
INTERTEK FISHERIES CERTIFICATION (IFC)
NZ Hake Fishery PCR Intertek Fisheries Certification page 87
PI 1.2.1 There is a robust and precautionary harvest strategy in placeJ
ust
ific
ati
on
The implementation of the proposed harvest strategy for all hake stocks includes: (a) a stockassessment estimating the current biomass (b) a precautionary region between the soft limitreference point and the hard limit reference point where a formal rebuild strategy is needed,(c) fishery closure to be considered if the stock is below the hard limit. The harvest strategyis not specified as a mathematical function.
The current HAK 1 Sub-Antarctic TACC has remained constant for over 20 years. ThatTACC has been exceeded in the past usually by no more than 5%, although in 2004/05 itwas exceeded by around 30%. Since that year, catches have been below the TACC.
The HAK 4 TACC has not been exceeded in the past by any significant amount and despitebeing reduced in the 2003-04 season, it is currently set at a level that does not limit thefishery.
The HAK 7 TACC has been exceeded regularly by up to 19% in each year between 1997/98– 2004/05 until the TACC was raised from 6855 to 7700, which suggests the TACC did nottightly control the harvest. The HAK 7 landed catch since 2007-08 has been well below theTACC. The relatively low catches in recent years may at least in part be due to the reducedhoki exploitation rate which is undergoing rebuilding, and increases in the TACC for thatspecies are mirrored by increases in HAK7 catches in recent years. With the current lowcatches and high biomass, the harvest strategy is not being placed under significant pressure.
The quota management area does not quite coincide with the HAK 4 Chatham Rise stockassessment, which includes the western end of the Chatham Rise currently forming part ofthe HAK 1 management area. This is accounted for in the assessment and this has notcaused a detectable stock management problem.
The strategy has not been fully tested, preventing a higher score under this indicator.Although stock assessments are not annual, stock status indices (primarily catches and agecompositions, with intermittent fishery-independent surveys in the case of HAK 7, butincluding abundance indices for HAK 1 and 4; see PI 1.2.3) are updated each year formonitoring purposes. This level of monitoring should detect significant problems created bythe harvest strategy. However, the implications of uncertainty on the performance of theharvest strategy have not been evaluated formally and the harvest strategy has not been inplace sufficiently long that it is possible to evaluate its performance empirically. Evidenceexists that management is prepared to apply controls consistent with the harvest strategystandard. This appears to be consistent with the relative risks posed to these stocks by thefishery.
While the HSS recognizes the value of MSE to evaluate harvest strategies, MSE has notbeen used for New Zealand hake stocks. Specifically, given that the harvest strategy is notmathematically specified, any MSE evaluation can only be approximate. Thus, it ispremature to conclude that the harvest strategy has been fully evaluated. A score of 80 isgiven.
c
Gu
idep
ost
Monitoring is in placethat is expected todetermine whether theharvest strategy isworking.
Met? Y
Ju
stif
ica
tio
n
Fishery-dependent and independent data are available to monitor trends in abundance aswell as the age and sex-structure of the populations and the removals from the population.These data are included in the stock assessment, which estimates stock status relative tolimit and target reference points. A plan is in place which determines future levels ofmonitoring (surveys and sampling for age and length; see the 10 year research plan forDeepwater Fisheries). Thus, monitoring is in the place that is expected to determine whetherthe harvest strategy is working. The fishery passes the 60 level.
INTERTEK FISHERIES CERTIFICATION (IFC)
NZ Hake Fishery PCR Intertek Fisheries Certification page 88
PI 1.2.1 There is a robust and precautionary harvest strategy in place
d
Gu
idep
ost
The harvest strategy is periodicallyreviewed and improved asnecessary.
Met? Y
Ju
stif
ica
tio
n
The HSS was published in 2008, and represents the current constraints on the harveststrategy. The guidelines for applying the HSS were revised in 2011. The major changes tothe document relate to metrics for quantifying fishing intensity as well as to the roles andresponsibilities of Science Working Groups and fisheries managers. For specific stocks,TACC levels for hake have been changed, along with changes in hoki TACC but as notedabove do not appear to constrain the fishery. However, the harvest strategy for hake hasevolved over time, with the development of formal limits and target reference points,demonstrating that the harvest strategy has been reviewed periodically and revised. A scoreof 100 is therefore given.
e
Gu
idep
ost
It is likely that sharkfinning is not takingplace.
It is highly likely thatshark finning is not takingplace.
There is a high degree of certaintythat shark finning is not takingplace.
Met? Not relevant Not relevant Not relevant
Ju
stif
ica
tio
n
Sharks are not a target species, hence this element is not scored.
References
Ministry of Fisheries, 2008
Ministry of Fisheries, 2010c
Ministry of Fisheries. 2011a, b, c
MSC. 2012
OVERALL PERFORMANCE INDICATOR SCORE: The score is 95 because all of thescoring issues for the 80 scoring guidepost are met as are two of the three scoring issues for the100 scoring guidepost.
95
CONDITION NUMBER (if relevant): NA
INTERTEK FISHERIES CERTIFICATION (IFC)
NZ Hake Fishery PCR Intertek Fisheries Certification page 89
Evaluation Table for PI 1.2.2
PI 1.2.2There are well defined and effective harvest control rules in place
Scoring Issue SG 60 SG 80 SG 100
a
Gu
idep
ost
Generally understoodharvest rules are in placethat are consistent withthe harvest strategy andwhich act to reduce theexploitation rate as limitreference points areapproached.
Well defined harvestcontrol rules are in placethat are consistent withthe harvest strategy andensure that theexploitation rate isreduced as limit referencepoints are approached.
Met? Y Y
Ju
stif
ica
tio
n
The harvest control rule for New Zealand hake is comprised of “Management actionsdetermined by the results of a series of forward projections under a range of catchassumptions, guided by the biological reference points”. The harvest control rule is not acatch control rule (a mathematical function which pre-determines TACCs based on stockstatus relative to limit and target reference points). Rather the harvest control rules areconsequences of the requirements of the Fisheries Act 1996 and Harvest Strategy Standard.For this PI, and consistent with the hoki certification, the harvest control rule is interpretedas comparing estimated stock status with the soft and hard limits, implementing a rebuildingplan if the stock is assessed to be below the soft limit, considering the fishery for closure ifthe stock is below the hard limit, and using 5-year projections to assess future stock statusgiven assumptions regarding future recruitment, TACCs and catch limits for the western andeastern stocks. The HSS indicates that the probability of breaching the soft limit should notexceed 10%.While the harvest strategy standard recognizes the need for action when stocks are belowtargets, but above the soft limit, consistent with the MSC standard, it lacks details on exactlyhow the exploitation rate will be reduced below the soft limit (the deemed value system maymake actual control difficult). The short-term consistency of TACC levels with the targetbiomass (0.4 B0) is identified through projections. In practice, TACCs have remained bydefault at the same level unless there is a practical need to change them. However, actionhas been demonstrated in other fisheries; e.g. the TACC for scampi was reduced in 2011when stock was projected to drop between the target and limit reference points. Thus, theharvest rules are well defined and consistent with the harvest strategy and will act to reducethe exploitation rate as the limit reference point is approached. A score of 80 is given.
b
Gu
idep
ost
The selection of theharvest control rules takesinto account the mainuncertainties.
The design of the harvest controlrules takes into account a widerange of uncertainties.
Met? Y N
INTERTEK FISHERIES CERTIFICATION (IFC)
NZ Hake Fishery PCR Intertek Fisheries Certification page 90
PI 1.2.2There are well defined and effective harvest control rules in place
Ju
stif
ica
tio
n
The assessment is based on a series of scenarios which capture the main assessment-relateduncertainties. Short-term projections are undertaken for a subset of these scenarios, usingspecific scenarios for future catch, and those projections account for uncertainty regardingfuture recruitment (by drawing on estimated historical recruitments, which while ignoringthe potential change in future recruitment due to the stock-recruitment relationship is notunreasonable given an assumed steepness of 0.9 and the longevity of the species). Theresults of the projections are expressed in terms of probabilities of failing to achieve variousgoals. Thus, the selection of the harvest control rules takes into account the mainuncertainties related to stock status and conducting projections. However, while the harveststrategy standard provides a formal and well specified process for setting harvest regulationsand is designed so that a range of uncertainties can be accounted for, the uncertaintyexamined within the stock assessment and projection process for hake cannot be said to be'wide', given the potential for structural and biological uncertainties noted within theassessment documents. A score of 80 is given.
c
Gu
idep
ost
There is some evidencethat tools used toimplement harvestcontrol rules areappropriate and effectivein controllingexploitation.
Available evidenceindicates that the tools inuse are appropriate andeffective in achieving theexploitation levelsrequired under the harvestcontrol rules.
Evidence clearly shows that thetools in use are effective inachieving the exploitation levelsrequired under the harvest controlrules.
Met? Y Y N
Ju
stif
ica
tio
n
The main tool used to implement the harvest control rules are the TACC. A system ofdeemed values is used to deter or deal with catches over quota. There are other ways tohandle over catch by individual operators, e.g. purchase of ACE from other quota holders.However, the deemed value also discourages discarding, an important attribute where hakeis taken as retained non-target species in the much larger hoki fishery. The estimated catchhas been less than the TACC since 2005 in all regions and clearly do not currently constraincatches, although some overruns have occurred prior to that time. Overall, it is not yet clearhow effective the tools will be during current hoki rebuilding, when the quota value wouldbecome very high if the hake quota constrains the hoki fishery. While available evidenceshows that the tools used to implement harvest control rules are appropriate and effective incontrolling exploitation, clearer evidence under developing conditions within the fisheryshould be provided over the coming years. A score of 80 is given.
References
Ministry of Fisheries, 2008
Ministry of Fisheries, 2011a, b
MPI, 2013a,b,c
OVERALL PERFORMANCE INDICATOR SCORE: All of the scoring issues for the 80scoring guidepost are met.
80
CONDITION NUMBER (if relevant): NA
INTERTEK FISHERIES CERTIFICATION (IFC)
NZ Hake Fishery PCR Intertek Fisheries Certification page 91
Evaluation Table for PI 1.2.3
PI 1.2.3Relevant information is collected to support the harvest strategy
Scoring Issue SG 60 SG 80 SG 100
a
Gu
idep
ost
Some relevantinformation related tostock structure, stockproductivity and fleetcomposition is availableto support the harveststrategy.
Sufficient relevantinformation related tostock structure, stockproductivity, fleetcomposition and otherdata is available tosupport the harveststrategy.
A comprehensive range ofinformation (on stock structure,stock productivity, fleetcomposition, stock abundance,fishery removals and otherinformation such as environmentalinformation), including some thatmay not be directly related to thecurrent harvest strategy, isavailable.
Met? Y Y N
Ju
stif
ica
tio
n
The report of the Stock Assessment Plenary (and individual stock assessment reports)summarizes information on stock structure and biology of hake, including growth, naturalmortality and maturity. Stock abundance is estimated from a stock assessment, whichrequires data on catches, abundance indices, age and size composition. Otolith ageing hasbeen validated. Sufficient data are all available to obtain good estimates of stock abundancefrom the assessment. Information on all vessels is held through a registry and licencesystem. Vessel activity is monitored through VMS and an observer programme. Monitoringof information not directly used in the harvest strategy includes mapping of spawningaggregations, remote sensing environmental change, productivity, physical oceanographicprocesses and bathymetry.
1. Stock structure. The three stocks of hake have been distinguished based primarilyon differences in morphology, biology and age structure, as well as the presence of separatespawning grounds. While available information is clearly sufficient to support the stockhypothesis, there is not a full understanding of whether the differences between the stocksare genetic or not.
2. Productivity. Data on growth rates are available from age and growth studies,fecundity-at-size has been estimated for the three stocks. Natural mortality estimates havebeen estimated using empirical approaches and also within the assessment model, but incommon with most assessments is kept constant over time. Understanding of the drivers ofrecruitment remains poor, and consequently the assessment conducts projections wherefuture recruitment is sampled from historical estimates.
3. Fleet composition. The total effort in the fishery is known, and comprehensive dataare available at fine spatial scales (e.g. Ballara et al. 2011). Although detailed information isavailable on catch and effort, including gear type and location, this information is generallynot used to construct an index of abundance that is used in the stock assessment, primarilybecause of the availability of fishery-independent data sources. However, a commercialCPUE time series has been developed for HAK7.
4. A variety of other data sources (diet, environmental conditions etc.) is alsoavailable for use in assessments and other analyses.
Thus, relevant information related to stock structure, stock productivity and fleetcomposition is available to support the harvest strategy. However, while there isconsiderable information on the biology of hake in New Zealand, sufficient data gapsremain (e.g. environmental influences, movement) that it cannot be concluded that the rangeof information available is comprehensive. A score of 80 is therefore given.
INTERTEK FISHERIES CERTIFICATION (IFC)
NZ Hake Fishery PCR Intertek Fisheries Certification page 92
PI 1.2.3Relevant information is collected to support the harvest strategy
b
Gu
idep
ost
Stock abundance andfishery removals aremonitored and at leastone indicator is availableand monitored withsufficient frequency tosupport the harvestcontrol rule.
Stock abundance andfishery removals areregularly monitored at alevel of accuracy andcoverage consistent withthe harvest control rule,and one or moreindicators are availableand monitored withsufficient frequency tosupport the harvestcontrol rule.
All information required by theharvest control rule is monitoredwith high frequency and a highdegree of certainty, and there is agood understanding of inherentuncertainties in the information[data] and the robustness ofassessment and management tothis uncertainty.
Met? Y Y Y: HAK1 and HAK4 only
Ju
stif
ica
tio
n
While extensive survey time series is available from regions HAK1 and HAK4, it is notedthat the survey has changed over time, with different periods of the year (HAK1 inparticular), depth ranges (e.g. HAK4) and occasionally different vessels. Developing aconsistent series shortens the time period available. Surveys in HAK7 have beenintermittent and 'one off', limiting the time series available; only two Tangaroa surveys(2000 and 2012) were included within the latest assessment, supplemented by a commercialCPUE time series. The assessment also allows for the sampling errors associated with thesurvey data and catch samples, as well as additional variance based on the methodology ofFrancis (2001).
The sampling coefficients of variation, CVs, of the abundance indices range from 0.12 to0.43, with estimates commonly in the range of 0.12-0.2, while that of the commercial timeseries is fixed at 0.04. Additional variance (“process error”) is usually added to these CVs toaccount for unquantified uncertainty between stock abundance and the abundance indices.
Removals are estimated by region and fishery, and information on age and length aresampled from the catches and the surveys. Catches are regularly sampled for age andstructure, and analyses account for the sampling protocol when assembling the data for usein the stock assessment. Length- and age-frequencies are based on '00s of measurements andotoliths of fish each survey.
Comparisons have been made between vessels with and without observers. In earlier years,before the introduction of higher TACCs in 1991–92, there is some evidence to suggest thatcatches of hake were under reported. Misreporting of catches among areas (stocks) hasoccurred between 1994/95 – 2000/01 seasons. There is no evidence of similar areamisreporting since 2000–01 and there is no evidence of IUU catches. There are negligiblerecreational or customary non-commercial catches. There is likely to be some mortalityassociated with escapement from trawl nets, but the level is not known and is assumed to benegligible.
No time series of survey biomass indices are available for the west coast South Island stock,and CPUE indices calculated for the stock have previously been uncertain. The seriesanalysing observer estimated tow-by-tow data from 2001 to 2011 was selected. It wasbelieved that this series, incorporating catch data after the establishment of the deemedvalue system, was the least likely to be biased owing to variation in fishing behaviour andcatch reporting behaviour. Issues with age data sampling across time and space were noted,leading to an under-estimate of uncertainty. The assessment was noted to be 'clearlyuncertain' due to the requirement to be based primarily on a CPUE series.
For HAK1 and HAK4, the information required by the harvest control rule is monitoredwith high frequency and a high degree of certainty, and there is a good understanding ofinherent uncertainties in the data and the robustness of the assessment and management tothis uncertainty. A score of 100 is given.
INTERTEK FISHERIES CERTIFICATION (IFC)
NZ Hake Fishery PCR Intertek Fisheries Certification page 93
PI 1.2.3Relevant information is collected to support the harvest strategy
Ju
stif
ica
tio
n For HAK7, while the assessment approach has improved and deemed acceptable as thebasis for advice, the harvest control rule requires high accuracy and the stock assessmentmethod used to achieve this accuracy seems to require explicit abundance indices. Thissuggests that while stock abundance and fishery removals are regularly monitored at a levelof accuracy and coverage consistent with the harvest control rule, and one or moreindicators are available and monitored with sufficient frequency to support the harvestcontrol rule, and while the sources of uncertainty are understood, the information cannot besaid to have a high degree of certainty. A score of 80 is given.
c
Gu
idep
ost
There is good informationon all other fisheryremovals from the stock.
Met? Y
Ju
stif
ica
tio
n
Catches by gears other than trawl are negligible. The landed catches by Maori for customarypurposes and by recreational fishers are considered negligible. Catches by all commercialfishing sectors (including non-hake fisheries) are counted against the TACC. Thus, there isgood information on all fishery removals from the stocks. A score of 80 is given.
References
Ballara, 2012
Colman, 1998a, b
Bagley et al., 2013
Francis et al., 2001
Francis et al., 2003
MPI 2013a,b,c
Horn, 2013a,b
Dunn, 2003
OVERALL PERFORMANCE INDICATOR SCORE: All HAK areas meet the scoring issuesat SG80. One 100 scoring guidepost is met in HAK1 and HAK4, and hence they score 90
HAK1& 4: 90
HAK7:80
CONDITION NUMBER (if relevant): NA
INTERTEK FISHERIES CERTIFICATION (IFC)
NZ Hake Fishery PCR Intertek Fisheries Certification page 94
Evaluation Table for PI 1.2.4
PI 1.2.4 There is an adequate assessment of the stock status
Scoring Issue SG 60 SG 80 SG 100
a
Gu
idep
ost
The assessment isappropriate for the stockand for the harvestcontrol rule.
The assessment is appropriate forthe stock and for the harvestcontrol rule and takes into accountthe major features relevant to thebiology of the species and thenature of the fishery.
Met? Y Y (HAK1), N (HAK4, HAK7)
Ju
stif
ica
tio
n
The latest assessments for each stock were carried out in 2011-2013, dependent upon thestock, using an age-structured CASAL model with Bayesian estimation of posteriordistributions.
The assessment uses fishery independent abundance indices (or primarily commercial catchindices in the case of HAK7), catch-at-age from the commercial fishery and trawl surveys,and estimates of biological parameters. The population model can account for the biology ofdifferent sexes, but this option has only been pursued, along with M varying with age, as asensitivity option for HAK1. Stock structure has been examined using size composition, sothat appropriate size selectivity and stock structure is used in the model.
There is no formal (i.e. mathematical) harvest control rule for New Zealand hake. Rather,decisions regarding the TACC is based on stock status as it assessed relative to biomass-based reference points. The projections conducted for different levels of future catches areadequate to inform decision makers regarding changes in (relative) abundance (stock statusis not generally well known in absolute terms, for example due to limited contrast in therelative abundance time series; HAK1). The assessment is appropriate for the stock and theharvest control rules. However the assessment is seen to be sensitive to the assumptionsmade on the biological structure (sex separation, natural mortality, etc., e.g. in HAK1)within the model, although relative outputs for HAK1 were robust to these uncertainties.Given the assessment for HAK1 examined the major features relevant to the biology ofhake, a score of 100 is given for this stock. The more limited evaluation of biologicalassumptions evaluated in their stock assessments means a score of 80 is given for HAK4and HAK7.
b
Gu
idep
ost
The assessment estimatesstock status relative toreference points.
Met? Y
Ju
stif
ica
tio
n
The stock assessment provides estimates of spawning biomass relative to (a) the soft andhard limits (0.1 and 0.2B0), (b) for some stocks estimates BMSY values under the assumptionof deterministic dynamics, and (c) the Management Target (0.4 B0). Thus, the assessmentestimates stock status relative to reference points, and meets the SG.
c
Gu
idep
ost
The assessment identifiesmajor sources ofuncertainty.
The assessment takesuncertainty into account.
The assessment takes into accountuncertainty and is evaluating stockstatus relative to reference pointsin a probabilistic way.
Met? Y Y Y
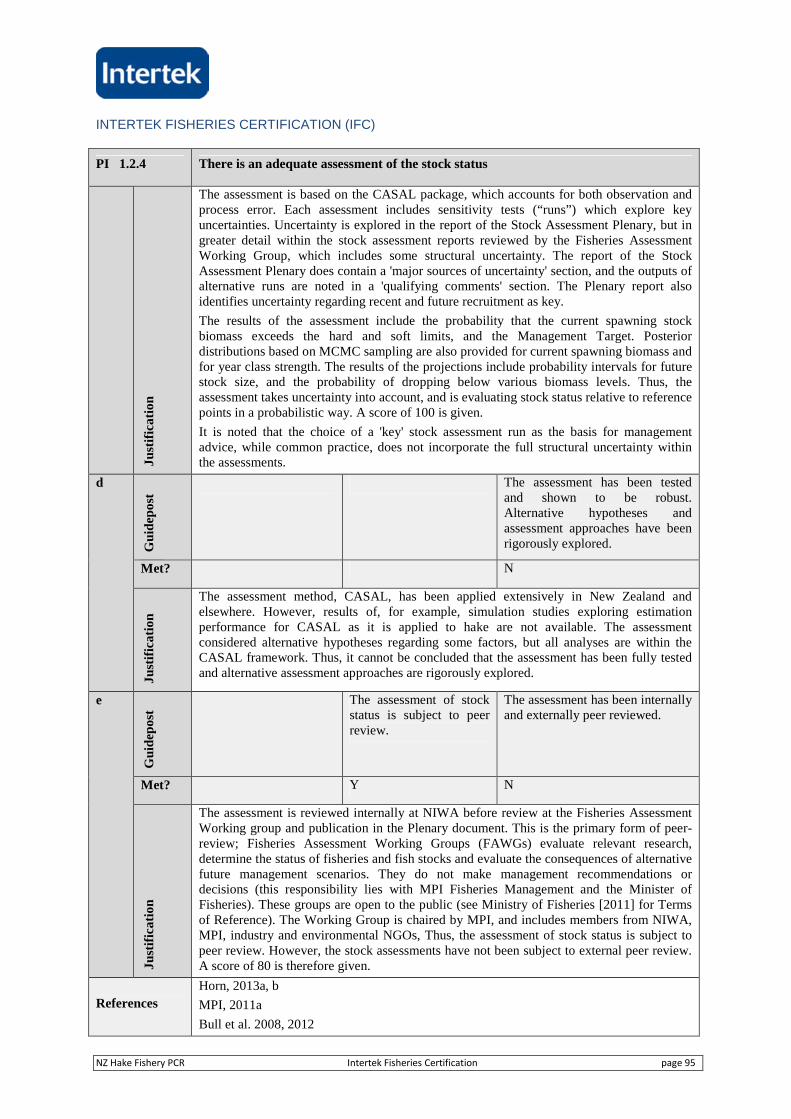
INTERTEK FISHERIES CERTIFICATION (IFC)
NZ Hake Fishery PCR Intertek Fisheries Certification page 95
PI 1.2.4 There is an adequate assessment of the stock statusJ
ust
ific
ati
on
The assessment is based on the CASAL package, which accounts for both observation andprocess error. Each assessment includes sensitivity tests (“runs”) which explore keyuncertainties. Uncertainty is explored in the report of the Stock Assessment Plenary, but ingreater detail within the stock assessment reports reviewed by the Fisheries AssessmentWorking Group, which includes some structural uncertainty. The report of the StockAssessment Plenary does contain a 'major sources of uncertainty' section, and the outputs ofalternative runs are noted in a 'qualifying comments' section. The Plenary report alsoidentifies uncertainty regarding recent and future recruitment as key.
The results of the assessment include the probability that the current spawning stockbiomass exceeds the hard and soft limits, and the Management Target. Posteriordistributions based on MCMC sampling are also provided for current spawning biomass andfor year class strength. The results of the projections include probability intervals for futurestock size, and the probability of dropping below various biomass levels. Thus, theassessment takes uncertainty into account, and is evaluating stock status relative to referencepoints in a probabilistic way. A score of 100 is given.
It is noted that the choice of a 'key' stock assessment run as the basis for managementadvice, while common practice, does not incorporate the full structural uncertainty withinthe assessments.
d
Gu
idep
ost
The assessment has been testedand shown to be robust.Alternative hypotheses andassessment approaches have beenrigorously explored.
Met? N
Ju
stif
ica
tio
n
The assessment method, CASAL, has been applied extensively in New Zealand andelsewhere. However, results of, for example, simulation studies exploring estimationperformance for CASAL as it is applied to hake are not available. The assessmentconsidered alternative hypotheses regarding some factors, but all analyses are within theCASAL framework. Thus, it cannot be concluded that the assessment has been fully testedand alternative assessment approaches are rigorously explored.
e
Gu
idep
ost
The assessment of stockstatus is subject to peerreview.
The assessment has been internallyand externally peer reviewed.
Met? Y N
Ju
stif
ica
tio
n
The assessment is reviewed internally at NIWA before review at the Fisheries AssessmentWorking group and publication in the Plenary document. This is the primary form of peer-review; Fisheries Assessment Working Groups (FAWGs) evaluate relevant research,determine the status of fisheries and fish stocks and evaluate the consequences of alternativefuture management scenarios. They do not make management recommendations ordecisions (this responsibility lies with MPI Fisheries Management and the Minister ofFisheries). These groups are open to the public (see Ministry of Fisheries [2011] for Termsof Reference). The Working Group is chaired by MPI, and includes members from NIWA,MPI, industry and environmental NGOs, Thus, the assessment of stock status is subject topeer review. However, the stock assessments have not been subject to external peer review.A score of 80 is therefore given.
References
Horn, 2013a, b
MPI, 2011a
Bull et al. 2008, 2012
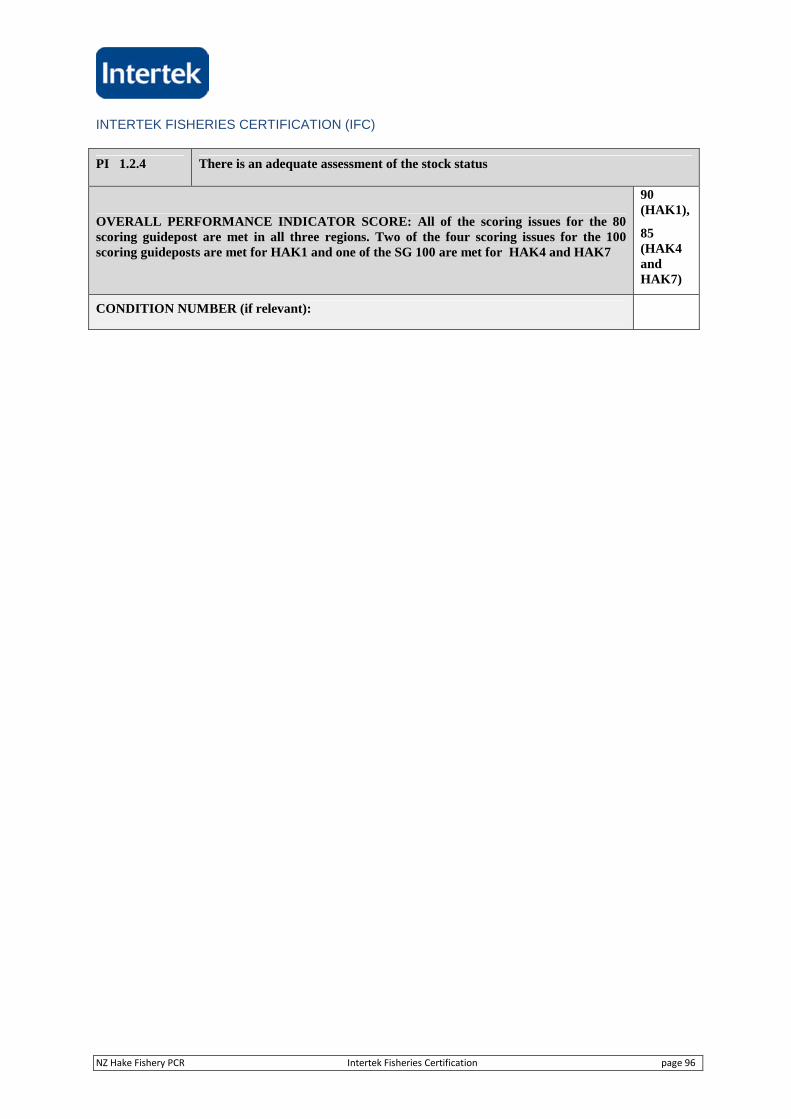
INTERTEK FISHERIES CERTIFICATION (IFC)
NZ Hake Fishery PCR Intertek Fisheries Certification page 96
PI 1.2.4 There is an adequate assessment of the stock status
OVERALL PERFORMANCE INDICATOR SCORE: All of the scoring issues for the 80scoring guidepost are met in all three regions. Two of the four scoring issues for the 100scoring guideposts are met for HAK1 and one of the SG 100 are met for HAK4 and HAK7
90(HAK1),
85(HAK4andHAK7)
CONDITION NUMBER (if relevant):
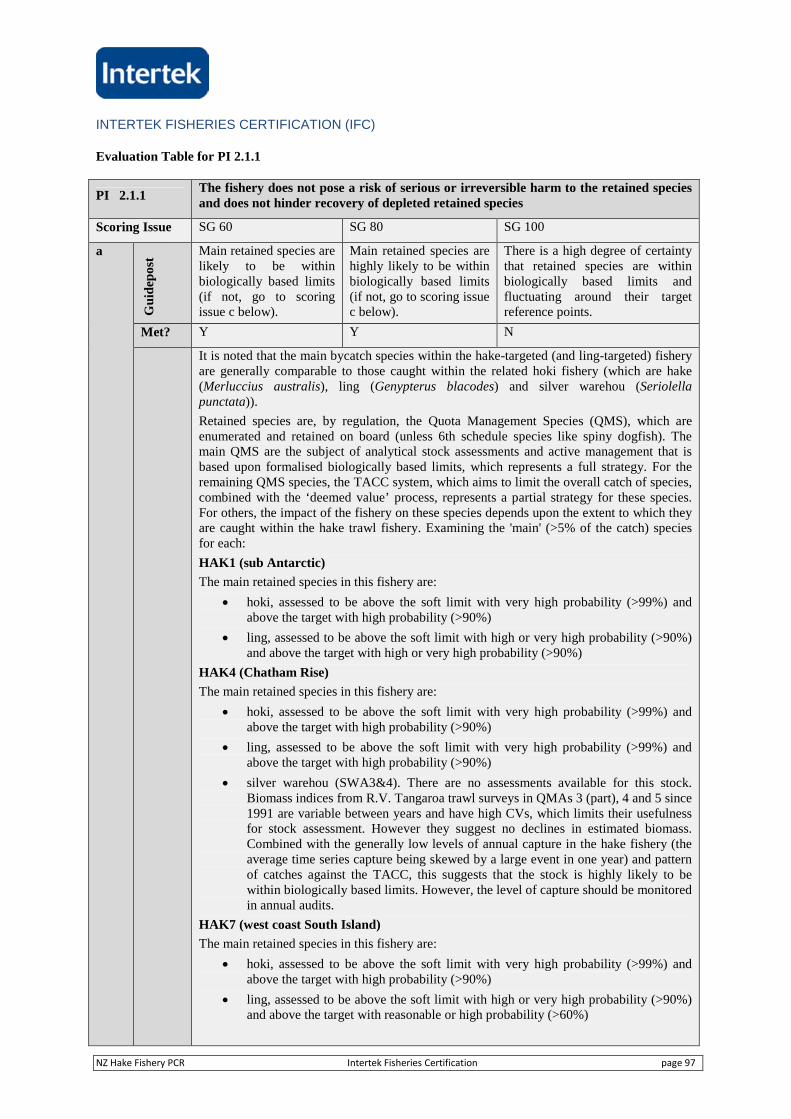
INTERTEK FISHERIES CERTIFICATION (IFC)
NZ Hake Fishery PCR Intertek Fisheries Certification page 97
Evaluation Table for PI 2.1.1
PI 2.1.1The fishery does not pose a risk of serious or irreversible harm to the retained speciesand does not hinder recovery of depleted retained species
Scoring Issue SG 60 SG 80 SG 100
a
Gu
idep
ost
Main retained species arelikely to be withinbiologically based limits(if not, go to scoringissue c below).
Main retained species arehighly likely to be withinbiologically based limits(if not, go to scoring issuec below).
There is a high degree of certaintythat retained species are withinbiologically based limits andfluctuating around their targetreference points.
Met? Y Y N
It is noted that the main bycatch species within the hake-targeted (and ling-targeted) fisheryare generally comparable to those caught within the related hoki fishery (which are hake(Merluccius australis), ling (Genypterus blacodes) and silver warehou (Seriolellapunctata)).
Retained species are, by regulation, the Quota Management Species (QMS), which areenumerated and retained on board (unless 6th schedule species like spiny dogfish). Themain QMS are the subject of analytical stock assessments and active management that isbased upon formalised biologically based limits, which represents a full strategy. For theremaining QMS species, the TACC system, which aims to limit the overall catch of species,combined with the ‘deemed value’ process, represents a partial strategy for these species.For others, the impact of the fishery on these species depends upon the extent to which theyare caught within the hake trawl fishery. Examining the 'main' (>5% of the catch) speciesfor each:
HAK1 (sub Antarctic)
The main retained species in this fishery are:
hoki, assessed to be above the soft limit with very high probability (>99%) andabove the target with high probability (>90%)
ling, assessed to be above the soft limit with high or very high probability (>90%)and above the target with high or very high probability (>90%)
HAK4 (Chatham Rise)
The main retained species in this fishery are:
hoki, assessed to be above the soft limit with very high probability (>99%) andabove the target with high probability (>90%)
ling, assessed to be above the soft limit with very high probability (>99%) andabove the target with high probability (>90%)
silver warehou (SWA3&4). There are no assessments available for this stock.Biomass indices from R.V. Tangaroa trawl surveys in QMAs 3 (part), 4 and 5 since1991 are variable between years and have high CVs, which limits their usefulnessfor stock assessment. However they suggest no declines in estimated biomass.Combined with the generally low levels of annual capture in the hake fishery (theaverage time series capture being skewed by a large event in one year) and patternof catches against the TACC, this suggests that the stock is highly likely to bewithin biologically based limits. However, the level of capture should be monitoredin annual audits.
HAK7 (west coast South Island)
The main retained species in this fishery are:
hoki, assessed to be above the soft limit with very high probability (>99%) andabove the target with high probability (>90%)
ling, assessed to be above the soft limit with high or very high probability (>90%)and above the target with reasonable or high probability (>60%)
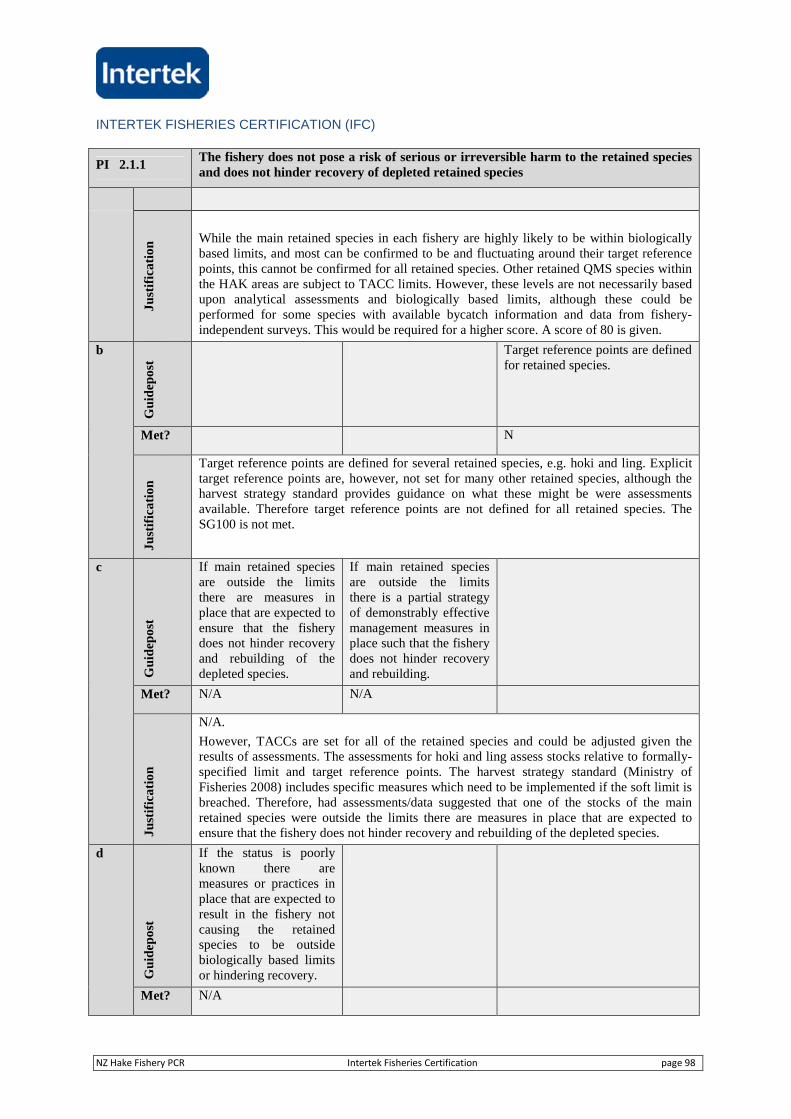
INTERTEK FISHERIES CERTIFICATION (IFC)
NZ Hake Fishery PCR Intertek Fisheries Certification page 98
PI 2.1.1The fishery does not pose a risk of serious or irreversible harm to the retained speciesand does not hinder recovery of depleted retained species
Ju
stif
ica
tio
n While the main retained species in each fishery are highly likely to be within biologicallybased limits, and most can be confirmed to be and fluctuating around their target referencepoints, this cannot be confirmed for all retained species. Other retained QMS species withinthe HAK areas are subject to TACC limits. However, these levels are not necessarily basedupon analytical assessments and biologically based limits, although these could beperformed for some species with available bycatch information and data from fishery-independent surveys. This would be required for a higher score. A score of 80 is given.
b
Gu
idep
ost
Target reference points are definedfor retained species.
Met? N
Ju
stif
ica
tio
n
Target reference points are defined for several retained species, e.g. hoki and ling. Explicittarget reference points are, however, not set for many other retained species, although theharvest strategy standard provides guidance on what these might be were assessmentsavailable. Therefore target reference points are not defined for all retained species. TheSG100 is not met.
c
Gu
idep
ost
If main retained speciesare outside the limitsthere are measures inplace that are expected toensure that the fisherydoes not hinder recoveryand rebuilding of thedepleted species.
If main retained speciesare outside the limitsthere is a partial strategyof demonstrably effectivemanagement measures inplace such that the fisherydoes not hinder recoveryand rebuilding.
Met? N/A N/A
Ju
stif
ica
tio
n
N/A.
However, TACCs are set for all of the retained species and could be adjusted given theresults of assessments. The assessments for hoki and ling assess stocks relative to formally-specified limit and target reference points. The harvest strategy standard (Ministry ofFisheries 2008) includes specific measures which need to be implemented if the soft limit isbreached. Therefore, had assessments/data suggested that one of the stocks of the mainretained species were outside the limits there are measures in place that are expected toensure that the fishery does not hinder recovery and rebuilding of the depleted species.
d
Gu
idep
ost
If the status is poorlyknown there aremeasures or practices inplace that are expected toresult in the fishery notcausing the retainedspecies to be outsidebiologically based limitsor hindering recovery.
Met? N/A
INTERTEK FISHERIES CERTIFICATION (IFC)
NZ Hake Fishery PCR Intertek Fisheries Certification page 99
PI 2.1.1The fishery does not pose a risk of serious or irreversible harm to the retained speciesand does not hinder recovery of depleted retained species
Ju
stif
ica
tio
n
N/A
ReferencesMinistry of Fisheries. 2008. Harvest Strategy Standard for New Zealand Fisheries
MPI (2013a,b,c)
OVERALL PERFORMANCE INDICATOR SCORE: The main retained species are thesubject of stock assessments and are within biologically based limits. However, not all retainedspecies are the subject of stock assessments and managed relative to reference points. Thiswould be required for a higher score.
80
CONDITION NUMBER (if relevant):
INTERTEK FISHERIES CERTIFICATION (IFC)
NZ Hake Fishery PCR Intertek Fisheries Certification page 100
Evaluation Table for PI 2.1.2
PI 2.1.2There is a strategy in place for managing retained species that is designed to ensurethe fishery does not pose a risk of serious or irreversible harm to retained species
Scoring Issue SG 60 SG 80 SG 100
a
Gu
idep
ost
There are measures inplace, if necessary, thatare expected to maintainthe main retained speciesat levels which arehighly likely to be withinbiologically based limits,or to ensure the fisherydoes not hinder theirrecovery and rebuilding.
There is a partial strategyin place, if necessary, thatis expected to maintainthe main retained speciesat levels which are highlylikely to be withinbiologically based limits,or to ensure the fisherydoes not hinder theirrecovery and rebuilding.
There is a strategy in place formanaging retained species.
Met? Y Y N
Ju
stif
ica
tio
n
TACCs are set for all of the retained species in the QMS, and the status of each QMSspecies is reviewed by the Stock Assessment Plenary. The process for providingmanagement advice involves collecting fishery-dependent and –independent data, analysingthose data using a stock assessment model, catch survey analysis or trends in biomassindices, assessing stock status relative to agreed reference points and conducting projectionsunder alternative TACCs for stocks with stock assessments, and setting a TACC, which isconsistent with the Fisheries Act 1996. This type of harvest strategy has all thecharacteristics of a system which is expected to achieve stock management objectives asreflected in the target and limit reference points.
Two of the retained species (ling, hoki) are managed using the same harvest strategy (basedon hoki). The TACCs for most of the other retained species are seldom changed, but thespecies are all monitored under the QMS, and using observer and vessel-based reporting.Management Action 28 in Annual Operational Plan aims to develop specific managementprocedures for silver warehou and white warehou; these are not yet in place although SWA1is currently managed through an adaptive management programme (noting that this overlapswith one of the areas of importance for hake) and work is planned to establish CPUE seriesfor SWA3&4, related to the hoki fishery (Annual Operational Plan for Deepwater Fisheriesfor 2012/13). There is a wider range of QMS species taken in this fishery relative to otherfisheries noted above. For these species, there is little documented evidence on thefrequency and framework for assessing the catches of minor QMS species against TACCover time, the full basis of the TACC levels set, and the relationship between these catchesand trends in the survey data, nor the decision making process behind many of the changesmade. The implementation of such a formalised management plan and process for all QMSspecies, including the development of routine monitoring of bycatch indicators currentlyplanned, would represent a strategy that would increase the score against this PI.
A score of 80 is therefore given.
b
Gu
idep
ost
The measures areconsidered likely towork, based on plausibleargument (e.g., generalexperience, theory orcomparison with similarfisheries/species).
There is some objectivebasis for confidence thatthe partial strategy willwork, based on someinformation directly aboutthe fishery and/or speciesinvolved.
Testing supports high confidencethat the strategy will work, basedon information directly about thefishery and/or species involved.
Met? Y Y N
INTERTEK FISHERIES CERTIFICATION (IFC)
NZ Hake Fishery PCR Intertek Fisheries Certification page 101
PI 2.1.2There is a strategy in place for managing retained species that is designed to ensurethe fishery does not pose a risk of serious or irreversible harm to retained species
Ju
stif
ica
tio
n
Few changes have been made to the TACCs for the main target species. However, thestocks of the main target species are all assessed to be above their target levels. There isconsequently some objective basis for confidence that the partial strategy will work, basedon some information directly about the fishery and/or species involved. However, no testingof the strategies for the retained species has been undertaken. A score of 80 is thereforegiven.
c
Gu
idep
ost
There is some evidencethat the partial strategy isbeing implementedsuccessfully.
There is clear evidence that thestrategy is being implementedsuccessfully.
Met? Y N
Ju
stif
ica
tio
n
All of the stocks of ling and hoki are currently above their target reference points and trendsin silver warehou biomass are at least flat and potentially increasing.
Observers conduct detailed monitoring of trawled catches at sea as well as operationalmeasures. In the hake/hoki/ling fishery in HAK1, 4 and 7, 16.8-30.3% of tows have beencovered by observers in 2010/11 fishing years. Reporting on the main species caught is alsorequired from vessels. This provides a comprehensive dataset for species with which toassess implementation of catch management strategies for these species. There is clearevidence, based on this information, that the strategy for managing main retained species isbeing implemented successfully, through the stock assessments and variations in TACC thatresult where required. Alternative strategies have been applied for other species, includingthe adaptive management approach for SWA1 and SPE3, and changes to the deemed valuerate for SWA 3&4. However, for other species of key interest changes in the TACC ordeemed value have not been reported despite catches exceeding the TACC level in recentyears. For many species, the phrase used within the Plenary document is "Estimates ofcurrent and reference biomass are not available for any [species] stocks and therefore it isnot known if current TACCs and recent catches are sustainable or whether they are at levelswhich will allow the stocks to move towards a size that will support the maximumsustainable yield". This indicates that the strategy is not formally applied to all the otherQMS species. A score of 80 is given. However, the increasing use of the survey time seriesto support indications of stock status is noted as a positive development. Continued surveyswithin HAK7 would further support this.
d
Gu
idep
ost
There is some evidence that thestrategy is achieving its overallobjective.
Met? N
Ju
stif
ica
tio
n
Regular updates of stock assessments underlying harvest strategies for the main speciesoccur to include new information and TACCs are reviewed regularly. With these tools andprocesses, there is therefore some evidence that the strategy is achieving its overallobjective for main species, but the effectiveness for the minor QMS species is not clear andas noted, supporting evidence for stock levels is not always available. The SG100 level isnot met.
e
Gu
idep
ost
It is likely that sharkfinning is not takingplace.
It is highly likely thatshark finning is not takingplace.
There is a high degree of certaintythat shark finning is not takingplace.
INTERTEK FISHERIES CERTIFICATION (IFC)
NZ Hake Fishery PCR Intertek Fisheries Certification page 102
PI 2.1.2There is a strategy in place for managing retained species that is designed to ensurethe fishery does not pose a risk of serious or irreversible harm to retained species
Met? Y Y Y
Ju
stif
ica
tio
n
Shark finning, as defined by the MSC standard, is "The practice of removing any of the finsof a shark (including the tail) while at sea and discarding the remainder of the shark at sea".Under current provisions of the Animal Welfare Act 1999, it is an offence to willfully ill-treat an animal. It is considered that the practice of removing the fins from a shark andreturning it to the sea while still alive fits within the definition of ill-treating an animal.
All retained shark species are within the QMS, and hence are required to be retained onboard: “No commercial fisherman shall return to or abandon in the sea or any other watersany fish, aquatic life, or seaweed of legal size, or for which no legal size is set, that issubject to the quota management system (See Fisheries Act 1996, s 72(1))”. The exceptionis Schedule 6 species, detailed in the Fisheries Act 1996. This lists species and stocks whichmay be returned to the sea in accordance with stated requirements. For fish species listed onthis schedule, the requirements include that the individual be likely to survive on return tothe sea, and that the return takes place as soon as practicable after the take. Spiny dogfishhave a unique status on Schedule 6, in that they are allowed to be returned to the sea eitheralive or dead as long as they are reported and counted against Annual Catch Entitlement.This allows operators to choose whether to land spiny dogfish or return them to the sea. Atthe time this provision was implemented there were limited markets for spiny dogfish andthe management objective was to set catch limits and ensure that there was full reportingagainst those limits. The provision of choice to fishers aimed to mitigate costs associatedwith landing spiny dogfish and possibly needing to dispose of them on land. This approachwas expected to result in better reporting of spiny dogfish catches by reducing the incentiveto illegally dump and not report catches. Without accurate reporting, appropriatemanagement settings for this fishery could not be established.
Since the NPOA-sharks 2008, school shark (Galeorhinus galeus), has been added toSchedule 6, an extremely rare bycatch in hake fisheries (<0.01% of catch weight).
The Deepwater Group has implemented a number of principles in order to optimize theapplicability of the NPOA sharks of banning shark finning consistent with the MSCdefinition. The new NPOA-sharks which has now been finalised, has one specific objectiveof eliminating shark finning in New Zealand fisheries (Objective 2.4). As noted in thatdocument, within the deepwater fishery as a whole, excluding spiny dogfish, 97.4% of QMSsharks were fully utilised or released. Half of all deepwater spiny dogfish catch was fullyutilised, with the remainder returned to the sea under Schedule 6 provisions.
The information available is supported by the 16-30% of trawls monitored by observers in2010/11 in the HAK/HOK/LIN trawl fishery. MPI note that the catch balancing systemensures that nothing is landed that isn’t reported, and that sharks were confirmed to bereturned to the water whole. A score of 100 is given.
References
Ramm, 2012
MPI, 2013b
MPI, 2013d
Observer species catch records, 2007/08 to 2011/12
Interview with MPI
Ballara et al., 2010
MPI 2012c
MPI 2013a, b, c
OVERALL PERFORMANCE INDICATOR SCORE: All of the scoring issues for the 60 and80 scoring guidepost are met as is one of four 100 scoring guideposts. The resultant score is 85.
85
CONDITION NUMBER (if relevant): NA

INTERTEK FISHERIES CERTIFICATION (IFC)
NZ Hake Fishery PCR Intertek Fisheries Certification page 103
INTERTEK FISHERIES CERTIFICATION (IFC)
NZ Hake Fishery PCR Intertek Fisheries Certification page 104
Evaluation Table for PI 2.1.3
PI 2.1.3Information on the nature and extent of retained species is adequate to determine therisk posed by the fishery and the effectiveness of the strategy to manage retainedspecies
Scoring Issue SG 60 SG 80 SG 100
a
Gu
idep
ost
Qualitative informationis available on theamount of main retainedspecies taken by thefishery.
Qualitative informationand some quantitativeinformation are availableon the amount of mainretained species taken bythe fishery.
Accurate and verifiableinformation is available on thecatch of all retained species andthe consequences for the status ofaffected populations.
Met? Y Y N
Ju
stif
ica
tio
n
Data on catch rates and the relative abundance of non-target catch species in the fishery areavailable from three main sources:
The TCEPR (Trawl catch, effort and processing return) forms, which providegreen-weight catch totals for the top five species (dependent on vessel size andfishing method) on a fishing-event basis, and daily summary of TACC speciescaught.
The MPI fisheries observer data, which provides catch weight for all QMS andnon-QMS species caught, on an observed tow-by-tow basis. This provides accurateand verifiable information (if on variable and patchy coverage). The observersmonitored around 16-30% of trawls in 2010/11 in the HAK/HOK/LIN trawlfishery.
Fishery independent trawl surveys on the Chatham Rise and Sub-Antarctic regions,and much less frequently the west coast South Island region, provide abundanceestimates of finfish, cartilaginous fish, and squid species, as well as catch weightsof macroinvertebrates. Further inshore surveys also provide some information onTACC stocks.
Data on removals of all retained species are collected and are available are summarized inthe report of the Stock Assessment Plenary (Ministry of Fisheries 2011). Thus, somequantitative information is available on the amount of main retained species taken by thefishery. However, due to lack of knowledge of population parameters of all species acrossthe geographic regions of interest, consequences for the status of all affected populationscannot be assessed as required at the SG100 level. A score of 80 is given.
B
Gu
idep
ost
Information is adequateto qualitatively assessoutcome status withrespect to biologicallybased limits.
Information is sufficientto estimate outcomestatus with respect tobiologically based limits.
Information is sufficient toquantitatively estimate outcomestatus with a high degree ofcertainty.
Met? Y Y N
Ju
stif
ica
tio
n
The stocks of hoki and ling are assessed using the CASAL modelling platform. Theseassessments make use of indices of abundance from trawl surveys, catch-rate indices, aswell as age and length composition data. Trends in abundance from surveys are alsoavailable for some other retained species, combined with observer coverage, provideindependent monitoring of landed catch. Thus, information is sufficient to estimate outcomestatus with respect to biologically based limits.
However, not all of the retained species are indexed well by surveys and trends in catch-rateindices may not always be plausible. While a number of research projects are eitherunderway or are planned which could increase the information base for the retained species,currently the sustainability of some TACC levels is unknown. Therefore it cannot be saidthat information is sufficient to quantitatively estimate outcome status with a high degree ofcertainty. A score of 80 is therefore given.
INTERTEK FISHERIES CERTIFICATION (IFC)
NZ Hake Fishery PCR Intertek Fisheries Certification page 105
PI 2.1.3Information on the nature and extent of retained species is adequate to determine therisk posed by the fishery and the effectiveness of the strategy to manage retainedspecies
c
Gu
idep
ost
Information is adequateto support measures tomanage main retainedspecies.
Information is adequate tosupport a partial strategyto manage main retainedspecies.
Information is adequate to supporta strategy to manage retainedspecies, and evaluate with a highdegree of certainty whether thestrategy is achieving its objective.
Met? Y Y Y (HAK1 & 4), N (HAK7)
Ju
stif
ica
tio
n
The Harvest Strategy Standard provides a basis for a comprehensive strategy to manageretained species and there are survey results, length composition information, and catch-ratedata. In addition, in the hake/hoki/ling fishery in HAK1, 4 and 7, 16.8-30.3% of tows havebeen covered by observers in 2010/11 fishing year. This coverage provides independentmonitoring of fishery operations and catch characteristics. Many of these data are used toinvestigate and analyse fishery performance against strategic and management objectives.Combined with the regular trawl surveys undertaken in HAK1 and HAK4, informationbeing collected is adequate to support a comprehensive strategy to manage retained species,and evaluate with a high degree of certainty whether the strategy is achieving its objective,and a score of 100 is given. The current lack of trawl survey time series for HAK7 thatallows a time series of relative abundance to be developed means that in this area,information is adequate to support a partial strategy. A score of 80 is given.
d
Gu
idep
ost
Sufficient data continueto be collected to detectany increase in risk level(e.g. due to changes in theoutcome indicator scoreor the operation of thefishery or theeffectiveness of thestrategy)
Monitoring of retained species isconducted in sufficient detail toassess ongoing mortalities to allretained species.
Met? Y Y
Ju
stif
ica
tio
n
Observer monitoring and catch reporting is extensive, both in terms of placements onvessels and coverage of tows (see above). Vessel-based logbook reporting also occurs forthe main species caught. Thus, monitoring of retained species is conducted in sufficientdetail to assess ongoing mortalities of all retained species. A score of 100 is given.
References
MPI, 2013a, b, c
Bagley et al., 2013
Ballara et al., 2010
O'Driscoll et al., 2011
MPI (2012a)
OVERALL PERFORMANCE INDICATOR SCORE: All of the scoring issues for the 60 and80 scoring guidepost are met in all regions. One of four for the 100 scoring guidepost is metwithin area HAK7, and the resultant score is 85. Two of the four for the 100 scoringguidepost are met within HAK1 and HAK4, and the resultant score is 90.
90 (HAK1 and 4)
85(HAK7)
CONDITION NUMBER (if relevant): NA
INTERTEK FISHERIES CERTIFICATION (IFC)
NZ Hake Fishery PCR Intertek Fisheries Certification page 106
Evaluation Table for PI 2.2.1
PI 2.2.1The fishery does not pose a risk of serious or irreversible harm to the bycatch speciesor species groups and does not hinder recovery of depleted bycatch species or speciesgroups
Scoring Issue SG 60 SG 80 SG 100
a
Gu
idep
ost
Main bycatch species arelikely to be withinbiologically based limits(if not, go to scoringissue b below).
Main bycatch species arehighly likely to be withinbiologically based limits(if not, go to scoring issueb below).
There is a high degree of certaintythat bycatch species are withinbiologically based limits.
Met? Y Y N
Due to the lack of information on status for non QMS species, we have taken the followingapproach. The main bycatch species are defined as those considered to represent >5% of thecatch, or as being particularly vulnerable (e.g. non-QMS elasmobranch species). For thepurposes of this assessment, we have therefore assumed that a species may be at risk wherethey represent >5% of the total catch, or are caught at levels greater than 10 tonnes per yearwhere this species is considered of low productivity. We recognise that a species may havelow abundance and high catchability, which may lead to incorrect estimation of status usingthese criteria. This is picked up under PI 2.2.2. This approach is comparable to that takenunder P1, in separating the determination of outcome from the management andinformation. All interactions with birds, marine mammals etc. are considered under 2.3.
Observers present on vessels record and estimate the weight of all species brought on board,while vessel logbooks also record these species if they are among the most frequent specieswithin the catch. Monitoring bycatch and addressing significant levels of catch represents apartial strategy, based upon the review of potential QMS status (see 2.2.2).
There are no main (>5% of the catch weight) bycatch species within the HAK1, 4 or 7targeted fisheries, based upon observer records. Javelinfish and rattails constitute the largestproportions of the observed catch (up to 1-3% over the last few years).
HAK1
With respect to potentially vulnerable non-QMS species in this region, this includesleafscale gulper shark (Centrophorus squamosus). Interactions with basking sharks arecovered under 2.3. Bycatches of leafscale gulper shark were low and showed no consistenttrend.
HAK4
There are no major non-QMS bycatch species based on low productivity criteria, all being<10 tonnes per annum based upon the observer data and coverage.
HAK7
With respect to potentially vulnerable non-QMS species in this region, this includes sealshark (Dalatias licha), leafscale gulper shark (Centrophorus squamosus) and shovelnosedogfish (Deania calcea). Examining bycatch rates showed no trends in these species(Ballara et al., 2010).
INTERTEK FISHERIES CERTIFICATION (IFC)
NZ Hake Fishery PCR Intertek Fisheries Certification page 107
PI 2.2.1The fishery does not pose a risk of serious or irreversible harm to the bycatch speciesor species groups and does not hinder recovery of depleted bycatch species or speciesgroups
Ju
stif
ica
tio
n
The 2010 ERA for related hoki fisheries (Boyd 2011) concluded that impacts on deepwatersharks and rays were negligible-minor (although the confidence in this conclusion was‘low’), and deepwater dogfish was minor-moderate (although the confidence in thisconclusion was ‘low’). Given the trends in bycatch levels and survey indices available, andthe relatively small catches considered, it reasonable to conclude the main vulnerablespecies are highly likely (probability> 0.7) to be within biologically based limits. However,given the large number of bycatch species and the difficulty monitoring many of these, it isnot possible to draw conclusions regarding all bycatch species in each UoC with a highdegree of certainty, as required at the SG100 level. A score of 80 is given.
b
Gu
idep
ost
If main bycatch speciesare outside biologicallybased limits there aremitigation measures inplace that are expected toensure that the fisherydoes not hinder recoveryand rebuilding.
If main bycatch speciesare outside biologicallybased limits there is apartial strategy ofdemonstrably effectivemitigation measures inplace such that the fisherydoes not hinder recoveryand rebuilding.
Met? N/A N/A
Ju
stif
ica
tio
n
N/A
c
Gu
idep
ost
If the status is poorlyknown there aremeasures or practices inplace that are expected toresult in the fishery notcausing the bycatchspecies to be outsidebiologically based limitsor hindering recovery.
Met? N/A
Ju
stif
ica
tio
n
N/A.
However, if a sustainability problem is detected, a species can be added to the QMS and/orthe species managed under Section 11 of the Act. However, it is difficult to detect whetherthere is a sustainability concern for many of the bycatch species.
References
Ballara et al., 2010
Bagley et al., 2013
Bagley and O'Driscoll, 2012
Blackwell, R.G., 2010
O'Driscoll et al., 2011
OVERALL PERFORMANCE INDICATOR SCORE: The score is 80 because all of thescoring issues for 80 scoring guidepost are met, but none for the 100 scoring guidepost.
80
INTERTEK FISHERIES CERTIFICATION (IFC)
NZ Hake Fishery PCR Intertek Fisheries Certification page 108
PI 2.2.1The fishery does not pose a risk of serious or irreversible harm to the bycatch speciesor species groups and does not hinder recovery of depleted bycatch species or speciesgroups
CONDITION NUMBER (if relevant): NA
Evaluation Table for PI 2.2.2
PI 2.2.2There is a strategy in place for managing bycatch that is designed to ensure the fisherydoes not pose a risk of serious or irreversible harm to bycatch populations
Scoring Issue SG 60 SG 80 SG 100
a
Gu
idep
ost
There are measures inplace, if necessary, thatare expected to maintainthe main bycatch speciesat levels which arehighly likely to be withinbiologically based limits,or to ensure the fisherydoes not hinder theirrecovery and rebuilding.
There is a partial strategyin place, if necessary, thatis expected to maintainthe main bycatch speciesat levels which are highlylikely to be withinbiologically based limits,or to ensure the fisherydoes not hinder theirrecovery and rebuilding.
There is a strategy in place formanaging and minimizing bycatch.
Met? Y Y N
Ju
stif
ica
tio
n
There are no bycatch species considered to be ‘main’ bycatch species in this fishery on thebasis of the weight of catch (<5%), although specific 'vulnerable' species are discussedunder 2.1.1. Ongoing monitoring of trawl catches through the observer programme providesongoing data monitoring.
The QMS Introduction Process Standard is one of the ways to give effect to the Ministry’sstatutory requirements for sustainability of species caught. This approach limits catch,which may also limit fishing effort. Species outside the QMS system tend to be consideredas low risk of being caught unsustainably. Substantial catches of non-QMS species tends tolead to the establishment of their QMS status. Furthermore, the framework of continualmonitoring of bycatch catches through the observer programme, and the noting of speciescatches within vessel logbooks if they represent the most frequent species caught in afishing event, provides a basis for simple assessments of the impact of the fishery on thesespecies or species groups. Once included in the QMS, reports have to be produced for suchspecies, and TACCs could be adjusted to ensure that the stock remains above the soft limit.
There is increasing evidence of continued monitoring of non-QMS species through theobserver data (all regions) and available survey time series (primarily HAK1 and HAK4).Continued monitoring and quantification of bycatch is also a key management objective ofthe National deepwater plan 2012-13 (MO2.1), with activities including the accuratereporting of bycatch information through observer programmes, with a focus on identifyingdeepwater shark species (Action #16), while Action #30 describes monitoring catches ofand assessing risks to non-QMS (Tier 3) species from deepwater fishing activity.Completion and action on the findings of these activities for the fishery under certificationwould demonstrate a cohesive strategy.
Combined with the QMS Introduction Process Standard and associated activities, this formsa partial but developing strategy for managing bycatch. A score of 80 is given.
b
Gu
idep
ost
The measures areconsidered likely towork, based on plausibleargument (e.g. generalexperience, theory orcomparison with similarfisheries/species).
There is some objectivebasis for confidence thatthe partial strategy willwork, based on someinformation directly aboutthe fishery and/or speciesinvolved.
Testing supports high confidencethat the strategy will work, basedon information directly about thefishery and/or species involved.
INTERTEK FISHERIES CERTIFICATION (IFC)
NZ Hake Fishery PCR Intertek Fisheries Certification page 109
PI 2.2.2There is a strategy in place for managing bycatch that is designed to ensure the fisherydoes not pose a risk of serious or irreversible harm to bycatch populations
Met? Y Y N
Ju
stif
ica
tio
n
Adding a species to the QMS allows catches of the species to be restricted. Catches aregenerally below TACCs, especially for lower value non-target species. A system of deemedvalues is used to deter or deal with catches over quota and this has been adjusted for specificretained species/stocks to address overfishing. There are other ways to handle over catch byindividual operators, e.g. purchase of quota from other quota holders.
Components of the QMS framework are regularly reviewed, based on species harvestsrecorded and any other significant new information.
The strategy has been tested through various species being incorporated into the QMS andrepresents an explicit part of the management framework for hake. No apparent collapseshave been identified through examination of survey time series. However, as noted withinthe Plenary document, there is no fully objective basis for confidence that the TACCs for allminor QMS species are set within biologically based limits and hence the strategy cannot besaid to be fully tested. A score of 80 is given.
c
Gu
idep
ost
There is some evidencethat the partial strategy isbeing implementedsuccessfully.
There is clear evidence that thestrategy is being implementedsuccessfully.
Met? Y N
Ju
stif
ica
tio
n
As species have moved from bycatch to QMS status within the fishery, they have beensubject to more formalised monitoring and must be retained on board vessels. Two recentexamples of species introduced through the QMS Introduction Process Standard arePatagonian toothfish and attached bladder kelp. The Patagonian toothfish was introducedbecause MPI recognised that continued management outside the QMS (as an open-accessfishery) could lead to an unsustainable increase in catch over a relatively short timeframe.Attached bladder kelp was introduced firstly to ensure the sustainable use of this resource,and secondly to prevent future sustainability concerns that could arise from unrestricted use.A further example is prawn killer, which is a bycatch species in other fisheries, but whoseaddition to the QMS was recommended on a precautionary basis given uncertainty overabundance, yield or stock status. There is clear evidence that the strategy is beingimplemented successfully for main bycatch species but not for all bycatch species A scoreof 100 is therefore given.
d
Gu
idep
ost
There is some evidence that thestrategy is achieving its overallobjective.
Met? N
Ju
stif
ica
tio
n
The strategy appears to be achieving its objective, in that the Standard is followed and newspecies are brought under the QMS framework, facilitating closer and more formalmanagement of sustainability issues. The strategy is not for ALL bycatch species A score of100 is notgiven.
References
Ministry of Fisheries 2005
Ministry of Fisheries 2010a,b
Ministry of Fisheries, 2008b, c
MPI 2013a, b, c
INTERTEK FISHERIES CERTIFICATION (IFC)
NZ Hake Fishery PCR Intertek Fisheries Certification page 110
PI 2.2.2There is a strategy in place for managing bycatch that is designed to ensure the fisherydoes not pose a risk of serious or irreversible harm to bycatch populations
OVERALL PERFORMANCE INDICATOR SCORE: All of the scoring issues for the 60 and80 scoring guidepost are met in all regions. None of the four 100 scoring guideposts are met,and the resultant score is 80
80
CONDITION NUMBER (if relevant): NA
INTERTEK FISHERIES CERTIFICATION (IFC)
NZ Hake Fishery PCR Intertek Fisheries Certification page 111
Evaluation Table for PI 2.2.3
PI 2.2.3Information on the nature and the amount of bycatch is adequate to determine the riskposed by the fishery and the effectiveness of the strategy to manage bycatch
Scoring Issue SG 60 SG 80 SG 100
a
Gu
idep
ost
Qualitative informationis available on theamount of main bycatchspecies taken by thefishery.
Qualitative informationand some quantitativeinformation are availableon the amount of mainbycatch species taken bythe fishery.
Accurate and verifiableinformation is available on thecatch of all bycatch species and theconsequences for the status ofaffected populations.
Met? Y Y N
Ju
stif
ica
tio
n
There are no species considered to be “main” bycatch species by weight in this fishery,although specific 'vulnerable' species are discussed under 2.1.1. An increasing number ofstudies have examined and summarized trends in abundance of non-target species fromtrawl surveys for the Chatham Rise and sub-Antarctic region, and compared the disjointedtime series for the west coast South Island. However, survey information is not available forall regions of the fishery and some bycatch species are not well monitored by the surveysundertaken. Observer records of catches are also evaluated; this programme provides for theproduction of estimates of bycatch by quota area. The precision of the estimates depends onthe level of observer coverage. Therefore, while qualitative information and somequantitative information is available on the main bycatch species affected by the fishery, itis not possible to evaluate the consequences of fishing activities on all bycatch speciespopulations in each of the areas. A score of 80 is given.
b
Gu
idep
ost
Information is adequateto broadly understandoutcome status withrespect to biologicallybased limits
Information is sufficientto estimate outcomestatus with respect tobiologically based limits.
Information is sufficient toquantitatively estimate outcomestatus with respect to biologicallybased limits with a high degree ofcertainty.
Met? Y Y N
Ju
stif
ica
tio
n
There are no species considered to be “main” bycatch species by weight in this fishery. Themain vulnerable species caught in bycatch are monitored on the through available trawlsurveys, noting that the survey in the WCSI provides a very limited time series. It is notedthat the 10 year research plan includes a combined trawl/acoustic survey on the WCSI.
To date, negative trends in abundance have not been detected in any of the surveys. On thisbasis, information is sufficient to estimate relative abundance, as a proxy for outcome withrespect to biologically-based limits in combination with estimates of species productivity.However, although observer reporting provides high quality information on trawl catchesand trawl survey data supplements this in HAK1 and HAK4 (while an increasing time seriesin HAK7 will develop in the future), information available on population parameters is notsufficient to quantitatively estimate outcome status for bycatch species with respect tobiologically-based limits with a high degree of certainty. A score of 80 is therefore given.
c
Gu
idep
ost
Information is adequateto support measures tomanage bycatch.
Information is adequate tosupport a partial strategyto manage main bycatchspecies.
Information is adequate to supporta strategy to manage bycatchspecies, and evaluate with a highdegree of certainty whether thestrategy is achieving its objective.
Met? Y Y Y

INTERTEK FISHERIES CERTIFICATION (IFC)
NZ Hake Fishery PCR Intertek Fisheries Certification page 112
PI 2.2.3Information on the nature and the amount of bycatch is adequate to determine the riskposed by the fishery and the effectiveness of the strategy to manage bycatch
Ju
stif
ica
tio
n
The primary source of bycatch information is through the observer programme. In thehake/hoki/ling fishery in HAK1, 4 and 7, 16.8-30.3% of tows have been covered byobservers in 2010/11 fishing year. In addition to data collection by observers, there is alsovessel-based reporting of species caught where those catches are significant. Whencombined with information collected through trawl surveys, a significant body of data isavailable to support a comprehensive strategy to manage bycatch, and evaluate whether thisstrategy is achieving its objective. A score of 100 is given.
d
Gu
idep
ost
Sufficient data continueto be collected to detectany increase in risk tomain bycatch species(e.g., due to changes inthe outcome indicatorscores or the operation ofthe fishery or theeffectiveness of thestrategy).
Monitoring of bycatch data isconducted in sufficient detail toassess ongoing mortalities to allbycatch species.
Met? Y Y (HAK1, HAK4) N (HAK7)
Ju
stif
ica
tio
n
The data collected from surveys are generally sufficient to cover the major areas of thefishery (Chatham Rise & sub-Antarctic), but the time series in west coast South Island isnotably limited. In combination with the ongoing observer coverage and actions detailed inthe Annual Operational Plan for the fishery, this is sufficient to detect increases in risk to themain bycatch species. That said, the precision of estimates for particular bycatch specieswithin the trawl surveys, in particular the WCSI, is more limited. This will improve withfurther surveys in this area.
A score of 100 is given for HAK1 and HAK4, and a score of 80 is given for HAK7,reflecting the reduced information from fishery-independent surveys in this area whichwould help support monitoring of additional unobserved mortalities as required at theSG100 level.
References
Ballara et al., 2010
Bagley et al., 2013
Ramm, 2012
O'Driscoll et al., 2011
OVERALL PERFORMANCE INDICATOR SCORE: All of the scoring issues for the 60and 80 scoring guidepost are met in all regions. Two of the four 100 scoring guideposts aremet for HAK1 and HAK4, and the resultant score is 90. One of the four 100 scoringguideposts are met for HAK7, and the resultant score is 85
90 (HAK1, HAK4)85(HAK7)
CONDITION NUMBER (if relevant): NA
INTERTEK FISHERIES CERTIFICATION (IFC)
NZ Hake Fishery PCR Intertek Fisheries Certification page 113
Evaluation Table for PI 2.3.1
PI 2.3.1The fishery meets national and international requirements for the protection of ETPspecies. The fishery does not pose a risk of serious or irreversible harm to ETP speciesand does not hinder recovery of ETP species
Scoring Issue SG 60 SG 80 SG 100
a
Gu
idep
ost
Known effects of thefishery are likely to bewithin limits of nationaland internationalrequirements forprotection of ETPspecies.
The effects of the fisheryare known and are highlylikely to be within limitsof national andinternational requirementsfor protection of ETPspecies.
There is a high degree of certaintythat the effects of the fishery arewithin limits of national andinternational requirements forprotection of ETP species.
Met? Y Y Y
INTERTEK FISHERIES CERTIFICATION (IFC)
NZ Hake Fishery PCR Intertek Fisheries Certification page 114
PI 2.3.1The fishery meets national and international requirements for the protection of ETPspecies. The fishery does not pose a risk of serious or irreversible harm to ETP speciesand does not hinder recovery of ETP species
Ju
stif
ica
tio
n
The Fisheries Act specifies that associated or dependent species should be maintained abovea level that ensures their long-term viability and that biological diversity of the aquaticenvironment should be maintained. Further, in the absence of a population managementplan, the Minister of Fisheries may, after consultation with the Minister of Conservation,take such measures as s/he considers are necessary to avoid, remedy, or mitigate the effectof fishing-related mortality on any protected species. Thus, accidental and incidentalcaptures of legally protected species by permitted commercial fisheries operations are notprohibited in New Zealand. Captures must be reported to the Ministry of Fisheries on amandatory form (Compliance Information Sheet 8), and the long-term aim is to minimisemortalities where possible. This provides good information on the potential effects of thefishery on ETP species.
It is also noted that the NPOA-Seabirds requires that seabird species identified as at veryhigh or high risk of having commercial fisheries bycatch exceed population sustainabilitylimits should be managed to a lower risk category by 2018. The new NPOA-sharks alsospecifies a risk-based approach to identifying and managing impacts on sharks.
Trawl vessels over 28 m in length are also required to deploy specified mitigation measuresto reduce seabird captures; compliance with these measures is assessed by governmentobservers. Occasionally, the New Zealand government will identify a maximum allowablemortality level for protected species in accordance with legislative provisions. No specificlimits on interactions have been set in the hake fishery; the activities aimed at minimisinginteractions are underway. It is noted that the interaction rate will be population sizedependent and therefore there is a need to explicitly consider population size estimates toevaluate unacceptable impact levels.
CITES Appendix 1 includes the Basking shark, which is also legally protected in NewZealand fisheries waters. The Agreement for the Conservation of Albatrosses and Petrels(ACAP) covers 29 species of these seabirds, the majority of which occur in New Zealandwaters (and are legally protected). This Agreement requires New Zealand to take measuresto achieve and maintain a favourable conservation status for albatrosses and petrels.
Good observer coverage and reporting within the hake fishery mean that the effects of thefishery are known and estimable, in terms of bycatch of ETP species and implementation ofsustainability measures (e.g. deployment of mitigation devices) required. Observers identifyand photograph all protected species landed dead. They also return most protected specieslanded dead for expert identification onshore. Focused coverage can be implemented toimprove knowledge where additional information is required for management. Theseinclude protection and monitoring of bird and mammal breeding sites. Data collected aresubjected to appropriate exploratory and/or quantitative analyses, e.g. monitoringpopulations, modelling population parameters, the Ecological Risk Assessment, and a level2 risk assessment (for seabirds). Limits focus on sustainability and minimising incidentalcatch of ETP species. Regular (annual) estimates of interactions of fisheries with ETPspecies are developed raising observer information up to the level of the fishery.
Through these approaches, the risk assessment for birds, existing population estimates forkey ETP species allow the current interaction rates to be viewed in relation to national andinternational requirements with a high degree of certainty, and are highly likely to be withinlimits of national and international requirements. A score of 100 is given.
b
Gu
idep
ost
Known direct effects areunlikely to createunacceptable impacts toETP species.
Direct effects are highlyunlikely to createunacceptable impacts toETP species.
There is a high degree ofconfidence that there are nosignificant detrimental directeffects of the fishery on ETPspecies.
Met? Y Y Y
The hake-targeted fishery is a sub-set of the hoki- and ling-targeted fishery, hake-targetedtrawls representing ~ 10% of the total.
INTERTEK FISHERIES CERTIFICATION (IFC)
NZ Hake Fishery PCR Intertek Fisheries Certification page 115
PI 2.3.1The fishery meets national and international requirements for the protection of ETPspecies. The fishery does not pose a risk of serious or irreversible harm to ETP speciesand does not hinder recovery of ETP species
Birds
Observer reports of bird kills within the hake fishery have varied over time, and by HAKarea. Numbers available from the observer programme focus on warp-strike events (allgears), hooking (longliners), as well as trawl-net interactions, and less on deck-strikes, sincethe former events were the most common prior to the implementation of mitigationmeasures. It is recommended that the recording of deck-strike and in particular trawl netinteractions continue to be improved. Conservative population estimates are: sootyshearwaters around 5 million adult pairs; white-capped albatross around 100,000 pairs;Buller’s albatross around 13,635 pairs; Salvin’s albatross around 31,000 pairs. When takingthe overall mortalities within the fishery into account, the Buller’s (southern) albatross iswithin the ‘moderate-high’ risk category and both Salvin’s albatross and white-chinnedpetrel within the ‘moderate’ risk category. Based upon these numbers and the catch rate inthe hake trawl fishery, the effects of the trawl fishery appear highly likely to be withinnational limits. This is supported by the risk assessment for birds, which indicated thatannual potential seabird fatalities within the deepwater trawl complex were between 1% and50% of the PBR. Seabird captures in the hake fishery account for approximately 3% ofseabirds caught in New Zealand offshore trawl fisheries in 2007/08 and 2008/09.
Marine mammals
Interactions between the hake fishery and marine mammals are typically with fur seals. Inthe past few years, interactions have varied between HAK areas. HAK1: no mortalitiesestimated in 2008-09, two in the previous year. HAK4: five mortalities estimated in 2008-09, three in the previous year. HAK7: (west coast South Island), greater numbers ofinteractions estimated, being 48 in 2007-08 (model estimates ranging between 34-70) and22 (9-44) in 2008-09. Populations are monitored, and estimates of total New Zealandpopulation sizes, and number of breeding colonies are generally increasing; total populationestimates around New Zealand exceed 50,000 adults and are thought to be expandingfollowing direct historical exploitation. However there remains some uncertainty overpopulation status in the WCSI. Overall population growth suggests that mortalities in HAK1and HAK4 are highly unlikely to directly affect the increasing population, althoughcontinued study is warranted. While catch rates are higher in HAK7, total interaction ratesare within precautionary estimated PBR levels for this region. Common dolphin interactionsare primarily within the mackerel trawl fishery, and negligible in the fishery undercertification.
Fish
Observed interactions of basking sharks with the hake fishery have been limited to theSouthland–Auckland Islands area (southerly part of HAK1), with 3 captures within twoevents in 2003-04, representing 3% of the total observed captures. Further individualinteractions were noted in recent years. These one-off events, while unfortunate, are highlyunlikely to lead to unacceptable impacts.
Ju
stif
ica
tio
n
Cold water corals
Observer data shows that protected cold water corals are brought up in trawls in the areasunder certification, and reported interactions within the hake fishery have been detailed inthe main text. These represented 0.3%, 1.3%, 0.3% and 2% of the noted interactions acrossfisheries. Recent reports indicated that the hake/hoki/ling fishery did not pose a great risk tocoral.
A score of 100 is therefore given.
INTERTEK FISHERIES CERTIFICATION (IFC)
NZ Hake Fishery PCR Intertek Fisheries Certification page 116
PI 2.3.1The fishery meets national and international requirements for the protection of ETPspecies. The fishery does not pose a risk of serious or irreversible harm to ETP speciesand does not hinder recovery of ETP species
c
Gu
idep
ost
Indirect effects have beenconsidered and arethought to be unlikely tocreate unacceptableimpacts.
There is a high degree ofconfidence that there are nosignificant detrimental indirecteffects of the fishery on ETPspecies.
Met? Y N
Ju
stif
ica
tio
n
Indirect effects are being managed through attempts to limit the discharge of offal throughVessel Management Plans. Offal provides food for birds and, to a lesser extent, marinemammals. It is therefore unlikely that indirect effects will create unacceptable impacts.Indirect effects on ETP species are subject to ongoing review by DOC as part of the MarineConservation Services Programme.
References
Abraham and Thompson 2011b
Thompson et al., 2013a, b
Thompson et al., 2010
Richards et al., 2011
Richards and Abraham, 2013a; 2013b
Francis and Smith, 2010
Baird et al., 2012
Baird, 2011
Ministry of Fisheries Compliance Information sheet 8
New Zealand Gazette 2010
www.acap.aq
DOC, 2012
Baker et al., 2009
Hamilton and Baker, 2010
Thompson et al., 2013
Baird, 2008
OVERALL PERFORMANCE INDICATOR SCORE: All of the scoring issues for the 60 and80 scoring guidepost are met in all regions. Two of the three 100 scoring guideposts are met
95
CONDITION NUMBER (if relevant): NA
INTERTEK FISHERIES CERTIFICATION (IFC)
NZ Hake Fishery PCR Intertek Fisheries Certification page 117
Evaluation Table for PI 2.3.2
PI 2.3.2
The fishery has in place precautionary management strategies designed to: Meet national and international requirements; Ensure the fishery does not pose a risk of serious harm to ETP species; Ensure the fishery does not hinder recovery of ETP species; and Minimise mortality of ETP species.
Scoring Issue SG 60 SG 80 SG 100
a
Gu
idep
ost
There are measures inplace that minimisemortality of ETP species,and are expected to behighly likely to achievenational and internationalrequirements for theprotection of ETPspecies.
There is a strategy inplace for managing thefishery’s impact on ETPspecies, includingmeasures to minimisemortality, which isdesigned to be highlylikely to achieve nationaland internationalrequirements for theprotection of ETPspecies.
There is a comprehensive strategyin place for managing the fishery’simpact on ETP species, includingmeasures to minimise mortality,which is designed to achieveabove national and internationalrequirements for the protection ofETP species.
Met? Y Y N
Key legislation for ETP species includes the Fisheries Act (1996), Wildlife Act (1953),Marine Mammals Protection Act (1978), and specific regulations for birds (relating tobycatch mitigation approaches). Combined with the requirement to report injury ormortality of protected species to the Department of Conservation without offence, and theobserver programme on board trawlers, these provide a strategy to monitor the fishery andhence implement the legislation. An environmental risk assessment process has beenperformed to support the revision of New Zealand’s NPOA – Seabirds, by identifying thosespecies most under pressure from additional mortality above natural levels. A new NPOAsharks has been finalised and is publically available.
General mitigation approaches for trawlers, supported through legislation, include voluntaryindustry-led codes of practice. These include individual vessels developing a VesselManagement Plan, which covers methodologies to limit offal discharge during periods ofvulnerability for birds, and which are audited by MPI observers. This approach allowsmitigation methods to be adapted to the particulars of vessel operations, but as a result maybe unable to eliminate interactions. In turn, regulations require the use of one of threepotential bird scaring devices: paired streamer lines, a bird baffler or warp deflector, whichmust be deployed as soon as possible after trawl shooting by all vessels 28 m or greater inlength (we note the increasing (but still low) number of vessels under 28 m operating inHAK7 and a recommendation has been developed for this component of the fishery). Thesedevices have been shown through the observer programme data to have successfullyreduced mortalities through warp strikes. While mealing of offal has been suggested prior todischarge, the efficacy of this approach is not clear. The cleaning of the net before shootingis also required. Reporting practices are also in place, so that bird captures trigger action byDWG and are reported to MPI.
INTERTEK FISHERIES CERTIFICATION (IFC)
NZ Hake Fishery PCR Intertek Fisheries Certification page 118
PI 2.3.2
The fishery has in place precautionary management strategies designed to: Meet national and international requirements; Ensure the fishery does not pose a risk of serious harm to ETP species; Ensure the fishery does not hinder recovery of ETP species; and Minimise mortality of ETP species.
Ju
stif
ica
tio
n
While there are no specific regulations defining mitigation approaches for marine mammalinteractions within this fishery, the industry has developed operating procedures to identifyand react to marine mammal bycatch events. Reporting practices are in place, so that marinemammal captures trigger action by DWG and are reported to MPI. In turn, operatingprocedures are also provided to minimise the danger period when the trawl net is close tothe surface, shallow turns while trawling, and to avoid discharging offal (as in the VMP forbird bycatch mitigation). Vessels avoid shooting nets where marine mammals are present,consistent with the MMOP.
For ETP fish species, legislation provides the main strategy to minimise mortality. Anyimplementation of this strategy is essentially operational.
For protected cold water corals, the operational strategy of towing within the historicalfootprint provides some protection, although it is noted that corals are still brought up intrawls. The designation of Benthic Protection Areas, which include seamounts known toinclude such key species, act as a non-directed strategy for managing the fishery’s impactson these species. While the effectiveness of these areas relative to the overall population ofprotected corals has not been specifically examined, risk assessments indicate that the hakefishery is unlikely to cause a risk to populations.
While operational plans appear effective, not all ETP are managed through comprehensivestrategies, as defined by MSC, designed to exceed national and international requirements(e.g. basking sharks, corals). A score of 80 is given.
b
Gu
idep
ost
The measures areconsidered likely towork, based on plausibleargument (e.g., generalexperience, theory orcomparison with similarfisheries/species).
There is an objectivebasis for confidence thatthe strategy will work,based on informationdirectly about the fisheryand/or the speciesinvolved.
The strategy is mainly based oninformation directly about thefishery and/or species involved,and a quantitative analysissupports high confidence that thestrategy will work.
Met? Y Y N
There is an objective basis for confidence that the strategy will work, based on informationderived from scientific research, knowledge of species and their interactions with fisheries,global best practice and past performance under operational plans.
Seabirds: Tori lines (one of the three gazetted measures that can be selected for seabirdbycatch reduction) are an international best practice measure for reducing warp strikes.Quantitative analyses in other fisheries (involving some of the same seabird species)demonstrate the efficacy of these devices. VMPs describe offal retention measuresdemonstrated to reduce seabird interactions with trawl gear. The efficacy of VMPs as awhole has not been tested. However, there is a substantial body of work on fisheries wastemanagement which shows quantitatively that holding waste, discharging in batches, etc iseffective in reducing seabird interactions with vessels.
Fur seals: The MMOP is based on detailed knowledge (and expert opinion) of marinemammal species, the hoki/hake/ling fishery, and interactions with marine mammals.Quantitative analyses of fur seal interactions with the fishery have been conducted.However, the efficacy of the particular measures the strategy contains have not beenevaluated quantitatively in the fishery.
Protected fish: No specific operational actions are in place to minimise captures of protectedfish, specifically the basking shark, noting the rarity of interactions.
INTERTEK FISHERIES CERTIFICATION (IFC)
NZ Hake Fishery PCR Intertek Fisheries Certification page 119
PI 2.3.2
The fishery has in place precautionary management strategies designed to: Meet national and international requirements; Ensure the fishery does not pose a risk of serious harm to ETP species; Ensure the fishery does not hinder recovery of ETP species; and Minimise mortality of ETP species.
Ju
stif
ica
tio
n
Protected corals: Spatial management measures have not yet been fully evaluated withrespect to their efficacy in managing impacts on protected corals (e.g. inclusion of coralswithin closed areas especially BPAs and representativeness of habitats protected). However,as noted the risk assessment indicates that the hake fishery is not a risk factor for thesespecies.
While the management strategy is multi-faceted, and considers information from the fishery,the efficacy of some components has not been evaluated quantitatively. A score of 80 istherefore given.
c
Gu
idep
ost
There is evidence that thestrategy is beingimplementedsuccessfully.
There is clear evidence that thestrategy is being implementedsuccessfully.
Met? Y Y
Ju
stif
ica
tio
n
For the framework in place, detailed monitoring is conducted by fisheries observers, atlevels clearly sufficient to estimate interaction levels and rates. Observers complete the“Vessel Management Plan/Marine Mammal Operating Procedure Observer Reviews” form,as well as record ETP interactions with fishing gear. Compliance monitoring of spatialmanagement areas also occurs; BPAs are monitored through VMS and observer coverage,and evidence shows that they are being adhered to. Camera surveys on closed seamountshave shown that the closure of areas with protected cold water corals within them hasallowed some recovery to begin where impacts have occurred previously.
Strategic documents are also reviewed from time to time, e.g. the Annual Operational Plan,the new NPOA – Sharks and NPOA - Seabirds (both reviewed every five years), andlegislation (reviews in recent years have included the addition of new species as legallyprotected, revised reporting regulations, and gazetting of required mitigation measures). Ascore of 100 is therefore given.
d
Gu
idep
ost
There is evidence that the strategyis achieving its objective.
Met? N
Ju
stif
ica
tio
n
Management objectives to achieve environmental outcomes desired from the hake fisheryfocus on avoiding and minimising adverse environmental impacts, including on ETPspecies. As noted, the strategic framework includes operational procedures developed withthe intent of reducing impacts. However, empirical evidence that the strategy is achieving itsobjectives is difficult to provide for all ETP. The 100 scoring guidepost is not met.
Noting that vessels less than 28 m are not specifically required to implement bird interactionmitigation approaches under Vessel Management Plans, a recommendation for further studyof this component of the fishery has been developed.
References
New Zealand Gazette 2010
Abraham and Thompson, 2011
Bull LS. 2009. New mitigation measures reducing seabird by-catch in trawl fisheries. Fishand Fisheries 10:408–427.
Deepwater Group Ltd., 2009.
INTERTEK FISHERIES CERTIFICATION (IFC)
NZ Hake Fishery PCR Intertek Fisheries Certification page 120
PI 2.3.2
The fishery has in place precautionary management strategies designed to: Meet national and international requirements; Ensure the fishery does not pose a risk of serious harm to ETP species; Ensure the fishery does not hinder recovery of ETP species; and Minimise mortality of ETP species.
Deepwater Group Ltd., 2011.
Department of Conservation. 2012.
MPI. 2013d.
Ministry of Fisheries. 2010
MPI, 2012b
MPI, 2013d
Ministry of Fisheries. 2011d.
New Zealand Gazette 2010.
Pierre et al., 2012.
Ramm, 2012.
Rowe, 2010.
OVERALL PERFORMANCE INDICATOR SCORE: All of the scoring issues of the 60 and 80scoring guideposts are met, and one component of the 100 scoring guidepost.
85
CONDITION NUMBER (if relevant): NA
INTERTEK FISHERIES CERTIFICATION (IFC)
NZ Hake Fishery PCR Intertek Fisheries Certification page 121
Evaluation Table for PI 2.3.3
PI 2.3.3
Relevant information is collected to support the management of fishery impacts onETP species, including:
Information for the development of the management strategy; Information to assess the effectiveness of the management strategy; and Information to determine the outcome status of ETP species.
Scoring Issue SG 60 SG 80 SG 100
a
Gu
idep
ost
Information is sufficientto qualitatively estimatethe fishery relatedmortality of ETP species.
Sufficient information isavailable to allow fisheryrelated mortality and theimpact of fishing to bequantitatively estimatedfor ETP species.
Information is sufficient toquantitatively estimate outcomestatus of ETP species with a highdegree of certainty.
Met? Y Y N
Ju
stif
ica
tio
n
The DOC Marine Conservation Services programme aims to monitor the effects ofcommercial fishing on protected species. Estimates of captures for seabird and marinemammal bycatch are publically available online.
Monitoring seabird mortality within trawl fisheries is a specific role of the observer onboard vessels. The coverage of observers has been sufficient to develop reasonably preciseestimates of the likely total mortality of seabirds in each fishery and area, and to monitortrends in the mortalities over time, including the impacts of bird mortality mitigationapproaches discussed under 2.3.2. Captures are observed by 'type', including entanglementwithin the net and warp strikes. Surveys of bird populations are underway, and estimates ofbreeding population size are available which allow quantitative estimates of outcome status.However, there remain difficulties in assessing bird mortalities other than through warpstrikes, such as those related to of cryptic mortality – i.e., where birds are caught but notdetected by observers, e.g. when they fall off the warps or out of the trawl net before beinglanded dead on-board vessels.
Monitoring of marine mammal mortalities within the trawl fishery is also a specific role ofthe observer on board vessels. The coverage of observers has been sufficient to developestimates of the likely total mortality of marine mammals, and to monitor trends in themortalities over time. Where information is less robust, specific data collection initiativeshave been developed. Surveys of relevant marine mammal populations are underway, butthese are not yet able to definitively indicate abundance levels in all areas to allow theoutcome status to be identified with a high degree of certainty.
For particular protected fish species (e.g. basking sharks), specific projects have beenfunded in an attempt to gather some information on population sizes. In turn, taggingprojects have been performed on great white sharks. Low interaction rates noted byobservers do allow quantitative estimates to be made.
Cold water corals captured in trawls are noted by observers present onboard, and where theycannot be identified they are returned to experts on shore for more detailed examination.Fishery-independent surveys are also underway using cameras inside and outside the mainfishery areas and the recovery of corals within newly closed areas of the New Zealand EEZhave been undertaken. Further projects have examined other biological aspects of cold watercorals. These data have been combined to examine the overlap of fishing vessel operationswith the distribution of protected cold water corals to be identified, and a risk-basedevaluation of the potential degree of impacts undertaken.
For areas or fishing units where observer coverage has been relatively low, which affects thecertainty of ETP interaction estimates, and for species without a robust population estimate,the outcome status of ETP species cannot be quantitatively estimated with a high degree ofcertainty. A score of 80 is therefore given.
INTERTEK FISHERIES CERTIFICATION (IFC)
NZ Hake Fishery PCR Intertek Fisheries Certification page 122
PI 2.3.3
Relevant information is collected to support the management of fishery impacts onETP species, including:
Information for the development of the management strategy; Information to assess the effectiveness of the management strategy; and Information to determine the outcome status of ETP species.
b
Gu
idep
ost
Information is adequateto broadly understand theimpact of the fishery onETP species.
Information is sufficientto determine whether thefishery may be a threat toprotection and recoveryof the ETP species.
Accurate and verifiableinformation is available on themagnitude of all impacts,mortalities and injuries and theconsequences for the status of ETPspecies.
Met? Y Y N
Ju
stif
ica
tio
n
Information from the observer programme is sufficient to support the strategy of birdmitigation to manage impacts, and data have shown decreases in bycatch following theintroduction of mitigation methods, allowing the impact to be identified with a reasonablyhigh degree of certainty, with captures noted by type (entanglement, warp strike, etc.). Thisprogramme also provides information on the interactions between gears and sea mammals,ETP fish species and coral. Combined with the fishery-independent underwater surveys,they allow the effectiveness of any mitigation approaches to be evaluated. However, formany seabird species and fur seals, population estimates can be dated or imprecise and fateinformation is not comprehensive. Current information has, however, allowed assessmentsto be made of fishing risks to some ETP species populations. A score of 80 is given.
c
Gu
idep
ost
Information is adequateto support measures tomanage the impacts onETP species.
Information is sufficientto measure trends andsupport a full strategy tomanage impacts on ETPspecies.
Information is adequate to supporta comprehensive strategy tomanage impacts, minimizemortality and injury of ETPspecies, and evaluate with a highdegree of certainty whether astrategy is achieving its objectives.
Met? Y Y N
Ju
stif
ica
tio
n
Information on ETP species available through observer data collection and scientificresearch is sufficient to support a full strategy to manage impacts on ETP species. Forseabirds, effective bycatch reduction measures are known; for example, monitoring of warpstrikes has indicated reductions in Salvin's albatross and white-capped albatross withinfisheries following the introduction of mandatory warp mitigation in January 2006. For furseals, some effective bycatch reduction measures are known, and others (which wouldbenefit from testing) are based on expert opinion and observation of the species. Fishingimpacts on protected coral species are determined by weight, and managed using spatialmeasures. Knowledge of the distribution of coral species is broadly known in areas ofrelevance to the fishery.
Trends in fisheries captures and mortalities are measured through observer data collection.A number of population-level research projects are also underway on ETP species, whichwill provide information useful for management. However, as noted, gaps in coverage andfate information prevents evaluations having a high degree of certainty whether a strategy isachieving its objectives. A score of 80 is given.
References
Thompson et al., 2013a,b
Tracey et al., 2011
Richard et al., 2011
Rowe, 2010
Richard and Abraham, 2013
Richard and Abraham, 2011
Abraham and Thompson, 2011
https://data.dragonfly.co.nz/psc/v20121101/birds/hake-trawl/all-vessels/eez/all/
INTERTEK FISHERIES CERTIFICATION (IFC)
NZ Hake Fishery PCR Intertek Fisheries Certification page 123
PI 2.3.3
Relevant information is collected to support the management of fishery impacts onETP species, including:
Information for the development of the management strategy; Information to assess the effectiveness of the management strategy; and Information to determine the outcome status of ETP species.
https://data.dragonfly.co.nz/psc/v20130304/new-zealand-fur-seal/hake-trawl/all-vessels/eez/all/
OVERALL PERFORMANCE INDICATOR SCORE: All of the scoring issues of the 60 and 80scoring guideposts are met.
80
CONDITION NUMBER (if relevant): NA
INTERTEK FISHERIES CERTIFICATION (IFC)
NZ Hake Fishery PCR Intertek Fisheries Certification page 124
Evaluation Table for PI 2.4.1
PI 2.4.1The fishery does not cause serious or irreversible harm to habitat structure,considered on a regional or bioregional basis, and function
Scoring Issue SG 60 SG 80 SG 100
a
Gu
idep
ost
The fishery is unlikely toreduce habitat structureand function to a pointwhere there would beserious or irreversibleharm.
The fishery is highlyunlikely to reduce habitatstructure and function to apoint where there wouldbe serious or irreversibleharm.
There is evidence that the fisheryis highly unlikely to reduce habitatstructure and function to a pointwhere there would be serious orirreversible harm.
Met? Y Y N
Ju
stif
ica
tio
n
As the trawl net is deployed to towing depth, pelagic habitats will experience short-termdisruption. Some disruption of the water column and its inhabitants will also occur as thenet is towed. However, longer term and more severe effects of the fishery on habitatstructure are benthic, given the bottom trawl method widely used. The degree of trawlingimpact on the seabed will be dependent upon sediment types, and is some concern. Researchin other geographic areas and studies of the impacts of trawling on the Chatham Rise haveidentified the stirring of sediments and benthos, the degree of impacts dependent upon thesubstrate type and level of previous trawl disturbance events. The footprint of the trawlfisheries has been examined within the New Zealand EEZ.
Currently, the best single tool currently available to evaluate benthic habitat types is theBenthic-Optimised Marine Environment Classification (BOMEC) for New Zealand waters.The pattern of New Zealand's trawl footprint for deepwater fisheries has been monitoredrelative to the BOMEC categories. The estimated swept area of the gear in relation to theBOMEC category areas within the New Zealand EEZ as a whole (rather than within theindividual regions of certification under this assessment) has been a maximum of 5%, andgenerally less than 0.6%.
Examinations of the trawl footprint by HAK region have also been undertaken. Trawlingoccurred mainly in the 200-800m depth rate, sweeping 7.4% of that depth band in HAK4.The report noted that for each of the hake fisheries, the area closed and/or not trawled wasover 98% for 1989/90 to 2011/12. Over the last five fishing years, HAK1 and HAK4 had anarea closed and/or not trawled of over 99.5%, for HAK7 it was 99.0%.
Vessel operational strategy indicates that the same tracks are being trawled; it is highlyunlikely that habitat structure and function will be degraded further, pending appropriatemanagement action.
Lost gear events appear to be rare, and given the value of the gear all efforts are made toretrieve any that are lost.
The examination of the trawl footprint of the fishery relative to the area of BOMECclassifications and HAK fishery areas provides evidence that the fishery is highly unlikelyto reduce habitat structure and function to a point where there would be serious orirreversible harm. However, further evidence on the basis of the inter-relationship betweenthe BPAs, ground-truthing of the latest habitat classification (relative to the rate of recoveryfollowing disturbance), combined with the current analysis of trawl paths, is recommendedto increase the score. Note that issues with cold water corals are dealt with under PI2.3. Ascore of 80 is given.
References
Black et al. 2013
Black, 2013
Hewitt et al., 2011
Snelder et al., 2005, 2006
Leathwick et al., 2006
Bowden et al. 2011
MPI, 2012
INTERTEK FISHERIES CERTIFICATION (IFC)
NZ Hake Fishery PCR Intertek Fisheries Certification page 125
PI 2.4.1The fishery does not cause serious or irreversible harm to habitat structure,considered on a regional or bioregional basis, and function
OVERALL PERFORMANCE INDICATOR SCORE: The fishery satisfies the scoring issuesfor the 60 scoring guidepost and the scoring issues of the 80 scoring guidepost, but not the 100scoring guidepost.
80
CONDITION NUMBER (if relevant): NA
INTERTEK FISHERIES CERTIFICATION (IFC)
NZ Hake Fishery PCR Intertek Fisheries Certification page 126
Evaluation Table for PI 2.4.2
PI 2.4.2There is a strategy in place that is designed to ensure the fishery does not pose a risk ofserious or irreversible harm to habitat types
Scoring Issue SG 60 SG 80 SG 100
a
Gu
idep
ost
There are measures inplace, if necessary, thatare expected to achievethe Habitat Outcome 80level of performance.
There is a partial strategyin place, if necessary, thatis expected to achieve theHabitat Outcome 80 levelof performance or above.
There is a strategy in place formanaging the impact of the fisheryon habitat types.
Met? Y Y N
Ju
stif
ica
tio
n
The Marine Reserves Act (1971) provides the basis for enacting marine protected areaswithin New Zealand, while the Conservation Act (1987), Wildlife Act (1953), and FisheriesAct (1996) also provide a framework for implementation. The New Zealand BiodiversityStrategy (2000) identified the need to develop a Marine Protected Areas Policy to protect afull range of natural marine habitats and ecosystems to effectively conserve marinebiodiversity, using a variety of appropriate mechanisms, including legal protection. TheMPI Strategy for Management of the Environmental Effects of Fishing provides a furtherframework for managing impacts, aiming to implement an Ecosystem Approach toFisheries, make significant improvements in managing the environmental effects of fishing,and to ensure the Ministry for Primary Industries meets its environmental obligations underthe Fisheries Act 1996 and other legislation in an efficient and consistent manner.
While the processes are ongoing, currently around a third of the New Zealand EEZ has beenencompassed by Benthic Protection Areas (from 2007). The requirement for the BPA designwas to encompass not less than 10% of each oceanic class of the MEC and each oceanicclass was to be represented in two or more BPAs. They were also spread by latitude andlongitude throughout the New Zealand EEZ, which runs from sub-tropical waters to sub-Antarctic waters, and to protect benthic habitats over a range of depths. The designatedBPAs are indicated to protect: 28 percent of Underwater Topographic Features (includingseamounts); 52 percent of seamounts (underwater mountains over 1000 metres in height);and 88 percent of active hydrothermal vents. Demersal trawling and dredging is prohibitedin these areas (pelagic fishing and demersal longlining being allowed). In turn, data continueto be collected to underpin studies. Further development of Marine Protected Areascontinues primarily within the Territorial Sea (from the coast to the 12-mile limit).
Combined, the BPAs and seamount closures, along with the operational strategy of towingwithin the path of historical trawl footprints, represent a partial strategy. The fishery doesnot have a cohesive and strategic arrangement in place to manage the fishery impacts onhabitats, which also includes mechanisms for the modification fishing practices in the lightof the identification of unacceptable impacts (MSC 2011). For example, the workoverlaying trawl tracks and habitat types is extremely informative, but there is no clear linkbetween the findings and its use for management of habitat impacts. Issues for considerationcould include when an impact on a habitat class is deemed worthy of management attention,how practices might be changed to manage identified impacts, any restrictions on trawlingnew areas or trawl gear, etc. A score of 80 is therefore given.
b
Gu
idep
ost
The measures areconsidered likely towork, based on plausibleargument (e.g. generalexperience, theory orcomparison with similarfisheries/habitats).
There is some objectivebasis for confidence thatthe partial strategy willwork, based oninformation directly aboutthe fishery and/or habitatsinvolved.
Testing supports high confidencethat the strategy will work, basedon information directly about thefishery and/or habitats involved.
Met? Y Y N
INTERTEK FISHERIES CERTIFICATION (IFC)
NZ Hake Fishery PCR Intertek Fisheries Certification page 127
PI 2.4.2There is a strategy in place that is designed to ensure the fishery does not pose a risk ofserious or irreversible harm to habitat types
Ju
stif
ica
tio
n
Reporting of interactions between fisheries and habitats is critical to understanding habitatimpacts. Spatial management is the most effective measure currently deployed formitigating habitat impacts due to demersal trawling and the closure of areas such asseamounts and the Benthic Protection Areas, combined with their location, the use of VMSand the analysis of trawl tracks relative to BOMEC areas provides some objective basis thatthe partial strategy will work. A score of 80 is given. We noted that there was a proposal toreview BPAs in 2013, which has not as yet been progressed.
c
Gu
idep
ost
There is some evidencethat the partial strategy isbeing implementedsuccessfully.
There is clear evidence that thestrategy is being implementedsuccessfully.
Met? Y N
Ju
stif
ica
tio
n
Fisheries observers monitor compliance with the boundaries of Benthic Protection Areas orother closed areas. The MPI and DWG are able to follow up if compliance anomalies aredetected. VMS data also provides information on the trawl footprint which has been relatedto the BOMEC areas. There is therefore clear evidence that the strategy as stands is beingimplemented successfully. This provides some evidence that the partial strategy is beingimplemented. A score of 80 is given.
d
Gu
idep
ost
There is some evidence that thestrategy is achieving its objective.
Met? N
Ju
stif
ica
tio
n
While there is some objective basis for confidence that the partial strategy will work,andongoing monitoring of patterns of fishing relative to the BPAs and BOMEC classifications,there has been no recent review of the BPA framework and its effectiveness to provideevidence that the approach is achieving its objective.
References
Black et al., 2013
DOC, 2012
DOC, 2005
MPI, 2012b
OVERALL PERFORMANCE INDICATOR SCORE: The fishery satisfies the scoring issuesfor the 60 scoring guidepost and the scoring issues of the 80 scoring guidepost, but none at the100 scoring guidepost.
80
CONDITION NUMBER (if relevant): NA
INTERTEK FISHERIES CERTIFICATION (IFC)
NZ Hake Fishery PCR Intertek Fisheries Certification page 128
Evaluation Table for PI 2.4.3
PI 2.4.3Information is adequate to determine the risk posed to habitat types by the fishery andthe effectiveness of the strategy to manage impacts on habitat types
Scoring Issue SG 60 SG 80 SG 100
a
Gu
idep
ost
There is basicunderstanding of thetypes and distribution ofmain habitats in the areaof the fishery.
The nature, distributionand vulnerability of allmain habitat types in thefishery are known at alevel of detail relevant tothe scale and intensity ofthe fishery.
The distribution of habitat types isknown over their range, withparticular attention to theoccurrence of vulnerable habitattypes.
Met? Y Y N
Ju
stif
ica
tio
n
Oceanography and primary productivity has been well studied through projects and remotesensing studies. Fairly extensive benthic surveys have been performed of seabed typesaround the New Zealand continental shelf and seamounts. Characteristics of habitats withinthe New Zealand EEZ have been classified and mapped through several projects, e.g. theMarine Environment Classification, the Oceans 20/20 work (e.g. on the Chatham rise; theChatham-Challenger project), and BOMEC. The projects aimed to map and comparehabitats and diversity of sea-bed communities in fishable depths at key locations across theChatham Rise and the Challenger Plateau, using both acoustic mapping approaches andunderwater camera work to map biodiversity and habitat types. In turn, the Ocean Survey20/20 (OS 20/20) project aimed to map the seafloor habitats and biodiversity of NewZealand’s marine environment across large areas of the EEZ, concentrating on the ChathamRise and Challenger Plateau. The location of key vulnerable habitat types (smokers,hydrothermal vents etc) is known.
Habitat mapping data, combined with the results of specimen collections from known trawllocations by fisheries observers, allow the nature, distribution and vulnerability of mainhabitat types to be known in the fishery, at a level of detail relevant to the scale and intensityof the fishery. Beyond areas of fishing activity, the degree of habitat knowledge at sub-regional scales is patchier. In turn, the footprint of the fishery is well established throughVMS records and the TCEPR data, and has been used within risk assessments for keybenthic species. However, the extent of habitat knowledge at sub-regional scales, includingfor vulnerable habitat types, is patchier. A score of 80 is therefore given.
b
Gu
idep
ost
Information is adequateto broadly understand thenature of the mainimpacts of gear use onthe main habitats,including spatial overlapof habitat with fishinggear.
Sufficient data areavailable to allow thenature of the impacts ofthe fishery on habitattypes to be identified andthere is reliableinformation on the spatialextent of interaction, andthe timing and location ofuse of the fishing gear.
The physical impacts of the gearon the habitat types have beenquantified fully.
Met? Y Y N
INTERTEK FISHERIES CERTIFICATION (IFC)
NZ Hake Fishery PCR Intertek Fisheries Certification page 129
PI 2.4.3Information is adequate to determine the risk posed to habitat types by the fishery andthe effectiveness of the strategy to manage impacts on habitat types
Ju
stif
ica
tio
n
Data from surveys, logbooks and the observer programme are available to allow impacts ofthe fishery on habitat types to be identified. The VMS provides reliable information on thespatial extent, timing and location of use of the fishing gear. In turn, reviews of thedistribution of BOMEC classes and recent fishing trawl survey tracks has clarified thedistribution and change of the fishery footprint relative to the ecosystem, providing anassessment of the main areas of potential impact sensitive to recovery times. The changeswithin previously fished habitats inside BPAs over time have been examined, particularlyfor seamounts. That on the main fished area has not been examined, and is inferred fromliterature on other fisheries; demersal trawling is a fishing method that typically destroyshabitat features and complexity. The observer programme notes benthic invertebratesbrought up in the trawls. Taxonomic guides developed by NIWA for cold water corals andsponges are improving species recognition, while still unidentified corals are returned forprofessional taxonomic identification. The body of information on the physical impacts ofthe gear on habitat is therefore growing, but cannot be said to have been quantified fully. Ascore of 80 is therefore given.
c
Gu
idep
ost
Sufficient data continueto be collected to detectany increase in risk tohabitat (e.g. due tochanges in the outcomeindicator scores or theoperation of the fishery orthe effectiveness of themeasures).
Changes in habitat distributionsover time are measured.
Met? Y N
Ju
stif
ica
tio
n
The continuation of the observer programme, logbook records, and surveys, providessufficient data to detect any increase in risk to habitat. The continued collection ofinformation and study of cold water corals has allowed risk assessments to be performed forthe fisheries in general, and the continued overlay of BOMEC distributions and trawlfootprints provides a mechanism to identify increased risk. However, no regular samplingregimes exist that are designed to measure changes in habitat distributions over time. Ascore of 80 is therefore given.
References
Snelder et al., 2007
Leathwick et al. 2009
Bowden et al. 2011
Hewitt et al., 2011
Black et al., 2013
OVERALL PERFORMANCE INDICATOR SCORE: : The fishery satisfies the scoring issuesfor the 60 scoring guidepost and the scoring issues of the 80 scoring guidepost, but none at the100 scoring guidepost.
80
CONDITION NUMBER (if relevant): NA
INTERTEK FISHERIES CERTIFICATION (IFC)
NZ Hake Fishery PCR Intertek Fisheries Certification page 130
Evaluation Table for PI 2.5.1
PI 2.5.1The fishery does not cause serious or irreversible harm to the key elements ofecosystem structure and function
Scoring Issue SG 60 SG 80 SG 100
a
Gu
idep
ost
The fishery is unlikely todisrupt the key elementsunderlying ecosystemstructure and function toa point where therewould be a serious orirreversible harm.
The fishery is highlyunlikely to disrupt the keyelements underlyingecosystem structure andfunction to a point wherethere would be a seriousor irreversible harm.
There is evidence that the fisheryis highly unlikely to disrupt thekey elements underlyingecosystem structure and functionto a point where there would be aserious or irreversible harm.
Met? Y Y N
Ju
stif
ica
tio
n
At an EEZ level, New Zealand fisheries have been preliminarily assessed to be sustainablein an energetic context. However, Knight et al. (2011) note that this energetic-basedsustainability assessment is not a replacement for a food web-based analysis, and that theirframeworks are appropriately deployed as a high-level guide for monitoring cumulativeeffects of multiple fisheries, rather than considering removals at a species-specific level.
Beyond energetic demands, high volume removals of species are expected to result in somelevel of ecosystem effects. Relative to this, the Chatham Rise fishery is best understood aschange is ongoing; the ecosystem has not stabilised at an alternative state. However, studiesshow: no evidence of loss of community constituents, although mean trophic level ofcommercial and trawl survey catches is declining, i.e. fishing is affecting higher trophiclevels. There is also evidence for changes in species abundance; no evidence of loss ofecosystem function; no evidence of loss of species over time. However, in other systemsbiogeochemical cycles have been reported to be disrupted by bottom trawling. This can beevaluated using the presence and dynamics of organisms over time.
Based upon logical argument and the position of hake within the ecosystem in the areasunder certification, the extraction of hake and the range of QMS and non-QMS species fromthe ecosystem through the fishery is unlikely to disrupt key elements of underlyingecosystem structure and function.
Ecosystem models developed for the sub-Antarctic region and Chatham Rise have not yetbeen specifically used to assess whether fishery removals at current levels (with stocks oftenwell above single species BMSY levels) may impact upon the modelled ecosystems.However, the trophic model of the Southern Plateau ecosystem, where hoki, rather thanhake, forms a large part of the fish component, suggests the area has low productivity andenergy transfer between components is efficient. A model for Chatham Rise suggests amore productive web. Stock sizes of hake in these areas indicate there remains a sizeableproportion of biomass in the ecosystem, and removals at this level are unlikely to lead toserious harm. This is particularly true given the recovery of the hoki population within theseecosystems.
Developing understanding of relationships between ecosystem components (e.g. functionalgroups), indicators and fishery characteristics would effectively contribute to improvingmanagement. “Evidence” in this SG requires a 20% probability that the true status of thecomponent is within the range where there is risk of serious or irreversible harm. Sufficientuncertainty exists on the impact of fishing for this specific species such that further work onecosystem effects of the fishery would be worthwhile, particularly for less-studied areas. Ascore of 80 is given.
References
Knight et al., 2011
Tuck et al. 2009
Thrush and Dayton, 2002
MacDarmid et al., 2005
Bradford-Grieve et al., 2003

INTERTEK FISHERIES CERTIFICATION (IFC)
NZ Hake Fishery PCR Intertek Fisheries Certification page 131
PI 2.5.1The fishery does not cause serious or irreversible harm to the key elements ofecosystem structure and function
OVERALL PERFORMANCE INDICATOR SCORE: The fishery satisfies the scoring issuesfor the 60 scoring guidepost and the scoring issues of the 80 scoring guidepost, but not the 100scoring guidepost.
80
CONDITION NUMBER (if relevant): NA
INTERTEK FISHERIES CERTIFICATION (IFC)
NZ Hake Fishery PCR Intertek Fisheries Certification page 132
Evaluation Table for PI 2.5.2
PI 2.5.2There are measures in place to ensure the fishery does not pose a risk of serious orirreversible harm to ecosystem structure and function
Scoring Issue SG 60 SG 80 SG 100
a
Gu
idep
ost
There are measures inplace, if necessary.
There is a partial strategyin place, if necessary.
There is a strategy that consists ofa plan, in place.
Met? Y Y Y
Ju
stif
ica
tio
n
The partial strategy in place is represented by the TACCs in operation within the fishery forall the QMS species, combined with numerous measures in place to reduce impacts of thefishery on individual ecosystem components (and thereby structure), e.g., for ETP species asdescribed above (PI 2.3.2) and the target (e.g. PI 1.1.1, 1.1.2), retained (PI 2.1.2) andbycatch (PI 2.2.2) species. This takes into account available information collected throughthe logbook system, observer programme and fishery-independent surveys. In addition,implementation of BPAs will help maintain ecosystem integrity in nearby areas.
There are no measures in place relating to ecosystem function specifically. There is,however, a legislative, policy and operational framework to manage ecosystem impacts, andaddress knowledge gaps relevant to fishery management, which builds on the partialstrategy. This includes components such as: The Fisheries Act (to avoid, remedy or mitigateany adverse effects of fishing on the aquatic environment) and Wildlife Act; The AnnualOperational Plan for Deepwater Fisheries; The National Fisheries Plan for Deepwater andMiddle-depth Fisheries; and research specifications for the 10 year research programme fordeepwater fisheries, which includes a specific focus on ecosystem functioning and trophiclinkages.
The result of these elements includes: to maintain QMS species at or above target levels,limit impacts on non-QMS species, and reduce the impact of gear on habitats. While they donot form a specific strategy aimed primarily at ecosystem maintenance, they work togetherto do so to form a plan. A score of 100 is therefore given.
b
Gu
idep
ost
The measures take intoaccount potential impactsof the fishery on keyelements of theecosystem.
The partial strategy takesinto account availableinformation and isexpected to restrainimpacts of the fishery onthe ecosystem so as toachieve the EcosystemOutcome 80 level ofperformance.
The strategy, which consists of aplan, contains measures to addressall main impacts of the fishery onthe ecosystem, and at least some ofthese measures are in place. Theplan and measures are based onwell-understood functionalrelationships between the fisheryand the Components and elementsof the ecosystem.
This plan provides fordevelopment of a full strategy thatrestrains impacts on the ecosystemto ensure the fishery does notcause serious or irreversible harm.
Met? Y Y N
INTERTEK FISHERIES CERTIFICATION (IFC)
NZ Hake Fishery PCR Intertek Fisheries Certification page 133
PI 2.5.2There are measures in place to ensure the fishery does not pose a risk of serious orirreversible harm to ecosystem structure and function
Ju
stif
ica
tio
n
The measures listed above either require some consideration of impacts (e.g. the FisheriesAct), take account of them with the intent of delivering better management (e.g. fisheriesmanagement objectives), or seek to manage them to reduce the environmental effects offishing (e.g. ETP bycatch measures). Furthermore, research outcomes are fed back intomanagement, although in the areas of ecosystem structure and function, stronger links couldbe developed. Where unacceptable impacts are detected, the current framework allows themto be addressed, including through fishery management measures. It is noted that, to date,responses have focussed on individual ecosystem components (e.g. target stock status,seabird bycatch levels) rather than broader effects, demonstrating that while the elementsnaturally work together, this is not through a specific ecosystem design; they are currentlynot developed across ecosystem components/functions to the level required for the SG100level. A score of 80 is therefore given.
c
Gu
idep
ost
The measures areconsidered likely towork, based on plausibleargument (e.g., generalexperience, theory orcomparison with similarfisheries/ecosystems).
The partial strategy isconsidered likely to work,based on plausibleargument (e.g., generalexperience, theory orcomparison with similarfisheries/ecosystems).
The measures are considered likelyto work based on prior experience,plausible argument or informationdirectly from thefishery/ecosystems involved.
Met? Y Y N
Ju
stif
ica
tio
n
Strategic and operational measures that are in place are considered likely to work, based oninformation about the fishery and ecosystem components involved (e.g. target and retainedspecies, some ETP species, habitat). For example, target species stocks have been activelymanaged, fish species brought under the QMS structure, and seabird bycatch mitigationmeasures introduced, to address sustainability concerns specifically, while BPAs have beenput in place. Annual review of the Annual Operational Plan for Deepwater Fisheriesprovides a natural forum for reviewing the efficacy of measures, and identification ofongoing and new issues. Detailed monitoring of many aspects of the fishery (e.g. catches oftarget, retained species, and bycatch) allows such review.
Hake is not a low trophic level species and current populations are likely or highly likely tobe above the target biomass reference levels. However, it is also a subset of the hoki fisheryand a bycatch in hoki-targeted trawls. Indeed the role of hoki in the fishery, and theresponse of the ecosystem to hoki removals, has been studied in greater depth than that ofhake across the fishery areas evaluated here. This provides plausible argument that thestrategy for the hake fishery is likely to work. It will be monitored during the surveillanceaudits based upon the decisions made on TACC levels - noting the potential for increasedhake bycatch in hoki targeted fishing -which have generally remained unchanged followingrecovery of the hoki fishery.
A score of 80 is given.
d
Gu
idep
ost
There is some evidencethat the measurescomprising the partialstrategy are beingimplementedsuccessfully.
There is evidence that themeasures are being implementedsuccessfully.
Met? Y Y
INTERTEK FISHERIES CERTIFICATION (IFC)
NZ Hake Fishery PCR Intertek Fisheries Certification page 134
PI 2.5.2There are measures in place to ensure the fishery does not pose a risk of serious orirreversible harm to ecosystem structure and function
Ju
stif
ica
tio
n
With particular reference to individual ecosystem components (rather than functions), thereis evidence that the strategy is being implemented successfully. For example, stockassessments of the target and retained species and monitoring of incidental mortalities ofETP species are ongoing, while TACCs and other control mechanisms are being monitoredand for the main species adjusted where necessary. BPAs are monitored through observerand VMS coverage, and as part of the partial management strategy should provide someecosystem buffering. There is therefore evidence that the approaches are being implementedsuccessfully. A score of 100 is given.
References
MPI, 2013a, b, c
MFish 2010b
New Zealand Gazette, 2010
Thompson et al., 2013a
Richard and Abraham, 2013a
Baird et al., 2012
Francis and Lyon, 2012
Horn, 2013a, b
OVERALL PERFORMANCE INDICATOR SCORE: The fishery satisfies the scoring issuesfor the 60 scoring guidepost and the scoring issues of the 80 scoring guidepost, and two of thefour at the 100 scoring guidepost.
90
CONDITION NUMBER (if relevant): NA
INTERTEK FISHERIES CERTIFICATION (IFC)
NZ Hake Fishery PCR Intertek Fisheries Certification page 135
Evaluation Table for PI 2.5.3
PI 2.5.3 There is adequate knowledge of the impacts of the fishery on the ecosystem
Scoring Issue SG 60 SG 80 SG 100
a
Gu
idep
ost
Information is adequateto identify the keyelements of theecosystem (e.g., trophicstructure and function,community composition,productivity pattern andbiodiversity).
Information is adequate tobroadly understand thekey elements of theecosystem.
Met? Y Y
Ju
stif
ica
tio
n
Stomach content analysis projects that have been performed provide information toadequately broadly understand the functions of the key elements of the ecosystem, includingtrophic structure, community composition, productivity and biodiversity. Studies on theChatham Rise have expanded existing analyses and include the diet of juvenile fish of keyspecies. However, recent projects have not examined the predators of the key fish species,although they are generally understood. The structure of the mid-water food web is broadlyunderstood for the Chatham Rise and Sub-Antarctic areas through a number of studies,which underpin ecosystem models. No model has yet been developed for the west CoastSouth Island but information from other areas is adequate to broadly understand the keyelements of the ecosystem. Given the different ecosystems covered by existing models andstudies, information is adequate to broadly understand the functions of the key ecosystemelements. A score of 80 is given.
b
Gu
idep
ost
Main impacts of thefishery on these keyecosystem elements canbe inferred from existinginformation, and havenot been investigated indetail.
Main impacts of thefishery on these keyecosystem elements canbe inferred from existinginformation and somehave been investigated indetail.
Main interactions between thefishery and these ecosystemelements can be inferred fromexisting information, and havebeen investigated.
Met? Y Y Y (HAK1, HAK4), N (HAK7)
Ju
stif
ica
tio
n
The main impacts of the fishery on the ecosystem elements can be inferred from the stockassessments (for key species), QMS catch trends, and surveys which cover the target,related species, and most levels of the ecosystems. Investigations have been particularlydetailed on the Chatham Rise. With the exception of the Southern Plateau and Chatham Risewhere models includes hake within fish groups, existing models have not been used toinvestigate the impacts of fishing on those ecosystems or feed into the fishery managementprocess and hence the main interactions have not been fully investigated for the hakefishery. For HAK1 and HAK4, therefore, a score of 100 is given. For HAK7, a score of 80is given.
c
Gu
idep
ost
The main functions of theComponents (i.e., target,Bycatch, Retained andETP species and Habitats)in the ecosystem areknown.
The impacts of the fishery ontarget, Bycatch, Retained and ETPspecies are identified and the mainfunctions of these Components inthe ecosystem are understood.
Met? Y N
INTERTEK FISHERIES CERTIFICATION (IFC)
NZ Hake Fishery PCR Intertek Fisheries Certification page 136
PI 2.5.3 There is adequate knowledge of the impacts of the fishery on the ecosystemJ
ust
ific
ati
on
The main functions of the components of the ecosystem have been identified through theecosystem sampling programme undertaken to parameterise the ecosystem models for theChatham Rise and sub-Antarctic regions around New Zealand. It is noted that ecosystemdata for the west of New Zealand is less abundant. The main functions of ecosystemcomponents are known, though not in detail for some species. Diet studies have beenintegral to the development of this knowledge.
The impacts of the fishery on target, bycatch, and ETP species are identified throughongoing monitoring that is a core component of the fishery management regime. The mainfunctions of some of these species can be understood from existing information. However,for some bycatch species and protected benthic species, knowledge of ecosystem functionsis minimal, or absent. There is also the potential for trawl gear to affect the productivity ofbenthic communities. Scientific research suggests that while certain communities will beadversely affected, others might benefit from increased availability of particular organisms,and that productivity may overall be increased.
A score of 80 is therefore given.
d
Gu
idep
ost
Sufficient information isavailable on the impactsof the fishery on theseComponents to allowsome of the mainconsequences for theecosystem to be inferred.
Sufficient information is availableon the impacts of the fishery onthe Components and elements toallow the main consequences forthe ecosystem to be inferred.
Met? Y Y (HAK1 and HAK4), N (HAK7)
Ju
stif
ica
tio
n
Information from the observer programme, and logbooks (for the main 5 species in thecatch) as well as continued sampling of stomachs, allow the main consequences for theecosystem to be inferred. The developed Ecopath models allow the impacts of the fishery oncomponents to be examined, although this analysis has not yet been performed for all areas.There is therefore considerable knowledge about the ecosystem components, and someelements that the fishery coexists with. While the consequences of fishery impacts on someecosystem characteristics are not well understood, sufficient information is available on thecomponents and elements of the ecosystem to allow the main consequences of the fishery tobe inferred in HAK1 and HAK4, as evidenced by the ecosystem models developed for theseregions. A score of 100 is therefore given. For HAK7, the reduced survey frequency andlack of an existing ecosystem model reduce the score for this region, noting that sufficientinformation is still available on the impacts of the fishery on the Components to allow someof the main consequences for the ecosystem to be inferred. A score of 80 is given.
e
Gu
idep
ost
Sufficient data continueto be collected to detectany increase in risk level(e.g., due to changes inthe outcome indicatorscores or the operation ofthe fishery or theeffectiveness of themeasures).
Information is sufficient to supportthe development of strategies tomanage ecosystem impacts.
Met? Y Y
Ju
stif
ica
tio
n
There is a growing body of information available on the ecosystem components in whichhake occurs and interacts. Linkages between all ecosystem components and the hake fisherycannot be quantified, making the scale of responses to changes in fishing patterns difficult topredict. However, sufficient information is available to support the development ofstrategies to manage ecosystem impacts. A score of 100 is given.
INTERTEK FISHERIES CERTIFICATION (IFC)
NZ Hake Fishery PCR Intertek Fisheries Certification page 137
PI 2.5.3 There is adequate knowledge of the impacts of the fishery on the ecosystem
References
Dunn et al., 2010
Stevens et al., 2011
Horn, 2013a,b
Pinkerton, 2011
Bradford-Grieve et al., 2003
Horn and Dunn, 2010
Baird 2011
OVERALL PERFORMANCE INDICATOR SCORE: The fishery satisfies the scoringissues for the 60 scoring guidepost and the scoring issues of the 80 scoring guidepost. ForHAK1 and HAK4, three of the four 100 scoring guideposts are met and the score is 95.For HAK7, one of the four 100 scoring guideposts are met and the score is 85.
95 (HAK1and HAK4),85 (HAK7)
CONDITION NUMBER (if relevant): NA
INTERTEK FISHERIES CERTIFICATION (IFC)
NZ Hake Fishery PCR Intertek Fisheries Certification page 138
Evaluation Table for PI 3.1.1
PI 3.1.1
The management system exists within an appropriate legal and/or customaryframework which ensures that it: Is capable of delivering sustainable fisheries in accordance with MSC Principles 1
and 2; and Observes the legal rights created explicitly or established by custom of people
dependent on fishing for food or livelihood; and Incorporates an appropriate dispute resolution framework.
Scoring Issue SG 60 SG 80 SG 100
a
Gu
idep
ost
There is an effectivenational legal system anda framework forcooperation with otherparties, where necessary,to deliver managementoutcomes consistent withMSC Principles 1 and 2
There is an effectivenational legal system andorganised and effectivecooperation with otherparties, where necessary,to deliver managementoutcomes consistent withMSC Principles 1 and 2.
There is an effective national legalsystem and binding proceduresgoverning cooperation with otherparties which deliversmanagement outcomes consistentwith MSC Principles 1 and 2.
Met? Y Y Y
Ju
stif
ica
tio
n
MPI is responsible for the utilisation of New Zealand's fisheries resources while ensuringsustainability in accordance with its governing legislation - the Fisheries Act 1996.
Where ensuring sustainability means:
(a) maintaining the potential of fisheries resources to meet the reasonably foreseeable needsof future generations; P1
and
(b) avoiding, remedying, or mitigating any adverse effects of fishing on the aquaticenvironment P2
Utilisation means conserving, using, enhancing, and developing fisheries resources toenable people to provide for their social, economic, and cultural well-being.
The Fisheries Act binds the Crown. Decisions made under power given by the Act arejudicially reviewable by the Courts in the event of disputes. Procedures and processes thatapply to disputes about the effects of fishing on the fishing activities of any person that has acurrent fishing interest provided for under the Act, are set out under Part 7 of the FisheriesAct.
MPI's fisheries management responsibilities extend to the 200 nautical mile limit of the NZEEZ. MPI provides management, licencing (where applicable) research and compliance andeducation services for commercial, recreational and customary fishing. MPI assists theMinister of Primary Industries in the administration of the relevant Acts.
The Government’s commitment to wide consultation and engagement is set out in Section12 of the Act. MPI is required to consult with those classes of persons having an interest(including, but not limited to, Maori, environmental, commercial and recreational interests)in the stock or the effects of fishing on the aquatic environment in the area concerned. MPIdo this in a number of ways eg through regular meeting of working groups. These meetingsare open to everyone, and consider fish stocks and the effects of fishing on the aquaticenvironment. There is an effective national legal system and binding procedures governingcooperation with other parties which delivers management outcomes consistent with MSCPrinciples 1 and 2. This SI meets 100.
INTERTEK FISHERIES CERTIFICATION (IFC)
NZ Hake Fishery PCR Intertek Fisheries Certification page 139
PI 3.1.1
The management system exists within an appropriate legal and/or customaryframework which ensures that it: Is capable of delivering sustainable fisheries in accordance with MSC Principles 1
and 2; and Observes the legal rights created explicitly or established by custom of people
dependent on fishing for food or livelihood; and Incorporates an appropriate dispute resolution framework.
b
Gu
idep
ost
The management systemincorporates or is subjectby law to a mechanismfor the resolution of legaldisputes arising withinthe system.
The management systemincorporates or is subjectby law to a transparentmechanism for theresolution of legaldisputes which isconsidered to be effectivein dealing with mostissues and that isappropriate to the contextof the fishery.
The management systemincorporates or is subject by law toa transparent mechanism for theresolution of legal disputes that isappropriate to the context of thefishery and has been tested andproven to be effective.
Met? Y Y Y
Ju
stif
ica
tio
n
The Fisheries Act provides opportunities to negotiate and resolve disputes. The Ministermay appoint a Dispute Commissioner and the Minister makes the final determination. Theconsultation process is an attempt to avoid unresolved disputes by ensuring all interestedparties have an opportunity to participate and have an input into decisions. There have beenoccasions when there has not been a satisfactory outcome and then this has gone to litigationand the Court has made a decision. The Memorandum of Understanding between theDeepwater Group Ltd and the Ministry for Primary Industries has encouraged betterworking relationships and avoided the need for litigation between the Ministry and theindustry. The management system incorporates or is subject by law to a transparentmechanism for the resolution of legal disputes that is appropriate to the context of thefishery and has been tested and proven to be effective. A score of 100 is given
d
Gu
idep
ost
The management systemhas a mechanism togenerally respect thelegal rights createdexplicitly or establishedby custom of peopledependent on fishing forfood or livelihood in amanner consistent withthe objectives of MSCPrinciples 1 and 2.
The management systemhas a mechanism toobserve the legal rightscreated explicitly orestablished by custom ofpeople dependent onfishing for food orlivelihood in a mannerconsistent with theobjectives of MSCPrinciples 1 and 2.
The management system has amechanism to formally commit tothe legal rights created explicitlyor established by custom of peopledependent on fishing for food andlivelihood in a manner consistentwith the objectives of MSCPrinciples 1 and 2.
Met? Y Y Y
MPI is responsible for the administration of the Treaty of Waitangi (Fisheries Claims)Settlement Act 1992, which implements the 1992 Fisheries Deed of Settlement under whichhistorical Treaty of Waitangi claims relating to commercial fisheries have been fully andfinally settled. The Ministry is also responsible for the Maori Fisheries Act 2004, whichprovides that the Crown allocates 20% of quota for any new quota management stocksbrought into the QMS to the Treaty of Waitangi Fisheries commission. For non-commercialfisheries, the Kaimoana Customary Fishing Regulations 1998 and the Fisheries (SouthIsland Customary Fishing) Regulations 1998 strengthen some of the rights of TangataWhenua to manage their fisheries.
INTERTEK FISHERIES CERTIFICATION (IFC)
NZ Hake Fishery PCR Intertek Fisheries Certification page 140
PI 3.1.1
The management system exists within an appropriate legal and/or customaryframework which ensures that it: Is capable of delivering sustainable fisheries in accordance with MSC Principles 1
and 2; and Observes the legal rights created explicitly or established by custom of people
dependent on fishing for food or livelihood; and Incorporates an appropriate dispute resolution framework.
Ju
stif
ica
tio
n
These regulations let iwi and hapü manage their non-commercial fishing in a way that bestfits their local practices, without having a major effect on the fishing rights of others. Whenthe government sets the total catch limits for fisheries each year, it allows for this customaryuse of fisheries. Before allocating comercial quotas. The management system therefore hasa mechanism to formally commit to the legal rights created explicitly or established bycustom of people dependent on fishing for food and livelihood in a manner consistent withthe objectives of MSC Principles 1 and 2. A score of 100 is given.
References
Fisheries Act 1996
DWG Partnership 2010
Treaty of Waitangi (Fisheries Claims) Settlement Act 1992
Deed of Settlement 1992
Maori Fisheries Act 2004
Customary Fisheries Regulations 1998
MFish 2009a
OVERALL PERFORMANCE INDICATOR SCORE: All of the scoring guideposts are met for60, 80 and 100.
100
CONDITION NUMBER (if relevant):
INTERTEK FISHERIES CERTIFICATION (IFC)
NZ Hake Fishery PCR Intertek Fisheries Certification page 141
Evaluation Table for PI 3.1.2
PI 3.1.2
The management system has effective consultation processes that are open tointerested and affected parties.
The roles and responsibilities of organisations and individuals who are involved in themanagement process are clear and understood by all relevant parties
Scoring Issue SG 60 SG 80 SG 100
a
Gu
idep
ost
Organisations andindividuals involved inthe management processhave been identified.Functions, roles andresponsibilities aregenerally understood.
Organisations andindividuals involved inthe management processhave been identified.Functions, roles andresponsibilities areexplicitly defined andwell understood for keyareas of responsibility andinteraction.
Organisations and individualsinvolved in the managementprocess have been identified.Functions, roles andresponsibilities are explicitlydefined and well understood for allareas of responsibility andinteraction.
Met? Y Y Y
Ju
stif
ica
tio
n
The Ministry for Primary industries (MPI) is the Government agency responsible for theutilisation and sustainable management of the fisheries resources. The role of the MPI,working with other government agencies, is to advise on and implement government policyin the following areas of core responsibility:
ensuring sustainability of fish stocks and the protection of the aquatic environment; meeting international and Deed of Settlement obligations; providing for maximum value to be realised; facilitating sustainable development; and ensuring integrity of management systems.
MPI is charged with consistently monitoring the fishery resource, and making timely andappropriate policy advice on all aspects of fisheries management to the Government. TheMinistry is also responsible for carrying out the Government's policies to manage andconserve fisheries, and to actively encourage compliance of fisheries regulations by allfishers.The Department of Conservation (DOC) is the central government organisation chargedwith conserving the natural and historical heritage of New Zealand. The department isresponsible for marine reserves, seabirds, and for marine mammals such as dolphins,whales, sea lions and fur seals.DWG is an amalgamation of EEZ fisheries quota owners in New Zealand. DWG is a non-profit organisation, and is the commercial stakeholder organisation responsible for themajority of deepwater and middle-depth fisheries. It is working in partnership with theMPI and other interest groups to ensure New Zealand gains the maximum economic yieldsfrom its deepwater fisheries resources managed within a long-term, sustainable framework.The vast majority (95%) of hake quota owners are represented through the DWG. The MPIand DWG signed a Memorandum of Understanding (MOU) in 2006 which sets out howDWG and MPI would work collaboratively to improve the management of deepwaterfisheries (including hake). eNGOs and other stakeholders have an important role inparticipating and contributing to management processes.Therefore, organisations and individuals involved in the management process have beenidentified and their functions, roles and responsibilities are explicitly defined and wellunderstood for key areas of responsibility and interaction. A score of 100 is given.
INTERTEK FISHERIES CERTIFICATION (IFC)
NZ Hake Fishery PCR Intertek Fisheries Certification page 142
PI 3.1.2
The management system has effective consultation processes that are open tointerested and affected parties.
The roles and responsibilities of organisations and individuals who are involved in themanagement process are clear and understood by all relevant parties
b
Gu
idep
ost
The management systemincludes consultationprocesses that obtainrelevant informationfrom the main affectedparties, including localknowledge, to inform themanagement system.
The management systemincludes consultationprocesses that regularlyseek and accept relevantinformation, includinglocal knowledge. Themanagement systemdemonstratesconsideration of theinformation obtained.
The management system includesconsultation processes thatregularly seek and accept relevantinformation, including localknowledge. The managementsystem demonstrates considerationof the information and explainshow it is used or not used.
Met? Y Y Y
Ju
stif
ica
tio
n
Section 12 of the 1996 Act includes a range of specific consultation requirements.MPI is required to consult with those classes of persons having an interest (including, butnot limited to, Maori, environmental, commercial and recreational interests) in the stock orthe effects of fishing on the aquatic environment in the area concerned; Section 12 onlyrelates to certain sections of the 1996 Act. However there are other sections of the 1996 Actthat require the Minister or MPI Chief Executive to consult with stakeholders before makinga decision.MPI has a well-defined process for stakeholder consultation. The consultation process:
- sets out best practice process for how MPI will meet its obligations under Section12 of the Fisheries Act 1996 and for other decisions requiring consultation withfisheries stakeholders;
- helps to ensure a consistent approach across all MPI business groups whenconsulting with fisheries stakeholders; and
- sets out minimum performance measures where appropriate, e.g., a minimumperiod for stakeholder consultation.
The consultation process standard includes the following:• identification of stakeholders “having an “interest” for consultation purposes;• a timeframe for consultation;• notification of decision to stakeholders; and• monitoring, review and oversight.There is evidence that consultation occurs on a regular basis and that information providedby stakeholders is often taken into account. Explanations on how information is used or notused are conveyed by letters, emails and in Final Advice papers.The management system therefore includes consultation processes that regularly seek andaccept relevant information, including local knowledge. The management systemdemonstrates consideration of the information and explains how it is used or not used. Ascore of 100 is given.
c
Gu
idep
ost
The consultation processprovides opportunity forall interested and affectedparties to be involved.
The consultation process providesopportunity and encouragementfor all interested and affectedparties to be involved, andfacilitates their effectiveengagement.
Met? Y Y
MPI has a well-defined process for stakeholder consultation. The consultation process:
INTERTEK FISHERIES CERTIFICATION (IFC)
NZ Hake Fishery PCR Intertek Fisheries Certification page 143
PI 3.1.2
The management system has effective consultation processes that are open tointerested and affected parties.
The roles and responsibilities of organisations and individuals who are involved in themanagement process are clear and understood by all relevant parties
Ju
stif
ica
tio
n
- sets out best practice process for how MPI will meet its obligations under Section12 of the Fisheries Act 1996 and for other decisions requiring consultation withfisheries stakeholders;
- helps to ensure a consistent approach across all MPI business groups whenconsulting with fisheries stakeholders; and
- sets out minimum performance measures where appropriate, e.g., a minimumperiod for stakeholder consultation.
The consultation process standard includes the following:• identification of stakeholders having an “interest” for consultation purposes;• a time frame for consultation;• notification of decision to stakeholders; and• monitoring, review and oversight.There is evidence of the MPI seeking stakeholder views throughout the year using, forexample, the Initial Position Paper process, the Working Group, and fisheries planningmeetings.As part of the consultation process, stakeholders are given the opportunity to providefeedback on the delivery of the process itself. The feedback is evaluated and used to fine-tune future consultation processes. Stakeholders are encouraged to be involved. Theconsultation process provides opportunity and encouragement for all interested and affectedparties to be involved, and facilitates their effective engagement. MPI have also set up anEnvironmental Engagement forum. A score of 100 is given
References
Fisheries Act 1996
DWG 2010
MFish 2010e
MFish 2010 l
MFish 2012b
MFish 2011b
DOC 2012
OVERALL PERFORMANCE INDICATOR SCORE: All of the scoring guideposts are met for60, 80 and 100.
100
CONDITION NUMBER (if relevant):
INTERTEK FISHERIES CERTIFICATION (IFC)
NZ Hake Fishery PCR Intertek Fisheries Certification page 144
Evaluation Table for PI 3.1.3
PI 3.1.3The management policy has clear long-term objectives to guide decision-making thatare consistent with MSC Principles and Criteria, and incorporates the precautionaryapproach
Scoring Issue SG 60 SG 80 SG 100
a
Gu
idep
ost
Long-term objectives toguide decision-making,consistent with the MSCPrinciples and Criteriaand the precautionaryapproach, are implicitwithin managementpolicy
Clear long-termobjectives that guidedecision-making,consistent with MSCPrinciples and Criteriaand the precautionaryapproach are explicitwithin managementpolicy.
Clear long-term objectives thatguide decision-making, consistentwith MSC Principles and Criteriaand the precautionary approach,are explicit within and required bymanagement policy.
Met? Y Y Y
Long-term fishery and environmental objectives are included within both NZ fisheries andenvironmental legislation and these guide decision making. In regard to informationprinciples, Section10 of Fisheries Act states: “All persons exercising or performingfunctions, duties, or powers under this Act, in relation to the utilisation of fisheriesresources or ensuring sustainability, shall take into account the following informationprinciples:
(a) Decisions should be based on the best available information:(b) Decision makers should consider any uncertainty in the information available in
any case:(c) Decision makers should be cautious when information is uncertain, unreliable, or
inadequate:(d) The absence of, or any uncertainty in, any information should not be used as a
reason for postponing or failing to take any measure to achieve the purpose of thisAct.”
Fisheries 2030 sets the strategic direction for the management and use of New Zealand’sfisheries resources. One of the principles guiding Fisheries 2030 is “Precautionaryapproach: particular care will be taken to ensure environmental sustainability whereinformation is uncertain unreliable or inadequate.”
The National Fisheries Plan for Deepwater and Middle-depth Fisheries (the NationalDeepwater Plan) establishes the 5-year enabling framework for the management of NewZealand’s deepwater fisheries. It is further divided into two parts – Part 1A and Part 1B.
Part 1A details the overall strategic direction for New Zealand’s deepwater fisheries.Specifically it describes:
(a) the wider strategic context that Fisheries Plans are part of, including Fisheries2030;
(b) the nature and status of the management objectives that will apply across alldeepwater fisheries; and
(c) how the National Deepwater Plan will be implemented and how stakeholders willbe engaged during the implementation phase.
Part 1A of the National Deepwater Plan has been approved by the Minister of Fisheriesunder Section 11A of the Fisheries Act 1996. This means that it must be considered eachtime the Minister makes decisions or recommendations concerning regulation or control offishing or any sustainability measures relating to the stocks managed through this plan.
INTERTEK FISHERIES CERTIFICATION (IFC)
NZ Hake Fishery PCR Intertek Fisheries Certification page 145
PI 3.1.3The management policy has clear long-term objectives to guide decision-making thatare consistent with MSC Principles and Criteria, and incorporates the precautionaryapproach
Ju
stif
ica
tio
n
Part 1B of the National Deepwater Plan comprises the fishery-specific chapters of theNational Deepwater Plan which provide greater detail on how deepwater fisheries will bemanaged at the fishery level, in line with the management objectives. To date, fishery-specific chapters have been completed for the hoki, orange roughy, southern blue whiting,and ling fisheries. The fishery specific chapter for hake is in draft form. The fishery-specificchapters describe the operational objectives for each target fishery and their key bycatchspecies, as well as how performance against both the management and operationalobjectives will be assessed at the fishery level. These chapters also describe any agreedharvest strategy for the relevant species.
On an annual basis the National Deepwater Plan is delivered through the AnnualOperational Plan which describes management actions scheduled for delivery during thefinancial year for which the Operational Plan applies, and the management services requiredto deliver the management actions. The Annual Operational Plan also clearly demonstrateshow these management actions contribute to the long-term objectives in the NationalDeepwater Plan.
The annual review of performance and delivery of objectives is provided in MPI’s annualreports
Clear long-term objectives that guide decision-making, consistent with MSC Principles andCriteria and the precautionary approach, are explicit within and required by managementpolicy. This SI scores 100.
References
Fisheries Act
MFish 2010d
MFish 2010f
Pricewaterhouse Coopers 2008
OVERALL PERFORMANCE INDICATOR SCORE: All of the scoring guideposts are met for60, 80 and 100.
100
CONDITION NUMBER (if relevant):
INTERTEK FISHERIES CERTIFICATION (IFC)
NZ Hake Fishery PCR Intertek Fisheries Certification page 146
Evaluation Table for PI 3.1.4
PI 3.1.4The management system provides economic and social incentives for sustainablefishing and does not operate with subsidies that contribute to unsustainable fishing
Scoring Issue SG 60 SG 80 SG 100
a
Gu
idep
ost
The management systemprovides for incentivesthat are consistent withachieving the outcomesexpressed by MSCPrinciples 1 and 2.
The management systemprovides for incentivesthat are consistent withachieving the outcomesexpressed by MSCPrinciples 1 and 2, andseeks to ensure thatperverse incentives do notarise.
The management system providesfor incentives that are consistentwith achieving the outcomesexpressed by MSC Principles 1and 2, and explicitly considersincentives in a regular review ofmanagement policy or proceduresto ensure they do not contribute tounsustainable fishing practices.
Met? Y Y P
Ju
stif
ica
tio
n
Incentives: The QMS and the use of ITQs provides stability and security for quota ownersand hence incentives for sustainable utilisation (Fisheries Act). The management systemalso includes customary provisions (e.g., Maori Fisheries Act 2004 and Treaty of Waitangi(Fisheries Claims) Settlement Act 1992).Subsidies: There are no subsidies in the New Zealand hake fishery. The managementsystem has explicit mechanisms that facilitate regular review of management policy orprocedures (Fisheries Act).Under Section 13 of the Fisheries Act 1996 the Minister of Fisheries needs to take social,cultural and economic factors into account as well as the status of the stocks and allenvironmental considerations when setting a TAC for a fishery.There are regular reviews of the Quota Management System and MPI management policyand procedures to ensure they contribute to sustainable fishing. Other strategies thatcontribute to sustainable fishing are also regularly reviewed e.g. deemed values and theharvest strategy. There do not appear to be explicit incentives and encouragement not tocatch marine mammals and protected species, i.e. there is no positive feedback for those notcatching these species.The management system does not explicitly consider incentives in a regular review ofmanagement policy or procedures to ensure they do not contribute to unsustainable fishingpractices. As such, the fishery only partially meets the 100 level of performance.
ReferencesFisheries Act 1996
Lock et al 2007
OVERALL PERFORMANCE INDICATOR SCORE: The scoring guideposts are met for 60and 80 and partially met for 100.
90
CONDITION NUMBER (if relevant):
INTERTEK FISHERIES CERTIFICATION (IFC)
NZ Hake Fishery PCR Intertek Fisheries Certification page 147
Evaluation Table for PI 3.2.1
PI 3.2.1The fishery has clear, specific objectives designed to achieve the outcomes expressed byMSC’s Principles 1 and 2
Scoring Issue SG 60 SG 80 SG 100
a
Gu
idep
ost
Objectives, which arebroadly consistent withachieving the outcomesexpressed by MSC’sPrinciples 1 and 2, areimplicit within thefishery’s managementsystem
Short and long-termobjectives, which areconsistent with achievingthe outcomes expressedby MSC’s Principles 1and 2, are explicit withinthe fishery’s managementsystem.
Well defined and measurable shortand long-term objectives, whichare demonstrably consistent withachieving the outcomes expressedby MSC’s Principles 1 and 2, areexplicit within the fishery’smanagement system.
Met? Y Y Y
Ju
stif
ica
tio
n
The management system has explicit short and long-term objectives which are set out inlong-term plans e.g. Fisheries 2030, National Fishing Plan Deepwater and Middle DepthsPlan and Annual Operational Plan. Objectives are subject to an annual review report.Objectives specific for hake are set out in the hake chapter of the National Fishing PlanDeepwater and Middle Depths Plan and Annual Operational Plan. These are then specifiedwithin the annual Operating Plan. These are fishery specific, subject to annual review andare measurable. However, the objectives tend to be high-level and not measurable.
References
MFish 2010d
MPI2012b
MPI 2013e
Pricewaterhouse Cooper 2008
OVERALL PERFORMANCE INDICATOR SCORE: 100
CONDITION NUMBER (if relevant): The scoring guideposts are met for 60 and 80 andpartially met for 100.
INTERTEK FISHERIES CERTIFICATION (IFC)
NZ Hake Fishery PCR Intertek Fisheries Certification page 148
Evaluation Table for PI 3.2.2
PI 3.2.2The fishery-specific management system includes effective decision-making processesthat result in measures and strategies to achieve the objectives, and has an appropriateapproach to actual disputes in the fishery under assessment.
Scoring Issue SG 60 SG 80 SG 100
a
Gu
idep
ost
There are some decision-making processes inplace that result inmeasures and strategiesto achieve the fishery-specific objectives.
There are establisheddecision-makingprocesses that result inmeasures and strategies toachieve the fishery-specific objectives.
Met? Y Y
Ju
stif
ica
tio
n
The decision-making process is clearly outlined in the Fisheries Act (specifically Sections10, 11&12). Section 10 of the Fisheries Act requires that all decisions be based on the bestavailable information. The management of fisheries to achieve these goals is based upon thescientific evaluation of:
the sustainable yield from fisheries resources; the effects of fishing on the aquatic environment, including on the viability of
associated or dependent species, and on biological diversity; alternative strategies for achieving the desired level of yield while avoiding,
remedying, or mitigating adverse effects of fishing on the aquatic environment; relevant cultural, economic, and social factors that may need to be included in the
management decision process; and the specific measures needed to implement the preferred strategy.
There ais also the working group process which is an example of how scientific informationis incorporated into managementThere are therefore established decision-making processes that result in measures andstrategies to achieve the fishery-specific objectives. A score of 80 is given
b
Gu
idep
ost
Decision-makingprocesses respond toserious issues identifiedin relevant research,monitoring, evaluationand consultation, in atransparent, timely andadaptive manner and takesome account of thewider implications ofdecisions.
Decision-makingprocesses respond toserious and otherimportant issuesidentified in relevantresearch, monitoring,evaluation andconsultation, in atransparent, timely andadaptive manner and takeaccount of the widerimplications of decisions.
Decision-making processesrespond to all issues identified inrelevant research, monitoring,evaluation and consultation, in atransparent, timely and adaptivemanner and take account of thewider implications of decisions.
Met? Y Y N
INTERTEK FISHERIES CERTIFICATION (IFC)
NZ Hake Fishery PCR Intertek Fisheries Certification page 149
PI 3.2.2The fishery-specific management system includes effective decision-making processesthat result in measures and strategies to achieve the objectives, and has an appropriateapproach to actual disputes in the fishery under assessment.
Ju
stif
ica
tio
n
Section 10 of the Fisheries Act requires all decisions to be based on the best availableinformation. The management of fisheries to achieve these goals is based upon the scientificevaluation of:
the sustainable yield from fisheries resources; the effects of fishing on the aquatic environment, including on the viability of
associated or dependent species, and on biological diversity; alternative strategies for achieving the desired level of yield while avoiding,
remedying, or mitigating adverse effects of fishing on the aquatic environment; relevant cultural, economic, and social factors that may need to be included in the
management decision process; and the specific measures needed to implement the preferred strategy.
Consultation is a central component of the management decision making process (FisheriesAct Section 12, Stakeholder Consultation Process Standard). The Minister makes the finaldecision based on advice received from other parties (Section 12 - the Minister shall consultwith such persons or organisations as the Minister considers are representative of thoseclasses of persons having an interest in the stock or the effects of fishing on the aquaticenvironment in the area concerned including Maori, environmental, commercial, andrecreational interests). The MPI ensures that the Minister is provided with analysedalternatives for consideration before making any decisions (information is both from withinand outside the Ministry (Stakeholders, Science)). The feedback process is formalised,involving planning, consultation, project development, and scientific enquiry.
The IPP/FAP process highlights the extent of consultation, engagement and transparency ofthe decision making process; see the following:
Hon. Phil Heatley (2011). Minister’s Decision Letter on Sustainable Measures.
Ministry of Fisheries (2011) Review of Sustainability Measures and Othermanagement Controls for Deepwater Fisheries – Final Advice Paper.
Ministry of Fisheries (2011) Submissions received on the Review of SustainabilityMeasures and other management Controls for Deepwater Fisheries.
Thus, decision-making processes respond to serious and other important issues identified inrelevant research, monitoring, evaluation and consultation, in a transparent, timely andadaptive manner and take account of the wider implications of decisions.
Although management decision-making can be shown to respond to serious and importantissues, a very large number of ‘issues’ are identified during research and monitoring.Management does not respond formally to all of these. However, response may be informalor through discussion at various fora such as working groups. All issues are addressedthrough such mechanisms, although this may not be to the satisfaction of all stakeholders.
The assessment team does not have full evidence that decision-making processes respond toall issues identified in relevant research, monitoring, evaluation and consultation, in atransparent, timely and adaptive manner and take account of the wider implications ofdecisions. A score of 80 is met.
c
Gu
idep
ost
Decision-makingprocesses use theprecautionary approachand are based on bestavailable information.
Met? Y
INTERTEK FISHERIES CERTIFICATION (IFC)
NZ Hake Fishery PCR Intertek Fisheries Certification page 150
PI 3.2.2The fishery-specific management system includes effective decision-making processesthat result in measures and strategies to achieve the objectives, and has an appropriateapproach to actual disputes in the fishery under assessment.
Ju
stif
ica
tio
n
The FAO technical consultation on the precautionary approach to capture fisheries tookplace in Sweden in 1995. One outcome of this consultation was a set of guidelines which setout principles for the precautionary approach for capture fisheries
The precautionary approach must be followed by the MPI. Section 10 of the FisheriesAct Information principles states:” All persons exercising or performing functions, duties, orpowers under this Act, in relation to the utilisation of fisheries resources or ensuringsustainability, shall take into account the following information principles:
(a) Decisions should be based on the best available information:(b) Decision makers should consider any uncertainty in the information available in
any case:(c) Decision makers should be cautious when information is uncertain, unreliable, or
inadequate:(d) The absence of, or any uncertainty in, any information should not be used as a
reason for postponing or failing to take any measure to achieve the purpose of thisAct.
Evidence of the application of the precautionary approach is seen in the Ministry ofFisheries (2011) Review of Sustainability Measures and Other Management Controls forDeepwater Fisheries – Final Advice Paper.Thus, decision-making processes use the precautionary approach and are based on bestavailable information. This SI meets 80
d
Gu
idep
ost
Some information onfishery performance andmanagement action isgenerally available onrequest to stakeholders.
Information on fisheryperformance andmanagement action isavailable on request, andexplanations are providedfor any actions or lack ofaction associated withfindings and relevantrecommendationsemerging from research,monitoring, evaluationand review activity.
Formal reporting to all interestedstakeholders providescomprehensive information onfishery performance andmanagement actions and describeshow the management systemresponded to findings and relevantrecommendations emerging fromresearch, monitoring, evaluationand review activity.
Met? Y Y Y
Ju
stif
ica
tio
n
Management decision-making processes are clearly outlined in the Fisheries Act 1996.Intentions are shared through a transparent process, which includes long- and short-termgoals and objectives that are publically available (e.g., National Fisheries Plan, AnnualOperational Plan, Statements of Intent, Initial Position Papers, press releases and reports).These publications are considered to be responses or invitations to respond to findings andrelevant recommendations emerging from research, monitoring, evaluation and reviewactivity. These reports also include cultural/social issues as well as fisheries managementissues.Formal responses on management decisions research, monitoring and evaluation areprovided. Formal responses consistent with formalised reporting and consultation processessuch as the IPP/FAP process, the Stakeholder Consultation Process Standard or the NationalFisheries Plan for Deepwater and Middle- Depth Fisheries and the annual Operating Planfor Deepwater Fisheries are always provided to stakeholders. A score of 100 is given.
INTERTEK FISHERIES CERTIFICATION (IFC)
NZ Hake Fishery PCR Intertek Fisheries Certification page 151
PI 3.2.2The fishery-specific management system includes effective decision-making processesthat result in measures and strategies to achieve the objectives, and has an appropriateapproach to actual disputes in the fishery under assessment.
e
Gu
idep
ost
Although themanagement authority orfishery may be subject tocontinuing courtchallenges, it is notindicating a disrespect ordefiance of the law byrepeatedly violating thesame law or regulationnecessary for thesustainability for thefishery.
The management systemor fishery is attempting tocomply in a timelyfashion with judicialdecisions arising fromany legal challenges.
The management system or fisheryacts proactively to avoid legaldisputes or rapidly implementsjudicial decisions arising fromlegal challenges.
Met? Y Y Y
Ju
stif
ica
tio
n
There are procedures and processes under Part 7 of the Fisheries Act that apply to disputesabout the effects of fishing on the fishing activities of any person that has a current fishinginterest provided for under the Act. The Act provides opportunities to negotiate and resolvedisputes. The Minister may appoint a Disputes Commissioner and the Minister makes thefinal determination. However, this mechanism does not seem to be widely used. Rather, theconsultation process is an attempt to avoid unresolved disputes by ensuring all interestedparties have an opportunity to participate and have an input into decisions. There have beenoccasions when there has not been a satisfactory outcome and then this has gone to litigationand the Court has made a decision. The Memorandum of Understandings between theDeepwater Group Ltd and the MPI should encourage better working relationships, andavoid the need for litigation between the Ministry and industry. The management system istherefore subject by law to a transparent mechanism for the resolution of legal disputeswhich is considered to be effective in dealing with most issues and that is appropriate to thecontext of the fishery.There are procedures and processes under Part 7 of the Fisheries Act that apply to disputesabout the effects of fishing on the fishing activities of any person that has a current fishinginterest provided for under the Act. The Act provides opportunities to negotiate and resolvedisputes. Co-operation and partnership between the Ministry and Industry has beensuccessful in pre-empting disputes. The management system is therefore attempting tocomply in a timely fashion within binding judicial decisions arising from any legalchallenges.The ‘inform and assist’ compliance model, as well as the co-operation and partnershipbetween the Ministry and Industry have been successful in pre-empting disputes. MPICompliance acts proactively in providing education and awareness programmes, fact sheetsand meetings with management and industry. MPI Compliance also works collegiately withthe fishing industry to proactively avoid legal disputes.A score of 100 is given.
References
Fisheries Act 1996
MFish 2009a
MFish 2010 l
MFish 2011b
OVERALL PERFORMANCE INDICATOR SCORE: All of the scoring issues for the 60 and80 scoring guidepost are met as is two of the three for the 100 scoring guidepost.
95
CONDITION NUMBER (if relevant):
INTERTEK FISHERIES CERTIFICATION (IFC)
NZ Hake Fishery PCR Intertek Fisheries Certification page 152
Evaluation Table for PI 3.2.3
PI 3.2.3Monitoring, control and surveillance mechanisms ensure the fishery’s managementmeasures are enforced and complied with
Scoring Issue SG 60 SG 80 SG 100
a
Gu
idep
ost
Monitoring, control andsurveillance mechanismsexist, are implemented inthe fishery underassessment and there is areasonable expectationthat they are effective.
A monitoring, control andsurveillance system hasbeen implemented in thefishery under assessmentand has demonstrated anability to enforce relevantmanagement measures,strategies and/or rules.
A comprehensive monitoring,control and surveillance systemhas been implemented in thefishery under assessment and hasdemonstrated a consistent abilityto enforce relevant managementmeasures, strategies and/or rules.
Met? Y Y Y
The Hake management system has a comprehensive and effective monitoring, control andsurveillance system.
1. Satellite Vessel Monitoring System. All New Zealand fishing vessels exceeding28 m in overall length must participate in the compulsory satellite VesselMonitoring System (VMS) and carry and operate on board an automatic locationcommunicator (ALC) (see Fisheries (Satellite Vessel Monitoring) Regulations).Both the vessel operator and the vessel master must ensure that the ALC on boardis in working order and is transmitting information. It is an offence to not have aworking ALC on board, and the person in breach can be liable to a fine notexceeding $100,000 unless they can show that the breach occurred due toaccidental mechanical or technical failure.
2. Government observers may be placed on board any vessel for the purpose ofcollecting information for fisheries research, fisheries management, and fisheriesenforcement (Fisheries Act, ss 223-224). Observers may be placed on board toobserve fishing and as well as any transhipment, and transportation, and collect anyinformation on hake fisheries resources (including catch and effort information),and the effect of hake fishing on the aquatic environment (ss 223-224). Anyperson on board a fishing vessel who fails to provide reasonable assistance orhinders the observer in any way is committing an offence (s225).
3. Accurate Reporting and Recordkeeping. The Fisheries Act and FisheriesRegulations impose on all persons operating in the hake fisheries (including:fishers, masters and owners of vessels, and owners of premises, vessels or vehicleswhere fish is received, purchased, stored, transported, processed, or sold) record-keeping and recording requirements (Fisheries Act ss 187-195; also see FisheriesRegulations). The purpose of these requirements is to establish auditable andtraceable records to ensure all catches are counted and do not exceed the ACE heldby each operator (Fisheries Act s 190; also see Fisheries Regulations).Accurate reporting and recordkeeping also demonstrates effectiveness. Compliancewith recordkeeping and recording requirements is essential to fulfil the fishers legalobligations in relation to the commercial fishing for hake (Fisheries Act ss 189-190; also see Fisheries Regulations).The required returns include:
(a) catch, effort, and landing returns (CELR);(b) catch landing returns (CLR);
(c) trawl catch, effort, and processing returns (TCEPR); and(d) non-fish and protected species catch return (NF-PSCR).
INTERTEK FISHERIES CERTIFICATION (IFC)
NZ Hake Fishery PCR Intertek Fisheries Certification page 153
PI 3.2.3Monitoring, control and surveillance mechanisms ensure the fishery’s managementmeasures are enforced and complied with
Ju
stif
ica
tio
n
Other measures include: fishing permit requirements; requirement to hold ACE to cover all target and bycatch species caught, or
alternatively, to pay deemed values; fishing permit and fishing vessel registers; vessel and gear marking requirements; fishing gear and method restrictions; vessel inspections; control of landings (e.g. requirement to land only to licensed fish receivers); auditing of licensed fish receivers; control of transhipment; monitored unloads of fish; information management and intelligence analysis; analysis of catch and effort reporting and comparison with VMS, observer,
landing and trade data to confirm accuracy; boarding and inspection by fishery officers at sea; and aerial and surface surveillance.
Thus, a monitoring, control and surveillance system has been implemented in the fisheryunder assessment and has demonstrated an ability to enforce relevant managementmeasures, strategies and/or rules.A score of 100 is given.
b
Gu
idep
ost
Sanctions to deal withnon-compliance existand there is someevidence that they areapplied.
Sanctions to deal withnon-compliance exist, areconsistently applied andthought to provideeffective deterrence.
Sanctions to deal with non-compliance exist, are consistentlyapplied and demonstrably provideeffective deterrence.
Met? Y Y Y
Offences. The majority of offences against the Fisheries Act 1996 or any of the FisheriesRegulations are strict liability offences (s 240).Defences. For offences against the Fisheries Act 1996 or any of the Fisheries Regulations,the offender has to satisfy a reverse onus and establish that the offence was outside theircontrol, that they took reasonable precautions and exercised due diligence to avoid thecontravention and, where applicable, they returned fish that was unlawfully taken andcomplied with all recording and reporting requirements.Penalties - Penalties are very severe. They include:
- Monetary penalties and Imprisonment - Fines range $250 and $750 (forinfringement-type offences)to more serious intentional offences that in addition toimprisonment for up to five years, include a fine up to $500,000 (ss 231, 233 &252, also see Fisheries (Infringement Offences) Regulations 2001).
- Forfeiture of property. Upon conviction, any vessel and other property used inthe commission of any of the more serious fisheries offences will automatically beforfeited to the Crown. This is subject of course to the existence of ‘specialreasons’ (s 255 A-E).Forfeiture is in addition to other penalties imposed by theCourt (s 256).
- Prohibition. Upon conviction of two or more separate fisheries offences the courtshall, in addition to any other penalty imposed, prohibit, for a period of three years,from holding any licence or permit, engaging in fishing or fishing related activityand deriving any beneficial income from activities associated with the taking offish (s 257).
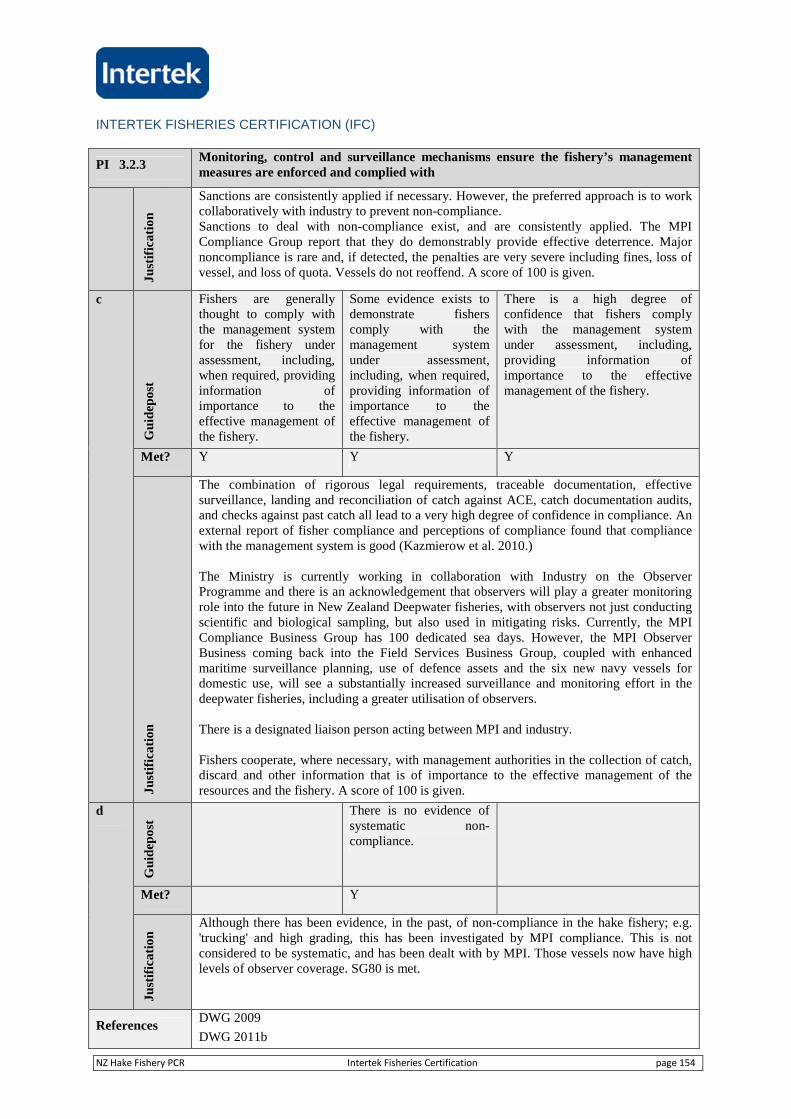
INTERTEK FISHERIES CERTIFICATION (IFC)
NZ Hake Fishery PCR Intertek Fisheries Certification page 154
PI 3.2.3Monitoring, control and surveillance mechanisms ensure the fishery’s managementmeasures are enforced and complied with
Ju
stif
ica
tio
n
Sanctions are consistently applied if necessary. However, the preferred approach is to workcollaboratively with industry to prevent non-compliance.Sanctions to deal with non-compliance exist, and are consistently applied. The MPICompliance Group report that they do demonstrably provide effective deterrence. Majornoncompliance is rare and, if detected, the penalties are very severe including fines, loss ofvessel, and loss of quota. Vessels do not reoffend. A score of 100 is given.
c
Gu
idep
ost
Fishers are generallythought to comply withthe management systemfor the fishery underassessment, including,when required, providinginformation ofimportance to theeffective management ofthe fishery.
Some evidence exists todemonstrate fisherscomply with themanagement systemunder assessment,including, when required,providing information ofimportance to theeffective management ofthe fishery.
There is a high degree ofconfidence that fishers complywith the management systemunder assessment, including,providing information ofimportance to the effectivemanagement of the fishery.
Met? Y Y Y
Ju
stif
ica
tio
n
The combination of rigorous legal requirements, traceable documentation, effectivesurveillance, landing and reconciliation of catch against ACE, catch documentation audits,and checks against past catch all lead to a very high degree of confidence in compliance. Anexternal report of fisher compliance and perceptions of compliance found that compliancewith the management system is good (Kazmierow et al. 2010.)
The Ministry is currently working in collaboration with Industry on the ObserverProgramme and there is an acknowledgement that observers will play a greater monitoringrole into the future in New Zealand Deepwater fisheries, with observers not just conductingscientific and biological sampling, but also used in mitigating risks. Currently, the MPICompliance Business Group has 100 dedicated sea days. However, the MPI ObserverBusiness coming back into the Field Services Business Group, coupled with enhancedmaritime surveillance planning, use of defence assets and the six new navy vessels fordomestic use, will see a substantially increased surveillance and monitoring effort in thedeepwater fisheries, including a greater utilisation of observers.
There is a designated liaison person acting between MPI and industry.
Fishers cooperate, where necessary, with management authorities in the collection of catch,discard and other information that is of importance to the effective management of theresources and the fishery. A score of 100 is given.
d
Gu
idep
ost
There is no evidence ofsystematic non-compliance.
Met? Y
Ju
stif
ica
tio
n
Although there has been evidence, in the past, of non-compliance in the hake fishery; e.g.'trucking' and high grading, this has been investigated by MPI compliance. This is notconsidered to be systematic, and has been dealt with by MPI. Those vessels now have highlevels of observer coverage. SG80 is met.
ReferencesDWG 2009
DWG 2011b
INTERTEK FISHERIES CERTIFICATION (IFC)
NZ Hake Fishery PCR Intertek Fisheries Certification page 155
PI 3.2.3Monitoring, control and surveillance mechanisms ensure the fishery’s managementmeasures are enforced and complied with
MFish 2009a
MFish 2010e
MFish 2010h
MFish 2010i
MFish 2010j
MPI 2013f
MPI 2013g
OVERALL PERFORMANCE INDICATOR SCORE: All of the scoring issues of the 60, 80and 100 scoring guideposts are met.
100
CONDITION NUMBER (if relevant):
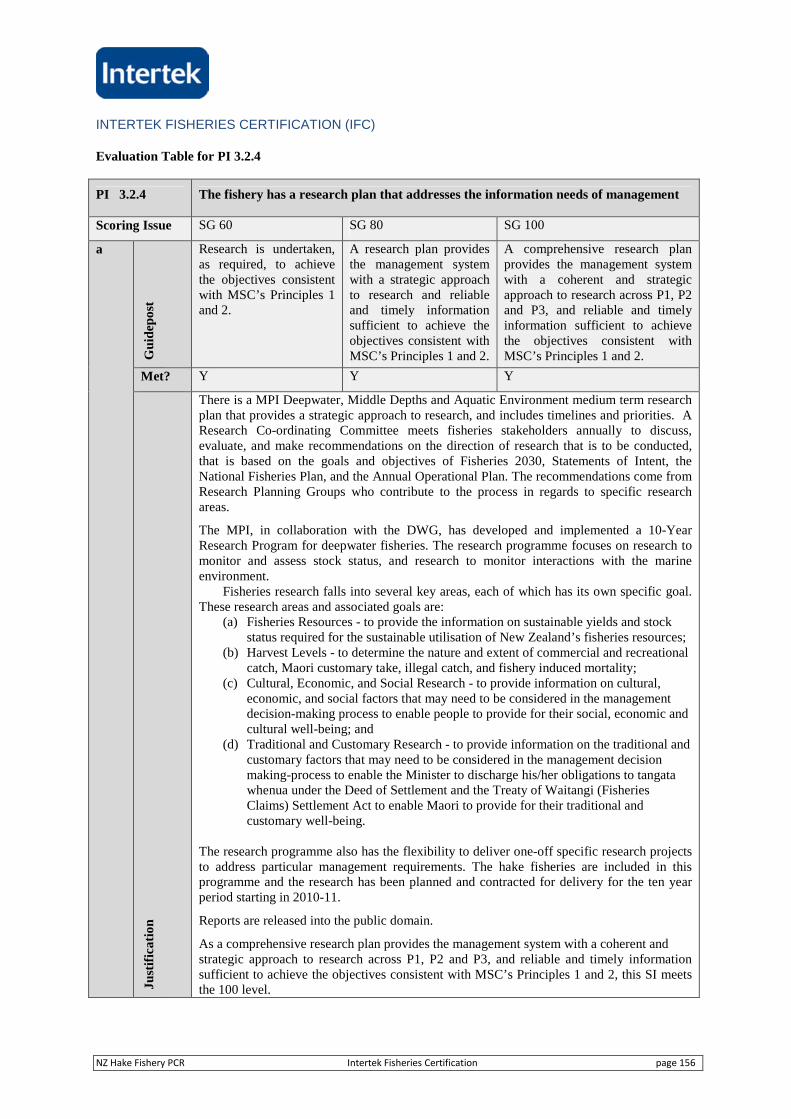
INTERTEK FISHERIES CERTIFICATION (IFC)
NZ Hake Fishery PCR Intertek Fisheries Certification page 156
Evaluation Table for PI 3.2.4
PI 3.2.4 The fishery has a research plan that addresses the information needs of management
Scoring Issue SG 60 SG 80 SG 100
a
Gu
idep
ost
Research is undertaken,as required, to achievethe objectives consistentwith MSC’s Principles 1and 2.
A research plan providesthe management systemwith a strategic approachto research and reliableand timely informationsufficient to achieve theobjectives consistent withMSC’s Principles 1 and 2.
A comprehensive research planprovides the management systemwith a coherent and strategicapproach to research across P1, P2and P3, and reliable and timelyinformation sufficient to achievethe objectives consistent withMSC’s Principles 1 and 2.
Met? Y Y Y
Ju
stif
ica
tio
n
There is a MPI Deepwater, Middle Depths and Aquatic Environment medium term researchplan that provides a strategic approach to research, and includes timelines and priorities. AResearch Co-ordinating Committee meets fisheries stakeholders annually to discuss,evaluate, and make recommendations on the direction of research that is to be conducted,that is based on the goals and objectives of Fisheries 2030, Statements of Intent, theNational Fisheries Plan, and the Annual Operational Plan. The recommendations come fromResearch Planning Groups who contribute to the process in regards to specific researchareas.
The MPI, in collaboration with the DWG, has developed and implemented a 10-YearResearch Program for deepwater fisheries. The research programme focuses on research tomonitor and assess stock status, and research to monitor interactions with the marineenvironment.
Fisheries research falls into several key areas, each of which has its own specific goal.These research areas and associated goals are:
(a) Fisheries Resources - to provide the information on sustainable yields and stockstatus required for the sustainable utilisation of New Zealand’s fisheries resources;
(b) Harvest Levels - to determine the nature and extent of commercial and recreationalcatch, Maori customary take, illegal catch, and fishery induced mortality;
(c) Cultural, Economic, and Social Research - to provide information on cultural,economic, and social factors that may need to be considered in the managementdecision-making process to enable people to provide for their social, economic andcultural well-being; and
(d) Traditional and Customary Research - to provide information on the traditional andcustomary factors that may need to be considered in the management decisionmaking-process to enable the Minister to discharge his/her obligations to tangatawhenua under the Deed of Settlement and the Treaty of Waitangi (FisheriesClaims) Settlement Act to enable Maori to provide for their traditional andcustomary well-being.
The research programme also has the flexibility to deliver one-off specific research projectsto address particular management requirements. The hake fisheries are included in thisprogramme and the research has been planned and contracted for delivery for the ten yearperiod starting in 2010-11.
Reports are released into the public domain.
As a comprehensive research plan provides the management system with a coherent andstrategic approach to research across P1, P2 and P3, and reliable and timely informationsufficient to achieve the objectives consistent with MSC’s Principles 1 and 2, this SI meetsthe 100 level.
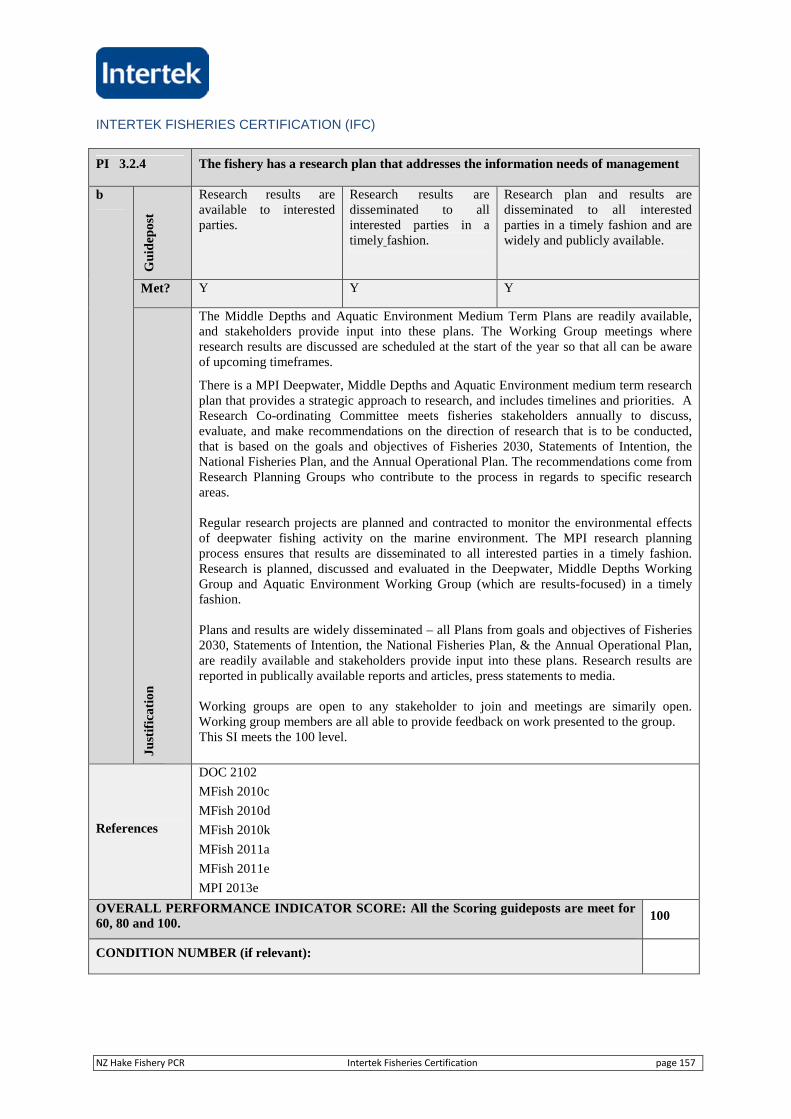
INTERTEK FISHERIES CERTIFICATION (IFC)
NZ Hake Fishery PCR Intertek Fisheries Certification page 157
PI 3.2.4 The fishery has a research plan that addresses the information needs of management
b
Gu
idep
ost
Research results areavailable to interestedparties.
Research results aredisseminated to allinterested parties in atimely fashion.
Research plan and results aredisseminated to all interestedparties in a timely fashion and arewidely and publicly available.
Met? Y Y Y
Ju
stif
ica
tio
n
The Middle Depths and Aquatic Environment Medium Term Plans are readily available,and stakeholders provide input into these plans. The Working Group meetings whereresearch results are discussed are scheduled at the start of the year so that all can be awareof upcoming timeframes.
There is a MPI Deepwater, Middle Depths and Aquatic Environment medium term researchplan that provides a strategic approach to research, and includes timelines and priorities. AResearch Co-ordinating Committee meets fisheries stakeholders annually to discuss,evaluate, and make recommendations on the direction of research that is to be conducted,that is based on the goals and objectives of Fisheries 2030, Statements of Intention, theNational Fisheries Plan, and the Annual Operational Plan. The recommendations come fromResearch Planning Groups who contribute to the process in regards to specific researchareas.
Regular research projects are planned and contracted to monitor the environmental effectsof deepwater fishing activity on the marine environment. The MPI research planningprocess ensures that results are disseminated to all interested parties in a timely fashion.Research is planned, discussed and evaluated in the Deepwater, Middle Depths WorkingGroup and Aquatic Environment Working Group (which are results-focused) in a timelyfashion.
Plans and results are widely disseminated – all Plans from goals and objectives of Fisheries2030, Statements of Intention, the National Fisheries Plan, & the Annual Operational Plan,are readily available and stakeholders provide input into these plans. Research results arereported in publically available reports and articles, press statements to media.
Working groups are open to any stakeholder to join and meetings are simarily open.Working group members are all able to provide feedback on work presented to the group.This SI meets the 100 level.
References
DOC 2102
MFish 2010c
MFish 2010d
MFish 2010k
MFish 2011a
MFish 2011e
MPI 2013e
OVERALL PERFORMANCE INDICATOR SCORE: All the Scoring guideposts are meet for60, 80 and 100.
100
CONDITION NUMBER (if relevant):
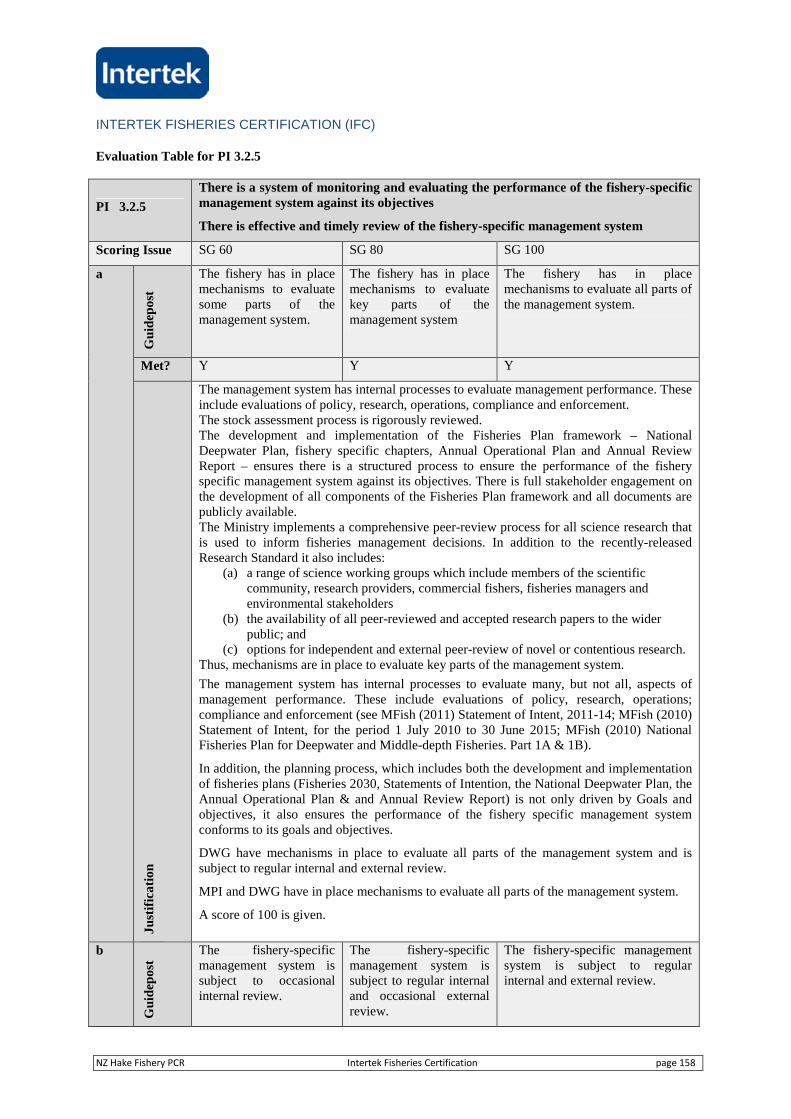
INTERTEK FISHERIES CERTIFICATION (IFC)
NZ Hake Fishery PCR Intertek Fisheries Certification page 158
Evaluation Table for PI 3.2.5
PI 3.2.5
There is a system of monitoring and evaluating the performance of the fishery-specificmanagement system against its objectives
There is effective and timely review of the fishery-specific management system
Scoring Issue SG 60 SG 80 SG 100
a
Gu
idep
ost
The fishery has in placemechanisms to evaluatesome parts of themanagement system.
The fishery has in placemechanisms to evaluatekey parts of themanagement system
The fishery has in placemechanisms to evaluate all parts ofthe management system.
Met? Y Y Y
Ju
stif
ica
tio
n
The management system has internal processes to evaluate management performance. Theseinclude evaluations of policy, research, operations, compliance and enforcement.The stock assessment process is rigorously reviewed.The development and implementation of the Fisheries Plan framework – NationalDeepwater Plan, fishery specific chapters, Annual Operational Plan and Annual ReviewReport – ensures there is a structured process to ensure the performance of the fisheryspecific management system against its objectives. There is full stakeholder engagement onthe development of all components of the Fisheries Plan framework and all documents arepublicly available.The Ministry implements a comprehensive peer-review process for all science research thatis used to inform fisheries management decisions. In addition to the recently-releasedResearch Standard it also includes:
(a) a range of science working groups which include members of the scientificcommunity, research providers, commercial fishers, fisheries managers andenvironmental stakeholders
(b) the availability of all peer-reviewed and accepted research papers to the widerpublic; and
(c) options for independent and external peer-review of novel or contentious research.Thus, mechanisms are in place to evaluate key parts of the management system.
The management system has internal processes to evaluate many, but not all, aspects ofmanagement performance. These include evaluations of policy, research, operations;compliance and enforcement (see MFish (2011) Statement of Intent, 2011-14; MFish (2010)Statement of Intent, for the period 1 July 2010 to 30 June 2015; MFish (2010) NationalFisheries Plan for Deepwater and Middle-depth Fisheries. Part 1A & 1B).
In addition, the planning process, which includes both the development and implementationof fisheries plans (Fisheries 2030, Statements of Intention, the National Deepwater Plan, theAnnual Operational Plan & and Annual Review Report) is not only driven by Goals andobjectives, it also ensures the performance of the fishery specific management systemconforms to its goals and objectives.
DWG have mechanisms in place to evaluate all parts of the management system and issubject to regular internal and external review.
MPI and DWG have in place mechanisms to evaluate all parts of the management system.
A score of 100 is given.
b
Gu
idep
ost
The fishery-specificmanagement system issubject to occasionalinternal review.
The fishery-specificmanagement system issubject to regular internaland occasional externalreview.
The fishery-specific managementsystem is subject to regularinternal and external review.
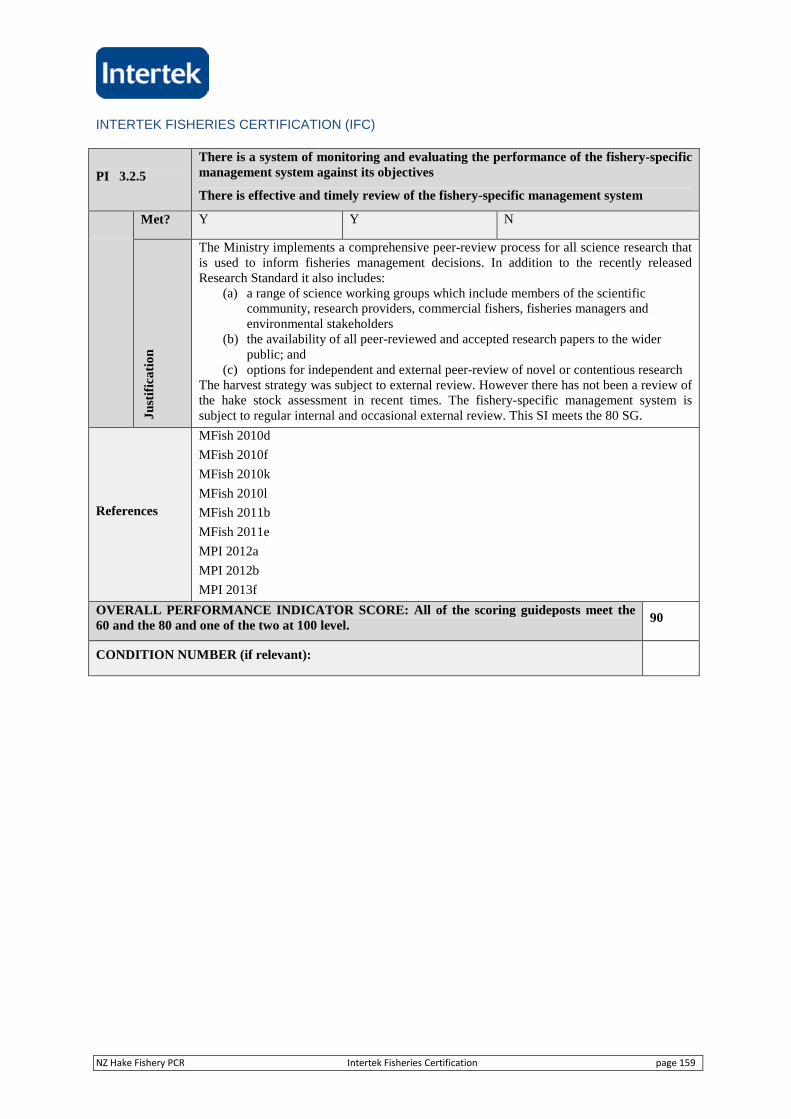
INTERTEK FISHERIES CERTIFICATION (IFC)
NZ Hake Fishery PCR Intertek Fisheries Certification page 159
PI 3.2.5
There is a system of monitoring and evaluating the performance of the fishery-specificmanagement system against its objectives
There is effective and timely review of the fishery-specific management system
Met? Y Y N
Ju
stif
ica
tio
n
The Ministry implements a comprehensive peer-review process for all science research thatis used to inform fisheries management decisions. In addition to the recently releasedResearch Standard it also includes:
(a) a range of science working groups which include members of the scientificcommunity, research providers, commercial fishers, fisheries managers andenvironmental stakeholders
(b) the availability of all peer-reviewed and accepted research papers to the widerpublic; and
(c) options for independent and external peer-review of novel or contentious researchThe harvest strategy was subject to external review. However there has not been a review ofthe hake stock assessment in recent times. The fishery-specific management system issubject to regular internal and occasional external review. This SI meets the 80 SG.
References
MFish 2010d
MFish 2010f
MFish 2010k
MFish 2010l
MFish 2011b
MFish 2011e
MPI 2012a
MPI 2012b
MPI 2013f
OVERALL PERFORMANCE INDICATOR SCORE: All of the scoring guideposts meet the60 and the 80 and one of the two at 100 level.
90
CONDITION NUMBER (if relevant):

INTERTEK FISHERIES CERTIFICATION (IFC)
NZ Hake Fishery PCR Intertek Fisheries Certification page 160
Appendix 1.2 Conditions
None raised
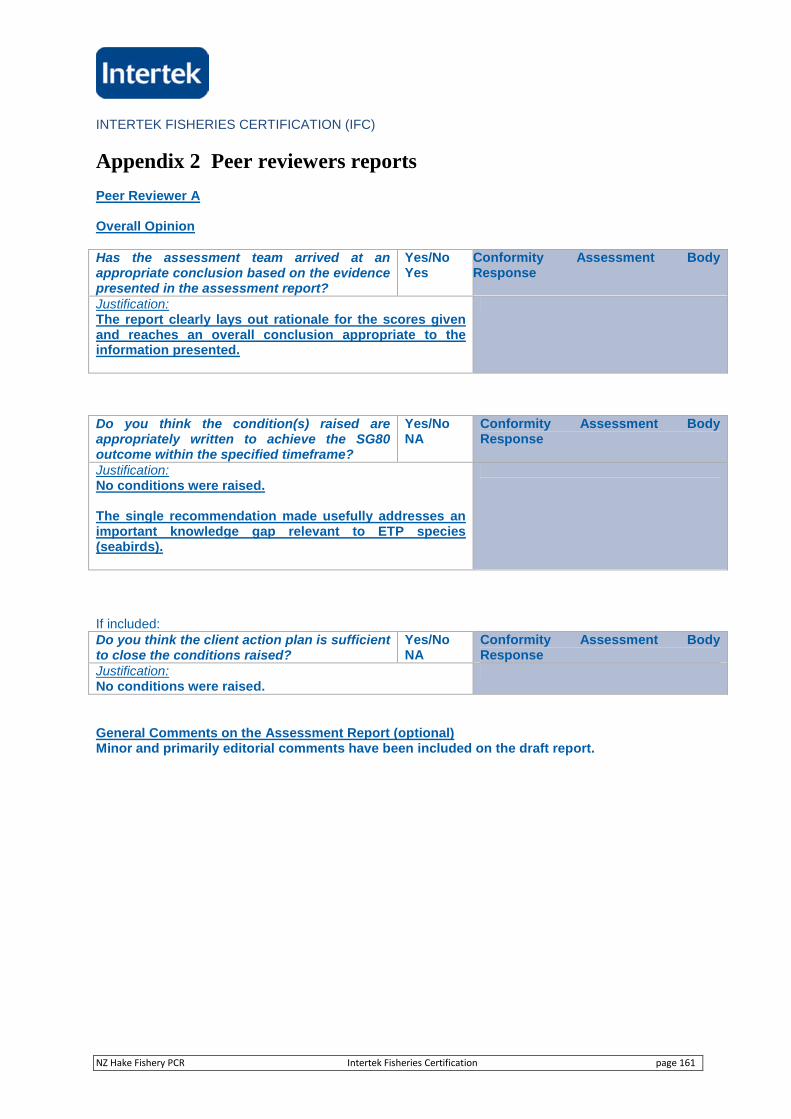
INTERTEK FISHERIES CERTIFICATION (IFC)
NZ Hake Fishery PCR Intertek Fisheries Certification page 161
Appendix 2 Peer reviewers reports
Peer Reviewer A
Overall Opinion
Has the assessment team arrived at anappropriate conclusion based on the evidencepresented in the assessment report?
Yes/NoYes
Conformity Assessment BodyResponse
Justification:The report clearly lays out rationale for the scores givenand reaches an overall conclusion appropriate to theinformation presented.
If included:Do you think the client action plan is sufficientto close the conditions raised?
Yes/NoNA
Conformity Assessment BodyResponse
Justification:No conditions were raised.
General Comments on the Assessment Report (optional)Minor and primarily editorial comments have been included on the draft report.
Do you think the condition(s) raised areappropriately written to achieve the SG80outcome within the specified timeframe?
Yes/NoNA
Conformity Assessment BodyResponse
Justification:No conditions were raised.
The single recommendation made usefully addresses animportant knowledge gap relevant to ETP species(seabirds).
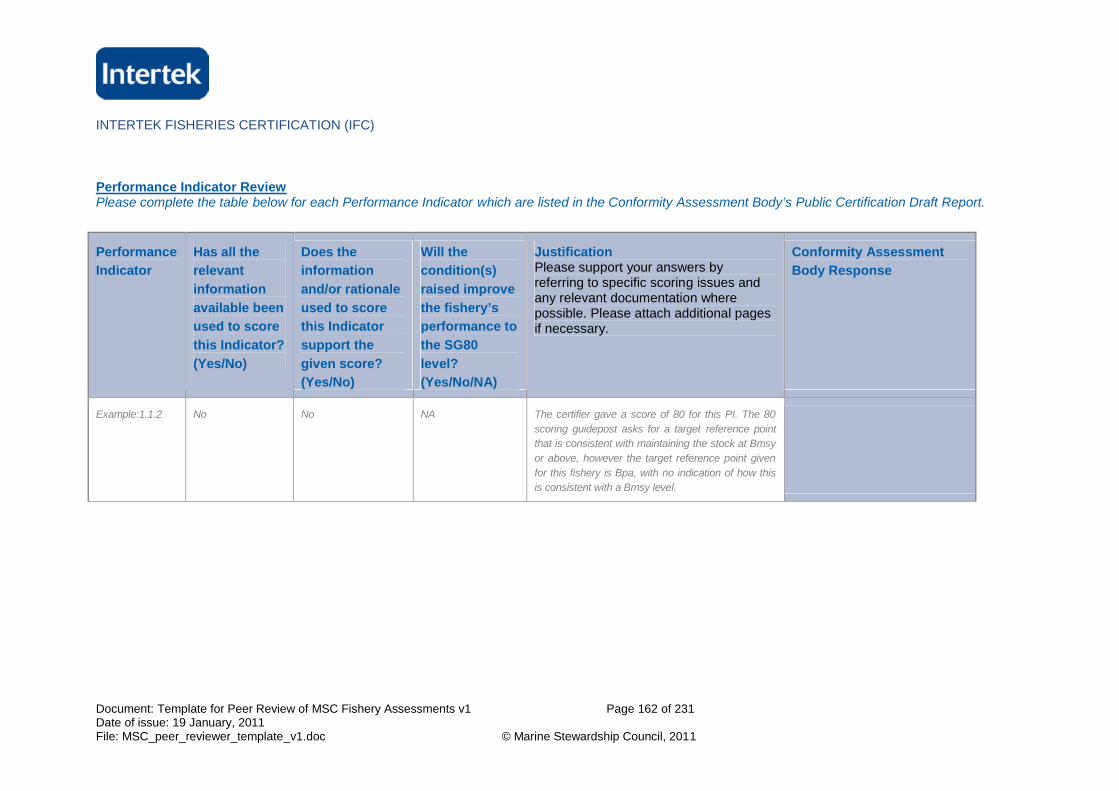
INTERTEK FISHERIES CERTIFICATION (IFC)
Document: Template for Peer Review of MSC Fishery Assessments v1 Page 162 of 231Date of issue: 19 January, 2011File: MSC_peer_reviewer_template_v1.doc © Marine Stewardship Council, 2011
Performance Indicator ReviewPlease complete the table below for each Performance Indicator which are listed in the Conformity Assessment Body’s Public Certification Draft Report.
Performance
Indicator
Has all the
relevant
information
available been
used to score
this Indicator?
(Yes/No)
Does the
information
and/or rationale
used to score
this Indicator
support the
given score?
(Yes/No)
Will the
condition(s)
raised improve
the fishery’s
performance to
the SG80
level?
(Yes/No/NA)
JustificationPlease support your answers byreferring to specific scoring issues andany relevant documentation wherepossible. Please attach additional pagesif necessary.
Conformity Assessment
Body Response
Example:1.1.2 No No NA The certifier gave a score of 80 for this PI. The 80
scoring guidepost asks for a target reference point
that is consistent with maintaining the stock at Bmsy
or above, however the target reference point given
for this fishery is Bpa, with no indication of how this
is consistent with a Bmsy level.
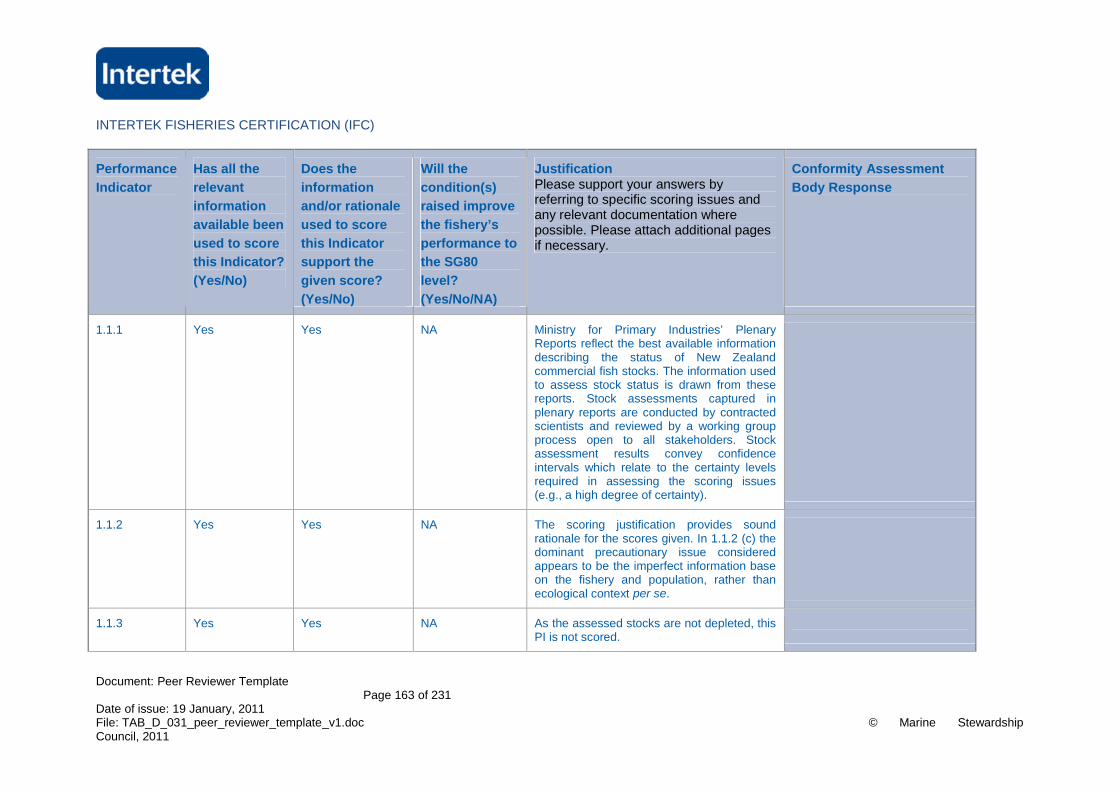
INTERTEK FISHERIES CERTIFICATION (IFC)
Document: Peer Reviewer TemplatePage 163 of 231
Date of issue: 19 January, 2011File: TAB_D_031_peer_reviewer_template_v1.doc © Marine StewardshipCouncil, 2011
Performance
Indicator
Has all the
relevant
information
available been
used to score
this Indicator?
(Yes/No)
Does the
information
and/or rationale
used to score
this Indicator
support the
given score?
(Yes/No)
Will the
condition(s)
raised improve
the fishery’s
performance to
the SG80
level?
(Yes/No/NA)
JustificationPlease support your answers byreferring to specific scoring issues andany relevant documentation wherepossible. Please attach additional pagesif necessary.
Conformity Assessment
Body Response
1.1.1 Yes Yes NA Ministry for Primary Industries’ PlenaryReports reflect the best available informationdescribing the status of New Zealandcommercial fish stocks. The information usedto assess stock status is drawn from thesereports. Stock assessments captured inplenary reports are conducted by contractedscientists and reviewed by a working groupprocess open to all stakeholders. Stockassessment results convey confidenceintervals which relate to the certainty levelsrequired in assessing the scoring issues(e.g., a high degree of certainty).
1.1.2 Yes Yes NA The scoring justification provides soundrationale for the scores given. In 1.1.2 (c) thedominant precautionary issue consideredappears to be the imperfect information baseon the fishery and population, rather thanecological context per se.
1.1.3 Yes Yes NA As the assessed stocks are not depleted, thisPI is not scored.
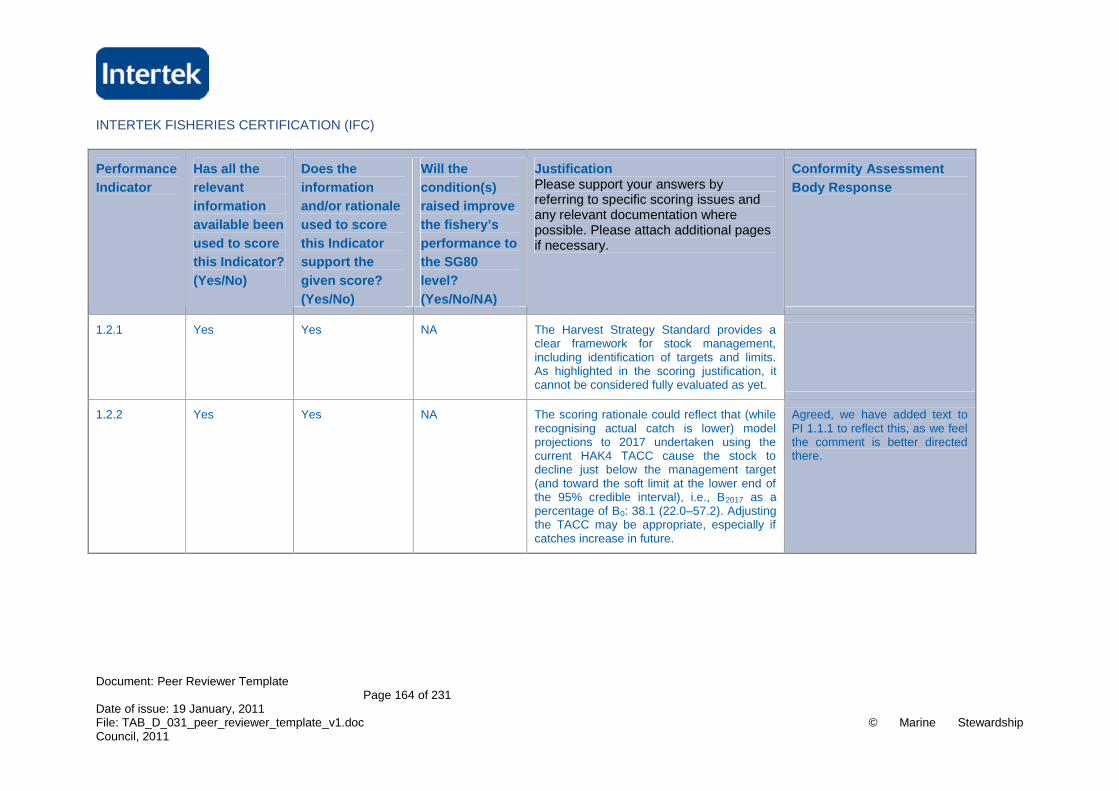
INTERTEK FISHERIES CERTIFICATION (IFC)
Document: Peer Reviewer TemplatePage 164 of 231
Date of issue: 19 January, 2011File: TAB_D_031_peer_reviewer_template_v1.doc © Marine StewardshipCouncil, 2011
Performance
Indicator
Has all the
relevant
information
available been
used to score
this Indicator?
(Yes/No)
Does the
information
and/or rationale
used to score
this Indicator
support the
given score?
(Yes/No)
Will the
condition(s)
raised improve
the fishery’s
performance to
the SG80
level?
(Yes/No/NA)
JustificationPlease support your answers byreferring to specific scoring issues andany relevant documentation wherepossible. Please attach additional pagesif necessary.
Conformity Assessment
Body Response
1.2.1 Yes Yes NA The Harvest Strategy Standard provides aclear framework for stock management,including identification of targets and limits.As highlighted in the scoring justification, itcannot be considered fully evaluated as yet.
1.2.2 Yes Yes NA The scoring rationale could reflect that (whilerecognising actual catch is lower) modelprojections to 2017 undertaken using thecurrent HAK4 TACC cause the stock todecline just below the management target(and toward the soft limit at the lower end ofthe 95% credible interval), i.e., B2017 as apercentage of B0: 38.1 (22.0–57.2). Adjustingthe TACC may be appropriate, especially ifcatches increase in future.
Agreed, we have added text toPI 1.1.1 to reflect this, as we feelthe comment is better directedthere.
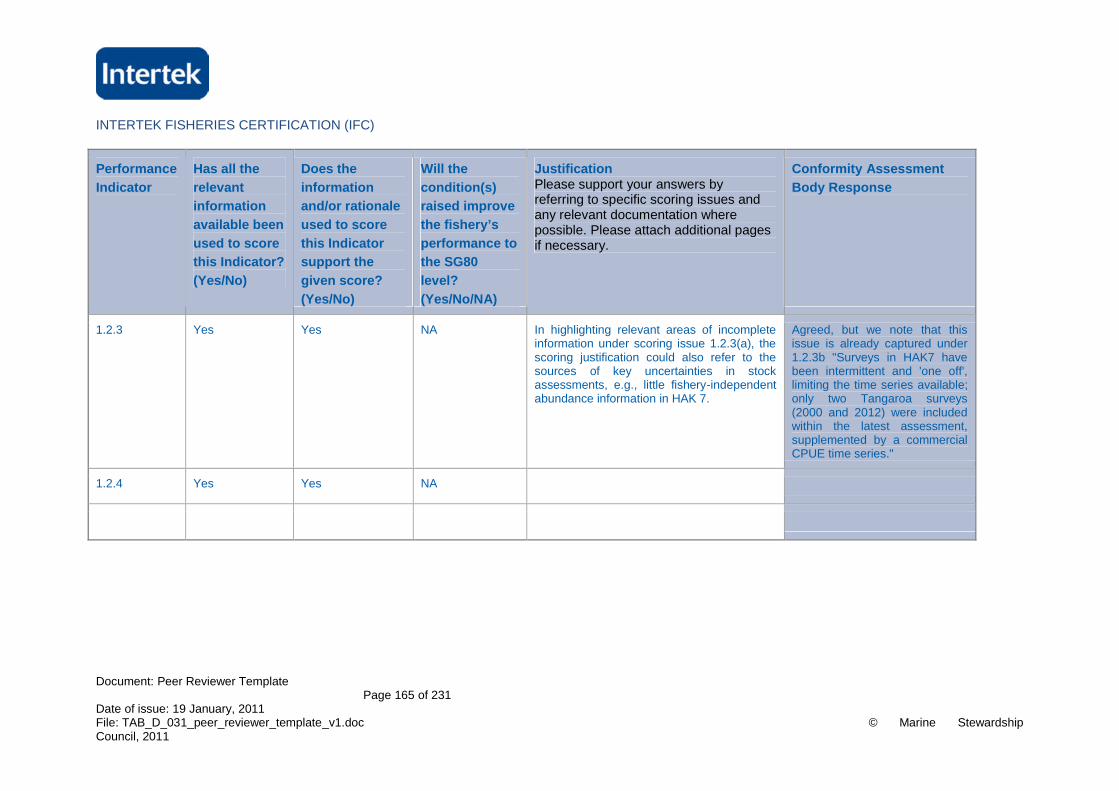
INTERTEK FISHERIES CERTIFICATION (IFC)
Document: Peer Reviewer TemplatePage 165 of 231
Date of issue: 19 January, 2011File: TAB_D_031_peer_reviewer_template_v1.doc © Marine StewardshipCouncil, 2011
Performance
Indicator
Has all the
relevant
information
available been
used to score
this Indicator?
(Yes/No)
Does the
information
and/or rationale
used to score
this Indicator
support the
given score?
(Yes/No)
Will the
condition(s)
raised improve
the fishery’s
performance to
the SG80
level?
(Yes/No/NA)
JustificationPlease support your answers byreferring to specific scoring issues andany relevant documentation wherepossible. Please attach additional pagesif necessary.
Conformity Assessment
Body Response
1.2.3 Yes Yes NA In highlighting relevant areas of incompleteinformation under scoring issue 1.2.3(a), thescoring justification could also refer to thesources of key uncertainties in stockassessments, e.g., little fishery-independentabundance information in HAK 7.
Agreed, but we note that thisissue is already captured under1.2.3b "Surveys in HAK7 havebeen intermittent and 'one off',limiting the time series available;only two Tangaroa surveys(2000 and 2012) were includedwithin the latest assessment,supplemented by a commercialCPUE time series."
1.2.4 Yes Yes NA
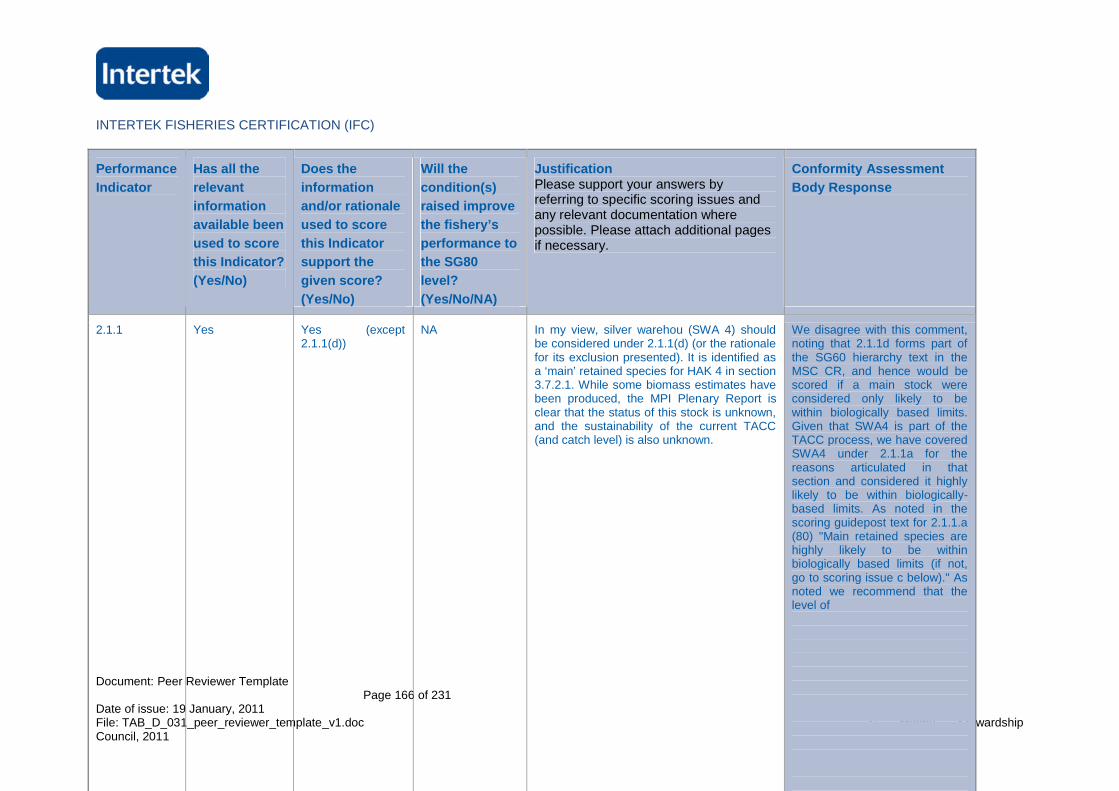
INTERTEK FISHERIES CERTIFICATION (IFC)
Document: Peer Reviewer TemplatePage 166 of 231
Date of issue: 19 January, 2011File: TAB_D_031_peer_reviewer_template_v1.doc © Marine StewardshipCouncil, 2011
Performance
Indicator
Has all the
relevant
information
available been
used to score
this Indicator?
(Yes/No)
Does the
information
and/or rationale
used to score
this Indicator
support the
given score?
(Yes/No)
Will the
condition(s)
raised improve
the fishery’s
performance to
the SG80
level?
(Yes/No/NA)
JustificationPlease support your answers byreferring to specific scoring issues andany relevant documentation wherepossible. Please attach additional pagesif necessary.
Conformity Assessment
Body Response
2.1.1 Yes Yes (except2.1.1(d))
NA In my view, silver warehou (SWA 4) shouldbe considered under 2.1.1(d) (or the rationalefor its exclusion presented). It is identified asa ‘main’ retained species for HAK 4 in section3.7.2.1. While some biomass estimates havebeen produced, the MPI Plenary Report isclear that the status of this stock is unknown,and the sustainability of the current TACC(and catch level) is also unknown.
We disagree with this comment,noting that 2.1.1d forms part ofthe SG60 hierarchy text in theMSC CR, and hence would bescored if a main stock wereconsidered only likely to bewithin biologically based limits.Given that SWA4 is part of theTACC process, we have coveredSWA4 under 2.1.1a for thereasons articulated in thatsection and considered it highlylikely to be within biologically-based limits. As noted in thescoring guidepost text for 2.1.1.a(80) "Main retained species arehighly likely to be withinbiologically based limits (if not,go to scoring issue c below)." Asnoted we recommend that thelevel of
capture should be monitored in
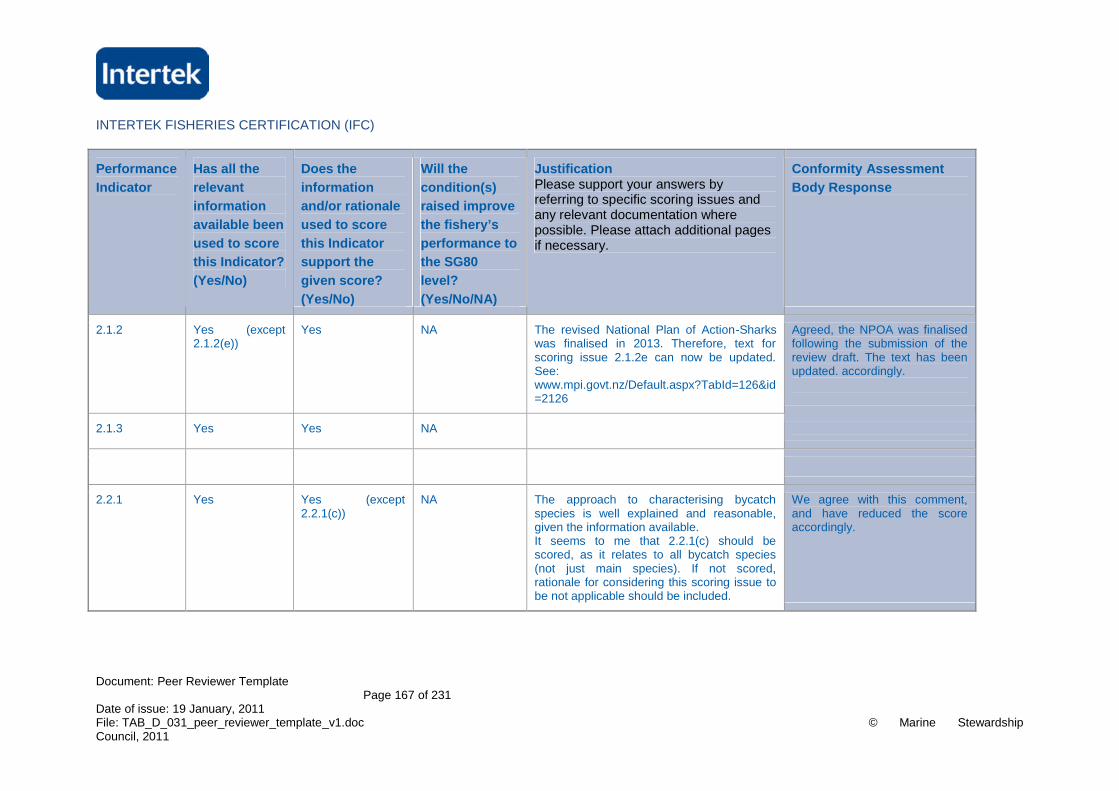
INTERTEK FISHERIES CERTIFICATION (IFC)
Document: Peer Reviewer TemplatePage 167 of 231
Date of issue: 19 January, 2011File: TAB_D_031_peer_reviewer_template_v1.doc © Marine StewardshipCouncil, 2011
Performance
Indicator
Has all the
relevant
information
available been
used to score
this Indicator?
(Yes/No)
Does the
information
and/or rationale
used to score
this Indicator
support the
given score?
(Yes/No)
Will the
condition(s)
raised improve
the fishery’s
performance to
the SG80
level?
(Yes/No/NA)
JustificationPlease support your answers byreferring to specific scoring issues andany relevant documentation wherepossible. Please attach additional pagesif necessary.
Conformity Assessment
Body Response
2.1.2 Yes (except2.1.2(e))
Yes NA The revised National Plan of Action-Sharkswas finalised in 2013. Therefore, text forscoring issue 2.1.2e can now be updated.See:www.mpi.govt.nz/Default.aspx?TabId=126&id=2126
Agreed, the NPOA was finalisedfollowing the submission of thereview draft. The text has beenupdated. accordingly.
2.1.3 Yes Yes NA
2.2.1 Yes Yes (except2.2.1(c))
NA The approach to characterising bycatchspecies is well explained and reasonable,given the information available.It seems to me that 2.2.1(c) should bescored, as it relates to all bycatch species(not just main species). If not scored,rationale for considering this scoring issue tobe not applicable should be included.
We agree with this comment,and have reduced the scoreaccordingly.
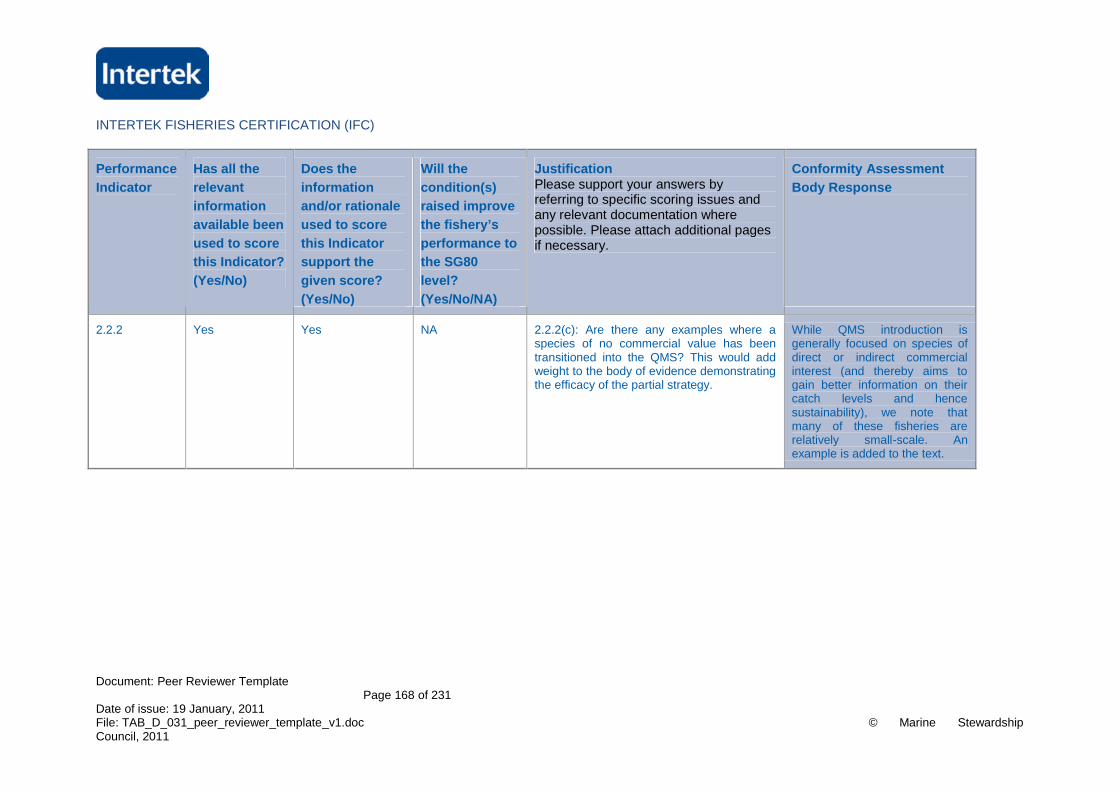
INTERTEK FISHERIES CERTIFICATION (IFC)
Document: Peer Reviewer TemplatePage 168 of 231
Date of issue: 19 January, 2011File: TAB_D_031_peer_reviewer_template_v1.doc © Marine StewardshipCouncil, 2011
Performance
Indicator
Has all the
relevant
information
available been
used to score
this Indicator?
(Yes/No)
Does the
information
and/or rationale
used to score
this Indicator
support the
given score?
(Yes/No)
Will the
condition(s)
raised improve
the fishery’s
performance to
the SG80
level?
(Yes/No/NA)
JustificationPlease support your answers byreferring to specific scoring issues andany relevant documentation wherepossible. Please attach additional pagesif necessary.
Conformity Assessment
Body Response
2.2.2 Yes Yes NA 2.2.2(c): Are there any examples where aspecies of no commercial value has beentransitioned into the QMS? This would addweight to the body of evidence demonstratingthe efficacy of the partial strategy.
While QMS introduction isgenerally focused on species ofdirect or indirect commercialinterest (and thereby aims togain better information on theircatch levels and hencesustainability), we note thatmany of these fisheries arerelatively small-scale. Anexample is added to the text.
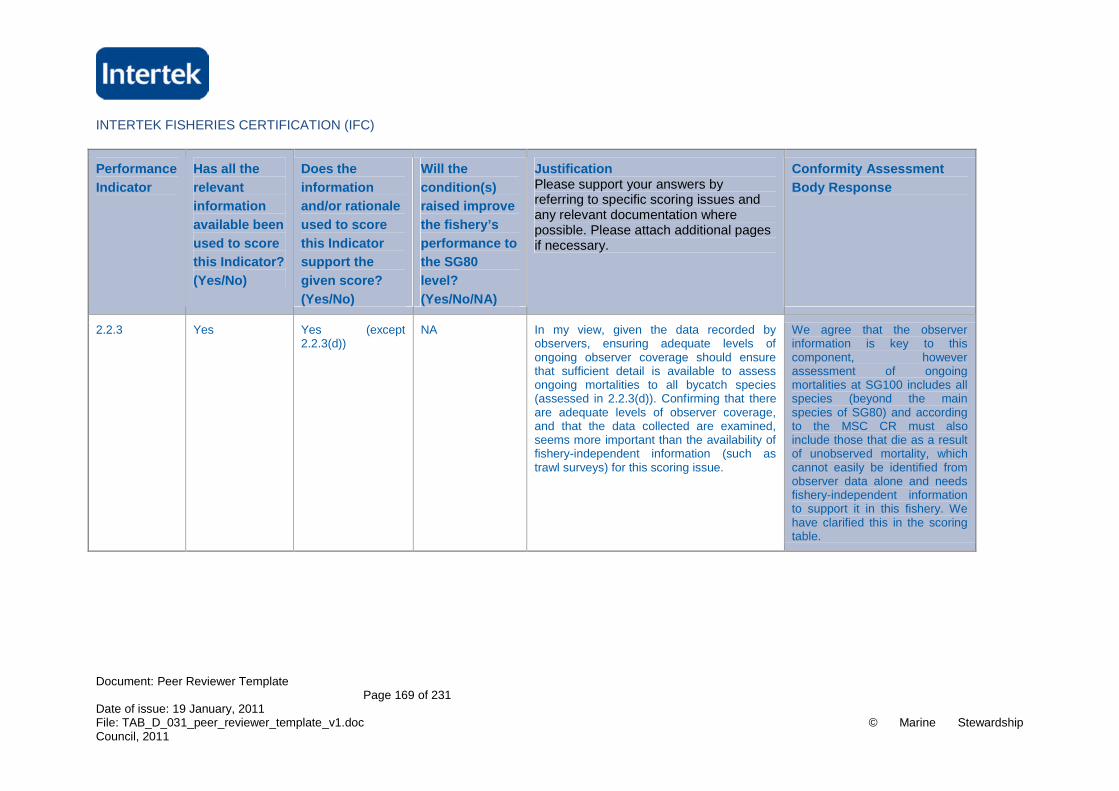
INTERTEK FISHERIES CERTIFICATION (IFC)
Document: Peer Reviewer TemplatePage 169 of 231
Date of issue: 19 January, 2011File: TAB_D_031_peer_reviewer_template_v1.doc © Marine StewardshipCouncil, 2011
Performance
Indicator
Has all the
relevant
information
available been
used to score
this Indicator?
(Yes/No)
Does the
information
and/or rationale
used to score
this Indicator
support the
given score?
(Yes/No)
Will the
condition(s)
raised improve
the fishery’s
performance to
the SG80
level?
(Yes/No/NA)
JustificationPlease support your answers byreferring to specific scoring issues andany relevant documentation wherepossible. Please attach additional pagesif necessary.
Conformity Assessment
Body Response
2.2.3 Yes Yes (except2.2.3(d))
NA In my view, given the data recorded byobservers, ensuring adequate levels ofongoing observer coverage should ensurethat sufficient detail is available to assessongoing mortalities to all bycatch species(assessed in 2.2.3(d)). Confirming that thereare adequate levels of observer coverage,and that the data collected are examined,seems more important than the availability offishery-independent information (such astrawl surveys) for this scoring issue.
We agree that the observerinformation is key to thiscomponent, howeverassessment of ongoingmortalities at SG100 includes allspecies (beyond the mainspecies of SG80) and accordingto the MSC CR must alsoinclude those that die as a resultof unobserved mortality, whichcannot easily be identified fromobserver data alone and needsfishery-independent informationto support it in this fishery. Wehave clarified this in the scoringtable.
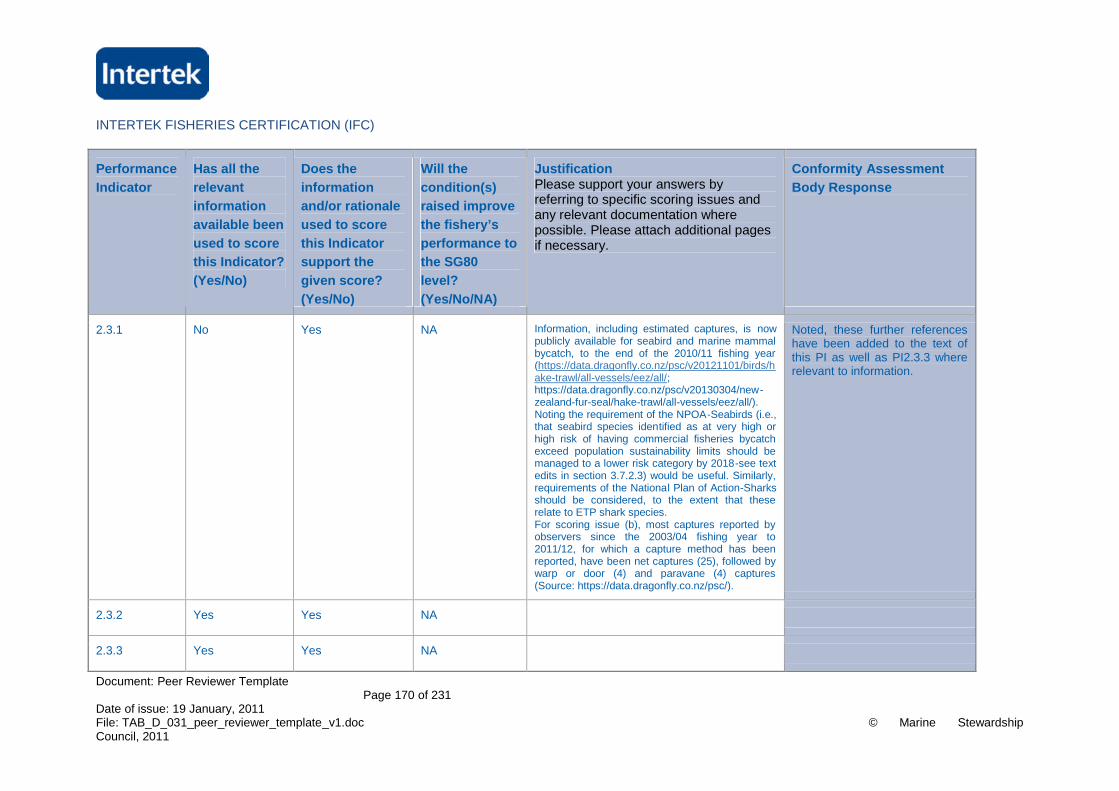
INTERTEK FISHERIES CERTIFICATION (IFC)
Document: Peer Reviewer TemplatePage 170 of 231
Date of issue: 19 January, 2011File: TAB_D_031_peer_reviewer_template_v1.doc © Marine StewardshipCouncil, 2011
Performance
Indicator
Has all the
relevant
information
available been
used to score
this Indicator?
(Yes/No)
Does the
information
and/or rationale
used to score
this Indicator
support the
given score?
(Yes/No)
Will the
condition(s)
raised improve
the fishery’s
performance to
the SG80
level?
(Yes/No/NA)
JustificationPlease support your answers byreferring to specific scoring issues andany relevant documentation wherepossible. Please attach additional pagesif necessary.
Conformity Assessment
Body Response
2.3.1 No Yes NA Information, including estimated captures, is nowpublicly available for seabird and marine mammalbycatch, to the end of the 2010/11 fishing year(https://data.dragonfly.co.nz/psc/v20121101/birds/hake-trawl/all-vessels/eez/all/;https://data.dragonfly.co.nz/psc/v20130304/new-zealand-fur-seal/hake-trawl/all-vessels/eez/all/).Noting the requirement of the NPOA-Seabirds (i.e.,that seabird species identified as at very high orhigh risk of having commercial fisheries bycatchexceed population sustainability limits should bemanaged to a lower risk category by 2018-see textedits in section 3.7.2.3) would be useful. Similarly,requirements of the National Plan of Action-Sharksshould be considered, to the extent that theserelate to ETP shark species.For scoring issue (b), most captures reported byobservers since the 2003/04 fishing year to2011/12, for which a capture method has beenreported, have been net captures (25), followed bywarp or door (4) and paravane (4) captures(Source: https://data.dragonfly.co.nz/psc/).
Noted, these further referenceshave been added to the text ofthis PI as well as PI2.3.3 whererelevant to information.
2.3.2 Yes Yes NA
2.3.3 Yes Yes NA
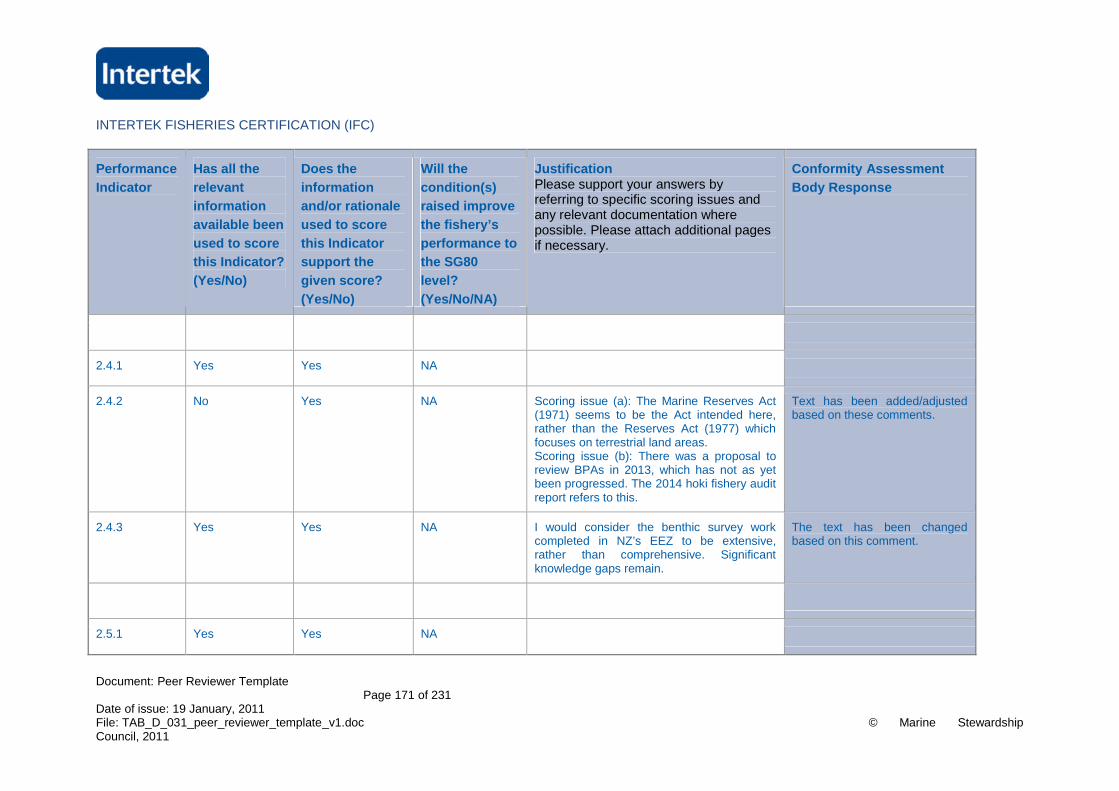
INTERTEK FISHERIES CERTIFICATION (IFC)
Document: Peer Reviewer TemplatePage 171 of 231
Date of issue: 19 January, 2011File: TAB_D_031_peer_reviewer_template_v1.doc © Marine StewardshipCouncil, 2011
Performance
Indicator
Has all the
relevant
information
available been
used to score
this Indicator?
(Yes/No)
Does the
information
and/or rationale
used to score
this Indicator
support the
given score?
(Yes/No)
Will the
condition(s)
raised improve
the fishery’s
performance to
the SG80
level?
(Yes/No/NA)
JustificationPlease support your answers byreferring to specific scoring issues andany relevant documentation wherepossible. Please attach additional pagesif necessary.
Conformity Assessment
Body Response
2.4.1 Yes Yes NA
2.4.2 No Yes NA Scoring issue (a): The Marine Reserves Act(1971) seems to be the Act intended here,rather than the Reserves Act (1977) whichfocuses on terrestrial land areas.Scoring issue (b): There was a proposal toreview BPAs in 2013, which has not as yetbeen progressed. The 2014 hoki fishery auditreport refers to this.
Text has been added/adjustedbased on these comments.
2.4.3 Yes Yes NA I would consider the benthic survey workcompleted in NZ’s EEZ to be extensive,rather than comprehensive. Significantknowledge gaps remain.
The text has been changedbased on this comment.
2.5.1 Yes Yes NA
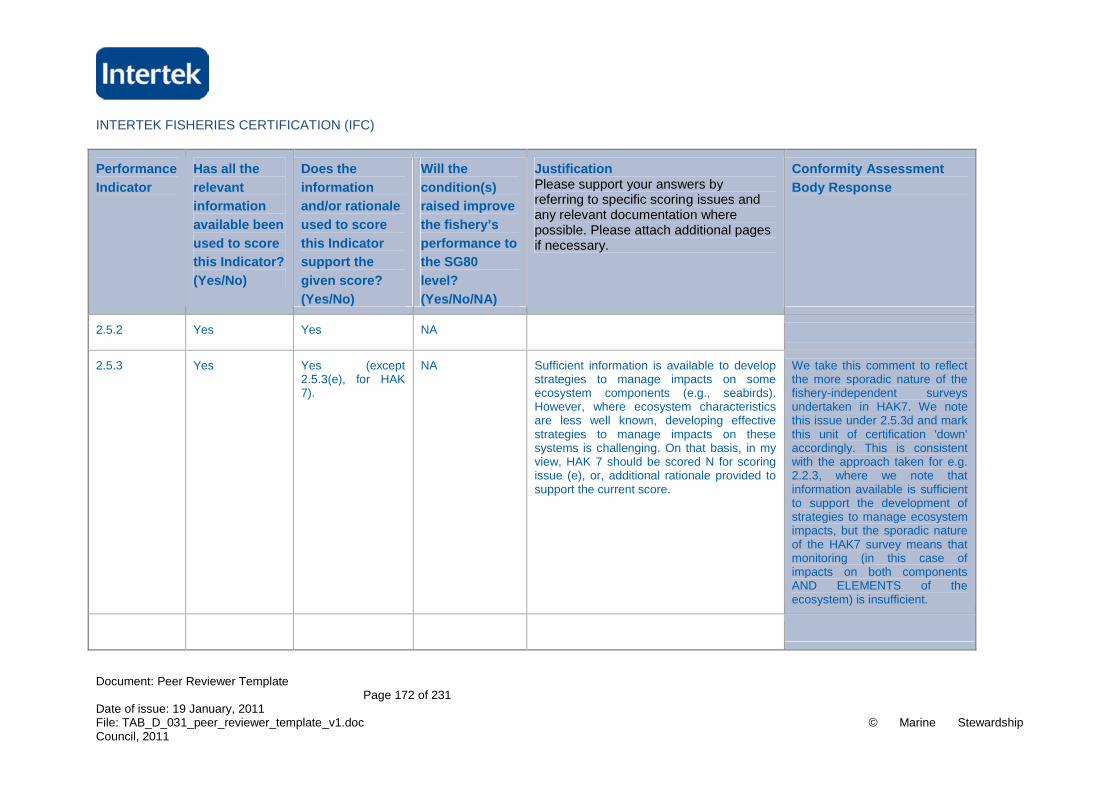
INTERTEK FISHERIES CERTIFICATION (IFC)
Document: Peer Reviewer TemplatePage 172 of 231
Date of issue: 19 January, 2011File: TAB_D_031_peer_reviewer_template_v1.doc © Marine StewardshipCouncil, 2011
Performance
Indicator
Has all the
relevant
information
available been
used to score
this Indicator?
(Yes/No)
Does the
information
and/or rationale
used to score
this Indicator
support the
given score?
(Yes/No)
Will the
condition(s)
raised improve
the fishery’s
performance to
the SG80
level?
(Yes/No/NA)
JustificationPlease support your answers byreferring to specific scoring issues andany relevant documentation wherepossible. Please attach additional pagesif necessary.
Conformity Assessment
Body Response
2.5.2 Yes Yes NA
2.5.3 Yes Yes (except2.5.3(e), for HAK7).
NA Sufficient information is available to developstrategies to manage impacts on someecosystem components (e.g., seabirds).However, where ecosystem characteristicsare less well known, developing effectivestrategies to manage impacts on thesesystems is challenging. On that basis, in myview, HAK 7 should be scored N for scoringissue (e), or, additional rationale provided tosupport the current score.
We take this comment to reflectthe more sporadic nature of thefishery-independent surveysundertaken in HAK7. We notethis issue under 2.5.3d and markthis unit of certification 'down'accordingly. This is consistentwith the approach taken for e.g.2.2.3, where we note thatinformation available is sufficientto support the development ofstrategies to manage ecosystemimpacts, but the sporadic natureof the HAK7 survey means thatmonitoring (in this case ofimpacts on both componentsAND ELEMENTS of theecosystem) is insufficient.
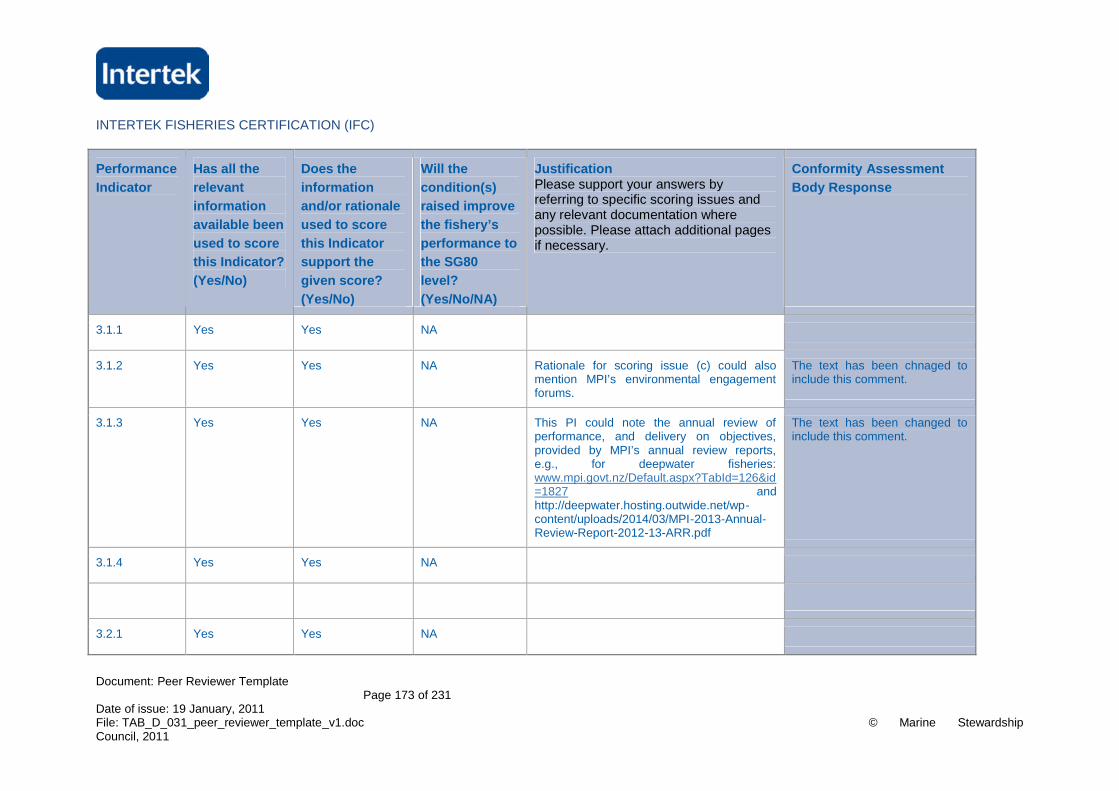
INTERTEK FISHERIES CERTIFICATION (IFC)
Document: Peer Reviewer TemplatePage 173 of 231
Date of issue: 19 January, 2011File: TAB_D_031_peer_reviewer_template_v1.doc © Marine StewardshipCouncil, 2011
Performance
Indicator
Has all the
relevant
information
available been
used to score
this Indicator?
(Yes/No)
Does the
information
and/or rationale
used to score
this Indicator
support the
given score?
(Yes/No)
Will the
condition(s)
raised improve
the fishery’s
performance to
the SG80
level?
(Yes/No/NA)
JustificationPlease support your answers byreferring to specific scoring issues andany relevant documentation wherepossible. Please attach additional pagesif necessary.
Conformity Assessment
Body Response
3.1.1 Yes Yes NA
3.1.2 Yes Yes NA Rationale for scoring issue (c) could alsomention MPI’s environmental engagementforums.
The text has been chnaged toinclude this comment.
3.1.3 Yes Yes NA This PI could note the annual review ofperformance, and delivery on objectives,provided by MPI’s annual review reports,e.g., for deepwater fisheries:www.mpi.govt.nz/Default.aspx?TabId=126&id=1827 andhttp://deepwater.hosting.outwide.net/wp-content/uploads/2014/03/MPI-2013-Annual-Review-Report-2012-13-ARR.pdf
The text has been changed toinclude this comment.
3.1.4 Yes Yes NA
3.2.1 Yes Yes NA
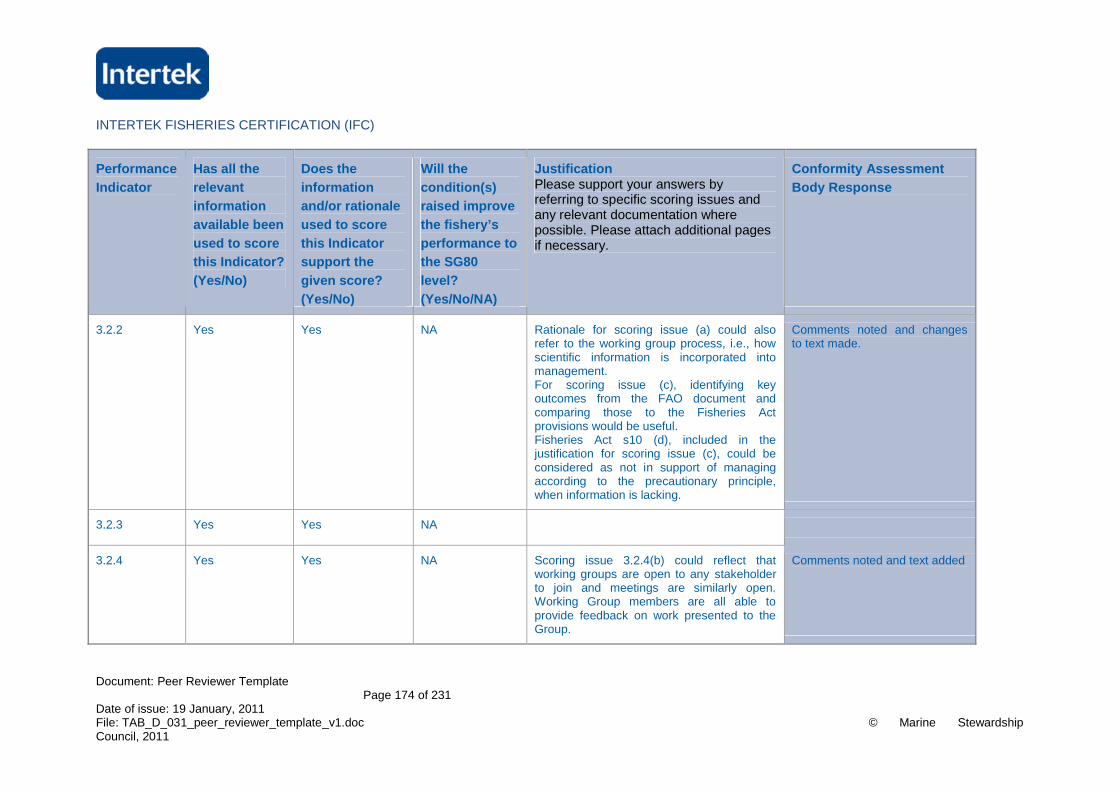
INTERTEK FISHERIES CERTIFICATION (IFC)
Document: Peer Reviewer TemplatePage 174 of 231
Date of issue: 19 January, 2011File: TAB_D_031_peer_reviewer_template_v1.doc © Marine StewardshipCouncil, 2011
Performance
Indicator
Has all the
relevant
information
available been
used to score
this Indicator?
(Yes/No)
Does the
information
and/or rationale
used to score
this Indicator
support the
given score?
(Yes/No)
Will the
condition(s)
raised improve
the fishery’s
performance to
the SG80
level?
(Yes/No/NA)
JustificationPlease support your answers byreferring to specific scoring issues andany relevant documentation wherepossible. Please attach additional pagesif necessary.
Conformity Assessment
Body Response
3.2.2 Yes Yes NA Rationale for scoring issue (a) could alsorefer to the working group process, i.e., howscientific information is incorporated intomanagement.For scoring issue (c), identifying keyoutcomes from the FAO document andcomparing those to the Fisheries Actprovisions would be useful.Fisheries Act s10 (d), included in thejustification for scoring issue (c), could beconsidered as not in support of managingaccording to the precautionary principle,when information is lacking.
Comments noted and changesto text made.
3.2.3 Yes Yes NA
3.2.4 Yes Yes NA Scoring issue 3.2.4(b) could reflect thatworking groups are open to any stakeholderto join and meetings are similarly open.Working Group members are all able toprovide feedback on work presented to theGroup.
Comments noted and text added
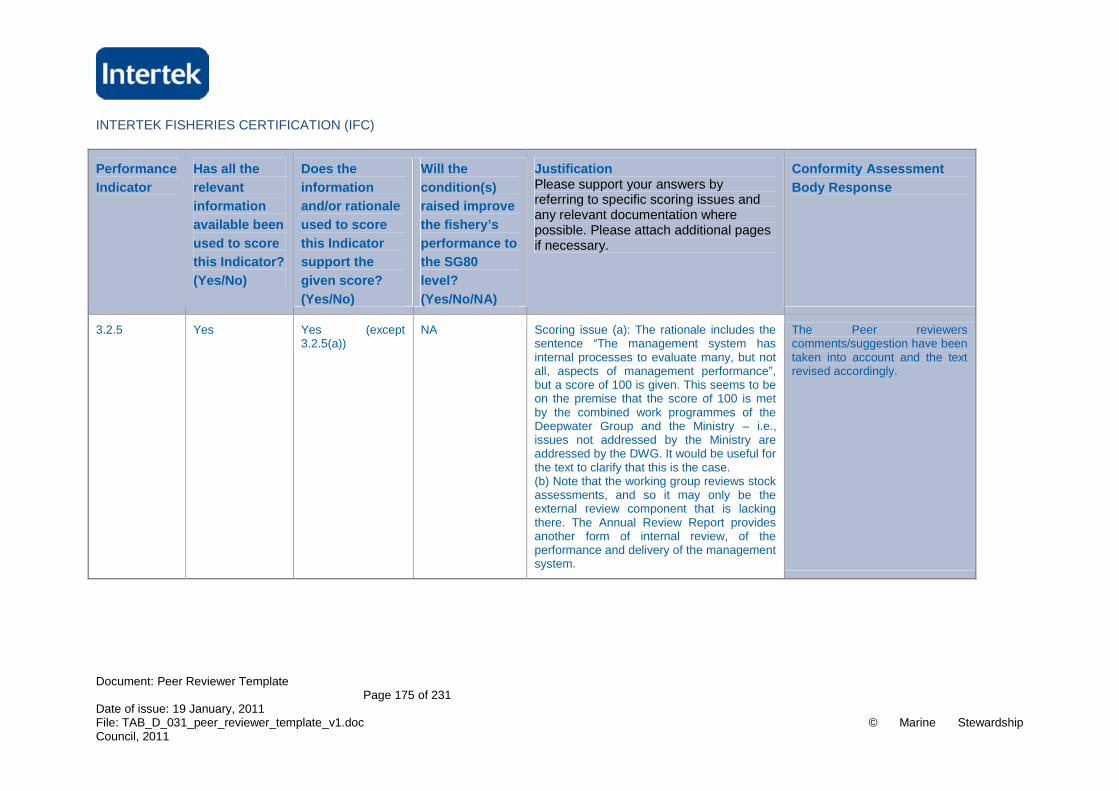
INTERTEK FISHERIES CERTIFICATION (IFC)
Document: Peer Reviewer TemplatePage 175 of 231
Date of issue: 19 January, 2011File: TAB_D_031_peer_reviewer_template_v1.doc © Marine StewardshipCouncil, 2011
Performance
Indicator
Has all the
relevant
information
available been
used to score
this Indicator?
(Yes/No)
Does the
information
and/or rationale
used to score
this Indicator
support the
given score?
(Yes/No)
Will the
condition(s)
raised improve
the fishery’s
performance to
the SG80
level?
(Yes/No/NA)
JustificationPlease support your answers byreferring to specific scoring issues andany relevant documentation wherepossible. Please attach additional pagesif necessary.
Conformity Assessment
Body Response
3.2.5 Yes Yes (except3.2.5(a))
NA Scoring issue (a): The rationale includes thesentence “The management system hasinternal processes to evaluate many, but notall, aspects of management performance”,but a score of 100 is given. This seems to beon the premise that the score of 100 is metby the combined work programmes of theDeepwater Group and the Ministry – i.e.,issues not addressed by the Ministry areaddressed by the DWG. It would be useful forthe text to clarify that this is the case.(b) Note that the working group reviews stockassessments, and so it may only be theexternal review component that is lackingthere. The Annual Review Report providesanother form of internal review, of theperformance and delivery of the managementsystem.
The Peer reviewerscomments/suggestion have beentaken into account and the textrevised accordingly.
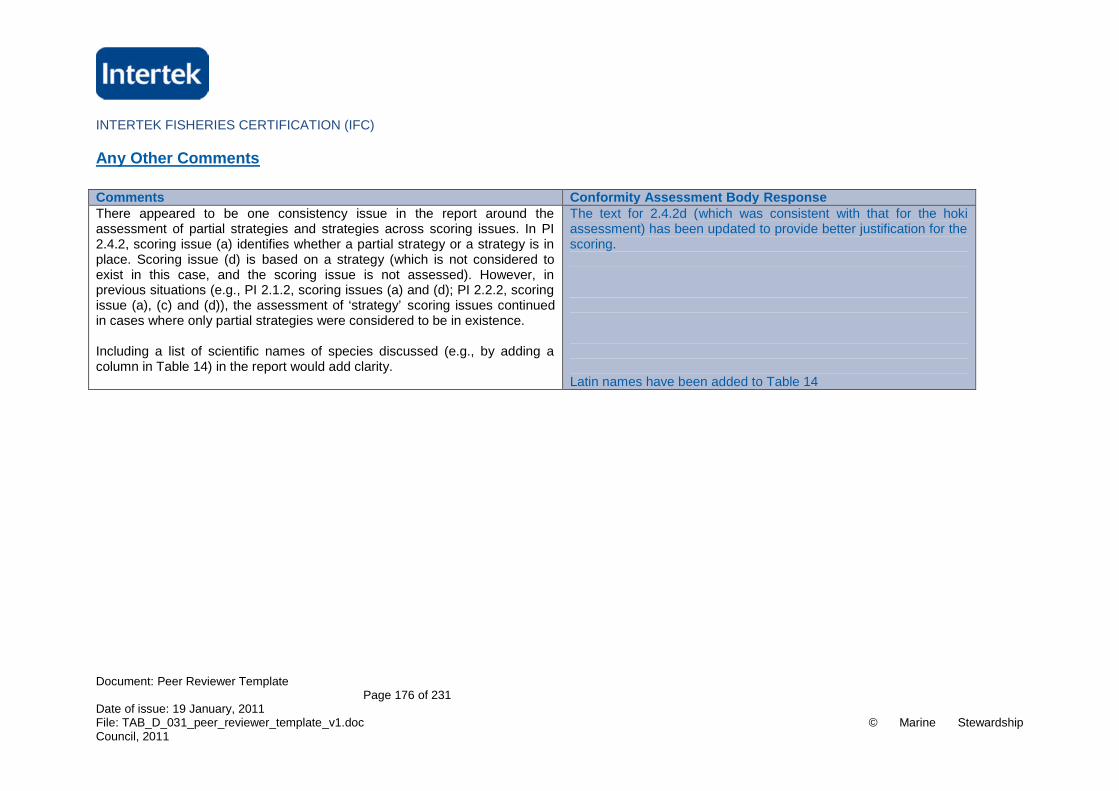
INTERTEK FISHERIES CERTIFICATION (IFC)
Document: Peer Reviewer TemplatePage 176 of 231
Date of issue: 19 January, 2011File: TAB_D_031_peer_reviewer_template_v1.doc © Marine StewardshipCouncil, 2011
Any Other Comments
Comments Conformity Assessment Body ResponseThere appeared to be one consistency issue in the report around theassessment of partial strategies and strategies across scoring issues. In PI2.4.2, scoring issue (a) identifies whether a partial strategy or a strategy is inplace. Scoring issue (d) is based on a strategy (which is not considered toexist in this case, and the scoring issue is not assessed). However, inprevious situations (e.g., PI 2.1.2, scoring issues (a) and (d); PI 2.2.2, scoringissue (a), (c) and (d)), the assessment of ‘strategy’ scoring issues continuedin cases where only partial strategies were considered to be in existence.
Including a list of scientific names of species discussed (e.g., by adding acolumn in Table 14) in the report would add clarity.
The text for 2.4.2d (which was consistent with that for the hokiassessment) has been updated to provide better justification for thescoring.
Latin names have been added to Table 14
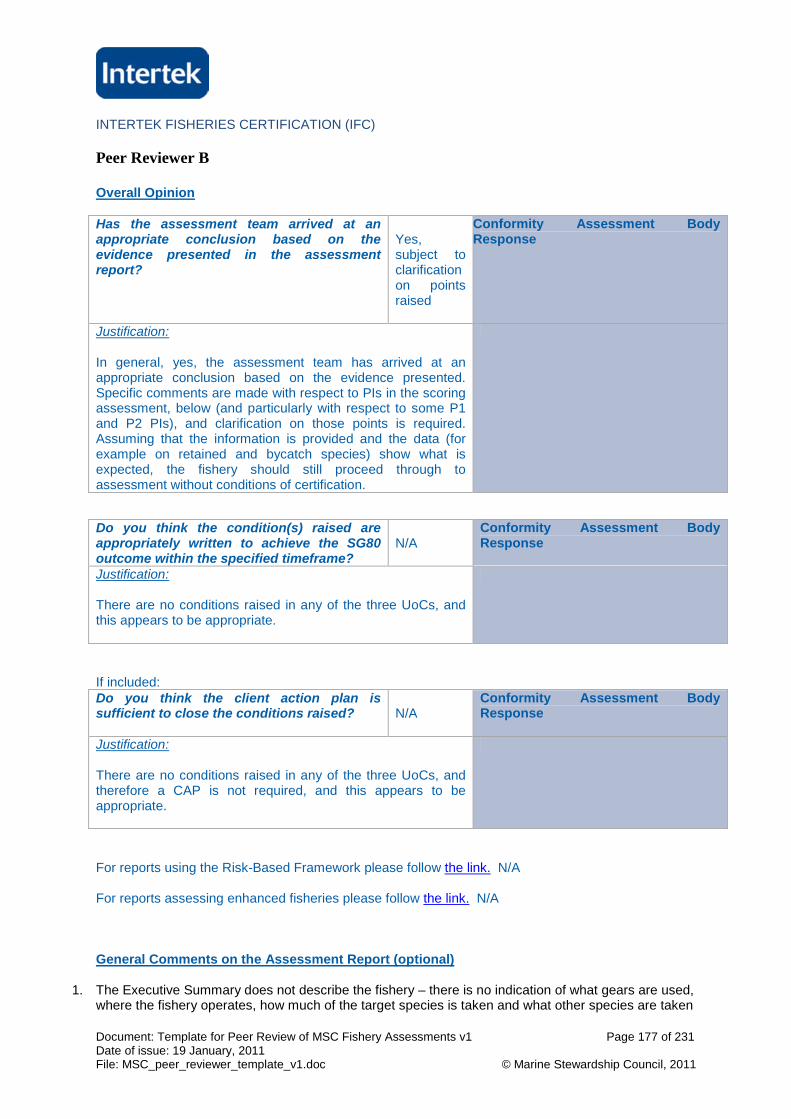
INTERTEK FISHERIES CERTIFICATION (IFC)
Document: Template for Peer Review of MSC Fishery Assessments v1 Page 177 of 231Date of issue: 19 January, 2011File: MSC_peer_reviewer_template_v1.doc © Marine Stewardship Council, 2011
Peer Reviewer B
Overall Opinion
Has the assessment team arrived at anappropriate conclusion based on theevidence presented in the assessmentreport?
Yes,subject toclarificationon pointsraised
Conformity Assessment BodyResponse
Justification:
In general, yes, the assessment team has arrived at anappropriate conclusion based on the evidence presented.Specific comments are made with respect to PIs in the scoringassessment, below (and particularly with respect to some P1and P2 PIs), and clarification on those points is required.Assuming that the information is provided and the data (forexample on retained and bycatch species) show what isexpected, the fishery should still proceed through toassessment without conditions of certification.
If included:Do you think the client action plan issufficient to close the conditions raised? N/A
Conformity Assessment BodyResponse
Justification:
There are no conditions raised in any of the three UoCs, andtherefore a CAP is not required, and this appears to beappropriate.
For reports using the Risk-Based Framework please follow the link. N/A
For reports assessing enhanced fisheries please follow the link. N/A
General Comments on the Assessment Report (optional)
1. The Executive Summary does not describe the fishery – there is no indication of what gears are used,where the fishery operates, how much of the target species is taken and what other species are taken
Do you think the condition(s) raised areappropriately written to achieve the SG80outcome within the specified timeframe?
N/AConformity Assessment BodyResponse
Justification:
There are no conditions raised in any of the three UoCs, andthis appears to be appropriate.
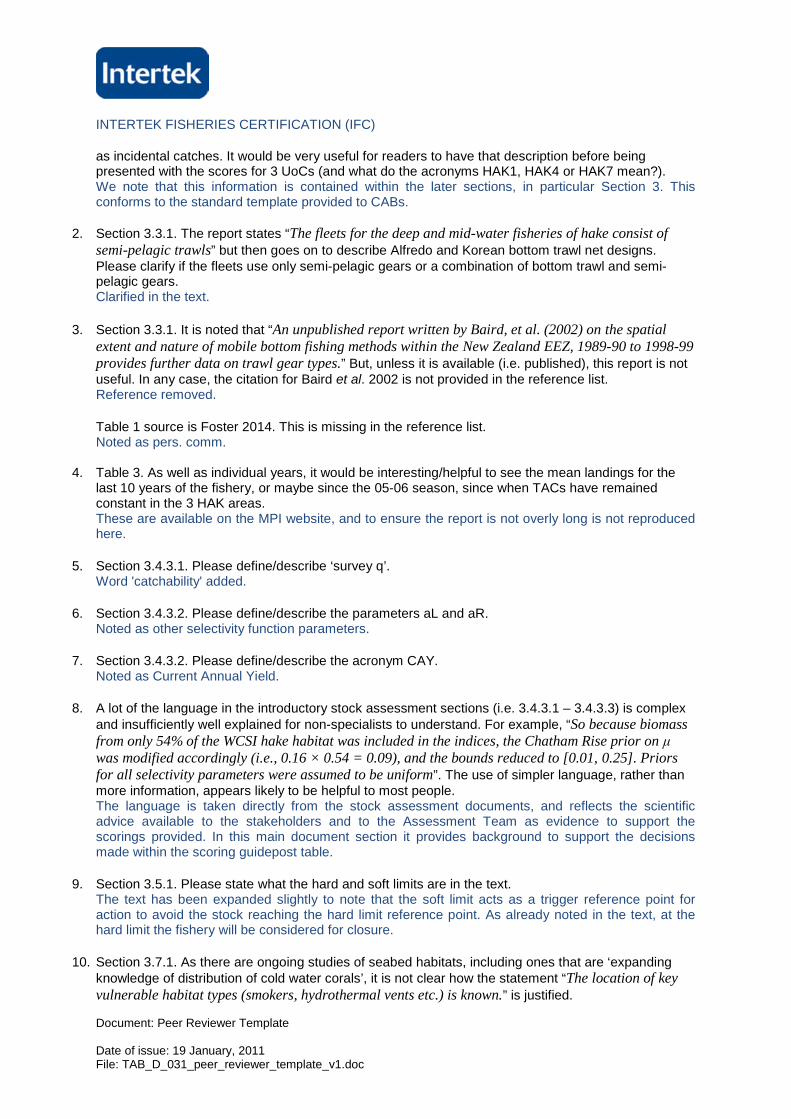
INTERTEK FISHERIES CERTIFICATION (IFC)
Document: Peer Reviewer Template
Date of issue: 19 January, 2011File: TAB_D_031_peer_reviewer_template_v1.doc
as incidental catches. It would be very useful for readers to have that description before beingpresented with the scores for 3 UoCs (and what do the acronyms HAK1, HAK4 or HAK7 mean?).We note that this information is contained within the later sections, in particular Section 3. Thisconforms to the standard template provided to CABs.
2. Section 3.3.1. The report states “The fleets for the deep and mid-water fisheries of hake consist ofsemi-pelagic trawls” but then goes on to describe Alfredo and Korean bottom trawl net designs.Please clarify if the fleets use only semi-pelagic gears or a combination of bottom trawl and semi-pelagic gears.Clarified in the text.
3. Section 3.3.1. It is noted that “An unpublished report written by Baird, et al. (2002) on the spatialextent and nature of mobile bottom fishing methods within the New Zealand EEZ, 1989-90 to 1998-99provides further data on trawl gear types.” But, unless it is available (i.e. published), this report is notuseful. In any case, the citation for Baird et al. 2002 is not provided in the reference list.Reference removed.
Table 1 source is Foster 2014. This is missing in the reference list.Noted as pers. comm.
4. Table 3. As well as individual years, it would be interesting/helpful to see the mean landings for thelast 10 years of the fishery, or maybe since the 05-06 season, since when TACs have remainedconstant in the 3 HAK areas.These are available on the MPI website, and to ensure the report is not overly long is not reproducedhere.
5. Section 3.4.3.1. Please define/describe ‘survey q’.Word 'catchability' added.
6. Section 3.4.3.2. Please define/describe the parameters aL and aR.Noted as other selectivity function parameters.
7. Section 3.4.3.2. Please define/describe the acronym CAY.Noted as Current Annual Yield.
8. A lot of the language in the introductory stock assessment sections (i.e. 3.4.3.1 – 3.4.3.3) is complexand insufficiently well explained for non-specialists to understand. For example, “So because biomassfrom only 54% of the WCSI hake habitat was included in the indices, the Chatham Rise prior on μwas modified accordingly (i.e., 0.16 × 0.54 = 0.09), and the bounds reduced to [0.01, 0.25]. Priorsfor all selectivity parameters were assumed to be uniform”. The use of simpler language, rather thanmore information, appears likely to be helpful to most people.The language is taken directly from the stock assessment documents, and reflects the scientificadvice available to the stakeholders and to the Assessment Team as evidence to support thescorings provided. In this main document section it provides background to support the decisionsmade within the scoring guidepost table.
9. Section 3.5.1. Please state what the hard and soft limits are in the text.The text has been expanded slightly to note that the soft limit acts as a trigger reference point foraction to avoid the stock reaching the hard limit reference point. As already noted in the text, at thehard limit the fishery will be considered for closure.
10. Section 3.7.1. As there are ongoing studies of seabed habitats, including ones that are ‘expandingknowledge of distribution of cold water corals’, it is not clear how the statement “The location of keyvulnerable habitat types (smokers, hydrothermal vents etc.) is known.” is justified.
INTERTEK FISHERIES CERTIFICATION (IFC)
Document: Peer Reviewer Template
Date of issue: 19 January, 2011File: TAB_D_031_peer_reviewer_template_v1.doc
Clarified by adding the word 'other' to the second sentence.
11. Section 3.7.1. The report states “The rate of recovery depends on the nature of the benthic habitat,with more mobile sediments such as mud and sand in high energy environments recovering fasterthan, for example, rocky sediments with slow growing organisms in low energy environments ... In theChatham Rise and sub-Antarctic regions, the majority of trawling is within higher-energy sedimentssuch as sandy silt and clay, although some lower-energy areas exist in these regions”. In general, Iwould expect ‘high energy’ environments to occur in either shallow waters (i.e., less than 100 mdepth) where wave energy extends to the seabed, or in areas of strong currents. Mud or silt is alsomore typical of low energy environments. More information to justify the statement in the report thatthe majority of the trawling is within higher-energy sediments is required.A cross-reference to section 3.7.2.7 has been added.
12. Section 3.7.1 The report states “The impact of trawling for conservation and speciesdiversity/persistence can be limited if trawling affects small proportions of a habitat type within anarea.” I agree, but is there any information available on the time taken for recovery in these areas?Within this Assessment we focus more on whether the analyses available suggest there is sufficientarea left 'untrawled'. A cross-reference to section 3.7.2.7 is again added.
13. Section 3.7.1. The report states “The New Zealand Government closed 17 BPAs (Benthic ProtectionAreas) within the New Zealand EEZ (Exclusive Economic Zone) to bottom trawl fishing methods inperpetuity as of late 2007 ... Demersal trawling and dredging is prohibited in these areas (pelagicfishing and demersal longlining being allowed)”. As at least some of the gear used in the hake fisheryis semi-pelagic, so do these BPA closures extend to the hake fishery?See Section 3.7.2.7.
14. Section 3.7.2. This states that Ministry of Fisheries observer data are available, and that these provideaccurate and verifiable information on catch weight for all QMS and non-QMS species caught.However, Table 6 does not indicate which are retained and which are bycatch (i.e. discarded)species, does not provide quantities or a percentage of each species relative to the hake catch, and isonly for the top 10 species (how is ‘top ten’ defined – by weight??). This lack of information preventsthe reader from understanding which are main retained or main bycatch species, and whether or notthere are more species that should have been considered as ‘main’. There is also no indication ofwhat period these data were collected over. Some of this information is provided in Table 7 but, still,Table 7 provides no indication of whether these species and quantities are retained or bycatch, orsome combination of both. It would be simplest and clearest to extend Table 6 and provide totals forall species taken down to a sensible minimum contribution (noting that Table 7 provides informationon stock derivation).Within Table 6, non-QMS species (which are not required to be retained, a point which has beenadded to the Table heading) are noted with a *.Clarified that the top 10 are defined by weight.We note that the paragraph above the table states "The top ten species (retained and bycatch) withinhake-targeted trawl fisheries by management area, based upon observer data from a five-year periodfrom 2007/08 to 2011/12. Proportion of QMS species in catch by weight noted".
15. Section 3.7.2.1. Please define ‘6th schedule species’?Clarified as Schedule 6 of the Fisheries Act 1996
16. Section 3.7.2.1. Please explain the ‘tier’ system of stock assessment approaches.Text added to clarify this.
17. Section 3.7.2.1. The report states that a Productivity – Sensitivity Analysis (PSA) was carried out.This is somewhat confusing as a PSA is also a term used specifically by the MSC, with respect to the
INTERTEK FISHERIES CERTIFICATION (IFC)
Document: Peer Reviewer Template
Date of issue: 19 January, 2011File: TAB_D_031_peer_reviewer_template_v1.doc
risk-based framework. It is presumed that this is not what is being referred to here, but a quickclarification point would be helpful.PSA is a tool used fairly widely to identify vulnerability, and is comparable to the type of analysisperformed within one step of the RBF of MSC. No change required.
18. Section 3.7.2.3. The report states: “General mitigation approaches that are being employed bytrawlers, supported through legislation, include voluntary industry-led codes of practice”. What dothese voluntary codes of practice entail?Phrase "detailed in Vessel Management Plans" added
19. Section 3.7.2.3. Please define ‘Level 2 risk assessment?’Described and reference to Hobday et al., 2007 added.
20. Section 3.7.2.7. Figures 3, 4 and 5 are somewhat useful but they would more useful if they includedthe fishing areas or, even better, summary trawl VMS data, in order to allow readers to see where thefishery was working in comparison to habitats.A figure (Figure 8) and reference to the location of the documents on the DWG website has beenadded.
21. Section 3.7.2.7. A figure showing fishing activity (e.g., summary VMS data or hours fished by gridsquare) would be a very useful addition to the report. At present, readers are given no indication ofwhere fishing occurs except on a gross scale.See response to comment 20.
22. Section 4.1. It is stated that harmonization between the hake, fishery and the ling and hoki fisherieshas occurred (e.g. “Consistency of outcomes has been ensured” and “Conclusions, where appropriate,are consistent between the three fisheries with respect to evaluation, scoring and conditions”), but noevidence has been provided. A table showing scores and providing reasons for any substantialdifferences would be useful.
MSC requirements state that “where an assessment overlaps with a certified fishery or fishery inassessment that a CAB has already scored, the team shall base their assessment on the rationaleand scores detailed for the previously scored fishery”. In this case the CAB has taken into account thecertified hoki fishery and the under assessment ling fishery.Further the MSC requirements state “to achieve harmonisation, CABs shall undertake the followingkey activities:a. The use of complementary assessment trees.b. The sharing of fishery information.c. The achievement of consistent conclusions with respect to evaluation, scoring and conditions.”.Thishas been done andCI3.2.3.3 says “The team shall explain and justify any difference in the scores in the scoring rationalefor relevant PIs.” There are no substantial differences in the scores for these fisheries for relevant PIs.
23. A number of typographic mistakes were spotted in the report. These were highlighted and the reportreturned to the authors.The text has been amended to correct these errors
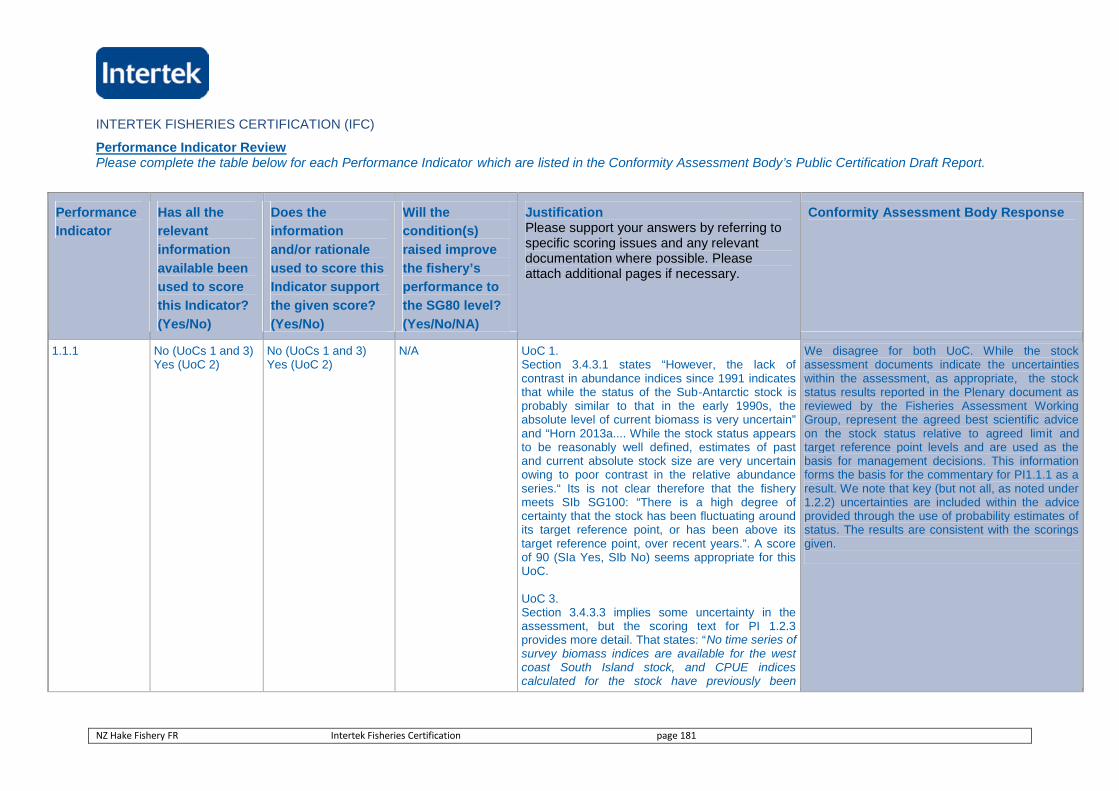
INTERTEK FISHERIES CERTIFICATION (IFC)
NZ Hake Fishery FR Intertek Fisheries Certification page 181
Performance Indicator ReviewPlease complete the table below for each Performance Indicator which are listed in the Conformity Assessment Body’s Public Certification Draft Report.
Performance
Indicator
Has all the
relevant
information
available been
used to score
this Indicator?
(Yes/No)
Does the
information
and/or rationale
used to score this
Indicator support
the given score?
(Yes/No)
Will the
condition(s)
raised improve
the fishery’s
performance to
the SG80 level?
(Yes/No/NA)
JustificationPlease support your answers by referring tospecific scoring issues and any relevantdocumentation where possible. Pleaseattach additional pages if necessary.
Conformity Assessment Body Response
1.1.1 No (UoCs 1 and 3)Yes (UoC 2)
No (UoCs 1 and 3)Yes (UoC 2)
N/A UoC 1.Section 3.4.3.1 states “However, the lack ofcontrast in abundance indices since 1991 indicatesthat while the status of the Sub-Antarctic stock isprobably similar to that in the early 1990s, theabsolute level of current biomass is very uncertain”and “Horn 2013a.... While the stock status appearsto be reasonably well defined, estimates of pastand current absolute stock size are very uncertainowing to poor contrast in the relative abundanceseries.“ Its is not clear therefore that the fisherymeets SIb SG100: “There is a high degree ofcertainty that the stock has been fluctuating aroundits target reference point, or has been above itstarget reference point, over recent years.”. A scoreof 90 (SIa Yes, SIb No) seems appropriate for thisUoC.
UoC 3.Section 3.4.3.3 implies some uncertainty in theassessment, but the scoring text for PI 1.2.3provides more detail. That states: “No time series ofsurvey biomass indices are available for the westcoast South Island stock, and CPUE indicescalculated for the stock have previously been
We disagree for both UoC. While the stockassessment documents indicate the uncertaintieswithin the assessment, as appropriate, the stockstatus results reported in the Plenary document asreviewed by the Fisheries Assessment WorkingGroup, represent the agreed best scientific adviceon the stock status relative to agreed limit andtarget reference point levels and are used as thebasis for management decisions. This informationforms the basis for the commentary for PI1.1.1 as aresult. We note that key (but not all, as noted under1.2.2) uncertainties are included within the adviceprovided through the use of probability estimates ofstatus. The results are consistent with the scoringsgiven.
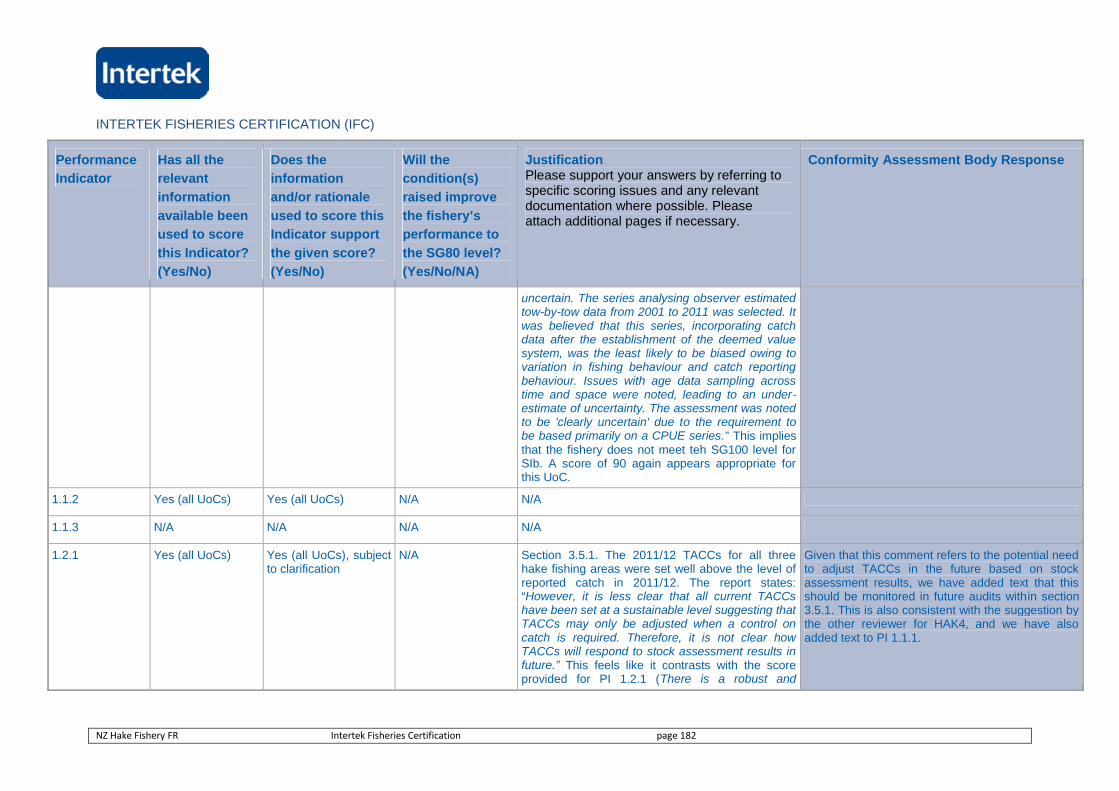
INTERTEK FISHERIES CERTIFICATION (IFC)
NZ Hake Fishery FR Intertek Fisheries Certification page 182
Performance
Indicator
Has all the
relevant
information
available been
used to score
this Indicator?
(Yes/No)
Does the
information
and/or rationale
used to score this
Indicator support
the given score?
(Yes/No)
Will the
condition(s)
raised improve
the fishery’s
performance to
the SG80 level?
(Yes/No/NA)
JustificationPlease support your answers by referring tospecific scoring issues and any relevantdocumentation where possible. Pleaseattach additional pages if necessary.
Conformity Assessment Body Response
uncertain. The series analysing observer estimatedtow-by-tow data from 2001 to 2011 was selected. Itwas believed that this series, incorporating catchdata after the establishment of the deemed valuesystem, was the least likely to be biased owing tovariation in fishing behaviour and catch reportingbehaviour. Issues with age data sampling acrosstime and space were noted, leading to an under-estimate of uncertainty. The assessment was notedto be 'clearly uncertain' due to the requirement tobe based primarily on a CPUE series.” This impliesthat the fishery does not meet teh SG100 level forSIb. A score of 90 again appears appropriate forthis UoC.
1.1.2 Yes (all UoCs) Yes (all UoCs) N/A N/A
1.1.3 N/A N/A N/A N/A
1.2.1 Yes (all UoCs) Yes (all UoCs), subjectto clarification
N/A Section 3.5.1. The 2011/12 TACCs for all threehake fishing areas were set well above the level ofreported catch in 2011/12. The report states:“However, it is less clear that all current TACCshave been set at a sustainable level suggesting thatTACCs may only be adjusted when a control oncatch is required. Therefore, it is not clear howTACCs will respond to stock assessment results infuture.” This feels like it contrasts with the scoreprovided for PI 1.2.1 (There is a robust and
Given that this comment refers to the potential needto adjust TACCs in the future based on stockassessment results, we have added text that thisshould be monitored in future audits within section3.5.1. This is also consistent with the suggestion bythe other reviewer for HAK4, and we have alsoadded text to PI 1.1.1.
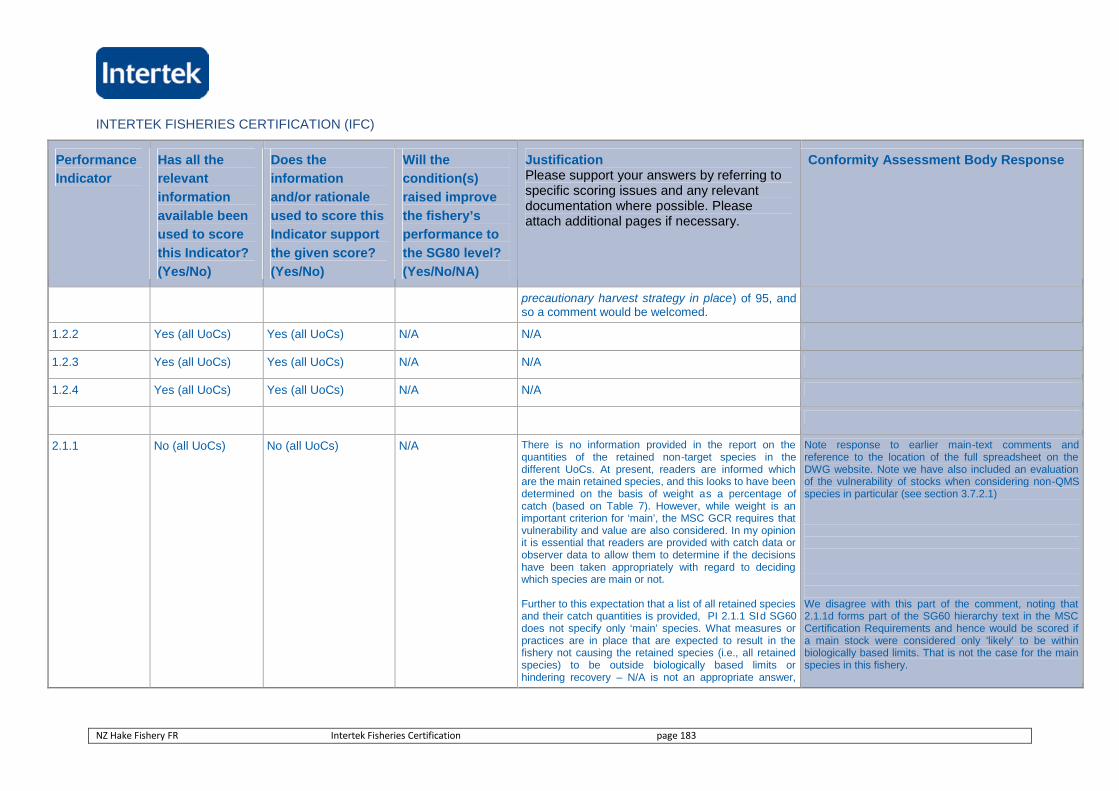
INTERTEK FISHERIES CERTIFICATION (IFC)
NZ Hake Fishery FR Intertek Fisheries Certification page 183
Performance
Indicator
Has all the
relevant
information
available been
used to score
this Indicator?
(Yes/No)
Does the
information
and/or rationale
used to score this
Indicator support
the given score?
(Yes/No)
Will the
condition(s)
raised improve
the fishery’s
performance to
the SG80 level?
(Yes/No/NA)
JustificationPlease support your answers by referring tospecific scoring issues and any relevantdocumentation where possible. Pleaseattach additional pages if necessary.
Conformity Assessment Body Response
precautionary harvest strategy in place) of 95, andso a comment would be welcomed.
1.2.2 Yes (all UoCs) Yes (all UoCs) N/A N/A
1.2.3 Yes (all UoCs) Yes (all UoCs) N/A N/A
1.2.4 Yes (all UoCs) Yes (all UoCs) N/A N/A
2.1.1 No (all UoCs) No (all UoCs) N/A There is no information provided in the report on thequantities of the retained non-target species in thedifferent UoCs. At present, readers are informed whichare the main retained species, and this looks to have beendetermined on the basis of weight as a percentage ofcatch (based on Table 7). However, while weight is animportant criterion for ‘main’, the MSC GCR requires thatvulnerability and value are also considered. In my opinionit is essential that readers are provided with catch data orobserver data to allow them to determine if the decisionshave been taken appropriately with regard to decidingwhich species are main or not.
Further to this expectation that a list of all retained speciesand their catch quantities is provided, PI 2.1.1 SId SG60does not specify only ‘main’ species. What measures orpractices are in place that are expected to result in thefishery not causing the retained species (i.e., all retainedspecies) to be outside biologically based limits orhindering recovery – N/A is not an appropriate answer,
Note response to earlier main-text comments andreference to the location of the full spreadsheet on theDWG website. Note we have also included an evaluationof the vulnerability of stocks when considering non-QMSspecies in particular (see section 3.7.2.1)
We disagree with this part of the comment, noting that2.1.1d forms part of the SG60 hierarchy text in the MSCCertification Requirements and hence would be scored ifa main stock were considered only 'likely' to be withinbiologically based limits. That is not the case for the mainspecies in this fishery.
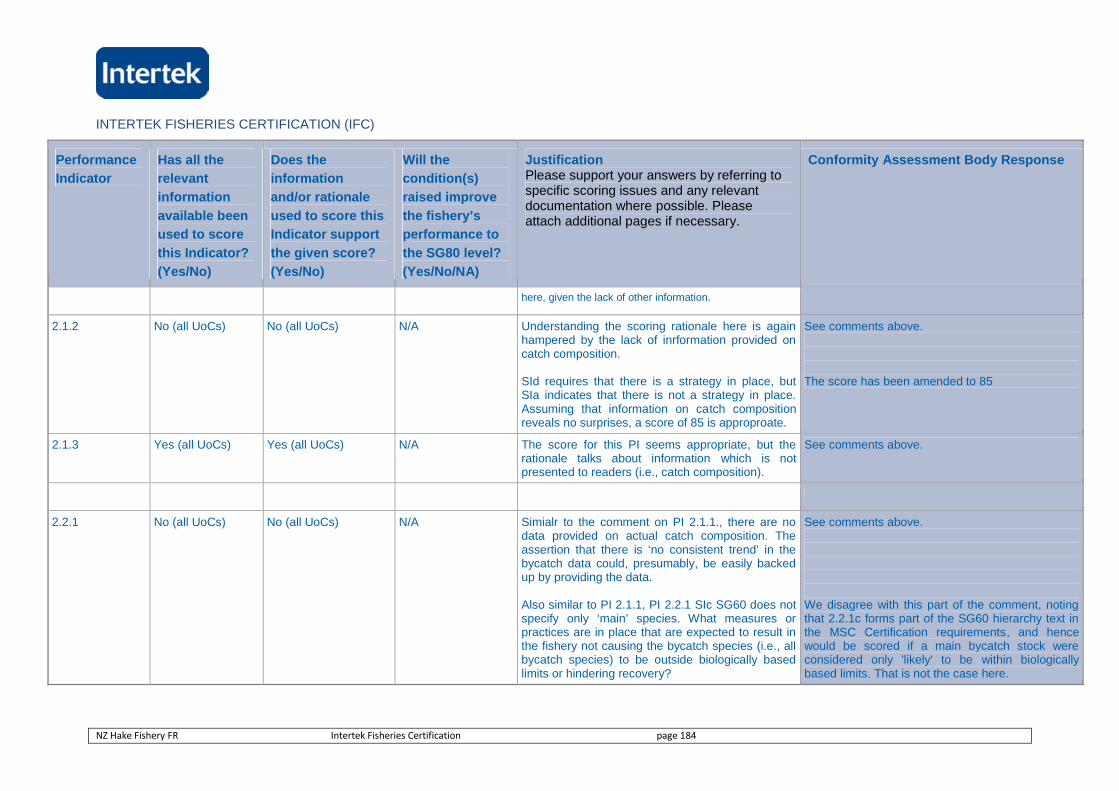
INTERTEK FISHERIES CERTIFICATION (IFC)
NZ Hake Fishery FR Intertek Fisheries Certification page 184
Performance
Indicator
Has all the
relevant
information
available been
used to score
this Indicator?
(Yes/No)
Does the
information
and/or rationale
used to score this
Indicator support
the given score?
(Yes/No)
Will the
condition(s)
raised improve
the fishery’s
performance to
the SG80 level?
(Yes/No/NA)
JustificationPlease support your answers by referring tospecific scoring issues and any relevantdocumentation where possible. Pleaseattach additional pages if necessary.
Conformity Assessment Body Response
here, given the lack of other information.
2.1.2 No (all UoCs) No (all UoCs) N/A Understanding the scoring rationale here is againhampered by the lack of inrformation provided oncatch composition.
SId requires that there is a strategy in place, butSIa indicates that there is not a strategy in place.Assuming that information on catch compositionreveals no surprises, a score of 85 is approproate.
See comments above.
The score has been amended to 85
2.1.3 Yes (all UoCs) Yes (all UoCs) N/A The score for this PI seems appropriate, but therationale talks about information which is notpresented to readers (i.e., catch composition).
See comments above.
2.2.1 No (all UoCs) No (all UoCs) N/A Simialr to the comment on PI 2.1.1., there are nodata provided on actual catch composition. Theassertion that there is ‘no consistent trend’ in thebycatch data could, presumably, be easily backedup by providing the data.
Also similar to PI 2.1.1, PI 2.2.1 SIc SG60 does notspecify only ‘main’ species. What measures orpractices are in place that are expected to result inthe fishery not causing the bycatch species (i.e., allbycatch species) to be outside biologically basedlimits or hindering recovery?
See comments above.
We disagree with this part of the comment, notingthat 2.2.1c forms part of the SG60 hierarchy text inthe MSC Certification requirements, and hencewould be scored if a main bycatch stock wereconsidered only 'likely' to be within biologicallybased limits. That is not the case here.
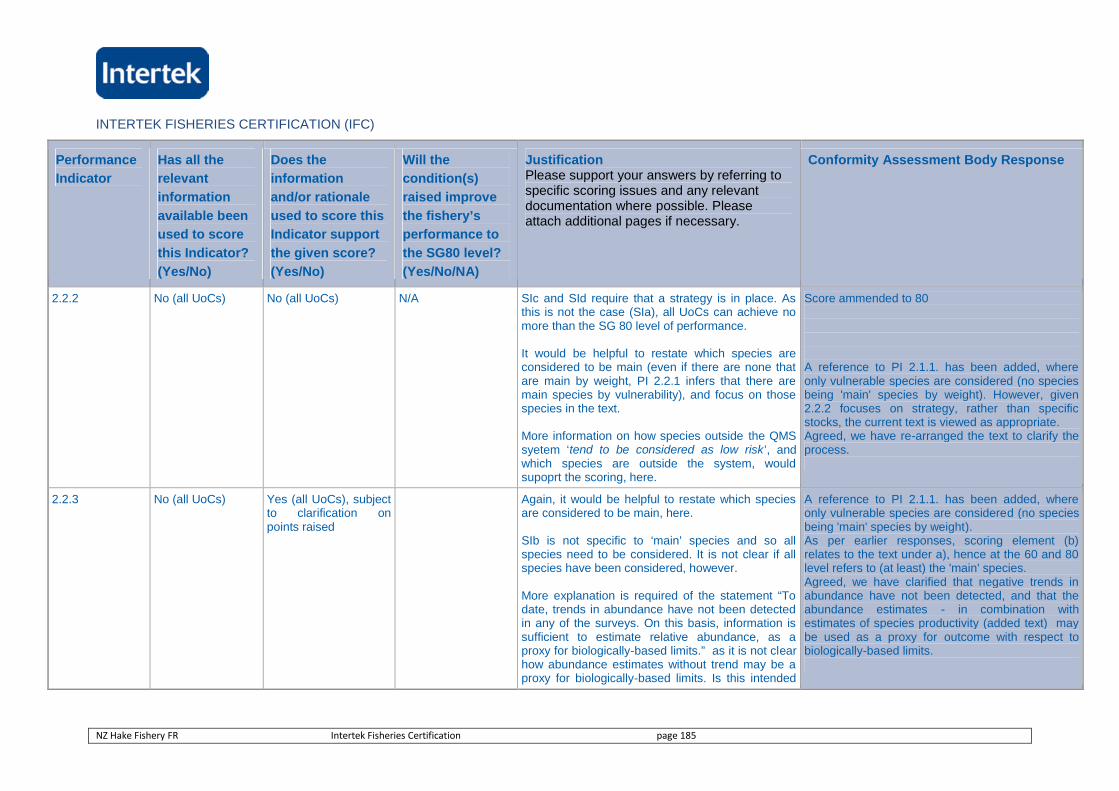
INTERTEK FISHERIES CERTIFICATION (IFC)
NZ Hake Fishery FR Intertek Fisheries Certification page 185
Performance
Indicator
Has all the
relevant
information
available been
used to score
this Indicator?
(Yes/No)
Does the
information
and/or rationale
used to score this
Indicator support
the given score?
(Yes/No)
Will the
condition(s)
raised improve
the fishery’s
performance to
the SG80 level?
(Yes/No/NA)
JustificationPlease support your answers by referring tospecific scoring issues and any relevantdocumentation where possible. Pleaseattach additional pages if necessary.
Conformity Assessment Body Response
2.2.2 No (all UoCs) No (all UoCs) N/A SIc and SId require that a strategy is in place. Asthis is not the case (SIa), all UoCs can achieve nomore than the SG 80 level of performance.
It would be helpful to restate which species areconsidered to be main (even if there are none thatare main by weight, PI 2.2.1 infers that there aremain species by vulnerability), and focus on thosespecies in the text.
More information on how species outside the QMSsyetem ‘tend to be considered as low risk’, andwhich species are outside the system, wouldsupoprt the scoring, here.
Score ammended to 80
A reference to PI 2.1.1. has been added, whereonly vulnerable species are considered (no speciesbeing 'main' species by weight). However, given2.2.2 focuses on strategy, rather than specificstocks, the current text is viewed as appropriate.Agreed, we have re-arranged the text to clarify theprocess.
2.2.3 No (all UoCs) Yes (all UoCs), subjectto clarification onpoints raised
Again, it would be helpful to restate which speciesare considered to be main, here.
SIb is not specific to ‘main’ species and so allspecies need to be considered. It is not clear if allspecies have been considered, however.
More explanation is required of the statement “Todate, trends in abundance have not been detectedin any of the surveys. On this basis, information issufficient to estimate relative abundance, as aproxy for biologically-based limits.” as it is not clearhow abundance estimates without trend may be aproxy for biologically-based limits. Is this intended
A reference to PI 2.1.1. has been added, whereonly vulnerable species are considered (no speciesbeing 'main' species by weight).As per earlier responses, scoring element (b)relates to the text under a), hence at the 60 and 80level refers to (at least) the 'main' species.Agreed, we have clarified that negative trends inabundance have not been detected, and that theabundance estimates - in combination withestimates of species productivity (added text) maybe used as a proxy for outcome with respect tobiologically-based limits.
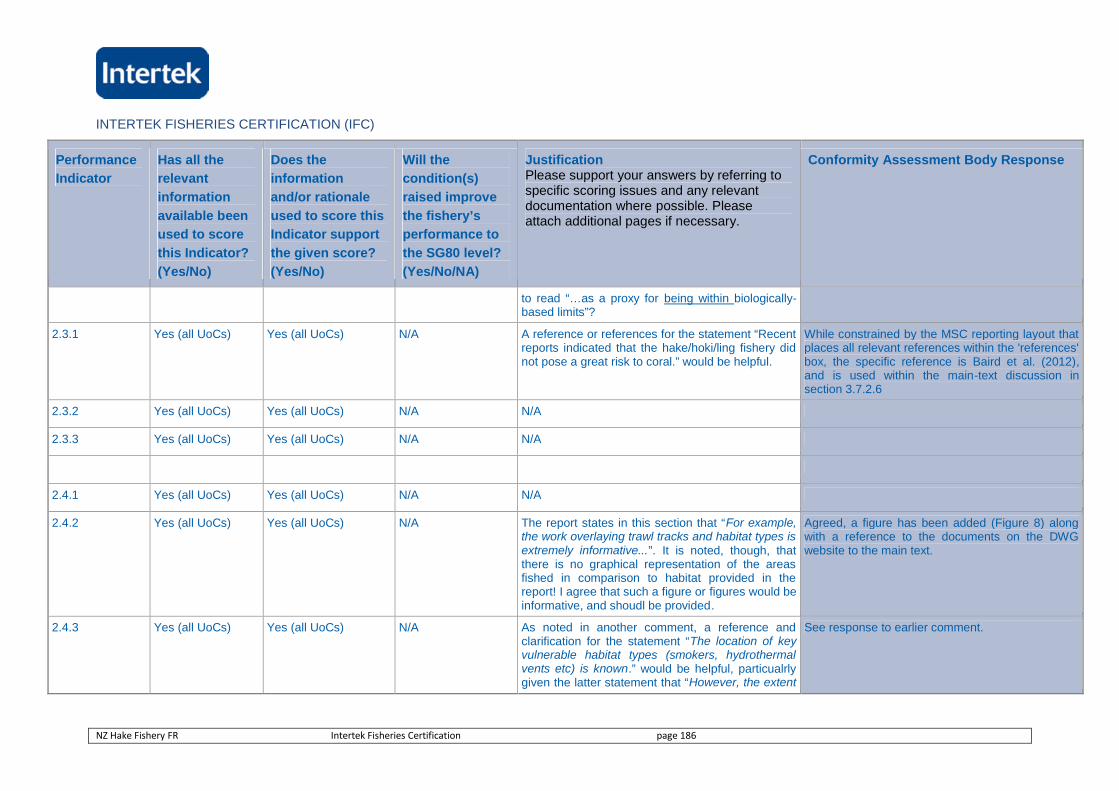
INTERTEK FISHERIES CERTIFICATION (IFC)
NZ Hake Fishery FR Intertek Fisheries Certification page 186
Performance
Indicator
Has all the
relevant
information
available been
used to score
this Indicator?
(Yes/No)
Does the
information
and/or rationale
used to score this
Indicator support
the given score?
(Yes/No)
Will the
condition(s)
raised improve
the fishery’s
performance to
the SG80 level?
(Yes/No/NA)
JustificationPlease support your answers by referring tospecific scoring issues and any relevantdocumentation where possible. Pleaseattach additional pages if necessary.
Conformity Assessment Body Response
to read “…as a proxy for being within biologically-based limits”?
2.3.1 Yes (all UoCs) Yes (all UoCs) N/A A reference or references for the statement “Recentreports indicated that the hake/hoki/ling fishery didnot pose a great risk to coral.” would be helpful.
While constrained by the MSC reporting layout thatplaces all relevant references within the 'references'box, the specific reference is Baird et al. (2012),and is used within the main-text discussion insection 3.7.2.6
2.3.2 Yes (all UoCs) Yes (all UoCs) N/A N/A
2.3.3 Yes (all UoCs) Yes (all UoCs) N/A N/A
2.4.1 Yes (all UoCs) Yes (all UoCs) N/A N/A
2.4.2 Yes (all UoCs) Yes (all UoCs) N/A The report states in this section that “For example,the work overlaying trawl tracks and habitat types isextremely informative...”. It is noted, though, thatthere is no graphical representation of the areasfished in comparison to habitat provided in thereport! I agree that such a figure or figures would beinformative, and shoudl be provided.
Agreed, a figure has been added (Figure 8) alongwith a reference to the documents on the DWGwebsite to the main text.
2.4.3 Yes (all UoCs) Yes (all UoCs) N/A As noted in another comment, a reference andclarification for the statement “The location of keyvulnerable habitat types (smokers, hydrothermalvents etc) is known.” would be helpful, particualrlygiven the latter statement that “However, the extent
See response to earlier comment.
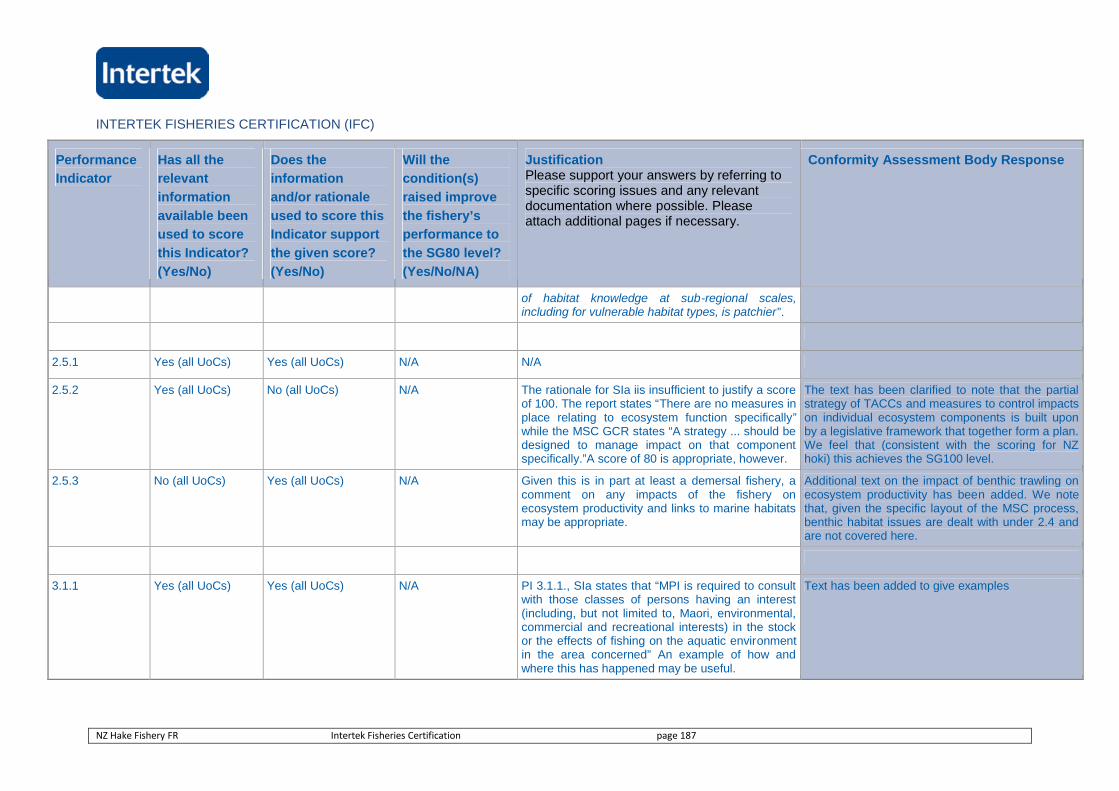
INTERTEK FISHERIES CERTIFICATION (IFC)
NZ Hake Fishery FR Intertek Fisheries Certification page 187
Performance
Indicator
Has all the
relevant
information
available been
used to score
this Indicator?
(Yes/No)
Does the
information
and/or rationale
used to score this
Indicator support
the given score?
(Yes/No)
Will the
condition(s)
raised improve
the fishery’s
performance to
the SG80 level?
(Yes/No/NA)
JustificationPlease support your answers by referring tospecific scoring issues and any relevantdocumentation where possible. Pleaseattach additional pages if necessary.
Conformity Assessment Body Response
of habitat knowledge at sub-regional scales,including for vulnerable habitat types, is patchier”.
2.5.1 Yes (all UoCs) Yes (all UoCs) N/A N/A
2.5.2 Yes (all UoCs) No (all UoCs) N/A The rationale for SIa iis insufficient to justify a scoreof 100. The report states “There are no measures inplace relating to ecosystem function specifically”while the MSC GCR states “A strategy ... should bedesigned to manage impact on that componentspecifically.”A score of 80 is appropriate, however.
The text has been clarified to note that the partialstrategy of TACCs and measures to control impactson individual ecosystem components is built uponby a legislative framework that together form a plan.We feel that (consistent with the scoring for NZhoki) this achieves the SG100 level.
2.5.3 No (all UoCs) Yes (all UoCs) N/A Given this is in part at least a demersal fishery, acomment on any impacts of the fishery onecosystem productivity and links to marine habitatsmay be appropriate.
Additional text on the impact of benthic trawling onecosystem productivity has been added. We notethat, given the specific layout of the MSC process,benthic habitat issues are dealt with under 2.4 andare not covered here.
3.1.1 Yes (all UoCs) Yes (all UoCs) N/A PI 3.1.1., SIa states that “MPI is required to consultwith those classes of persons having an interest(including, but not limited to, Maori, environmental,commercial and recreational interests) in the stockor the effects of fishing on the aquatic environmentin the area concerned” An example of how andwhere this has happened may be useful.
Text has been added to give examples
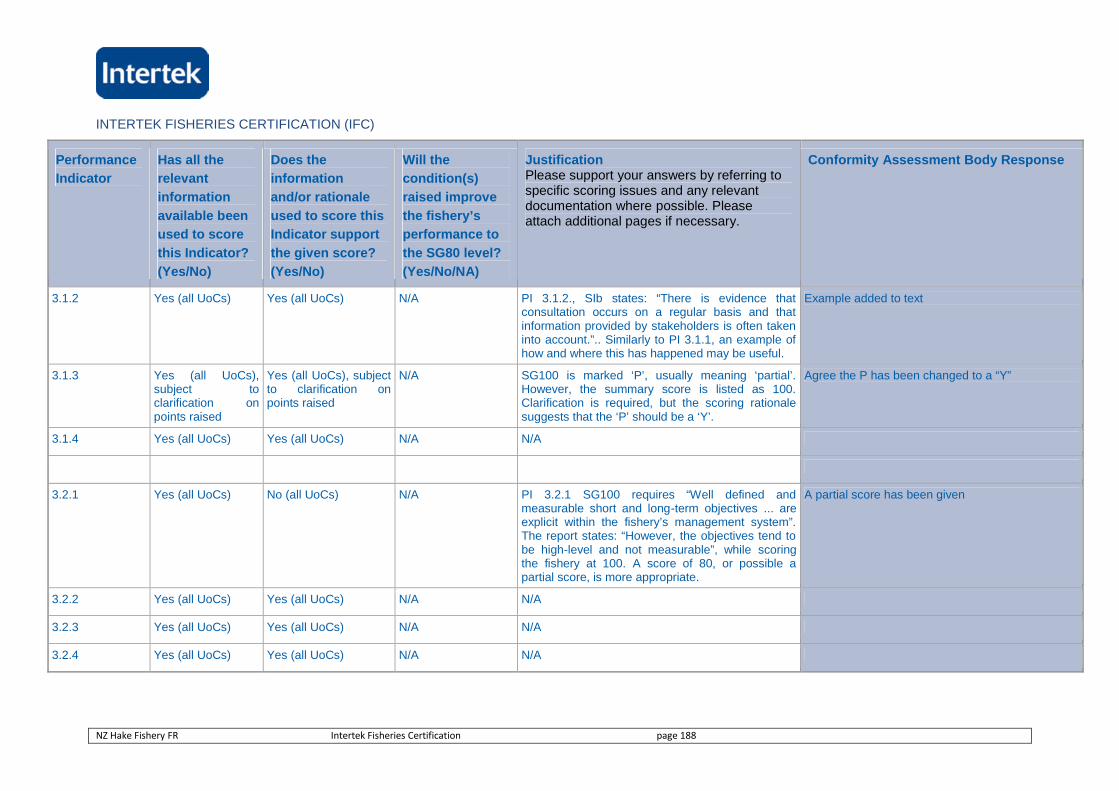
INTERTEK FISHERIES CERTIFICATION (IFC)
NZ Hake Fishery FR Intertek Fisheries Certification page 188
Performance
Indicator
Has all the
relevant
information
available been
used to score
this Indicator?
(Yes/No)
Does the
information
and/or rationale
used to score this
Indicator support
the given score?
(Yes/No)
Will the
condition(s)
raised improve
the fishery’s
performance to
the SG80 level?
(Yes/No/NA)
JustificationPlease support your answers by referring tospecific scoring issues and any relevantdocumentation where possible. Pleaseattach additional pages if necessary.
Conformity Assessment Body Response
3.1.2 Yes (all UoCs) Yes (all UoCs) N/A PI 3.1.2., SIb states: “There is evidence thatconsultation occurs on a regular basis and thatinformation provided by stakeholders is often takeninto account.”.. Similarly to PI 3.1.1, an example ofhow and where this has happened may be useful.
Example added to text
3.1.3 Yes (all UoCs),subject toclarification onpoints raised
Yes (all UoCs), subjectto clarification onpoints raised
N/A SG100 is marked ‘P’, usually meaning ‘partial’.However, the summary score is listed as 100.Clarification is required, but the scoring rationalesuggests that the ‘P’ should be a ‘Y’.
Agree the P has been changed to a “Y”
3.1.4 Yes (all UoCs) Yes (all UoCs) N/A N/A
3.2.1 Yes (all UoCs) No (all UoCs) N/A PI 3.2.1 SG100 requires “Well defined andmeasurable short and long-term objectives ... areexplicit within the fishery’s management system”.The report states: “However, the objectives tend tobe high-level and not measurable”, while scoringthe fishery at 100. A score of 80, or possible apartial score, is more appropriate.
A partial score has been given
3.2.2 Yes (all UoCs) Yes (all UoCs) N/A N/A
3.2.3 Yes (all UoCs) Yes (all UoCs) N/A N/A
3.2.4 Yes (all UoCs) Yes (all UoCs) N/A N/A
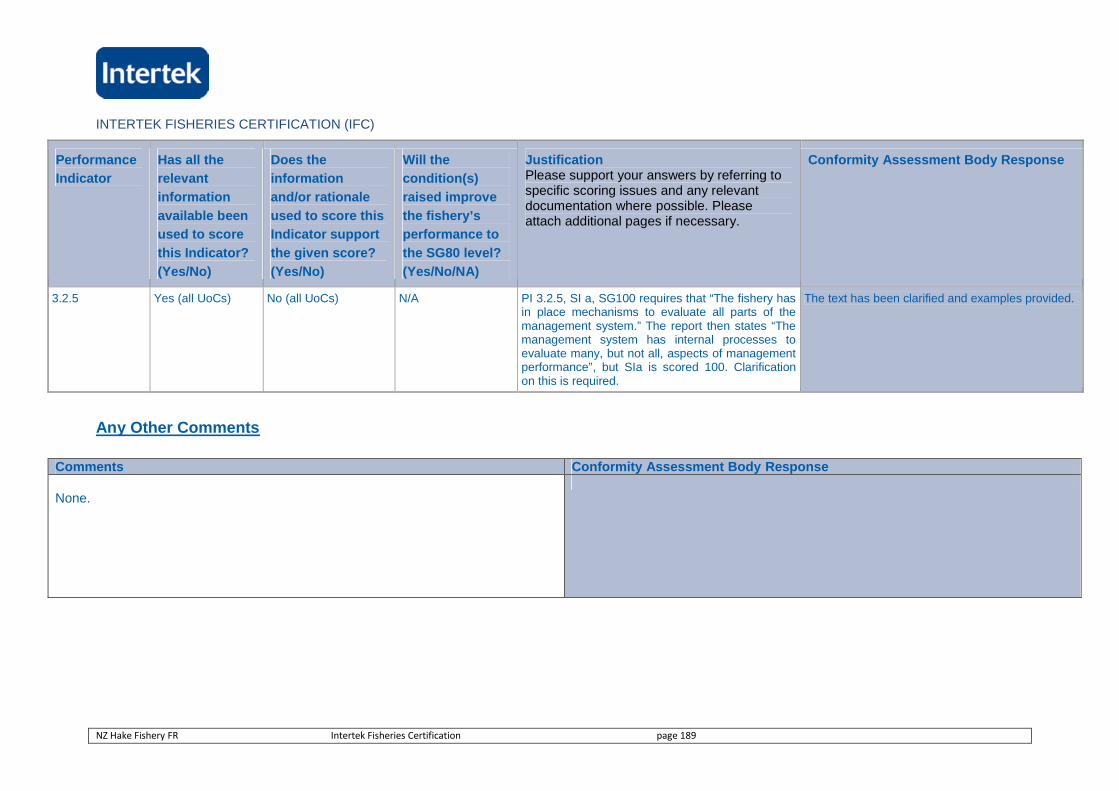
INTERTEK FISHERIES CERTIFICATION (IFC)
NZ Hake Fishery FR Intertek Fisheries Certification page 189
Performance
Indicator
Has all the
relevant
information
available been
used to score
this Indicator?
(Yes/No)
Does the
information
and/or rationale
used to score this
Indicator support
the given score?
(Yes/No)
Will the
condition(s)
raised improve
the fishery’s
performance to
the SG80 level?
(Yes/No/NA)
JustificationPlease support your answers by referring tospecific scoring issues and any relevantdocumentation where possible. Pleaseattach additional pages if necessary.
Conformity Assessment Body Response
3.2.5 Yes (all UoCs) No (all UoCs) N/A PI 3.2.5, SI a, SG100 requires that “The fishery hasin place mechanisms to evaluate all parts of themanagement system.” The report then states “Themanagement system has internal processes toevaluate many, but not all, aspects of managementperformance”, but SIa is scored 100. Clarificationon this is required.
The text has been clarified and examples provided.
Any Other Comments
Comments Conformity Assessment Body Response
None.
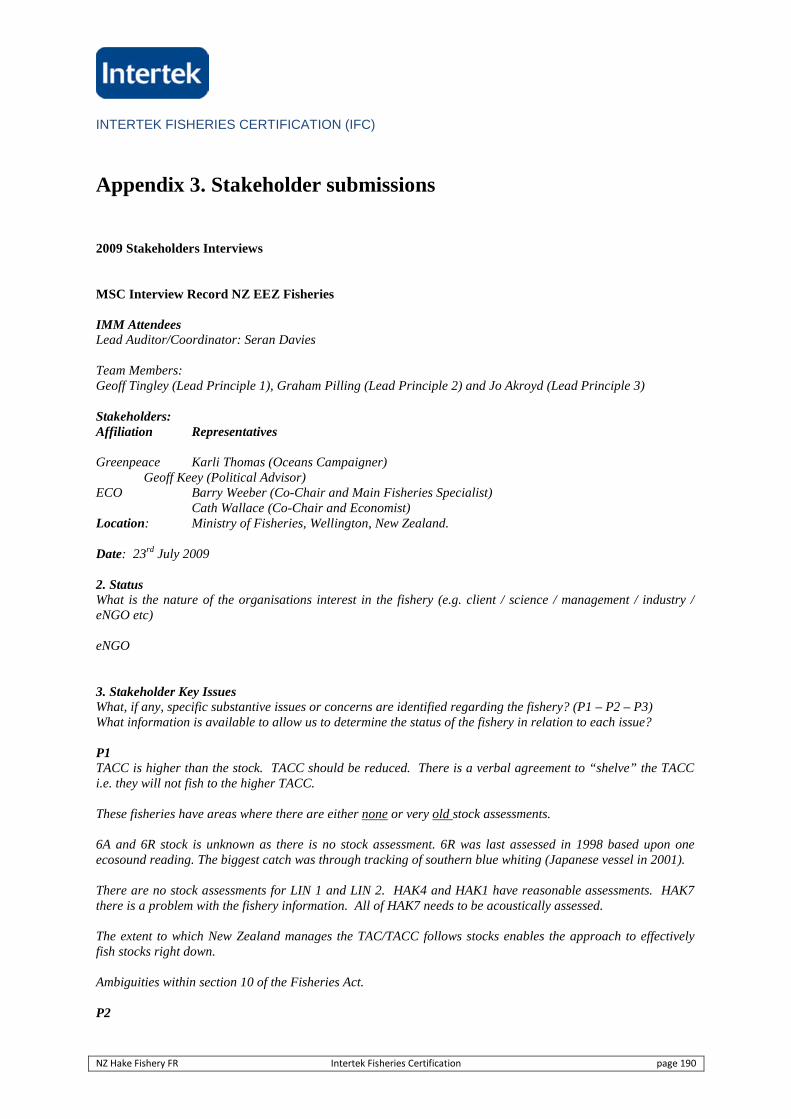
INTERTEK FISHERIES CERTIFICATION (IFC)
NZ Hake Fishery FR Intertek Fisheries Certification page 190
Appendix 3. Stakeholder submissions
2009 Stakeholders Interviews
MSC Interview Record NZ EEZ Fisheries
IMM AttendeesLead Auditor/Coordinator: Seran Davies
Team Members:Geoff Tingley (Lead Principle 1), Graham Pilling (Lead Principle 2) and Jo Akroyd (Lead Principle 3)
Stakeholders:Affiliation Representatives
Greenpeace Karli Thomas (Oceans Campaigner)Geoff Keey (Political Advisor)
ECO Barry Weeber (Co-Chair and Main Fisheries Specialist)Cath Wallace (Co-Chair and Economist)
Location: Ministry of Fisheries, Wellington, New Zealand.
Date: 23rd July 2009
2. StatusWhat is the nature of the organisations interest in the fishery (e.g. client / science / management / industry /eNGO etc)
eNGO
3. Stakeholder Key IssuesWhat, if any, specific substantive issues or concerns are identified regarding the fishery? (P1 – P2 – P3)What information is available to allow us to determine the status of the fishery in relation to each issue?
P1TACC is higher than the stock. TACC should be reduced. There is a verbal agreement to “shelve” the TACCi.e. they will not fish to the higher TACC.
These fisheries have areas where there are either none or very old stock assessments.
6A and 6R stock is unknown as there is no stock assessment. 6R was last assessed in 1998 based upon oneecosound reading. The biggest catch was through tracking of southern blue whiting (Japanese vessel in 2001).
There are no stock assessments for LIN 1 and LIN 2. HAK4 and HAK1 have reasonable assessments. HAK7there is a problem with the fishery information. All of HAK7 needs to be acoustically assessed.
The extent to which New Zealand manages the TAC/TACC follows stocks enables the approach to effectivelyfish stocks right down.
Ambiguities within section 10 of the Fisheries Act.
P2
INTERTEK FISHERIES CERTIFICATION (IFC)
NZ Hake Fishery FR Intertek Fisheries Certification page 191
BPAs are not marine reserves and are not deemed as being suitable for protecting endemic biodiversity.Around ½ of these areas are located in areas where no fishing occurs. They therefore provide limitedprotection from a threat which historically does not occur there. Also, these BPAs are voluntary so industrycould potentially revoke the non-fishing activity. It is considered that this industry led approach is actuallyundermining the actual MPA programme.
Bottom trawling cannot be considered as a sustainable fishing practice. Greenpeace require a broaderdefinition of the term “destructive fishing” which should include bottom trawling, canyoning, dredging anddrift nets.
Trawling is destructive and causes damage, has been reported by NIWA scientists that trawlers can “wander”into closed and protected areas such as sea mounts.
Bycatch of fur seals and sea lions within these fisheries.
The long line fleet have a large impact upon seabirds (range of petrels and albatross species). The trawlfishery is better managed to avoid bird with various forms of mitigation.
There are discrepancies in observer coverage across these fisheries.
Compliance issue with the non-reporting of bycatch species on boats which do not carry observers. The Westcoast hake and Ling fisheries, SBW, Campbell and Bounty Island fisheries all have marine mammal bycatch.
There is a large shark bycatch in the deepwater fisheries. Spiny dogfish in ling fishery (previously non QMS).
Concern that hake and ling are being certified “on the coat tails” of New Zealand hoki. Two independentreview panels state that this (hoki) fishery should not have been certified.
P3
Hake has a high rate of juvenile catch both retained and discarded (run through fish meal plant). This isaffecting small areas which are targeted and this calls into question how this is affecting stock.
High grading occurs within the hoki fishery.
Public access to fishery management is required. Management is currently deemed to be quite secretive andmanagement documents are not within the public domain (no public engagement within the process). Section12 of the fisheries act- no public right to be involved in management of fisheries.
Management is reliant on the fishing industry for money.
4. Other issues(e.g. any other stakeholders we should contact, any written submissions to follow?)
Seran DaviesIMM Project Coordinator
INTERTEK FISHERIES CERTIFICATION (IFC)
NZ Hake Fishery FR Intertek Fisheries Certification page 192
MSC Interview Record NZ EEZ Fisheries
IMM AttendeesLead Auditor/Coordinator: Seran Davies
Team Members:Geoff Tingley (Lead Principle 1), Graham Pilling (Lead Principle 2) and Jo Akroyd (Lead Principle 3)
Stakeholders:Affiliation RepresentativesRoyal Forest & Bird Kevin Hackwell (Advocacy Manager) and Kirstie Knowles (Marine ConservationAdvocate)
Location: Ministry of Fisheries, Wellington, New Zealand.
Date: 23rd July 2009
2. StatusWhat is the nature of the organisations interest in the fishery (e.g. client / science / management / industry /eNGO etc)
eNGO
3. Stakeholder Key IssuesWhat, if any, specific substantive issues or concerns are identified regarding the fishery? (P1 – P2 – P3)What information is available to allow us to determine the status of the fishery in relation to each issue?
The BPA’s should not be considered very highly within this assessment. The position of them is incorrect and noresearch, knowledge of habitat or suitable benthos was undertaken to support them. RF&B do not agree thatthe BPA’s address the protection of some of the hake, ling & SBW (Southern Blue Whiting) grounds. Researchneeds to be undertaken on the habitats and the BPA’s should not be given much weighting within these EEZfishery assessments.
High grading occurs within the NZ EEZ fisheries.
Southern Blue Whiting (SBW)Key issues raised with regard to P2 but also some concerns regarding status of stock under P1. High catchesof marine mammals (mostly NZ fur seals but also some NZ sea lions). The squid trawl fishery has the worstrecord for this and has a plan to rectify the situation. Argue to the contrary that the code of practice does notwork. Murray Smith has undertaken modelling work on bycatch & Sophie Manual (NIWA). Bounty Islandspose the biggest risk area with large amounts of bycatch. Factors contributing to capture include turningwhilst trawling plus the time of day when trawling takes place- these things are not picked up by the codes ofpractice. Also seasonal strategies do not come into play. This fishery has killed more mammals than the squidfishery. 95% of New Zealand Sea lions are breeding on the Auckland Islands. Louise Chilvers (DOC) and IgorDebsky (DoC)/Nathan Walker (MFish) have further information on this. Observer coverage is misaligned tothe period of increased bycatch. Seabird bycatch is not particularly high but it is a diverse range of birds.There is potential underreporting of marine mammal bycatch.In addition there are trophic impacts and habitat impacts associated with bottom trawling. The range ofspecies caught as bycatch is not as well-known as from the hoki fishery.Ling
Long line: Currently low level in NZ waters. Fishing occurs around the Bounty Islands in smaller vessels.Vessels over 28m have seabird mitigation in place. Ed Abraham has information showing high seabird bycatchfrom longline fishery (smaller vessels). Also sponges and corals are brought up from the seabed by the lines.There is a long history of misreporting from this Ling fishery.
INTERTEK FISHERIES CERTIFICATION (IFC)
NZ Hake Fishery FR Intertek Fisheries Certification page 193
Problem raised with Hoki are the same for hake and ling as it is the same fishery. There is a research paper onmisreporting in the hoki fishery which also includes ling misreporting information (Philip Clarke, 2009). Otherresearch includes information n the misreporting of observer documents (Tracey Batman (MFish) RichardBurns & Geoffrey Cove (Lincoln University), Graham Brewer (Dunedin).TrawlIssue with P2- fur seal bycatch. The SLEDS (Sea Lion Exclusion Devices) do not work for fur seals and thisresults in unacceptably high levels of fur seal bycatch.
HakeThe hake fishery has the same issues as identified for Ling. Problem with single species focus stockassessments (as hake, ling and hoki are all caught together e.g. hake/ling may be bycatch in the hoki fishery andvice versa. Issue therefore with the three overlap species of hoki, hake and ling.Issue with process and transparency at the Ministry (MPI). Scientists’ results and information are not alwaysintegrated into Ministry decisions especially with regard to ETP and habitats.RF&B support real time catch reporting.
Bounty Islands has a serious fur seal bycatch problem. Some areas are good, but equally some are not e.g. noseabird standard in place etc. ENGO’s contacted to comment by MPI. DW Fish plan (DWG & DWTeam)provided to RF& B to comment on but there was no scientific involvement & they do not consult with scientistsinternally.There is no drive regarding the working towards minimising the bycatch. Aerial counts of fur seal populationsare informative for distribution but cannot be used for abundance information. Boat based informationundertaken in Fjordland (South Island) is the same.Trawls should only go over old trawl areas- no expansion into new areas. For BPAS – areas of significanceneed to be identified as well as areas being put to one side to study the rate of recovery of the seabed fromtrawling in order to better understand the impact of the fishery.NO MPAs are planned within NZ’s EEZ until 2013. The considered approach for the MPA protection wassquashed by the BPA plan.RF&B would like to discuss the BPAs with DWG. MFish and DOC have been told to freeze all work due to theagreement for the BPAS.Overview:Issue with P2 for Southern Blue WhitingAutoliners are ok within the longline fleet (but the small vessels are not- less regulations, more issues withbycatch etc)With regard to the trawl fisheries, RF&B do not think that the hoki fishery met the MSC standard (althoughhake and ling are slightly better than hoki).
4. Other issues(e.g. any other stakeholders we should contact, any written submissions to follow?)
Hugh Best (Marine conservationist) has 16 years worth of fur seal data.Barry Weever (ECO) - key person to be contacted on fisheries stock assessments.Louise Chilvers (DOC) and Igor Debsky (DoC)/Nathan Walker (MFish)Murray Smith & Sophie Manual (NIWA)Ed Abraham
Seran DaviesIMM Project Coordinator
INTERTEK FISHERIES CERTIFICATION (IFC)
NZ Hake Fishery FR Intertek Fisheries Certification page 194
MSC Interview Record
IMM AttendeesLead Auditor/Coordinator: Seran Davies
Team Members:Geoff Tingley (Lead Principle 1), Graham Pilling (Lead Principle 2) and Jo Akroyd (Lead Principle 3)
Stakeholders:Affiliation RepresentativesWWF Peter Trott (WWF-Australia. Fisheries Programme Manager)
Rebecca Bird (WWF- New Zealand. Marine Programme Manager)
Location: Talley’s Seafood, Nelson, New Zealand.
Date: 24th July 2009
2. StatusWhat is the nature of the organisations interest in the fishery (e.g. client / science / management / industry /eNGO etc)
eNGO
3. Stakeholder Key IssuesWhat, if any, specific substantive issues or concerns are identified regarding the fishery? (P1 – P2 – P3)What information is available to allow us to determine the status of the fishery in relation to each issue?
There is no management in place for bycatch species (except if QMS) e.g. what about sharks? General harveststrategies are in place not specific to the fisheries themselves for appropriate reference points e.g. SBW.There is not enough information on the habitat types e.g. % of areas fished and sensitivity level of habitat.Require demonstrable proof regarding impacts to trophic structure and ecosystem modelling.There is not enough convincing evidence that seals will survive SLEDs. Critical injury and hypoxia may occur.SEDs are effective in other fisheries and should be introduced here in addition to the SLEDS.HakeSimilar issues as for Hoki. Bycatch problems with fur seals, birds, sharks and skates. Issues with Trawlfootprints. Concerns for hake stock on Chatham rise classified as overfished in last 5 years. Information is notcausing concern for sub-Antarctic stocks.Hake and Ling fisheries are not precautionary enough. Variability in stocks not considered.Concerned that the harvest strategy is not tried and tested as it is a generic strategy.There is an impact of this fisheries gear type on the habitat. The severity of this impact is not well known.Discarding is occurring within the fishery predominantly of bycatch species (also happens with QMS species).Monitoring & compliance: prosecutions are occurring due to high grading within the hoki fishery (same fisheryas for hake). There is also a compliance issue with tracking the products fo this fishery.There is underreporting present throughout the EEZ fisheries and the trawl fisheries have an issue withcompliance.LingChatham rise is fully fished. There is limited information regarding stock status for west coast South Island.Impacts of this fishery upon bycatch species are unknown also; discarding of bycatch is known to occur.Inshore long lines have high interactions with seabirds and no effective mitigation nor codes of practice.Australian fisheries abide by CCAMLR regulations which are proving to be effective- suggest the sameapproach for NZ fisheries.Southern Blue WhitingThere is an issue with the stock especially Campbell and Bounty stocks. Uncertainties in stock assessments alsounknown stock trend. Damaging gear type used in fishery. Protected species are affected-especially around
INTERTEK FISHERIES CERTIFICATION (IFC)
NZ Hake Fishery FR Intertek Fisheries Certification page 195
the Bounty’s e.g. sea lions, birds and other marine mammals. Model is based upon the squid fishery only (usinginformation based upon sea lion capture). Not enough convincing information to suggest that the usage of theSLEDS is allowing survival (high percentage is suffering hypoxia or serious injury). Current on-goingmonitoring is not effective and further information is required.
4. Other issues(e.g. any other stakeholders we should contact, any written submissions to follow?)
Seran DaviesIMM Project Coordinator
INTERTEK FISHERIES CERTIFICATION (IFC)
NZ Hake Fishery FR Intertek Fisheries Certification page 196
2012 Interviews
Site Visit - Stakeholder Meeting Checklist
Stakeholder Interview Record MPI deepwater and Science, MPI Compliance
Assessment Team NamesLead Assessor Jo AkroydP1 Team Member Graham PillingP2 Team Member Graham PillingP3 Team Member Jo Akroyd
Meeting Location WellingtonDate 10th September 2013Stakeholders Name AffiliationJeremy Helson MPI – DeepwaterTiffany Back MPI – DeepwaterGeoff Tingley MPI – ScienceDean Baigent MPI – ComplianceGeoff backhouse MPI – Compliance
Comments:Meeting 1. Deepwater and ScienceMeeting 2 Compliance
2. StatusWhat is the nature of the organisations interest in the fishery (e.g. client / science /management / industry / eNGO etc)
MPI are the Managers of the NZ fisheries
INTERTEK FISHERIES CERTIFICATION (IFC)
NZ Hake Fishery FR Intertek Fisheries Certification page 197
3. IMM Assessment Team QuestionsAssessment team questions for stakeholders
Deepwater and sciencePlease describe the processes involved in the management of the fishery and the activitiesinvolved relating to management of P1 and P2 species, as well as the processes relevant toP3.CompliancePlease could you describe the compliance in these two fisheries, any concerns you have andany enforcement issues
4. Stakeholder Key Issues and responses
Deepwater and Science
- With regard the process involved in setting the TACCs, the underpinning science wasdefined within the 10 year research programme, which holds for 5 years with a subsequent 5year extension. The science is peer reviewed through the NZ working group structure and putforward to managers who consider options for TACC changes (including status quo) usuallybased upon constant catch projections of future status. These options undergo statutoryconsultation through the IPP (initial position paper) that allows the incorporation ofstakeholder views and commentary. This consultation process is a requirement of theFisheries Act. Based on consultation, final advice is then provided to the Minister. The finaladvice paper (FAP) includes information on the environmental impacts, biology of thestocks, ETP and bycatch, as well as multispecies issues. The IPPs and FAPs are placed onthe website. Advice is probabilistic where feasible which was generally discussed in detail atthe Working Group level.- The criteria for the rebuilding period (less than twice the time that stock rebuildingwould occur in the absence of fishing) was detailed.- A paper by Dr Mace on the harvest strategy, as submitted to the MSC process forhoki, was noted.- MPI provided details on the number of recent decisions on TACC change, theirdirections, and the level of support for these from the industry stakeholder- The working relationship between MPI and DWG was described- The consultation process on the 10 year research plan was described, including theconsultation planning meeting in 2010- Further examples of the process involved were noted through the NPOA seabirds andsharks process- The QMS and tier levels of species were described, noting that the Fishery Planprovides the higher level goals that drive the Annual Operational Plan, progress on which isreported on annually (Annual report reviewing progress vs the Annual Operational Plan).The pattern of introduction of species into the QMS was described, noting the QMSIntroduction and Final Advice Paper 2008- The Official Information Act was also noted- The role of the PBR within the management system was discussed. It was noted thatthe Fisheries Act (section 15(2)) presents an obligation on protected species, along with in
INTERTEK FISHERIES CERTIFICATION (IFC)
NZ Hake Fishery FR Intertek Fisheries Certification page 198
section 9. However, neither presents specific numbers or statutory targets for specificprotected species. In general, the Minister may take measures considered necessary to avoid,remedy or mitigate the effect of fishing on any protected species. PBR were considered to actas one indicator for action, rather than absolute trigger values. Trigger values are availableunder the Fisheries Act but require a formal process to be established. This has not occurredin the fisheries in question as it has been deemed unnecessary based on historical catch ofprotected species. It was noted that one interaction itself acts as a trigger for action. TheAEWG has not reviewed the PBRs for key species (e.g. sea lions). Some PBRs have beenreviewed by the AEWG Working Group; there are also more detailed Bayesian models forother sea lion populations that have been extensively peer reviewed. The exception is the sealion PBR for the Campbell Islands southern blue whiting fishery (SBW6I).- The Science 2012 process aims to provide a better understanding of the risk thatfisheries pose for other ETP species beyond seabirds (a risk assessment for which hasalready been completed). This project is currently running up to 2013 and was started in2012. It will examine cumulative impacts on species as well as the risk posed by individualfisheries- It was noted that the squid SQU6T has been closed in some years due to sea lionbycatch levels, based on assumed strike rates, so that sanction can be used in that fishery andcould be extended to other fisheries if deemed necessary.- The history of the BPAs and their utility was discussed, and the discussionsundertaken as part of the recent hoki assessment were noted. MPI are monitoring the fisheryfootprint and inter-annual changes through statutory reporting of fishing positions and VMS(required on vessels >28m).- Fishery plans for hake and ling (and SBW, ORH, JMA and HOK) have beenapproved by the Ministry and relate to management objectives,- The pattern of trawl surveys, as detailed in the 10 year plan, was described. Theimportance of the surveys in the WCSI to support the fishery-based CPUE time series wasnoted.
Compliance- Currently there are no particular compliance concerns with risk in the hake or lingfisheries- MPI compliance are looking at wider compliance eg FCV reviews, corrective actionsand culture on some of the fishing vessels.- MPI compliance are working collaboratively with DWG to identify risks.- There have been no recent compliance issues- In 2007/2008 using MPI profiling and observed vs non observed data, misreportingbetween LIN 5 and 6 was identified. Three major operations took place involving Korean,Japanese and Russian vessels. This resulted in 3 prosecutions. It was the first time a coDirector had been taken to court, sending clear signals that companies and Directors wouldbe held accountable.- Since then observers and profiling have confirmed that there is now minimal risk ofthis occurring however monitoring still takes place.- A number of years ago trucking in Hake was identified as an issue involving ~1500tof hake per year, taken in HAK7 but misreported as having been taken in HAK4 and HAK1.An investigation was launched – it involved Korean vessels. Six vessels were prosecuted.There has since been close monitoring with good results. The catches were taken intoaccount in the stock assessments.
INTERTEK FISHERIES CERTIFICATION (IFC)
NZ Hake Fishery FR Intertek Fisheries Certification page 199
- Hake and ling are now considered low risk fisheries; this has been largely attributedto a change in behavior in foreign charters.- Any minor compliance issues are brought to the attention of the DWG who have theopportunity to work with the company or vessel to resolve an issue. If this is not resolvedsatisfactorily then target specific vessels will be targeted and if no behavioral change, will beprosecuted if it is a deliberate criminal offence, repetitive or serious.- the “VADE” (Voluntary, Assisted, Directed, Enforced) compliance model seems to beworking well and it was emphasized that hake and ling are not considered a compliance risk
6. Closing
IMM Lead Assessor: Summary of key points – stakeholder to confirm in writing (sign if hard copy)
7. Confirmation of record of meeting:
IMM Lead Assessor Signature: Stakeholder Signature:
16/09/13 By email
INTERTEK FISHERIES CERTIFICATION (IFC)
NZ Hake Fishery FR Intertek Fisheries Certification page 200
Stakeholder Interview Record NZ Hake and Ling : NIWA 10th September 2013
Assessment Team NamesLead Assessor Jo AkroydP1 Team Member Graham PillingP2 Team Member Graham PillingP3 Team Member Jo Akroyd
Meeting Location WellingtonDate 10th September 2013Stakeholders Name AffiliationRosemary Hurst NIWAPeter Horn NIWACharles Edwards NIWA
2. StatusWhat is the nature of the organisations interest in the fishery (e.g. client / science / management / industry /eNGO etc)
Research providers
3. IMM Assessment Team QuestionsAssessment team questions for stakeholders
What are the key updates with the HAK and LIN stock assessments in recent years?What are the areas of uncertainty within the stock assessments?Have the assessments been subject to external review?What analyses are performed for lower tier species?What is the latest work on cold water coral distribution and status?What research has been undertaken on ecosystem analyses?What activities have been undertaken on benthic habitat structure?
4. Stakeholder Key Issues and responses
- Recent HAK assessments in regions 1,4 and 7- General patterns in stock size detailed in the plenary report were detailed, and the frequency ofresource fishery-independent surveys noted- Noted that while Chatham Rise stock has increased in recent years due to better recruitments,projections show the stock is likely to decline in the future- West Coast South Island stock assessment was the subject of some uncertainty due to the lack offishery-independent stock assessments. The assessment therefore relied on commercial CPUE data. Twosurveys in 2000 and 2012 allowed some ‘ground-truthing’ of the commercial CPUE time series and reduced(but did not eliminate) the uncertainty. A further survey has recently been completed and will be included in thenext assessment.- Recent LIN assessments in regions 3&4, 5&6, and 7, as well as the Bounty Plateau (part of the LIN6area) and Cook Strait (overlapping parts of areas LIN2 and 7)- No stock assessment for LIN2- LIN7 assessment contained the same uncertainty as HAK7- The Cook Strait assessment was not accepted, and suffered from conflicts in the catch-at-age andCPUE data
INTERTEK FISHERIES CERTIFICATION (IFC)
NZ Hake Fishery FR Intertek Fisheries Certification page 201
- The hoki assessment was externally reviewed, which covered the CASAL modeling approach.However, the specific hake and ling assessments have not been externally reviewed. It was noted that theinternal review process of new assessments is quite rigorous- Tier II and Tier III species are subject to risk assessment approaches (tier III) and characterizationanalyses (e.g. using trends in CPUE – tier II), as detailed in the 10 year research plan. An internally fundedNIWA project is looking into data poor assessment approaches, while others are progressing ageing for non-tier I species (e.g. deepwater shark ageing)- A summary of cold water coral analyses will be provided- Trophic studies of the Chatham Rise have supported Ecopath analyses for areas 3&4- These will also underpin future ‘Atlantis’ ecosystem modeling of the Chatham Rise region- There are ongoing discussions on spatial modeling of benthic species, including Vulnerable MarineEcosystem work. Further analyses to examine the BOMEC activities, including the ocean survey 2020 onChatham Rise, are ongoing. Relevant camera-based work will be summarized.
6. Closing
IMM Lead Assessor: Summary of key points – stakeholder to confirm in writing (sign if hard copy)
7. Confirmation of record of meeting:
16/09/2013 18/9/2013
IMM Lead Assessor Signature: Stakeholder Signature:
INTERTEK FISHERIES CERTIFICATION (IFC)
NZ Hake Fishery FR Intertek Fisheries Certification page 202
Site Visit - Stakeholder Meeting Checklist
Stakeholder Interview Record
Meeting Dragonfly for MSC Assessment NZ Hake and Ling : September 10th 2013
Assessment Team NamesLead Assessor Jo AkroydP1 Team Member Graham PillingP2 Team Member Graham PillingP3 Team Member Jo Akroyd
Meeting Location Dragonfly offices, WellingtonDate 10/09/2013Stakeholders Name AffiliationEdward Abraham DragonflyFinlay Thompson DragonflyPhilipp Neubauer Dragonfly
2. StatusWhat is the nature of the organisations interest in the fishery (e.g. client / science /management / industry / eNGO etc)
Research Providers
4. IMM Assessment Team QuestionsAssessment team questions for stakeholders
Please detail the approach, outputs and uncertainties in the modeling of non-target (ETP)species in the hake and ling fisheries
3. Stakeholder Key IssuesWhat, if any, specific substantive issues or concerns are identified regarding the fishery? (P1– P2 – P3) and what information is available to allow us to determine the status of thefishery in relation to each issue?
- A summary of the results available in the Dragonfly reports was given, broken downby unit of certification
INTERTEK FISHERIES CERTIFICATION (IFC)
NZ Hake Fishery FR Intertek Fisheries Certification page 203
- Noted differences between the autoliner (offshore) and smaller manual settinglongliners (inshore)- Noted that year trend model estimates in the trawl fishery were influenced by thepattern seen in the hoki fishery, as those year effects were modeled across the fishery- Noted that the 2010 mitigation requirements (e.g. integrated weight line) wereintegrated into the model (in terms of the capture rates) but not directly taken into accountwithin the model- The recent coverage of observers within the fleets has been sufficient to estimateinteractions, but a greater coverage tends to increase precision in the estimates, and reducebiases due to uneven coverage of fleet units- Model details are available in the 2010/2011 Dragonfly report- Results are presented and reviewed at the Scientific Working Group and furtheranalysis performed on the basis of feedback- Noted that the risk assessment for seabirds has been completed, and highlightsuncertainty in the estimates for the smaller inshore vessels due to the low observer coverage.Current estimates indicate, for example, a high risk for black petrels- Analyses for marine mammals were also detailed- Month-effects were noted with greater movement potential in the winter months asindividuals may move further offshore, while pupping activity may constrain activity insummer months- Links between the Auckland Island and Campbell Island were noted for sealionsbased on tagging info- A risk assessment approach for marine mammals is currently underway- Uncertainties in the inputs to the PBR calculation were discussed, with Rmaxconsidered reasonably consistent for marine mammals, with population size being viewed asa key area of uncertainty. PBR was viewed more as a figure to provide context rather than a‘critical level’ value
6. Closing
IMM Lead Assessor: Summary of key points – stakeholder to confirm in writing (sign if hard copy)
7. Confirmation of record of meeting:
16/09/13 Confirmation by emailIMM Lead Assessor Signature: Stakeholder Signature:
INTERTEK FISHERIES CERTIFICATION (IFC)
NZ Hake Fishery FR Intertek Fisheries Certification page 204
Site Visit - Stakeholder Meeting Checklist
Stakeholder Interview Record e NGOs 9th September 2013
Assessment Team NamesLead Assessor Jo AkroydP1 Team Member Graham PillingP2 Team Member Graham PillingP3 Team Member Jo Akroyd
Meeting Location WWF Wellington OfficesDate 10th September 2013Stakeholders Name AffiliationPaul Crozier WWF NZKevin Hackwell Forest and BirdBarry Weeber ECO
Comments:- The representative from Eco requested that it be clearly noted that his presence at themeeting did not legitimize the MSC process being undertaken in NZ, in particular for thesefisheries, and noted concerns over the composition of the audit team and the availability ofinformation for the stakeholders
2. StatusWhat is the nature of the organisations interest in the fishery (e.g. client / science /management / industry / eNGO etc)
E NGO
3. Stakeholder Key IssuesWhat, if any, specific substantive issues or concerns are identified regarding the fishery? (P1– P2 – P3) and what information is available to allow us to determine the status of thefishery in relation to each issue?
INTERTEK FISHERIES CERTIFICATION (IFC)
NZ Hake Fishery FR Intertek Fisheries Certification page 205
ENGO’s concerns- It was noted by all eNGO representatives that their attendance and involvement atWorking Groups, in particular for stock assessment, were hindered by funding andmanpower. If possible, they would concentrate on stock assessment meetings for thosefisheries under MSC certification, and noted that given industry received Governmentsupport for the MSC process that it was unfair that NGOs did not receive the same- With respect to reference points, it was noted that for particular species (e.g. blackcardinalfish) management action may not be taken when limits were reached- It was noted that changes in TACC tended to take a long time after the stockassessment advice was supplied, and that it appeared easier to increase TACCs thandecrease them- eNGOs felt they and other key stakeholders were not involved sufficiently in thedevelopment of the 10 year research plan in recent years- EFF groups were felt to be useful and engagement on the NPOAs for seabirds andsharks was more successful, but communications between eNGOs and other stakeholdersremained limited- The proposed identification guides for sharks as part of the NPOA sharks was notedas a positive development to improve data collection- The issue of the charter fleet and the recent Parliamentary Enquiry were noted, whichraised management issues such as misreporting- The limited observer coverage on the inshore longline fleet fishing for ling was noted- 80% of Benthic Protection Areas were noted to be outside the depth that formed thefocus of trawl activities- A Standards NZ review of benthic impact standards was said to have stalled after 6months. A report by Leathwick on fisheries captures by habitat types was noted as animportant document- On ecosystem issues, the compendium from the Aquatic Environment Working Groupwas noted.- For ETP species, issues with uncertainty in the ling inshore (small) longline fleet wasnoted, given patchy observer coverage, while fur seals were also noted within the trawlfishery- Concern was raised that recent decisions to increase the TACC for hoki might lead toincreases in the catch of hake and ling to levels above the TACC for those species, orpotential discarding- It was noted that while 100% observer coverage had been achieved on thehoki/hake/ling fishery this year, the 24 hour pattern of activity in these vessels would meanthat some tows may be unobserved as the observer must sleep at some point- concern with the amount of by-catch of deep water sharks in these fisheries, and thefact that they are extremely vulnerable to fishing practices
6. Closing
IMM Lead Assessor: Summary of key points – stakeholder to confirm in writing (sign if hard copy) Comments not to be attributed to individuals with the exception of Mr Weeber’sconcern re the process and expertise of the auditors.
INTERTEK FISHERIES CERTIFICATION (IFC)
NZ Hake Fishery FR Intertek Fisheries Certification page 206
The IMM team would take the eNGOs concerns into account when writing the reportand scoring the fishery
7. Confirmation of record of meeting:
16/09/13 Confirmation by email
IMM Lead Assessor Signature: Stakeholder Signature:
INTERTEK FISHERIES CERTIFICATION (IFC)
NZ Hake Fishery FR Intertek Fisheries Certification page 207
Written submissions made by stakeholders
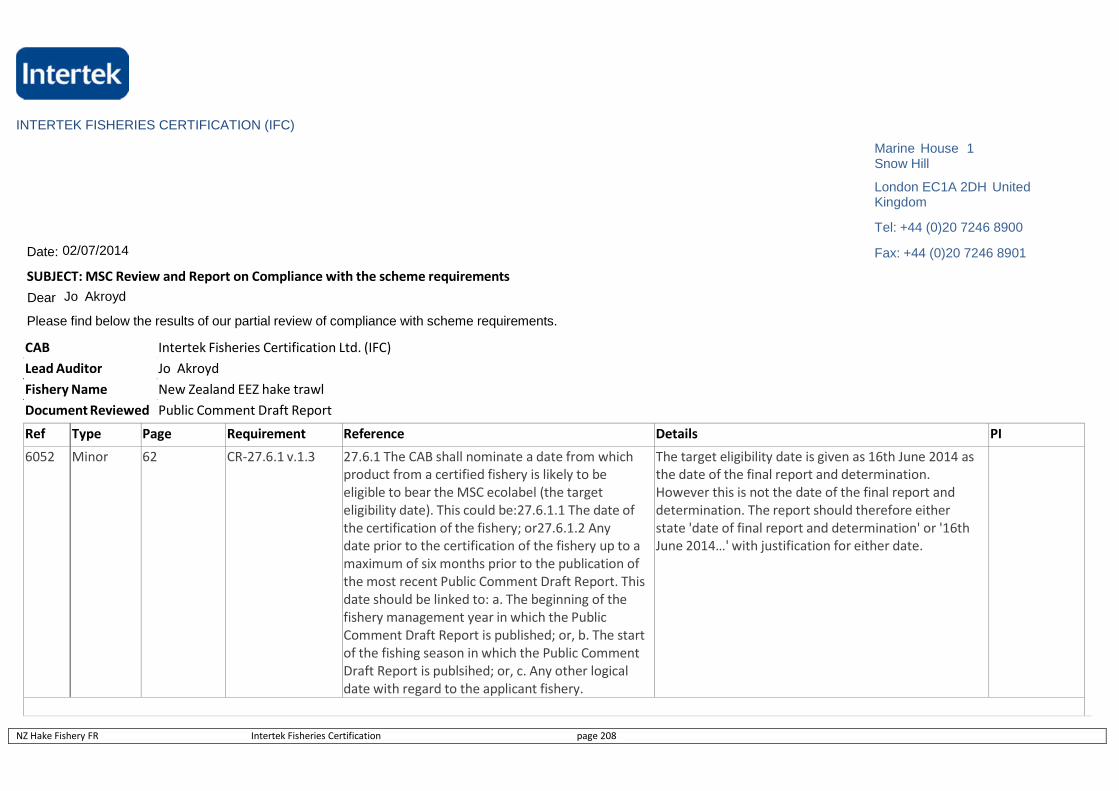
INTERTEK FISHERIES CERTIFICATION (IFC)
NZ Hake Fishery FR Intertek Fisheries Certification page 208
Date: 02/07/2014
SUBJECT: MSC Review and Report on Compliance with the scheme requirements
Dear Jo Akroyd
Please find below the results of our partial review of compliance with scheme requirements.
Marine House 1Snow Hill
London EC1A 2DH UnitedKingdom
Tel: +44 (0)20 7246 8900
Fax: +44 (0)20 7246 8901
Ref Type Page Requirement Reference Details PI
6052 Minor 62 CR-27.6.1 v.1.3 27.6.1 The CAB shall nominate a date from whichproduct from a certified fishery is likely to beeligible to bear the MSC ecolabel (the targeteligibility date). This could be:27.6.1.1 The date ofthe certification of the fishery; or27.6.1.2 Anydate prior to the certification of the fishery up to amaximum of six months prior to the publication ofthe most recent Public Comment Draft Report. Thisdate should be linked to: a. The beginning of thefishery management year in which the PublicComment Draft Report is published; or, b. The startof the fishing season in which the Public CommentDraft Report is publsihed; or, c. Any other logicaldate with regard to the applicant fishery.
The target eligibility date is given as 16th June 2014 asthe date of the final report and determination.However this is not the date of the final report anddetermination. The report should therefore eitherstate 'date of final report and determination' or '16thJune 2014…' with justification for either date.
CAB Intertek Fisheries Certification Ltd. (IFC)
Lead Auditor Jo Akroyd
Fishery Name New Zealand EEZ hake trawl
Document Reviewed Public Comment Draft Report
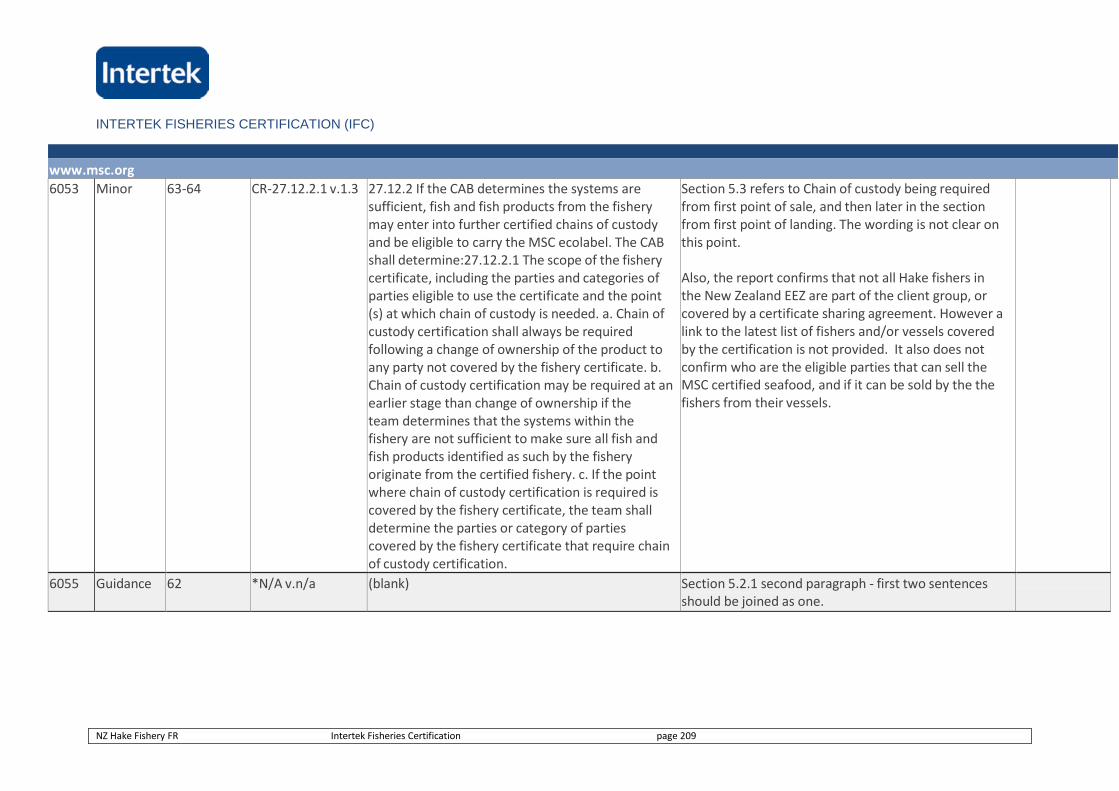
INTERTEK FISHERIES CERTIFICATION (IFC)
NZ Hake Fishery FR Intertek Fisheries Certification page 209
www.msc.org
6053 Minor 63-64 CR-27.12.2.1 v.1.3 27.12.2 If the CAB determines the systems aresufficient, fish and fish products from the fisherymay enter into further certified chains of custodyand be eligible to carry the MSC ecolabel. The CABshall determine:27.12.2.1 The scope of the fisherycertificate, including the parties and categories ofparties eligible to use the certificate and the point(s) at which chain of custody is needed. a. Chain ofcustody certification shall always be requiredfollowing a change of ownership of the product toany party not covered by the fishery certificate. b.Chain of custody certification may be required at anearlier stage than change of ownership if theteam determines that the systems within thefishery are not sufficient to make sure all fish andfish products identified as such by the fisheryoriginate from the certified fishery. c. If the pointwhere chain of custody certification is required iscovered by the fishery certificate, the team shalldetermine the parties or category of partiescovered by the fishery certificate that require chainof custody certification.
Section 5.3 refers to Chain of custody being requiredfrom first point of sale, and then later in the sectionfrom first point of landing. The wording is not clear onthis point.
Also, the report confirms that not all Hake fishers inthe New Zealand EEZ are part of the client group, orcovered by a certificate sharing agreement. However alink to the latest list of fishers and/or vessels coveredby the certification is not provided. It also does notconfirm who are the eligible parties that can sell theMSC certified seafood, and if it can be sold by the thefishers from their vessels.
6055 Guidance 62 *N/A v.n/a (blank) Section 5.2.1 second paragraph - first two sentencesshould be joined as one.
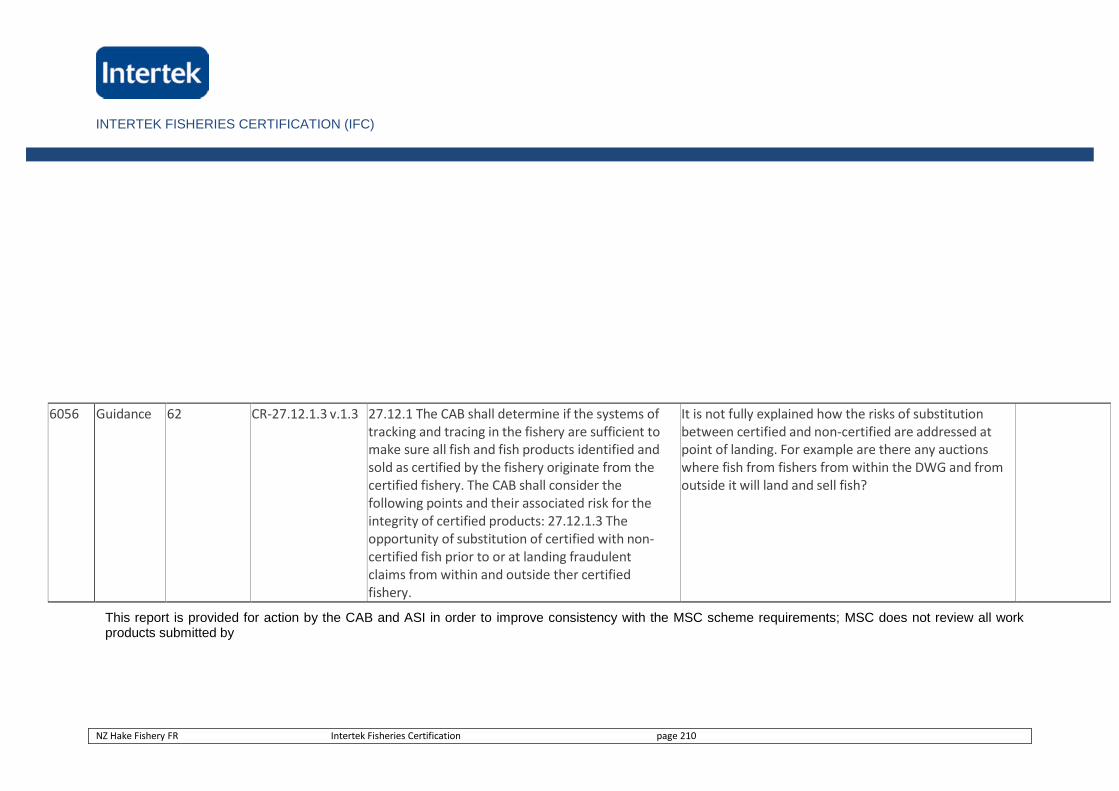
INTERTEK FISHERIES CERTIFICATION (IFC)
NZ Hake Fishery FR Intertek Fisheries Certification page 210
6056 Guidance 62 CR-27.12.1.3 v.1.3 27.12.1 The CAB shall determine if the systems oftracking and tracing in the fishery are sufficient tomake sure all fish and fish products identified andsold as certified by the fishery originate from thecertified fishery. The CAB shall consider thefollowing points and their associated risk for theintegrity of certified products: 27.12.1.3 Theopportunity of substitution of certified with non-certified fish prior to or at landing fraudulentclaims from within and outside ther certifiedfishery.
It is not fully explained how the risks of substitutionbetween certified and non-certified are addressed atpoint of landing. For example are there any auctionswhere fish from fishers from within the DWG and fromoutside it will land and sell fish?
This report is provided for action by the CAB and ASI in order to improve consistency with the MSC scheme requirements; MSC does not review all workproducts submitted by
INTERTEK FISHERIES CERTIFICATION (IFC)
NZ Hake Fishery FR Intertek Fisheries Certification page 211
www.msc.org
Conformity Assessment Bodies and this review should not be considered a checking service. If any clarification is required, please contact Maylynn Nunn on +61 2 9524 8400 formore information.
Best regards,Fisheries Oversight DirectorDan Hoggarth
Marine Stewardship Council
INTERTEK FISHERIES CERTIFICATION (IFC)
NZ Hake Fishery FR Intertek Fisheries Certification page 212
Intertek Fisheries Certification omment
MSC REF 6052 Minor CR-27.6.1 v1.3
The target eligibility date is given as 16th June 2014 as the date of the final report and determination.However this is not the date of the final report and determination. The report should therefore eitherstate 'date of final report and determination' or '16th June 2014…' with justification for either date.
The report has been changed to state that the target eligibility date is the date of the final report anddetermination.
MSC REF 6053 Minor CR 27.12.3.1
Section 5.3 refers to Chain of custody being required from first point of sale, and then later in thesection from first point of landing. The wording is not clear on this point.
Also, the report confirms that not all Hake fishers in the New Zealand EEZ are part of the client group, orcovered by a certificate sharing agreement. However a link to the latest list of fishers and/or vessels covered bythe certification is not provided. It also does not confirm who are the eligible parties that can sell the MSCcertified seafood, and if it can be sold by the the fishers from their vessels.
Section 5.3 has been changed to read Chain of Custody required from first point of landing.
The Ministry of Primary Industries were asked to check the recent catch records for HAK by DWGShareholders and other companies/fishers who contract catch, buy HAK ACE, or whose catches of HAK aresold by DWG shareholders to establish both the level of representation of 'fishers' in the hake fisheries and as abasis to assess the CoC matters. Over the last five years 99.5% of hake catch is related to DWG catch. Thereport has been amended to say this.
MSC REF 6055 Guidance.
Section 5.2.1 second paragraph - first two sentences should be joined as one.
Section 5.2.1 has been corrected.
MSC REF 6056 Guidance CR 27.12.1.3 V 1.3
It is not fully explained how the risks of substitution between certified and non-certified are addressed at point oflanding. For example are there any auctions where fish from fishers from within the DWG and from outside itwill land and sell fish?
DWG vessels will have only certified hake at point of landing. These will be clearly labelled eg vessel name andas MSC certified fish. The labelling and documentation accompanies fish all the way from landing to final pointof sale. Hake from a non Deepwater Group vessel will not be able to be labelled as certified. The fish will beclearly identified as to which vessel the fish was caught. Hake from different vessels is never mixed and neversold together.
INTERTEK FISHERIES CERTIFICATION (IFC)
NZ Hake Fishery FR Intertek Fisheries Certification page 213
Template for Stakeholder Inputinto MSC Fishery Assessments
The forms included in this document are to guide stakeholders in providing
written comments during an MSC fishery assessment process
Thank you for your interest in participating in and contributing to an MSC fishery assessment!
Stakeholder contributions are integral to ensuring robust assessments and certification decisions. The
forms contained in this document, are intended to be used alongside the Stakeholder’s Guide to the
Marine Stewardship Council, to assist you in contributing relevant information to the certifier at each
appropriate stage in the assessment process.
There are six steps in the MSC fishery assessment process where stakeholders are formally invited
to comment. These are:
1. Fishery announcement, stakeholder identification and assessment team formation
2. Defining the assessment tree
3. Information gathering, stakeholder meetings and scoring
4. Client and peer review
5. Public review of the draft assessment report
6. Final assessment report and determination
The final phase of the assessment process, once the Final assessment report and certification
determination has been posted, is the opportunity for stakeholders who have been involved in the
process to lodge a formalobjection
to the decision before it becomes final. Guidance for stakeholders on
the Objections Procedure can be found here: www.msc.org/get-
certified/fisheries/assessment/objections
If a fishery becomes certified, stakeholders will continue to have regular opportunities to provide input
over the life of the certificate through the annual surveillance audits required by the MSC.
In the pages that follow, we have provided template forms that will help organize your written input at
each relevant phase of the process, including the post-certification surveillance phase. For each
phase, there are a series of options you may choose from on the left, and a box on the right in which
to provide justifications. In order for your comments to be actionable, justifications are crucial,
because certifiers can only consider information that is relevant, factual and substantiated. These
forms have been developed to help ensure that your input and contributions may have maximum
impact.
A series of footnotes have been provided, linking to a list of the MSC documents containing the
specific requirements for certifiers at the different assessment stages. If you wish to read these
requirements, you may download them from the MSC website by clicking the links.
INTERTEK FISHERIES CERTIFICATION (IFC)
NZ Hake Fishery FR Intertek Fisheries Certification page 214
Comments must be submitted directly to the certifier (not to the MSC). Certifiers are required to
acknowledge receipt of your comments, and provide an indication to you of how and when they will
be addressed, within 10 days of receipt.
Finally, if at any time during the assessment process you have complaints about the conduct of the
certifier in undertaking a fishery assessment, please know that you can ask the certifier for their
complaints procedure, or you can provide your complaint directly to Accreditation Services
International (www.accreditation-services.com/contact0.html), which is the body that oversees the
certifiers in the MSC programme.
INTERTEK FISHERIES CERTIFICATION (IFC)
NZ Hake Fishery FR Intertek Fisheries Certification page 215
Contact Information Make sure you submit your full contact details at the first phase you participate in a specific assessment
process, subsequent participation will only need your name unless these details have changed.
Contact Name First David Last Wiedenfeld
Title Dr.
On behalf of (organisation, company, government agency, etc.) – if applicable
Organisation Please enter the legal or registered name of your organisation or company.
American Bird Conservancy
Department
Position Please indicate the position or function you exert within your organisation or company.
Senior Conservation Scientist
Description Please provide a short description of your organization.
American Bird Conservancy (ABC) is a non-profit organization whose mission is to conservenative birds and their habitats throughout the Americas.
Mailing Address, Country PO Box 249, The Plains, Virginia 20186 USA
Tel + 540-253-5780 Mob + 540-260-5596 Fax + 540-253-5782
Email [email protected] Web www.abcbirds.org
Assessment Details
Fishery New Zealand hake
Certification Body Intertek Fisheries Certification
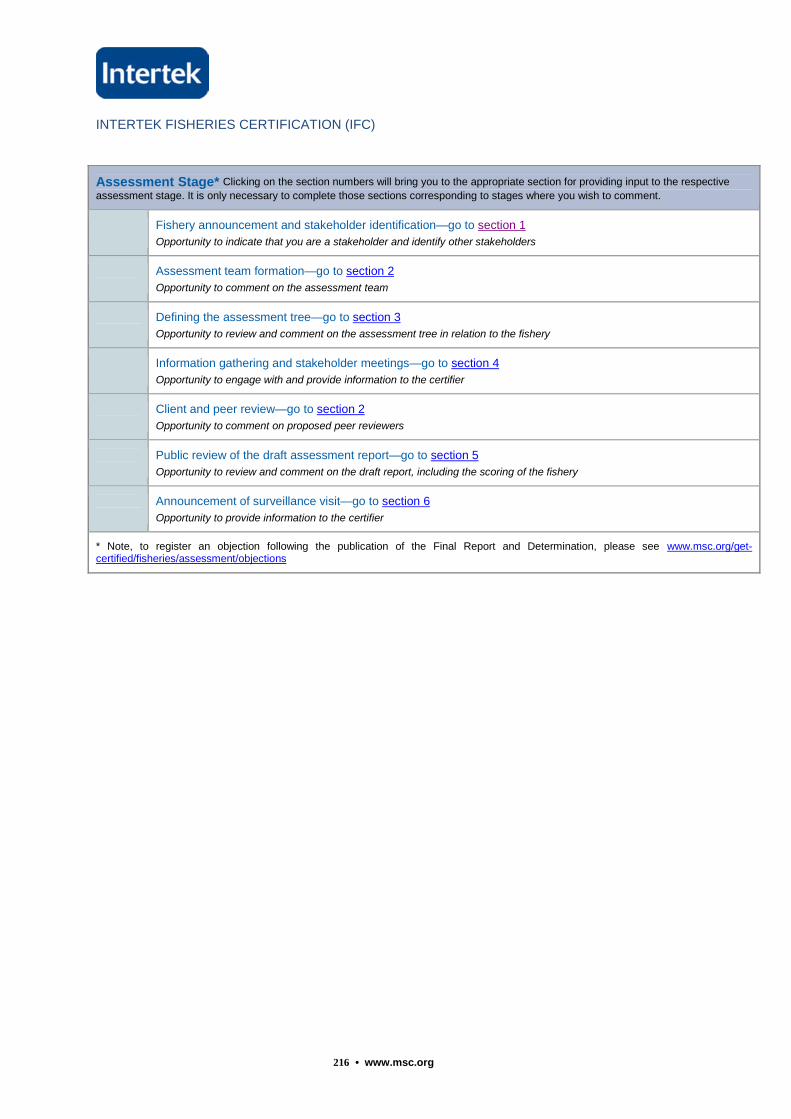
INTERTEK FISHERIES CERTIFICATION (IFC)
216 • www.msc.org
Assessment Stage* Clicking on the section numbers will bring you to the appropriate section for providing input to the respective
assessment stage. It is only necessary to complete those sections corresponding to stages where you wish to comment.
Fishery announcement and stakeholder identification—go to section 1
Opportunity to indicate that you are a stakeholder and identify other stakeholders
Assessment team formation—go to section 2
Opportunity to comment on the assessment team
Defining the assessment tree—go to section 3
Opportunity to review and comment on the assessment tree in relation to the fishery
Information gathering and stakeholder meetings—go to section 4
Opportunity to engage with and provide information to the certifier
Client and peer review—go to section 2
Opportunity to comment on proposed peer reviewers
Public review of the draft assessment report—go to section 5
Opportunity to review and comment on the draft report, including the scoring of the fishery
Announcement of surveillance visit—go to section 6
Opportunity to provide information to the certifier
* Note, to register an objection following the publication of the Final Report and Determination, please see www.msc.org/get-certified/fisheries/assessment/objections
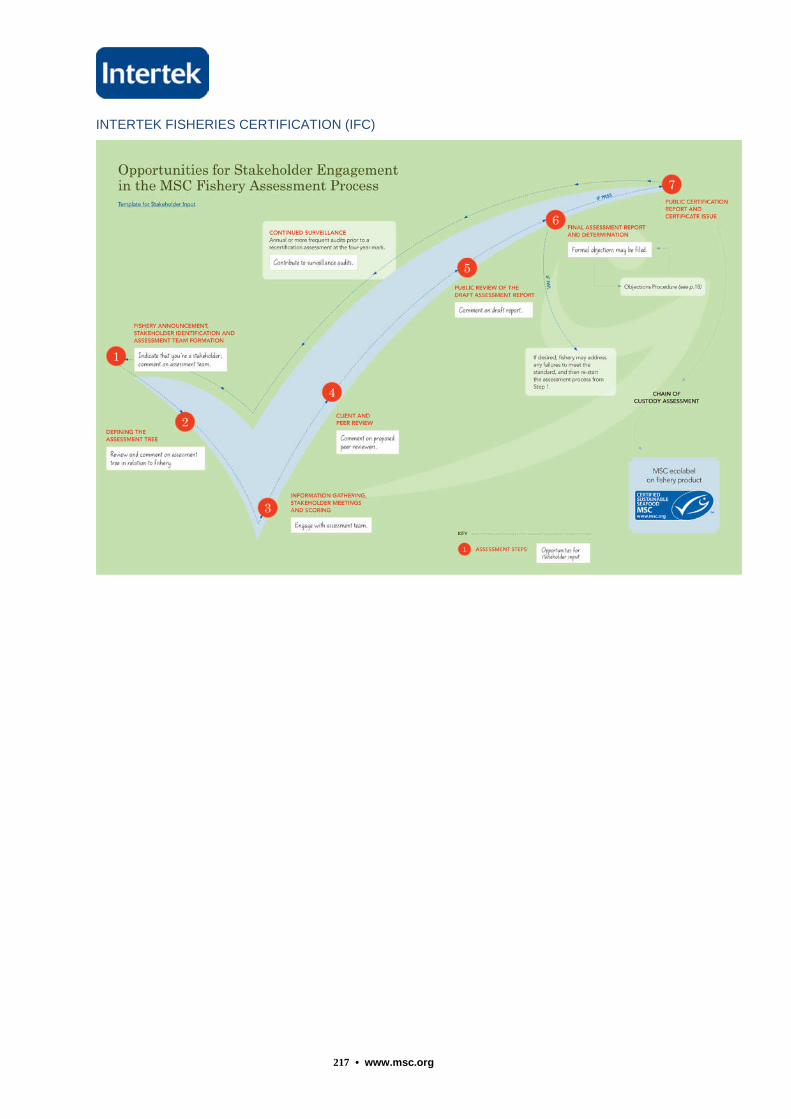
INTERTEK FISHERIES CERTIFICATION (IFC)
217 • www.msc.org
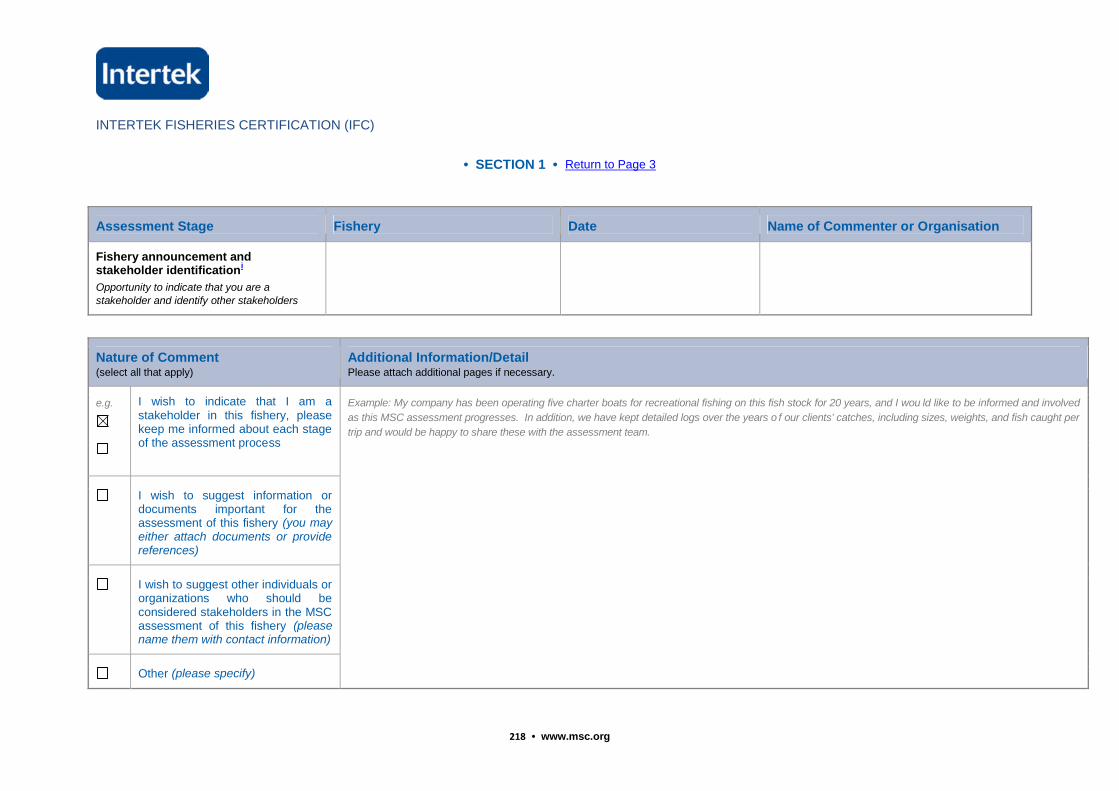
INTERTEK FISHERIES CERTIFICATION (IFC)
218 • www.msc.org
• SECTION 1 • Return to Page 3
Assessment Stage Fishery Date Name of Commenter or Organisation
Fishery announcement andstakeholder identificationi
Opportunity to indicate that you are astakeholder and identify other stakeholders
Nature of Comment(select all that apply)
Additional Information/DetailPlease attach additional pages if necessary.
e.g. I wish to indicate that I am astakeholder in this fishery, pleasekeep me informed about each stageof the assessment process
Example: My company has been operating five charter boats for recreational fishing on this fish stock for 20 years, and I wou ld like to be informed and involved
as this MSC assessment progresses. In addition, we have kept detailed logs over the years o f our clients’ catches, including sizes, weights, and fish caught per
trip and would be happy to share these with the assessment team.
I wish to suggest information ordocuments important for theassessment of this fishery (you mayeither attach documents or providereferences)
I wish to suggest other individuals ororganizations who should beconsidered stakeholders in the MSCassessment of this fishery (pleasename them with contact information)
Other (please specify)
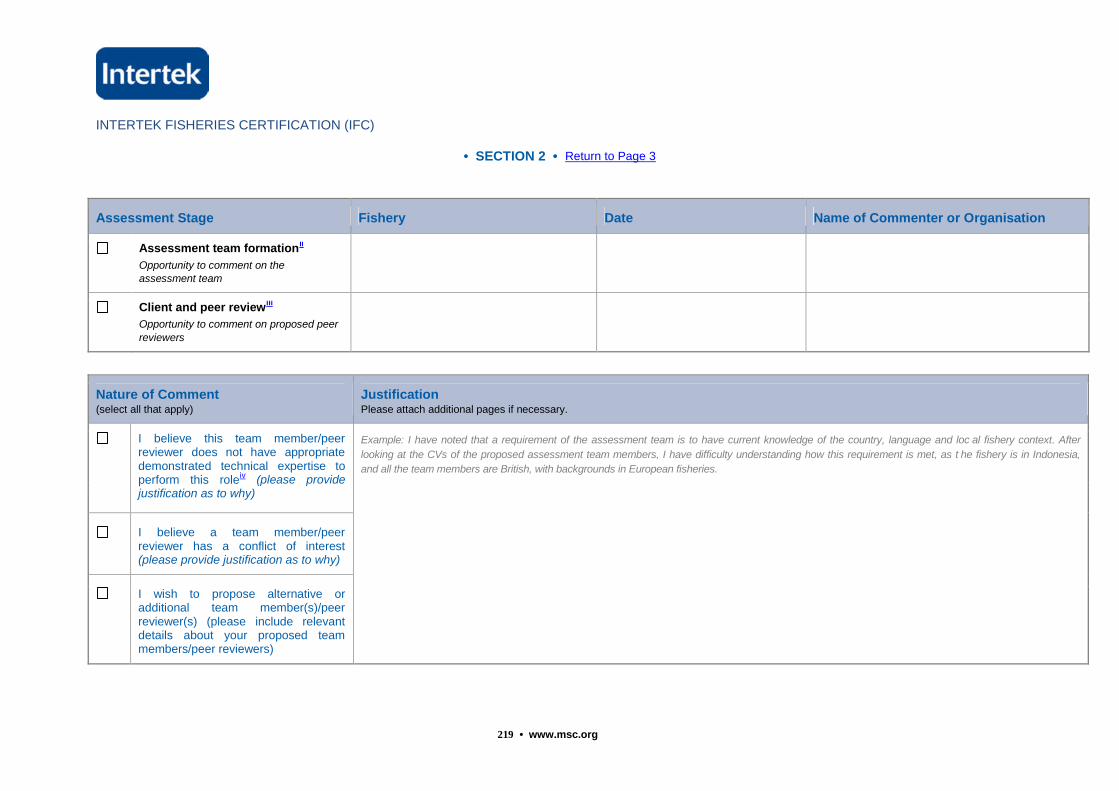
INTERTEK FISHERIES CERTIFICATION (IFC)
219 • www.msc.org
• SECTION 2 • Return to Page 3
Assessment Stage Fishery Date Name of Commenter or Organisation
Assessment team formationii
Opportunity to comment on theassessment team
Client and peer reviewiii
Opportunity to comment on proposed peer
reviewers
Nature of Comment(select all that apply)
JustificationPlease attach additional pages if necessary.
I believe this team member/peerreviewer does not have appropriatedemonstrated technical expertise toperform this roleiv (please providejustification as to why)
Example: I have noted that a requirement of the assessment team is to have current knowledge of the country, language and loc al fishery context. After
looking at the CVs of the proposed assessment team members, I have difficulty understanding how this requirement is met, as t he fishery is in Indonesia,
and all the team members are British, with backgrounds in European fisheries.
I believe a team member/peerreviewer has a conflict of interest(please provide justification as to why)
I wish to propose alternative oradditional team member(s)/peerreviewer(s) (please include relevantdetails about your proposed teammembers/peer reviewers)
INTERTEK FISHERIES CERTIFICATION (IFC)
220 • www.msc.org
Other (please specify)
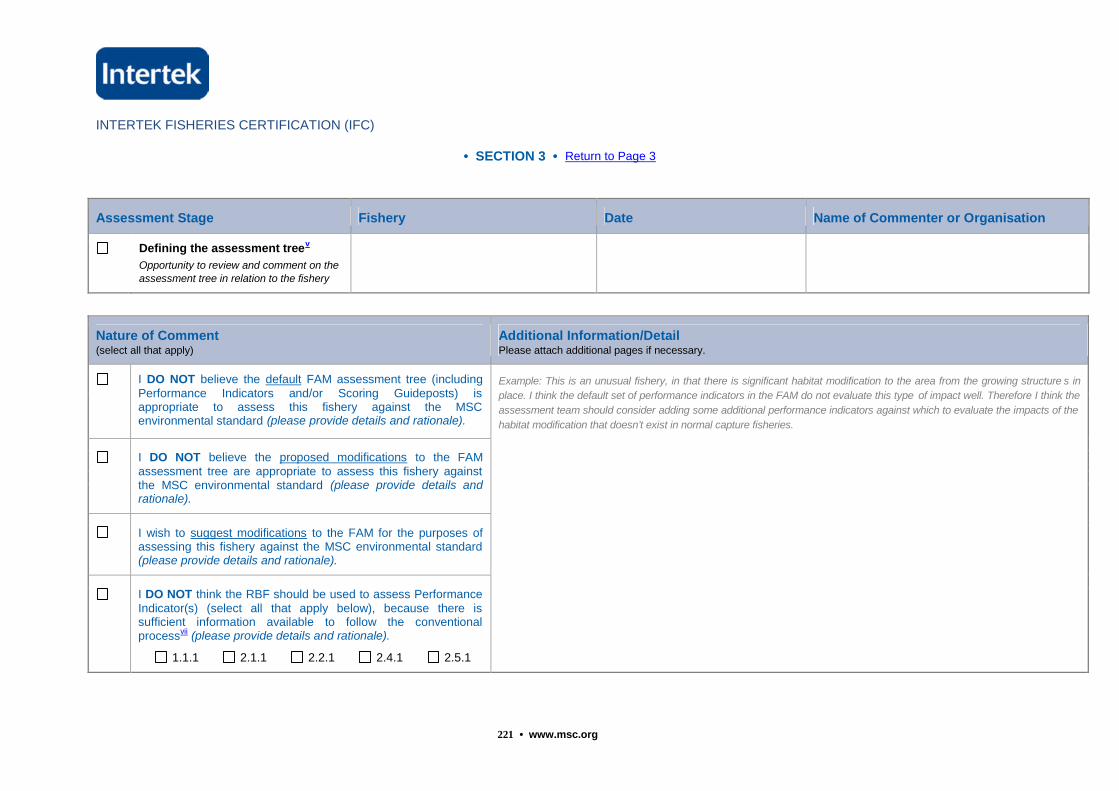
INTERTEK FISHERIES CERTIFICATION (IFC)
221 • www.msc.org
• SECTION 3 • Return to Page 3
Assessment Stage Fishery Date Name of Commenter or Organisation
Defining the assessment treev
Opportunity to review and comment on theassessment tree in relation to the fishery
Nature of Comment(select all that apply)
Additional Information/DetailPlease attach additional pages if necessary.
I DO NOT believe the default FAM assessment tree (includingPerformance Indicators and/or Scoring Guideposts) isappropriate to assess this fishery against the MSCenvironmental standard (please provide details and rationale).
Example: This is an unusual fishery, in that there is significant habitat modification to the area from the growing structure s in
place. I think the default set of performance indicators in the FAM do not evaluate this type of impact well. Therefore I think the
assessment team should consider adding some additional performance indicators against which to evaluate the impacts of the
habitat modification that doesn’t exist in normal capture fisheries.
I DO NOT believe the proposed modifications to the FAMassessment tree are appropriate to assess this fishery againstthe MSC environmental standard (please provide details andrationale).
I wish to suggest modifications to the FAM for the purposes ofassessing this fishery against the MSC environmental standard(please provide details and rationale).
I DO NOT think the RBF should be used to assess PerformanceIndicator(s) (select all that apply below), because there issufficient information available to follow the conventionalprocessvii (please provide details and rationale).
1.1.1 2.1.1 2.2.1 2.4.1 2.5.1
INTERTEK FISHERIES CERTIFICATION (IFC)
222 • www.msc.org
I DO think the RBF should be used to assess PerformanceIndicator(s) (select all that apply below) because there is NOTsufficient information available to follow the conventionalprocessvii (please provide details and rationale).
1.1.1 2.1.1 2.2.1 2.4.1 2.5.1
Other (please specify)
INTERTEK FISHERIES CERTIFICATION (IFC)
223 • www.msc.org
• SECTION 4 • Return to Page 3
Assessment Stage Fishery Date Name of Commenter or Organisation
Information gathering and stakeholdermeetingsviii
Opportunity to engage with and provideinformation to the certifier
Nature of Comment(select all that apply)
Additional Information/DetailPlease attach additional pages if necessary.
I wish to request an in-personmeeting with the assessment teamduring their assessment visit(meetings without the fishery clientpresent may be requested at thisphase of the process if needed)
Example: I am unable to attend the scheduled on-site meetings with the assessment team about this fishery, but would like to ensure the following documents
are considered when the team reviews the available information:
1. Doc A; 2. Doc B; 3. Doc C.
All of these are available for download at the following web address…
I wish to submit written informationabout the fishery and itsperformance against the FAMand/or RBF to the assessment team(please provide documents orreferences).
Other (please specify)
INTERTEK FISHERIES CERTIFICATION (IFC)
224 • www.msc.org
• SECTION 5 • Return to Page 3
Assessment Stage Fishery Date Name of Commenter or Organisation
Public review of the draft assessmentreportix
Opportunity to review and comment on thedraft report, including the scoring of the fishery
New Zealand hake 27 June 2014 David Wiedenfeld, American Bird Conservancy
I wish to comment on the evaluation of the fishery against specific Performance Indicators.
A table with these indicators and the scores and rationales provided by certifiers can be found as an appendix to the report.
Nature of comment (Please code below)
1. I do not believe all the relevant informationx
available has been used to score this performance indicator (please provide details and rationale)
2. I do not think the information and/or rationale used to score this performance indicator is adequate to support the given scorexi
(please provide details
and rationale)
3. I do not believe the condition(s) set for this performance indicator are adequate to improve the fishery’s performance to the SG80 levelxii
(please provide
details and rationale)
4. Other (please specify)
Performance Indicator Nature of CommentIndicate relevant code(s)
from list above.
JustificationPlease support your comment by referring to specific scoring issues and any relevant documentation where
possible. Please attach additional pages if necessary.
Example: 1.1.2 2 The certifier gave a score of 80 for this PI. The 80 scoring guidepost asks for a target reference point that is consistent
with maintaining the stock at Bmsy or above, however the target reference point given for this fishery is Bpa, with no
indication of how this is consistent with a Bmsy level.
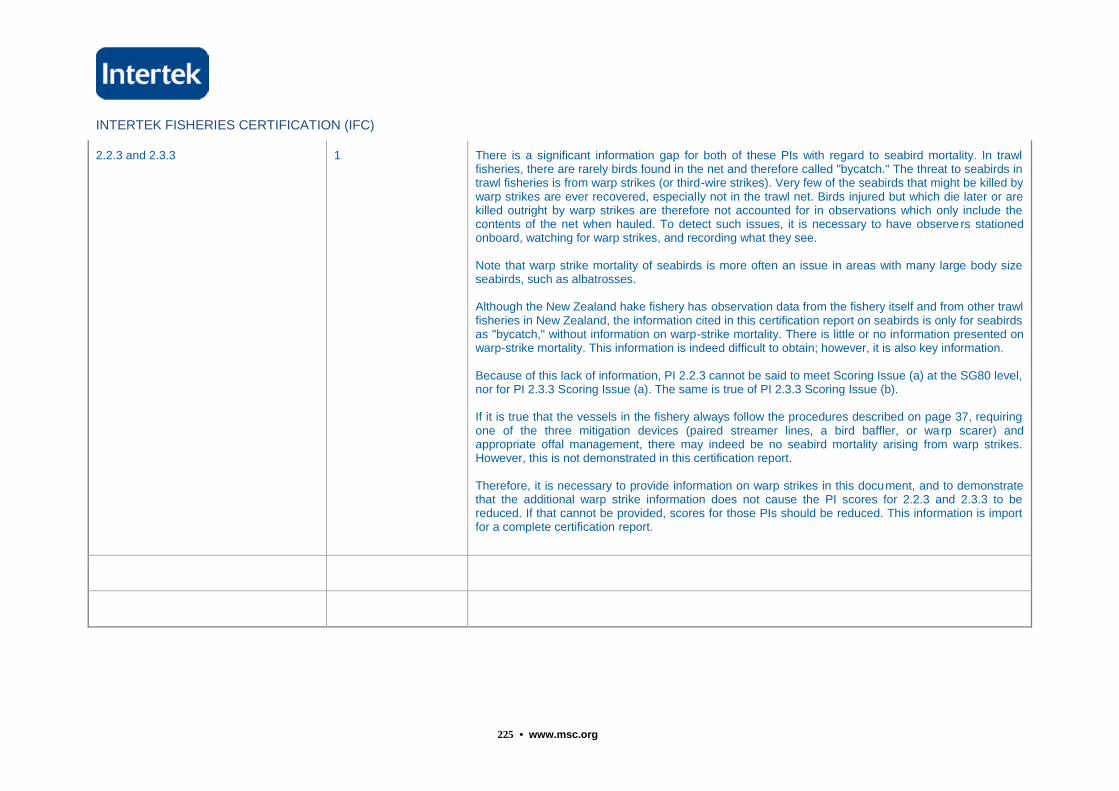
INTERTEK FISHERIES CERTIFICATION (IFC)
225 • www.msc.org
2.2.3 and 2.3.3 1 There is a significant information gap for both of these PIs with regard to seabird mortality. In trawlfisheries, there are rarely birds found in the net and therefore called "bycatch." The threat to seabirds intrawl fisheries is from warp strikes (or third-wire strikes). Very few of the seabirds that might be killed bywarp strikes are ever recovered, especially not in the trawl net. Birds injured but which die later or arekilled outright by warp strikes are therefore not accounted for in observations which only include thecontents of the net when hauled. To detect such issues, it is necessary to have observers stationedonboard, watching for warp strikes, and recording what they see.
Note that warp strike mortality of seabirds is more often an issue in areas with many large body sizeseabirds, such as albatrosses.
Although the New Zealand hake fishery has observation data from the fishery itself and from other trawlfisheries in New Zealand, the information cited in this certification report on seabirds is only for seabirdsas "bycatch," without information on warp-strike mortality. There is little or no information presented onwarp-strike mortality. This information is indeed difficult to obtain; however, it is also key information.
Because of this lack of information, PI 2.2.3 cannot be said to meet Scoring Issue (a) at the SG80 level,nor for PI 2.3.3 Scoring Issue (a). The same is true of PI 2.3.3 Scoring Issue (b).
If it is true that the vessels in the fishery always follow the procedures described on page 37, requiringone of the three mitigation devices (paired streamer lines, a bird baffler, or warp scarer) andappropriate offal management, there may indeed be no seabird mortality arising from warp strikes.However, this is not demonstrated in this certification report.
Therefore, it is necessary to provide information on warp strikes in this document, and to demonstratethat the additional warp strike information does not cause the PI scores for 2.2.3 and 2.3.3 to bereduced. If that cannot be provided, scores for those PIs should be reduced. This information is importfor a complete certification report.
INTERTEK FISHERIES CERTIFICATION (IFC)
226 • www.msc.org
Comment Nature of Comment Justification Please attach additional pages if necessary.
I wish to comment on the adequacyof the consultation process used togather information about this fishery(for example, related to the RBFprocess, selection of stakeholdersconsulted, etc.)
Comment Nature of Comment Justification Please attach additional pages if necessary.
I wish to comment on other portionsof the report (e.g. backgroundinformation, species biology, peerreview reports and CB responses,list of consultees, etc.)
Comment Nature of Comment Justification Please attach additional pages if necessary.
I wish to provide general commentsabout the assessment of this fisheryagainst the MSC Principles andCriteria for Sustainable Fishing
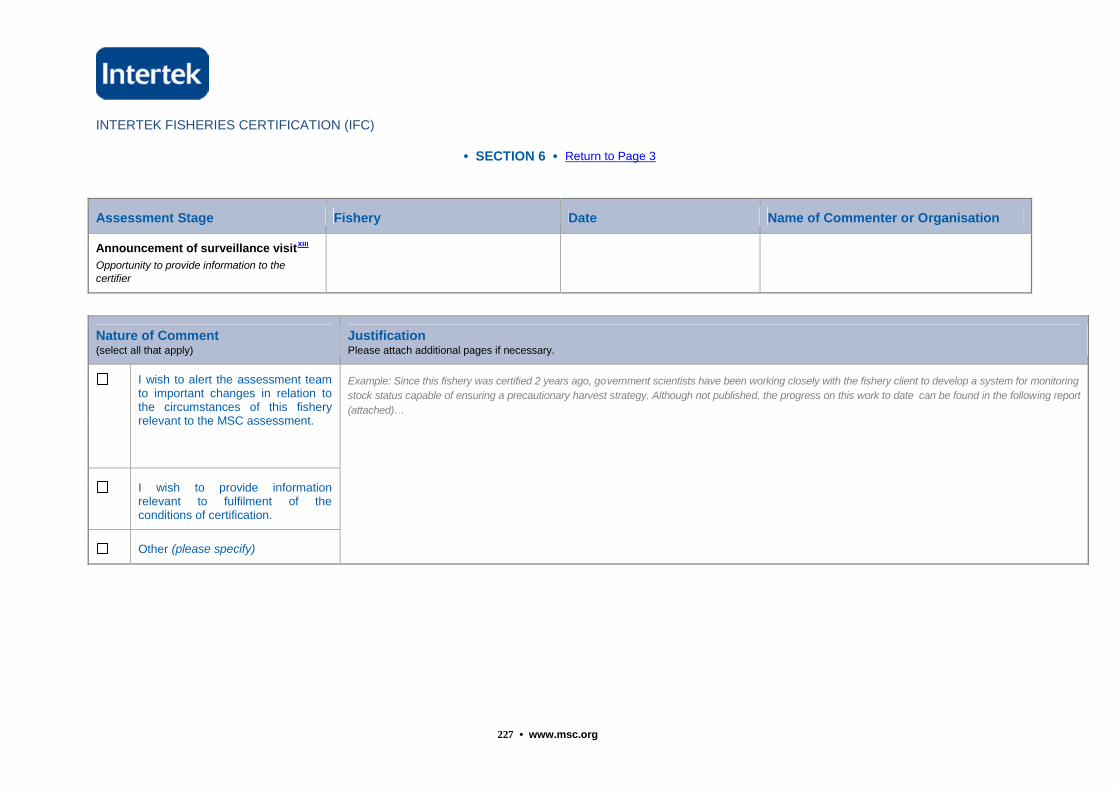
INTERTEK FISHERIES CERTIFICATION (IFC)
227 • www.msc.org
• SECTION 6 • Return to Page 3
Assessment Stage Fishery Date Name of Commenter or Organisation
Announcement of surveillance visitxiii
Opportunity to provide information to thecertifier
Nature of Comment(select all that apply)
JustificationPlease attach additional pages if necessary.
I wish to alert the assessment teamto important changes in relation tothe circumstances of this fisheryrelevant to the MSC assessment.
Example: Since this fishery was certified 2 years ago, government scientists have been working closely with the fishery client to develop a system for monitoring
stock status capable of ensuring a precautionary harvest strategy. Although not published, the progress on this work to date can be found in the following report
(attached)…
I wish to provide informationrelevant to fulfilment of theconditions of certification.
Other (please specify)
INTERTEK FISHERIES CERTIFICATION (IFC)
228 • www.msc.org
Intertek Fisheies Certification comment
Comment on PIs 2.2.3 and 2.3.3 on "a significant information gap for both of these PIs with regard to seabirdmortality."
The report has been clarified: within Section 3.7.2.3 of the main text to highlight the fact that current estimates of mortality
developed by Dragonfly (e.g. Abraham and Thompson, 2011) include recorded captures in the net, onthe warps, or tangled in line, and hence include observed warp strikes. Captures are also estimated byfishing method, being categorised by whether they were warp captures, net captures, or reported caughtthrough some other means (see https://data.dragonfly.co.nz/psc/v20121101/birds/hake-trawl/all-vessels/eez/all/ for a breakdown by year and interaction type for the hake trawl fishery). They excludeanimals that landed on the deck or collided with the vessel’s superstructure (Abraham and Thompson,2011).
Within PI 2.2.1 to clarify that interactions with birds and marine mammals are considered under 2.3.
Within PI 2.3.1 and 2.3.3 to clarify that warp strike mortalities are included within seabird mortalityestimates, and that warp-strike mitigation methods have been found successful for key seabirds (forexample, monitoring of warp strikes has indicated reductions in Salvin's albatross and white-cappedalbatross within fisheries following the introduction of mandatory warp mitigation in January 2006).
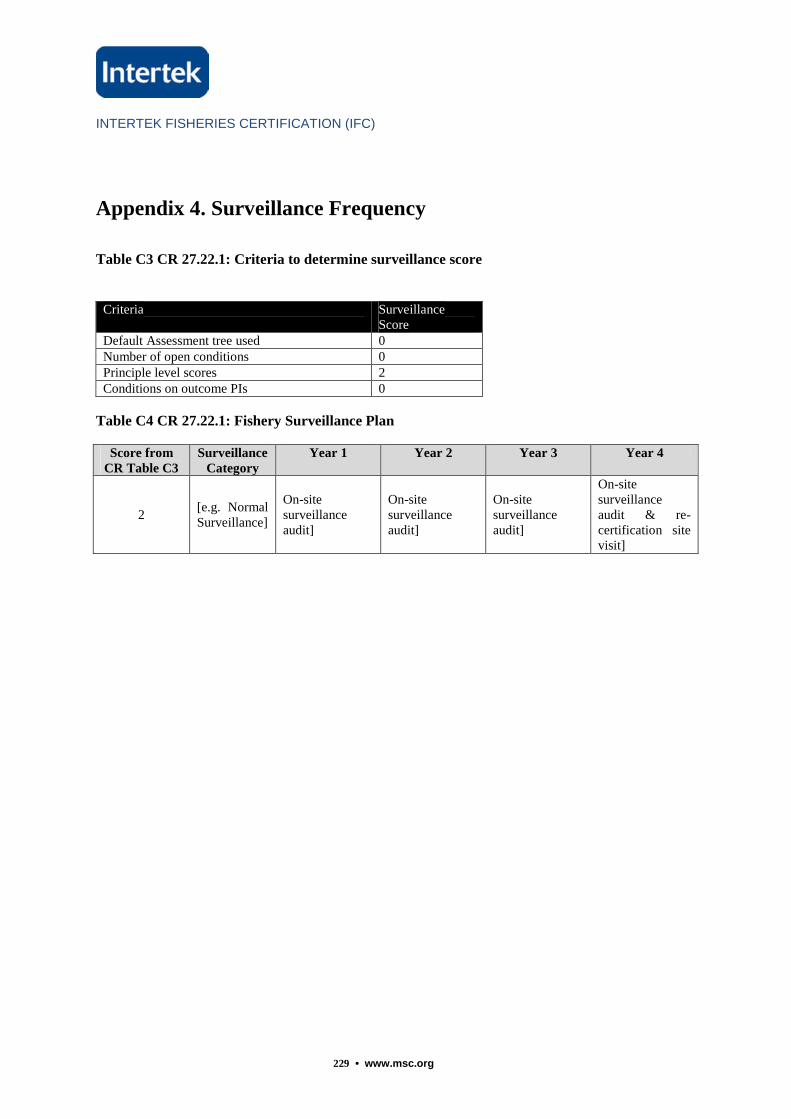
INTERTEK FISHERIES CERTIFICATION (IFC)
229 • www.msc.org
Appendix 4. Surveillance Frequency
Table C3 CR 27.22.1: Criteria to determine surveillance score
Criteria SurveillanceScore
Default Assessment tree used 0Number of open conditions 0Principle level scores 2Conditions on outcome PIs 0
Table C4 CR 27.22.1: Fishery Surveillance Plan
Score fromCR Table C3
SurveillanceCategory
Year 1 Year 2 Year 3 Year 4
2[e.g. NormalSurveillance]
On-sitesurveillanceaudit]
On-sitesurveillanceaudit]
On-sitesurveillanceaudit]
On-sitesurveillanceaudit & re-certification sitevisit]
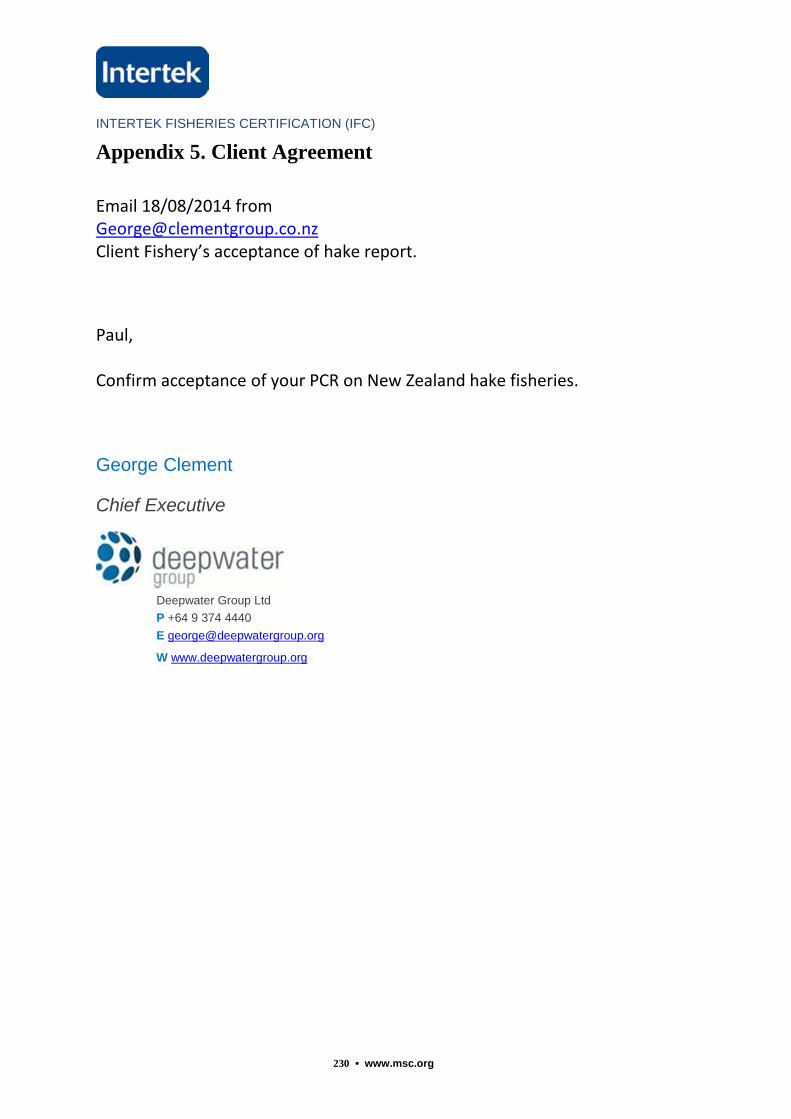
INTERTEK FISHERIES CERTIFICATION (IFC)
230 • www.msc.org
Appendix 5. Client Agreement
Email 18/08/2014 [email protected] Fishery’s acceptance of hake report.
Paul,
Confirm acceptance of your PCR on New Zealand hake fisheries.
George Clement
Chief Executive
Deepwater Group Ltd
P +64 9 374 4440
W www.deepwatergroup.org

INTERTEK FISHERIES CERTIFICATION (IFC)
231 • www.msc.org
Appendix 5.1 Objections Process
No Objections were received