
New Zealand firms - Productivity Commission€¦ · and accessible advice that leads to the best...
71
New Zealand firms: reaching for the frontier Issues paper April 2020
Transcript of New Zealand firms - Productivity Commission€¦ · and accessible advice that leads to the best...

New Zealand firms: reaching for the frontier
Issu
es p
aper
A
pril
2020

The Productivity Commission aims
to provide insightful, well-informed
and accessible advice that leads to
the best possible improvement in
the wellbeing of New Zealanders.
We want to gather ideas, opinions,
evidence and information to ensure
that this inquiry is well-informed and
relevant. The Commission is seeking
submissions on the questions
contained in this paper by
1 September 2020.

New Zealand firms: reaching for the frontier Issues paper – April 2020
The New Zealand Productivity Commission
Te Kōmihana Whai Hua o Aotearoa1
The Commission – an independent Crown Entity – completes in-depth inquiry reports on topics
selected by the Government, carries out productivity-related research, and promotes
understanding of productivity issues. The Commission aims to provide insightful, well-informed
and accessible advice that leads to the best possible improvement in the wellbeing of New
Zealanders. The New Zealand Productivity Commission Act 2010 guides and binds the
Commission.
You can find information on the Commission at www.productivity.govt.nz or by calling
+64 4 903 5150.
How to cite this document: New Zealand Productivity Commission (2020). New Zealand firms:
reaching for the frontier. Available from www.productivity.govt.nz
Date: April 2020
ISBN: 978-1-98-851949-4 (online)
Copyright: This copyright work is licensed under the Creative Commons Attribution 4.0
International License. In essence you are free to copy, distribute and adapt the work, as long as
you attribute the source of the work to the New Zealand Productivity Commission (the
Commission) and abide by the other license terms. To view a copy of this license, visit
www.creativecommons.org/licenses/by/4.0/. Please note that this license does not apply to any
logos, emblems, and/or trademarks that may be placed on the Commission’s website or
publications. Those specific items may not be reused without express permission.
1 The Commission that pursues abundance for New Zealand
Disclaimer
The contents of this report must not be construed as legal advice. The Commission does not accept any responsibility or liability for an action taken as a result of reading, or reliance placed because of having read any part, or all, of the information in this report. The Commission does not accept any responsibility or liability for any error, inadequacy, deficiency, flaw in or omission from this report.
The results in this report are not official statistics. Some have been created for research purposes from the Integrated Data Infrastructure (IDI), managed by Stats NZ.
The opinions, findings, recommendations, and conclusions expressed in this report are those of the author(s), not Stats NZ. Access to the anonymised data used in this study was provided by Stats NZ under the security and confidentiality provisions of the Statistics Act 1975. Only people authorised by the Statistics Act 1975 can see data about a particular person, household, business, or organisation, and the results in this report have been confidentialised to protect these groups from identification and to keep their data safe.
Careful consideration has been given to the privacy, security, and confidentiality issues associated with using administrative and survey data in the IDI. Further detail can be found in the Privacy impact assessment for the Integrated Data Infrastructure at www.stats.govt.nz.
Contents
The issues paper i
Key inquiry dates ................................................................................................................... i
Making a submission ............................................................................................................ i
What the Commission will do with submissions ................................................................ ii
Other ways to participate .................................................................................................... ii
Inquiry contacts .................................................................................................................... ii
1 About this inquiry 1
What the Commission has been asked to do .................................................................... 1
What is at stake? .................................................................................................................. 1
Building on earlier work ....................................................................................................... 2
What is meant by firm performance? ................................................................................. 4
What is a frontier firm? ........................................................................................................ 6
The backdrop to the inquiry ................................................................................................ 8
2 Frontier firms and economic success 10
The characteristics of a successful New Zealand economy ............................................ 10
Not just looking at the “average firm” ............................................................................. 11
The drivers of productivity growth.................................................................................... 11
Potential drivers of success ............................................................................................... 13
3 The picture in New Zealand: frontier firms 16
The global context ............................................................................................................. 16
Productivity growth in New Zealand’s firms ..................................................................... 18
Firms at the New Zealand productivity frontier ............................................................... 21
Other high-performing Kiwi firms ..................................................................................... 23
4 The picture in New Zealand: innovation, diffusion and reallocation 26
Innovation ........................................................................................................................... 26
Diffusion .............................................................................................................................. 28
Reallocation ........................................................................................................................ 30
Drivers of weak innovation, diffusion and reallocation in New Zealand ........................ 31
The picture in New Zealand – a summary ........................................................................ 32
5 Māori frontier firms 35
History and context ............................................................................................................ 35
Characteristics of Māori enterprises ................................................................................. 37
6 The policy agenda 43
Diagnosing the problem ................................................................................................... 43
Identifying policy levers ..................................................................................................... 43
Developing tailored solutions for New Zealand .............................................................. 45
7 The Commission’s approach 47
A three-step approach ...................................................................................................... 47
Methods of inquiry ............................................................................................................. 48
Summary of questions 50
References 54
Terms of reference 59
The issues paper i
The issues paper
This issues paper aims to assist individuals and organisations to participate in the inquiry. It
outlines the background to the inquiry, the Commission’s intended approach, and the matters
about which the Commission is seeking comment and information.
This paper contains specific questions to which responses are invited. Participants should choose
which questions are relevant to them. The questions are not intended to limit comment. The
Commission welcomes information and comment on all issues that participants consider relevant
to the inquiry’s terms of reference.
Submissions should be provided by 1 September, although earlier would be preferred to give
the Commission more time to consider the ideas and information it receives and incorporate
them in its analysis.
Key inquiry dates
Due date for submissions on issues paper: 1 September 2020
Release of draft report: November 2020
Final report to Government: 31 March 2021
Making a submission
The Commission aims to provide insightful, well-informed and accessible advice that leads to the
best possible improvement in the wellbeing of New Zealanders. Submissions help the
Commission to gather ideas, opinions and information to ensure that inquiries are well-informed
and that its advice is relevant, credible and workable.
The inquiry team will consider submissions as part of the evidence base for this inquiry. The
team’s work relies on its research and analytical skills, and its ability to undertake high-quality
analysis and shape that into influential policy advice. The Commission currently employs about
20 people, with about six people on the team for this inquiry.
Submissions will help shape the nature and focus of this inquiry. The Commission’s inquiry
reports may cite or directly incorporate relevant information from submissions. There will be an
opportunity to make further submissions in response to subsequent reports published
throughout the duration of this inquiry.
Anyone can make a submission. It may be in written, electronic or audio format. A submission
can range from a short note on a single issue to a more substantial document covering many
issues. The Commission is also happy to receive relatively informal submissions, such as a short
email.
Please provide supporting facts, figures, data, examples and documentation where possible.
Every submission is welcome; however, identical submissions will not carry any more weight than

ii Issues paper | New Zealand firms: reaching for the frontier
the merits of the arguments presented. Submissions may incorporate relevant material provided
to other reviews or inquiries.
Submissions may be lodged at www.productivity.govt.nz/have-your-say/make-a-submission.
Submissions should include the submitter’s name and contact details, and the details of any
organisation represented. The Commission will not accept submissions that, in its opinion,
contain inappropriate or defamatory content.
What the Commission will do with submissions
The Commission seeks to have as much information as possible on the public record.
Submissions typically become publicly available documents on the Commission’s website shortly
after receipt unless accompanied by a request to delay release for a short period.
The Commission is subject to the Official Information Act 1982 (OIA) and can accept material in
confidence only under special circumstances. Please contact the Commission before submitting
such material.
Other ways to participate
The Commission welcomes engagement on its inquiries. Please telephone or send an email to
discuss how you can participate in this inquiry. This could be in person or via telephone or video
conference.
Inquiry contacts
Administration Robyn Sadlier
Other matters Patrick Nolan
Inquiry Director [email protected]
Website www.productivity.govt.nz
Twitter @nzprocom
Linkedin NZ Productivity Commission
About this inquiry 1
1 About this inquiry
New Zealand is facing the prospect of a significant economic shock from the spread of
COVID-19. Helping more Kiwi firms reach the productivity frontier would be a valuable step
towards the economy reaching its full potential once the immediate effects of COVID-19 have
passed.
What the Commission has been asked to do
This inquiry focuses on a central aspect of New Zealand’s productivity performance – the
economic contribution of its most productive firms. The Terms of Reference (ToR) for this inquiry
are included as an appendix to this paper. The Government has asked the Commission to
investigate how the economic contribution of frontier firms can be maximised through policies
and interventions aimed at:
improving the performance of frontier firms themselves; and
helping new technologies, efficient business practices and other productivity-enhancing
innovations diffuse more effectively to other New Zealand firms.
Through these two channels, the productivity performance of frontier firms can lift the
productivity of the whole economy.
What is at stake?
Productivity refers to how well people or organisations convert inputs – resources such as labour
and capital – into outputs of goods and services. Improvements in productivity allow a given
quantity of output to be produced using fewer resources, or more and better outputs to be
produced from the same resource base. This is often done using new technologies or innovative
practices. Changing how a firm is organised, governed and managed can also improve its
productivity.
Lifting productivity would help solve many of New Zealand’s hardest problems. It can help the
country earn a living from the rest of the world while protecting our natural environment. It can
lead to faster growth in real wages, meaning families have decent incomes without having to
work long hours. It underpins the provision of state services to an ageing population in a tighter
fiscal environment.
Improved productivity can also support social and cultural wellbeing. For example, improving the
productivity of Māori firms can provide benefits to both Māori and the wider New Zealand
economy, across multiple dimensions.
Growing a more productive, innovative and internationally connected Māori economic
sector will deliver prosperity to Māori, and resilience and growth to the national economy.
This will be achieved by lifting per capita income and improving export performance, which
will lift the Māori contribution to the New Zealand economy and improve quality of life for
Māori and all New Zealanders. (Māori Economic Development Panel, 2012b, p. 6)
2 Issues paper | New Zealand firms: reaching for the frontier
Even a small improvement in productivity growth can have large cumulative effects in the form of
improved jobs and earnings, more housing, better care of the environment and provision of
social services. Lifting productivity is critical if New Zealand is to achieve higher incomes and
living standards.
Building on earlier work
The importance of productivity has been understood for many years. Indeed, over the last four
decades governments have attempted to shift New Zealand’s productivity into a higher gear:
The substantial reforms of the late 1980s and early 1990s sharpened incentives for greater
efficiency in business and established a more stable and predictable macroeconomic
framework.
The early 2000s saw the knowledge wave, the language of “economic transformation” to a
knowledge-based, high-skill economy and significant reforms to savings and capital markets
in the form of KiwiSaver and the New Zealand Superfund.
The years 2009–15 following GFC were dominated by recovery - maintaining and expanding
employment and getting the government budget back into surplus. The Government
expressed its economic growth strategy in a “Business Growth Agenda” which emphasised
investment in infrastructure, innovation (Callaghan Innovation and the Primary Growth
Partnership) and increasing exports through trade agreements.
Key government initiatives aimed at lifting economic growth and productivity over the last 20
years are summarised in Box 1.
Box 1 Government strategies for lifting economic growth and productivity
Since the late 1990s, successive governments have pursued economic strategies aimed at
lifting economic prosperity through boosting innovation, diversifying the economy and
shifting economic activity up the value chain. Common threads have included building a
skilled workforce, increasing international connections, supporting research and science,
deepening capital markets, and investing in infrastructure. This has resulted in on-going
initiatives to foster and underpin innovation:
The New Zealand Venture Investment Fund was established in 2002 to deepen the
early-stage capital market. Now called New Zealand Capital Growth Partners, it received
a $300 million boost in Budget 2019.
The telecommunications sector has been restructured and reformed, and its
infrastructure upgraded through the rollout of ultra-fast broadband.
Callaghan Innovation was established in 2013, to partner with businesses by providing a
range of research and development (R&D) services, and to improve the operation of the
innovation ecosystem. In 2019 an R&D tax incentive was introduced.
Further, the approach to supporting economic development has evolved over time and
across governments.
About this inquiry 3
The fact that New Zealand’s productivity has continued to lag in the face of these efforts has
been described as a paradox. This is because it occurred despite policy settings in many
important areas appearing at or close to best practice; at least when “viewed through the long-
range telescopes of the OECD and World Bank” (Conway, 2018, p. 52).
In 1999, the new Labour-led government established the Economic Development
portfolio and created Industry New Zealand to support regional and sectorial economic
growth. In 2003, the domestically-focused Industry New Zealand was merged with Trade
NZ, to form New Zealand Trade and Enterprise (NZTE), which assists New Zealand firms
to grow internationally.
The 2001 Knowledge Wave conference looked at ways to generate high-value
industries, and the subsequent Growth and Innovation Framework (GIF) focused on
supporting the ICT, biotech, screen production and design sectors.
In 2005, the former Ministry of Science, Research and Technology released Vision
Mātauranga – a policy framework for guiding research investments. It aimed to unlock
the innovation potential of Māori knowledge, resources and people. It has since been
adopted by the Ministry for Business, Innovation and Employment (MBIE).
In 2006, the GIF was replaced with the Economic Transformation Agenda (ET). ET
retained the emphasis on innovation, but its five themes included a focus on
environmental sustainability, as well as building Auckland as an internationally
competitive city.
In 2012, the fifth National-led government launched its Business Growth Agenda (BGA).
Faced with a post-GFC environment, the BGA included microeconomic reforms to
support business recovery. “Result 9” focused on reducing the cost to business of
interacting with government.
In 2013, He kai kei aku ringa, the Crown-Māori Economic Development Strategy was
launched, providing a vision and accompanying action plan for a more productive,
innovative, internationally connected and export-oriented Māori economy. Focus areas
include lifting educational achievement, supporting more productive use of natural
resources, and developing new commercial opportunities and export markets by
building on Māori points of difference (“Māori Inc.”).
In 2018, the Ministry for Pacific Peoples published Pacific Aotearoa Lalanga Fou, which
emphasised a need to develop more successful and sustainable Pacific entrepreneurs
and Pacific-owned businesses.
In 2019, the Labour-led government issued its Economic Plan for a productive,
sustainable and inclusive economy. Priorities include sharing the benefits of growth
more widely (reducing inequalities) and transitioning to a low-emissions economy. A
number of strategies and initiatives sit within this economic plan, including an industry
transformation strategy and a (draft) research, science and innovation strategy.
Source: Vitalis (2008); Māori Economic Development Panel (2012b); New Zealand Government (2017); New Zealand Government (2019a); New Zealand Government (2019b).
4 Issues paper | New Zealand firms: reaching for the frontier
Yet, rather than being a paradox this highlights how hard the challenge of lifting productivity in
New Zealand is. New Zealand is not a “standard OECD country” and faces an unusual set of
challenges and opportunities (Conway, 2018). New Zealand is unusual in the combination of its
distance from international partners, small domestic markets, and industry structure.
There is no reason to think that economies like New Zealand cannot successfully lift their
productivity performance, it is just that the path to success may be different to that of larger or
more central economies. Studying other small advanced economies in a structured way may
provide some key lessons, although even among this group the combination of challenges New
Zealand faces are unique.
Turning around New Zealand’s productivity performance will require consistent and focussed
effort over many fronts and for many years. There is no simple quick fix. In this inquiry the
Commission will examine factors contributing to New Zealand’s productivity gap and will
develop policy recommendations for improved outcomes.
What is meant by firm performance?
There are several potential measures of firm performance. Firms often measure their own
performance based on revenue, profits, market share or return on assets.2 Yet, productivity
remains an important measure of economic performance. Box 2 explains why both productivity
and profitability are important measures of success.
2 Firms may also monitor ‘softer’ measures of performance, like customer satisfaction or staff retention.
Box 2 Productivity and profitability: how they differ and why they are important
Productivity is about how much “real” output is produced per unit of input. It is a measure
of economic efficiency. Output is real in the sense of actual goods and services that firms
produce such as milk powder, houses or haircuts. The type and quality of each output
needs to be specified. Inputs are “real” too – such as an hour of labour or an hour’s use of
a combine harvester. When a business produces more than one output it is necessary to
derive a composite output measure by combining the outputs into a single “output
bundle”. Businesses use at least two inputs – labour and capital services – and many use
more than two. Productivity is defined relative to either a single input (eg, labour
productivity) or a group of inputs treated as a bundle (this is called multi-factor
productivity).
A firm’s profit is the revenue it earns from selling its outputs less the cost of its inputs. This
is not the same as its productivity – if the price of its output goes up but nothing else
changes then its profits will increase but its productivity will not change. Owners of firms
care about profit because it is the income they earn from their investment in owning the
firm.
If a business becomes more productive several effects can follow:
About this inquiry 5
In the Commission’s view, productivity – the ratio of outputs to inputs – is the most meaningful
measure of firm performance for this inquiry. Two performance measures based on productivity
are common:
A firm’s productivity growth. This measure looks at how productivity changes over time.
Productivity growth rates are normally calculated by comparing the growth of a firm’s outputs
with the growth of its inputs. For example, if outputs grow by 5% in a year and inputs by only
3% then the firm’s productivity has grown by the difference of 2%.
A firm’s productivity level. This measure looks at the firm’s level of productivity in a particular
year. It is more difficult to measure productivity levels than growth rates because it is often
easier to measure changes in economic quantities and values than their absolute levels. But
measures of levels enable comparisons across firms thus highlighting differences in
productivity between firms in the same industry either within New Zealand or compared with
firms in other countries.
As noted in Box 2, when comparing a firm’s outputs with its inputs, the two most common
methods are labour productivity and multifactor productivity (MFP):
Labour productivity is the output of a firm divided by the number of hours of work that are
needed to produce the output. Labour productivity can vary across time and across
countries, depending on how labour is combined with other inputs (such as capital) to
produce output. For example, the addition of a wheelbarrow to a person with a shovel – a
The business may be able to achieve higher profits because it can produce more
outputs with the same inputs, such as hours of work. This higher profitability may then
prompt owners and managers to expand output.
If other similar businesses also become more productive and profitable and they all
expand their outputs, then prices are likely to fall benefiting consumers (but not
necessarily firms since with falling prices their profitability may return to “normal”).
If higher productivity is achieved by means of a scarce skill or piece of knowledge that
businesses must buy, then their increased demand will drive up the price of the skill or
knowledge and the gains will go to those who own these scarce resources.
The last two cases show that higher productivity doesn’t necessarily mean higher
profitability. But higher productivity always benefits some group in the economy and
enables higher living standards. Indeed, higher productivity is a necessary condition for
lifting living standards and that is why it is such an important measure.
Nor do higher profits necessarily mean higher productivity. This is because a business with
some monopoly power can simply put up its prices and earn higher revenue without
improving its efficiency (ie, productivity). On the other hand, in a competitive economy, the
pursuit of profit by firms motivates them to innovate and be efficient (ie, be more
productive). These behaviours are needed for higher living standards. They may yield
higher profits to firms in the short term even if, over a longer time period, competition
pares back profits to normal. Yet, through the competitive process, consumers are better
off.
6 Issues paper | New Zealand firms: reaching for the frontier
process referred to as capital intensity or capital deepening – results in the person being able
to shift more dirt from point A to point B for a given input of labour hours.
MFP is a measure that compares the output produced with a “unit bundle” of the inputs that
the firm uses to produce the output. The two most common inputs are labour and capital,
but firms also use other inputs such as land and “intermediate” goods and services that they
buy from other firms (eg, raw materials and engineering services). MFP reflects how efficiently
a combination of productive inputs is used to produce output. It is often thought of as a
proxy for broad technological advances that increase the output from a bundle of inputs.
These advances can include new technology associated with new types of equipment,
improvements in management and production processes, increased scale and improved
worker skills. Often these improvements come together. For example, a new IT system not
only provides workers with increased capital but also more advanced technology enabling
improved work processes (Conway, 2016).
Researchers have examined the distribution of labour productivity and MFP across firms, and
generally look at firms in the same industry. In the New Zealand Standard Industrial Output
Classification (NZSIOC), industries are classified at various levels of detail, ranging from level 1
(which breaks the economy down into 16 industries) to level 4 (more than 100 industries).
Industries at the second level are commonly studied, and some studies look more finely at the
third and fourth levels.3
Comparing firms’ productivity within the same industry provides several benefits. Firms in
different industries can have different levels and growth rates of productivity for reasons
unrelated to firm performance. For example, the labour productivity of workers in electricity
generation is many times higher than workers in hairdressing because electricity generation is
very capital intensive, while hairdressing is labour intensive. The pace of technological change is
another influence. For instance, rapid technological change in mobile telephony has supported
fast productivity growth in that industry, while the technologies supporting restaurant services
have stayed relatively constant.
What is a frontier firm?
The ToR for this inquiry asks the Commission to “establish a coherent and measurable
classification of what constitutes a frontier firm, and what the distribution of New Zealand firms
looks like behind the productivity frontier”.
The ToR’s mention of individual firms, a productivity frontier and firms “behind” the frontier
points to a definition of a frontier firm as one that scores at the highest level on a measure of
productivity. This measure is most naturally a measure of the level of productivity, but it could
also be taken to be a measure of the growth rate of productivity.
The OECD’s work, based on data on firm-level productivity, defines frontier firms as those in the
top 10% of the productivity distribution either among firms globally (the global productivity
frontier) or domestic firms (the domestic productivity frontier). There is nothing sacrosanct about
10%. Some studies use a 5% or top-quartile cut off to define frontier firms.
3 Typical level 2 industries in the NZSIOC are “Retail trade” and “Accommodation and food services”. At level 3, “Retail trade”
splits into “Motor vehicle and motor vehicle parts and fuel retailing”, “Supermarket, grocery story and specialised food retailing” and “Other store-based retailing and non-store retailing”. Level 4 splits the first level 3 category into “Motor vehicle and parts retailing” and “Fuel retailing”.
About this inquiry 7
Non-frontier firms are all those firms not in the frontier group. This, of course, includes a wide
range – from firms just behind the frontier to those in the left-hand tail of the distribution. The
Commission intends to use the OECD’s definitions of frontier and non-frontier firms but will also
take a broader, pragmatic approach to what constitutes a frontier firm. Some reasons for this are:
At this early stage in the inquiry the Commission is open to different ideas about what
constitutes a frontier firm.
The ToR request the Commission to investigate the economic contribution of Māori frontier
firms. Doing this may well require a different definition and different approach. Options for
defining a Māori frontier firm are explored further in Chapter 5.
Some potentially highly successful firms could be still in a development phase in which
current measures of their profitability and productivity are not high. For instance, the highly
regarded accounting software company Xero only recently achieved a positive cashflow.
Some such firms may be regarded as leading edge and successful, but simple measures of
productivity may not capture them as part of the frontier.
Firm productivity is studied using large, statistical databases of most firms in an economy. In
New Zealand, this is the Longitudinal Business Database (LBD), but individual firms are
anonymised in these databases. Yet, the Commission also wishes to study and talk to a range
of publicly identifiable firms, including ones widely regarded as leading and successful.
There are a variety of other measures (beyond productivity) that could be used to identify highly
performing New Zealand businesses. Possible criteria include export success, return on assets,
revenue growth, a preponderance of highly skilled employees, and the use or development of
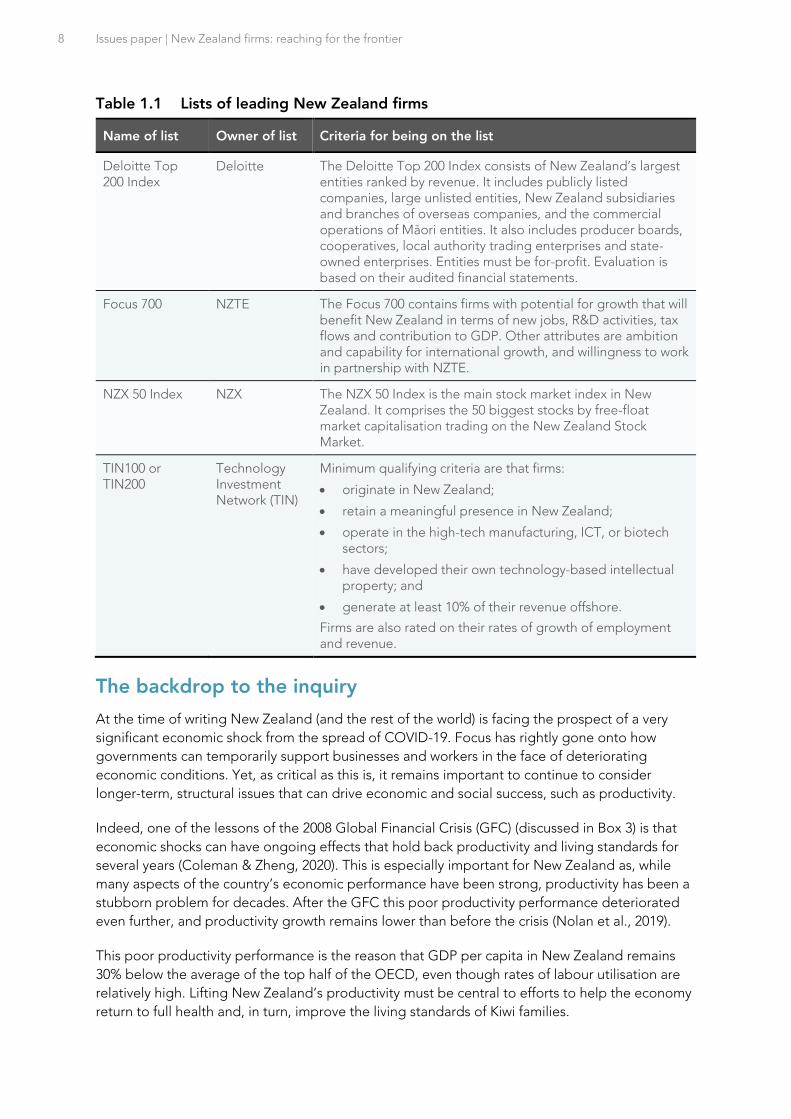
advanced technology. Table 1.1 shows how “top performing firms” in New Zealand are defined
in various ways by different organisations. In addition, a wide range of business awards (arranged
by different organisations) recognise different aspects of business performance and success.
8 Issues paper | New Zealand firms: reaching for the frontier
Table 1.1 Lists of leading New Zealand firms
Name of list Owner of list Criteria for being on the list
Deloitte Top 200 Index
Deloitte The Deloitte Top 200 Index consists of New Zealand’s largest entities ranked by revenue. It includes publicly listed companies, large unlisted entities, New Zealand subsidiaries and branches of overseas companies, and the commercial operations of Māori entities. It also includes producer boards, cooperatives, local authority trading enterprises and state-owned enterprises. Entities must be for-profit. Evaluation is based on their audited financial statements.
Focus 700 NZTE The Focus 700 contains firms with potential for growth that will benefit New Zealand in terms of new jobs, R&D activities, tax flows and contribution to GDP. Other attributes are ambition and capability for international growth, and willingness to work in partnership with NZTE.
NZX 50 Index NZX The NZX 50 Index is the main stock market index in New Zealand. It comprises the 50 biggest stocks by free-float market capitalisation trading on the New Zealand Stock Market.
TIN100 or TIN200
Technology Investment Network (TIN)
Minimum qualifying criteria are that firms:
• originate in New Zealand;
• retain a meaningful presence in New Zealand;
• operate in the high-tech manufacturing, ICT, or biotech sectors;
• have developed their own technology-based intellectual property; and
• generate at least 10% of their revenue offshore.
Firms are also rated on their rates of growth of employment and revenue.
The backdrop to the inquiry
At the time of writing New Zealand (and the rest of the world) is facing the prospect of a very
significant economic shock from the spread of COVID-19. Focus has rightly gone onto how
governments can temporarily support businesses and workers in the face of deteriorating
economic conditions. Yet, as critical as this is, it remains important to continue to consider
longer-term, structural issues that can drive economic and social success, such as productivity.
Indeed, one of the lessons of the 2008 Global Financial Crisis (GFC) (discussed in Box 3) is that
economic shocks can have ongoing effects that hold back productivity and living standards for
several years (Coleman & Zheng, 2020). This is especially important for New Zealand as, while
many aspects of the country’s economic performance have been strong, productivity has been a
stubborn problem for decades. After the GFC this poor productivity performance deteriorated
even further, and productivity growth remains lower than before the crisis (Nolan et al., 2019).
This poor productivity performance is the reason that GDP per capita in New Zealand remains
30% below the average of the top half of the OECD, even though rates of labour utilisation are
relatively high. Lifting New Zealand’s productivity must be central to efforts to help the economy
return to full health and, in turn, improve the living standards of Kiwi families.
About this inquiry 9
Q1 How should the inquiry define frontier firms? What data are available to
enable the study of frontier firms under your suggested definition?
Box 3 Reflecting on New Zealand’s experience of the Global Financial Crisis
Compared to many of the world’s large advanced economies, New Zealand weathered the
GFC relatively well. The fall in GDP was not as severe, and the recovery quicker, than in
many other countries. Insulating factors included higher nominal interest rates and lower
public debt (which allowed room for manoeuvre in monetary and fiscal policy); a floating
exchange rate; a limited fall in household wealth due to buoyant house prices; the strength
of demand in China and other Asian countries; and relatively good policy settings, such as
flexible labour and product markets (Makhlouf, 2013). In addition, the New Zealand
banking sector had little exposure to the complexity or weakness of financial systems in
other markets (Bollard & Ng, 2012).
However, New Zealand certainly did not escape unscathed, and the economic impacts
were not evenly distributed. Also, significant and rapid policy actions were required to
mitigate the impacts (Bollard & Ng, 2012). Real GDP fell 2.7% between December 2007 and
March 2009. Alongside the fall in output, the unemployment rate rose by three percentage
points between December 2007 and December 2009. Job losses were greater for lower
skilled workers (D. C. Maré et al., 2015), low wage and young workers, and workers with
short job tenure (Fabling & Maré, 2012).
The GFC also triggered a sharp rise in business insolvencies (as measured by corporate and
total personal insolvencies), which took around five years to return to their usual rate.
Corporate insolvencies were driven by the rise in costs, and personal insolvencies by the
drop in employment growth (Hall & McDermott, 2019).
The world is now facing the very real prospect of entering a further recession due to the
economic impacts of COVID-19. The magnitude and duration of the impending global
recession will depend on the success of efforts to contain the virus. Many commentators
are predicting a major shock to global economic activity.
The nature of this new economic shock will be very different to the GFC. The underlying
circumstances in New Zealand are also different. Historically low interest rates have left
little room for cuts to the OCR, and the Reserve Bank has instigated quantitative easing to
add monetary stimulus. Fiscal consolidation since the GFC means the Government has
been well-placed to execute a significant fiscal support package. New Zealand is now more
exposed to Asian markets, particularly China. Also, some industries will be harder hit than
others, with the outlook for tourism being particularly unclear.

10 Issues paper | New Zealand firms: reaching for the frontier
2 Frontier firms and economic success
Before considering policy options that might help achieve New Zealand’s productivity potential,
it is useful to reflect on what success could look like and how frontier firms can contribute. Most
obviously, a successful New Zealand economy would be one in which the substantial gaps in
income and productivity vis-à-vis the more advanced OECD countries steadily close (Conway,
2018). It would provide a stronger platform for addressing wider environmental and social
challenges, such as shifting towards a low-emissions economy and learning from and supporting
the growth of the Māori economy.
The transition to a low-emissions economy will, for instance, require profound and widespread
changes in every part of the economy; including transforming production methods and
technology, energy systems, land use, regulatory frameworks and institutions and business and
political culture. Governments will need to make difficult decisions about how best to use the
levers within their control, and how to act in the face of influences outside of it.
The characteristics of a successful New Zealand economy
Narrowing the gaps in income and productivity between New Zealand and other advanced
economies requires changes to the way innovation, diffusion and reallocation happen. To catch
up, New Zealand will need to overcome a combination of challenges that mark it apart from its
OECD peers – the combination of small size, distance from markets and its reliance on the
primary sector.
Success would see some New Zealand firms operating at the global frontier, as well as firms at
the global frontier operating in New Zealand. It would require more New Zealand firms to have
effective international connections and the tradable part of the economy to grow strongly.
Resources of capital and labour would move towards high-productivity firms. The country would
have diverse and complex exports, building on existing areas of comparative advantage, with
New Zealand firms integrated into high value-added parts of global supply chains. New
Zealand’s science and innovation system would produce and commercialise productivity-
enhancing ideas and technologies that attract high global demand. The skills system would be
well integrated into the labour market to produce skills and training that are well-matched to
future jobs.
Across the domestic economy firms and workers would be learning from the frontier, with
diffusion lifting their productivity over time. Innovations developed at the international and
national frontiers would diffuse to lower-productivity firms, including in regional markets. More
productive firms would grow and benefit from scale economies, while poor performers would be
more likely than now to shrink and exit to release resources to more productive firms.
Chapters 3 and 4 of this Issues Paper describe the distribution of firms in New Zealand and
examine what the data can tell us about how the processes of innovation, diffusion and
reallocation are working. They look at some potential explanations as to why those processes
may not currently be working as well as they should be.
Frontier firms and economic success 11
Not just looking at the “average firm”
It is important to have good information on frontier and non-frontier firms to understand their
contribution to New Zealand’s productivity performance. Fortunately, the Commission and other
researchers have access to a rich and comprehensive set of linked administrative and survey data
on individual firms known as the Longitudinal Business Database (LBD). The LBD provides a
detailed view of firms’ behaviour and performance across a broad range of topics (Fabling &
Sanderson, 2016). There have been several important studies completed using the LBD over the
last few years. The Ministry of Business, Innovation and Employment has prepared a valuable
stocktake of them (Allan, 2018)..
Aggregate data (economy-wide and industry-level) and microdata (firm-level) are both important
because they illustrate productivity performance in different ways and often employ different
methodological approaches (Mai & Warmke, 2012).
Aggregate data show the performance of the average firm, which can mask large differences
between individual firms (the distribution of performance). Conversely, while microdata can
provide a deeper picture of firm-level performance, aggregate data can illustrate wider trends
(providing a broader picture).
The drivers of productivity growth
The OECD uses a framework that distinguishes firms performing at the productivity frontier and
non-frontier firms. This framework is a natural one for this inquiry to use and is illustrated in the
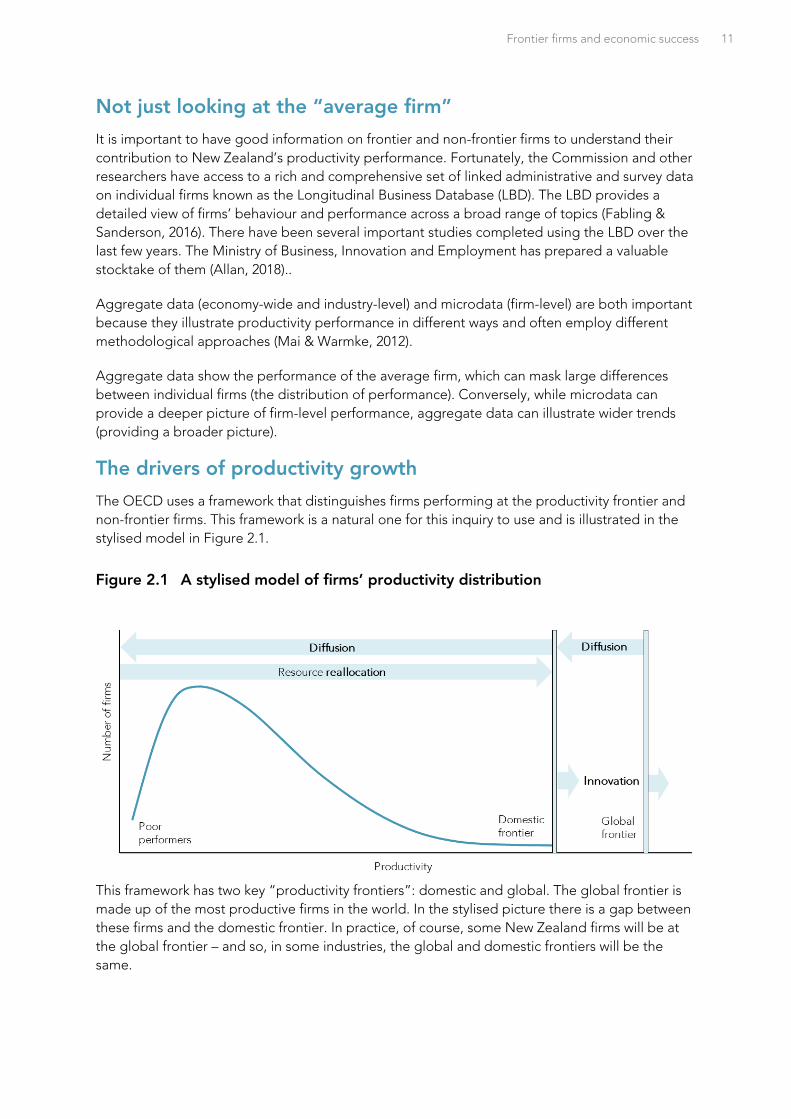
stylised model in Figure 2.1.
Figure 2.1 A stylised model of firms’ productivity distribution
This framework has two key “productivity frontiers”: domestic and global. The global frontier is
made up of the most productive firms in the world. In the stylised picture there is a gap between
these firms and the domestic frontier. In practice, of course, some New Zealand firms will be at
the global frontier – and so, in some industries, the global and domestic frontiers will be the
same.
12 Issues paper | New Zealand firms: reaching for the frontier
All the other firms in New Zealand can then be arranged by how close or far away they are to the
domestic frontier (giving a distribution of performance). The microdata revolution has made
available large data sets of individual-firm characteristics. These microdata sets have revealed
wide distributions of productivity across firms, even within narrowly-defined industries (see more
on this below). They also show that the distribution of firms tends to be skewed, and large
numbers of firms tend to have low productivity.
There are three broad drivers of aggregate productivity growth, global or domestic, in this
framework:
Innovation – the process of creating new knowledge and translating it into growth of the
international and domestic productivity frontiers;
Diffusion – the spread of technology, ideas and practices between firms; and
Reallocation – the movement of resources between firms.4
In summary, productivity growth can reflect both movements in the frontiers and the distribution
of firms below them.
Innovation
Innovation is the process of converting ideas and knowledge into new products or processes.
Firms at the global frontier produce genuinely new innovations that advance possibilities for
what businesses produce, or how they undertake their activities. This pushes out the productivity
frontier. Innovation results from investments in R&D, and from combining complementary ideas
and capabilities in novel ways (Hendy & Callaghan, 2013).
The concept of innovation is broad, and includes the creation and implementation of new
products, processes and ways of working.
Diffusion
Firms behind the frontier can improve their productivity by adapting and adopting the latest
technology, ideas or practices. The process by which these existing ideas spread from the
frontier to other firms in the economy is called diffusion. In this way, more firms reap productivity
benefits from the latest innovations. Diffusion can help to close the gap between the most and
least productive firms in the economy.
While diffusion from the domestic frontier to non-frontier firms helps to close the productivity
gap domestically, diffusion of technology and practices from the global frontier to the domestic
one helps to close the gap between the two frontiers. Both can raise New Zealand’s aggregate
productivity.
Reallocation
Across the whole economy, the adoption of new technology, ideas and practices can lead to
dynamic changes. Stronger firms grow, innovative new firms are created, and poorly performing
firms leave the market – a process called reallocation. Through reallocation, resources are moved
4 Sometimes diffusion and reallocation will overlap. For instance, skilled workers may move between firms and thereby transfer knowledge and practices to the firms they join.
Frontier firms and economic success 13
away from the least productive firms to high-productivity firms, leading to improved overall
productivity.
The evidence indicates that, in most economies, resource reallocation contributes more to lifting
productivity than within-firm productivity growth, although the extent to which this is the case
varies across countries, industries and timeframes There is some recent evidence, however, that
the contribution of reallocation to overall productivity may have declined over time (Adalet
McGowan et al., 2017).
Potential drivers of success
There are many different factors that influence innovation, diffusion and reallocation, and the
overall distribution of firm productivity. Recent OECD research discusses several important
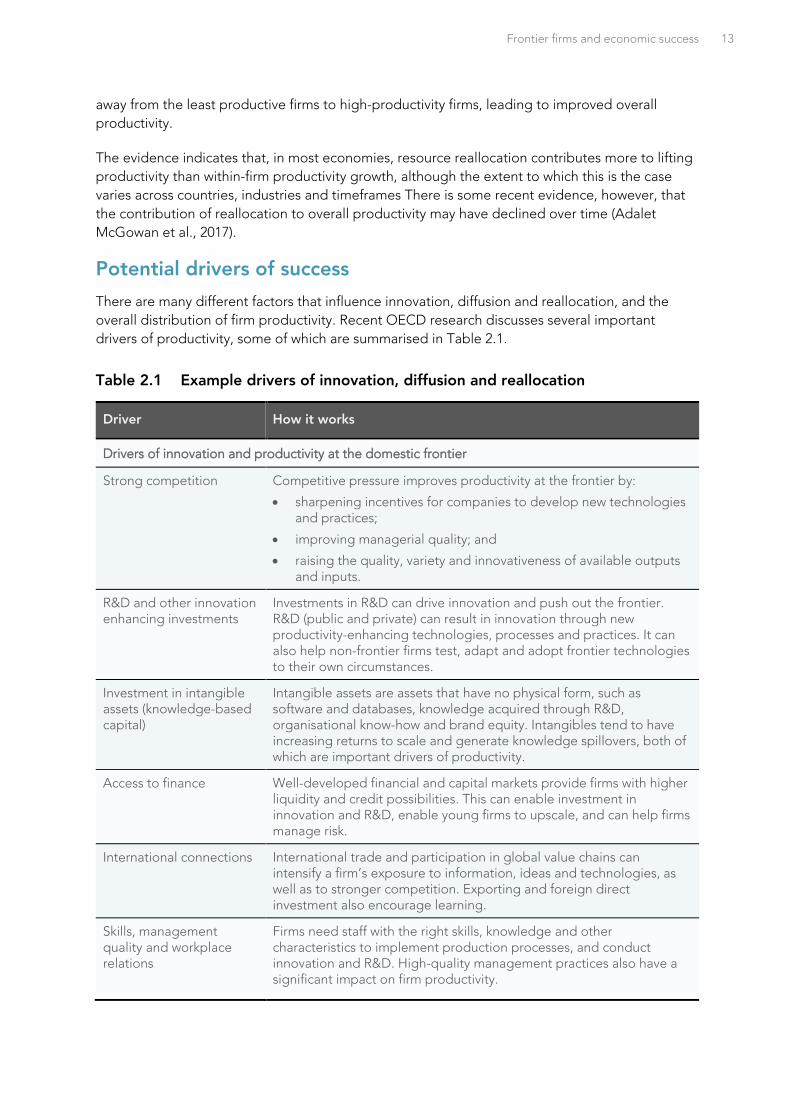
drivers of productivity, some of which are summarised in Table 2.1.
Table 2.1 Example drivers of innovation, diffusion and reallocation
Driver How it works
Drivers of innovation and productivity at the domestic frontier
Strong competition Competitive pressure improves productivity at the frontier by:
• sharpening incentives for companies to develop new technologies and practices;
• improving managerial quality; and
• raising the quality, variety and innovativeness of available outputs and inputs.
R&D and other innovation enhancing investments
Investments in R&D can drive innovation and push out the frontier. R&D (public and private) can result in innovation through new productivity-enhancing technologies, processes and practices. It can also help non-frontier firms test, adapt and adopt frontier technologies to their own circumstances.
Investment in intangible assets (knowledge-based capital)
Intangible assets are assets that have no physical form, such as software and databases, knowledge acquired through R&D, organisational know-how and brand equity. Intangibles tend to have increasing returns to scale and generate knowledge spillovers, both of which are important drivers of productivity.
Access to finance Well-developed financial and capital markets provide firms with higher liquidity and credit possibilities. This can enable investment in innovation and R&D, enable young firms to upscale, and can help firms manage risk.
International connections International trade and participation in global value chains can intensify a firm’s exposure to information, ideas and technologies, as well as to stronger competition. Exporting and foreign direct investment also encourage learning.
Skills, management quality and workplace relations
Firms need staff with the right skills, knowledge and other characteristics to implement production processes, and conduct innovation and R&D. High-quality management practices also have a significant impact on firm productivity.
14 Issues paper | New Zealand firms: reaching for the frontier
Driver How it works
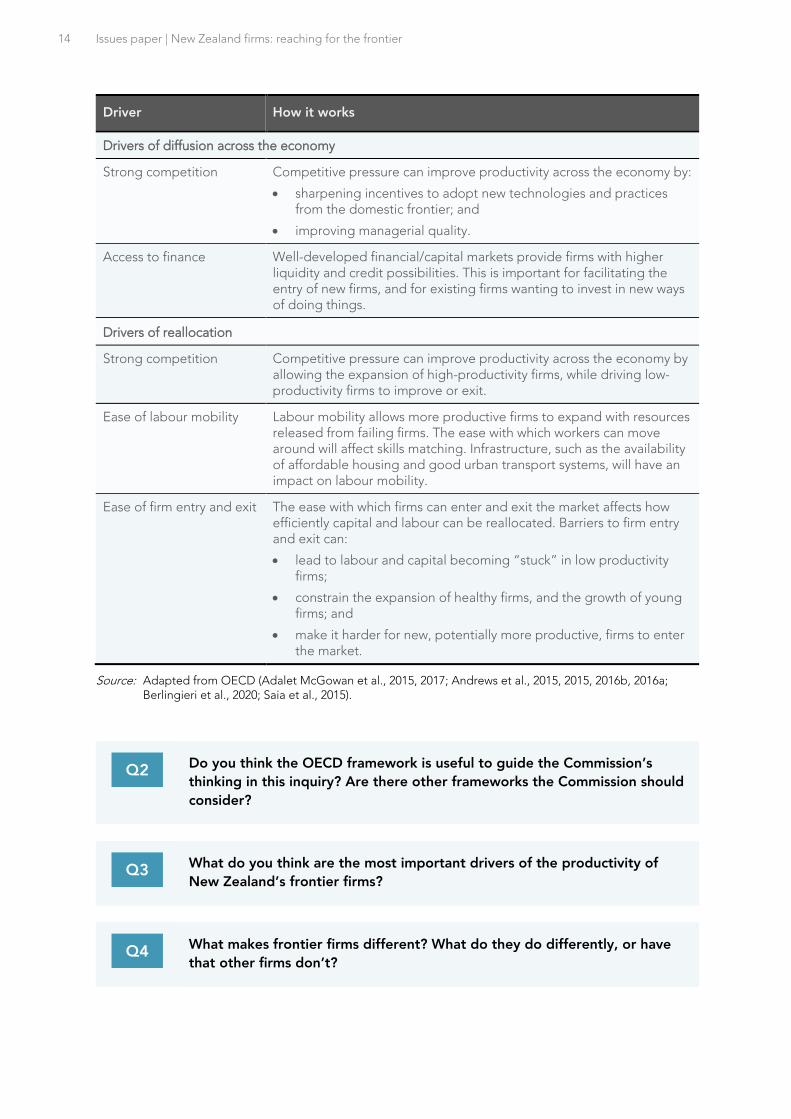
Drivers of diffusion across the economy
Strong competition Competitive pressure can improve productivity across the economy by:
• sharpening incentives to adopt new technologies and practices from the domestic frontier; and
• improving managerial quality.
Access to finance Well-developed financial/capital markets provide firms with higher liquidity and credit possibilities. This is important for facilitating the entry of new firms, and for existing firms wanting to invest in new ways of doing things.
Drivers of reallocation
Strong competition Competitive pressure can improve productivity across the economy by allowing the expansion of high-productivity firms, while driving low-productivity firms to improve or exit.
Ease of labour mobility Labour mobility allows more productive firms to expand with resources released from failing firms. The ease with which workers can move around will affect skills matching. Infrastructure, such as the availability of affordable housing and good urban transport systems, will have an impact on labour mobility.
Ease of firm entry and exit The ease with which firms can enter and exit the market affects how efficiently capital and labour can be reallocated. Barriers to firm entry and exit can:
• lead to labour and capital becoming “stuck” in low productivity firms;
• constrain the expansion of healthy firms, and the growth of young firms; and
• make it harder for new, potentially more productive, firms to enter the market.
Source: Adapted from OECD (Adalet McGowan et al., 2015, 2017; Andrews et al., 2015, 2015, 2016b, 2016a; Berlingieri et al., 2020; Saia et al., 2015).
Q2 Do you think the OECD framework is useful to guide the Commission’s
thinking in this inquiry? Are there other frameworks the Commission should
consider?
Q3 What do you think are the most important drivers of the productivity of
New Zealand’s frontier firms?
Q4 What makes frontier firms different? What do they do differently, or have
that other firms don’t?
Frontier firms and economic success 15
Q5 Can the success of frontier firms be replicated? For example, how much of
their success is down to highly motivated and talented individuals, good
timing, or even just good luck?
Q6 What are the most important drivers of the diffusion of technology, ideas
and business practices from frontier firms to other firms in New Zealand?
Q7 How easily do resources flow from lower to higher productivity firms and
vice versa? What are the most important drivers of the reallocation of
labour, capital and other resources between firms in New Zealand?
Q8 In your view, what are the key ingredients that would lead to a successful
New Zealand economy, and what would success look like?
16 Issues paper | New Zealand firms: reaching for the frontier
3 The picture in New Zealand: frontier firms
The global context
Prior to the COVID-19 crisis, the world economy had recovered to a considerable extent from the
2008 GFC, but not without a marked slowdown in the average rate of productivity growth in
OECD countries, New Zealand included. Over 2010–17, average annual growth in total economy
labour productivity in the OECD slowed to 0.9%, about half the rate in the pre-crisis period of
2001–07. New Zealand’s average annual labour productivity growth over 2001–07 was 1.4% and
this slowed to 0.5% over 2010–17. (OECD, 2019)
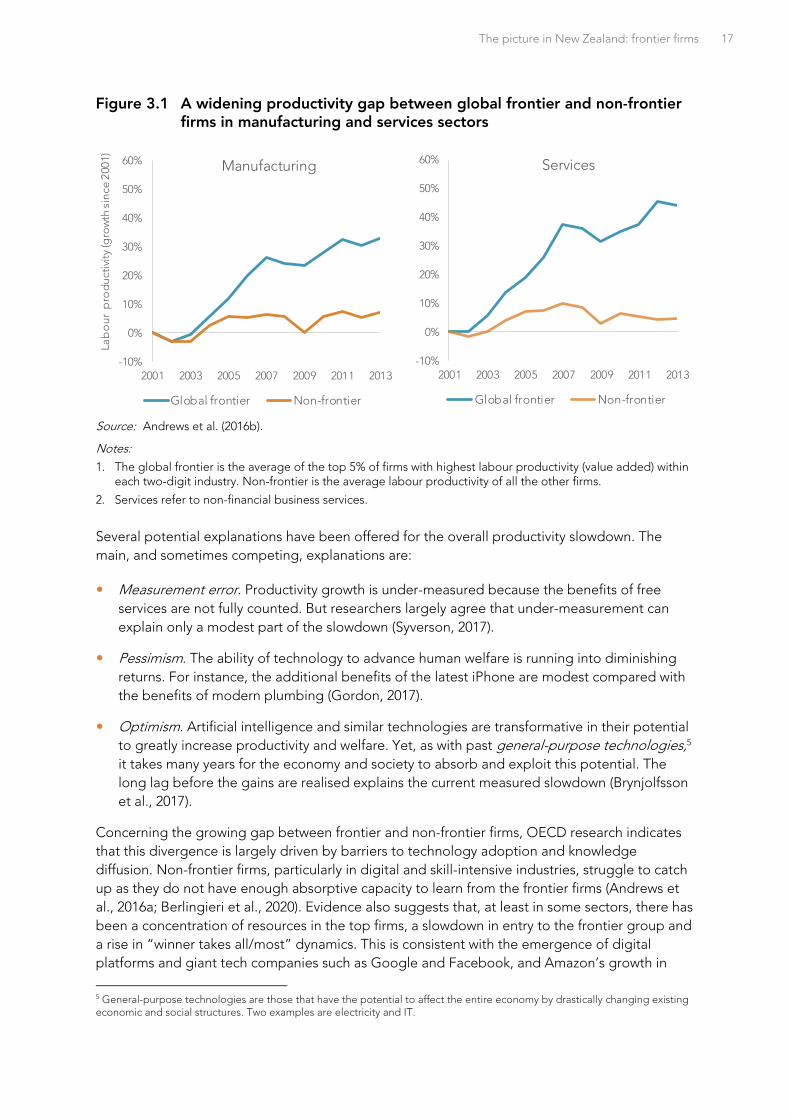
This change in average labour productivity growth masks important changes in the distribution
of firm productivity. Strikingly, as Figure 3.1 shows, for OECD countries the productivity growth
of firms at the global productivity frontier has outpaced that of firms behind the frontier since
early this century, although the GFC checked the productivity growth of both groups of firms. As
a result, firms behind the frontier have not kept up and have lagged further behind. This is
sometimes referred to as a broken “productivity diffusion machine”. OECD work points to this
growing gap in both manufacturing and services, but a larger gap in services (Figure 3.1).
It is important to note that the graphs in Figure 3.1 show only the growth rates (and not the
levels) of productivity of each of the two groups of firms – frontier and non-frontier. They show by
how much the productivity of each group has grown since 2001. For example, by 2013 global
frontier firms in the services sector had grown their labour productivity on average by around
40% since 2001, compared with non-frontier firms who had grown theirs by only around 5%. The
graphs are set to start at the same point of 0% in 2001. This does not mean the productivity
levels of the two groups of firms were the same in 2001. These levels were already quite different
in that year to the extent that firms at the frontier were on average probably around three to four
times more productive than non-frontier firms (Andrews et al., 2016b). This point also applies to
the productivity-growth graphs in Figure 3.2 and Figure 3.3.
The picture in New Zealand: frontier firms 17
Figure 3.1 A widening productivity gap between global frontier and non-frontier firms in manufacturing and services sectors
Source: Andrews et al. (2016b).
Notes:
1. The global frontier is the average of the top 5% of firms with highest labour productivity (value added) within each two-digit industry. Non-frontier is the average labour productivity of all the other firms.
2. Services refer to non-financial business services.
Several potential explanations have been offered for the overall productivity slowdown. The
main, and sometimes competing, explanations are:
Measurement error. Productivity growth is under-measured because the benefits of free
services are not fully counted. But researchers largely agree that under-measurement can
explain only a modest part of the slowdown (Syverson, 2017).
Pessimism. The ability of technology to advance human welfare is running into diminishing
returns. For instance, the additional benefits of the latest iPhone are modest compared with
the benefits of modern plumbing (Gordon, 2017).
Optimism. Artificial intelligence and similar technologies are transformative in their potential
to greatly increase productivity and welfare. Yet, as with past general-purpose technologies,5
it takes many years for the economy and society to absorb and exploit this potential. The
long lag before the gains are realised explains the current measured slowdown (Brynjolfsson
et al., 2017).
Concerning the growing gap between frontier and non-frontier firms, OECD research indicates
that this divergence is largely driven by barriers to technology adoption and knowledge
diffusion. Non-frontier firms, particularly in digital and skill-intensive industries, struggle to catch
up as they do not have enough absorptive capacity to learn from the frontier firms (Andrews et
al., 2016a; Berlingieri et al., 2020). Evidence also suggests that, at least in some sectors, there has
been a concentration of resources in the top firms, a slowdown in entry to the frontier group and
a rise in “winner takes all/most” dynamics. This is consistent with the emergence of digital
platforms and giant tech companies such as Google and Facebook, and Amazon’s growth in
5 General-purpose technologies are those that have the potential to affect the entire economy by drastically changing existing economic and social structures. Two examples are electricity and IT.
-10%
0%
10%
20%
30%
40%
50%
60%
2001 2003 2005 2007 2009 2011 2013
Lab
ou
r p
rod
uct
ivit
y (g
row
th s
ince
200
1)
Manufacturing
Global frontier Non-frontier
-10%
0%
10%
20%
30%
40%
50%
60%
2001 2003 2005 2007 2009 2011 2013
Services
Global frontier Non-frontier
18 Issues paper | New Zealand firms: reaching for the frontier
retail. There appears to have been declining business dynamism across the board (entry of new
firms and reallocation of existing resource across firms), as well as rising wage inequality and a
declining labour income share.
New Zealand’s aggregate productivity growth since the GFC has slowed in line with the general
OECD trend, although there are some differences. As noted, the global slowdown in labour
productivity growth has been largely driven by a slowdown in MFP growth (MFP being just one
component of labour productivity). However, in New Zealand the other component of labour
productivity – business investment leading to capital deepening – has been flat and so appears
to have played a larger role (Nolan et al., 2019). Further, the relative experience of New
Zealand’s frontier and non-frontier firms appears not to have followed the same pattern as in
other OECD countries. This topic is covered in the next section.
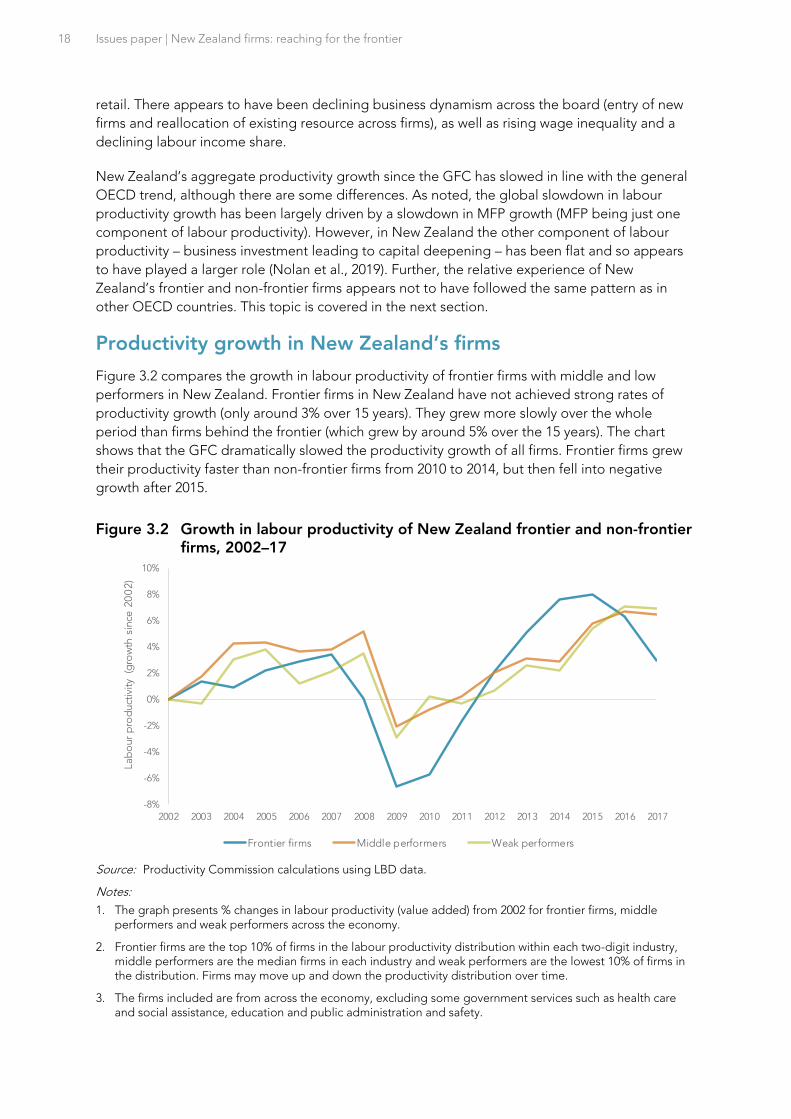
Productivity growth in New Zealand’s firms
Figure 3.2 compares the growth in labour productivity of frontier firms with middle and low
performers in New Zealand. Frontier firms in New Zealand have not achieved strong rates of
productivity growth (only around 3% over 15 years). They grew more slowly over the whole
period than firms behind the frontier (which grew by around 5% over the 15 years). The chart
shows that the GFC dramatically slowed the productivity growth of all firms. Frontier firms grew
their productivity faster than non-frontier firms from 2010 to 2014, but then fell into negative
growth after 2015.
Figure 3.2 Growth in labour productivity of New Zealand frontier and non-frontier firms, 2002–17
Source: Productivity Commission calculations using LBD data.
Notes:
1. The graph presents % changes in labour productivity (value added) from 2002 for frontier firms, middle performers and weak performers across the economy.
2. Frontier firms are the top 10% of firms in the labour productivity distribution within each two-digit industry, middle performers are the median firms in each industry and weak performers are the lowest 10% of firms in the distribution. Firms may move up and down the productivity distribution over time.
3. The firms included are from across the economy, excluding some government services such as health care and social assistance, education and public administration and safety.
-8%
-6%
-4%
-2%
0%
2%
4%
6%
8%
10%
2002 2003 2004 2005 2006 2007 2008 2009 2010 2011 2012 2013 2014 2015 2016 2017
La
bo
ur
pro
du
ctiv
ity
(gro
wth
sin
ce 2
00
2)
Frontier firms Middle performers Weak performers
The picture in New Zealand: frontier firms 19
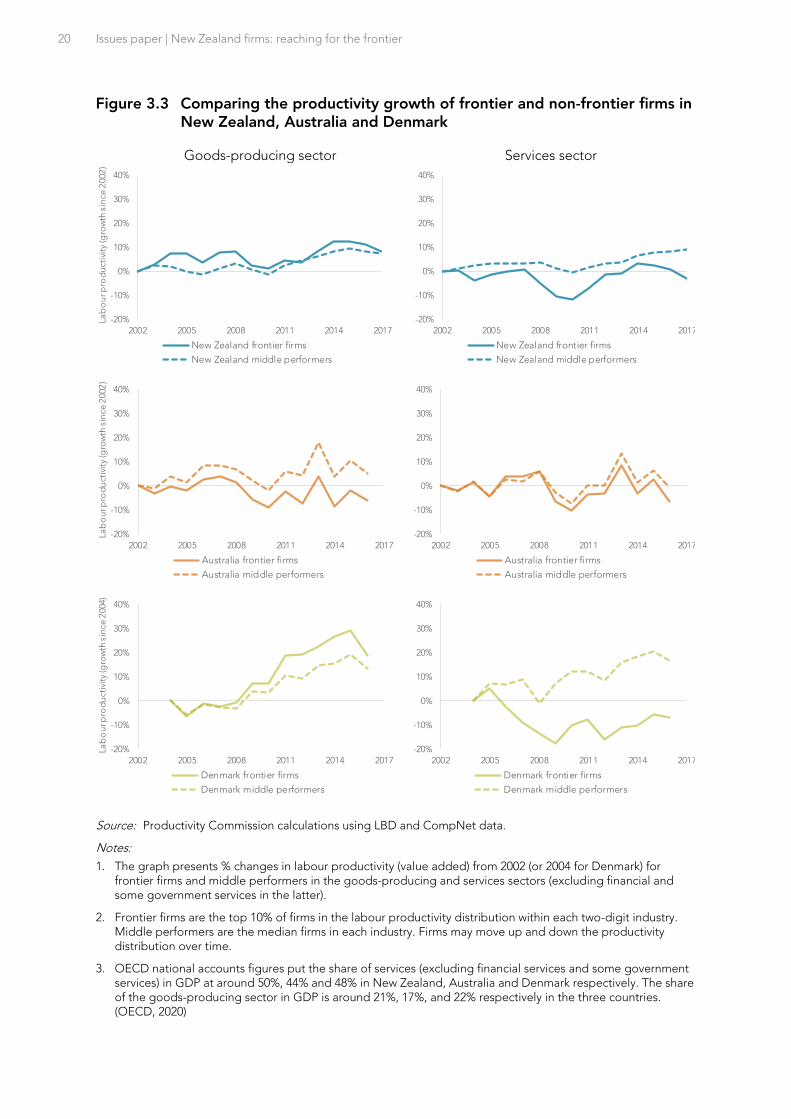
Figure 3.3 compares the results for New Zealand’s goods-producing and services sectors6 with
those of two other small, advanced economies: Australia and Denmark. Making international
comparisons of this type raises significant data and measurement issues. Nonetheless, the data
indicate that the experience of New Zealand is broadly consistent with these other small
advanced economies. In all three countries frontier firms have had relatively lacklustre
productivity growth particularly in the services sector.7
Middle performers grew slightly more than frontier firms in New Zealand and Australia but grew
the same in Denmark. While not shown in the figure, the productivity levels of the middle
performers stayed well below those of the frontier firms in each case. A striking thing about these
results is that the frontier firms do not appear to be pulling away from the rest – in the way the
OECD found when looking at all firms globally. This could indicate that the widening trends
observed by the OECD are being driven by a relatively small number of “super-star” firms in
large economies as noted above.
Figure 3.3 does not compare the productivity levels of firms across countries. This is difficult to
do and would require further investigation. But because studies of productivity levels of the total
economy of the three countries show New Zealand well behind Australia and Denmark, it is
highly likely that the productivity levels of New Zealand firms are, on average, significantly lower
than for firms in Australia and Denmark.
6 The goods-producing sector includes the following industries: manufacturing (including food processing), electricity, gas, water, waste services and construction. Services are market-provided services and so exclude services provided directly by the government such as health care and social assistance, education and public administration and safety. 7 These results come from CompNet data. More information on this dataset is available at www.comp-net.org/data. An alternative dataset would be the OECD’s MultiProd; however, the CompNet dataset has more recent data for New Zealand than MultiProd. It is important to note that these alternative datasets will give rise to some small differences in results given differences in how they are constructed. This highlights the challenges of undertaking comparative research and the importance of triangulating results from several different sources.
20 Issues paper | New Zealand firms: reaching for the frontier
Figure 3.3 Comparing the productivity growth of frontier and non-frontier firms in New Zealand, Australia and Denmark
Goods-producing sector Services sector
Source: Productivity Commission calculations using LBD and CompNet data.
Notes:
1. The graph presents % changes in labour productivity (value added) from 2002 (or 2004 for Denmark) for frontier firms and middle performers in the goods-producing and services sectors (excluding financial and some government services in the latter).
2. Frontier firms are the top 10% of firms in the labour productivity distribution within each two-digit industry. Middle performers are the median firms in each industry. Firms may move up and down the productivity distribution over time.
3. OECD national accounts figures put the share of services (excluding financial services and some government services) in GDP at around 50%, 44% and 48% in New Zealand, Australia and Denmark respectively. The share of the goods-producing sector in GDP is around 21%, 17%, and 22% respectively in the three countries. (OECD, 2020)
-20%
-10%
0%
10%
20%
30%
40%
2002 2005 2008 2011 2014 2017
La
bo
ur p
rod
ucti
vity
(gro
wth
sin
ce
2002
)
New Zealand frontier firms
New Zealand middle performers
-20%
-10%
0%
10%
20%
30%
40%
2002 2005 2008 2011 2014 2017
La
bo
ur p
rod
ucti
vity
(gro
wth
sin
ce
2002
)
New Zealand frontier firms
New Zealand middle performers
-20%
-10%
0%
10%
20%
30%
40%
2002 2005 2008 2011 2014 2017
Lab
ou
r pro
du
ctiv
ity
(gro
wth
sin
ce 2
002
)
Australia frontier firms
Australia middle performers
-20%
-10%
0%
10%
20%
30%
40%
2002 2005 2008 2011 2014 2017
Lab
ou
r pro
du
ctiv
ity
(gro
wth
sin
ce 2
002
)
Australia frontier firms
Australia middle performers
-20%
-10%
0%
10%
20%
30%
40%
2002 2005 2008 2011 2014 2017
Lab
ou
r pro
du
ctiv
ity
(gro
wth
sin
ce 2
004)
Denmark frontier firms
Denmark middle performers
-20%
-10%
0%
10%
20%
30%
40%
2002 2005 2008 2011 2014 2017
Lab
ou
r pro
du
ctiv
ity
(gro
wth
sin
ce 2
004)
Denmark frontier firms
Denmark middle performers
The picture in New Zealand: frontier firms 21
Firms at the New Zealand productivity frontier
The characteristics of New Zealand’s frontier firms can be studied using Stats NZ’s LBD. The LBD
contains linked administrative and survey data at the level of the individual firm and worker and
provides a detailed view of firms’ behaviour and performance over time and across a broad
range of topics (Fabling & Sanderson, 2016). Data in the LBD is anonymised so it is not possible
to reveal the identities of individual firms, although the characteristics of groups of firms can be
studied (subject to checking for confidentiality).
For its LBD research, the Commission intends to define frontier firms as the top 10% of firms in
the productivity distribution in each industry. Defining the frontier more narrowly (e.g., the top
5%) would increase the risk of measurement error due to the smaller sample size and mean that,
in some cases, the results could not be revealed given the need to protect the confidentiality of
the data.
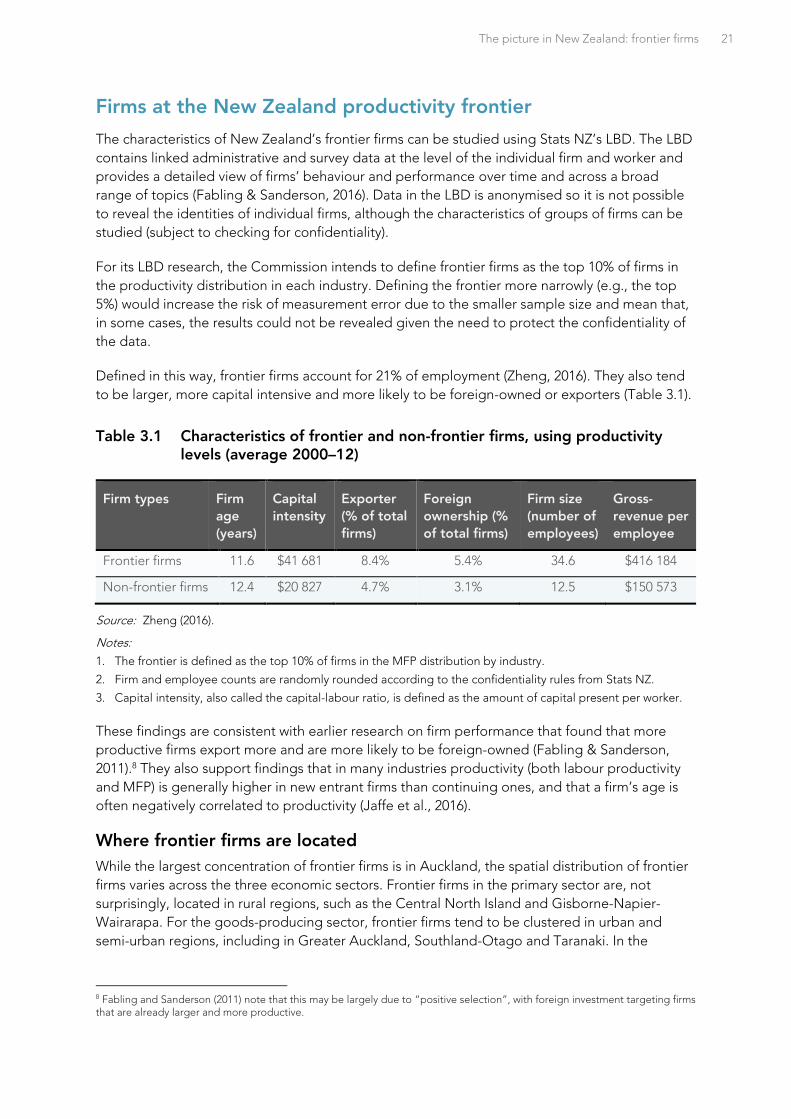
Defined in this way, frontier firms account for 21% of employment (Zheng, 2016). They also tend
to be larger, more capital intensive and more likely to be foreign-owned or exporters (Table 3.1).
Table 3.1 Characteristics of frontier and non-frontier firms, using productivity levels (average 2000–12)
Firm types Firm
age
(years)
Capital
intensity
Exporter
(% of total
firms)
Foreign
ownership (%
of total firms)
Firm size
(number of
employees)
Gross-
revenue per
employee
Frontier firms 11.6 $41 681 8.4% 5.4% 34.6 $416 184
Non-frontier firms 12.4 $20 827 4.7% 3.1% 12.5 $150 573
Source: Zheng (2016).
Notes:
1. The frontier is defined as the top 10% of firms in the MFP distribution by industry.
2. Firm and employee counts are randomly rounded according to the confidentiality rules from Stats NZ.
3. Capital intensity, also called the capital-labour ratio, is defined as the amount of capital present per worker.
These findings are consistent with earlier research on firm performance that found that more
productive firms export more and are more likely to be foreign-owned (Fabling & Sanderson,
2011).8 They also support findings that in many industries productivity (both labour productivity
and MFP) is generally higher in new entrant firms than continuing ones, and that a firm’s age is
often negatively correlated to productivity (Jaffe et al., 2016).
Where frontier firms are located
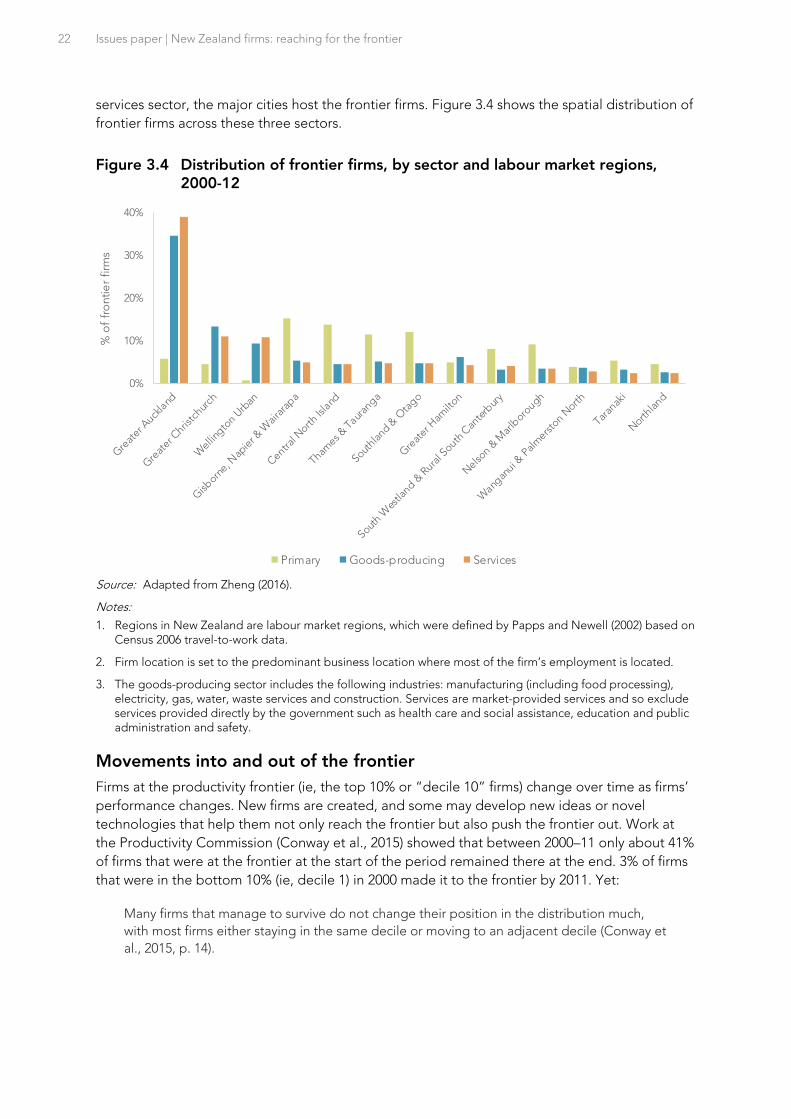
While the largest concentration of frontier firms is in Auckland, the spatial distribution of frontier
firms varies across the three economic sectors. Frontier firms in the primary sector are, not
surprisingly, located in rural regions, such as the Central North Island and Gisborne-Napier-
Wairarapa. For the goods-producing sector, frontier firms tend to be clustered in urban and
semi-urban regions, including in Greater Auckland, Southland-Otago and Taranaki. In the
8 Fabling and Sanderson (2011) note that this may be largely due to “positive selection”, with foreign investment targeting firms that are already larger and more productive.
22 Issues paper | New Zealand firms: reaching for the frontier
services sector, the major cities host the frontier firms. Figure 3.4 shows the spatial distribution of
frontier firms across these three sectors.
Figure 3.4 Distribution of frontier firms, by sector and labour market regions, 2000-12
Source: Adapted from Zheng (2016).
Notes:
1. Regions in New Zealand are labour market regions, which were defined by Papps and Newell (2002) based on Census 2006 travel-to-work data.
2. Firm location is set to the predominant business location where most of the firm’s employment is located.
3. The goods-producing sector includes the following industries: manufacturing (including food processing), electricity, gas, water, waste services and construction. Services are market-provided services and so exclude services provided directly by the government such as health care and social assistance, education and public administration and safety.
Movements into and out of the frontier
Firms at the productivity frontier (ie, the top 10% or “decile 10” firms) change over time as firms’
performance changes. New firms are created, and some may develop new ideas or novel
technologies that help them not only reach the frontier but also push the frontier out. Work at
the Productivity Commission (Conway et al., 2015) showed that between 2000–11 only about 41%
of firms that were at the frontier at the start of the period remained there at the end. 3% of firms
that were in the bottom 10% (ie, decile 1) in 2000 made it to the frontier by 2011. Yet:
Many firms that manage to survive do not change their position in the distribution much,
with most firms either staying in the same decile or moving to an adjacent decile (Conway et
al., 2015, p. 14).
0%
10%
20%
30%
40%
% o
f fr
on
tie
r fi
rms
Primary Goods-producing Services
The picture in New Zealand: frontier firms 23
Business models
Globally, some of the current set of frontier firms have distinctive business models that are clearly
linked to their success. These models exploit the possibilities offered by ICT and digital
technologies. Box 4 looks at trends in business models and the limited amount that is known
about the extent to which business practices and models are changing among New Zealand
firms. Yet, some New Zealand studies exist and indicate the productivity benefits of having
access to ultra-fast broadband (Fabling & Grimes, 2016, 2019).
Other high-performing Kiwi firms
As discussed in Chapter 1, there are a variety of characteristics and measures that can be used to
identify high-performing firms. The Commission will draw on a range of available datasets, in
addition to the LBD, to provide a richer view on frontier firms in New Zealand. Table 1.1
presented several lists of top-performing firms in New Zealand. This section examines the
characteristics of firms in two of those lists: NZTE’s Focus 700 (F700) portfolio and Deloitte’s Top
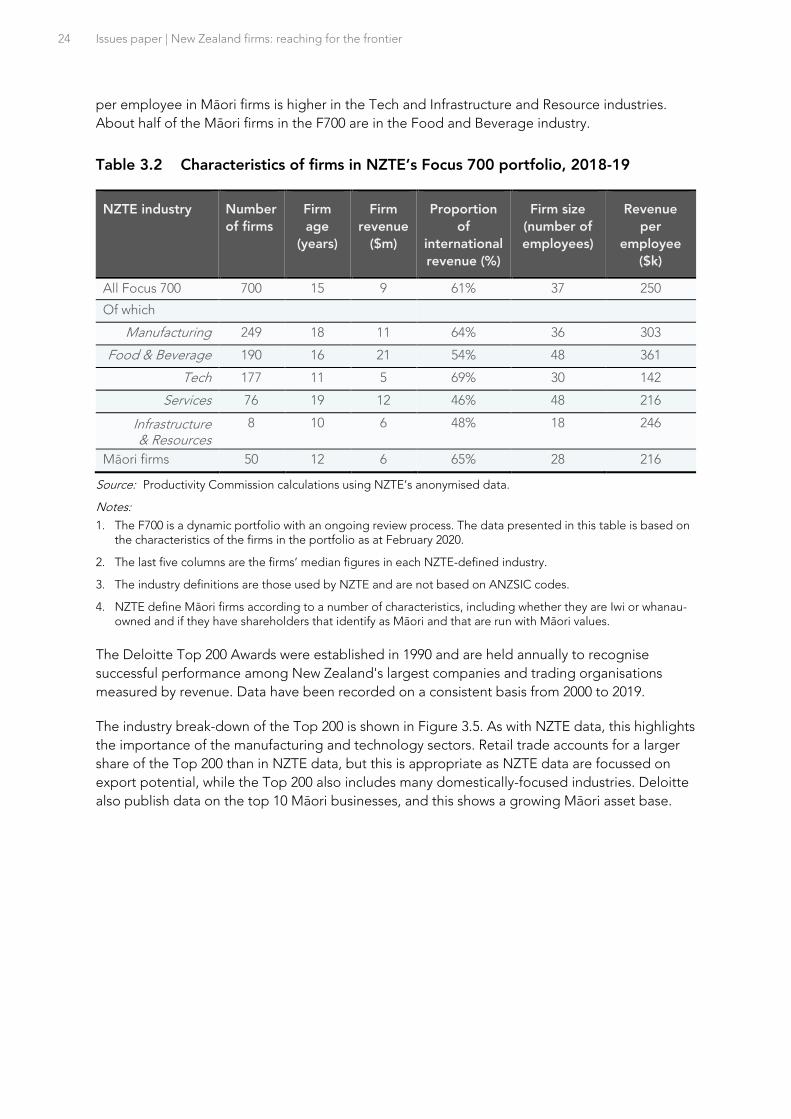
200 Index. Table 3.2 summarises the characteristics of NZTE’s F700 firms by citing the median
value of the characteristic in each case.
The average size of firms in NZTE’s F700 is comparable to the frontier firms identified in the LBD
(Table 3.1).9 However, the revenue per employee of most F700 firms is smaller, possibly because
they are selected based on export and high-growth potential and not current performance.
The 50 Māori firms in the F700 are, on average, younger and smaller than the other firms on the
list. Māori firms perform better than average F700 firms in some industries. For instance, revenue
9 Most firms in the F700 are relatively small, it also covers some very large firms. For instance, in 2019, 17 firms had more than 1 000 employees and 15 firms each earned a total revenue of more than $500 million.
Box 4 Firms employ a wide range of business practices and models
A business model is a collection of different business practices. Firms use a wide range of
practices, which they combine in various ways into different business models. The way firms
operate has changed substantially over time, with adoption rates of different practices
varying, depending on location, industry, firm size and other factors.
The most significant recent trend has been growth in the use of digital technologies such
as cloud computing, e-commerce and online platforms. Digital technologies underpin
many emerging and rapidly growing business models and are having a huge impact on
how firms do business.
Yet, there are limited data to measure how widespread most emerging business practices
are among New Zealand firms, with measurement struggling to keep up as business
models evolve. Because such practices are not well-measured, it is hard to know just how
quickly their use is growing in New Zealand, which firms are using them, or the impact they
are having on productivity.
Source: MBIE (2020, unpublished internal document).
24 Issues paper | New Zealand firms: reaching for the frontier
per employee in Māori firms is higher in the Tech and Infrastructure and Resource industries.
About half of the Māori firms in the F700 are in the Food and Beverage industry.
Table 3.2 Characteristics of firms in NZTE’s Focus 700 portfolio, 2018-19
NZTE industry Number
of firms
Firm
age
(years)
Firm
revenue
($m)
Proportion
of
international
revenue (%)
Firm size
(number of
employees)
Revenue
per
employee
($k)
All Focus 700 700 15 9 61% 37 250
Of which
Manufacturing 249 18 11 64% 36 303
Food & Beverage 190 16 21 54% 48 361
Tech 177 11 5 69% 30 142
Services 76 19 12 46% 48 216
Infrastructure & Resources
8 10 6 48% 18 246
Māori firms 50 12 6 65% 28 216
Source: Productivity Commission calculations using NZTE’s anonymised data.
Notes:
1. The F700 is a dynamic portfolio with an ongoing review process. The data presented in this table is based on the characteristics of the firms in the portfolio as at February 2020.
2. The last five columns are the firms’ median figures in each NZTE-defined industry.
3. The industry definitions are those used by NZTE and are not based on ANZSIC codes.
4. NZTE define Māori firms according to a number of characteristics, including whether they are Iwi or whanau-owned and if they have shareholders that identify as Māori and that are run with Māori values.
The Deloitte Top 200 Awards were established in 1990 and are held annually to recognise
successful performance among New Zealand's largest companies and trading organisations
measured by revenue. Data have been recorded on a consistent basis from 2000 to 2019.
The industry break-down of the Top 200 is shown in Figure 3.5. As with NZTE data, this highlights
the importance of the manufacturing and technology sectors. Retail trade accounts for a larger
share of the Top 200 than in NZTE data, but this is appropriate as NZTE data are focussed on
export potential, while the Top 200 also includes many domestically-focused industries. Deloitte
also publish data on the top 10 Māori businesses, and this shows a growing Māori asset base.
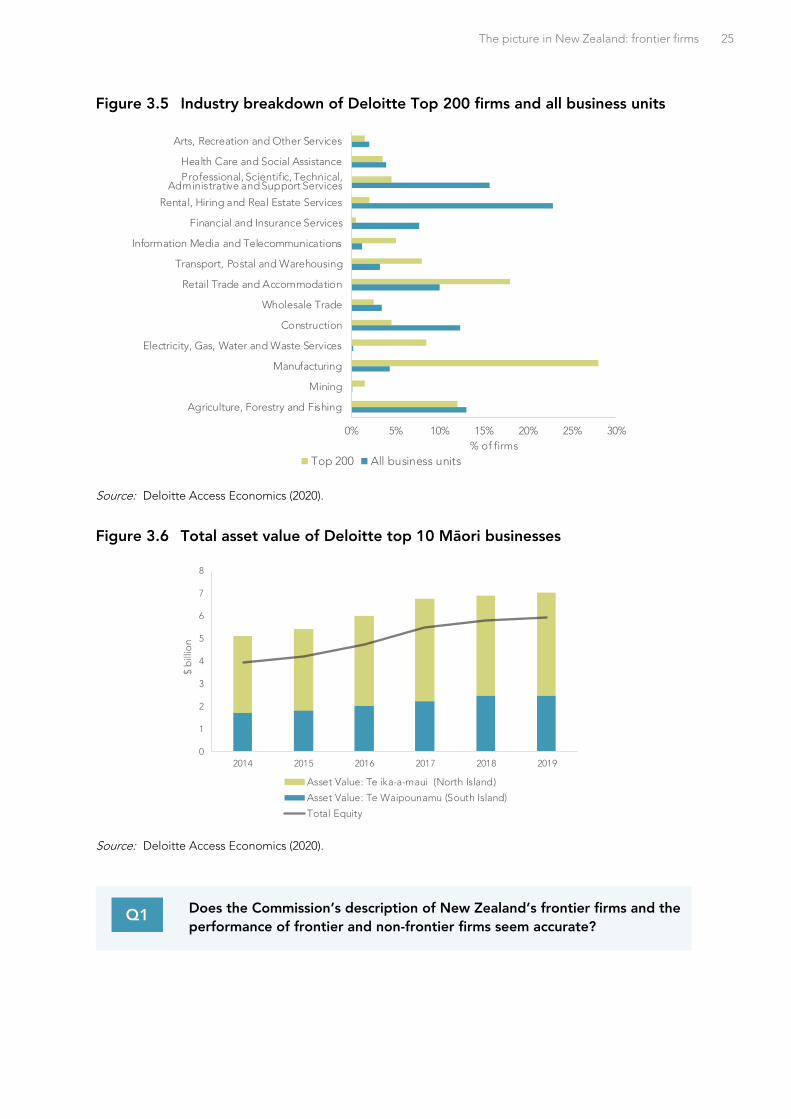
The picture in New Zealand: frontier firms 25
Figure 3.5 Industry breakdown of Deloitte Top 200 firms and all business units
Source: Deloitte Access Economics (2020).
Figure 3.6 Total asset value of Deloitte top 10 Māori businesses
Source: Deloitte Access Economics (2020).
Q1 Does the Commission’s description of New Zealand’s frontier firms and the
performance of frontier and non-frontier firms seem accurate?
0% 5% 10% 15% 20% 25% 30%
Agriculture, Forestry and Fishing
Mining
Manufacturing
Electricity, Gas, Water and Waste Services
Construction
Wholesale Trade
Retail Trade and Accommodation
Transport, Postal and Warehousing
Information Media and Telecommunications
Financial and Insurance Services
Rental, Hiring and Real Estate Services
Professional, Scientific, Technical,…
Health Care and Social Assistance
Arts, Recreation and Other Services
% of firms
Top 200 All business units
Professional, Scientific, Technical, Administrative and Support Services
0
1
2
3
4
5
6
7
8
2014 2015 2016 2017 2018 2019
$ b
illio
n
Asset Value: Te ika-a-maui (North Island)
Asset Value: Te Waipounamu (South Island)
Total Equity
26 Issues paper | New Zealand firms: reaching for the frontier
4 The picture in New Zealand: innovation, diffusion and reallocation
Innovation
Innovation is a key driver of productivity growth. Innovation is important not only for frontier
firms to push out the productivity frontier, but for non-frontier firms to absorb technology and
know-how from frontier firms and improve their performance.
To innovate, firms may need to invest in R&D, retrain employees and promote new products to
customers. Innovation is costly and risky and has uncertain impacts on firm performance. By
changing the way firms do things, innovation exposes businesses to risks of failure; new products
may not catch on, or process changes could disrupt systems that were working efficiently. Even
when innovations are successful, rivals may copy them and capture a large share of the returns.
Notwithstanding the costs and risks, knowledge is becoming increasingly important in driving
economic growth, and the benefits of investing in innovation can be greater than has
traditionally been the case (Haskel & Westlake, 2018).
Despite a supposed “number 8 fencing wire” attitude, New Zealand firms do not perform well in
some important aspects of innovation. Public and private investment in R&D as a share of GDP in
New Zealand are among the lowest in the OECD. New Zealand is also unusual in that less than
50% of total R&D is funded by the private sector, while the OECD average is close to 70%. This is
backed up by international comparisons that show while New Zealand ranks highly in generating
ideas, firms invest relatively little and perform poorly in commercialisation (Wakeman & Le, 2015).
Kiwi firms innovate at different rates
Using firm-level data from the LBD, Wakeman and Le (2015) found that while innovation rates of
Kiwi firms varied across time and by firm characteristics some key patterns could be identified.
Smaller younger firms are more innovative. On measures that adjust for firm size,10 and on
average, smaller firms innovate more, even though a higher proportion of larger firm
innovate and engage in R&D. Younger firms are more likely to innovate than older firms. This
is consistent with international evidence showing that innovations are often brought to
market by new firms.
The extent and type of innovative activity varies by industry. R&D and patenting activity is
highest in the manufacturing industries, and firms in those industries are more likely to
introduce innovative goods and services and operational processes. Firms in the services
sector are just as, or more, likely to introduce new organisational processes and marketing
methods.
10 The percentage of sales from new goods and services and expenditure on R&D as a % of total expenditure.
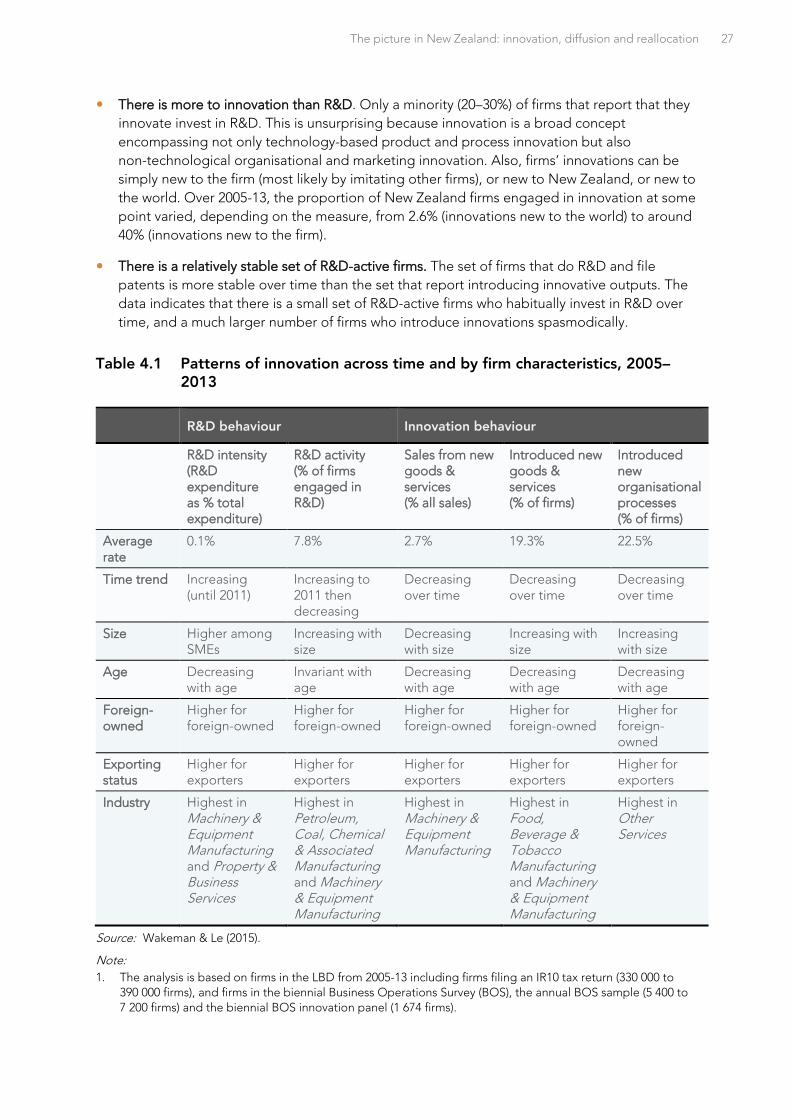
The picture in New Zealand: innovation, diffusion and reallocation 27
There is more to innovation than R&D. Only a minority (20–30%) of firms that report that they
innovate invest in R&D. This is unsurprising because innovation is a broad concept
encompassing not only technology-based product and process innovation but also
non-technological organisational and marketing innovation. Also, firms’ innovations can be
simply new to the firm (most likely by imitating other firms), or new to New Zealand, or new to
the world. Over 2005-13, the proportion of New Zealand firms engaged in innovation at some
point varied, depending on the measure, from 2.6% (innovations new to the world) to around
40% (innovations new to the firm).
There is a relatively stable set of R&D-active firms. The set of firms that do R&D and file
patents is more stable over time than the set that report introducing innovative outputs. The
data indicates that there is a small set of R&D-active firms who habitually invest in R&D over
time, and a much larger number of firms who introduce innovations spasmodically.
Table 4.1 Patterns of innovation across time and by firm characteristics, 2005–2013
R&D behaviour Innovation behaviour
R&D intensity (R&D expenditure as % total expenditure)
R&D activity (% of firms engaged in R&D)
Sales from new goods & services (% all sales)
Introduced new goods & services (% of firms)
Introduced new organisational processes (% of firms)
Average rate
0.1% 7.8% 2.7% 19.3% 22.5%
Time trend Increasing (until 2011)
Increasing to 2011 then decreasing
Decreasing over time
Decreasing over time
Decreasing over time
Size Higher among SMEs
Increasing with size
Decreasing with size
Increasing with size
Increasing with size
Age Decreasing with age
Invariant with age
Decreasing with age
Decreasing with age
Decreasing with age
Foreign-owned
Higher for foreign-owned
Higher for foreign-owned
Higher for foreign-owned
Higher for foreign-owned
Higher for foreign-owned
Exporting status
Higher for exporters
Higher for exporters
Higher for exporters
Higher for exporters
Higher for exporters
Industry Highest in Machinery & Equipment Manufacturing and Property & Business Services
Highest in Petroleum, Coal, Chemical & Associated Manufacturing and Machinery & Equipment Manufacturing
Highest in Machinery & Equipment Manufacturing
Highest in Food, Beverage & Tobacco Manufacturing and Machinery & Equipment Manufacturing
Highest in Other Services
Source: Wakeman & Le (2015).
Note:
1. The analysis is based on firms in the LBD from 2005-13 including firms filing an IR10 tax return (330 000 to
390 000 firms), and firms in the biennial Business Operations Survey (BOS), the annual BOS sample (5 400 to
7 200 firms) and the biennial BOS innovation panel (1 674 firms).
28 Issues paper | New Zealand firms: reaching for the frontier
The impact of innovation on firm performance
Wakeman and Conway (2017) studied several thousand New Zealand firms from the BOS and the
broader LBD over 2005-12. They found that innovative firms had faster growth in employment
and output and a better chance of survival than firms that did not innovate. Yet, while innovating
firms grew more quickly than non-innovators, their productivity performance following innovation
was, on average, no better.
This pattern was not uniform across all types of firms. For instance, among younger firms
(particularly those aged 5-10 years), those that engaged in most types of innovation exhibited
significantly higher growth in MFP in the following three years than non-innovators. The effect
was especially strong among the small group of firms that introduced a product innovation new
to the world – their productivity increased on average by 22% in the following three years,
The lack of a productivity dividend across most innovative New Zealand firms is concerning.
Numerous international studies show that innovation is a key driver of productivity growth in
many countries, so what is it about the New Zealand environment that undermines the positive
impact of innovation on firm productivity? New Zealand’s unusual combination of a small
domestic market, a thinly spread population, and distance from foreign markets may mean that
the benefits of innovating relative to the costs are lower for New Zealand firms.
Translating knowledge into productivity growth is not a straightforward mechanical process. To
successfully innovate and make the most of new technology, firms need to reinvent many
aspects of their operation, including process and service design, software development,
organisation structure and marketing. This requires considerable management expertise to
orchestrate all these aspects and an “all-of-firm” innovation mindset. This can be a daunting
challenge for firms and will also depend on factors outside their immediate control such as the
availability of specialised skills or other inputs. This, in turn, indicates the importance of a
supportive “innovation eco-system”.
A recent study asked a sample of New Zealand firms about their motives for innovation and R&D,
the constraints to undertaking them and government support. It found that most businesses who
want to innovate can do so, and that non-innovating businesses see little reason to innovate,
which may reflect that their costs of innovating exceed the benefits perhaps due to a lack of
competition and opportunities in their industry. Businesses reported limits on money, time and
skills as the main constraints to innovation. Government action could help, for instance, by
improving the skills system to better meet industry’s needs and ensuring that regulations support
innovation (Pells & Howard, 2019).
Other potential causes of limited innovation and weak effects of innovation on productivity in
New Zealand are explored below.
Diffusion
Diffusion of technology from frontier firms to other firms may be particularly important in New
Zealand, given remoteness from foreign markets and weak international connections. This
section focuses on the convergence of lagging firms to the national frontier, as an indicator of
how quickly firms are adopting new technologies and catching up to the frontier.
Productivity-enhancing ideas and technologies diffuse differently in different industries and
regions. Therefore, the speed with which low-productivity firms converge towards the frontier
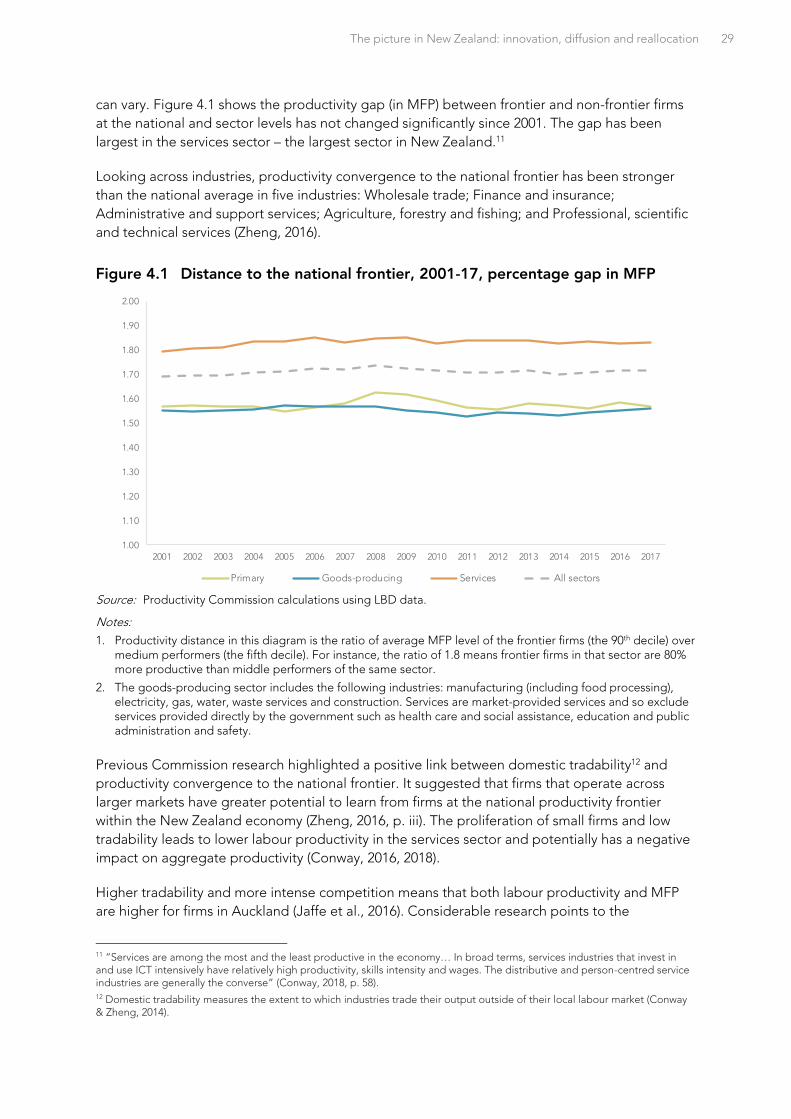
The picture in New Zealand: innovation, diffusion and reallocation 29
can vary. Figure 4.1 shows the productivity gap (in MFP) between frontier and non-frontier firms
at the national and sector levels has not changed significantly since 2001. The gap has been
largest in the services sector – the largest sector in New Zealand.11
Looking across industries, productivity convergence to the national frontier has been stronger
than the national average in five industries: Wholesale trade; Finance and insurance;
Administrative and support services; Agriculture, forestry and fishing; and Professional, scientific
and technical services (Zheng, 2016).
Figure 4.1 Distance to the national frontier, 2001-17, percentage gap in MFP
Source: Productivity Commission calculations using LBD data.
Notes:
1. Productivity distance in this diagram is the ratio of average MFP level of the frontier firms (the 90th decile) over medium performers (the fifth decile). For instance, the ratio of 1.8 means frontier firms in that sector are 80% more productive than middle performers of the same sector.
2. The goods-producing sector includes the following industries: manufacturing (including food processing), electricity, gas, water, waste services and construction. Services are market-provided services and so exclude services provided directly by the government such as health care and social assistance, education and public administration and safety.
Previous Commission research highlighted a positive link between domestic tradability12 and
productivity convergence to the national frontier. It suggested that firms that operate across
larger markets have greater potential to learn from firms at the national productivity frontier
within the New Zealand economy (Zheng, 2016, p. iii). The proliferation of small firms and low
tradability leads to lower labour productivity in the services sector and potentially has a negative
impact on aggregate productivity (Conway, 2016, 2018).
Higher tradability and more intense competition means that both labour productivity and MFP
are higher for firms in Auckland (Jaffe et al., 2016). Considerable research points to the
11 “Services are among the most and the least productive in the economy… In broad terms, services industries that invest in and use ICT intensively have relatively high productivity, skills intensity and wages. The distributive and person-centred service industries are generally the converse” (Conway, 2018, p. 58). 12 Domestic tradability measures the extent to which industries trade their output outside of their local labour market (Conway & Zheng, 2014).
1.00
1.10
1.20
1.30
1.40
1.50
1.60
1.70
1.80
1.90
2.00
2001 2002 2003 2004 2005 2006 2007 2008 2009 2010 2011 2012 2013 2014 2015 2016 2017
Primary Goods-producing Services All sectors
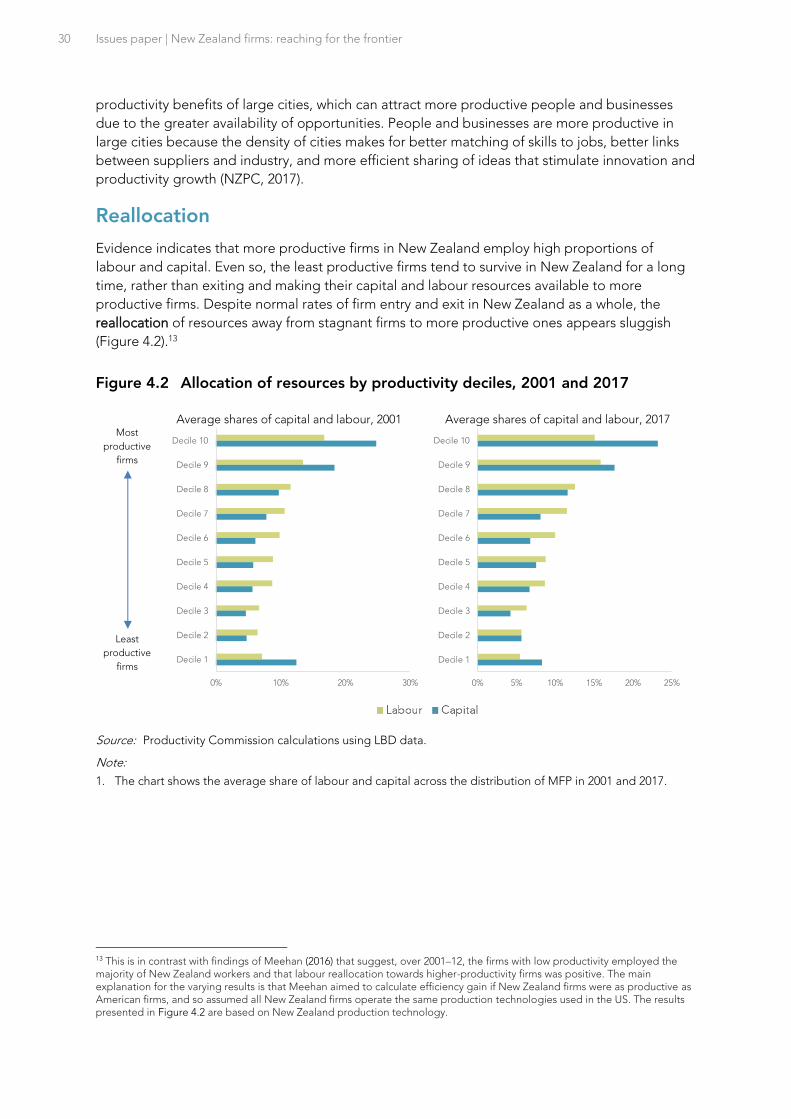
30 Issues paper | New Zealand firms: reaching for the frontier
productivity benefits of large cities, which can attract more productive people and businesses
due to the greater availability of opportunities. People and businesses are more productive in
large cities because the density of cities makes for better matching of skills to jobs, better links
between suppliers and industry, and more efficient sharing of ideas that stimulate innovation and
productivity growth (NZPC, 2017).
Reallocation
Evidence indicates that more productive firms in New Zealand employ high proportions of
labour and capital. Even so, the least productive firms tend to survive in New Zealand for a long
time, rather than exiting and making their capital and labour resources available to more
productive firms. Despite normal rates of firm entry and exit in New Zealand as a whole, the
reallocation of resources away from stagnant firms to more productive ones appears sluggish
(Figure 4.2).13
Figure 4.2 Allocation of resources by productivity deciles, 2001 and 2017
Average shares of capital and labour, 2001 Average shares of capital and labour, 2017 Most
productive
firms
Least
productive
firms
Source: Productivity Commission calculations using LBD data.
Note:
1. The chart shows the average share of labour and capital across the distribution of MFP in 2001 and 2017.
13 This is in contrast with findings of Meehan (2016) that suggest, over 2001–12, the firms with low productivity employed the majority of New Zealand workers and that labour reallocation towards higher-productivity firms was positive. The main explanation for the varying results is that Meehan aimed to calculate efficiency gain if New Zealand firms were as productive as American firms, and so assumed all New Zealand firms operate the same production technologies used in the US. The results presented in Figure 4.2 are based on New Zealand production technology.
0% 10% 20% 30%
Decile 1
Decile 2
Decile 3
Decile 4
Decile 5
Decile 6
Decile 7
Decile 8
Decile 9
Decile 10
2001
Labour share Capital share
0% 5% 10% 15% 20% 25%
Decile 1
Decile 2
Decile 3
Decile 4
Decile 5
Decile 6
Decile 7
Decile 8
Decile 9
Decile 10
2017
Labour share Capital share

The picture in New Zealand: innovation, diffusion and reallocation 31
Drivers of weak innovation, diffusion and reallocation in New Zealand
Recent research offers a range of potential explanations for why the processes of innovation,
diffusion and reallocation may not be happening as well as they could be in New Zealand. Some
possible explanations include:
Weak international connections. For many New Zealand firms, innovation means adopting
and adapting innovations developed elsewhere, and it is through international links that they
are exposed to new and innovative ways of operating (Pells & Howard, 2019). OECD research
has shown that spillovers from the global frontier are stronger in economies that are more
connected globally via trade, investment and people flows, and integration in global value
chains (Saia et al., 2015). The New Zealand economy’s relatively weak international
connections could be limiting opportunities for local firms to learn from those at the global
frontier. It could also be limiting local firms’ access to valuable skills and experience acquired
internationally. It could be challenging for many New Zealand firms to offer the pay and
incentives needed to attract and hold on to in-demand talent, including highly skilled Kiwis
living abroad.
Lack of competition. Competition is a driver of both diffusion and reallocation, because it
puts pressure on firms to innovate and improve productivity and can also drive improvements
in managerial capability. Recent research on 39 industries from 2001-16 found that changes in
competition in New Zealand had not been particularly pronounced (D. Maré & Fabling, 2019;
Schiff & Singh, 2019). Competitive pressures in New Zealand are likely to be weak. Distance
from international trading partners dilutes competitive pressures, and many New Zealand
firms operate in small local markets where they are relatively insulated from competition
(Barker, 2017). Competition can encourage managers to undertake productivity-raising
actions that they otherwise may not. As Maré and Fabling (2019) put it, “competition acts as a
discipline on firms.”
Small markets. The “extent of the market” influences the productivity benefits that firms can
capture from innovation. Firms operating in New Zealand’s small domestic markets and who
are distant from foreign markets may struggle to fully exploit the productivity benefits that
can come from innovation. For example, small markets limit the ability of innovative firms to
achieve the scale necessary to realise the benefits of new knowledge.
Lack of managerial capability. New Zealand firms’ ability to learn (absorptive capacity) is
important for their ability to innovate and improve their productivity. Harris and Le (2018)
found that the ability of New Zealand firms to make use of external knowledge is related to
their propensity to undertake R&D, innovate and export, (controlling for other firm
characteristics such as foreign ownership and employee skill levels). This finding reinforces
the importance of management practices. Fabling and Grimes (2014) found, in a sample of
over 1 500 New Zealand firms surveyed in 2001 and 2005, that firms that introduced a suite of
high-performance practices in human resource management (HRM) raised their productivity.
Yet, New Zealand has a relatively large number of firms with poor management practices
(Green & Agarwal, 2011). Understanding the reasons behind poor management capability is
an important area of ongoing research (Sanderson, 2018).
Lack of investment in innovation, and research and development activity. A well-functioning
national innovation system can test and demonstrate new technologies, help firms identify
opportunities for change, and foster business and research links (Pells & Howard, 2019).
32 Issues paper | New Zealand firms: reaching for the frontier
Evidence from other OECD countries indicates that investment in innovation and R&D has
strong positive effects on productivity (de Serres et al., 2014). However, New Zealand
research has so far suggested that innovation has rather weak effects on productivity (see
earlier section). Also, Chappell and Jaffe (2018) found no relationship between firms’
investment in intangible assets and either productivity or profitability. de Serres et al (2014)
found that New Zealand’s low intensity of R&D investment could account for a substantial
portion of the country’s productivity gap. The low intensity is perhaps simply reflective of the
low returns to these types of investments.
Underdeveloped investment and capital markets. Underdeveloped financial markets make it
difficult for innovative firms to attract resources and grow. Business capital investment in New
Zealand is low compared to other OECD countries. Firms may not have enough options to
fund capital expenditure, with relatively thin angel and venture capital markets. Their lack of
development may in part be a reflection of New Zealand’s low household saving rates
(Barker, 2017).
Organisational form and governance. How a firm is organised and governed affects
productivity by how effectively it can formulate good strategies, match workers to tasks,
assemble and orchestrate complementary assets, and leverage skill and knowledge
differences across workers to match production processes (OECD GFP team, 2019).
Organisational innovation is also often required to match technological innovation. But
traditional governance practices may not be well-suited to fostering innovation, or adapting
to changes in the operating environment (Institute of Directors & MinterEllisonRuddWatts,
2019). Further, organisational forms (ie, whether a firm is a co-operative, state owned, private
or publicly listed company) vary in how effectively they can respond to their environment and
to changing pressures.
The picture in New Zealand – a summary
At this stage of its inquiry, the Commission is still building a picture of New Zealand’s frontier
and non-frontier firms. Where evidence is weak or mixed, the Commission intends to do more
work to establish the facts. Bearing this in mind, and that these findings are tentative, the picture
looks something like the following:
New Zealand’s frontier firms are mostly well behind global frontier firms in their levels and
growth rates of productivity.
Indications are that the distribution of New Zealand firms in terms of their productivity is
wider than in many OECD comparator countries.
The productivity distribution is not widening over time in New Zealand. This means that firms
at the domestic frontier are not widening the gap with non-frontier firms unlike what is
happening globally. This is probably because of the sluggish productivity growth of New
Zealand frontier firms.
Interestingly, the productivity gap between frontier and non-frontier firms also appears not to
be widening in some other small OECD economies such as Australia and Denmark.
Tentative conclusions are that the origins of New Zealand’s underperformance lie in three
areas
The picture in New Zealand: innovation, diffusion and reallocation 33
- The under-performance of New Zealand frontier firms compared to global frontier firms is
indicative a range of potential problems such as weaknesses in innovation, international
connections, managerial capability and ownership structures.
- although New Zealand non-frontier firms are not falling further behind the domestic
frontier, the wide distribution is indicative of weak competition mainly due to small
isolated local markets; and
- while most resources of capital and labour are located in firms in the top three
productivity deciles (which is good), this distribution of capital and labour is static over
time suggesting weak market dynamism in reallocating resources to higher productivity
firms.
Q10 To what extent do you agree with the Commission’s tentative picture of
why New Zealand’s frontier and non-frontier firms are underperforming?
Q11 In your view, why does it appear that the productivity of frontier firms in
New Zealand has not grown faster than non-frontier firms, unlike the
situation globally?
Q12 What explains the research finding of a weak connection between
innovation and productivity growth among New Zealand firms?
Q13 What are the main challenges for New Zealand firms that aspire to reach
the performance of the best firms globally?
Q14 Are New Zealand firms ambitious about growing and scaling up? If not,
why not? If they are, what's getting in their way?
Q15 How do New Zealand’s frontier firms learn about, adapt and adopt cutting
edge technologies and practices?
Q16 What types of international connections make the biggest difference for
diffusion from the global to the domestic frontier? What could be done to
improve these kinds of connections?
Q17 Do frontier firms have a problem sustaining their performance? What is
needed to maintain high productivity over the long-term?
34 Issues paper | New Zealand firms: reaching for the frontier
Q18 Why don’t other firms follow the example of frontier firms? What’s holding
them back?
Q19 How could the lessons from New Zealand’s frontier firms be better shared?
Q20 How do different types of corporate form and ownership structure affect
firms’ incentives to innovate, grow and internationalise?
Q21 What are the pros and cons of the standard corporate governance model
for stimulating business growth, innovation and productivity?
Q22 Are there particular barriers to innovation, diffusion and reallocation that
the Commission should focus on?
Māori frontier firms 35
5 Māori frontier firms
Increasing the productivity of Māori firms and, in turn, the Māori asset base could support
industrial and regional development (along with, of course, improved social outcomes) and
provide valuable lessons on how to lift the productivity of Kiwi firms more generally. The ToR for
the inquiry therefore direct the Commission to:
investigate the economic contribution of Māori frontier firms. In particular, the Commission
should consider, having consulted with Māori firms:
what challenges/constraints, and what resources/opportunities, are unique or greater for Māori firms at the frontier; and
how the diffusion of technology or practices from Māori frontier firms may be different from other frontier firms.
The Commission is especially interested in ways in which non-Māori frontier firms may be able to
learn from Māori frontier firms. There would be value in greater recognition of the benefits of
Te Ao Māori approaches and wisdom (Oram, 2020).
History and context
The Māori economy, including Māori businesses and the Māori asset base, reflects its unique
culture and history. Pre-colonial Māori communities operated their own economy, with land and
other resources held in collective ownership (Te Puni Kōkiri & Federation of Māori Authorities,
2006). Māori traded with the early settlers and other British colonies and Māori collective
enterprise thrived during the early years of colonisation (NZIER, 2003). However, through the
subsequent decades, including the New Zealand wars and continuing into the 20th century, Māori
were disenfranchised from their lands, and suffered significant losses to their population, assets,
culture, mana and language.
In the 1930s, Māori-owned land-based businesses became incorporated under special Acts of
Parliament. Treaty of Waitangi settlements from the 1990s onwards have strengthened the Māori
asset base, contributing to its focus on land-based and fisheries industries. Treaty negotiations
processes also led to the legal recognition of Post-Settlement Governance Entities (PSGEs) –
which went on to hold and invest the proceeds of Treaty settlements.
Today, the Māori economy is characterised by a range of organisational forms, including
collectively-owned Māori Freehold Land Incorporations and Trusts, other trusts, PSGEs,
pan-tribal (such as the Federation of Māori Authorities) or localised Māori organisations (such as
Māori health and social services providers), private companies and self-employment. These are
structured under several legal frameworks such as Te Ture Whenua Māori Act, Companies Act,
Charitable Trusts Act, Māori Trust Boards Act, statutory bodies and publicly listed companies, as
well as tribal entities legally recognised in association with Treaty settlements (Te Puni Kōkiri &
Federation of Māori Authorities, 2006).
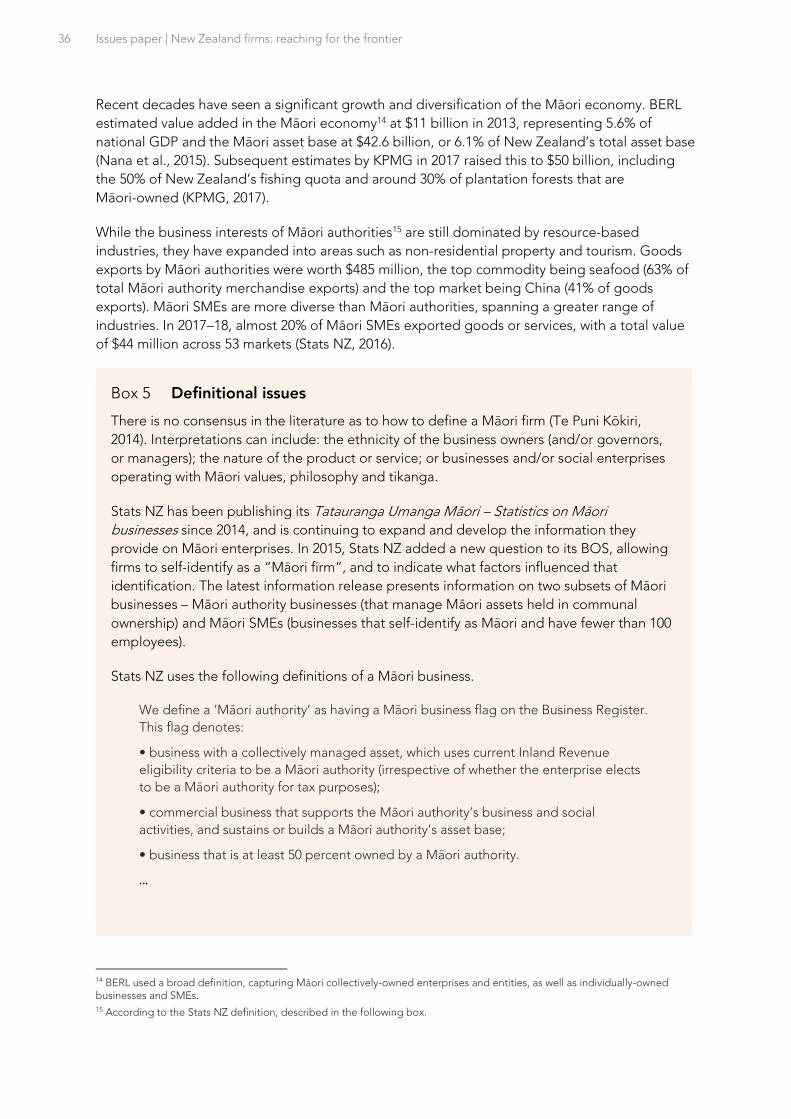
36 Issues paper | New Zealand firms: reaching for the frontier
Recent decades have seen a significant growth and diversification of the Māori economy. BERL
estimated value added in the Māori economy14 at $11 billion in 2013, representing 5.6% of
national GDP and the Māori asset base at $42.6 billion, or 6.1% of New Zealand’s total asset base
(Nana et al., 2015). Subsequent estimates by KPMG in 2017 raised this to $50 billion, including
the 50% of New Zealand’s fishing quota and around 30% of plantation forests that are
Māori-owned (KPMG, 2017).
While the business interests of Māori authorities15 are still dominated by resource-based
industries, they have expanded into areas such as non-residential property and tourism. Goods
exports by Māori authorities were worth $485 million, the top commodity being seafood (63% of
total Māori authority merchandise exports) and the top market being China (41% of goods
exports). Māori SMEs are more diverse than Māori authorities, spanning a greater range of
industries. In 2017–18, almost 20% of Māori SMEs exported goods or services, with a total value
of $44 million across 53 markets (Stats NZ, 2016).
14 BERL used a broad definition, capturing Māori collectively-owned enterprises and entities, as well as individually-owned businesses and SMEs. 15 According to the Stats NZ definition, described in the following box.
Box 5 Definitional issues
There is no consensus in the literature as to how to define a Māori firm (Te Puni Kōkiri,
2014). Interpretations can include: the ethnicity of the business owners (and/or governors,
or managers); the nature of the product or service; or businesses and/or social enterprises
operating with Māori values, philosophy and tikanga.
Stats NZ has been publishing its Tatauranga Umanga Māori – Statistics on Māori
businesses since 2014, and is continuing to expand and develop the information they
provide on Māori enterprises. In 2015, Stats NZ added a new question to its BOS, allowing
firms to self-identify as a “Māori firm”, and to indicate what factors influenced that
identification. The latest information release presents information on two subsets of Māori
businesses – Māori authority businesses (that manage Māori assets held in communal
ownership) and Māori SMEs (businesses that self-identify as Māori and have fewer than 100
employees).
Stats NZ uses the following definitions of a Māori business.
We define a ‘Māori authority’ as having a Māori business flag on the Business Register.
This flag denotes:
• business with a collectively managed asset, which uses current Inland Revenue
eligibility criteria to be a Māori authority (irrespective of whether the enterprise elects
to be a Māori authority for tax purposes);
• commercial business that supports the Māori authority’s business and social
activities, and sustains or builds a Māori authority’s asset base;
• business that is at least 50 percent owned by a Māori authority.
…
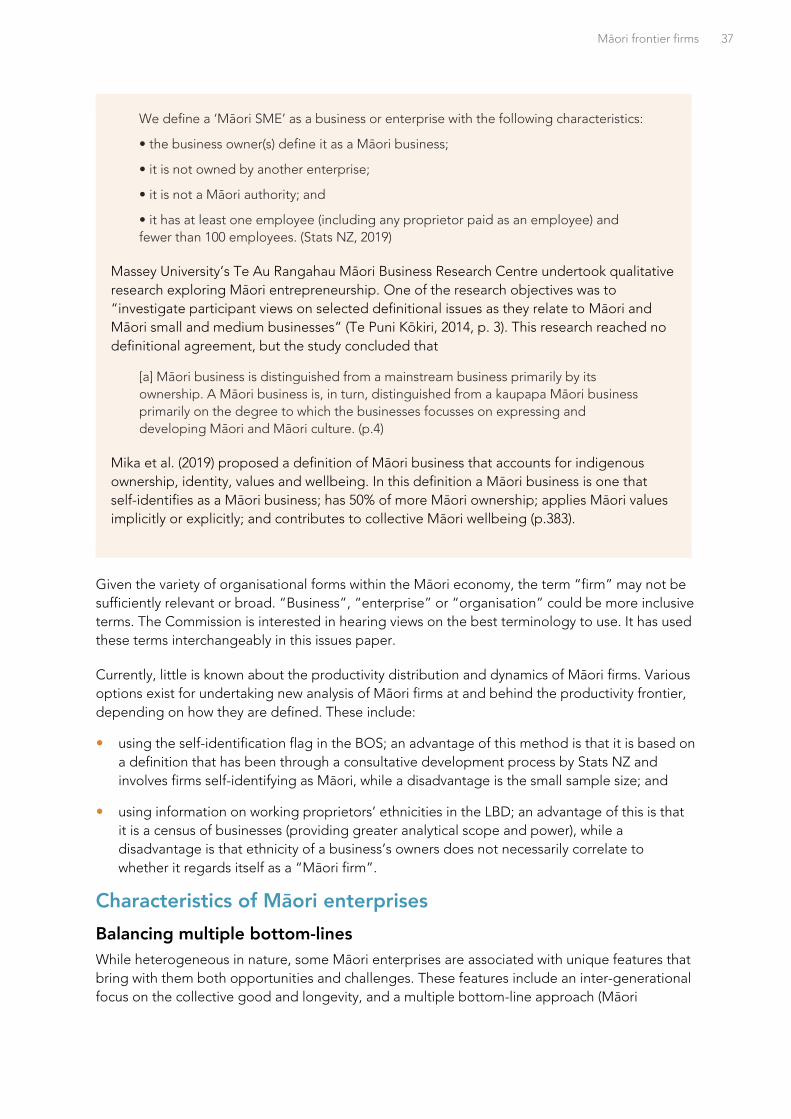
Māori frontier firms 37
Given the variety of organisational forms within the Māori economy, the term “firm” may not be
sufficiently relevant or broad. “Business”, “enterprise” or “organisation” could be more inclusive
terms. The Commission is interested in hearing views on the best terminology to use. It has used
these terms interchangeably in this issues paper.
Currently, little is known about the productivity distribution and dynamics of Māori firms. Various
options exist for undertaking new analysis of Māori firms at and behind the productivity frontier,
depending on how they are defined. These include:
using the self-identification flag in the BOS; an advantage of this method is that it is based on
a definition that has been through a consultative development process by Stats NZ and
involves firms self-identifying as Māori, while a disadvantage is the small sample size; and
using information on working proprietors’ ethnicities in the LBD; an advantage of this is that
it is a census of businesses (providing greater analytical scope and power), while a
disadvantage is that ethnicity of a business’s owners does not necessarily correlate to
whether it regards itself as a “Māori firm”.
Characteristics of Māori enterprises
Balancing multiple bottom-lines
While heterogeneous in nature, some Māori enterprises are associated with unique features that
bring with them both opportunities and challenges. These features include an inter-generational
focus on the collective good and longevity, and a multiple bottom-line approach (Māori
We define a ‘Māori SME’ as a business or enterprise with the following characteristics:
• the business owner(s) define it as a Māori business;
• it is not owned by another enterprise;
• it is not a Māori authority; and
• it has at least one employee (including any proprietor paid as an employee) and
fewer than 100 employees. (Stats NZ, 2019)
Massey University’s Te Au Rangahau Māori Business Research Centre undertook qualitative
research exploring Māori entrepreneurship. One of the research objectives was to
“investigate participant views on selected definitional issues as they relate to Māori and
Māori small and medium businesses” (Te Puni Kōkiri, 2014, p. 3). This research reached no
definitional agreement, but the study concluded that
[a] Māori business is distinguished from a mainstream business primarily by its
ownership. A Māori business is, in turn, distinguished from a kaupapa Māori business
primarily on the degree to which the businesses focusses on expressing and
developing Māori and Māori culture. (p.4)
Mika et al. (2019) proposed a definition of Māori business that accounts for indigenous
ownership, identity, values and wellbeing. In this definition a Māori business is one that
self-identifies as a Māori business; has 50% of more Māori ownership; applies Māori values
implicitly or explicitly; and contributes to collective Māori wellbeing (p.383).
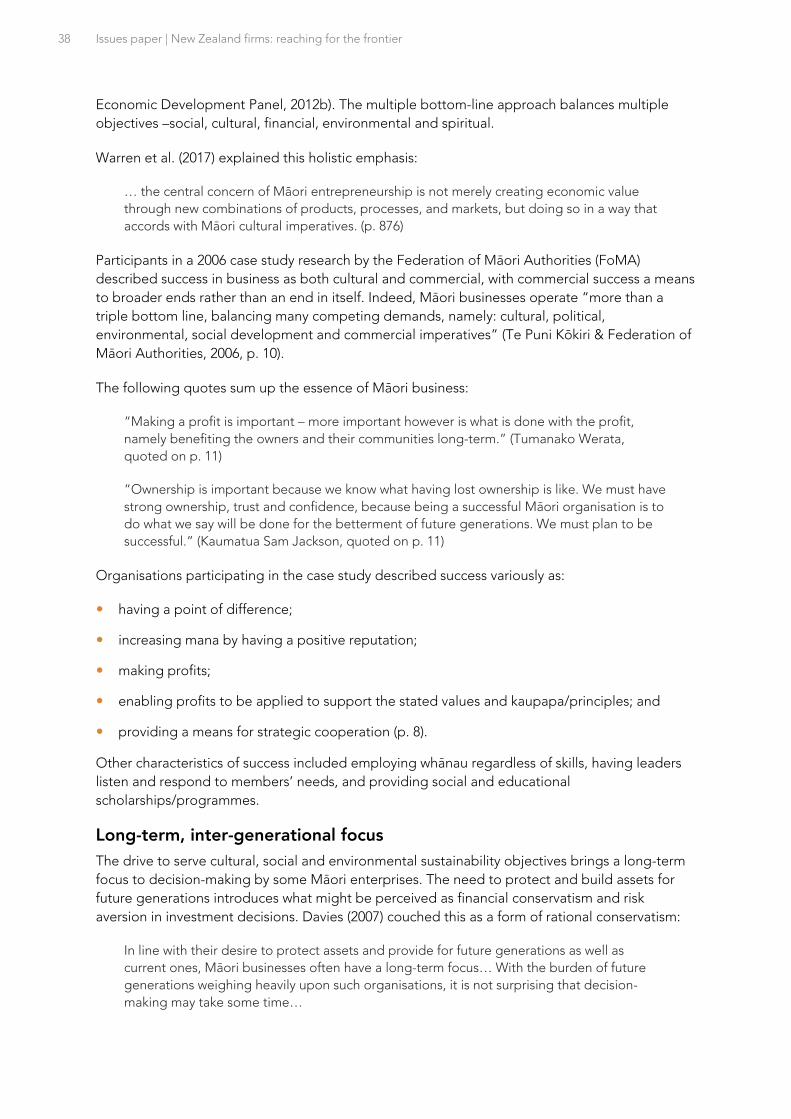
38 Issues paper | New Zealand firms: reaching for the frontier
Economic Development Panel, 2012b). The multiple bottom-line approach balances multiple
objectives –social, cultural, financial, environmental and spiritual.
Warren et al. (2017) explained this holistic emphasis:
… the central concern of Māori entrepreneurship is not merely creating economic value
through new combinations of products, processes, and markets, but doing so in a way that
accords with Māori cultural imperatives. (p. 876)
Participants in a 2006 case study research by the Federation of Māori Authorities (FoMA)
described success in business as both cultural and commercial, with commercial success a means
to broader ends rather than an end in itself. Indeed, Māori businesses operate “more than a
triple bottom line, balancing many competing demands, namely: cultural, political,
environmental, social development and commercial imperatives” (Te Puni Kōkiri & Federation of
Māori Authorities, 2006, p. 10).
The following quotes sum up the essence of Māori business:
“Making a profit is important – more important however is what is done with the profit,
namely benefiting the owners and their communities long-term.” (Tumanako Werata,
quoted on p. 11)
“Ownership is important because we know what having lost ownership is like. We must have
strong ownership, trust and confidence, because being a successful Māori organisation is to
do what we say will be done for the betterment of future generations. We must plan to be
successful.” (Kaumatua Sam Jackson, quoted on p. 11)
Organisations participating in the case study described success variously as:
having a point of difference;
increasing mana by having a positive reputation;
making profits;
enabling profits to be applied to support the stated values and kaupapa/principles; and
providing a means for strategic cooperation (p. 8).
Other characteristics of success included employing whānau regardless of skills, having leaders
listen and respond to members’ needs, and providing social and educational
scholarships/programmes.
Long-term, inter-generational focus
The drive to serve cultural, social and environmental sustainability objectives brings a long-term
focus to decision-making by some Māori enterprises. The need to protect and build assets for
future generations introduces what might be perceived as financial conservatism and risk
aversion in investment decisions. Davies (2007) couched this as a form of rational conservatism:
In line with their desire to protect assets and provide for future generations as well as
current ones, Māori businesses often have a long-term focus… With the burden of future
generations weighing heavily upon such organisations, it is not surprising that decision-
making may take some time…
Māori frontier firms 39
Taking a longer-term view, Māori businesses are perhaps content to eschew high-risk/high-
return opportunities in favour of safer options. While there might be some support for
having a portfolio that includes both alternatives, and options in between, it is perhaps not
irrational to pursue a low risk strategy when playing in a longer-term game. (Davies, 2007,
pp. 14–15)
This financial conservatism is echoed in the available data. Figures from the Annual Enterprise
Survey showed that, over 2012-14, Māori authorities exhibited a “strong, conservative and
growing financial stance”. Stats NZ observed that this “low-leverage, low-risk” financial position
is “more typical of public institutions than business” (Stats NZ, 2016, p. 19).
A cautious approach to investment may have implications for the pace at which some Māori
enterprises grow and keep up with the frontier (eg, by adopting the latest technologies or
business models), or experiment and innovate at the frontier.
The value of cultural connections
Cultural affinity with international counterparts, including indigenous enterprises, can provide
Māori businesses with a valuable edge and help open up overseas markets. For example, the
success of Māori trade missions to China has been attributed to cultural similarities between the
Māori and Chinese peoples. This includes the importance of values and relationships in business,
and an intergenerational view of investment and common (though distant) ancestry (Mika & Ross,
2019; Tomoana, 2020).
Unique branding value and features
Māori cultural values such as kaitiakitanga, kōtahitanga and whanaungatanga can differentiate
Māori goods and services and provide added brand value overseas. They are also closely
aligned with growing interest globally in environmental sustainability and corporate social
responsibility (KPMG, 2017). Harmsworth and Tahi (2008) found that cultural brand distinctiveness
is becoming a significant asset, and Māori branding (Tohu Māori) may provide Māori businesses
with a competitive advantage in some markets. Tohu Māori is also used by non-Māori businesses
and contributes to the value of “Brand NZ”. This gives rise to concerns around cultural
appropriation of Tohu Māori, and the authors emphasised the need for adequate protections
and processes around the use of indigenous branding.16
Innovative and entrepreneurial
Māori have a long tradition of entrepreneurship, innovation and technology adoption. While this
entrepreneurial spirit was constrained by the impact of colonisation, recent decades have seen a
revival in Māori entrepreneurial activity. Today, Māori enterprises extend into a variety of
high-tech industries, as well as innovative social enterprises.
Data from the BOS show that both Māori authorities and Māori SMEs have higher innovation
rates compared to New Zealand businesses overall. One-third of Māori authorities and 19% of
Māori SMEs sampled in the 2015 BOS reported no barriers to innovation at all. Māori authorities
reported low levels of concern about access to intellectual property rights and government
regulation, compared to businesses in general. Stats NZ posited that this lower level of concern
“may reflect Māori authorities’ unique status as kawanatanga-mana holders (or governance
16 Broader issues around Māori intellectual property rights related to indigenous flora and fauna were raised in the Wai 262 claim, and are being considered as part of a whole-of-government response.
40 Issues paper | New Zealand firms: reaching for the frontier
authorities) and kaitiaki (guardians) over Māori intellectual property and governance” (Stats NZ,
2016, p. 15).
Challenges
A commonly-identified challenge for Māori enterprises is access to capital. For Māori Freehold
Land Incorporations and Trusts, barriers to finance can be higher than non-Māori enterprises,
due to factors such as:
limited relationships between Māori and financial institutions;
collective ownership;
assets not able to be used as collateral (due to the inalienability of many Māori assets);
conservative governance, itself a response to Te Ture Whenua Māori Act 1993; and
a history of loss of land and rights (Te Puni Kōkiri & Federation of Māori Authorities, 2006).
Collectively-owned Māori organisations may also operate with additional legislative
requirements (compared to non-Māori organisations), leading to higher compliance costs. For
Māori entrepreneurs, barriers to start-up or working capital can include relatively low incomes,
lower home ownership rates, and the lack of a business track record (NZIER, 2003).
Qualitative research in 2014 into Māori entrepreneurship identified accessing finance and
compliance costs as key challenges for Māori businesses. For the business owners interviewed in
the study, their start-up was primarily financed by them and their whānau. For whānau-run
businesses, all whānau members were expected to contribute both financially and in-kind.
Compliance costs included those relating to tax and local authority costs. Most participants
thought that accessing information about government assistance for businesses was difficult, and
found it hard to relate culturally to the people fronting these organisations (Te Puni Kōkiri, 2014).
The Government’s 2012 Māori economic development strategy and action plan also identified
barriers to Māori business growth. These included:
difficulty raising capital;
a disconnect between Māori businesses and business services provided by Government
aimed at building management capabilities;
Māori entities being constrained in using their assets due to complex regulatory settings and
central and local government rules and actions (including legislative impediments,
coordination issues and capability gaps);
Māori enterprises and collectives not being effectively linked into the innovation system
(including CRIs, universities and incubators);
current structures for the governance of collectively-owned Māori assets not necessarily
being conducive to making the best use of them; and
the fragmentation (and hence lack of scale) of many small collectives and small settlements
(Māori Economic Development Panel, 2012a).
Opportunities for productivity growth
Te Puni Kōkiri commissioned NZIER to scope the opportunities for lifting Māori productivity
(Ballingall & Bailey, 2010). The report drew on data from 2003-07. It found that Māori asset
Māori frontier firms 41
productivity17 was relatively low in primary industries (driven by high asset-to-labour ratios), but
relatively high in education, property, health and community services.
The report identified the following barriers to improving Māori asset productivity.
multiple (collective) ownership, which makes communication, land use decision-making, and
access to finance difficult;
issues with governance and management, including a lack of people with planning and
decision-making expertise – although NZIER was of the view that Māori leadership and
management ability may be understated in the literature;
limited information on current and potential Māori land use;
difficulty accessing some Māori land; and
problems dealing with local authorities attempting to recover rates arrears.
Concerning the lifting of labour productivity and MFP, the report highlighted the importance of
training and education. It noted that improving Māori educational outcomes would likely flow
through into productivity improvements. The report also emphasised the importance of
diversifying the Māori economic asset base to avoid over-reliance on any one sector.
The 2006 FoMA study explained that there has been increasing financial acumen over time, and
that most banks and financial institutions have put in place dedicated personnel familiar with
Māori Freehold Land Incorporations and Trusts. This growing financial capability has resulted in
financial institutions better understanding Māori, better access to finance, a growing asset base
and improved financial performance (Te Puni Kōkiri & Federation of Māori Authorities, 2006). The
report also explained that:
… [e]stablishing subsidiary companies or overview trusts for amalgamation of poor
performing or non-active assets/lands plays a major part in improving performance. A range
of subsidiary companies has been established to enable partnerships and joint ventures to
take advantage of opportunities and to share risk. (p.9)
Participants in the 2014 study noted above discussed their plans for business growth. Efficiency
improvements gained through computerised systems and other technologies were recognised
as generating productivity and quality benefits, due to the time freed up for monitoring staff
training. However, while business growth is important, “lifestyle and commitment to whānau
tended to be paramount for business owners” (Te Puni Kōkiri, 2014, p. 27). Suggestions for
support that would assist business growth included: an accessible database of expertise; advice
on training and education, financial and investment issues; and business networks.
For Māori Freehold Land Incorporations and Trusts, and to a lesser extent PGSEs, a key
challenge is maximising productivity subject to the current legislative constraints. Ways of
mitigating these constraints can include developing structural options (for example PSGEs often
establish social and commercial arms), and establishing robust decision-making processes (often
requiring that more time is built in) and governance (particularly in the case of collective
ownership). In the longer-term, legislative changes might help improve the opportunities and
incentives for productivity growth. For example, changes to the Māori Land Act to help
incentivise productive use of Māori Freehold Land could be considered.
17 Asset productivity is often defined as the revenue generated per unit of asset.

42 Issues paper | New Zealand firms: reaching for the frontier
Q23 How should this inquiry think about and define a Māori frontier firm?
Q24 What resources/opportunities and constraints/barriers are unique or
greater for Māori frontier firms, compared to non-Māori firms?
How do these opportunities and constraints vary by the organisational
form of the Māori entity?
How do Māori firms maximise opportunities within these constraints?
What would help mitigate barriers or enable Māori firms to better
maximise their potential?
Q25 How are knowledge, technology and practices diffused from Māori frontier
firms to other Māori and/or non-Māori firms? In what ways does this differ
from diffusion from non-Māori firms? How can these diffusion mechanisms
be strengthened?
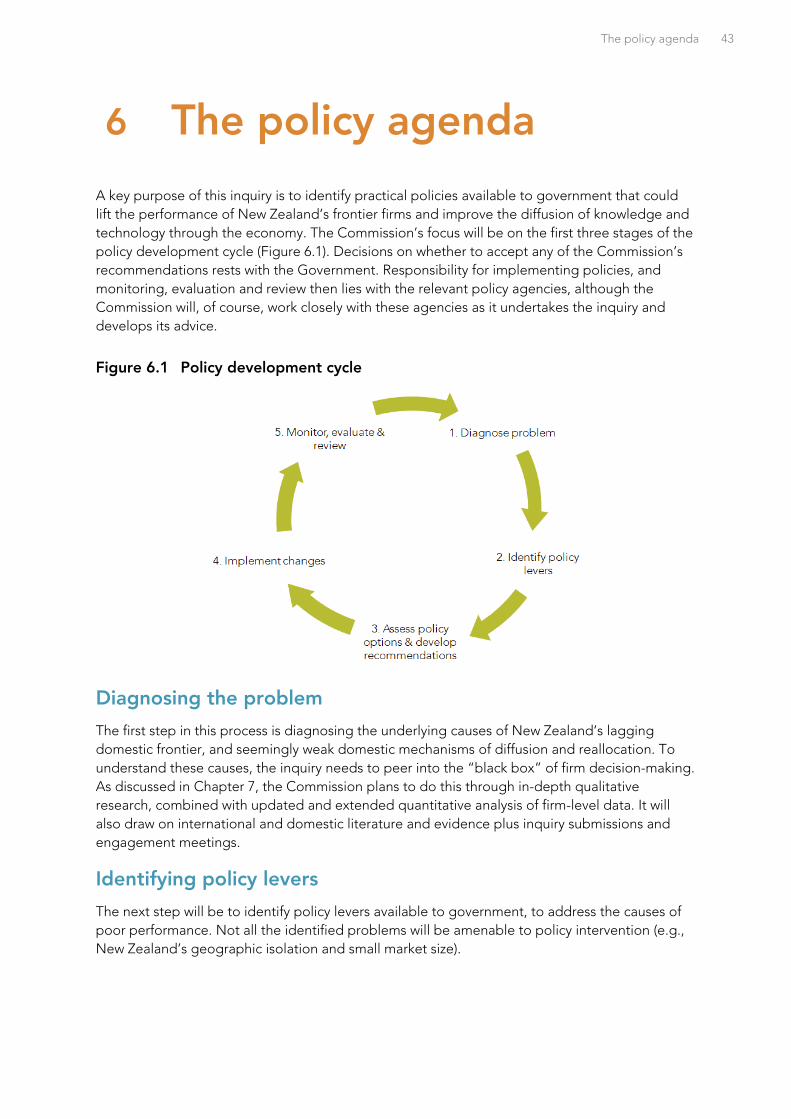
The policy agenda 43
6 The policy agenda
A key purpose of this inquiry is to identify practical policies available to government that could
lift the performance of New Zealand’s frontier firms and improve the diffusion of knowledge and
technology through the economy. The Commission’s focus will be on the first three stages of the
policy development cycle (Figure 6.1). Decisions on whether to accept any of the Commission’s
recommendations rests with the Government. Responsibility for implementing policies, and
monitoring, evaluation and review then lies with the relevant policy agencies, although the
Commission will, of course, work closely with these agencies as it undertakes the inquiry and
develops its advice.
Figure 6.1 Policy development cycle
Diagnosing the problem
The first step in this process is diagnosing the underlying causes of New Zealand’s lagging
domestic frontier, and seemingly weak domestic mechanisms of diffusion and reallocation. To
understand these causes, the inquiry needs to peer into the “black box” of firm decision-making.
As discussed in Chapter 7, the Commission plans to do this through in-depth qualitative
research, combined with updated and extended quantitative analysis of firm-level data. It will
also draw on international and domestic literature and evidence plus inquiry submissions and
engagement meetings.
Identifying policy levers
The next step will be to identify policy levers available to government, to address the causes of
poor performance. Not all the identified problems will be amenable to policy intervention (e.g.,
New Zealand’s geographic isolation and small market size).
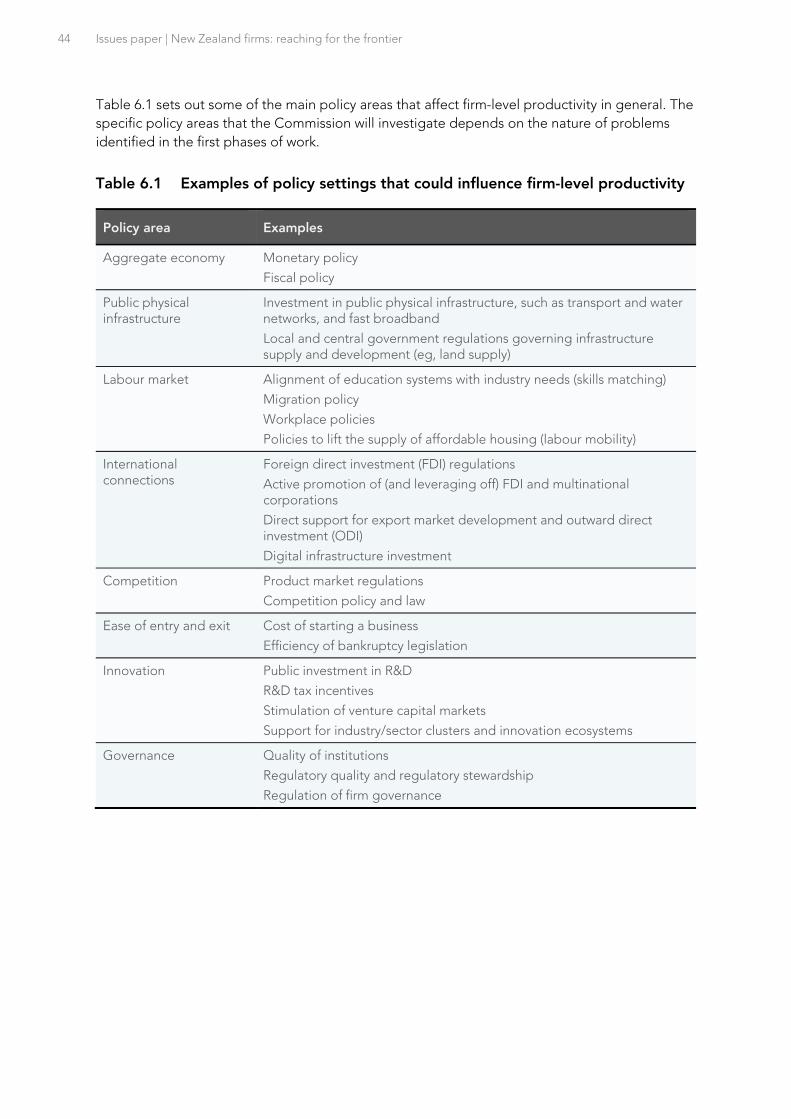
44 Issues paper | New Zealand firms: reaching for the frontier
Table 6.1 sets out some of the main policy areas that affect firm-level productivity in general. The
specific policy areas that the Commission will investigate depends on the nature of problems
identified in the first phases of work.
Table 6.1 Examples of policy settings that could influence firm-level productivity
Policy area Examples
Aggregate economy Monetary policy
Fiscal policy
Public physical infrastructure
Investment in public physical infrastructure, such as transport and water networks, and fast broadband
Local and central government regulations governing infrastructure supply and development (eg, land supply)
Labour market Alignment of education systems with industry needs (skills matching)
Migration policy
Workplace policies
Policies to lift the supply of affordable housing (labour mobility)
International connections
Foreign direct investment (FDI) regulations
Active promotion of (and leveraging off) FDI and multinational corporations
Direct support for export market development and outward direct investment (ODI)
Digital infrastructure investment
Competition Product market regulations
Competition policy and law
Ease of entry and exit Cost of starting a business
Efficiency of bankruptcy legislation
Innovation Public investment in R&D
R&D tax incentives
Stimulation of venture capital markets
Support for industry/sector clusters and innovation ecosystems
Governance Quality of institutions
Regulatory quality and regulatory stewardship
Regulation of firm governance
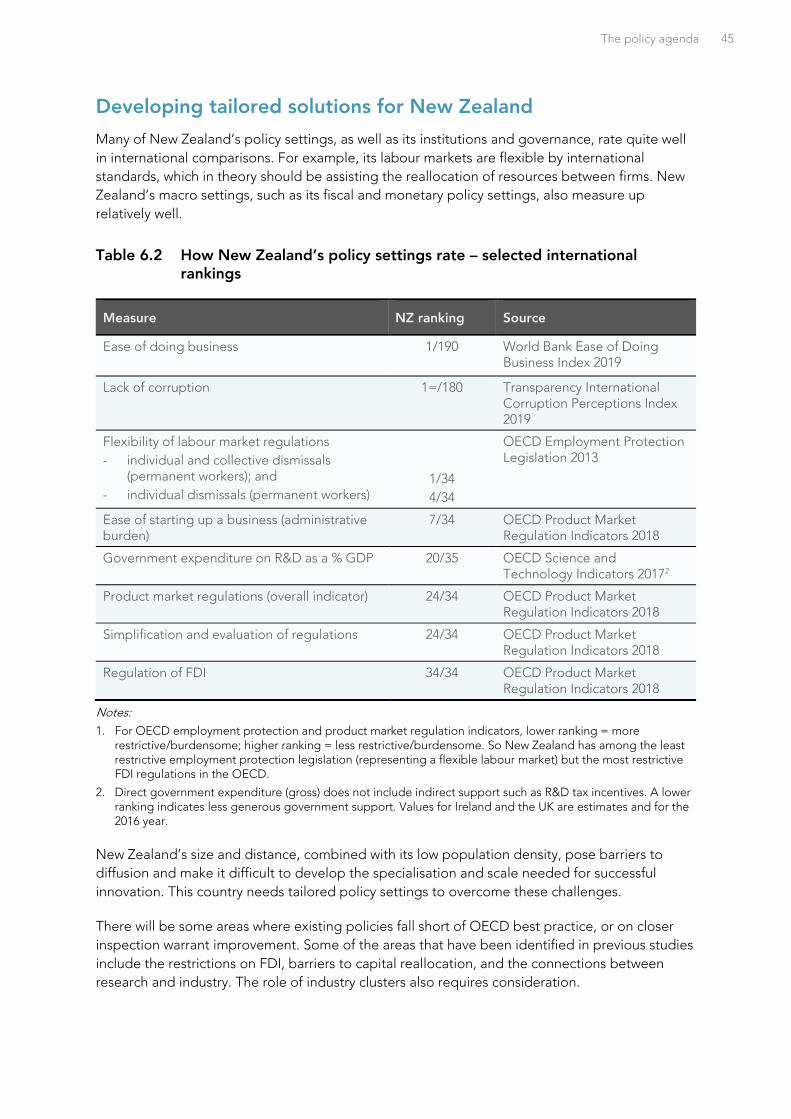
The policy agenda 45
Developing tailored solutions for New Zealand
Many of New Zealand’s policy settings, as well as its institutions and governance, rate quite well
in international comparisons. For example, its labour markets are flexible by international
standards, which in theory should be assisting the reallocation of resources between firms. New
Zealand’s macro settings, such as its fiscal and monetary policy settings, also measure up
relatively well.
Table 6.2 How New Zealand’s policy settings rate – selected international rankings
Measure NZ ranking Source
Ease of doing business
1/190 World Bank Ease of Doing Business Index 2019
Lack of corruption 1=/180 Transparency International Corruption Perceptions Index 2019
Flexibility of labour market regulations
- individual and collective dismissals (permanent workers); and
- individual dismissals (permanent workers)
1/34
4/34
OECD Employment Protection Legislation 2013
Ease of starting up a business (administrative burden)
7/34 OECD Product Market Regulation Indicators 2018
Government expenditure on R&D as a % GDP 20/35 OECD Science and Technology Indicators 20172
Product market regulations (overall indicator) 24/34 OECD Product Market Regulation Indicators 2018
Simplification and evaluation of regulations 24/34 OECD Product Market Regulation Indicators 2018
Regulation of FDI 34/34 OECD Product Market Regulation Indicators 2018
Notes:
1. For OECD employment protection and product market regulation indicators, lower ranking = more restrictive/burdensome; higher ranking = less restrictive/burdensome. So New Zealand has among the least restrictive employment protection legislation (representing a flexible labour market) but the most restrictive FDI regulations in the OECD.
2. Direct government expenditure (gross) does not include indirect support such as R&D tax incentives. A lower ranking indicates less generous government support. Values for Ireland and the UK are estimates and for the 2016 year.
New Zealand’s size and distance, combined with its low population density, pose barriers to
diffusion and make it difficult to develop the specialisation and scale needed for successful
innovation. This country needs tailored policy settings to overcome these challenges.
There will be some areas where existing policies fall short of OECD best practice, or on closer
inspection warrant improvement. Some of the areas that have been identified in previous studies
include the restrictions on FDI, barriers to capital reallocation, and the connections between
research and industry. The role of industry clusters also requires consideration.
46 Issues paper | New Zealand firms: reaching for the frontier
Novel solutions may be needed. The Commission will draw on the experiences of other small
advanced economies whose governments have successfully taken measures to strengthen their
productivity performance, to distil lessons New Zealand could learn from them. It will also draw
on insights from the experience of highly successful firms around the world as to what
capabilities (eg, of their owners, directors, managers and staff) that underlie their success. These
insights could also point to lessons for achieving improved outcomes on the part of New
Zealand’s leading firms.
The Commission hopes to engage with a wide range of Kiwi firms and other industry
stakeholders to help figure out what the Government could do to make a tangible difference.
There may also be measures the private sector could take. For instance, the Commission may
make practical suggestions for firms and industry bodies to consider, as well as highlighting
examples of leading practice.
The challenge for this inquiry is to determine which policy settings matter the most, and what
interventions offer the largest potential impact, within the unique New Zealand context.
Q26 Which policy levers matter the most and would have the largest potential
impact in:
helping New Zealand frontier firms get closer to the global frontier?
helping diffusion from New Zealand frontier firms to other New
Zealand firms?
supporting resource reallocation from lower to higher productivity firms
within New Zealand?
Q27 What measures could the business sector take to help New Zealand
frontier firms get closer to the global frontier, improve diffusion from
frontier firms, or support resource reallocation from lower to higher
productivity firms?
The Commission’s approach 47
7 The Commission’s approach
A three-step approach
The Commission proposes a three-step approach for this inquiry.
1. Observe the current performance of New Zealand’s frontier and non-frontier firms.
2. Understand the observed performance of firms, including the main reasons for them not
keeping pace with global frontier firms and why non-frontier firms do not get closer to the
domestic frontier.
3. Come up with a set of policy recommendations based on the understanding established in
step 2, that are most likely to improve the performance of New Zealand’s frontier firms and
their impact on non-frontier firms.
The observed performance of New Zealand firms
As noted above, previous research indicates that New Zealand frontier firms significantly lag
behind the global frontier, and New Zealand non-frontier firms appear to be more widely
dispersed than in some other OECD economies (Conway, 2018). This indicates that the
processes of diffusion and reallocation may not be happening as effectively as they should in
New Zealand.
The above “stylised facts” are based on a firm-level microdata lens. Other stylised facts
reflecting the performance of firms and their impact on New Zealand’s economic performance
can be gleaned from using aggregate-level and industry-level lenses.
These stylised facts, and how they compare with the stylised facts about firm performance in
comparator countries, are important clues about what may be going on with firm performance,
knowledge diffusion and resource reallocation. The inquiry also needs to gain insights into the
“black box” of firm decision making, and the Commission plans to do this through in-depth
qualitative research.
Understanding these observations
There is a long list of potential causes of the observed performance of New Zealand firms and
why it is inferior (or perhaps superior in some instances) to that of other economies.
The Commission will use multiple sources and perspectives to help it generate a comprehensive
and credible narrative that it feels best explains the performance of New Zealand’s frontier and
non-frontier firms. The credibility of a narrative will depend critically on its ability to encompass
well-established research findings and explain important stylised facts. The sources and
perspectives the Commission will use are:
existing international and New Zealand research at the aggregate, industry and microdata
levels;
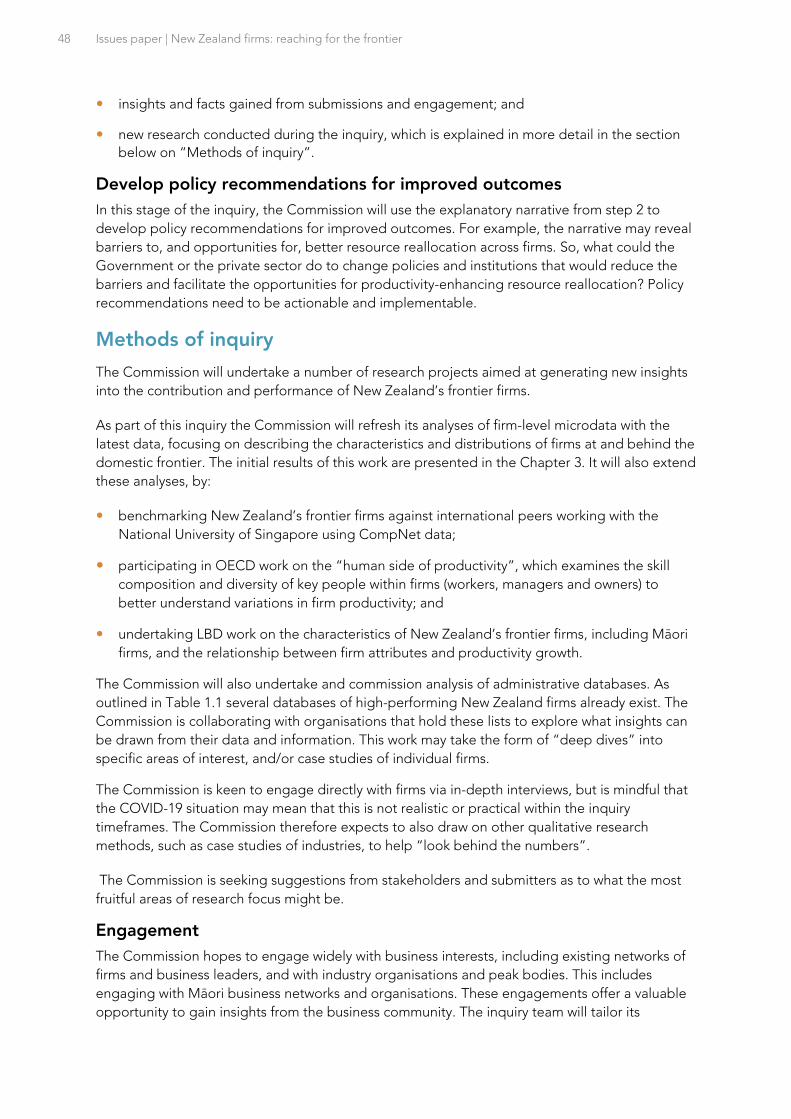
48 Issues paper | New Zealand firms: reaching for the frontier
insights and facts gained from submissions and engagement; and
new research conducted during the inquiry, which is explained in more detail in the section
below on “Methods of inquiry”.
Develop policy recommendations for improved outcomes
In this stage of the inquiry, the Commission will use the explanatory narrative from step 2 to
develop policy recommendations for improved outcomes. For example, the narrative may reveal
barriers to, and opportunities for, better resource reallocation across firms. So, what could the
Government or the private sector do to change policies and institutions that would reduce the
barriers and facilitate the opportunities for productivity-enhancing resource reallocation? Policy
recommendations need to be actionable and implementable.
Methods of inquiry
The Commission will undertake a number of research projects aimed at generating new insights
into the contribution and performance of New Zealand’s frontier firms.
As part of this inquiry the Commission will refresh its analyses of firm-level microdata with the
latest data, focusing on describing the characteristics and distributions of firms at and behind the
domestic frontier. The initial results of this work are presented in the Chapter 3. It will also extend
these analyses, by:
benchmarking New Zealand’s frontier firms against international peers working with the
National University of Singapore using CompNet data;
participating in OECD work on the “human side of productivity”, which examines the skill
composition and diversity of key people within firms (workers, managers and owners) to
better understand variations in firm productivity; and
undertaking LBD work on the characteristics of New Zealand’s frontier firms, including Māori
firms, and the relationship between firm attributes and productivity growth.
The Commission will also undertake and commission analysis of administrative databases. As
outlined in Table 1.1 several databases of high-performing New Zealand firms already exist. The
Commission is collaborating with organisations that hold these lists to explore what insights can
be drawn from their data and information. This work may take the form of “deep dives” into
specific areas of interest, and/or case studies of individual firms.
The Commission is keen to engage directly with firms via in-depth interviews, but is mindful that
the COVID-19 situation may mean that this is not realistic or practical within the inquiry
timeframes. The Commission therefore expects to also draw on other qualitative research
methods, such as case studies of industries, to help “look behind the numbers”.
The Commission is seeking suggestions from stakeholders and submitters as to what the most
fruitful areas of research focus might be.
Engagement
The Commission hopes to engage widely with business interests, including existing networks of
firms and business leaders, and with industry organisations and peak bodies. This includes
engaging with Māori business networks and organisations. These engagements offer a valuable
opportunity to gain insights from the business community. The inquiry team will tailor its
The Commission’s approach 49
engagement approach to accommodate the evolving circumstances of COVID-19 and the
challenges this is posing for businesses and communities.
Figure 7.1 Proposed range of research methods and information sources
Q28 Do you agree with the Commission’s proposed approach to the inquiry?
Where would you like to see the Commission put the most emphasis? Are
there modifications to the proposed approach that would better fulfil the
inquiry’s Terms of Reference in your view?
Q29 Is there any other research underway of relevance to this inquiry that the
Commission should be aware of? How could the Commission best engage
with this work?
Q30 What are the top three things you would like to see come out of this
inquiry?
50 Issues paper | New Zealand firms: reaching for the frontier
Summary of questions
Q1 How should the inquiry define frontier firms? What data are available to
enable the study of frontier firms under your suggested definition?
Q2 Do you think the OECD framework is useful to guide the Commission’s
thinking in this inquiry? Are there other frameworks the Commission should
consider?
Q3 What do you think are the most important drivers of the productivity of
New Zealand’s frontier firms?
Q4 What makes frontier firms different? What do they do differently, or have
that other firms don’t?
Q5 Can the success of frontier firms be replicated? For example, how much of
their success is down to highly motivated and talented individuals, good
timing, or even just good luck?
Q6 What are the most important drivers of the diffusion of technology, ideas
and business practices from frontier firms to other firms in New Zealand?
Q7 How easily do resources flow from lower to higher productivity firms and
vice versa? What are the most important drivers of the reallocation of
labour, capital and other resources between firms in New Zealand?
Q8 In your view, what are the key ingredients that would lead to a successful
New Zealand economy, and what would success look like?
76
Q9 Does the Commission’s description of New Zealand’s frontier firms and the
performance of frontier and non-frontier firms seem accurate?
Summary of questions 51
Q10 To what extent do you agree with the Commission’s tentative picture of
why New Zealand’s frontier and non-frontier firms are underperforming?
Q11 In your view, why does it appear that the productivity of frontier firms in
New Zealand has not grown faster than non-frontier firms, unlike the
situation globally?
Q12 What explains the research finding of a weak connection between
innovation and productivity growth among New Zealand firms?
Q13 What are the main challenges for New Zealand firms that aspire to reach
the performance of the best firms globally?
Q14 Are New Zealand firms ambitious about growing and scaling up? If not,
why not? If they are, what's getting in their way?
Q15 How do New Zealand’s frontier firms learn about, adapt and adopt cutting
edge technologies and practices?
Q16 What types of international connections make the biggest difference for
diffusion from the global to the domestic frontier? What could be done to
improve these kinds of connections?
Q17 Do frontier firms have a problem sustaining their performance? What is
needed to maintain high productivity over the long-term?
Q18 Why don’t other firms follow the example of frontier firms? What’s holding
them back?
Q19 How could the lessons from New Zealand’s frontier firms be better shared?
Q20 How do different types of corporate form and ownership structure affect
firms’ incentives to innovate, grow and internationalise?
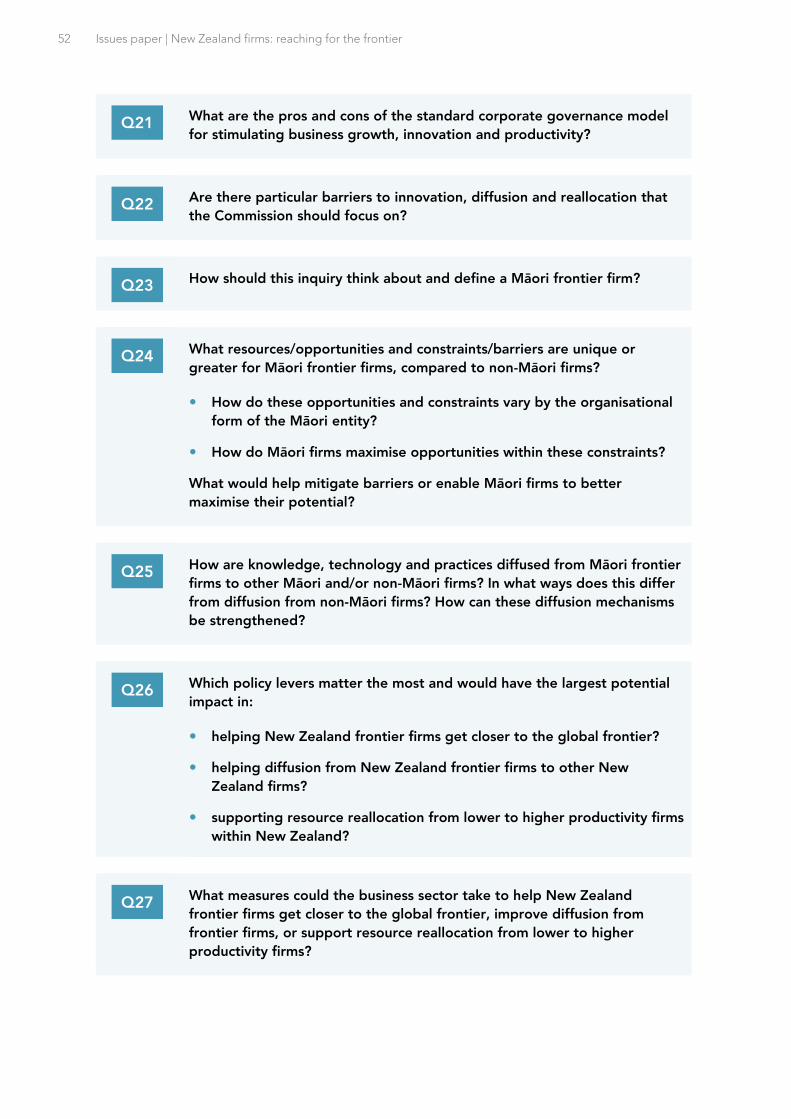
52 Issues paper | New Zealand firms: reaching for the frontier
Q21 What are the pros and cons of the standard corporate governance model
for stimulating business growth, innovation and productivity?
Q22 Are there particular barriers to innovation, diffusion and reallocation that
the Commission should focus on?
Q23 How should this inquiry think about and define a Māori frontier firm?
Q24 What resources/opportunities and constraints/barriers are unique or
greater for Māori frontier firms, compared to non-Māori firms?
How do these opportunities and constraints vary by the organisational
form of the Māori entity?
How do Māori firms maximise opportunities within these constraints?
What would help mitigate barriers or enable Māori firms to better
maximise their potential?
Q25 How are knowledge, technology and practices diffused from Māori frontier
firms to other Māori and/or non-Māori firms? In what ways does this differ
from diffusion from non-Māori firms? How can these diffusion mechanisms
be strengthened?
Q26 Which policy levers matter the most and would have the largest potential
impact in:
helping New Zealand frontier firms get closer to the global frontier?
helping diffusion from New Zealand frontier firms to other New
Zealand firms?
supporting resource reallocation from lower to higher productivity firms
within New Zealand?
Q27 What measures could the business sector take to help New Zealand
frontier firms get closer to the global frontier, improve diffusion from
frontier firms, or support resource reallocation from lower to higher
productivity firms?

Summary of questions 53
Q28 Do you agree with the Commission’s proposed approach to the inquiry?
Where would you like to see the Commission put the most emphasis? Are
there modifications to the proposed approach that would better fulfil the
inquiry’s Terms of Reference in your view?
Q29 Is there any other research underway of relevance to this inquiry that the
Commission should be aware of? How could the Commission best engage
with this work?
Q30 What are the top three things you would like to see come out of this
inquiry?
54 Issues paper | New Zealand firms: reaching for the frontier
References
Adalet McGowan, M., Andrews, D., & Criscuolo, C. (2015). The future of productivity. OECD. www.oecd.org/economy/growth/OECD-2015-The-future-of-productivity-book.pdf
Adalet McGowan, M., Andrews, D., & Millot, V. (2017). The walking dead? Zombie firms and productivity performance in OECD countries [OECD Economics Department Working Paper No. 1372]. OECD Economics Department. www.oecd.org/economy/growth/The-Walking-Dead-Zombie-Firms-and-Productivity-Performance-in-OECD-Countries.pdf
Allan, C. (2018). Getting under the hood: Insights from recent firm-level productivity research in New Zealand. Productivity Hub. www.mbie.govt.nz/dmsdocument/2981-getting-under-the-hood-insights-from-recent-firm-level-productivity-research-in-new-zealand
Andrews, D., Criscuolo, C., & Gal, P. N. (2015). Frontier firms, technology diffusion and public policy: Micro evidence from OECD countries [OECD Productivity Background Paper]. OECD. www.oecd.org/economy/growth/Frontier-Firms-Technology-Diffusion-and-Public-Policy-Micro-Evidence-from-OECD-Countries.pdf
Andrews, D., Criscuolo, C., & Gal, P. N. (2016a). The best versus the rest: The global productivity slowdown, divergence across firms and the role of public policy [OECD Productivity Working Paper No. 05]. OECD Publishing. https://doi.org/10.1787/24139424
Andrews, D., Criscuolo, C., & Gal, P. N. (2016b). The global productivity slowdown, technology divergence and public policy: A firm level perspective [OECD Productivity Background Paper]. OECD. www.oecd.org/global-forum-productivity/events/GP_Slowdown_Technology_Divergence_and_Public_Policy_Final_after_conference_26_July.pdf
Ballingall, J., & Bailey, P. (2010). Lifting Māori Productivity – a scoping paper. Te Puni Kōkiri. https://tpk.govt.nz/en/a-matou-mohiotanga/business-and-economics/lifting-maori-productivity--a-scoping-paper
Barker, A. (2017). Improving productivity in New Zealand’s economy [OECD Economics Department Working Paper No. 1419]. OECD Economics Department. www.oecd-ilibrary.org/economics/improving-productivity-in-new-zealand-s-economy_8071e193-en
Berlingieri, G., Calligaris, S., Criscuolo, C., & Verlhac, R. (2020). Laggard firms, technology diffusion and its structural and policy determinants (OECD Science, Technology and Industry Policy Papers). OECD. www.oecd-ilibrary.org/science-and-technology/laggard-firms-technology-diffusion-and-its-structural-and-policy-determinants_281bd7a9-en
Bollard, A., & Ng, T. (2012, August 9). Learnings from the Global Financial Crisis [Speech]. The Treasury. www.rbnz.govt.nz/-/media/ReserveBank/Files/Publications/Speeches/2012/4890771.pdf?revision=ea61ed83-28b6-4304-80b8-9678bb155ae8
Brynjolfsson, E., Rock, D., & Syverson, C. (2017). Artificial intelligence and the modern productivity paradox: A clash of expectations and statistics [NBER Working Paper No. 24001]. National Bureau of Economic Research. www.nber.org/papers/w24001
Chappell, N., & Jaffe, A. B. (2018). Intangible investment and firm performance [NBER Working Paper No. 24363]. National Bureau of Economic Research. www.nber.org/papers/w24363.pdf
References 55
Coleman, A., & Zheng, G. (2020). Job-to-job transitions and the regional job ladder [NZPC Working Paper No. 2020/01]. NZPC. www.productivity.govt.nz/research/job-to-job-transitions/
Conway, P. (2016). Achieving New Zealand productivity potential [NZPC Research Paper No. 2016/01]. NZPC. www.productivity.govt.nz/assets/Documents/def5015ce2/Report-Achieving-NZs-productivity-potential.pdf
Conway, P. (2018). Can the kiwi fly? Achieving productivity lift off in New Zealand. International Productivity Monitor, 34(Spring), 40–63. www.productivity.govt.nz/research/nz-productivity
Conway, P., Meehan, L., & Zheng, G. (2015). Do New Zealand firms catch up to the domestic productivity frontier? [NZPC Working Paper No. 2015/3]. NZPC. www.productivity.govt.nz/research/do-nz-firms-catch-up-to-the-domestic-productivity-frontier
Conway, P., & Zheng, G. (2014). Trade over distance for New Zealand firms [NZPC Working Paper No. 2014/05]. NZPC. www.productivity.govt.nz/research/trade-over-distance-for-new-zealand-firms
Davies, P. (2007). A time for change in Māori economic development. Te Puni Kōkiri. https://tpk.govt.nz/en/a-matou-mohiotanga/business-and-economics/a-time-for-change-in-maori-economic-development
de Serres, A., Yashiro, N., & Boulhol, H. (2014). An international perspective on the New Zealand productivity paradox [NZPC Working Paper No. 2014/01]. NZPC. www.productivity.govt.nz/research/an-international-persepective-on-the-nz-productivity-paradox-6
Deloitte Access Economics. (2020). Analysis of the Top 200 firms and Top 10 Māori businesses. NZPC. www.productivity.govt.nz/inquiries/frontier-firms
Fabling, R., & Grimes, A. (2014). The ‘suite’ smell of success: Personnel practices and firm performance’. IRL Review, 67(4), 1095–1126. https://doi.org/10.1177/0019793914546297
Fabling, R., & Grimes, A. (2016). Picking up speed: Does access to UFB increase firm productivity? [Motu Working Paper No. 16-22]. Motu Economic and Public Policy Research. http://motu-www.motu.org.nz/wpapers/16_22.pdf
Fabling, R., & Grimes, A. (2019). Ultra-fast broadband, skill complementarities, gender and wages [Motu Working Paper No. 19-23]. Motu Economic and Public Policy Research. http://motu-www.motu.org.nz/wpapers/19_23.pdf
Fabling, R., & Maré, D. C. (2012). Cyclical labour market adjustment in New Zealand: The response of firms to the Global Financial Crisis and its implications for workers [Motu Working Paper No. 12-04]. Motu Economic and Public Policy Research. http://motu-www.motu.org.nz/wpapers/12_04.pdf
Fabling, R., & Sanderson, L. (2011). Foreign acquisition and the performance of New Zealand firms [New Zealand Treasury Working Paper No. 11/06]. The Treasury. https://motu.nz/assets/Documents/our-work/wellbeing-and-macroeconomics/economic-performance/Foreign-Acquisition-and-the-Performance-of-New-Zealand-Firms.pdf
Fabling, R., & Sanderson, L. (2016). A rough guide to New Zealand’s Longitudinal Business Database (2nd Edition) [Motu Working Paper No. 16-03]. Motu Economic and Public Policy Research. https://motu.nz/our-work/productivity-and-innovation/firm-productivity-and-performance/a-rough-guide-to-new-zealands-longitudinal-business-database-2nd-edition
Gordon, R. (2017). The rise and fall of American growth. Princetown University Press. https://books.google.co.nz/books?id=bA8mDwAAQBAJ
56 Issues paper | New Zealand firms: reaching for the frontier
Green, R., & Agarwal, R. (2011). Management matters in New Zealand: How does manufacturing measure up? Ministry of Economic Development. http://worldmanagementsurvey.org/wp-content/images/2010/07/Report_Management-Matters-in-New-Zealand-How-does-manufacturing-measure-up.pdf
Hall, V. B., & McDermott, C. J. (2019). Changes in New Zealand’s business insolvency rates after the Global Financial Crisis [Motu Working Paper No. 19-15]. Motu Economic and Public Policy Research. http://motu-www.motu.org.nz/wpapers/19_15.pdf
Harmsworth, G., & Tahi, M. (2008). Indigenous branding: Examples from Aotearoa-New Zealand. Fostering indigenous business & entrepreneurship in the Americas conference, 22-25 July 2008, Manaus, Brazil. www.researchgate.net/publication/237198102
Harris, R., & Le, T. (2018). Absorptive capacity in New Zealand firms: Measurement and importance [Motu Working Paper No. 18-01]. Motu Economic and Public Policy Research. http://motu-www.motu.org.nz/wpapers/18_01.pdf
Haskel, J., & Westlake, S. (2018). Capitalism without capital. Princeton University Press; JSTOR. https://doi.org/10.2307/j.ctvc77hhj
Hendy, S., & Callaghan, P. (2013). Get off the grass. Auckland University Press. https://ebookcentral-proquest-com.helicon.vuw.ac.nz/lib/vuw/reader.action?docID=1531094
Institute of Directors, & MinterEllisonRuddWatts. (2019). Always on duty—The future board. Institute of Directors New Zealand. www.iod.org.nz/resources-and-insights/publications/insights/always-on-duty-the-future-board
Jaffe, A., Le, T., & Chappell, N. (2016). Productivity distribution and drivers of productivity growth in the construction industry [Motu Working Paper No. 16-08]. Motu Economic and Public Policy Research. http://motu-www.motu.org.nz/wpapers/16_08.pdf
KPMG. (2017). Māori economy investor guide. MBIE. www.mbie.govt.nz/dmsdocument/1051-maori-economy-investor-guide-pdf
Mai, B., & Warmke, N. (2012). Comparing approaches to compiling macro and micro productivity measures using Statistics New Zealand data. New Zealand Association of Economists conference, 27-29 June 2012, Palmerston North. www.nzae.org.nz/wp-content/uploads/2012/07/Mai-Warmke-comparing-approaches-to-compiling-macro-and-micro-productivity-measures.pdf
Makhlouf, G. (2013, July 24). Reflections on, and some lessons from, the Global Financial Crisis. Speech delivered by Gabriel Makhlouf [Speech]. The Treasury. https://treasury.govt.nz/sites/default/files/2013-07/sp-reflectionsgfc-24jul13.pdf
Māori Economic Development Panel. (2012a). He kai kei aku ringa—The Crown-Māori economic growth partnership: Action plan 2012-2017. MBIE. https://tpk.govt.nz/en/a-matou-mohiotanga/business-and-economics/he-kai-kei-aku-ringa-the-crownmaori-economic-growt
Māori Economic Development Panel. (2012b). He kai kei aku ringa—The Crown-Māori economic growth partnership: Strategy to 2040. MBIE. www.mbie.govt.nz/assets/7ec02ea964/strategy-to-2040-maori-economic-development-panel.pdf
Maré, D. C., Hyslop, D. R., & Fabling, R. (2015). Firm productivity growth and skills [Motu Working Paper No. 15-18]. Motu Economic and Public Policy Research. http://motu-www.motu.org.nz/wpapers/15_18.pdf
References 57
Maré, D., & Fabling, R. (2019). Competition and productivity: Do commonly used metrics suggest a relationship? [Motu Working Paper 19-16]. Motu Economic and Public Policy Research. https://motu.nz/our-work/productivity-and-innovation/firm-productivity-and-performance/competition-and-productivity-do-commonly-used-metrics-suggest-a-relationship
Meehan, L. (2016). Misallocation and productivity in New Zealand. New Zealand Association of Economists conference, 29 June - 1 July 2016, Auckland. www.nzae.org.nz/wp-content/uploads/2016/10/Meehan-Misallocation-and-productivity-NZAE-version-submitted-13062016-with-corrected-disclaimer.pdf
Mika, J. P., Fahey, N., & Bensemann, J. (2019). What counts as an indigenous enterprise? Evidence from Aotearoa New Zealand. Journal of Enterprising Communities: People and Places in the Global Economy, 13(3), 372–390. https://doi.org/10.1108/JEC-12-2018-0102
Mika, J. P., & Ross, B. M. E. (2019). International indigenous business and trade and the role of culture: A comparison between Aotearoa Māori and Alaska native enterprises. The Journal of Aboriginal Economic Development, 11(2), 54–71. www.researchgate.net/publication/338084569
Nana, G., Khan, M., & Schulze, H. (2015). Te ōhanga Māori 2013—Māori economy report 2013. Te Puni Kōkiri. https://tpk.govt.nz/en/a-matou-mohiotanga/business-and-economics/maori-economy-report-2013
New Zealand Government. (2017). The Business Growth Agenda 2017. MBIE. https://enz.govt.nz/assets/Uploads/BGA-2017-refresh-report.pdf
New Zealand Government. (2019a). Economic Plan: For a productive, sustainable and inclusive economy. MBIE. www.mbie.govt.nz/business-and-employment/economic-development/economic-plan
New Zealand Government. (2019b). Growing innovative industries in New Zealand: From the Knowledge Wave to the digital age. MBIE. www.mbie.govt.nz/dmsdocument/5866-growing-innovative-industries-in-new-zealand-from-the-knowledge-wave-to-the-digital-age
Nolan, P., Pomeroy, R., & Zheng, G. (2019). Productivity by the numbers [NZPC Research Paper No. 2019/2]. NZPC. www.productivity.govt.nz/research/productivity-by-the-numbers-2019/
NZIER (New Zealand Institute of Economic Research). (2003). Māori economic development—Te ōhanga whanaketanga Māori. NZIER. https://nzier.org.nz/publication/maori-economic-development
NZPC (New Zealand Productivity Commission). (2017). Better Urban Planning. NZPC. www.productivity.govt.nz/inquiries/better-urban-planning
OECD. (2019). OECD compendium of productivity indicators. OECD. https://doi.org/10.1787/b2774f97-en
OECD. (2020). Annual National Accounts. OECD.Stat. https://stats.oecd.org
OECD GFP team. (2019). The human side of productivity: Setting the scene [OECD GFP Background Paper]. OECD Global Forum on Productivity. www.oecd.org/global-forum-productivity/events/Human-side-of-productivity-background-paper.pdf
Oram, R. (2020). What we can learn from Te Ao Māori. Newsrooom. www.newsroom.co.nz/2020/02/09/1022568/a-different-world-view
Pells, S., & Howard, C. (2019). Deepening our understanding of business innovation: Main report from a study based on interviews with New Zealand businesses. MBIE. www.mbie.govt.nz/dmsdocument/6570-deepening-our-understanding-of-business-innovation-main-report-pdf
http://www.oecd.org/global-forum-productivity/events/Human-side-of-productivity-background-paper.pdf
58 Issues paper | New Zealand firms: reaching for the frontier
Saia, A., Andrews, D., & Albrizio, S. (2015). Productivity spillovers from the global frontier and public policy: Industry-level evidence [OECD Economics Department Working Paper No. 1238]. OECD Economics Department. www.oecd.org/economy/growth/Productivity-Spillovers-from-the-Global-Frontier-and-Public-Policy-Industry-Level-%20Evidence.pdf
Sanderson, L. (2018). The evolution of management practices in New Zealand. New Zealand Association of Economists conference, 27-29 June 2018, Auckland.
Schiff, A., & Singh, H. (2019). Competition in New Zealand: Highlights from the latest data [NZPC Research Note No. 2019/03]. NZPC. www.productivity.govt.nz/assets/Documents/competition-in-new-zealand/75b795cc4f/NZPC-Competition-in-New-Zealand-highlights-from-the-latest-data.pdf
Stats NZ. (2016). Tatauranga umanga Māori 2016: Statistics on Māori businesses. Stats NZ. www.stats.govt.nz/information-releases/tatauranga-umanga-maori-2016-statistics-on-maori-businesses
Stats NZ. (2019). Tatauranga umanga Māori concepts. DataInfo+. http://datainfoplus.stats.govt.nz/Item/nz.govt.stats/1bbe090c-fb27-4bf7-adee-7e230cb79585/newzealand.govt.nz#/nz.govt.stats/20d65e97-e5fa-46dd-804b-8d0bdca8ccee/4
Syverson, C. (2017). Challenges to Mismeasurement Explanations for the US Productivity Slowdown. Journal of Economic Perspectives, 31(2), 165–186. https://doi.org/10.1257/jep.31.2.165
Te Puni Kōkiri. (2014). Ngā takahanga waewae o ngā kaipakihi Māori: The footsteps of Māori entrepreneurs. Te Puni Kōkiri. www.tpk.govt.nz/en/a-matou-mohiotanga/business-and-economics/nga-takahanga-waewae-o-nga-kaipakihi-maori-the-foo
Te Puni Kōkiri, & Federation of Māori Authorities. (2006). Hei wakamārama i ngā āhuatanga o te tūrua pō—Investigating key Māori business characteristics for future measures: Thinking paper. Te Puni Kōkiri. www.tpk.govt.nz/en/a-matou-mohiotanga/business-and-economics/investigating-key-maori-business-characteristics
Tomoana, N. (2020). Māori engagement with China [Presentation at China capable knowledge transfer event, 19 February 2020]. Victoria University of Wellington.
Vitalis, V. (2008). Trade and Innovation Project—Case study 2: Domestic reform, trade, innovation and growth in New Zealand’s agricultural sector [OECD Trade Policy Working Paper No. 74]. OECD. www.oecd.org/newzealand/41077830.pdf
Wakeman, S., & Conway, P. (2017). Innovation and the performance of New Zealand firms [NZPC Working Paper No. 2017/2]. NZPC. www.productivity.govt.nz/research/nz-firms
Wakeman, S., & Le, T. (2015). Measuring the innovative activity of New Zealand firms [NZPC Working Paper No. 2015/2]. NZPC and Motu Economic and Public Policy Research. www.productivity.govt.nz/assets/Documents/ad6c13d21b/Working-paper-Measuring-the-innovative-activity-of-NZ-firms.pdf
Warren, L., Mika, J., & Palmer, F. (2017). How does enterprise assistance support Māori entrepreneurs? An identity approach. Journal of Management & Organization, 23(6), 873–885. https://doi.org/doi:10.1017/jmo.2017.73
Zheng, G. (2016). Geographic proximity and productivity convergence across New Zealand firms [NZPC Working Paper No. 2016/04]. NZPC. www.productivity.govt.nz/research/prouctivity-convergence
Terms of reference 59
Terms of reference
New Zealand Productivity Commission Inquiry into Maximising the Economic Contribution of New Zealand's Frontier Firms
Issued by the Ministers of Finance, of Economic Development and of Trade and Export Growth.
Pursuant to sections 9 and 11 of the New Zealand Productivity Commission Act 2010, we hereby
request that the New Zealand Productivity Commission ("the Commission") undertake an inquiry into
maximising the economic contribution of New Zealand's frontier firms.
Context
While aspects of New Zealand's recent economic performance have been strong, productivity growth
is persistently weak and a significant drag on living standards and wellbeing.
This inquiry focusses on a central aspect of New Zealand's productivity performance - the economic
contribution of New Zealand's frontier firms. Frontier firms are the most productive firms in the
domestic economy within their industry. These firms play an important role in shaping aggregate
productivity performance, both through their own performance and through the way they diffuse new
technologies and business practices into the New Zealand economy.
While New Zealand has some world-leading firms, on average our frontier firms are not performing as
well as their international peers, and the diffusion of innovations from the domestic frontier to other
domestic firms seems slow.
The purpose of this inquiry is to identify policies and interventions that could maximise the
performance and contribution to the economy of New Zealand's frontier firms through:
• improving the performance of the frontier firms themselves; and
• helping innovations diffuse more effectively from frontier firms to other New Zealand firms.
This requires using the Productivity Commission's high quality independent analytical capacity, and its
links with OECD research and analysis, to accurately characterise the New Zealand situation and
identify and evaluate relevant policies and interventions.
As the final report will be delivered in the year that New Zealand is hosting APEC, its substance could
inform discussions through the Economic Committees.
Scope
Having regard to the context outlined above, the referring Ministers request that the Commission
undertake an inquiry into maximising the contribution of New Zealand's frontier firms to aggregate
productivity growth through their own performance and through the diffusion of innovations from
frontier firms to other domestic firms.
For the purposes of the inquiry the Commission should:
• establish a coherent and measurable classification of what constitutes a frontier firm, and what the
distribution of New Zealand firms looks like behind the productivity frontier. This could include
benchmarking the performance of New Zealand's firms with international peers.
60 Issues paper | Terms of reference
• building on research from New Zealand and elsewhere, investigate the internal or external
characteristics of New Zealand's frontier firms that correlate with productivity performance, and
where possible make observations about likely causation. Relevant characteristics could include:
- organisational form;
- access to and use of capital (including type of capital and support received, and whether
foreign or domestic);
- level of competition;
- location;
- export status;
- staff skill / governance and management capability levels (including whether migration flows
are used to acquire these skills);
- distribution across sectors at an aggregate and more detailed level;
- firm age; and
- rate of growth and expansion.
• drawing on the above analysis, identify factors that could be inhibiting the performance of New
Zealand's frontier firms, and the interventions available to government that will (or will not)
effectively lift their performance.
• identify factors that contribute to or detract from diffusion of knowledge and technology in the
New Zealand economy, particularly from frontier firms to other firms. Identify the mechanisms by
which this diffusion occurs and interventions available to government to improve this diffusion.
• investigate the economic contribution of Māori frontier firms. In particular, the Commission
should consider, having consulted with Māori firms:
- what challenges / constraints, and what resources / opportunities, are unique or greater for
Māori firms at the frontier; and
- how the diffusion of technology or practices from Māori frontier firms may be different from
other frontier firms.
• use its focus on public engagement, and links with the OECD and other international agencies, to
recommend responses and policies that are actionable and implementable.
Consultation Requirements
In undertaking this inquiry, the Commission should:
• consult with key interest groups and affected parties (including firms, their employees, trade
unions and industry peak bodies);
• engage with relevant government departments; and
• draw from international perspectives and experience.
Timeframe
The Commission must publish a draft report and/or discussion paper(s) on the inquiry for public
comment, followed by a final report or reports, which must be submitted to each of the referring
Ministers by 31 March 2021. The Commission is also encouraged to produce any additional outputs
that may facilitate public understanding or enhance the impact of their work as they see fit.