New Zealand Energy Information Handbook
140
New Zealand Energy Information Handbook Third Edition
Transcript of New Zealand Energy Information Handbook

New Zealand
Energy InformationHandbook
Third Edition


New ZealandEnergy Information
HandbookThird Edition
Gary EngIan Bywater
Charles Hendtlass
Editors
CAENZ2008

New Zealand Energy Information Handbook – Third Edition
ISBN 978-0-908993-44-4
Printing History
First published 1984; Second Edition published 1993;this Edition published April 2008.
Copyright© 2008 New Zealand Centre for Advanced Engineering
PublisherNew Zealand Centre for Advanced EngineeringUniversity of Canterbury CampusPrivate Bag 4800Christchurch 8140, New Zealande-mail: [email protected]
Editorial Services, Graphics and Book DesignCharles Hendtlass, New Zealand Centre for Advanced Engineering.Cover photo by Scott Caldwell, CAENZ.
PrintingToltech Print, Christchurch
DisclaimerEvery attempt has been made to ensure that data in this publication are accurate. However,the New Zealand Centre for Advanced Engineering accepts no liability for any loss ordamage however caused arising from reliance on or use of that information or arising fromthe absence of information or any particular information in this Handbook.
All rights reserved. No part of this publication may be reproduced, stored in a retrievalsystem, transmitted, or otherwise disseminated, in any form or by any means, except forthe purposes of research or private study, criticism or review, without the prior permissionof the New Zealand Centre for Advanced Engineering.

Page iiiNew Zealand Energy Information Handbook
PrefacePrefacePrefacePrefacePreface
This Energy Information Handbook bringstogether in a single, concise, ready-reference format basic technical informa-tion describing the country’s energyresources and current energy commodi-ties.
The editor of the second edition of theHandbook published in 1991, JamesBaines, was responsible for editing asimilar volume in 1984 under theauspices of the New Zealand EnergyResearch and Development Committee.This is the third revised and expandededition, published for the first time bythe New Zealand Centre for AdvancedEngineering (CAENZ).
CAENZ was established in 1987 as theCentre for Advanced Engineering (CAE) tomark one hundred years of teachingengineering at the University of Canter-bury. Over the years, guided by ‘for thepublic good’ principles, CAENZ has playeda strong knowledge-broking and facilitat-ing role within New Zealand’s engineeringand technology sectors, seeking toenlarge this country’s technologicalcapability in areas of national impor-tance.
As with the second edition, a newHandbook is overdue for several reasons.The original volume was prepared at atime when the gas sector in particularwas in a state of rapid evolution. It is avery different now and so are the energycommodities involved. Since 1984, theenergy sector has been re-regulated,corporatised and privatised to varyingdegrees. Access to definitive information,even of a technical rather than a commer-cial nature, remains problematic for many.
Climate Change and the depletion rate offossil energy resources, more widelyrecognised now than when the secondedition was published, add to thepressure of finding and using energyresources with the utmost efficiency andwith due regard to the environmentalconsequences.
The data contained in this Handbookhave been selected as being suitable foranalyses and investigations at theplanning and policy level, and for generalconsumer and student enquiries. The twomain aims served by this Handbook areto encourage the widespread andconsistent use of a uniform data set,relevant to New Zealand, and to familiar-ise users who do not have a technicalbackground with the important factorsthat affect the appropriateness andaccuracy of energy data.
Interest in strategic energy issues isintensifying even more. Informed publicdebate depends on access to authorita-tive data. It is heartening to observe acontinuation of support for making goodtechnical data publicly available amongenergy sector organisations. ThisHandbook is a tribute to the cooperative-ness of many individuals in the energysector.
The Handbook is not intended to be anenergy compendium, and does notcontain energy statistics or other datathat will date quickly. There are severalalternative sources for information of thistype, such as the Ministry of EconomicDevelopment Energy Data File(www.med.govt.nz) and the EECA website(www.eeca.govt.nz).

Page iv Preface
Handbook Updating
As always, there are gaps in this data-base, attributable in the main either tocommercial sensitivities (primary resourcedata) or to the absence of basic informa-tion (end-use data). In time these gapsmay be remedied.
It is also likely that users of the Hand-book will be able to identify possibleadditions or improvements to beincorporated in future editions. ThisHandbook will continue to be reviewedand updated from time to time toaccommodate changing circumstances in
New Zealand’s energy scene, andadditional user requirements. Commentsand suggestions from users would bewelcomed. These can be sent to:
The EditorNew Zealand Energy InformationHandbookCAENZUniversity of Canterbury CampusPrivate Bag 4800CHRISTCHURCH 8140
or e-mailed to:
Page vNew Zealand Energy Information Handbook
ContentsContentsContentsContentsContents
Preface ............................................................................................................. iiiList of Tables ................................................................................................. viiiList of Figures ................................................................................................... x
1 Introduction ..................................................................................................... 1New Zealand focus and international conventions ................................................. 1Units and conversion factors ................................................................................... 1Levels of accuracy .................................................................................................... 1
2 Units and Energy Conversion Factors .....................................................................3SI units of measurement ........................................................................................ 3Metric prefixes ......................................................................................................... 3Energy commodity units in popular usage ............................................................. 3Energy and work equivalents ................................................................................. 4Power equivalents ................................................................................................... 4Calorific value equivalents ...................................................................................... 5IEA energy equivalents ............................................................................................ 6Some examples of unit conversions ....................................................................... 6
3 Coal .........................................................................................................................9Character of the resource ....................................................................................... 9The coal sector in New Zealand ............................................................................. 9New Zealand coal properties ................................................................................. 11New Zealand coal resources .................................................................................. 11Coal analysis ......................................................................................................... 14Other coal-based solid fuels ................................................................................. 18
4 Natural Gas ........................................................................................................... 19Character of the resource ...................................................................................... 19Gas treatment ....................................................................................................... 19Fuel components of natural gas ........................................................................... 19New Zealand resources ......................................................................................... 20Location of major facilities ................................................................................... 21Natural gas distribution ........................................................................................ 21Overview of natural gas sales streams ................................................................. 21Liquefied Petroleum Gas (LPG) ............................................................................. 21
5 Petroleum ..............................................................................................................25Character of the resource ..................................................................................... 25New Zealand resources ......................................................................................... 25Technical infrastructure ......................................................................................... 25Product density ..................................................................................................... 25Energy and product density .................................................................................. 25Energy content of petroleum commodities .......................................................... 25Refined product fractions ..................................................................................... 26

Page vi Contents
CO2 emission factors for petroleum-based fuels .................................................. 28Terminology ........................................................................................................... 28
6 Geothermal ............................................................................................................ 31Character of the resource ......................................................................................31Geographical distribution ..................................................................................... 32Regulatory status .................................................................................................. 32Current use ............................................................................................................ 33Energy content ...................................................................................................... 34Carbon dioxide emissions ..................................................................................... 34Other constituents ................................................................................................ 34
7 Wood .....................................................................................................................37Character of the resource ..................................................................................... 37Wood composition ................................................................................................ 37Different conditions of wood ................................................................................ 37Volumetric conversion factors ............................................................................... 38Different bases for measurement ......................................................................... 38Calorific value – mass basis ................................................................................. 38Effects of moisture ................................................................................................ 38Density .................................................................................................................. 39Calorific values – volume basis ............................................................................ 39Data for wood residues ........................................................................................ 41Wood pellets ......................................................................................................... 43Retting .................................................................................................................. 43
8 Energy from Waste ................................................................................................45Character of the resource ..................................................................................... 45Factors affecting energy content ........................................................................... 45Nature of the data ................................................................................................ 45Some indicative calorific values ........................................................................... 45Landfill gas ........................................................................................................... 46Other solid wastes ................................................................................................ 48
9 Solar ......................................................................................................................49Character of the resource ..................................................................................... 49Global solar fluxes ................................................................................................ 49Direct solar input to New Zealand ........................................................................ 49Seasonal and geographical variation in solar input ............................................. 50
10 Wind ......................................................................................................................53Character of the resource ..................................................................................... 53Quantifying the wind resource .............................................................................. 53The nature of wind variability ............................................................................... 54Potential wind farms ............................................................................................. 54
11 Oceans ..................................................................................................................59Character of the resource ..................................................................................... 59

Page viiNew Zealand Energy Information Handbook
Wave power .......................................................................................................... 59Ocean and tidal currents ...................................................................................... 59Potential Issues ..................................................................................................... 60
12 Emerging Forms of Energy Sources ......................................................................63Biofuels ................................................................................................................. 63Potential gasoline substitutes (alcohols, MTBE) .................................................. 64Potential diesel substitutes (alcohols, vegetable oils and animal fats) ............... 66Gas-to-liquids (GTL) and coal-To-liqiuds (CTL) fuels ............................................. 67Synthesis from coal or gas ................................................................................... 68Gaseous fuels ....................................................................................................... 70Industrial fuel gases ............................................................................................. 70Hydrogen ............................................................................................................... 71Manufactured town gas ........................................................................................ 71Producer gas ......................................................................................................... 72Coalbed methane .................................................................................................. 72Gas hydrates ......................................................................................................... 72
13 Electricity ...............................................................................................................75Resource base ....................................................................................................... 75Electricity units ...................................................................................................... 75Electrical energy and power .................................................................................. 75Thermal equivalents ............................................................................................. 75Power station locations ........................................................................................ 77DC link .................................................................................................................. 79Terminology ........................................................................................................... 81
14 Energy Demand and Efficiency .............................................................................85Introduction .......................................................................................................... 85Transport ............................................................................................................... 86Industrial and commercial .................................................................................... 87Residential ............................................................................................................ 88Household appliances ........................................................................................... 93Heat pumps .......................................................................................................... 94Regional data ........................................................................................................ 94
15 Energy Storage .....................................................................................................97Introduction .......................................................................................................... 97Electrical energy storage ....................................................................................... 97Chemical energy storage ....................................................................................... 98Kinetic energy storage .......................................................................................... 99Potential energy storage ....................................................................................... 99
16 General Physical Conversion Factors .................................................................. 103SI units of measurement .................................................................................... 103Temperature ........................................................................................................ 103Mass/volume interrelationships .......................................................................... 103
Page viii Contents
References and Data Sources ............................................................................. 109
Glossary .............................................................................................................. 113
Acknowledgements ............................................................................................. 119
Index ................................................................................................................... 121
List of TablesChapter 2: Units & Conversion FactorsTable 2.1: SI base units .......................................................................................... 3Table 2.2: Derived units .......................................................................................... 3Table 2.3: Metric prefixes, symbols and factors ..................................................... 4Table 2.4: Energy and work equivalents ................................................................ 4Table 2.5: Power equivalents .................................................................................. 5Table 2.6: Calorific value equivalents – mass basis ............................................... 6Table 2.7: Calorific value equivalents – volume basis ........................................... 6Table 2.8: IEA Energy equivalents – general .......................................................... 7Table 2.9: IEA Energy equivalents for New Zealand ............................................... 8
Chapter 3: CoalTable 3.1: New Zealand coal production 2006 ....................................................... 9Table 3.2: Regional variation of coal properties ................................................... 11Table 3.3: New Zealand coal resources ................................................................ 14Table 3.4: Analysis of New Zealand industrial coals ............................................ 15Table 3.5: Typical values for CO2 emission factors for NZ coals .......................... 18Table 3.6: Typical calorific values of coal-based solid fuels ................................ 18
Chapter 4: Natural GasTable 4.1: Typical data for fuel components of natural gas – mass basis ........... 20Table 4.2:Typical data for fuel components of natural gas – volume basis ........ 20Table 4.3: Typical energy data for LPG and component gases ............................ 24Table 4.4: Typical values of CO2 emission factors for LPG & component gases ................................................................................... 24
Chapter 5: PetroleumTable 5.1: Typical values for crude feedstocks to the Marsden Point refinery ..... 27Table 5.2: Typical values for blendstock .............................................................. 27Table 5.3: Typical values for refined products ...................................................... 28Table 5.4: Characteristics of principal petroleum fractions .................................. 28Table 5.5: Typical values of CO2 emission factor for petroleum-based fuels ...... 29
Chapter 6: GeothermalTable 6.1: Estimated parameters for high temperature geothermal systems ....... 33
Chapter 7: WoodTable 7.1: Typical composition values for softwoods and hardwoods ................. 37Table 7.2: Volumetric conversion factors for wood quantities ............................. 38

Page ixNew Zealand Energy Information Handbook
Table 7.3: Reduction in net calorific value with moisture content ....................... 39Table 7.4: Typical values of density for potential firewood species – wood content .................................................................................... 40Table 7.5: Typical values of moisture content for potential firewood species – bark content ....................................................................... 41Table 7.6: Typical net calorific values of potential firewood species ................... 42Table 7.7: Calorific values for fuelwood and residues ......................................... 43Table 7.8: Wood pellet properties ........................................................................ 43
Chapter 8: Energy from Solid WasteTable 8.1: Calorific values for biogas .................................................................... 46Table 8.2: Production of biogas from digestion of various materials .................. 47Table 8.3: Daily quantities of waste produced by various animals and birds ..... 47Table 8.4: Main constituents of landfill gas ......................................................... 48Table 8.5: Some typical waste fuels and their approximate characteristics ........ 48
Chapter 9: SolarTable 9.1: Disposition of the mean annual solar radiation incident on the earth-atmosphere system ........................................................ 49Table 9.2: Typical values for albedo for various land surfaces ............................ 50Table 9.3: New Zealand solar radiation intensity ................................................. 51
Chapter 10: WindTable 10.1: New Zealand median wind speeds, 1971 - 2000 ................................ 55Table 10.2: Current operational windfarms in New Zealand ................................. 55
Chapter 11: OceansTable 11.1: New Zealand wave heights and periods ............................................. 61Table 11.2: New Zealand water current speeds .................................................... 62
Chapter 12: Emerging Forms of EnergyTable 12.1: Energy content of biofuel ................................................................... 63Table 12.2: Energy balance from some feedstocks .............................................. 63Table 12.3: GHG emissions ................................................................................... 63Table 12.4: Productivity- indicative for some feedstocks ..................................... 64Table 12.5: Typical energy values for substitutes and blends with gasoline ....... 66Table 12.6: Typical values of CO2 emission factor for alcohol fuels .................... 66Table 12.7: Typical data for specific gravity and net calorific value for potential diesel substitutes ............................................................... 67Table 12.8: Typical calorific values for hydrogen, acetylene, town and producer gases, and methane ................................................................... 71
Chapter 13: ElectricityTable 13.1: Generating stations in the North Island ............................................. 76Table 13.2: Generating stations in the South Island ............................................ 77Table 13.3: North Island lakes and reservoir management data .......................... 80
Page x Contents
Table 13.4: South Island lakes and reservoir management data ......................... 80Table 13.5: Potential hydro generating capacity from major catchments given existing power stations .......................................................................... 81
Chapter 14: Energy Demand and EfficiencyTable 14:1: Passenger energy intensity by mode .................................................. 87Table 14:2: Freight energy intensity by mode ...................................................... 87Table 14.3: Fuel use – top and bottom 20% ........................................................ 90Table 14.4: Estimates of electricity use by appliance ........................................... 92Table 14.5: Heat pump COPs at various locations ............................................... 93Table 14.6: Average annual total energy use per house by fuel .......................... 95Table 14.7: Average annual hot water energy use per house by fuel .................. 95Table 14.8: Average annual space heating energy use per house by fuel ........... 95Table 14.9: Average annual energy use per house for selected end-uses ........... 96
Chapter 15: Energy StorageTable 15.1: Some latent heat storage materials .................................................. 101Table 15.2: Potential implementations of thermal storage by PCMs ................. 102
Chapter 16: General Physical Conversion FactorsTable 16.1: Temperature conversion factors ........................................................ 103Table 16.2: Length conversion factors ................................................................ 103Table 16.3: Area conversion factors .................................................................... 103Table 16.4: Volume conversion factors ............................................................... 104Table 16.5: Mass conversion factors ................................................................... 104Table 16.6: Pressure conversion factors ............................................................. 104Table 16.7: Velocity conversion factors ............................................................... 105Table 16.8: Flowrate conversion factors ............................................................. 105Table 16.9: Density conversion factors ............................................................... 105Table 16.10: Volume of liquids of different specific gravities contained in one tonne .................................................................................. 105Table 16.11: Mass of liquids of different specific gravities in kilograms ............ 106
List of FiguresChapter 3: CoalFigure 3.1: ASTM coal classification chart ............................................................. 10Figure 3.2a: Distribution of New Zealand’s coal resources – North Island ........... 12Figure 3.2b: Distribution of New Zealand’s coal resources – South Island .......... 13Figure 3.3. Relationship of ultimate and Proximate analysis to coal composition ............................................................................................... 16
Chapter 4: Natural GasFigure 4.1: Typical treatment sequence ................................................................ 19Figure 4.2: Location of major gas and oil fields .................................................. 22Figure 4.3: Existing natural gas distribution network .......................................... 23

Page xiNew Zealand Energy Information Handbook
Chapter 5: PetroleumFigure 5.1: Specific gravity & API gravity .............................................................. 26Figure 5.2: Energy content and product density .................................................. 26
Chapter 6: GeothermalFigure 6.1: Geothermal systems in New Zealand .................................................. 32
Chapter 10: WindFigure 10.1: North Island mean annual wind speeds, 1971-2000 ......................... 56Figure 10.2: South Island mean annual wind speeds, 1971-2000 ........................ 57Figure 10.3: Current and proposed windfarms in New Zealand ........................... 58
Chapter 11: OceansFigure 11.1: Mean significant wave height 1979-1998 ........................................... 60
Chapter 12: Emerging Forms of EnergyFigure 12.1: Current biofuels transformation processes ........................................ 64Figure 12.2: GTL production options .................................................................... 69Figure 12.3: Heavy duty emissions with GTL fuel ................................................. 70
Chapter 13: ElectricityFigure 13.1: Location of generating stations in the North Island ......................... 78Figure 13.2: Location of generating stations in the South Island ........................ 79Figure 13.3: North Island high voltage network ................................................... 82Figure 13.4: South Island high voltage network ................................................... 83
Chapter 14: Energy Demand and EfficiencyFigure 14.1: Light petrol fleet average fuel economy 2001-2006 ......................... 87Figure 14.2: Commercial/Industrial steam – energy used to provide service ....... 88Figure 14.3: Commercial/Industrial hot water – energy used to provide service ..................................................................... 89Figure 14.4: Commercial HVAC – energy used to provide service ........................ 89Figure 14.5: Total household energy use by fuel type ......................................... 90Figure 14.6: Total household energy use by end-use ........................................... 90Figure 14.7: Household electricity usage .............................................................. 91Figure 14.8: Domestic dispersed space heating – energy used to provide service ..................................................................... 90Figure 14.9: Domestic central space heating – energy used to provide service .. 90Figure 14.10: Domestic cooking – energy used to provide service ...................... 91Figure 14.11: Domestic hot water – energy used to provide service .................... 91Figure 14.12: Range of technology efficiencies ..................................................... 92
Chapter 15: Energy StorageFigure 15.1: Ragone Chart – specific energy vs specific power ranges for current technology ........................................................................... 98Figure 15.2: Useful transport energy derived from electricity ............................... 99

Page xii Contents

Page 1New Zealand Energy Information Handbook
1 Introduction1 Introduction1 Introduction1 Introduction1 Introduction
New Zealand focus andinternational conventions
Energy is derived from many differentsources, measured in different units, andreported in a variety of terminology. Thedefinitions, conversion factors, and tablesof energy data that follow are aimed atminimising errors and inconsistencies ofenergy accounting that might stem fromsuch differences.
This Handbook brings together databased on general practices followed inNew Zealand in recording and compilinginformation on energy stocks and usage.The units of measurement and theinterconversion factors presented takeinto consideration the wider perspectiveof international practices.
The Handbook details characteristics ofenergy types, fuel commodities and ratesof production. It does not containhistorical, time-series data that wouldvery quickly become dated.
In a few cases (e.g. for manufactured gasdata), information has been retained onenergy commodities no longer in use.This has been done to provide forsituations requiring historical analysis.
Units and conversion factors
In the past, a variety of measurementsystems has been in use around theworld. The Systeme Internationale (SI)has become established as the predomi-
nant coherent system of units, eventhough other systems remain in use incertain specialist situations. Users of thedata in this Handbook are urged toconvert all energy data to Joules (andmultiples thereof ) and to adopt SIconventions generally (Refer to NZStandard 650:1973).
Conversion factors between the varioussystems of units appear in two sectionsof this Handbook. Those most directlyinvolved in energy accounting procedures(energy/work equivalents, power equiva-lents, and calorific value equivalents) arepresented early in the Handbook (Section2) before the energy commodity data.Conversion factors for other physicalunits (e.g. volume, mass, density, etc) arepresented at the back (Section 16).
Levels of accuracy
The energy data contained in thisHandbook are intended for use primarilyin general energy accounting procedures,not in specialist scientific calculations.Individual numerical values are in somecases expressed using more significantfigures than the confidence limits wouldindicate is appropriate. The premise usedto justify this is that it is quite acceptablecomputational practice to carry moresignificant figures through a sequence ofcalculations so long as the end result isappropriately truncated to reflect theultimate confidence limits. It is thereforeexpected that the user will follow thissuggested practice.

Page 2 Introduction

Page 3New Zealand Energy Information Handbook
2 2 2 2 2 Units and Energy Conversion Factors
SI units of measurement
The seven SI base units of measurementare given in Table 2.1, while Table 2.2lists a further four derived SI units ofparticular relevance in the measurementof energy quantities.
Metric prefixes
One of the numerous advantages of anymetric system is its set of prefixes forindicating multiples of common units.
The recommended prefixes listed in Table2.3 are those indicating multiples andsub-multiples that differ from a unit insteps of 103.
Energy commodity units inpopular usage
The units in which energy commoditiesare most commonly measured arenumerous.
Units of mass are used as the basis formeasurement of most solid and mostnon-commercial fuels (e.g. sawdust, otherwaste products) and, in some instances,of liquid fuels. Units of volume are usedin the measurement of liquid fuels,certain non-commercial fuels (e.g.fuelwood), and gas.
Also used in the measurement of gas arecalories and British thermal units (Btu).
Physical quantity Unit Symbol
Length metre m
Mass kilogram kg
Time second s
Electric current ampere A
Thermodynamic temperature kelvin K
Luminous intensity candela cd
Amount of substance mole mol
Table 2.1: SI base units
Physical quantity Unit Symbol Derivation
Force newton N kg m s-2
Pressure pascal Pa N m-2
Work, energy, heat joule J N m
Power watt W J s-1
Table 2.2: Derived units. The column headed ‘derivation’ gives the expression of theunit in terms of SI base units or of SI units with special names.

Page 4 Units and Energy Conversion Factors
Other units commonly employed in themeasurement of energy or energy com-modities are the kilowatt hour (kWh), andmultiples thereof, for electrical energy, andthe Joule (J), which links heat and work.
Energy and work equivalents
The SI unit of energy is the Joule. TheJoule is the work done or the energyexpended when a force of one newtonmoves the point of application a distanceof one metre in the direction of that
force. (Source: SANZ 6501:1973)
In other metric systems calories are used.One calorie is the energy needed toincrease the temperature of a gram ofwater by 1 degree Celsius but, as thisdepends on the starting temperature andother variables, several definitions are inuse. The most common are thethermochemical calorie (calth), defined asexactly 4.1840 joules by the US Bureau ofStandards in 1953, and the InternationalSteam Table calorie (ITcal), defined asexactly 4.1868 joules by the Fifth Interna-tional Conference on Properties of Steamin 1956. These should not be mistaken forthe biological calorie, used in themeasurement of food energy, which is infact equal to 1000 physical calories.
The Imperial and American systems useBritish thermal units (Btu;1 Quad = 1015 Btu) or therms andsometimes kilowatt hours (kWh) ormultiples thereof. Other measures ofwork include British and metric horse-power-hours (hp-h), and the foot-pound(ft-lb). The interrelationships between thevarious units for measuring energy arepresented in Table 2.4.
Power equivalents
Power is the rate of doing work or the
Prefix Symbol Factor
zetta Z 1021
exa E 1018
peta P 1015
tera T 1012
giga G 109
mega M 106
kilo k 103
milli m 10-3
micro m 10-6
nano n 10-9
pico p 10-12
femto f 10-15
atto a 10-18
Table 2.3: Metric prefixes, symbolsand factors
To convert to: J ITcal kWh Btu
from: multiply by
Joules (J) 1 0.2388 2.778x10⁻⁷ 9.478x10⁻⁴
International Steam Table calorie (ITcal)
4.1868 1 1.163x10⁻⁶ 3.968x10⁻³
kilowatt-hours (kWh) 3.6x10⁶ 8.6x10⁵ 1 3412
British Thermal Units (Btu) 1055.1 252 2.931x10⁻⁴ 1
Horsepower hours (hp-h) 2.685x10⁶ 6.412x10⁵ 0.7457 2544
Cheval-vapeur hours (cv-h) 2.648x10⁶ 6.324x10⁵ 0.7355 2510
Table 2.4: Energy and work equivalents
Page 5New Zealand Energy Information Handbook
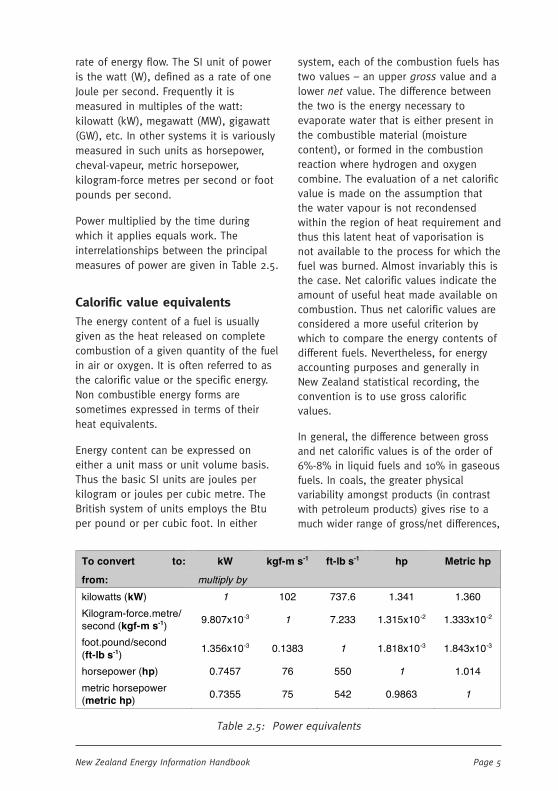
rate of energy flow. The SI unit of poweris the watt (W), defined as a rate of oneJoule per second. Frequently it ismeasured in multiples of the watt:kilowatt (kW), megawatt (MW), gigawatt(GW), etc. In other systems it is variouslymeasured in such units as horsepower,cheval-vapeur, metric horsepower,kilogram-force metres per second or footpounds per second.
Power multiplied by the time duringwhich it applies equals work. Theinterrelationships between the principalmeasures of power are given in Table 2.5.
Calorific value equivalents
The energy content of a fuel is usuallygiven as the heat released on completecombustion of a given quantity of the fuelin air or oxygen. It is often referred to asthe calorific value or the specific energy.Non combustible energy forms aresometimes expressed in terms of theirheat equivalents.
Energy content can be expressed oneither a unit mass or unit volume basis.Thus the basic SI units are joules perkilogram or joules per cubic metre. TheBritish system of units employs the Btuper pound or per cubic foot. In either
system, each of the combustion fuels hastwo values – an upper gross value and alower net value. The difference betweenthe two is the energy necessary toevaporate water that is either present inthe combustible material (moisturecontent), or formed in the combustionreaction where hydrogen and oxygencombine. The evaluation of a net calorificvalue is made on the assumption thatthe water vapour is not recondensedwithin the region of heat requirement andthus this latent heat of vaporisation isnot available to the process for which thefuel was burned. Almost invariably this isthe case. Net calorific values indicate theamount of useful heat made available oncombustion. Thus net calorific values areconsidered a more useful criterion bywhich to compare the energy contents ofdifferent fuels. Nevertheless, for energyaccounting purposes and generally inNew Zealand statistical recording, theconvention is to use gross calorificvalues.
In general, the difference between grossand net calorific values is of the order of6%-8% in liquid fuels and 10% in gaseousfuels. In coals, the greater physicalvariability amongst products (in contrastwith petroleum products) gives rise to amuch wider range of gross/net differences,
To convert to: kW kgf-m s-1 ft-lb s-1 hp Metric hp
from: multiply by
kilowatts (kW) 1 102 737.6 1.341 1.360
Kilogram-force.metre/ second (kgf-m s-1)
9.807x10⁻³ 1 7.233 1.315x10⁻² 1.333x10⁻²
foot.pound/second (ft-lb s-1)
1.356x10⁻³ 0.1383 1 1.818x10⁻³ 1.843x10⁻³
horsepower (hp) 0.7457 76 550 1 1.014
metric horsepower (metric hp)
0.7355 75 542 0.9863 1
Table 2.5: Power equivalents
Page 6 Units and Energy Conversion Factors
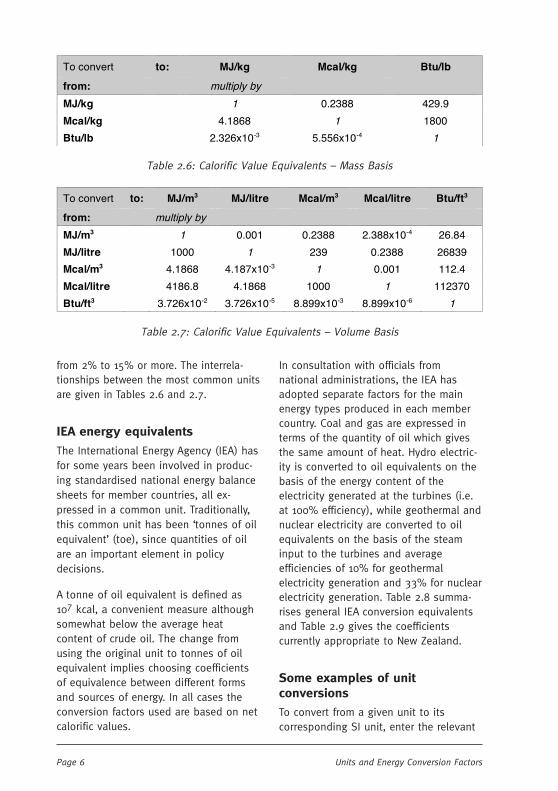
from 2% to 15% or more. The interrela-tionships between the most common unitsare given in Tables 2.6 and 2.7.
IEA energy equivalents
The International Energy Agency (IEA) hasfor some years been involved in produc-ing standardised national energy balancesheets for member countries, all ex-pressed in a common unit. Traditionally,this common unit has been ‘tonnes of oilequivalent’ (toe), since quantities of oilare an important element in policydecisions.
A tonne of oil equivalent is defined as107 kcal, a convenient measure althoughsomewhat below the average heatcontent of crude oil. The change fromusing the original unit to tonnes of oilequivalent implies choosing coefficientsof equivalence between different formsand sources of energy. In all cases theconversion factors used are based on netcalorific values.
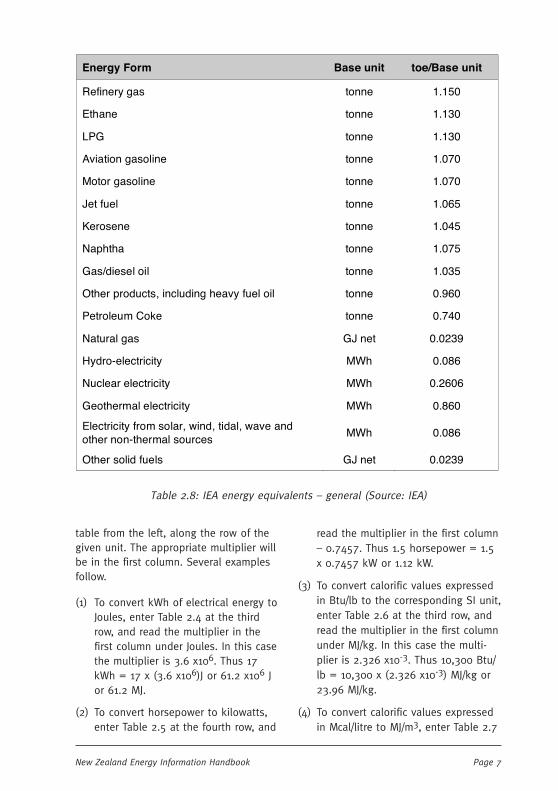
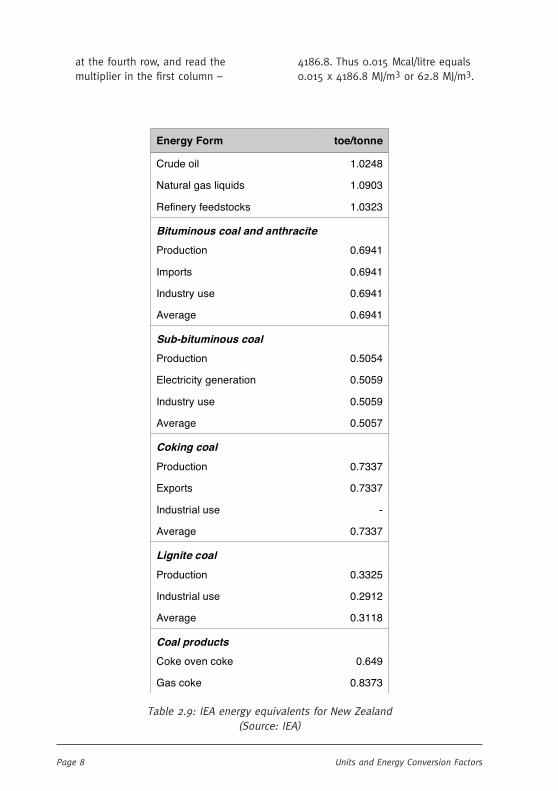
In consultation with officials fromnational administrations, the IEA hasadopted separate factors for the mainenergy types produced in each membercountry. Coal and gas are expressed interms of the quantity of oil which givesthe same amount of heat. Hydro electric-ity is converted to oil equivalents on thebasis of the energy content of theelectricity generated at the turbines (i.e.at 100% efficiency), while geothermal andnuclear electricity are converted to oilequivalents on the basis of the steaminput to the turbines and averageefficiencies of 10% for geothermalelectricity generation and 33% for nuclearelectricity generation. Table 2.8 summa-rises general IEA conversion equivalentsand Table 2.9 gives the coefficientscurrently appropriate to New Zealand.
Some examples of unitconversions
To convert from a given unit to itscorresponding SI unit, enter the relevant
To convert to: MJ/kg Mcal/kg Btu/lb
from: multiply by
MJ/kg 1 0.2388 429.9
Mcal/kg 4.1868 1 1800
Btu/lb 2.326x10⁻³ 5.556x10⁻⁴ 1
Table 2.6: Calorific Value Equivalents – Mass Basis
To convert to: MJ/m3 MJ/litre Mcal/m3 Mcal/litre Btu/ft3
from: multiply by
MJ/m3 1 0.001 0.2388 2.388x10⁻⁴ 26.84
MJ/litre 1000 1 239 0.2388 26839
Mcal/m3 4.1868 4.187x10⁻³ 1 0.001 112.4
Mcal/litre 4186.8 4.1868 1000 1 112370
Btu/ft3 3.726x10⁻² 3.726x10⁻⁵ 8.899x10⁻³ 8.899x10⁻⁶ 1
Table 2.7: Calorific Value Equivalents – Volume Basis
Page 7New Zealand Energy Information Handbook
table from the left, along the row of thegiven unit. The appropriate multiplier willbe in the first column. Several examplesfollow.
(1) To convert kWh of electrical energy toJoules, enter Table 2.4 at the thirdrow, and read the multiplier in thefirst column under Joules. In this casethe multiplier is 3.6 x10⁶. Thus 17kWh = 17 x (3.6 x106)J or 61.2 x10⁶ Jor 61.2 MJ.
(2) To convert horsepower to kilowatts,enter Table 2.5 at the fourth row, and
Energy Form Base unit toe/Base unit
Refinery gas tonne 1.150
Ethane tonne 1.130
LPG tonne 1.130
Aviation gasoline tonne 1.070
Motor gasoline tonne 1.070
Jet fuel tonne 1.065
Kerosene tonne 1.045
Naphtha tonne 1.075
Gas/diesel oil tonne 1.035
Other products, including heavy fuel oil tonne 0.960
Petroleum Coke tonne 0.740
Natural gas GJ net 0.0239
Hydro-electricity MWh 0.086
Nuclear electricity MWh 0.2606
Geothermal electricity MWh 0.860
Electricity from solar, wind, tidal, wave and other non-thermal sources
MWh 0.086
Other solid fuels GJ net 0.0239
Table 2.8: IEA energy equivalents – general (Source: IEA)
read the multiplier in the first column– 0.7457. Thus 1.5 horsepower = 1.5x 0.7457 kW or 1.12 kW.
(3) To convert calorific values expressedin Btu/lb to the corresponding SI unit,enter Table 2.6 at the third row, andread the multiplier in the first columnunder MJ/kg. In this case the multi-plier is 2.326 x10⁻³. Thus 10,300 Btu/lb = 10,300 x (2.326 x10-3) MJ/kg or23.96 MJ/kg.
(4) To convert calorific values expressedin Mcal/litre to MJ/m3, enter Table 2.7
Page 8 Units and Energy Conversion Factors
Energy Form toe/tonne
Crude oil 1.0248
Natural gas liquids 1.0903
Refinery feedstocks 1.0323
Bituminous coal and anthracite
Production 0.6941
Imports 0.6941
Industry use 0.6941
Average 0.6941
Sub-bituminous coal
Production 0.5054
Electricity generation 0.5059
Industry use 0.5059
Average 0.5057
Coking coal
Production 0.7337
Exports 0.7337
Industrial use -
Average 0.7337
Lignite coal
Production 0.3325
Industrial use 0.2912
Average 0.3118
Coal products
Coke oven coke 0.649
Gas coke 0.8373
Table 2.9: IEA energy equivalents for New Zealand(Source: IEA)
at the fourth row, and read themultiplier in the first column –
4186.8. Thus 0.015 Mcal/litre equals0.015 x 4186.8 MJ/m3 or 62.8 MJ/m3.
Page 9New Zealand Energy Information Handbook
3 Coal3 Coal3 Coal3 Coal3 Coal
Character of the resource
Coal is a combustible sedimentary rockcontaining both organic and mineralmatter. The organic matter is derivedfrom plant material accumulated underconditions which have preventedcomplete decay. The coalification processresults from subsequent burial of thisplant material, forming a complex mixtureof chemical compounds containingcarbon, hydrogen and oxygen togetherwith smaller amounts of nitrogen, sulphurand trace elements. The mineral matterconsists chiefly of clay minerals, mineralforms of sulphur (mostly pyrite) andsmaller amounts of other minerals.Moisture is also an important constituent.
Coals have a wide range of propertiesthat influence the way in which they areused. These characteristics are measuredby a wide range of analytical techniques.There are three main factors whichdetermine coal properties:
• Type – variation in the original plantmaterial from which coal is derivedand the amount of decay thatoccurred before eventual burial.
• Rank – difference in the degree ofburial of the original plant materialwhich affects the temperature andpressure conditions that existedduring coalification.
• Grade – the amount of contaminationby inorganic material during deposi-tion which results in variations inmineral matter contained in coal.High-grade coal contains little mineralmatter, whereas lower-grade coalcontains more mineral matter, mainlyderived from mud in the original peatswamp.
Increasing rank results in progressive and
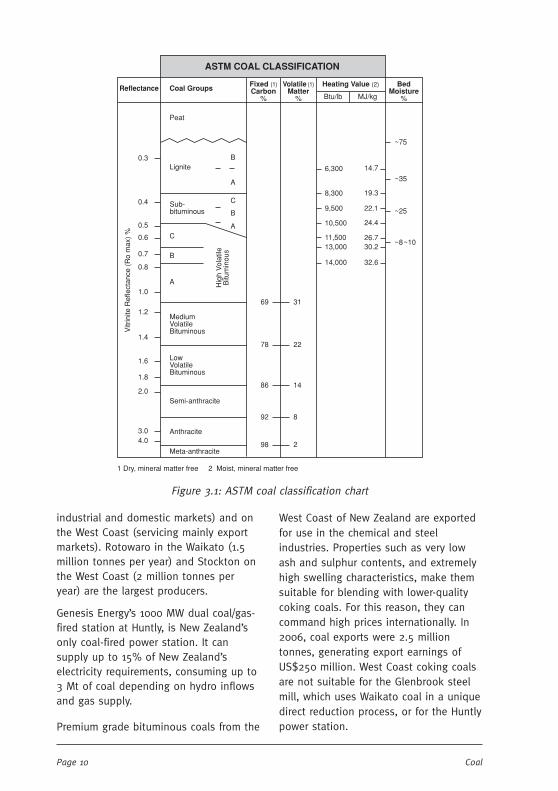
irreversible changes in the chemical andphysical properties of the coal, in thegeneralised sequence of peat � lignite(brown coal) � sub-bituminous coal �bituminous coal � semi-anthracite �anthracite. The changes in rank-inducedproperties between these general groupsis continuous, but uneven. The ASTM coalclassification system is generally used inNew Zealand (see Figure 3.1).
The coal sector in New Zealand
Coal is New Zealand’s most abundantfossil fuel and currently supplies about12.5% of primary energy supply. Coalplays an important role in New Zealand’senergy mix, both because of the extent ofthe proven indigenous resource and itsability to improve fuel diversity andenergy security. As well as being used forelectricity generation, coal is used as aheat source in the dairy, meat and timberindustries, and as a reagent/heat sourcein cement and steel manufacture.
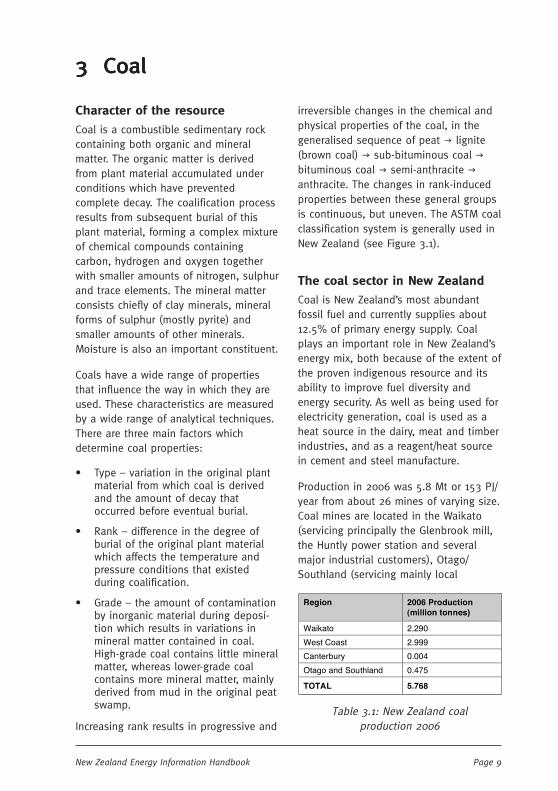
Production in 2006 was 5.8 Mt or 153 PJ/year from about 26 mines of varying size.Coal mines are located in the Waikato(servicing principally the Glenbrook mill,the Huntly power station and severalmajor industrial customers), Otago/Southland (servicing mainly local
Region 2006 Production (million tonnes)
Waikato 2.290
West Coast 2.999
Canterbury 0.004
Otago and Southland 0.475
TOTAL 5.768
Table 3.1: New Zealand coalproduction 2006
Page 10 Coal
industrial and domestic markets) and onthe West Coast (servicing mainly exportmarkets). Rotowaro in the Waikato (1.5million tonnes per year) and Stockton onthe West Coast (2 million tonnes peryear) are the largest producers.
Genesis Energy’s 1000 MW dual coal/gas-fired station at Huntly, is New Zealand’sonly coal-fired power station. It cansupply up to 15% of New Zealand’selectricity requirements, consuming up to3 Mt of coal depending on hydro inflowsand gas supply.
Premium grade bituminous coals from the
West Coast of New Zealand are exportedfor use in the chemical and steelindustries. Properties such as very lowash and sulphur contents, and extremelyhigh swelling characteristics, make themsuitable for blending with lower-qualitycoking coals. For this reason, they cancommand high prices internationally. In2006, coal exports were 2.5 milliontonnes, generating export earnings ofUS$250 million. West Coast coking coalsare not suitable for the Glenbrook steelmill, which uses Waikato coal in a uniquedirect reduction process, or for the Huntlypower station.
Peat
Lignite
Sub-bituminous
C
B
A
MediumVolatileBituminous
LowVolatileBituminous
Semi-anthracite
Anthracite
Meta-anthracite
B
A
A
B
C
Hig
h V
olat
ileB
itum
inou
s
~75
~35
~25
~8~10
32.6
30.226.7
24.4
22.1
19.3
14.76,300
8,300
9,500
10,500
11,50013,000
14,000
69 31
78 22
86 14
92 8
98 24.03.0
2.0
1.8
1.6
1.4
1.2
1.0
0.8
0.7
0.6
0.5
0.4
0.3
Vitr
inite
Ref
lect
ance
(R
o m
ax)
%
Reflectance Coal Groups Fixed (1)Carbon
%
Volatile (1)Matter
%
Heating Value (2)
Btu/lb MJ/kg
BedMoisture
%
ASTM COAL CLASSIFICATION
1 Dry, mineral matter free 2 Moist, mineral matter free
Figure 3.1: ASTM coal classification chart
Page 11New Zealand Energy Information Handbook
New Zealand coal properties
There are major contrasts in properties –rank, type and grade – between the coalsfrom different New Zealand coalfields.There can even be considerable variationof properties within a single deposit oreven within one mine. This variation ofproperties is the result of the different,and sometimes complex, geologicalhistories of many New Zealand coalfields,especially on the West Coast of the SouthIsland.
New Zealand coals range from very high-moisture lignite to very low-moisturebituminous coal and minor anthracite,which covers the full range of coal rank.
Detailed information on the properties ofsome New Zealand export coals can befound on the Solid Energy NZ Ltd website(www.coalnz.com).
New Zealand coal resources
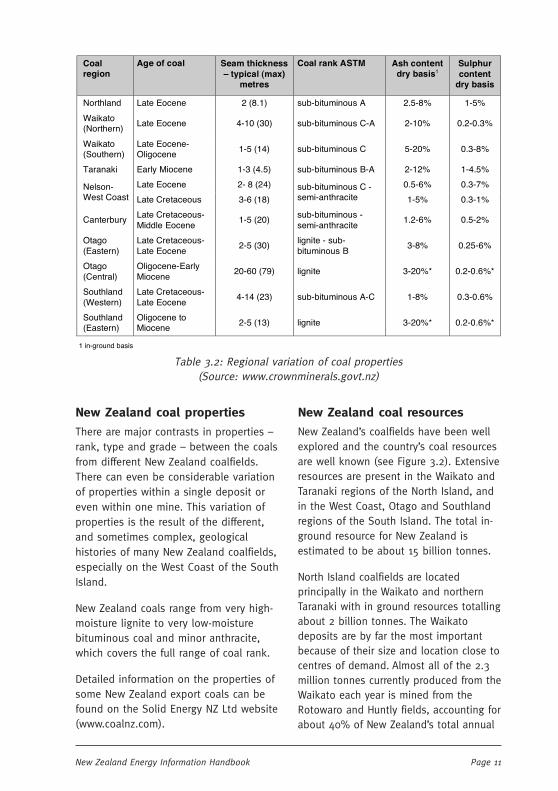
New Zealand’s coalfields have been wellexplored and the country’s coal resourcesare well known (see Figure 3.2). Extensiveresources are present in the Waikato andTaranaki regions of the North Island, andin the West Coast, Otago and Southlandregions of the South Island. The total in-ground resource for New Zealand isestimated to be about 15 billion tonnes.
North Island coalfields are locatedprincipally in the Waikato and northernTaranaki with in ground resources totallingabout 2 billion tonnes. The Waikatodeposits are by far the most importantbecause of their size and location close tocentres of demand. Almost all of the 2.3million tonnes currently produced from theWaikato each year is mined from theRotowaro and Huntly fields, accounting forabout 40% of New Zealand’s total annual
Coal region
Age of coal Seam thickness – typical (max)
metres
Coal rank ASTM Ash content dry basis1
Sulphur content
dry basis
Northland Late Eocene 2 (8.1) sub-bituminous A 2.5-8% 1-5%
Waikato (Northern)
Late Eocene 4-10 (30) sub-bituminous C-A 2-10% 0.2-0.3%
Waikato (Southern)
Late Eocene-Oligocene
1-5 (14) sub-bituminous C 5-20% 0.3-8%
Taranaki Early Miocene 1-3 (4.5) sub-bituminous B-A 2-12% 1-4.5%
Late Eocene 2- 8 (24) 0.5-6% 0.3-7% Nelson- West Coast Late Cretaceous 3-6 (18)
sub-bituminous C - semi-anthracite 1-5% 0.3-1%
Canterbury
Late Cretaceous-Middle Eocene
1-5 (20) sub-bituminous - semi-anthracite
1.2-6% 0.5-2%
Otago (Eastern)
Late Cretaceous-Late Eocene
2-5 (30) lignite - sub-bituminous B
3-8% 0.25-6%
Otago (Central)
Oligocene-Early Miocene
20-60 (79) lignite 3-20%* 0.2-0.6%*
Southland (Western)
Late Cretaceous-Late Eocene
4-14 (23) sub-bituminous A-C 1-8% 0.3-0.6%
Southland (Eastern)
Oligocene to Miocene
2-5 (13) lignite 3-20%* 0.2-0.6%*
1 in-ground basis
Table 3.2: Regional variation of coal properties(Source: www.crownminerals.govt.nz)
Page 12 Coal
Figure 3.2(a): Distribution of New Zealand’s coal resources – North Island
Pacific Ocean
Tasman Sea
New Plymouth
Auckland
Wellington
Coalfields
Major cities/towns
Coal deposits andisolatedoccurances
Legend
N
100 km0
NORTHLANDCOAL
REGION
WAIKATO COAL REGION
TARANAKICOAL
REGION
Waikato1 Maramarua2 Huntly3 Waikare4 Rotowaro5 Kawhia
Taranaki7 Mokua8 Waitawhena9 Ohura
2
4
5
67
89
31
production and 70% of production fordomestic consumption. The steel mill atGlenbrook and the thermal power stationat Huntly are the main users. Recentexpansion in Waikato coal production wasdriven by demand to fuel the Huntlypower station, which has switched fromgas to primarily coal.
The West Coast contains New Zealand’sonly bituminous coals. The Buller,
Greymouth, Pike River, and Reeftoncoalfields are the most economicallyimportant coalfields. Some West Coastcoals are exceptionally low in mineralcontaminants which, together with highfluidity and swelling properties, allowthese coals to command premium pricesin international metallurgical coalmarkets. Coal-in-ground resources for theregion are about 1 billion tonnes. Overthree-quarters of recoverable reserves are

Page 13New Zealand Energy Information Handbook
Figure 3.2(b): Distribution of New Zealand’s coal resources – South Island
Blenheim
Christchurch
Timaru
Oamaru
Dunedin
Invercargill
Greymouth
Westport
Coalfields
Major cities/towns
Coal deposits andisolatedoccurances
Legend
N
100 km0
NELSONCOAL
REGION
WESTCOAST
COALREGION
CANTERBURYCOALREGION
OTAGOCOAL
REGION
SOUTHLANDCOAL REGION
Tasman Sea
Pacific Ocean
Central Otago lignites
Eastern Southland lignites9
West Coast1 Buller2 Reefton3 Pike river4 Greymouth
Central Otago5 St Bathans6 Roxburgh
Eastern Southland7 Croydon8 Waimumu9 Mataura10 Edendale11 Morton Mains12 Ashers - Waituna13 Waimatua14 Makarewa
6
78 9
5
2
1
34
1011
121314
in the Greymouth (mostly underground)and Buller (mostly opencast) coalfields.The Pike River coalfield is underdevelopment and is slated to startproduction in 2008.
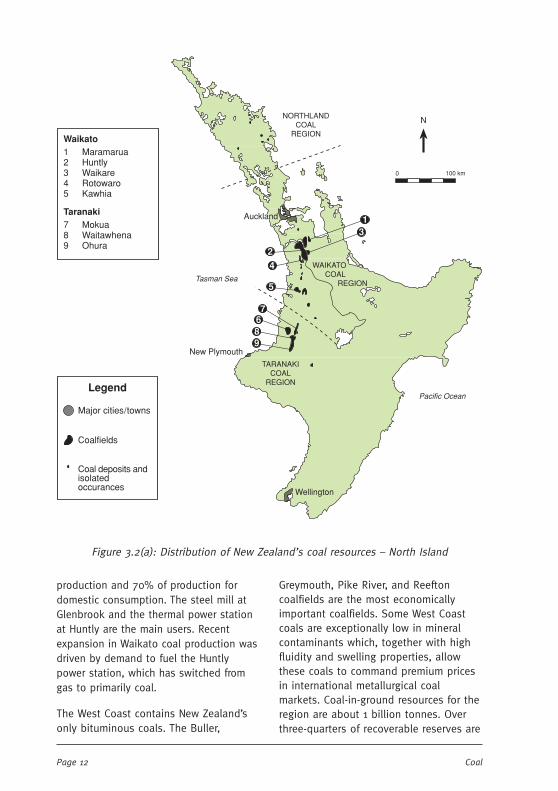
Most of New Zealand’s coal resources arein the south of the South Island. Otagocoalfields include very large lignitedeposits in Central Otago, the Kaitangatacoalfield south of Dunedin, and several
smaller coalfields. Southland coalfieldsinclude the huge lignite depositsunderlying the Eastern Southland plains,the Ohai coalfield in central Southland,and a number of lesser coalfields.
The South Island lignites are by far NewZealand’s biggest known single energyresource. Lignites make up 80% of NewZealand’s coal resources by tonnage andtwo-thirds by energy content. Resources of
Page 14 Coal
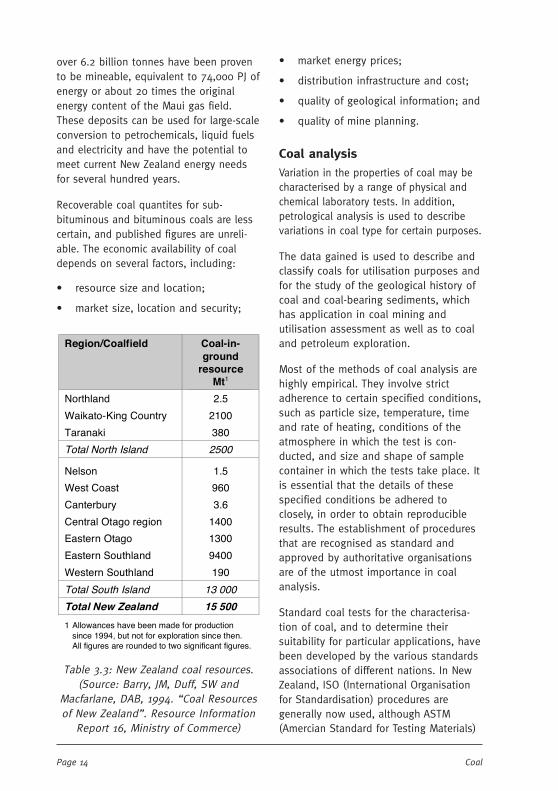
over 6.2 billion tonnes have been provento be mineable, equivalent to 74,000 PJ ofenergy or about 20 times the originalenergy content of the Maui gas field.These deposits can be used for large-scaleconversion to petrochemicals, liquid fuelsand electricity and have the potential tomeet current New Zealand energy needsfor several hundred years.
Recoverable coal quantites for sub-bituminous and bituminous coals are lesscertain, and published figures are unreli-able. The economic availability of coaldepends on several factors, including:
• resource size and location;
• market size, location and security;
• market energy prices;
• distribution infrastructure and cost;
• quality of geological information; and
• quality of mine planning.
Coal analysis
Variation in the properties of coal may becharacterised by a range of physical andchemical laboratory tests. In addition,petrological analysis is used to describevariations in coal type for certain purposes.
The data gained is used to describe andclassify coals for utilisation purposes andfor the study of the geological history ofcoal and coal-bearing sediments, whichhas application in coal mining andutilisation assessment as well as to coaland petroleum exploration.
Most of the methods of coal analysis arehighly empirical. They involve strictadherence to certain specified conditions,such as particle size, temperature, timeand rate of heating, conditions of theatmosphere in which the test is con-ducted, and size and shape of samplecontainer in which the tests take place. Itis essential that the details of thesespecified conditions be adhered toclosely, in order to obtain reproducibleresults. The establishment of proceduresthat are recognised as standard andapproved by authoritative organisationsare of the utmost importance in coalanalysis.
Standard coal tests for the characterisa-tion of coal, and to determine theirsuitability for particular applications, havebeen developed by the various standardsassociations of different nations. In NewZealand, ISO (International Organisationfor Standardisation) procedures aregenerally now used, although ASTM(Amercian Standard for Testing Materials)
Table 3.3: New Zealand coal resources.(Source: Barry, JM, Duff, SW and
Macfarlane, DAB, 1994. “Coal Resourcesof New Zealand”. Resource Information
Report 16, Ministry of Commerce)
Region/Coalfield Coal-in-ground
resource
Mt1
Northland 2.5
Waikato-King Country 2100
Taranaki 380
Total North Island 2500
Nelson 1.5
West Coast 960
Canterbury 3.6
Central Otago region 1400
Eastern Otago 1300
Eastern Southland 9400
Western Southland 190
Total South Island 13 000
Total New Zealand 15 500
1 Allowances have been made for production since 1994, but not for exploration since then. All figures are rounded to two significant figures.
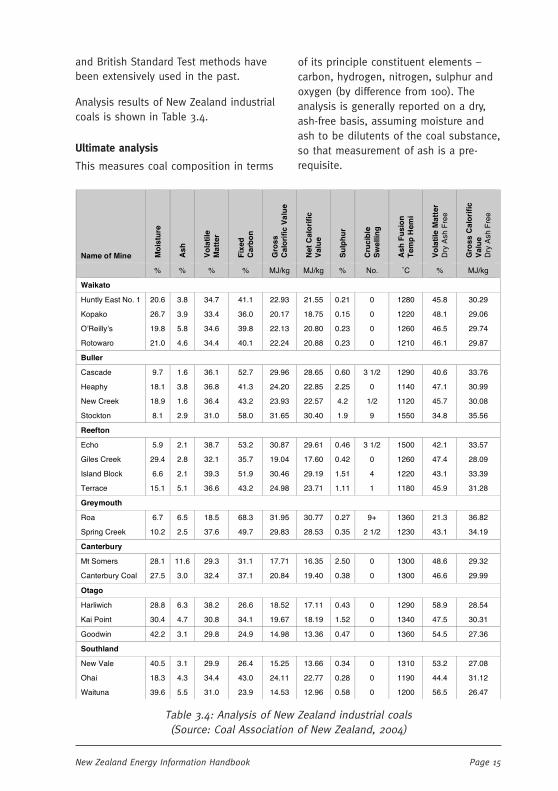
Page 15New Zealand Energy Information Handbook
Table 3.4: Analysis of New Zealand industrial coals(Source: Coal Association of New Zealand, 2004)
and British Standard Test methods havebeen extensively used in the past.
Analysis results of New Zealand industrialcoals is shown in Table 3.4.
Ultimate analysis
This measures coal composition in terms
of its principle constituent elements –carbon, hydrogen, nitrogen, sulphur andoxygen (by difference from 100). Theanalysis is generally reported on a dry,ash-free basis, assuming moisture andash to be dilutents of the coal substance,so that measurement of ash is a pre-requisite.
Name of Mine Mo
istu
re
Ash
Vo
lati
le
Mat
ter
Fix
ed
Car
bo
n
Gro
ss
Cal
ori
fic V
alu
e
Net
Cal
ori
fic
Val
ue
Su
lph
ur
Cru
cib
le
Sw
ellin
g
Ash
Fu
sio
n
Tem
p H
emi
Vo
lati
le M
atte
r D
ry A
sh F
ree
Gro
ss C
alo
rifi
c V
alu
e D
ry A
sh F
ree
% % % % MJ/kg MJ/kg % No. ˚C % MJ/kg
Waikato
Huntly East No. 1 20.6 3.8 34.7 41.1 22.93 21.55 0.21 0 1280 45.8 30.29
Kopako 26.7 3.9 33.4 36.0 20.17 18.75 0.15 0 1220 48.1 29.06
O’Reilly’s 19.8 5.8 34.6 39.8 22.13 20.80 0.23 0 1260 46.5 29.74
Rotowaro 21.0 4.6 34.4 40.1 22.24 20.88 0.23 0 1210 46.1 29.87
Buller
Cascade 9.7 1.6 36.1 52.7 29.96 28.65 0.60 3 1/2 1290 40.6 33.76
Heaphy 18.1 3.8 36.8 41.3 24.20 22.85 2.25 0 1140 47.1 30.99
New Creek 18.9 1.6 36.4 43.2 23.93 22.57 4.2 1/2 1120 45.7 30.08
Stockton 8.1 2.9 31.0 58.0 31.65 30.40 1.9 9 1550 34.8 35.56
Reefton
Echo 5.9 2.1 38.7 53.2 30.87 29.61 0.46 3 1/2 1500 42.1 33.57
Giles Creek 29.4 2.8 32.1 35.7 19.04 17.60 0.42 0 1260 47.4 28.09
Island Block 6.6 2.1 39.3 51.9 30.46 29.19 1.51 4 1220 43.1 33.39
Terrace 15.1 5.1 36.6 43.2 24.98 23.71 1.11 1 1180 45.9 31.28
Greymouth
Roa 6.7 6.5 18.5 68.3 31.95 30.77 0.27 9+ 1360 21.3 36.82
Spring Creek 10.2 2.5 37.6 49.7 29.83 28.53 0.35 2 1/2 1230 43.1 34.19
Canterbury
Mt Somers 28.1 11.6 29.3 31.1 17.71 16.35 2.50 0 1300 48.6 29.32
Canterbury Coal 27.5 3.0 32.4 37.1 20.84 19.40 0.38 0 1300 46.6 29.99
Otago
Harliwich 28.8 6.3 38.2 26.6 18.52 17.11 0.43 0 1290 58.9 28.54
Kai Point 30.4 4.7 30.8 34.1 19.67 18.19 1.52 0 1340 47.5 30.31
Goodwin 42.2 3.1 29.8 24.9 14.98 13.36 0.47 0 1360 54.5 27.36
Southland
New Vale 40.5 3.1 29.9 26.4 15.25 13.66 0.34 0 1310 53.2 27.08
Ohai 18.3 4.3 34.4 43.0 24.11 22.77 0.28 0 1190 44.4 31.12
Waituna 39.6 5.5 31.0 23.9 14.53 12.96 0.58 0 1200 56.5 26.47

Page 16 Coal
Proximate analysis
This is the most commonly used analysisfor general coal characterisation anddetermines the proportion by weight ofmoisture, volatile matter, fixed carbonand ash.
The analysis is a convenient, empiricalprocedure requiring the standardisationof methods and, especially for low-rankcoals, the standardisation of moisturedetermination. Figure 3.3 shows therelationship of proximate analysisdetermination to coal composition.
Moisture
Moisture content is measured as the lossof water from coal on heating to 105°C.Since the moisture contents of coalschange with changing conditions oftemperature and humidity, and becausethe moisture content measured is the
basis for expressing other properties,including specific energy, the treatment acoal receives between being removedfrom the ground and being analysed iscritical. Without standardised proceduresfor moisture determination, systematiccomparison of coals for scientific andcommercial purposes is not possible, andclassifications based on moisture content(e.g. ASTM) cannot be used. Since 1959coals analysed by what is now CRLEnergy Ltd are air-dried at 20°C and 70%relative humidity before analysis.
A confusing array of terms is used todescribe the nature of the moisturecontained in a coal and the moistureactually measured by analysis. The mostimportant of these are:
• inherent moisture, which is thatcontained in the coal substance at100% relative humidity and is roughly
UltimateAnalysis
ProximateAnalysisRAW COAL
Moisture(usuallyair-dried)
TotalMoisture
Surface Moisture Loss on Air Drying
Inherent Moisture(≅ Bed Moisture)
Moisture inAir-dried Coal
Fixed CarbonCarbon Organic Matter
(pure coal)
Volatile Matter
Ash
Hydrogen
OxygenNitrogenSulphur
Wh
Si, Al, Ca, MgFe, S, etc.
Mineralmatter
Organic
Pyritic and sulphateSul
phur
Wh = water of hydration
≠
Figure 3.3. Relationship of Ultimate and Proximate analysis to raw coal composition
Page 17New Zealand Energy Information Handbook
equivalent to the natural bedmoisture required for ASTM classifica-tion
• free or surface moisture that isadhering to the coal particles inexcess of inherent moisture.
Lignites may contain up to 65% inherentmoisture, which starts to be lost veryquickly on exposure to air and cannot allbe reinstated, so that sampling proce-dures for low-rank, high-moisture coalsare very important. On the other hand,high-rank bituminous coals have inherentmoisture contents as low as 1% or 2%,and their total moisture content is likelyto increase after mining by an increase insurface moisture, and, unlike low-rankcoals, their inherent moisture contentmay increase slightly with weathering.
Volatile matter
Determination of volatile matter is by anempirical weight loss method involvingheating the coal to 900°C. Accuratemeasurement for comparative purposesrequires close adherence to exactspecifications. Volatile matter as suchdoes not occur in coal, but is composedof the products of thermal decompositionformed during heating.
Fixed carbon
This is obtained by the difference ofmoisture, ash and volatile matter from100. The determination is not equivalentto carbon in the ultimate analysis, but isa measure of the solid combustiblematerial left after moisture and volatileshave been expelled.
Ash
As measured by proximate analysis, ashis the non-combustible residue remainingafter burning of the coal sample. Ashdoes not occur as such in coal, but is
formed during the combustion processfrom small amounts of mineral matterinherent in the vegetable material of thecoal substance, and more importantlyfrom adventitious minerals such as claysand quartz in detrital material introducedduring peat accumulation.
New Zealand coals have generally lowash contents by world standards, oftenaround 5%. A few coals, such as somenear Westport, have ash contents as lowas 0.1% or less.
Miscellaneous analyses
As well as those listed above, there areseveral other tests, including Ash FusionTemperature, Hardgrove GrindabilityIndex, ssh constituents and GieselerPlastometer.
Specific Energy (calorific value)
The heating value of coal is principallydetermined by the combustion of thecarbon and hydrogen of the organicmaterial; the combustion of sulphur alsocontributes. This is one of the keymeasurements for coal classification andutilisation.
Forms of sulphur
Sulphur in coals is present in threedistinct forms: pyritic sulphur, sulphatesulphur, and organic sulphur. A distin-guishing feature of New Zealand coals, incomparison with overseas coals, is thehigh proportion of organic sulphur.
Distinction between the forms of sulphuris important. In the ASTM classificationsystem, the adjustment for mineral mattercontent in the coal material so as todetermine the pure coal compositionassumes that all sulphur is pyrite. NewZealand coals also have a very large range

Page 18 Coal
of sulphur contents, which can haveimportant implications for utilisation.
Crucible Swelling Number
Crucible Swelling Number is an empiricalmeasure of the increase in volume of acoal when it is heated without restrictionunder specific conditions. It is associatedwith the plastic properties of coal and isprincipally determined by coal rank, butis significantly affected by coal type.
The test is used to evaluate cokingpotential as well as to predict thebehaviour of coal in some types ofcombustion equipment. In New Zealand,only West Coast bituminous coals showswelling properties.
CO2 Emission Factors
CO2 emission factors refer to the amountsof CO2 that are released in to theatmosphere when fossil fuels are burned.They are expressed either in terms oftonnes CO2/TJ of fuel burned, or tonnescarbon/TJ (where the carbon refers to thecarbon content of the CO2 emissions).
Typical values for CO2 emissions for NewZealand coals are shown in Table 3.5.
In general, this Handbook presents CO2emission factors only, i.e. the incorpora-
tion of emissions such as methane andnitrous oxides into a CO2-e
factor isgenerally not presented here.
Other coal-based solid fuels
Coke is produced by heating bituminouscoals in the absence or near absence ofair. As the coal is heated it melts for abrief time at temperatures just above400˚C, swells, then resolidifies as thetemperature rises above 450˚C. Duringthe melting/resolidification process, thecoal undergoes structural changeresulting in a solid material having largerpores and thicker wall structure, which ishigh in carbon and low in moisture andvolatile matter.
Metallurgical coke is produced in thesame way as coke, but at a highertemperature resulting in a harder,stronger substance. It is used in the ironand steel industry, both as a chemicalagent and a source of energy.
Char is produced by low temperaturedistillation of non-bituminous coals thatdo not melt and resolidify; the resultingmaterial retains the finer pore structure ofthe original coal.
Typical calorific values for coke and charare given in Table 3.6.
Solid Fuel type Emission Factor
tC/TJ tCO2/TJ
Bituminous 24.2 88.8
Sub-bituminous 24.9 91.2
Lignite 26.0 95.2
Source: New Zealand's Greenhouse Gas Inventory 1990 – 2002, Ministry for the Environment
Table 3.5: Typical values for CO2emission factors for New Zealand coals
Fuel Type GCV
MJ/kg
NCV
MJ/kg
Coke (8%-12% moisture)
27.9 27.5
Metallurgical coke 29.7 29.5
Char 29.0 28.2
Source: New Zealand Energy Information Handbook, 2nd Edition, 1993.
Table 3.6: Typical calorific values of coal-based solid fuels
Page 19New Zealand Energy Information Handbook
4 4 4 4 4 Natural GasNatural GasNatural GasNatural GasNatural Gas
Character of the resource
Natural gas occurs in undergroundaccumulations often in association withcrude petroleum or condensate. Itconsists mainly of methane, but may alsocontain substantial quantities of ethane,propane, butane, other longer chainhydrocarbons, and trace quantities ofunsaturated hydrocarbons (ethylene,propylene, etc.).
It is not uncommon, in some parts of theworld, for these hydrocarbon componentsof natural gas to be associated withsignificant amounts of carbon dioxide,nitrogen and hydrogen sulphide gases.For example, some Russian and Canadiansources of natural gas have more than70% hydrogen sulphide (by volume). InNew Zealand, raw Kapuni natural gascontains approximately 43% carbondioxide (by volume).
Gas treatment
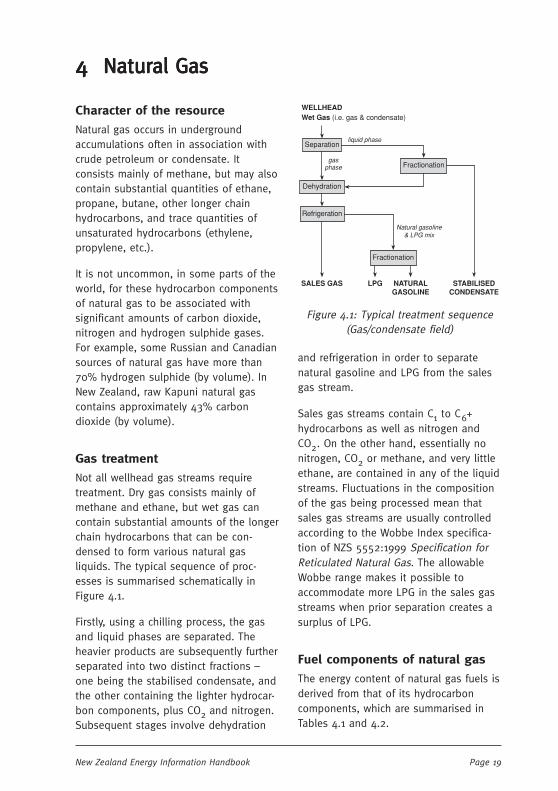
Not all wellhead gas streams requiretreatment. Dry gas consists mainly ofmethane and ethane, but wet gas cancontain substantial amounts of the longerchain hydrocarbons that can be con-densed to form various natural gasliquids. The typical sequence of proc-esses is summarised schematically inFigure 4.1.
Firstly, using a chilling process, the gasand liquid phases are separated. Theheavier products are subsequently furtherseparated into two distinct fractions –one being the stabilised condensate, andthe other containing the lighter hydrocar-bon components, plus CO2 and nitrogen.Subsequent stages involve dehydration
and refrigeration in order to separatenatural gasoline and LPG from the salesgas stream.
Sales gas streams contain C1 to C6+hydrocarbons as well as nitrogen andCO2. On the other hand, essentially nonitrogen, CO2 or methane, and very littleethane, are contained in any of the liquidstreams. Fluctuations in the compositionof the gas being processed mean thatsales gas streams are usually controlledaccording to the Wobbe Index specifica-tion of NZS 5552:1999 Specification forReticulated Natural Gas. The allowableWobbe range makes it possible toaccommodate more LPG in the sales gasstreams when prior separation creates asurplus of LPG.
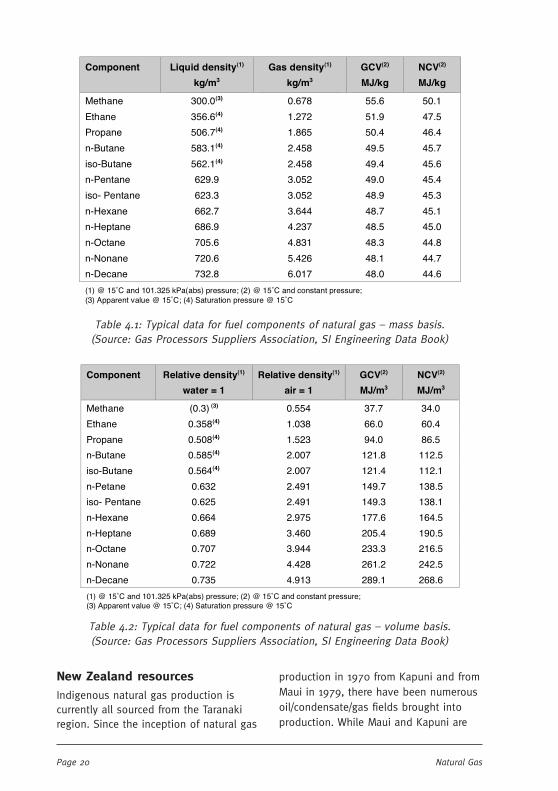
Fuel components of natural gas
The energy content of natural gas fuels isderived from that of its hydrocarboncomponents, which are summarised inTables 4.1 and 4.2.
Separation
Dehydration
Refrigeration
Fractionation
Fractionation
liquid phase
gasphase
Natural gasoline& LPG mix
LPG NATURALGASOLINE
STABILISEDCONDENSATE
SALES GAS
WELLHEADWet Gas (i.e. gas & condensate)
Figure 4.1: Typical treatment sequence(Gas/condensate field)
Page 20 Natural Gas
New Zealand resources
Indigenous natural gas production iscurrently all sourced from the Taranakiregion. Since the inception of natural gas
production in 1970 from Kapuni and fromMaui in 1979, there have been numerousoil/condensate/gas fields brought intoproduction. While Maui and Kapuni are
Component Liquid density(1)
kg/m3
Gas density(1)
kg/m3
GCV(2)
MJ/kg
NCV(2)
MJ/kg
Methane 300.0(3) 0.678 55.6 50.1
Ethane 356.6(4) 1.272 51.9 47.5
Propane 506.7(4) 1.865 50.4 46.4
n-Butane 583.1(4) 2.458 49.5 45.7
iso-Butane 562.1(4) 2.458 49.4 45.6
n-Pentane 629.9 3.052 49.0 45.4
iso- Pentane 623.3 3.052 48.9 45.3
n-Hexane 662.7 3.644 48.7 45.1
n-Heptane 686.9 4.237 48.5 45.0
n-Octane 705.6 4.831 48.3 44.8
n-Nonane 720.6 5.426 48.1 44.7
n-Decane 732.8 6.017 48.0 44.6
(1) @ 15˚C and 101.325 kPa(abs) pressure; (2) @ 15˚C and constant pressure; (3) Apparent value @ 15˚C; (4) Saturation pressure @ 15˚C
Table 4.1: Typical data for fuel components of natural gas – mass basis.(Source: Gas Processors Suppliers Association, SI Engineering Data Book)
Component Relative density(1)
water = 1
Relative density(1)
air = 1
GCV(2)
MJ/m3
NCV(2)
MJ/m3
Methane (0.3) (3) 0.554 37.7 34.0
Ethane 0.358(4) 1.038 66.0 60.4
Propane 0.508(4) 1.523 94.0 86.5
n-Butane 0.585(4) 2.007 121.8 112.5
iso-Butane 0.564(4) 2.007 121.4 112.1
n-Petane 0.632 2.491 149.7 138.5
iso- Pentane 0.625 2.491 149.3 138.1
n-Hexane 0.664 2.975 177.6 164.5
n-Heptane 0.689 3.460 205.4 190.5
n-Octane 0.707 3.944 233.3 216.5
n-Nonane 0.722 4.428 261.2 242.5
n-Decane 0.735 4.913 289.1 268.6
(1) @ 15˚C and 101.325 kPa(abs) pressure; (2) @ 15˚C and constant pressure; (3) Apparent value @ 15˚C; (4) Saturation pressure @ 15˚C
Table 4.2: Typical data for fuel components of natural gas – volume basis.(Source: Gas Processors Suppliers Association, SI Engineering Data Book)

Page 21New Zealand Energy Information Handbook
still the largest individual producers, thereis a growing diversification of theproduction base including McKee/Mangahewa, Tariki/Ahuroa and Rimu/Kauriwith Pohokura having produced its firstgas in 2006 and Kupe planned to beginproduction in 2009.
Several other fields have been drilled inrecent times and show reserves potential,but further exploration activity is requiredto prove the reserves and the ability toflow the hydrocarbons from the reservoirs.
Typically, New Zealand’s natural gasescontain 5%-10% ethane, 3%-5% propaneand yet smaller proportions of longerchain hydrocarbons. Of the principalnatural gas sources raw Kapuni gas hasan unusually high carbon dioxide level –approximately 43% by volume. Whenused as a chemical feedstock for themanufacture of methanol, the carbondioxide is a useful constituent and canbe left in, or blended into, the processfeedstock up to about 19%-20% CO2 byvolume. However CO2 has no usefulenergy content.
When natural gas is to be used in thegeneral retail market carbon dioxide mustbe reduced to such a level that the naturalgas complies with the Wobbe Number (andother parameters), specified in NZS5442:1999 Specification for ReticulatedNatural Gas. This would generally entailthe carbon dioxide content being reducedto less than 8%, depending on the level ofother gas constituents.
Location of major facilities
The on-shore production fields, theproduction station for Maui gas atOaonui, and the three major petrochemi-cal plants are all located in close proxim-ity to each other, as shown in Figure 4.2.
Natural gas distribution
Without any link across Cook Strait,natural gas can only be reticulated bypipeline around the North Island. Anoverview of the existing distributionnetwork is given in Figure 4.3.
Overview of natural gas salesstreams
The consumption of natural gas in NewZealand can be categorised into fourprincipal uses – electricity generation,petrochemicals manufacture in theTaranaki region, major industrial usersand reticulation to domestic and commer-cial consumers around the North Island.
In the current market gas from any fieldis likely to end up in any of the abovemarkets. With the advent of open accesson most pipeline systems, most sourcesof natural gas can be transported, by onecontractual means or another, to almostany market point of demand. Several ofthe key gas market players are alsoinvolved in more than one marketsegment. All natural gas sources areinterchangeable as they must all meetthe requirements of NZS 5442:1999 ifthey are to be transported in an openaccess pipeline.
Liquefied Petroleum Gas (LPG)
Liquefied Petroleum Gas (LPG) is amixture predominantly of commercialbutane and commercial propane. It willtherefore contain variable but very smallamounts of other closely related hydro-carbons. LPG is stored under pressure inits liquid phase at about 600 kPadepending upon ambient temperaturesand product mix. Its composition isdetermined by production parameters butis typically 60% propane and 40% butaneon a volumetric basis and generally

Page 22 Natural Gas
described as Mix. Higher propane contentLPG is described as propane enrichedproduct. Variations are permitted and arespecified in NZS 5435:1996.
NZ produced LPG is a by-product of theNatural Gas stream and is treated andshipped from Taranaki to Auckland(Manukau), Christchurch, and Dunedinports. Product is also sold on theinternational market and shippedoffshore, mainly to the Pacific Islands.Internal distribution within NZ is essen-tially by road tanker, with a minor volume
by rail. It is loaded by mass (tonnes) viaa weighbridge into road tankers, butdelivered into storage at customer sitesby metered volume (litres). The principaldistributor is the industry ownedLiquigas, with large bulk storage depotsadjacent to the above ports and fromwhich the wholesalers draw much of theirproduct. In the NI a large volume ofproduct is delivered directly from theTaranaki fields by road tanker.
LPG is typically sold on a mass basis incylinders to leisure, domestic, and
Figure 4.2: Location of major gas and oilfields. Inset - location of major facilities
(Source: MED, 2007)
PatekeAmokura
Tui
Granted PMP Nov 0527.9 mmbbls
Maui3686.57 (482.650)235.296 (28.805)
Kupe28822.0 (inc. LPG)
Kahili
McKee182.7 (58.387)47.741 (1.9)
Kaimiro/Ngatoro25.74 (8.182)
10.822 (3.250)
Moturoa
Discovered2003/2004
Maari (granted PMP Dec 05)49.0 mmbbls
Toru
Pohokura700 Bcf42.8 mmbbls
Discovered2000
Kauri42.285 (33.141)5.719 (5.025)
Rimu22.000 (19.554)4.700 (4.036)
Cheal5.871 (5.871)4.402 (4.317)
Waihapa/Ngaere28.838 (0.465)24.153 (0.557)
Tariki/Ahuroa115.48 (28.364)6.29 (1.966)
Turangi (discovered 2005)137.04.8
Windsor
Kapuni1439.01 (374.170)66.87 (5.17)
Radnor18.1170.479
Surrey0.441 (0.441)0.607 (0.347)
Mangahewa72.5 (37.243)9.664 (0.156)
High Pressure Gas Pipeline
Liquid Products Pipeline
Field NameGas: Ultimate (Remaining) Reserves BcfOil: Ultimate (Remaining) Reserves mmbbl
Gas Field Oil Field
0 25 50
Kilometers
N
NewPlymouth
New PlymouthPower Station
KAIMIRO
McKEE
WAIHAPA
KAPUNIPRODUCTION
STATION & GASTREATMENT
PLANT
OAONUIPRODUCTION
STATION
From MauiPlatform
Stratford
Hawera
Ammonia–Urea
Motunui(methanol - mothballed)
Waitara(methanol)
Taranaki CCPower Station
KUPEPRODUCTION
STATION
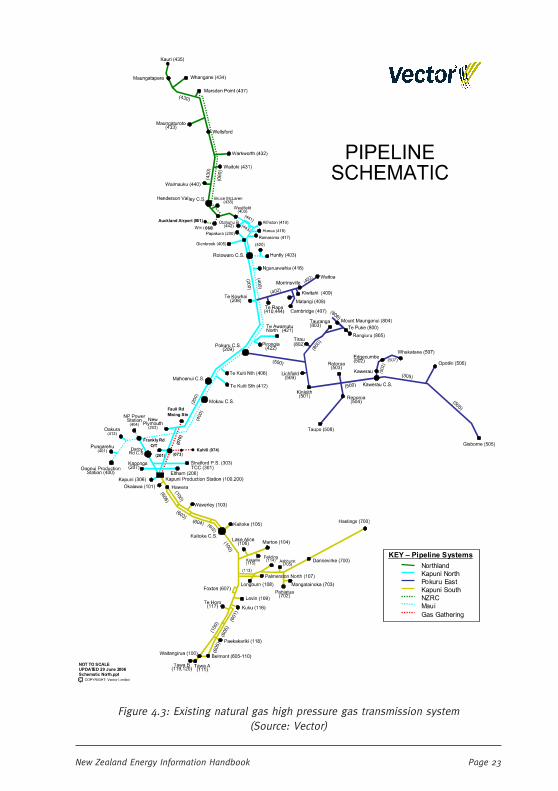
Page 23New Zealand Energy Information Handbook
Figure 4.3: Existing natural gas high pressure gas transmission system(Source: Vector)
(073)
060
Auckland Airport (061)
Kahili (074)(201)
Frankly RdO/T
Faull RdMixing Stn
(070
)
KEY – Pipeline SystemsNorthlandKapuni NorthPokuru EastKapuni SouthNZRCMauiGas Gathering
NOT TO SCALEUPDATED 29 June 2006Schematic North.ppt
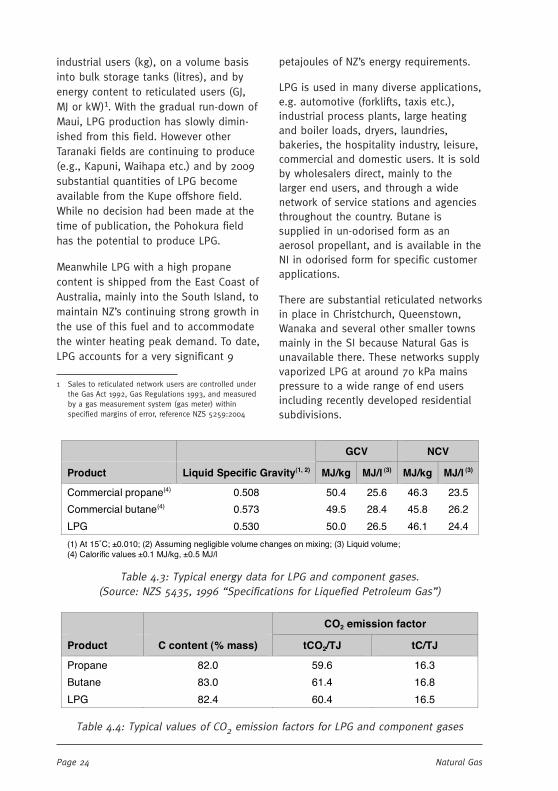
Page 24 Natural Gas
industrial users (kg), on a volume basisinto bulk storage tanks (litres), and byenergy content to reticulated users (GJ,MJ or kW)1. With the gradual run-down ofMaui, LPG production has slowly dimin-ished from this field. However otherTaranaki fields are continuing to produce(e.g., Kapuni, Waihapa etc.) and by 2009substantial quantities of LPG becomeavailable from the Kupe offshore field.While no decision had been made at thetime of publication, the Pohokura fieldhas the potential to produce LPG.
Meanwhile LPG with a high propanecontent is shipped from the East Coast ofAustralia, mainly into the South Island, tomaintain NZ’s continuing strong growth inthe use of this fuel and to accommodatethe winter heating peak demand. To date,LPG accounts for a very significant 9
petajoules of NZ’s energy requirements.
LPG is used in many diverse applications,e.g. automotive (forklifts, taxis etc.),industrial process plants, large heatingand boiler loads, dryers, laundries,bakeries, the hospitality industry, leisure,commercial and domestic users. It is soldby wholesalers direct, mainly to thelarger end users, and through a widenetwork of service stations and agenciesthroughout the country. Butane issupplied in un-odorised form as anaerosol propellant, and is available in theNI in odorised form for specific customerapplications.
There are substantial reticulated networksin place in Christchurch, Queenstown,Wanaka and several other smaller townsmainly in the SI because Natural Gas isunavailable there. These networks supplyvaporized LPG at around 70 kPa mainspressure to a wide range of end usersincluding recently developed residentialsubdivisions.
GCV NCV
Product Liquid Specific Gravity(1, 2) MJ/kg MJ/l (3) MJ/kg MJ/l (3)
Commercial propane(4) 0.508 50.4 25.6 46.3 23.5
Commercial butane(4) 0.573 49.5 28.4 45.8 26.2
LPG 0.530 50.0 26.5 46.1 24.4
(1) At 15˚C; ±0.010; (2) Assuming negligible volume changes on mixing; (3) Liquid volume; (4) Calorific values ±0.1 MJ/kg, ±0.5 MJ/l
Table 4.3: Typical energy data for LPG and component gases.(Source: NZS 5435, 1996 “Specifications for Liquefied Petroleum Gas”)
CO2 emission factor
Product C content (% mass) tCO2/TJ tC/TJ
Propane 82.0 59.6 16.3
Butane 83.0 61.4 16.8
LPG 82.4 60.4 16.5
Table 4.4: Typical values of CO2 emission factors for LPG and component gases
1 Sales to reticulated network users are controlled underthe Gas Act 1992, Gas Regulations 1993, and measuredby a gas measurement system (gas meter) withinspecified margins of error, reference NZS 5259:2004
Page 25New Zealand Energy Information Handbook
5 5 5 5 5 PetroleumPetroleumPetroleumPetroleumPetroleum
Character of the resource
Crude petroleum is a naturally occurringflammable liquid extracted from mineraldeposits – literally ‘rock oil’. It consistsmainly of a complex mixture of hydrocar-bons: more than 90% by weight beingcarbon (C) and hydrogen (H), with theremainder made up of sulphur (S), oxygen(O), nitrogen (N), and various metals.Some crude oils can be burnt directly, butmost are sent to refineries for processing.Natural gas liquids or condensates aremade up of the longer chain and morecomplex hydrocarbons in crude naturalgas streams. They are extracted from thewet gas stream at the wellhead or atgasoline absorption plants.
New Zealand resources
New Zealand has a number of discoveredoil and condensate reservoirs in theTaranaki region. Main production sourcesfor a number of years are the Maui,Kapuni and McKee fields.
In 2006 and 2007, significant production,by New Zealand standards, began at thePohokura and Tui fields, respectively. Theimminent development of the Kupe,Maari and Cheal fields attests to theprospectivity of the Taranaki theatre foroil and gas.
Technical infrastructure
New Zealand’s petroleum needs areprovided from indigenous resources andimports of crude oil and refined petroleumproducts. New Zealand is served by oneoil refinery, located at Marsden Point, thatcan produce all types of refined petroleumproduct required in this country with theexception of aviation gasoline, light
kerosene and lubricating oils.
Distribution of petroleum products fromMarsden Point takes place via coastaltankers to the main ports around thecountry, via a truck loading facilityadjacent to the refinery for Northlanddistribution, or via a pipeline (approxi-mately 50%) to Wiri, in South Auckland.Road tankers distribute products fromwholesaler storage tanks to retailers andbulk customers.
Product density
Petroleum products differ in both densityand energy content. Liquid densities areusually expressed in terms of specificgravity. In the international petroleumindustry, an alternative measure is API(American Petroleum Institute) gravity (fordetails see Section 16 on conversionfactors). The lightest petroleum productsare about half as heavy as water, whilethe heaviest are slightly heavier thanwater. There can be significant differenceseven within various categories of productas indicated in Figure 5.1.
Energy and product density
The energy content of both crudepetroleum and its refined products isclosely related to their specific gravity, asillustrated in Figure 5.2.
Energy content of petroleumcommodities
Data on the energy content of petroleumcommodities are listed under severalcategories:
• crude feedstocks to the refinery;
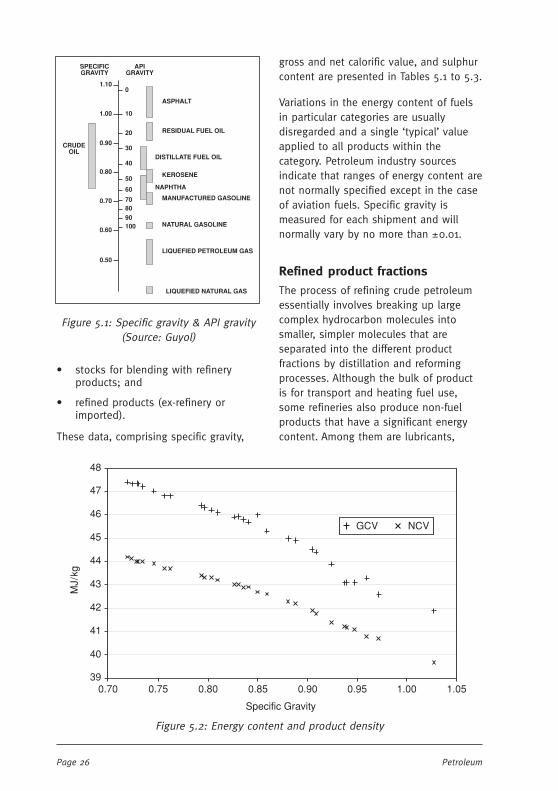
Page 26 Petroleum
• stocks for blending with refineryproducts; and
• refined products (ex-refinery orimported).
These data, comprising specific gravity,
gross and net calorific value, and sulphurcontent are presented in Tables 5.1 to 5.3.
Variations in the energy content of fuelsin particular categories are usuallydisregarded and a single ‘typical’ valueapplied to all products within thecategory. Petroleum industry sourcesindicate that ranges of energy content arenot normally specified except in the caseof aviation fuels. Specific gravity ismeasured for each shipment and willnormally vary by no more than ±0.01.
Refined product fractions
The process of refining crude petroleumessentially involves breaking up largecomplex hydrocarbon molecules intosmaller, simpler molecules that areseparated into the different productfractions by distillation and reformingprocesses. Although the bulk of productis for transport and heating fuel use,some refineries also produce non-fuelproducts that have a significant energycontent. Among them are lubricants,
Figure 5.1: Specific gravity & API gravity(Source: Guyol)
48
47
46
45
44
43
42
41
40
390.70 0.75 0.80 0.85 0.90 0.95 1.00 1.05
Specific Gravity
MJ/
kg
NCVGCV
Figure 5.2: Energy content and product density
1.10
1.00
0.80
0.90
0.70
0.60
0.50
0
10
20
30
40
50
60
708090100
SPECIFICGRAVITY
APIGRAVITY
ASPHALT
RESIDUAL FUEL OIL
DISTILLATE FUEL OIL
KEROSENE
NAPHTHA
MANUFACTURED GASOLINE
NATURAL GASOLINE
LIQUEFIED PETROLEUM GAS
LIQUEFIED NATURAL GAS
CRUDEOIL

Page 27New Zealand Energy Information Handbook
including oils and greases, bitumen (orasphalt), paraffin wax, white spirits andother products used as solvents, andpetroleum coke that is rich in carbon andused in the manufacture of carbonelectrodes. How these different productfractions are related to end use issummarised in Table 5.4.
In the mid 1980s the Marsden Point
refinery was modernised and expanded toincorporate a hydrocracker unit, allowinglarger quantities of heavier feedstocks tobe processed. As a result of changes topetroleum product specifications a largehydrodesulphuriser for diesel and abenzene removal unit for petrol wereadded to the refinery in 2005. As of 2007,a significant ($180m) ‘Future Fuels’upgrade and expansion is underway.
Feedstock Specific Gravity1 GCV NCV S
MJ/kg MJ/l MJ/kg MJ/l % mass
Al Shaheen 0.87 44.4 38.6 41.7 36.3 2.49
Arabian extra light crude 0.83 45.5 37.7 42.6 35.4 1.09
Champion 0.90 44.7 40.3 42.1 37.9 0.15
Kapuni condensate 0.76 46.8 35.6 43.7 33.2 0.04
Khafji 0.89 43.9 39.1 41.3 36.8 2.94
Low sulphur residue 0.91 44.4 40.4 41.8 38.0 0.16
Lower Zakum 0.83 45.5 37.8 42.7 35.4 1.02
Masila 0.87 45.0 39.2 42.3 36.8 0.62
Maui condensate 0.75 47.0 35.1 43.9 32.7 0.01
McKee Blend 0.82 46.0 37.7 43.1 35.3 0.08
Miri light crude 0.84 45.7 38.5 43.1 36.3 0.08
Murban 0.83 45.9 37.9 43.0 35.5 0.80
Pohokura 0.79 46.4 36.7 43.4 34.3 0.04
Qatar Land 0.82 45.6 37.4 42.7 35.0 1.22
Qatar Marine 0.86 44.7 38.4 42.0 36.1 2.02
Ratawi 0.91 43.4 39.5 40.9 37.2 3.59
Umm Shaif 0.84 45.7 38.4 42.9 36.0 1.31
Varanus Light 0.78 46.6 36.3 43.5 34.0 0.02
West Seno 0.83 45.8 38.0 43.0 35.7 0.12
Woollybutt 0.78 46.6 36.3 43.5 34.0 0.01
1 at 15˚C and atmospheric pressure
Table 5.1: Typical values for crude feedstocks to the Marsden Point refinery (Source:The NZ Refining Co Ltd)
GCV NCV S
Blendstock Specific Gravity MJ/kg MJ/l MJ/kg MJ/l % mass
Light cycle oil 0.91 44.5 40.5 41.5 38.2 0.3
Cracked spirit 0.72 47.3 34.1 44.1 31.8 0.025
Premium Unleaded Petrol 0.73 47.2 34.5 44.0 32.2 0.01
Table 5.2: Typical values for blendstock (Source: The NZ Refining Co Ltd)
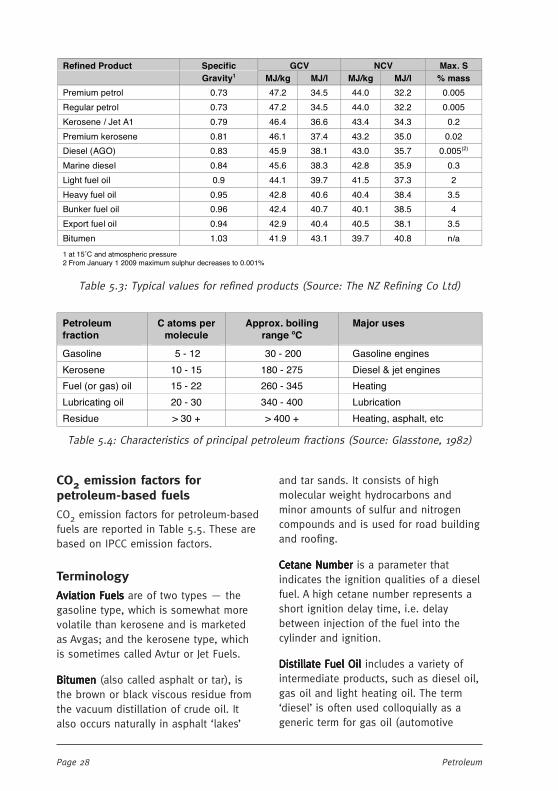
Page 28 Petroleum
CO2 emission factors forpetroleum-based fuels
CO2 emission factors for petroleum-basedfuels are reported in Table 5.5. These arebased on IPCC emission factors.
Terminology
Aviation FuelsAviation FuelsAviation FuelsAviation FuelsAviation Fuels are of two types — thegasoline type, which is somewhat morevolatile than kerosene and is marketedas Avgas; and the kerosene type, whichis sometimes called Avtur or Jet Fuels.
BitumenBitumenBitumenBitumenBitumen (also called asphalt or tar), isthe brown or black viscous residue fromthe vacuum distillation of crude oil. Italso occurs naturally in asphalt ‘lakes’
and tar sands. It consists of highmolecular weight hydrocarbons andminor amounts of sulfur and nitrogencompounds and is used for road buildingand roofing.
Cetane NumberCetane NumberCetane NumberCetane NumberCetane Number is a parameter thatindicates the ignition qualities of a dieselfuel. A high cetane number represents ashort ignition delay time, i.e. delaybetween injection of the fuel into thecylinder and ignition.
Distillate Fuel OilDistillate Fuel OilDistillate Fuel OilDistillate Fuel OilDistillate Fuel Oil includes a variety ofintermediate products, such as diesel oil,gas oil and light heating oil. The term‘diesel’ is often used colloquially as ageneric term for gas oil (automotive
Refined Product Specific GCV NCV Max. S Gravity1 MJ/kg MJ/l MJ/kg MJ/l % mass
Premium petrol 0.73 47.2 34.5 44.0 32.2 0.005
Regular petrol 0.73 47.2 34.5 44.0 32.2 0.005
Kerosene / Jet A1 0.79 46.4 36.6 43.4 34.3 0.2
Premium kerosene 0.81 46.1 37.4 43.2 35.0 0.02
Diesel (AGO) 0.83 45.9 38.1 43.0 35.7 0.005(2)
Marine diesel 0.84 45.6 38.3 42.8 35.9 0.3
Light fuel oil 0.9 44.1 39.7 41.5 37.3 2
Heavy fuel oil 0.95 42.8 40.6 40.4 38.4 3.5
Bunker fuel oil 0.96 42.4 40.7 40.1 38.5 4
Export fuel oil 0.94 42.9 40.4 40.5 38.1 3.5
Bitumen 1.03 41.9 43.1 39.7 40.8 n/a
1 at 15˚C and atmospheric pressure 2 From January 1 2009 maximum sulphur decreases to 0.001%
Table 5.3: Typical values for refined products (Source: The NZ Refining Co Ltd)
Petroleum fraction
C atoms per molecule
Approx. boiling range oC
Major uses
Gasoline 5 - 12 30 - 200 Gasoline engines
Kerosene 10 - 15 180 - 275 Diesel & jet engines
Fuel (or gas) oil 15 - 22 260 - 345 Heating
Lubricating oil 20 - 30 340 - 400 Lubrication
Residue > 30 + > 400 + Heating, asphalt, etc
Table 5.4: Characteristics of principal petroleum fractions (Source: Glasstone, 1982)
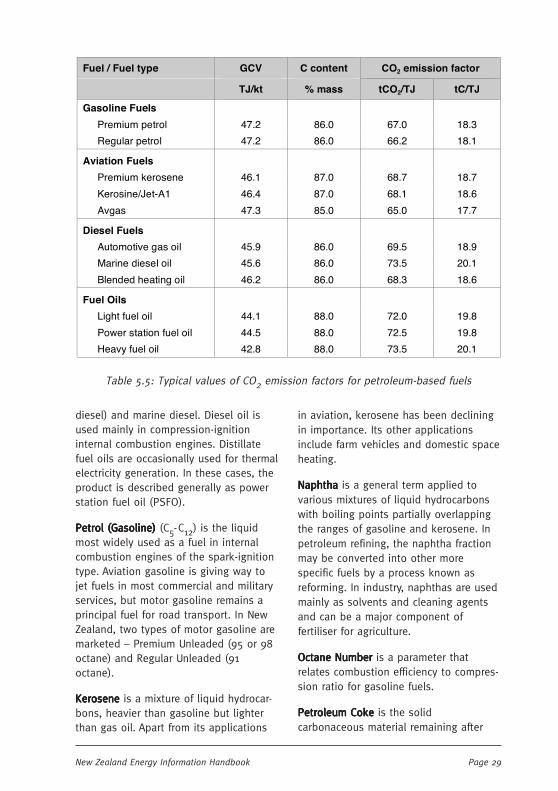
Page 29New Zealand Energy Information Handbook
diesel) and marine diesel. Diesel oil isused mainly in compression-ignitioninternal combustion engines. Distillatefuel oils are occasionally used for thermalelectricity generation. In these cases, theproduct is described generally as powerstation fuel oil (PSFO).
Petrol (Gasoline)Petrol (Gasoline)Petrol (Gasoline)Petrol (Gasoline)Petrol (Gasoline) (C5-C12) is the liquidmost widely used as a fuel in internalcombustion engines of the spark-ignitiontype. Aviation gasoline is giving way tojet fuels in most commercial and militaryservices, but motor gasoline remains aprincipal fuel for road transport. In NewZealand, two types of motor gasoline aremarketed – Premium Unleaded (95 or 98octane) and Regular Unleaded (91octane).
KeroseneKeroseneKeroseneKeroseneKerosene is a mixture of liquid hydrocar-bons, heavier than gasoline but lighterthan gas oil. Apart from its applications
Fuel / Fuel type GCV C content CO2 emission factor
TJ/kt % mass tCO2/TJ tC/TJ
Gasoline Fuels
Premium petrol 47.2 86.0 67.0 18.3
Regular petrol 47.2 86.0 66.2 18.1
Aviation Fuels
Premium kerosene 46.1 87.0 68.7 18.7
Kerosine/Jet-A1 46.4 87.0 68.1 18.6
Avgas 47.3 85.0 65.0 17.7
Diesel Fuels
Automotive gas oil 45.9 86.0 69.5 18.9
Marine diesel oil 45.6 86.0 73.5 20.1
Blended heating oil 46.2 86.0 68.3 18.6
Fuel Oils
Light fuel oil 44.1 88.0 72.0 19.8
Power station fuel oil 44.5 88.0 72.5 19.8
Heavy fuel oil 42.8 88.0 73.5 20.1
Table 5.5: Typical values of CO2 emission factors for petroleum-based fuels
in aviation, kerosene has been decliningin importance. Its other applicationsinclude farm vehicles and domestic spaceheating.
NaphthaNaphthaNaphthaNaphthaNaphtha is a general term applied tovarious mixtures of liquid hydrocarbonswith boiling points partially overlappingthe ranges of gasoline and kerosene. Inpetroleum refining, the naphtha fractionmay be converted into other morespecific fuels by a process known asreforming. In industry, naphthas are usedmainly as solvents and cleaning agentsand can be a major component offertiliser for agriculture.
Octane NumberOctane NumberOctane NumberOctane NumberOctane Number is a parameter thatrelates combustion efficiency to compres-sion ratio for gasoline fuels.
Petroleum CokePetroleum CokePetroleum CokePetroleum CokePetroleum Coke is the solidcarbonaceous material remaining after

Page 30 Petroleum
severe thermal decomposition of theresidual oils from petroleum distillation.Petroleum coke can serve as a fuel, but ithas important industrial non-fuel uses,such as the manufacture of carbonanodes for use in aluminium smelting.
Residual Fuel OilResidual Fuel OilResidual Fuel OilResidual Fuel OilResidual Fuel Oil is the residue ofpetroleum refining. It is sometimessubclassified into the categories of Lightand Heavy Fuel Oil and is used mainly asan industrial boiler fuel, including powerstation fuel oil (PSFO), and for marinebunkering purposes.
Page 31New Zealand Energy Information Handbook
6 6 6 6 6 GeothermalGeothermalGeothermalGeothermalGeothermal
Character of the resource
Geothermal energy is a globally vastrenewable energy resource consisting ofthermal energy, or heat, stored beneaththe earth’s surface or discharged from itas hot water and steam. This heat isbrought to the surface by thermalconduction and by near-surface intrusionsof molten magma originating from greatdepth.
The resulting heat flux is concentratedalong the tectonic plate boundaries,locations of elevated heat flow, andseismic and volcanic activity, the lattertransporting molten magma to depths of5-20 km, where it slowly cools and heatsthe surrounding rock. Where sufficientpermeability (due to the presence offractures) and/or porosity exist in this hotrock, and where water is naturallyavailable, it can circulate down andthrough the hot rock creating largereservoirs of hot fluid (water and/orsteam). These geothermal, or hydrother-mal, systems typically exhibit surfaceareas of several square kilometres overwhich are generally distributed variousthermal features such as hot springs,geysers, mudpools and fumaroles.
In hydrothermal systems, the energy(heat) in the reservoir is distributedbetween the hot rock and the hot fluidpresent in its fractures and pores. Toextract the geothermal heat it is neces-sary to produce the hot water and steamby drilling wells into the reservoirs.Typically, commercial geothermal re-sources require drilling to depths of lessthan 3 km. The hot fluids generallydischarge spontaneously from the wellsat sustainable flow rates of up to
hundreds of tonnes per hour for manyyears. Most hydrothermal reservoirs areliquid-dominated, i.e. the wells producemainly hot water; though some arevapour-dominated, with steam produced.
Serious attention is now also beingdirected to accessing the enormous heatresources available in the hot rockspresent at depths of 3-10 km, almostanywhere on earth, for electricityproduction. Once known as hot dry rock(HDR), because of the absence of waterin the hot rock of these resources, theterminology has now changed toenhanced [or engineered] geothermalsystems (EGS), because man mustliterally create the reservoir by enhancingpermeability (by fracturing the rock) andproviding the water, to access the heat.
Recent assessments of the deep heatresources for EGS development have beenperformed for the USA, and parts of Chinaand India, indicating potentials of at least100,000 MWe in each country that can beutilised for both electricity generation anddirect heat applications (such as industrialprocess heat, district heating, green-houses, aquaculture and heat pumps) asco-generation options prior to reinjectionof the fluid to continue the utilisationcycle. The first EGS pilot plants areexpected to be installed at Soultz-sous-Forêts, France and Cooper Basin, Australia,by mid-2008.
Commercial generation of electricitygenerally requires reservoir temperaturesin excess of about 100˚C; using flashsteam power plants for fluids withtemperatures greater than about 180˚Cand binary plants for the lower tempera-ture fluids. Developers typically aim to
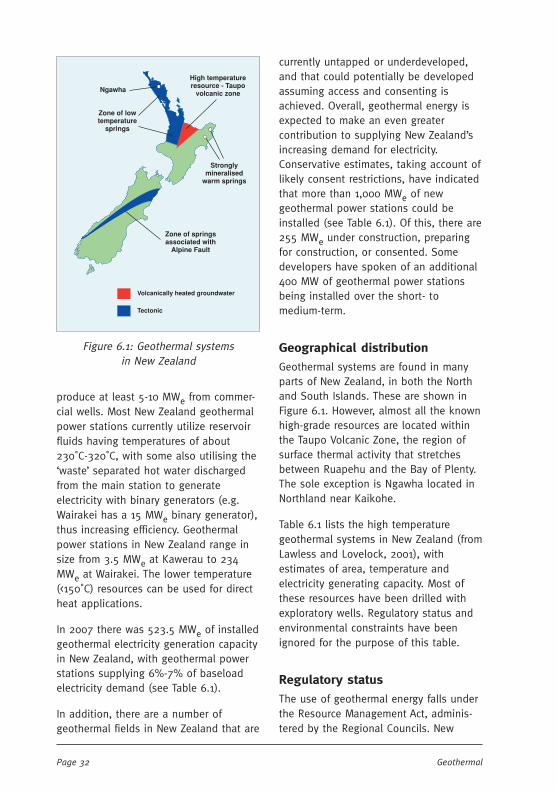
Page 32 Geothermal
produce at least 5-10 MWe from commer-cial wells. Most New Zealand geothermalpower stations currently utilize reservoirfluids having temperatures of about230˚C-320˚C, with some also utilising the‘waste’ separated hot water dischargedfrom the main station to generateelectricity with binary generators (e.g.Wairakei has a 15 MWe binary generator),thus increasing efficiency. Geothermalpower stations in New Zealand range insize from 3.5 MWe at Kawerau to 234MWe at Wairakei. The lower temperature(<150˚C) resources can be used for directheat applications.
In 2007 there was 523.5 MWe of installedgeothermal electricity generation capacityin New Zealand, with geothermal powerstations supplying 6%-7% of baseloadelectricity demand (see Table 6.1).
In addition, there are a number ofgeothermal fields in New Zealand that are
currently untapped or underdeveloped,and that could potentially be developedassuming access and consenting isachieved. Overall, geothermal energy isexpected to make an even greatercontribution to supplying New Zealand’sincreasing demand for electricity.Conservative estimates, taking account oflikely consent restrictions, have indicatedthat more than 1,000 MWe of newgeothermal power stations could beinstalled (see Table 6.1). Of this, there are255 MWe under construction, preparingfor construction, or consented. Somedevelopers have spoken of an additional400 MW of geothermal power stationsbeing installed over the short- tomedium-term.
Geographical distribution
Geothermal systems are found in manyparts of New Zealand, in both the Northand South Islands. These are shown inFigure 6.1. However, almost all the knownhigh-grade resources are located withinthe Taupo Volcanic Zone, the region ofsurface thermal activity that stretchesbetween Ruapehu and the Bay of Plenty.The sole exception is Ngawha located inNorthland near Kaikohe.
Table 6.1 lists the high temperaturegeothermal systems in New Zealand (fromLawless and Lovelock, 2001), withestimates of area, temperature andelectricity generating capacity. Most ofthese resources have been drilled withexploratory wells. Regulatory status andenvironmental constraints have beenignored for the purpose of this table.
Regulatory status
The use of geothermal energy falls underthe Resource Management Act, adminis-tered by the Regional Councils. New
Figure 6.1: Geothermal systemsin New Zealand
Zone of springsassociated with
Alpine Fault
Stronglymineralised
warm springs
High temperatureresource - Taupo
volcanic zoneNgawha
Zone of lowtemperature
springs
Volcanically heated groundwater
Tectonic
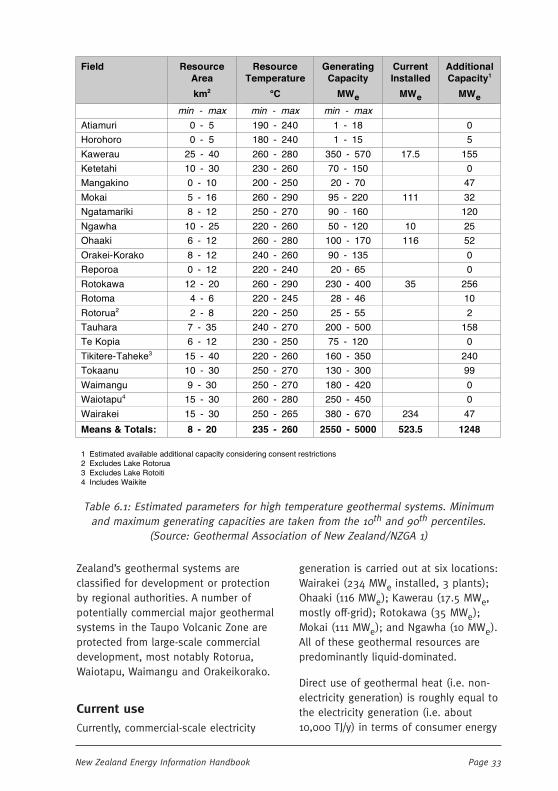
Page 33New Zealand Energy Information Handbook
Zealand’s geothermal systems areclassified for development or protectionby regional authorities. A number ofpotentially commercial major geothermalsystems in the Taupo Volcanic Zone areprotected from large-scale commercialdevelopment, most notably Rotorua,Waiotapu, Waimangu and Orakeikorako.
Current use
Currently, commercial-scale electricity
generation is carried out at six locations:Wairakei (234 MWe installed, 3 plants);Ohaaki (116 MWe); Kawerau (17.5 MWe,mostly off-grid); Rotokawa (35 MWe);Mokai (111 MWe); and Ngawha (10 MWe).All of these geothermal resources arepredominantly liquid-dominated.
Direct use of geothermal heat (i.e. non-electricity generation) is roughly equal tothe electricity generation (i.e. about10,000 TJ/y) in terms of consumer energy
Table 6.1: Estimated parameters for high temperature geothermal systems. Minimumand maximum generating capacities are taken from the 10th and 90th percentiles.
(Source: Geothermal Association of New Zealand/NZGA 1)
Field Resource Area
km2
Resource Temperature
°C
Generating Capacity
MWe
Current Installed
MWe
Additional Capacity1
MWe
min - max min - max min - max
Atiamuri 0 - 5 190 - 240 1 - 18 0
Horohoro 0 - 5 180 - 240 1 - 15 5
Kawerau 25 - 40 260 - 280 350 - 570 17.5 155
Ketetahi 10 - 30 230 - 260 70 - 150 0
Mangakino 0 - 10 200 - 250 20 - 70 47
Mokai 5 - 16 260 - 290 95 - 220 111 32
Ngatamariki 8 - 12 250 - 270 90 - 160 120
Ngawha 10 - 25 220 - 260 50 - 120 10 25
Ohaaki 6 - 12 260 - 280 100 - 170 116 52
Orakei-Korako 8 - 12 240 - 260 90 - 135 0
Reporoa 0 - 12 220 - 240 20 - 65 0
Rotokawa 12 - 20 260 - 290 230 - 400 35 256
Rotoma 4 - 6 220 - 245 28 - 46 10
Rotorua2 2 - 8 220 - 250 25 - 55 2
Tauhara 7 - 35 240 - 270 200 - 500 158
Te Kopia 6 - 12 230 - 250 75 - 120 0
Tikitere-Taheke3 15 - 40 220 - 260 160 - 350 240
Tokaanu 10 - 30 250 - 270 130 - 300 99
Waimangu 9 - 30 250 - 270 180 - 420 0
Waiotapu4 15 - 30 260 - 280 250 - 450 0
Wairakei 15 - 30 250 - 265 380 - 670 234 47
Means & Totals: 8 - 20 235 - 260 2550 - 5000 523.5 1248
1 Estimated available additional capacity considering consent restrictions 2 Excludes Lake Rotorua 3 Excludes Lake Rotoiti 4 Includes Waikite

Page 34 Geothermal
use (White, 2006). It is used mainly inthe Bay of Plenty and Waikato areas – atthe Kawerau mills for industrial process-ing (for paper and timber drying), atMokai for greenhouse heating, atWairakei for prawn farming, at Ohaaki fortimber drying and at Rotorua, Taupo andTauranga for space heating. Tourist spadevelopments are numerous, includingsome in the South Island. There is also along history of use by Maori for cooking,washing, bathing and therapeuticapplications.
Energy content
The energy of a geothermal system iscontained in the hot fluid and rock. Theheat is utilised by extracting the fluidwith geothermal wells. Well performanceis determined by flowrate, energy content(enthalpy) and pressure. The dischargeenthalpy is generally obtained bymeasuring the flow of steam and waterand using the specific enthalpy of thesecomponents (normally expressed askiloJoules per kg) to obtain the enthalpyof the total flow. The conversionefficiencies for the use of geothermalfluid are about 10% for electricitygeneration and 50% for direct use.
Field enthalpy is defined as the total heatflow from all producing wells divided bythe total mass flow. This value will bedetermined by the reservoir temperatureand the relative quantities of water andsteam, with steam having a much higherspecific enthalpy.
Knowing the total mass flow, enthalpyand well-head pressure, the electricitygenerating capacity can be calculated forthe chosen power plant design. However,well outputs change with time, andassessment of the sustainable capacity isa complex issue.
Carbon dioxide emissions
Carbon dioxide is a very small compo-nent of geothermal fluids and is dis-charged naturally through surface thermalfeatures. It originates from the de-gassingof the deeper magma heat sources andfrom the release of carbon dioxide fromreservoir rock by the fluids passingthrough them. Geothermal productionfluids therefore contain carbon dioxide;typically less than a few percent byweight. Most of the carbon dioxideremains with any steam that is separatedfrom the production flow and is eventu-ally released to the environment.However, carbon dioxide at a fewdevelopments is collected and used inthe manufacture of carbonated beveragesand for supply to greenhouses tostimulate plant growth.
In New Zealand the gas content ofreservoir fluid ranges from <0.1% atWairakei to about 2% at Ohaaki. Overall,the gas emissions are significantly lessthan equivalent generation using fossilfuels, averaging only about 5% of theemissions from equivalent sized fossilfuel plants, though for the exceptionalhigher-gas systems emissions can becomparable to gas-fired combined cycleplants (NZGA 2). The average carbondioxide emission from New Zealandgeothermal developments is about 100g/kWh, compared to 400 g/kWh for gas-fired combined cycle plants (ibid.).
Other constituents
Geothermal fluid contains other constitu-ents apart from steam, water and carbondioxide. The brine contains dissolvedsolids with major constituents beingsodium, chloride, potassium and silica.Total dissolved solids range from about0.1% to 1% in New Zealand geothermal

Page 35New Zealand Energy Information Handbook
waters. Environmentally harmful constitu-ents include boron, lithium, fluoride andarsenic, although with moderngeothermal projects total reinjection ofthe waste brine removes these hazards.
Carbon dioxide is by far the major non-condensible gas ( >90%). Minor gasesinclude hydrogen sulphide, ammonia,nitrogen, methane, hydrogen and tracesof mercury.

Page 36 Geothermal

Page 37New Zealand Energy Information Handbook
7 7 7 7 7 WoodWoodWoodWoodWood
Character of the resource
Wood can be used as a source of energyin a variety of ways. Combustion as asolid fuel, either as wood or woodpellets, is the focus of this section. It canalso form the feedstock for conversion toother solid, liquid and gaseous fuels.Information on these energy commoditiesis reported elsewhere in this handbook.
As an energy resource, wood is mainlyharvested from exotic plantations, as wellas collected from forest industry wastes.
Wood composition
Wood fuels vary by tree type and woodmaterial (e.g. bark, heartwood, sapwood,needles, etc.). While physical structure isnot important in determining the energyvalue of wood materials, the chemical
composition is. Wood is a composite ofthree basic polymers: cellulose, hemicel-lulose, and lignin. These are all chemicalcombinations of carbon, hydrogen andoxygen. In addition, wood containsextractives (such as resins and tannins),minerals and moisture. Lignin contentand the level of extractives modify thebasic energy value.
Wood species are generally categorisedinto softwoods and hardwoods. Table 7.1gives generic data on the analysis ofthese main types in three formats (for therelationship between ultimate andproximate anaylsis, see Figure 3.3, p16).
Different conditions of wood
Three conditions of wood are frequentlyreferred to. ‘Green’ or wet wood is freshly
Analysis Softwoods (%) Hardwoods (%) Bark (%) Straw (%) Peat (%)
Chemical composition (dry basis)
Cellulose 41-43 39-43 34 40 10
Hemicellulose 24-28 35 16 28 32
Lignin 28-29 20-22 34 17 44
Ultimate analysis (dry basis)
Hydrogen 6.1 6.2
Carbon 53.0 51.0
Oxygen 38.8 39.9
Sulphur - -
Ash 1.7 2.5 2 7 6
Proximate analysis
Volatiles 40.6 52.4
Fixed carbon 12.4 12.9
Ash 1.0 2.7
Moisture 46.0 32.0
Table 7.1: Typical composition values (% by mass) for softwoods and hardwoods(Source: Tillman, 1980)

Page 38 Wood
cut. ‘Air-dried’ wood has been allowed tostand for some time until its moisturecontent has reduced – dry wood usuallyrefers to an average moisture content ofless than 25%. ‘Oven-dried’ wood hashad all the moisture removed. Theseconditions of wood should not beconfused with the different bases formeasuring wood condition.
Volumetric conversion factors
In measuring volumes, several units havecome into use that are peculiar to themeasurement of wood, such as the cord(4ft x 4ft x 8ft=128ft3) and the stackedcubic metre. They take into account thefact that when wood is collected togetherthere is always a considerable voidage(volume of air in the spaces between theseparate pieces of wood) associated withthe total observed volume.
Conversion factors are given in Table 7.2.
Different bases for measurement
The most common basis for measuringwood mass, wood moisture or woodenergy content per unit mass is the‘oven-dry’ unit - i.e. per oven-dry kg,although the ‘wet wood’ basis is occa-sionally used. Density is frequentlyexpressed as ‘basic density’ (oven-drymass/green volume), or ‘air-dry density’(air-dry mass/air-dry volume).
Calorific value – mass basis
It is normal practice to express the energycontent per unit mass of wood as the netcalorific value on an oven-dry basis. Onthis basis, softwoods generally haveslightly higher calorific values. Thedifference is due to the higher lignincontent of softwoods. Within thesecategories, there is little differencebetween species (5%-8% max.) unless theextractive contents are widely different.Because bark has a higher level ofextractives, its calorific value is normallyhigher than that of wood. Typical netcalorific values (MJ/kg oven-dry wood) are:
Softwoods 19.2
Hardwoods 18.2
Bark 19.7
Effect of moisture
Moisture in wood fuels markedly affectsthe calorific value. The reduction in grosscalorific value is directly proportional tothe amount of moisture present. Moisturecontent is usually defined on an oven-drybasis as:
Moisture content (%) = mass of water inthe wood x 100/oven dry mass of wood.
It is, however, sometimes seen on a wetwood basis. The relationship between netcalorific value and wood moisture is setout in Table 7.3 for both softwoods andhardwoods. Each kilogram of water presentreduces the calorific value by 2.267 MJ.
To convert to: m3 solid wood Cord(1) Stacked m3
from: multiply by
m3 solid wood 1.0 0.45 1.42
Cord 2.2 1.00 3.20
Stacked m3 0.7 0.32 1.00
1 Cord (128 ft3 or 3.6 m3) is no longer a recognised measure for firewood sales
Table 7.2: Volumetric conversion factors for wood quantities

Page 39New Zealand Energy Information Handbook
Density
Although density does not affect the fuelvalue of firewood on a mass basis, woodfuels are generally sold by volume andthe heat content/volume is related todensity. In addition, other properties suchas moisture content, rate of combustion,and restoking period are related todensity.
In general, the higher the density thebetter the fuel value of the wood. Tables7.4 and 7.5 list typical values of densityand moisture content for a range ofpotential firewood species.
Calorific values – volume basis
The calorific value of wood on a volume
Moisture content oven-dry basis (%)1
Moisture content wet wood basis (%)2
Softwoods MJ/kg wet
Hardwoods MJ/kg wet
0.0 0.0 19.2 18.2
10.0 9.1 17.2 16.3
11.1 10.0 17.1 16.2
20.0 16.7 15.6 14.8
25.0 20.0 14.9 14.1
30.0 23.1 14.2 13.5
40.0 28.6 13.1 12.4
42.9 30.0 12.8 12.1
50.0 33.3 12.0 11.4
60.0 37.5 11.2 10.5
66.7 40.0 10.6 10.0
70.0 41.2 10.4 9.8
80.0 44.4 9.7 9.1
90.0 47.4 9.0 8.5
100.0 50.0 8.5 8.0
120.0 54.5 7.5 7.0
140.0 58.3 6.7 6.3
150.0 60.0 6.3 5.9
160.0 61.5 6.0 5.6
180.0 64.3 5.4 5.0
200.0 66.7 4.9 4.6
220.0 68.8 4.4 4.1
233.3 70.0 4.2 3.9
240.0 70.6 4.1 3.8
260.0 72.2 3.7 3.4
280.0 73.7 3.4 3.1
300.0 75.0 3.1 2.9
1 Moisture content on an oven-dry basis: kg moisture/kg oven-dry wood; 2 Moisture content on a wet wood basis: kg moisture/kg wet wood [NB. Wet wood = oven-dry wood content + moisture content]
Table 7.3: Reduction in net calorific value with moisture content
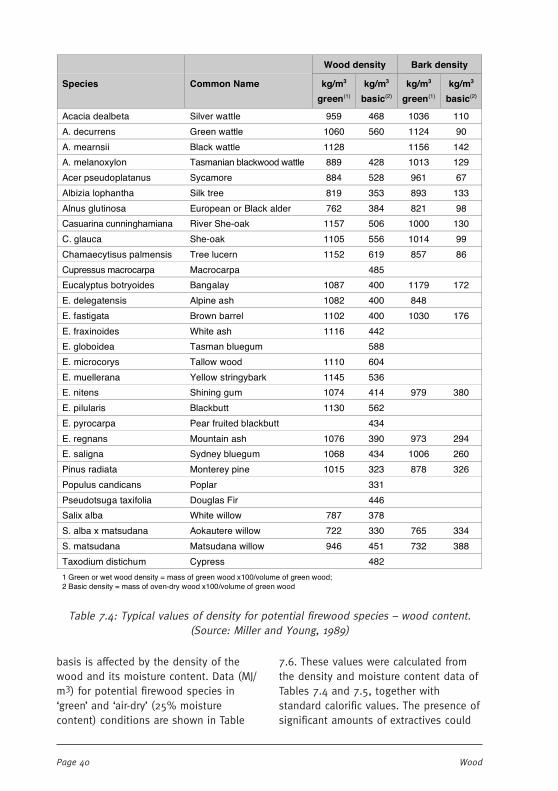
Page 40 Wood
Wood density Bark density
Species Common Name kg/m3
green(1)
kg/m3
basic(2)
kg/m3
green(1)
kg/m3
basic(2)
Acacia dealbeta Silver wattle 959 468 1036 110
A. decurrens Green wattle 1060 560 1124 90
A. mearnsii Black wattle 1128 1156 142
A. melanoxylon Tasmanian blackwood wattle 889 428 1013 129
Acer pseudoplatanus Sycamore 884 528 961 67
Albizia lophantha Silk tree 819 353 893 133
Alnus glutinosa European or Black alder 762 384 821 98
Casuarina cunninghamiana River She-oak 1157 506 1000 130
C. glauca She-oak 1105 556 1014 99
Chamaecytisus palmensis Tree lucern 1152 619 857 86
Cupressus macrocarpa Macrocarpa 485
Eucalyptus botryoides Bangalay 1087 400 1179 172
E. delegatensis Alpine ash 1082 400 848
E. fastigata Brown barrel 1102 400 1030 176
E. fraxinoides White ash 1116 442
E. globoidea Tasman bluegum 588
E. microcorys Tallow wood 1110 604
E. muellerana Yellow stringybark 1145 536
E. nitens Shining gum 1074 414 979 380
E. pilularis Blackbutt 1130 562
E. pyrocarpa Pear fruited blackbutt 434
E. regnans Mountain ash 1076 390 973 294
E. saligna Sydney bluegum 1068 434 1006 260
Pinus radiata Monterey pine 1015 323 878 326
Populus candicans Poplar 331
Pseudotsuga taxifolia Douglas Fir 446
Salix alba White willow 787 378
S. alba x matsudana Aokautere willow 722 330 765 334
S. matsudana Matsudana willow 946 451 732 388
Taxodium distichum Cypress 482
1 Green or wet wood density = mass of green wood x100/volume of green wood; 2 Basic density = mass of oven-dry wood x100/volume of green wood
Table 7.4: Typical values of density for potential firewood species – wood content.(Source: Miller and Young, 1989)
basis is affected by the density of thewood and its moisture content. Data (MJ/m3) for potential firewood species in‘green’ and ‘air-dry’ (25% moisturecontent) conditions are shown in Table
7.6. These values were calculated fromthe density and moisture content data ofTables 7.4 and 7.5, together withstandard calorific values. The presence ofsignificant amounts of extractives could
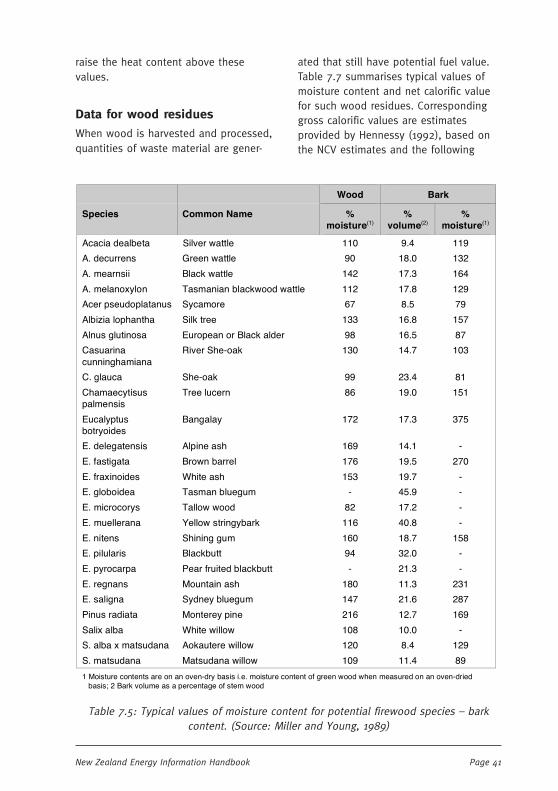
Page 41New Zealand Energy Information Handbook
raise the heat content above thesevalues.
Data for wood residues
When wood is harvested and processed,quantities of waste material are gener-
Wood Bark
Species Common Name % moisture(1)
% volume(2)
% moisture(1)
Acacia dealbeta Silver wattle 110 9.4 119
A. decurrens Green wattle 90 18.0 132
A. mearnsii Black wattle 142 17.3 164
A. melanoxylon Tasmanian blackwood wattle 112 17.8 129
Acer pseudoplatanus Sycamore 67 8.5 79
Albizia lophantha Silk tree 133 16.8 157
Alnus glutinosa European or Black alder 98 16.5 87
Casuarina cunninghamiana
River She-oak 130 14.7 103
C. glauca She-oak 99 23.4 81
Chamaecytisus palmensis
Tree lucern 86 19.0 151
Eucalyptus botryoides
Bangalay 172 17.3 375
E. delegatensis Alpine ash 169 14.1 -
E. fastigata Brown barrel 176 19.5 270
E. fraxinoides White ash 153 19.7 -
E. globoidea Tasman bluegum - 45.9 -
E. microcorys Tallow wood 82 17.2 -
E. muellerana Yellow stringybark 116 40.8 -
E. nitens Shining gum 160 18.7 158
E. pilularis Blackbutt 94 32.0 -
E. pyrocarpa Pear fruited blackbutt - 21.3 -
E. regnans Mountain ash 180 11.3 231
E. saligna Sydney bluegum 147 21.6 287
Pinus radiata Monterey pine 216 12.7 169
Salix alba White willow 108 10.0 -
S. alba x matsudana Aokautere willow 120 8.4 129
S. matsudana Matsudana willow 109 11.4 89
1 Moisture contents are on an oven-dry basis i.e. moisture content of green wood when measured on an oven-dried basis; 2 Bark volume as a percentage of stem wood
Table 7.5: Typical values of moisture content for potential firewood species – barkcontent. (Source: Miller and Young, 1989)
ated that still have potential fuel value.Table 7.7 summarises typical values ofmoisture content and net calorific valuefor such wood residues. Correspondinggross calorific values are estimatesprovided by Hennessy (1992), based onthe NCV estimates and the following

Page 42 Wood
assumptions:
(1) GCV=NCV+0.212*H*(10.01*M)+0.0008*O*(1-0.01*M)+0.0245*M, where M =% moisture, H = % hydrogen, O = %oxygen;
(2) For both softwood and bark H and Ocontents (dry basis) are assumed tobe 6.25% and 42.9% respectively.Values for black liquor are not known.Hennesy’s estimate for the GCV ofoven-dried wood is 20.6MJ/kg.
Wood heat content(1)
Total heat content(2)
Species Common Name MJ/m3 green
MJ/m3 air-dry
MJ/m3 green
MJ/m3 air-dry
Acacia dealbeta Silver wattle 7350 8250 7420 8330
A. decurrens Green wattle 9050 9870 8880 9760
A. mearnsii Black wattle 7100 8360 7080 8360
A. melanoxylon Tasmanian blackwood wattle
6700 7550 6830 7710
Acer pseudoplatanus Sycamore 8810 9310 8880 9390
Albizia lophantha Silk tree 5360 6220 5400 6290
Alnus glutinosa European or Black alder
6140 6770 6410 7040
Casuarina cunninghamiana
River She-oak 7720 8920 7840 8990
C. glauca She-oak 8870 9800 9130 10010
Chamaecytisus palmensis
Tree lucern 10060 10910 9210 10080
Eucalyptus botryoides Bangalay 5720 7050 5210 6650
E. delegatensis Alpine ash - 7050 - -
E. fastigata Brown barrel 5680 7050 5310 6710
E. fraxinoides White ash 6510 7790 - -
E. globoidea Tasman bluegum - 10370 - -
E. microcorys Tallow wood 9870 10650 - -
E. muellerana Yellow stringybark 8350 9450 - -
E. nitens Shining gum 6030 7300 6050 7290
E. pilularis Blackbutt 9030 9910 - -
E. pyrocarpa Pear fruited blackbutt - 7650 - -
E. regnans Mountain ash 5510 6880 5370 6740
E. saligna Sydney bluegum 6450 7650 5800 7070
Pinus radiata Monterey pine 4620 6020 4690 6050
Salix alba White willow 5950 6660 - -
S. alba x matsudana Aokautere willow 5110 5820 5150 5870
S. matsudana Matsudana willow 7090 7950 7060 7890
1 Wood heat content is the net calorific value on a volume basis; 2 Total heat content is the heat content of the whole stem including bark
Table 7.6: Typical net calorific values of potential firewood species(Source: Miller and Young, 1989)

Page 43New Zealand Energy Information Handbook
Wood Pellets
Wood pellets are a clean-burning, lowemission fuel. When they are burned inspecially designed pellet fireplacesthermal efficiencies as high as 90% maybe achieved. Wood pellets are especiallysuitable for home heating and may alsobe economic for some smaller spaceheating boiler applications (less than 200kW), such as schools.
The fuel produces 10% of the emissionsof typical solid fuel domestic burners andaround 1% of the emissions from anopen fire1. Unlike firewood, burnt pelletsleave little residue. Storage of the fuelrequires dry conditions.
Wood pellets are a relatively new fuel inthe New Zealand marketplace, havingonly been available since 1997. Overseas,it has a history going back about 30years and pellets are quite widely used inEurope and North America.
In New Zealand, pellets are made fromshavings and sawdust from Pinus radiata.These are dried and ground into apowder, which is then compressed sothat the lignin in the wood binds thepowder to form the pellets. The manufac-
Moisture content NCV GCV
Wood source % wet % oven-dry MJ/kg wet MJ/kg wet
Forest residues 30-60 - - -
Fresh harvested wood 50-55 100-120 7.4 + 25% 9.3
Bark – undried 60-70 150-230 7.0 + 25% 9.1
Sawmill residues & fuel merchant fuelwood – undried
38-41 60-70 10.3 + 20% 12.1
Timber merchant, building & wood container residues
23-29 30-40 13.3 + 13% 14.9
Joinery, furniture, veneerboard residues 12-14 4-16 16.3 + 13% 17.8
Wood pulp black liquor 50 - 8.6 + 15% 10.5
Table 7.7: Calorific values for fuelwood and residues (MED, 2007)
turing process is also quite low carbon.
The fuel cost of pellets is comparable toheatpumps or nightstore heaters on ac/kWh basis, and substantially less thanthe cost of LPG or conventional electricheaters, at 2007 prices.
Energy Content 19 MJ/kg
Specific Gravity 640 kg/m3
Moisture Content 5.0%
Ash Content < 0.5%
Table 7.8: Wood pellet properties
Retting
Retting is a term which refers to theprocess in which woody materials aresoaked in water for several days orlonger at normal air temperatures. Thisallows the chopped, moistened woodyresidues to partially decay throughbiologicial action. Partially decayed andprocessed cellulosic materials give ahigher heating value than if the materialsare simply dried. For example, dried ricestraw (10 percent moisture content) has aheat value of only 7 MJ/kg, but this willincrease to between 17.4 MJ/kg and 28MJ/kg when the material has partiallyrotted before it is dried.1 www.naturesflame.co.nz

Page 44 Wood

Page 45New Zealand Energy Information Handbook
8 8 8 8 8 Energy from WasteEnergy from WasteEnergy from WasteEnergy from WasteEnergy from Waste
Character of the resource
There are several ways by which solidwaste materials can be used as a sourceof energy. These derive from the organiccontent of wastes including paper, kraft,cardboard, plastic, and biomass materialssuch as wood residues and garden andkitchen wastes.
The most common methods of utilisationfor energy are incineration to produceheat, and anaerobic digestion to producemethane, although the former hasatmospheric impacts that are either costlyor impossible to avoid. The use oforganic wastes as feedstocks for liquidfuel production has also been explored.
Factors affecting energy content
The useful energy content of solid wastedepends on the proposed method ofutilisation. Incineration has the potentialto harness the energy of combustion ofall carbon and hydrogen in the wastematerials. Methane production will taponly those components that can bedecomposed by biological action, thusexcluding most plastics.
The principal factors affecting the energycontent of solid wastes are wastecomposition and moisture content.
Nature of the data
Up-to-date data on the composition ofaggregate municipal solid wastes (MSW)and associated estimates of calorificvalue are not available. Furthermore,with the rising concern about volumes ofwaste requiring disposal and the growinginterest in various aspects of recycling,
the volumes and composition of munici-pal wastes are likely to change quitesignificantly in the future. Composition islikely to vary since the opportunities forrecycling are not uniform for all compo-nents of the solid waste stream.
Some indicative calorific values
Aggregate municipal solid waste
As an indicator of the calorific value ofhistorical municipal solid waste streams(incorporating domestic, commercial andindustrial solid wastes) in relation toother energy sources, the following dataare provided:
GCV (MJ/kg) 10.8
Moisture (%) 27-30
Non-combustible (%) 14-17
There is a worldwide trend not toincinerate raw waste, but to have somepreliminary sorting first (at a sortingstation, or as a result of kerbsiderecycling, for example). When waste issorted and the fermentable componentsare separated, a high quality fuel can beproduced with low moisture content andrelatively stable composition seasonally.
Biogas (digester gas, landfill gas)
Sources of biogas
Biogas is the name given to the gasproduced by the bacterial degradation oforganic matter in anaerobic (airless)conditions. In general terms, there aretwo categories of fermentation process –‘liquid’ processes, where the solidscontent is very low, typically less than10%, and ‘solid’ processes, where the

Page 46 Energy from Waste
solids content is considerably higher, inthe range 30%-35%. Most practicalexperience and data relate to the ‘liquid’processes. The potential advantages of‘solid’ fermentation processes derive fromsmaller digestor sizes (reduced capitalcosts) and a process design thatrecirculates the liquids, thus avoiding theneed to treat and dispose of liquideffluent.
Digester gas produced at sewage worksby the anaerobic digestion of sewagesolids, and landfill gas (LFG) produced bythe decomposition of refuse in landfills,are other forms of biogas.
Methane content and calorific value
Biogas is very similar to natural gas, ofwhich the major fuel component ismethane. It is of variable compositionand can range from 40% methane and60% carbon dioxide (with a trace ofsulphide gases – usually less than 1%and often less than 0.1% by volume) toas much as 80% methane and 20%carbon dioxide. Digester gas usuallycontains about 65% methane and 35%carbon dioxide, but may contain 1%-5%of air or nitrogen.
A typical biogas composition fromdigestion of crop materials is 55%methane and 45% carbon dioxide, whilstfrom animal manures a typical composi-tion would be 65% methane and 35%carbon dioxide. Sometimes the carbondioxide content is substantially reducedby post-digestor treatment. Landfill gasusually contains 40%-55% methane and20%-40% carbon dioxide with thebalance being air or nitrogen. It mayalso contain a wide range of other gasesin small amounts, including chlorinatedhydrocarbons, depending on the refuse inthe landfill.
The energy content of any biogas iscalculated explicitly (on a volume %basis) from the energy content ofmethane (i.e. the volumetric energycontent of pure methane multiplied bythe volume % of methane in the particu-lar biogas). Table 8.1 summarises typicaldata for biogas of various methanelevels.
Methane %
Gas Density(1)
kg/m3 GCV(2) MJ/m3
NCV(2) MJ/m3
55 1.21 20.8 18.8
65 1.09 24.5 22.1
87 0.83 32.9 29.6
98 0.70 37.0 33.4
1 At 15ºC and 101.325 kPa (absolute) pressure 2 ±0.1 MJ/m3
Table 8.1: Calorific values for biogas
Particular source materials
Materials with a high carbohydrate orsugar content are likely to producebiogas with close to 50% methane, whilstmaterials high in cellulose, oils or fatswill yield higher proportions of methane.
The composition is also affected byretention time. Table 8.2 presents dataon biogas production, methane content,and corresponding calorific values for awide range of potential sources.
Rates of resource production
Indicative rates of biogas production canbe estimated by linking data in Table 8.2with that in Table 8.3, which summarisesdaily quantities of waste produced byvarious animals and birds.
Landfill Gas
There is little public domain informationon the use of landfill gas in powergeneration in New Zealand, howeverthere are a number of applications in

Page 47New Zealand Energy Information Handbook
Source Material
Biogas litres/kg TS(1)
% Methane GCV MJ/m3
Banana (fruit & stem) 940 53 20.0
Potato (tubers) 880 54 20.4
Sugarbeet (root) 620 60 22.6
Meat waste (offal) 600 59 22.2
Lucerne 450-600 56-64 21.1-24.1
Grass 450-530 55-57 20.7-21.5
Oats (whole plant) 450-480 51-55 19.2-20.7
Kale 440-560 47-58 17.7-21.9
Sugarbeet (leaves) 380 66 24.9
MSW (organic fraction) 380 48 18.1
Lakeweed (Lagarosiphon) 380 56 21.1
Maize (whole plant) 350-500 50 18.9
Hay 350-460 54-65 20.4-24.5
Straw (ground) 350-450 54-58 20.4-21.9
Poultry manure (fresh) 300-450 57-70 21.5-26.4
Straw (chopped) 250-350 58 21.9
Newspaper 240 52 19.6
Cattle manure 190-220 68 25.6
Sheep manure 180-220 56 21.1
Pig manure (fresh) 170-450 55-65 20.7-24.5
1 TS = Total Solids
Table 8.2: Production of biogas from digestion of various materials at 35˚C andsuitable retention times with a loading concentration of 5% total solids
(Source: MAF 1985, from test data at Invermay Agricultural Centre)
Animal / Bird
Fresh manure/day kg
Total Solids(1)
%
Solids/day kg
Dairy cow (500kg) 35 13 4.5
Beef steer (400kg) 25 13 3.2
Breeding sow 16 9 1.4
Sheep 3.9 25 1.25
Fattening pig (50kg) 3.3 9 0.3
Turkey (5.5kg) 0.4 25 0.09
Layer hen (2kg) 0.12 25 0.03
Meat chicken (1kg) 0.10 21 0.02
1 Varies with diet, etc.
Table 8.3: Daily quantities of waste produced by various animals and birds(Source: MAF 1985, from test data at Invermay Agricultural Centre)

Page 48 Energy from Waste
service in the Hutt Valley and Auckland.Typically these facilities are connected tothe local distribution network.
Table 8.4 shows the main constituents oflandfill gas and their proportions.Methane is a greenhouse gas and alsoposes explosion hazards if uncontrolled.Other landfill gas constituents, such as
non-methane organic compounds, arepollutants and others pose healthhazards due to their toxicity.
Other solid wastes
Typical energy content and resourcecharacteristics for a variety of solid wastematerials are shown in Table 8.5.
Constituent Gas Concentration in Landfill Gas
Range Average
Methane (CH4) 35% - 60% 50%
Carbon Dioxide (CO2) 35% - 55% 45%
Nitrogen (N2) 0% - 20% 5%
Oxygen (O2) 0% - 2.5% <1%
Hydrogen Sulfide (H2S) 1 - 1,700 ppmv 21 ppmv
Halides NA 132 ppmv
Water Vapor (H2O) 1% - 10% NA
Nonmethane Organic Compounds 237 - 14,294 ppmv 2,700 ppmv
NA = not available. ppmv = parts per million by volume. Note: Highest values occur in perimeter wells.
Sources: G.J. Sandelli, Demonstration of Fuel Cells To Recover Energy from Landfill Gas. Phase I Final Report: Conceptual Study, EPA-600-R-92-007, prepared for the U.S. Environmental Protection Agency by International Fuel Cells Corporation (Washington, DC, January 1992); M. Doorn, J. Pacey, and D. Augenstein, Landfill Gas Energy Utilization Experience: Discussion of Technical and Non-Technical Issues, Solutions, and Trends, EPA-600/R-95-035, prepared for the Air and Energy Engineering Research Laboratory, U.S. Environmental Protection Agency by E.H. Pechan and Associates, Inc. (Washington, DC, March 1995).
Table 8.4: Main constituents of landfill gas
Waste Ash % Moisture % Gross heat value kcal/kg
Animal fats - - 9,500
Corn cobs 3 5 4,500
Paint - - 4,500
Paper 1 5 4,000
Rubber 20 30 5,500
Pathological waste 3 85 550
Wood 3 10 5,000
Source: International solid Waste Association, 1997
Table 8.5: Some typical waste fuels and their approximate characteristics
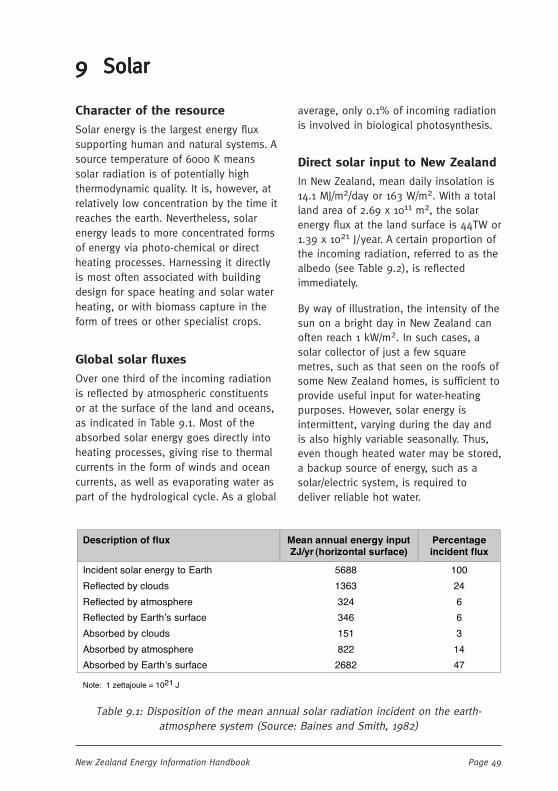
Page 49New Zealand Energy Information Handbook
9 9 9 9 9 SolarSolarSolarSolarSolar
Character of the resource
Solar energy is the largest energy fluxsupporting human and natural systems. Asource temperature of 6000 K meanssolar radiation is of potentially highthermodynamic quality. It is, however, atrelatively low concentration by the time itreaches the earth. Nevertheless, solarenergy leads to more concentrated formsof energy via photo-chemical or directheating processes. Harnessing it directlyis most often associated with buildingdesign for space heating and solar waterheating, or with biomass capture in theform of trees or other specialist crops.
Global solar fluxes
Over one third of the incoming radiationis reflected by atmospheric constituentsor at the surface of the land and oceans,as indicated in Table 9.1. Most of theabsorbed solar energy goes directly intoheating processes, giving rise to thermalcurrents in the form of winds and oceancurrents, as well as evaporating water aspart of the hydrological cycle. As a global
average, only 0.1% of incoming radiationis involved in biological photosynthesis.
Direct solar input to New Zealand
In New Zealand, mean daily insolation is14.1 MJ/m2/day or 163 W/m2. With a totalland area of 2.69 x 10¹¹ m2, the solarenergy flux at the land surface is 44TW or1.39 x 1021 J/year. A certain proportion ofthe incoming radiation, referred to as thealbedo (see Table 9.2), is reflectedimmediately.
By way of illustration, the intensity of thesun on a bright day in New Zealand canoften reach 1 kW/m2. In such cases, asolar collector of just a few squaremetres, such as that seen on the roofs ofsome New Zealand homes, is sufficient toprovide useful input for water-heatingpurposes. However, solar energy isintermittent, varying during the day andis also highly variable seasonally. Thus,even though heated water may be stored,a backup source of energy, such as asolar/electric system, is required todeliver reliable hot water.
Description of flux Mean annual energy input ZJ/yr (horizontal surface)
Percentage incident flux
Incident solar energy to Earth 5688 100
Reflected by clouds 1363 24
Reflected by atmosphere 324 6
Reflected by Earth’s surface 346 6
Absorbed by clouds 151 3
Absorbed by atmosphere 822 14
Absorbed by Earth’s surface 2682 47
Note: 1 zettajoule = 1021 J
Table 9.1: Disposition of the mean annual solar radiation incident on the earth-atmosphere system (Source: Baines and Smith, 1982)

Page 50 Solar
In general, while the figures presentedhere indicate that solar energy is plentiful(in comparison to world energy usage,which was approximately 0.5ZJ in 2004),harnessing it for uses beyond thestandard ones such as photosynthesisand ambient heating is a problem,especially in an economic manner.
Seasonal and geographicalvariation in solar input
For any calculation purposes, or to get anindication of the amount of solar energyavailable in different parts of the country,the solar radiation (MJ/m2) must be used.(In the past the duration of sunshine hasbeen considered, but correlation betweensunshine hours and solar radiation canbe poor and is no basis for reliablecalculations.) The solar radiation varieswith season and geographic locationthroughout the country. Typically threecomponents of radiation will be consid-ered and a combination used dependingon the application. These are:
• Global: Total amount of solarradiation incident on the surface ofthe earth (on a horizontal surface).
• Direct: Amount of solar radiation atthe Earth’s surface on a flat surface
perpendicular to the sun’s beam withsurrounding sky radiation blocked.
• Diffuse: Amount of solar radiationincident on the surface of the earthunder all-sky conditions with directradiation from the sun’s beamblocked by a shadow band ortracking disk at the Earth’s surface.
Data for solar radiation intensity aretypically presented in units of MJ/m2/day.The historical unit was langleys/day,measured on the internationalpyrheliometric scale (IPS). For conversionuse 1 Langley = 0.04278 MJ/m2.
For modern calculation purposes, hourlydata should be considered. These arenow available from a variety of sources:
• Sustainable Electricity Association ofSustainable Electricity Association ofSustainable Electricity Association ofSustainable Electricity Association ofSustainable Electricity Association ofNew ZealandNew ZealandNew ZealandNew ZealandNew Zealand www.seanz.org.nz
• NIWANIWANIWANIWANIWA www.niwa.cri.nz
• NASA NASA NASA NASA NASA http://eosweb.larc.nasa.gov/cgi-bin/sse/[email protected] (Datagenerated from satellite measure-ments. This will be less accurate thanactual ground based measurement.)
(As with all web links, the above maychange over time, but a web search usingsome of the text above should find thedata.)
Type of land surface Land area (million ha) Albedo
Pasture / arable lands 14.4 0.25
Forest lands 7.2 0.10
Remaining lands 5.3 0.28
All New Zealand 26.9 0.22
Table 9.2: Typical values for albedo for various land surfaces
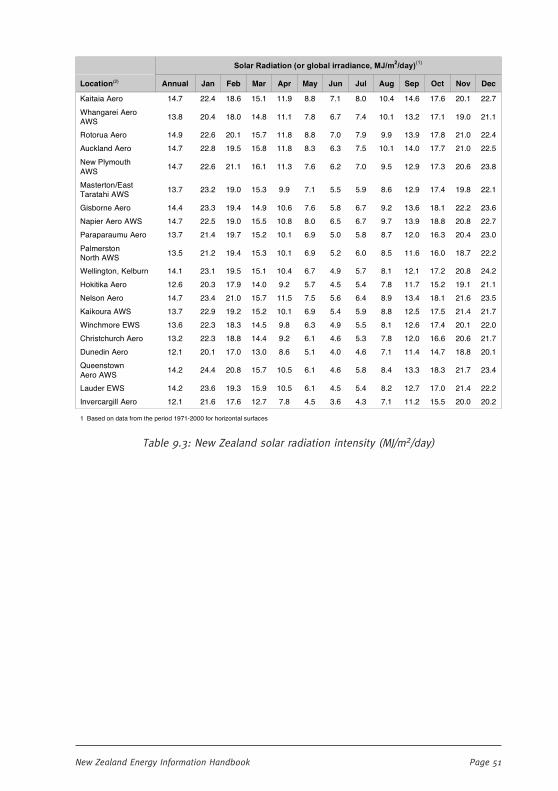
Page 51New Zealand Energy Information Handbook
Solar Radiation (or global irradiance, MJ/m
2
/day)
(1)
Location(2) Annual Jan Feb Mar Apr May Jun Jul Aug Sep Oct Nov Dec
Kaitaia Aero 14.7 22.4 18.6 15.1 11.9 8.8 7.1 8.0 10.4 14.6 17.6 20.1 22.7
Whangarei Aero AWS
13.8 20.4 18.0 14.8 11.1 7.8 6.7 7.4 10.1 13.2 17.1 19.0 21.1
Rotorua Aero 14.9 22.6 20.1 15.7 11.8 8.8 7.0 7.9 9.9 13.9 17.8 21.0 22.4
Auckland Aero 14.7 22.8 19.5 15.8 11.8 8.3 6.3 7.5 10.1 14.0 17.7 21.0 22.5
New Plymouth AWS
14.7 22.6 21.1 16.1 11.3 7.6 6.2 7.0 9.5 12.9 17.3 20.6 23.8
Masterton/East Taratahi AWS
13.7 23.2 19.0 15.3 9.9 7.1 5.5 5.9 8.6 12.9 17.4 19.8 22.1
Gisborne Aero 14.4 23.3 19.4 14.9 10.6 7.6 5.8 6.7 9.2 13.6 18.1 22.2 23.6
Napier Aero AWS 14.7 22.5 19.0 15.5 10.8 8.0 6.5 6.7 9.7 13.9 18.8 20.8 22.7
Paraparaumu Aero 13.7 21.4 19.7 15.2 10.1 6.9 5.0 5.8 8.7 12.0 16.3 20.4 23.0
Palmerston North AWS
13.5 21.2 19.4 15.3 10.1 6.9 5.2 6.0 8.5 11.6 16.0 18.7 22.2
Wellington, Kelburn 14.1 23.1 19.5 15.1 10.4 6.7 4.9 5.7 8.1 12.1 17.2 20.8 24.2
Hokitika Aero 12.6 20.3 17.9 14.0 9.2 5.7 4.5 5.4 7.8 11.7 15.2 19.1 21.1
Nelson Aero 14.7 23.4 21.0 15.7 11.5 7.5 5.6 6.4 8.9 13.4 18.1 21.6 23.5
Kaikoura AWS 13.7 22.9 19.2 15.2 10.1 6.9 5.4 5.9 8.8 12.5 17.5 21.4 21.7
Winchmore EWS 13.6 22.3 18.3 14.5 9.8 6.3 4.9 5.5 8.1 12.6 17.4 20.1 22.0
Christchurch Aero 13.2 22.3 18.8 14.4 9.2 6.1 4.6 5.3 7.8 12.0 16.6 20.6 21.7
Dunedin Aero 12.1 20.1 17.0 13.0 8.6 5.1 4.0 4.6 7.1 11.4 14.7 18.8 20.1
Queenstown Aero AWS
14.2 24.4 20.8 15.7 10.5 6.1 4.6 5.8 8.4 13.3 18.3 21.7 23.4
Lauder EWS 14.2 23.6 19.3 15.9 10.5 6.1 4.5 5.4 8.2 12.7 17.0 21.4 22.2
Invercargill Aero 12.1 21.6 17.6 12.7 7.8 4.5 3.6 4.3 7.1 11.2 15.5 20.0 20.2
1 Based on data from the period 1971-2000 for horizontal surfaces
Table 9.3: New Zealand solar radiation intensity (MJ/m2/day)

Page 52 Solar

Page 53New Zealand Energy Information Handbook
10 10 10 10 10 WindWindWindWindWind
Character of the resource
Winds arise principally from temperaturedifferences at the Earth’s surface causedby uneven absorption of sunlight. Airheated by contact with a warmer surfacewill rise causing cooler air to flow in andtake its place.
The resulting airflow we call wind. Theenergy of motion (kinetic energy) in windhas provided a source of mechanicalenergy for centuries. Early use centred ondirect mechanical pumping while latterlytechnology has evolved to link windturbines to electric generators.
New Zealand has an excellent windresource because of its oceanic locationand a fairly steady succession of troughsand depressions passing west to east.Each weather system induces a pressurepattern over the mountains and this canlead to almost continuous winds in someparts of the country.
Mean wind energy fluxes in New Zealandare more concentrated than the meansolar flux. Certain regions have meanwind energy fluxes greater that 400 W/m2,with some locations as high as 2000-2500 W/m2. (Note that the solar flux ismeasured over a horizontal area, whilewind flux is measured over a verticalarea.)
Quantifying the wind resource
The usefulness of wind for energy isassessed in terms of annual mean windspeed (AMWS) rather than instantaneouswind speed. A speed of 3-4 metres persecond is a typical ‘cut in’ wind speed forelectricity generation. Wind turbinestypically achieve maximum electricity
output at around 12-15 metres persecond and shutdown at wind speedsgreater than 25 metres per second toavoid damage.
Measuring this wind speed is vital forwind farm developers so that they have agood understanding about the bestlocations for wind farms. It is, broadlyspeaking, possible to measure the windspeed in two ways.
One can either take physical measure-ments using an anemometer or ‘metmast’ as it tends to be known in theindustry. More recently, developers haveturned to SODAR (sonic detection andranging) or LIDAR (Light Detection andRanging) measurement that can beinstalled at ground level to support themet mast measurements. While thismethod is very accurate it is expensive ifone is seeking to acquire informationabout average wind speeds, over longperiods of time, across the entire country.
Alternatively, with the assistance oftoday’s powerful computers, it is possibleto carry out sophisticated modelling ofwind speeds. This modelling can be doneat four levels of accuracy:
••••• Synoptic scaleSynoptic scaleSynoptic scaleSynoptic scaleSynoptic scale modelling looks atweather systems with dimensions ofseveral hundred kilometres or more.
••••• Meso-scaleMeso-scaleMeso-scaleMeso-scaleMeso-scale modelling typically rangesfrom 80 km through to severalhundred kilometres.
••••• Storm scaleStorm scaleStorm scaleStorm scaleStorm scale modelling refers to theanalysis of individual weather events(e.g. thunderstorms) and conse-quently is concerned with featuresranging in size from a kilometre up to

Page 54 Wind
50 kilometres.
••••• Micro-scaleMicro-scaleMicro-scaleMicro-scaleMicro-scale modelling is concernedwith modelling wind speeds at aresolution down to as low as 200metres.
While modelled predictions of windspeed patterns are useful indicators ofrelative wind resource across the countryand the potential of a particular site,wind farm developers do not rely on suchmodelled predictions.
Actual, continuous measurements of windspeeds on prospective sites are generallyundertaken to confirm commercialviability. The met masts used will haveprovision for measuring wind speeds atvarious heights above the ground, up tothe intended hub height. With the latesttechnology, the hub height can be ashigh as 100 m above the ground, though80 m is most typical.
Table 10.1 shows wind speeds on a monthlybasis at various North Island and SouthIsland locations. Mean annual wind speedsfor the North and South Islands are shownin Figures 10.1 and 10.2, respectively.
The nature of wind variability
Instantaneous wind speed is inherentlyvery variable. However, when summed overclimatic seasons or calendar years, recordsindicate average wind speeds are relativelyconstant. For example, analyses by Smyth(1987) suggest a 1-in-20 year low for windenergy that is 10% below the long-run
mean. The corresponding deviation forhydro lake storage levels is 15%.
Data from the first 10 years of operationof the Brooklyn wind turbine and the first4 years of the Tararua Stage 1 wind farm,supports this 10% range in variability ofthe wind resource over time.
The Electricity Commission has nowcommissioned two reports fromTranspower1 which have looked at thenature of wind variability, in the shortterm (minutes and hours), and thepotential affects of that variability on thestability of the grid. The reports identify anumber of operational issues associatedwith the rapid uptake of wind energy andnotes that these issues are manageable.
Potential wind farmsOperational
Table 10.2 shows currently operationalwind farms around the country.
Planned and potential projects
There are a number of developmentscurrently being considered around NewZealand. The nature of the developmentof wind farm sites is such that manyprojects do not get beyond the initialassessment phase and, as a result of thatinitial assessment are not subsequentlysubmitted to the planning process.
Figure 10.3 depicts existing, consentedand potential windfarms which have beenor are being investigated in New Zealand.
1 ‘Manawatu wind generation: Observed impacts on thescheduling and dispatch process’ Part 1 – February2005; Part 2 – September 2005.
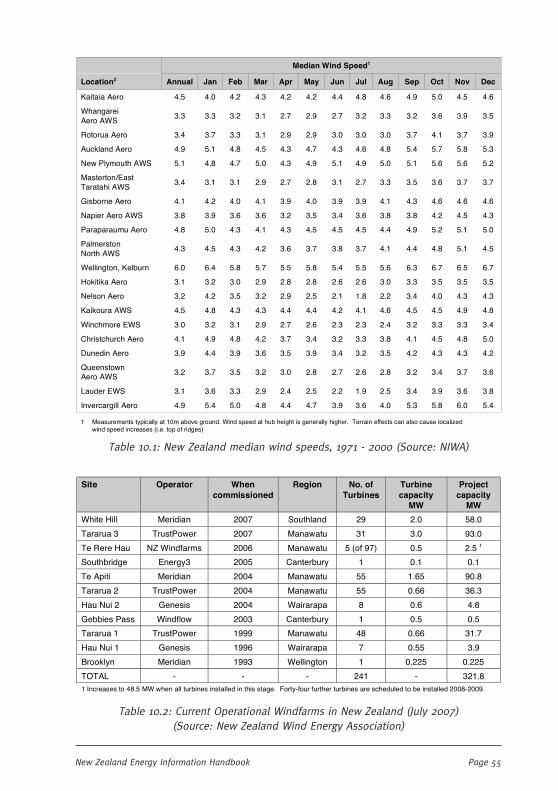
Page 55New Zealand Energy Information Handbook
Median Wind Speed1
Location2 Annual Jan Feb Mar Apr May Jun Jul Aug Sep Oct Nov Dec
Kaitaia Aero 4.5 4.0 4.2 4.3 4.2 4.2 4.4 4.8 4.6 4.9 5.0 4.5 4.6
Whangarei Aero AWS
3.3 3.3 3.2 3.1 2.7 2.9 2.7 3.2 3.3 3.2 3.6 3.9 3.5
Rotorua Aero 3.4 3.7 3.3 3.1 2.9 2.9 3.0 3.0 3.0 3.7 4.1 3.7 3.9
Auckland Aero 4.9 5.1 4.8 4.5 4.3 4.7 4.3 4.6 4.8 5.4 5.7 5.8 5.3
New Plymouth AWS 5.1 4.8 4.7 5.0 4.3 4.9 5.1 4.9 5.0 5.1 5.6 5.6 5.2
Masterton/East Taratahi AWS
3.4 3.1 3.1 2.9 2.7 2.8 3.1 2.7 3.3 3.5 3.6 3.7 3.7
Gisborne Aero 4.1 4.2 4.0 4.1 3.9 4.0 3.9 3.9 4.1 4.3 4.6 4.6 4.6
Napier Aero AWS 3.8 3.9 3.6 3.6 3.2 3.5 3.4 3.6 3.8 3.8 4.2 4.5 4.3
Paraparaumu Aero 4.8 5.0 4.3 4.1 4.3 4.5 4.5 4.5 4.4 4.9 5.2 5.1 5.0
Palmerston North AWS
4.3 4.5 4.3 4.2 3.6 3.7 3.8 3.7 4.1 4.4 4.8 5.1 4.5
Wellington, Kelburn 6.0 6.4 5.8 5.7 5.5 5.8 5.4 5.5 5.6 6.3 6.7 6.5 6.7
Hokitika Aero 3.1 3.2 3.0 2.9 2.8 2.8 2.6 2.6 3.0 3.3 3.5 3.5 3.5
Nelson Aero 3.2 4.2 3.5 3.2 2.9 2.5 2.1 1.8 2.2 3.4 4.0 4.3 4.3
Kaikoura AWS 4.5 4.8 4.3 4.3 4.4 4.4 4.2 4.1 4.6 4.5 4.5 4.9 4.8
Winchmore EWS 3.0 3.2 3.1 2.9 2.7 2.6 2.3 2.3 2.4 3.2 3.3 3.3 3.4
Christchurch Aero 4.1 4.9 4.8 4.2 3.7 3.4 3.2 3.3 3.8 4.1 4.5 4.8 5.0
Dunedin Aero 3.9 4.4 3.9 3.6 3.5 3.9 3.4 3.2 3.5 4.2 4.3 4.3 4.2
Queenstown Aero AWS
3.2 3.7 3.5 3.2 3.0 2.8 2.7 2.6 2.8 3.2 3.4 3.7 3.6
Lauder EWS 3.1 3.6 3.3 2.9 2.4 2.5 2.2 1.9 2.5 3.4 3.9 3.6 3.8
Invercargill Aero 4.9 5.4 5.0 4.8 4.4 4.7 3.9 3.6 4.0 5.3 5.8 6.0 5.4
1 Measurements typically at 10m above ground. Wind speed at hub height is generally higher. Terrain effects can also cause localized wind speed increases (i.e. top of ridges)
Table 10.1: New Zealand median wind speeds, 1971 - 2000 (Source: NIWA)
Site Operator When commissioned
Region No. of Turbines
Turbine capacity
MW
Project capacity
MW
White Hill Meridian 2007 Southland 29 2.0 58.0
Tararua 3 TrustPower 2007 Manawatu 31 3.0 93.0
Te Rere Hau NZ Windfarms 2006 Manawatu 5 (of 97) 0.5 2.5 1
Southbridge Energy3 2005 Canterbury 1 0.1 0.1
Te Apiti Meridian 2004 Manawatu 55 1.65 90.8
Tararua 2 TrustPower 2004 Manawatu 55 0.66 36.3
Hau Nui 2 Genesis 2004 Wairarapa 8 0.6 4.8
Gebbies Pass Windflow 2003 Canterbury 1 0.5 0.5
Tararua 1 TrustPower 1999 Manawatu 48 0.66 31.7
Hau Nui 1 Genesis 1996 Wairarapa 7 0.55 3.9
Brooklyn Meridian 1993 Wellington 1 0.225 0.225
TOTAL - - - 241 - 321.8
1 Increases to 48.5 MW when all turbines installed in this stage. Forty-four further turbines are scheduled to be installed 2008-2009.
Table 10.2: Current Operational Windfarms in New Zealand (July 2007)(Source: New Zealand Wind Energy Association)
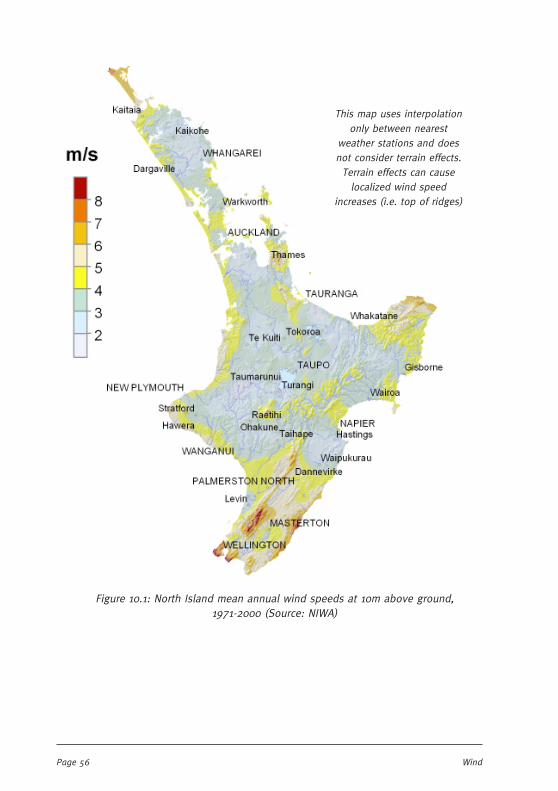
Page 56 Wind
Figure 10.1: North Island mean annual wind speeds at 10m above ground,1971-2000 (Source: NIWA)
This map uses interpolationonly between nearest
weather stations and doesnot consider terrain effects.Terrain effects can cause
localized wind speedincreases (i.e. top of ridges)
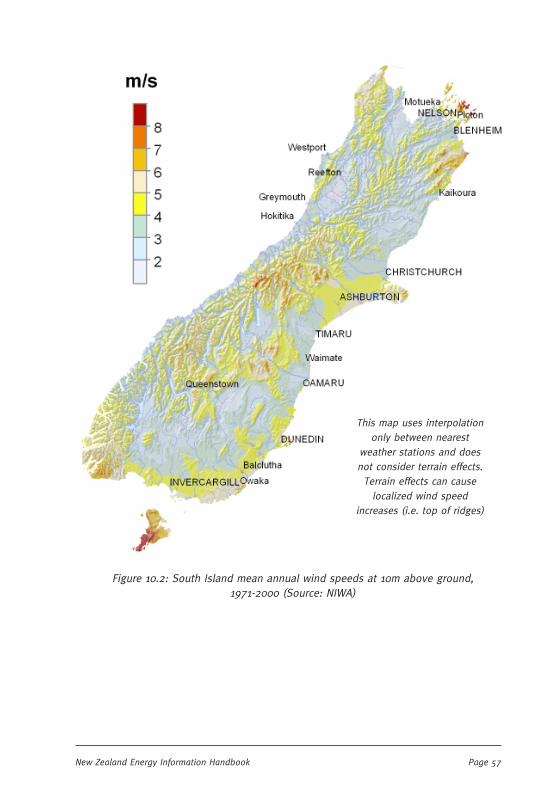
Page 57New Zealand Energy Information Handbook
Figure 10.2: South Island mean annual wind speeds at 10m above ground,1971-2000 (Source: NIWA)
This map uses interpolationonly between nearest
weather stations and doesnot consider terrain effects.Terrain effects can cause
localized wind speedincreases (i.e. top of ridges)

Page 58 Wind
Figure 10.3: Current and Proposed Windfarms in New Zealand. Sizes and locations areindicative only, based on media reports and other public sources
(Source: NIWA (base map) and Transpower (generation), August 2007)
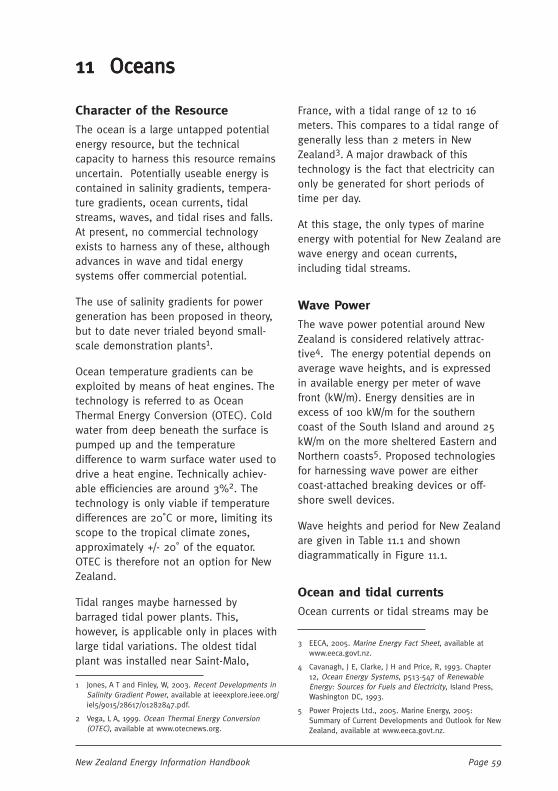
Page 59New Zealand Energy Information Handbook
11 11 11 11 11 OceansOceansOceansOceansOceans
Character of the Resource
The ocean is a large untapped potentialenergy resource, but the technicalcapacity to harness this resource remainsuncertain. Potentially useable energy iscontained in salinity gradients, tempera-ture gradients, ocean currents, tidalstreams, waves, and tidal rises and falls.At present, no commercial technologyexists to harness any of these, althoughadvances in wave and tidal energysystems offer commercial potential.
The use of salinity gradients for powergeneration has been proposed in theory,but to date never trialed beyond small-scale demonstration plants1.
Ocean temperature gradients can beexploited by means of heat engines. Thetechnology is referred to as OceanThermal Energy Conversion (OTEC). Coldwater from deep beneath the surface ispumped up and the temperaturedifference to warm surface water used todrive a heat engine. Technically achiev-able efficiencies are around 3%2. Thetechnology is only viable if temperaturedifferences are 20˚C or more, limiting itsscope to the tropical climate zones,approximately +/- 20˚ of the equator.OTEC is therefore not an option for NewZealand.
Tidal ranges maybe harnessed bybarraged tidal power plants. This,however, is applicable only in places withlarge tidal variations. The oldest tidalplant was installed near Saint-Malo,
France, with a tidal range of 12 to 16meters. This compares to a tidal range ofgenerally less than 2 meters in NewZealand3. A major drawback of thistechnology is the fact that electricity canonly be generated for short periods oftime per day.
At this stage, the only types of marineenergy with potential for New Zealand arewave energy and ocean currents,including tidal streams.
Wave Power
The wave power potential around NewZealand is considered relatively attrac-tive4. The energy potential depends onaverage wave heights, and is expressedin available energy per meter of wavefront (kW/m). Energy densities are inexcess of 100 kW/m for the southerncoast of the South Island and around 25kW/m on the more sheltered Eastern andNorthern coasts5. Proposed technologiesfor harnessing wave power are eithercoast-attached breaking devices or off-shore swell devices.
Wave heights and period for New Zealandare given in Table 11.1 and showndiagrammatically in Figure 11.1.
Ocean and tidal currents
Ocean currents or tidal streams may be
1 Jones, A T and Finley, W, 2003. Recent Developments inSalinity Gradient Power, available at ieeexplore.ieee.org/iel5/9015/28617/01282847.pdf.
2 Vega, L A, 1999. Ocean Thermal Energy Conversion(OTEC), available at www.otecnews.org.
3 EECA, 2005. Marine Energy Fact Sheet, available atwww.eeca.govt.nz.
4 Cavanagh, J E, Clarke, J H and Price, R, 1993. Chapter12, Ocean Energy Systems, p513-547 of RenewableEnergy: Sources for Fuels and Electricity, Island Press,Washington DC, 1993.
5 Power Projects Ltd., 2005. Marine Energy, 2005:Summary of Current Developments and Outlook for NewZealand, available at www.eeca.govt.nz.
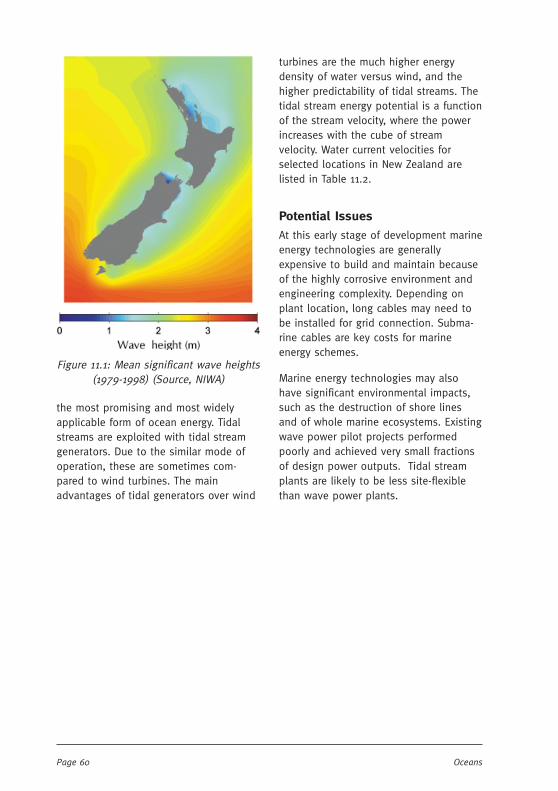
Page 60 Oceans
the most promising and most widelyapplicable form of ocean energy. Tidalstreams are exploited with tidal streamgenerators. Due to the similar mode ofoperation, these are sometimes com-pared to wind turbines. The mainadvantages of tidal generators over wind
Figure 11.1: Mean significant wave heights(1979-1998) (Source, NIWA)
turbines are the much higher energydensity of water versus wind, and thehigher predictability of tidal streams. Thetidal stream energy potential is a functionof the stream velocity, where the powerincreases with the cube of streamvelocity. Water current velocities forselected locations in New Zealand arelisted in Table 11.2.
Potential Issues
At this early stage of development marineenergy technologies are generallyexpensive to build and maintain becauseof the highly corrosive environment andengineering complexity. Depending onplant location, long cables may need tobe installed for grid connection. Subma-rine cables are key costs for marineenergy schemes.
Marine energy technologies may alsohave significant environmental impacts,such as the destruction of shore linesand of whole marine ecosystems. Existingwave power pilot projects performedpoorly and achieved very small fractionsof design power outputs. Tidal streamplants are likely to be less site-flexiblethan wave power plants.

Page 61New Zealand Energy Information Handbook
Mean Hs
Node Lon Lat Hs Tp 5% 50% 95%
° E ° N m s m m M
W Stewart 167.50 -47.00 3.18 11.3 1.59 2.97 5.57
E Foveaux 168.75 -47.00 2.53 10.9 1.29 2.31 4.52
Otago 171.25 -46.00 1.84 9.5 0.93 1.68 3.33
Waitaki 171.25 -45.00 1.22 8.0 0.54 1.11 2.28
Ellesmere 172.50 -44.00 1.21 7.5 0.56 1.11 2.25
N Canterbury 173.75 -43.00 1.54 8.5 0.73 1.40 2.92
Palliser 175.00 -42.00 1.77 8.1 0.85 1.63 3.29
Wairarapa 176.25 -41.00 1.63 8.9 0.71 1.45 3.21
Kidnappers 177.50 -40.00 1.71 9.0 0.75 1.51 3.37
Poverty 178.75 -39.00 2.07 9.0 1.03 1.86 3.85
E Cape 178.75 -38.00 1.93 8.7 1.00 1.77 3.42
Bay of Plenty 177.50 -37.00 1.69 7.2 0.71 1.53 3.20
E Coromandel 176.25 -37.00 1.38 7.2 0.51 1.23 2.82
Hauraki 175.00 -36.00 1.34 7.4 0.49 1.17 2.79
Bay of Islands 175.00 -35.00 1.58 7.4 0.65 1.41 3.16
N Cape 173.75 -34.00 2.09 9.7 1.13 1.93 3.59
3 Kings 172.50 -34.00 2.65 10.8 1.50 2.50 4.35
90 Mile Beach 172.50 -35.00 2.46 11.2 1.26 2.28 4.25
Hokianga 172.50 -36.00 2.64 11.2 1.28 2.46 4.63
Kaipara 173.75 -37.00 2.16 11.1 1.00 1.98 3.92
Raglan 173.75 -38.00 2.13 10.4 0.95 1.96 3.90
New Plymouth 173.75 -39.00 1.92 9.5 0.81 1.78 3.56
S Taranaki 173.75 -40.00 1.58 7.9 0.59 1.47 2.94
Farewell 172.50 -40.00 2.34 10.1 1.09 2.18 4.14
Heaphy 171.25 -41.00 2.49 10.8 1.16 2.30 4.45
Foulwind 171.25 -42.00 2.03 10.5 0.86 1.84 3.84
Harihari 170.00 -43.00 1.97 10.2 0.82 1.77 3.80
Jackson Bay 167.50 -44.00 2.56 11.0 1.26 2.38 4.45
Fiordland 166.25 -45.00 3.25 11.2 1.68 3.06 5.47
Puysegur 166.25 -46.00 3.44 11.3 1.74 3.24 5.85
Chathams 183.75 -44.00 3.18 10.4 1.74 2.97 5.35
NotesNotesNotesNotesNotes
1. Wave heights are significant wave heights in deep water, given by o
M4 , where M0 is the areaunder the Fourier spectrum.
2. Periods are peak periods (i.e., the period of the peak in the Fourier spectrum).
3. Data come from the NOAA Wave Watch 3 (NWW3) model http://polar.ncep.noaa.gov/waves/Welcome.html
4. Locations are at nodes of the model grid which has intervals of 1.25° in longitude and 1° in latitude.
Table 11.1: New Zealand wave heights and periods

Page 62 Oceans
NotesNotesNotesNotesNotes
1. Tidal constituents were obtained from the Oregon State University global tide model TPXOVersion 7 available from: http://www.coas.oregonstate.edu/research/po/research/tide/global.html.
2. Constituents are available at 0.25° intervals in latitude and longitude for 10 tides (M2, S2,N2, K2, K1, O1, P1, Q1, Mf, and Mm), of which the first 8 were used, being the primary tidesfor New Zealand.
3. Tidal current statistics were calculated by synthesizing the constituents at 15 minuteintervals for 1 year.
4. The sites were chosen as the 20 nodes with the largest maximum M2 current speed aroundthe NZ coast. Other nodes with large currents may occur within 1° of latitude and longitudeof the sites listed.
5. For areas with complex bathymetry and shorelines, and where the currents are spatiallyhighly variable (such as Cook Strait), the model resolution is much too coarse to ad-equately define the current speeds, and a local-area model should be used to refine thestatistics.
Table 11.2: New Zealand water current speeds (current speeds are in m/s)
Node Longitude Latitude Mean Speed
5% Speed
50% Speed
95% Speed
Max Speed
W Stewart 167.75 -46.75 0.38 0.19 0.38 0.55 0.61
E Stewart 168.75 -47.00 0.29 0.13 0.30 0.46 0.53
Catlins 169.75 -46.75 0.08 0.03 0.08 0.13 0.15
Waitaki 171.75 -45.00 0.02 0.01 0.02 0.04 0.05
Mernoo 173.75 -43.50 0.07 0.03 0.08 0.12 0.14
Cook 174.75 -41.50 0.17 0.09 0.16 0.25 0.28
Wairarapa 176.00 -41.25 0.03 0.01 0.03 0.04 0.05
Colville 175.50 -36.50 0.18 0.05 0.19 0.30 0.32
Reinga 172.75 -34.25 0.10 0.03 0.11 0.16 0.19
3 Kings 171.75 -34.00 0.08 0.02 0.08 0.16 0.20
Kaipara 174.00 -36.25 0.26 0.08 0.26 0.45 0.51
Waikato 174.75 -37.50 0.14 0.03 0.14 0.25 0.28
N Plymouth 173.00 -38.75 0.08 0.04 0.08 0.13 0.15
S Taranaki 174.25 -39.75 0.22 0.06 0.22 0.38 0.45
Wanganui 175.25 -40.50 0.28 0.09 0.27 0.47 0.54
D'Urville 174.00 -40.75 0.24 0.06 0.26 0.39 0.43
Farewell 172.75 -40.50 0.09 0.04 0.09 0.15 0.17
Foulwind 171.50 -41.75 0.47 0.11 0.48 0.82 0.99
Fiordland 166.00 -46.50 0.09 0.04 0.09 0.14 0.17
Chatham 183.25 -43.75 0.76 0.15 0.77 1.36 1.73

Page 63New Zealand Energy Information Handbook
12 12 12 12 12 Emerging Forms of EnergyEmerging Forms of EnergyEmerging Forms of EnergyEmerging Forms of EnergyEmerging Forms of Energy
Biofuels
In an age of growing environmentalconcern and of constrained supplies ofliquid fuels from crude oil, notablytransport fuels, biofuels hold the promiseof extending and replacing traditionalsources of oil-based energy.
In general, biofuels can be manufacturedfrom a large range of biomass sources/feedstocks. Additionally, different types ofbiofuel crops can be grown in numerouslocations. Sourcing fuels/energy frombiomass creates a considerable range ofdiversity from both the biomass sourceand geography points of view.
Given constrained and increasinglyexpensive oil supplies, much of it fromvolatile parts of the world, these aspectshave the potential to contribute greatlyto energy security.
Unsurprisingly, the economics of manu-facturing biofuels from different sourcesvaries considerably, depending onparameters such as competition for thefeedstock (food), competition for arableland, land costs, growing costs, the costsof the fuel manufacturing processes, theenvironmental effects of growing biofuelscrops and the environmental effects ofconverting the crop into useful fuel.
The greenhouse gas content embodied inbiofuels, emitted upon combustion, isconsidered neutral as it is then absorbedduring the growth cycle of the biofuelcrop. However, the growing, harvesting,extraction, refining and processingrequired to arrive at useable biofuels isnot carbon neutral as, more often thannot, fossil fuels are used to enable thesesteps. Thus, to a greater or lesser extent,
carbon is emitted during the conversionprocess from crop to useful energy. Inthis sense, some biofuels are more ‘CO2efficient’ than others.
Tables 12.1 – 12.4 give some indicativeestimates of effective energy and carbonintensity for a limited range of biofuelsources.
Petrol: Ethanol 100:67
Diesel: Biodiesel 100:86
Table 12.1: Relative energy content ofbiofuels (volumetric)
Corn ethanol (petrol) 1.3
Sugarcane ethanol (petrol) 8.0
Cellulosic ethanol (petrol) (eg. From wood or agricultural wastes, switchgrass, salix)
2 - 36
Canola (diesel) 2.5
Table 12.2: Energy balance from somefeedstocks (per unit of fossil fuel input)
Corn ethanol (petrol) 77%
(1)
Sugarcane ethanol (petrol)
10% - 45%
(2)
Cellulosic ethanol (petrol)
10%
Canola (diesel) 32%
Crutzen & Smith in Atmospheric Chemistry and Physics Discussions, Sept. 2007 estimate a range of 90-150% for (1) and 50-90% for (2)
Table 12.3: Relative GHG emissions(from production and use– Petrol/Diesel = 100%)

Page 64 Emerging Forms of Energy
Fuel Productivity L/ha/yr
Corn ethanol (petrol) 2800
Sugarcane ethanol (petrol)
5600 - 7500
Canola (diesel) 500 - 800
Soybeans 550
Peanuts 1000
Palm Oil 6000
Jatropha 12000
Algae (theoretical) 47000 - 65000
Table 12.4: Productivity – indicative forsome feedstocks (litres/hectare/year)
(Sources for Tables 12.1 – 12.4: US Deptof Energy, US Environmental ProtectionAgency, various.)
Figure 12.1 gives some indication of thedifferent pathways that are currentlyemployed to transform biomass intoliquid fuels.
HydrolysisLigno-
cellulose
Complex
sugars
FermentationSugar crops
Grain crops
Ethanol
EsterificationPlant Oils, tallow
Methanol
Biodiesel
Figure 12.1: Current biofuelstransformation Processes
From the yield and carbon emissionspoints of view, biodiesel from algae holdsconsiderable conceptual promise. Algaethrive and depend on the capture of CO2
in order to grow and produce energy. Thesame algae may also be able to absorbother impurities such as nitrates.
Unlike many other biofuel feedstocks,algae have not only huge productivity perunit area, but will often thrive in areasthat are not arable and which do notcompete for other uses such as ponds orbogs.
However, due in part to its high watercontent, the path to useful fuel is notwell developed with most processesbeing largely experimental and costly.
In contrast, most of the other feedstockoptions described in Tables 12.1-12.4 andsummarised in Figure 12.1 are establishedprocesses, even if some of them are notas high yield, have competing uses, andmay not be very carbon-beneficial.
Potential petrol substitutes(alcohols, MTBE)
Liquid fuels are currently the principalsource of energy in the Western world. Agreat many fuels fall into this category,most of which are oil-based products.There are, however, a number of alterna-tives to oil-based fuels, and in the field oftransport the more important currentlyappear to be the alcohols and variousvegetable and animal oils and fats. Thesefuels are designed to blend with orsubstitute for petrol in spark ignitionengines and diesel fuel in compressionignition engines.
The alcohols
The alcohols, methanol and ethanol, aresuitable for use in spark ignition engines.They may be used alone or blended withpetrol. Low percentage blends of alcoholwith petrol may not require any engine orvehicle modifications and as such may be

Page 65New Zealand Energy Information Handbook
used as a petrol extender. High alcoholblends require a number of enginemodifications if their full potential is tobe realised. One reason for enginemodifications is the incompatibility ofalcohols with conventional engine andvehicle materials, leading to problems ofcorrosion.
Sources
Methanol can be obtained from a varietyof sources – gasification of coal or wood,or reforming of natural gas, currently thecheapest source for large-scale production.
Ethanol can be produced from ethylene(derived from oil) or by the fermentationand distillation of sugars from variousagricultural crops (eg. sugar cane, beetand corn) or whey, a by-product of milkprocessing.
Since the alcohols are oxygenated fuelsthey require less air for combustion of aunit mass of fuel. However their calorificvalue is approximately half that of petrol,hence nearly twice as much fuel must beburnt within an engine cylinder in orderto obtain an equivalent power output.
Alcohol-petrol blended fuels
Low alcohol blends consist of up to 10%alcohol in petrol. Only minor enginechanges may be necessary with suchblends.
High alcohol blends consist of up to 85%alcohol in petrol. The small percentage ofpetrol is present to ensure adequate coldstarting.
In addition to the material compatibilityproblems mentioned above, blendedfuels can have phase separation prob-lems. As ethanol and methanol are totallymiscible with water, the miscibility of
both alcohols in petrol is reduced by thepresence of water, and is further reducedat cooler temperatures.
The current trend is to operate vehicleswith a flexible fuelling system. A flexiblefuelled vehicle is designed to run on anypercentage blend of ethanol and petrolup to a maximum of 85% alcohol. Onehundred percent ethanol is available as avehicle fuel in Brazil.
However, relatively little data has beenpublished on fuel economy and emis-sions for engines operating with fuelblends ranging between 10% and 85%ethanol. Thus there has been little effortmade to optimise engine efficiency overthis range to the point that would offsetthe additional fuel cost.
MTBE
The alcohols may themselves be used asa feedstock, with iso-butane, for theproduction of methyl tertiary butyl ether,MTBE, or ethyl tertiary butyl ether, ETBE.These blends have higher specificenergies when compared to the basealcohols.
Furthermore, the anti-knock qualities ofMTBE and ETBE are superior to thealcohols and therefore may be used asnon lead-based octane boosters in petrol.They also have the advantage of lowerenthalpies of vaporisation and do notsuffer water separation problems whenblended with petrol due to a highmiscibility with all hydrocarbon fuels anda low solubility with water.
The use of MTBE gained some popularityin the 1990s. However, suspectedcarcinogenic issues have resulted in itsuse falling from favour. Ethanol, which ismore expensive, is generally regarded asa suitable substitute. It has an octane

Page 66 Emerging Forms of Energy
GCV NCV
Fuel Specific Gravity(1) MJ/kg(2) MJ/l (3) MJ/kg(2) MJ/l (3)
Petrol 0.73 47.2 34.5 44.4 32.4
Methanol 0.80 22.3 17.8 19.9 15.8
Ethanol 0.79 29.7 23.6 26.8 21.3
M15(4) 0.74 43.2 32.0 40.4 29.9
E20(4) 0.74 43.5 32.3 40.7 30.2
M85(4) 0.79 25.8 20.4 23.3 18.4
E90(4) 0.78 31.3 24.5 28.4 22.3
MTBE 0.74 38.1 28.2 35.3 26.2
(1) ±0.01; (2) ±0.1; (3) ±0.5; (4) Numbers refer to the volume percentage of alcohol in the blend (M=methanol blend, E=ethanol blend)
Table 12.5: Typical energy values for substitutes and blends with petrol
C content(1) CO2 Emission factor
Fuel % mass tCO2/TJ tC/TJ
Petrol 86 66.6 18.2
Methanol 38 62.4 17.0
Ethanol 52 64.2 17.5
1 Estimates of carbon content sourced from Bosch (1986)
Table 12.6: Typical values of CO2 emission factor for alcohol fuels
value of around 113.
Data for petrol substitutes
Notwithstanding the trend towardsflexible fuelling, data for particular blendsare still presented in Table 12.5. Table12.6 lists CO2 emission factors for thealcohol fuels, in comparison with petrol.
Potential diesel substitutes(alcohols, vegetable oils andanimal fats)
Alcohols
While the alcohols are attractive alterna-tive fuels for petrol, they are inherentlypoor fuels for use in diesel engines. It isdifficult to obtain diesel-like combustionwith pure alcohol fuels in an unmodified
engine because of their long ignitiondelay periods quantified by excessivelylow cetane numbers. Various ways ofburning the alcohols, employing eitherpartial or complete diesel substitution, arecurrently being investigated worldwide.
Vegetable oils and animal fats
These fuels generally have cetanenumbers closely similar to diesel fuels,but exhibit similar combustion character-istics. High cloud points can causeproblems in low ambient temperatureconditions, but this can be quite easilyovercome by the installation of a heatingcoil in the fuel tank.
The oils and fats may be used alone or inblends with diesel fuel in both direct andindirect fuelled engines. Their use is

Page 67New Zealand Energy Information Handbook
NCV
Fuel Specific Gravity(1) MJ/kg(2) MJ/l(3)
Diesel 0.83 43.0 35.8
Castor oil 0.96 35.2 33.8
Linseed oil 0.93 39.5 36.7
Peanut oil 0.92 37.0 34.1
Rape seed oil (RSO) 0.92 37.6 34.5
Methyl esters of RSO 0.89 39.1 34.6
Ethyl esters of RSO 0.88 41.0 35.9
Safflower oil 0.91 39.5 36.1
Soybean oil 0.92 36.9 34.1
Tallow (molten) 0.89 38.8 34.7
Methyl esters of tallow 0.88 40.4 35.4
Ethyl esters of tallow 0.87 41.7 36.2
Butyl esters of tallow 0.87 41.2 35.9
1 ±0.01; 2 ±0.20; 3 ±0.50
Table 12.7: Typical data for specific gravity and net calorific value forpotential diesel substitutes (Sources: Wickramanayake,1981; Sims et al.)
becoming more widespread subject tofeedstock availability and price.
Transesterification of the oils, usingethanol or methanol, reduces theviscosity to a level similar to diesel fueland this helps to lower the combustionrelated problems. The influence ofindividual diesel engine designs whenused with these fuels is considerable andwhilst certain engines may performsatisfactorily others have reportedfailures after very short periods ofoperation.
Table 12.7 summarises specific gravityand net calorific data for a range ofvegetable oils and animal fats.
Gas-to-liquids (GTL) and coal-to-liquids (CTL) Fuels
Overview
The production of synthetic fuels (so
called ‘synfuels’) is an establishedtechnology with a history that dates backto the 1920s and coal-based plants.Modern technology, however, is verydifferent from its original form which wasaimed at the direct production of liquidfuels from coal and there is now agrowing interest in the technologies as ameans of converting natural gas, biomassand coal into high-value liquid fuels,including methanol, dimethyl ether,middle distillates and specialty chemicalsand waxes. There is now a significantcommercial experience in these technolo-gies and considerable investigationworldwide into new projects based uponstranded gas resources and low-costlignite coals.
In New Zealand, the gas-to-liquids plantat Motunui, which used the Mobilproprietary ZSM5 catalyst technology forthe conversion of methanol to petrol,was one of the first plants of the modern
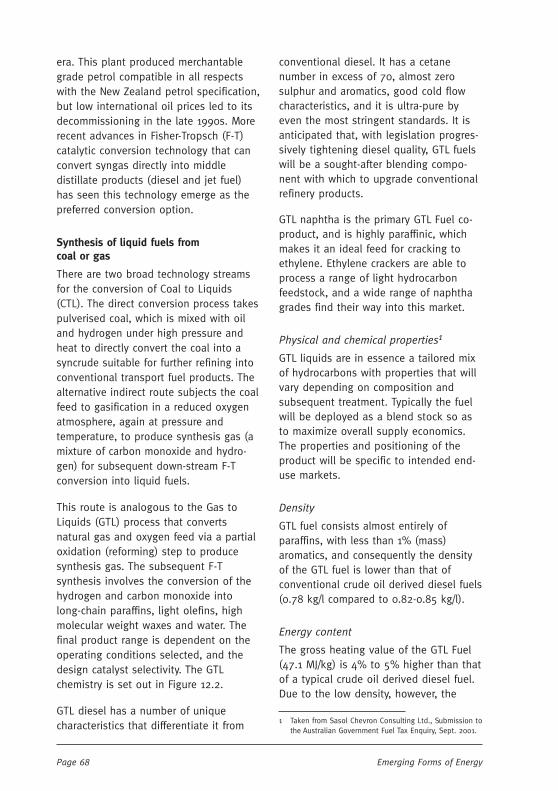
Page 68 Emerging Forms of Energy
era. This plant produced merchantablegrade petrol compatible in all respectswith the New Zealand petrol specification,but low international oil prices led to itsdecommissioning in the late 1990s. Morerecent advances in Fisher-Tropsch (F-T)catalytic conversion technology that canconvert syngas directly into middledistillate products (diesel and jet fuel)has seen this technology emerge as thepreferred conversion option.
Synthesis of liquid fuels fromcoal or gas
There are two broad technology streamsfor the conversion of Coal to Liquids(CTL). The direct conversion process takespulverised coal, which is mixed with oiland hydrogen under high pressure andheat to directly convert the coal into asyncrude suitable for further refining intoconventional transport fuel products. Thealternative indirect route subjects the coalfeed to gasification in a reduced oxygenatmosphere, again at pressure andtemperature, to produce synthesis gas (amixture of carbon monoxide and hydro-gen) for subsequent down-stream F-Tconversion into liquid fuels.
This route is analogous to the Gas toLiquids (GTL) process that convertsnatural gas and oxygen feed via a partialoxidation (reforming) step to producesynthesis gas. The subsequent F-Tsynthesis involves the conversion of thehydrogen and carbon monoxide intolong-chain paraffins, light olefins, highmolecular weight waxes and water. Thefinal product range is dependent on theoperating conditions selected, and thedesign catalyst selectivity. The GTLchemistry is set out in Figure 12.2.
GTL diesel has a number of uniquecharacteristics that differentiate it from
conventional diesel. It has a cetanenumber in excess of 70, almost zerosulphur and aromatics, good cold flowcharacteristics, and it is ultra-pure byeven the most stringent standards. It isanticipated that, with legislation progres-sively tightening diesel quality, GTL fuelswill be a sought-after blending compo-nent with which to upgrade conventionalrefinery products.
GTL naphtha is the primary GTL Fuel co-product, and is highly paraffinic, whichmakes it an ideal feed for cracking toethylene. Ethylene crackers are able toprocess a range of light hydrocarbonfeedstock, and a wide range of naphthagrades find their way into this market.
Physical and chemical properties1
GTL liquids are in essence a tailored mixof hydrocarbons with properties that willvary depending on composition andsubsequent treatment. Typically the fuelwill be deployed as a blend stock so asto maximize overall supply economics.The properties and positioning of theproduct will be specific to intended end-use markets.
Density
GTL fuel consists almost entirely ofparaffins, with less than 1% (mass)aromatics, and consequently the densityof the GTL fuel is lower than that ofconventional crude oil derived diesel fuels(0.78 kg/l compared to 0.82-0.85 kg/l).
Energy content
The gross heating value of the GTL Fuel(47.1 MJ/kg) is 4% to 5% higher than thatof a typical crude oil derived diesel fuel.Due to the low density, however, the
1 Taken from Sasol Chevron Consulting Ltd., Submission tothe Australian Government Fuel Tax Enquiry, Sept. 2001.
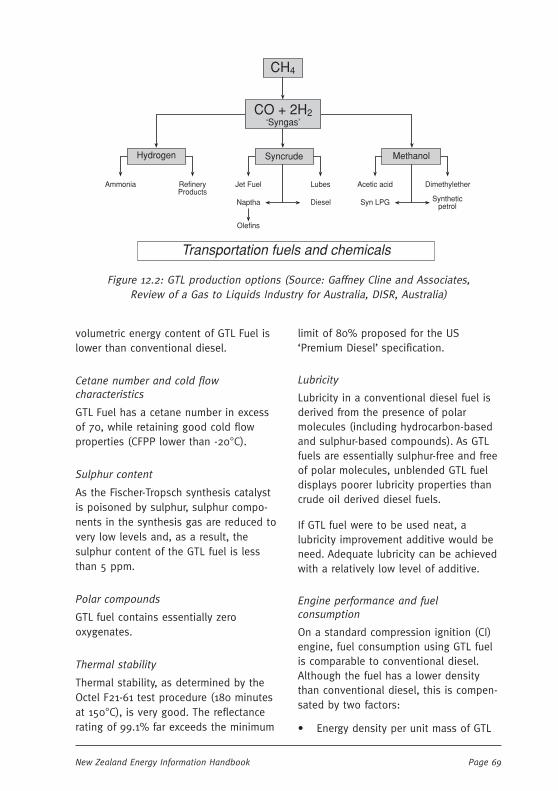
Page 69New Zealand Energy Information Handbook
volumetric energy content of GTL Fuel islower than conventional diesel.
Cetane number and cold flowcharacteristics
GTL Fuel has a cetane number in excessof 70, while retaining good cold flowproperties (CFPP lower than -20°C).
Sulphur content
As the Fischer-Tropsch synthesis catalystis poisoned by sulphur, sulphur compo-nents in the synthesis gas are reduced tovery low levels and, as a result, thesulphur content of the GTL fuel is lessthan 5 ppm.
Polar compounds
GTL fuel contains essentially zerooxygenates.
Thermal stability
Thermal stability, as determined by theOctel F21-61 test procedure (180 minutesat 150°C), is very good. The reflectancerating of 99.1% far exceeds the minimum
limit of 80% proposed for the US‘Premium Diesel’ specification.
Lubricity
Lubricity in a conventional diesel fuel isderived from the presence of polarmolecules (including hydrocarbon-basedand sulphur-based compounds). As GTLfuels are essentially sulphur-free and freeof polar molecules, unblended GTL fueldisplays poorer lubricity properties thancrude oil derived diesel fuels.
If GTL fuel were to be used neat, alubricity improvement additive would beneed. Adequate lubricity can be achievedwith a relatively low level of additive.
Engine performance and fuelconsumption
On a standard compression ignition (CI)engine, fuel consumption using GTL fuelis comparable to conventional diesel.Although the fuel has a lower densitythan conventional diesel, this is compen-sated by two factors:
• Energy density per unit mass of GTL
Figure 12.2: GTL production options (Source: Gaffney Cline and Associates,Review of a Gas to Liquids Industry for Australia, DISR, Australia)
CH4
CO + 2H2‘Syngas’
SyncrudeHydrogen Methanol
Ammonia RefineryProducts
Jet Fuel Lubes Acetic acid Dimethylether
Naptha Diesel
Olefins
Syn LPG Syntheticpetrol
Transportation fuels and chemicals
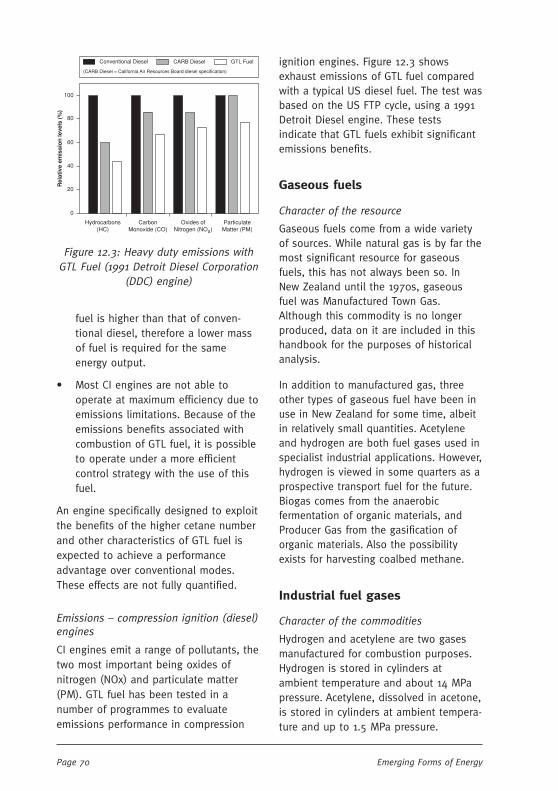
Page 70 Emerging Forms of Energy
100
80
60
40
20
0
Rel
ativ
e em
issi
on
leve
ls (
%)
Hydrocarbons(HC)
CarbonMonoxide (CO)
Oxides ofNitrogen (NOx)
ParticulateMatter (PM)
Conventional Diesel CARB Diesel GTL Fuel
(CARB Diesel = California Air Resources Board diesel specification)
Figure 12.3: Heavy duty emissions withGTL Fuel (1991 Detroit Diesel Corporation
(DDC) engine)
fuel is higher than that of conven-tional diesel, therefore a lower massof fuel is required for the sameenergy output.
• Most CI engines are not able tooperate at maximum efficiency due toemissions limitations. Because of theemissions benefits associated withcombustion of GTL fuel, it is possibleto operate under a more efficientcontrol strategy with the use of thisfuel.
An engine specifically designed to exploitthe benefits of the higher cetane numberand other characteristics of GTL fuel isexpected to achieve a performanceadvantage over conventional modes.These effects are not fully quantified.
Emissions – compression ignition (diesel)engines
CI engines emit a range of pollutants, thetwo most important being oxides ofnitrogen (NOx) and particulate matter(PM). GTL fuel has been tested in anumber of programmes to evaluateemissions performance in compression
ignition engines. Figure 12.3 showsexhaust emissions of GTL fuel comparedwith a typical US diesel fuel. The test wasbased on the US FTP cycle, using a 1991Detroit Diesel engine. These testsindicate that GTL fuels exhibit significantemissions benefits.
Gaseous fuels
Character of the resource
Gaseous fuels come from a wide varietyof sources. While natural gas is by far themost significant resource for gaseousfuels, this has not always been so. InNew Zealand until the 1970s, gaseousfuel was Manufactured Town Gas.Although this commodity is no longerproduced, data on it are included in thishandbook for the purposes of historicalanalysis.
In addition to manufactured gas, threeother types of gaseous fuel have been inuse in New Zealand for some time, albeitin relatively small quantities. Acetyleneand hydrogen are both fuel gases used inspecialist industrial applications. However,hydrogen is viewed in some quarters as aprospective transport fuel for the future.Biogas comes from the anaerobicfermentation of organic materials, andProducer Gas from the gasification oforganic materials. Also the possibilityexists for harvesting coalbed methane.
Industrial fuel gases
Character of the commodities
Hydrogen and acetylene are two gasesmanufactured for combustion purposes.Hydrogen is stored in cylinders atambient temperature and about 14 MPapressure. Acetylene, dissolved in acetone,is stored in cylinders at ambient tempera-ture and up to 1.5 MPa pressure.

Page 71New Zealand Energy Information Handbook
Both gases are sold on the basis of gasvolumes at atmospheric pressure and 15˚C.
Hydrogen
Sources of hydrogen
Hydrogen has the potential to become anattractive alternative fuel as its cleanburning properties could help combatatmospheric pollution caused by thecombustion of fossil fuels. Current large-scale manufacture of hydrogen is fromfossil fuels, involving the release ofcarbon dioxide gas. If hydrogen is to bemanufactured in the future, free of carbondioxide emissions, it can be producedelectrolytically from water, using hydropower, wind power, photovoltaic solarpower or thermal solar power. Feasibilitystudies and demonstration plants arecurrently being investigated worldwide.
Hydrogen for transport
The greatest potential use for hydrogenis as a transport fuel. There are howevertwo major problem areas involving thecombustion of hydrogen in an engine andthe storage of hydrogen in a vehicle.
The minimum ignition energy of hydro-gen-air mixtures is an order of magnitude
lower than that of petrol or CNG. Hencehot spots within an engine cylinder, orresidual exhaust gases are likely to causelightback and/or pre-ignition. Thisproblem may be overcome by employinga well-designed mixture formationsystem.
The only pollutants from an engineoperating on hydrogen are the oxides ofnitrogen. Operating at lean air-fuel ratiosor burning the fuel in a similar manner todiesel operation will ensure low levels ofthese pollutants. The rotary (Wankel)engine has inherent design characteristicsthat suit hydrogen operation.
Storage methods
The main storage methods for hydrogenare high pressure gaseous storage, metalhydride storage, and as liquid hydrogen.Despite the disadvantage of high cost forliquefaction, liquid hydrogen is the onlymethod that provides a sufficiently highenergy density for an acceptable storagevolume. It has the added advantage thatlittle energy is required to compressliquid hydrogen to the pressures neces-sary for high pressure gaseous injection.
Manufactured town gas
Character of the commodity
Manufactured town gas used to be thesingle gaseous product retailed frommanufacturing gas companies. Since itsenergy content was very closely specified,it was usually the blended product ofseveral gases produced within the gasworks from a variety of raw materials.
In coal gasification-oriented operations(once typical in throughout New Zealand)the bulk of manufactured town gas wasderived from coal gas. This was oftenblended with other gas in order to
Product GCV
MJ/m3
NCV
MJ/m3
Hydrogen 11.9 10.1
Acetylene 54.4 52.6
Town gas 16.8 15.1
Producer gas 4.8 4.4
Methane 37.7 34.0
Table 12.8: Typical calorific values forhydrogen, acetylene, methane, town andproducer gases at 15˚C and 101.325 kPa
(absolute) pressure.

Page 72 Emerging Forms of Energy
maintain the required calorific rating aswell as to boost supplies. Sometimessupplies were made up with productionof carburetted water gas and reformergas. In reformer-type operations (oncecommon in the North Island) manufac-tured town gas was derived fromreformer gas using light distillatefeedstock (gas naphtha) or natural petrol.
Calorific values for manufactured towngas are shown in Table 12.8.
Producer Gas
Character of the commodity
Any plant material capable of conversionto coarse charcoal within a gasifier makessuitable fuel for gasification. Althoughplant wastes can be used, wood is themost common feedstock. A typicalanalysis (% volume) of producer gas is:
20% carbon monoxide
19% hydrogen
1% methane
9% carbon dioxide
51% nitrogen
Calorific values
Producer gas from wood may vary incalorific value from 4.1 to 6.3 MJ/m3.However typical data for practicalpurposes are:
Gas density (kg/m3) 1.09
GCV (MJ/m3) 4.8
NCV (MJ/m3) 4.4
Coalbed Methane
Character of the resource
The occurrence of coalbed gases, mainlymethane, has been considered a hazardin New Zealand coal mines and therehave been several major explosions
involving this gas mixture. Only in recentyears has attention been turned to thepotential for coalbed methane (CBM) tobe tapped as a commercial energysource.
In New Zealand, coalbed gas mostcommonly comprises methane with smallamounts of ethane. Available gascomposition analyses suggest that it israre to encounter more than a trace ofother gases. Data for methane is given inTables 4.1 and 4.2 (page 20).
Gas content of coals
Exploration and production of coalbedmethane in New Zealand is in its infancy.Production is on a relatively small scalein a small number of locations in Otago/Southland and the Waikato.
Some data is available on the gascontent of New Zealand coals. Gascontent varies with coal rank. It can alsobe influenced by the geological structurewithin a coal deposit, with thick lenticularseams providing the potential forsignificant gas reserves. Estimates oflikely gas-bearing capacities (m3/tonne ofin-ground coal) have been made for threecoalfields, as follows:
Huntly coalfield 1-2
Greymouth coalfield 9-13
Aratika coalfield 3-8
Gas Hydrates
Gas hydrates are a substance in whichmolecules of water form a lattice thatencloses molecules of methane gas. Theyare found in arctic permafrost or belowthe seabed and, in New Zealand, exist asa void-filling clathrate within sedimentsalong New Zealand’s deep-water conti-nental margins (at water depths greaterthan about 800 m).
Page 73New Zealand Energy Information Handbook
There is now general agreement thathydrate deposits serve as one of thelargest storehouses of organic carbon onthe planet, probably exceeding theamount remaining in all the world’s oil,natural gas and coal deposits combined.
New Zealand has enormous gas hydratereserves. The East Coast margin isconsidered one of the single largest gashydrate provinces in the world, with anestimated area of about 50,000 km2, anestimated volume of gas hydrate of atleast 228.5 km3, and about 23 Tm3 ofrecoverable reserves2. Economically viablereserves may be greater than 1.1 Tm3 (12times larger than the Maui gas field).
The utilisation of gas hydrates as anenergy resource in a safe and environ-mentally acceptable way is at present amajor focus of several nations (Japan, US,India and others). Although the technol-
ogy for production of natural gas fromhydrates is at present in the developmen-tal stage, transportation, storage andgeneration technologies are the same asfor natural gas, eg:
• Deep offshore rigs.
• Offshore/onshore production.
• LNG import /export /storage.
• Gas plant.
• Gas Post treatment.
• Compression.
• Fischer-Tropsch syngas production.
Gas hydrates have the potential toprovide New Zealand with a secureenergy supply for both electricitygeneration and as a transport fuel.However, the technology for recovery ofgas hydrates is by no means established,and the energetics of recovery areexpensive.
2 Pecher, I A and Henrys, S A, 2003. Potential GasReserves in Gas Hydrate Sweet Spots on the HikurangiMargin, New Zealand, Report v2003/23, Institute ofGeological & Nuclear Sciences

Page 74 Emerging Forms of Energy
Page 75New Zealand Energy Information Handbook
13 13 13 13 13 ElectricityElectricityElectricityElectricityElectricity
Resource base
Electricity is not an energy resource initself, but is a means of transmission ofenergy. Because there is no simpleinexpensive way of storing very largequantities of electricity it must be usedas produced (or conversely produced asit is required) It is therefore alwaysnecessary to consider several aspects ofelectricity use:
• the magnitude of the resource(s) –Energy.
• The means of conversion.
• The rate of conversion and transmis-sion – Power.
Electricity is quite often designated‘primary’ or ‘secondary’ according to itsgenerating source. Where no fuel isrequired as a feedstock for generation, itis called primary electrical energy. Thisincludes hydro, geothermal, wind andphotovoltaic sources. Electricity that isderived from other primary fuels — coal,oil, gas, wood, refuse, crop residues, etc.— is termed secondary electrical energy.
Historically, electricity generation in NewZealand has been based almost exclusivelyon relatively large-scale power stations —hydro, geothermal, or fired by coal, oil ornatural gas. Within the last decade or soalternative modes of generating electricityhave emerged. These include electricityfrom windpower (see Section 10) and frommunicipal wastes, as well as electricityfrom on-site cogeneration in industry.Small-scale solar-based technology (photo-voltaic) has been in use in specialistsituations for some years, as has micro-hydro technology.
Nevertheless, over 90% of the electricity
presently generated each year in NewZealand comes from relatively large-scalepower stations operated by the fivemajor generating companies. The balanceis generated in smaller facilities jointlyowned with distribution network opera-tors or large industrial plants (e.g. milkprocessing plant).
The resource base can be quantified interms of the stocks and flows of primaryresources available, or in terms of theinstalled generating capacity of existingpower stations. Data for all operatingpower stations as of 2007 are given inTables 13.1 and 13.2.
Electricity units
All electricity at a given voltage has thesame energy value, regardless of source.The most frequently used and universallyaccepted unit for quantifying electricalenergy is the kilowatt-hour (kWh). Incommercial transactions, one ‘unit’ ofelectricity is the same as one kWh. Themetric equivalent of one kWh is 3.6 MJ.Other standard multiples of the kWh arethe GWh and TWh.
Electrical energy and power
Units of electrical energy (kWh) shouldnot be confused with units of electricalpower (kW). Power is concerned with therate at which energy is transformed orused. For example, 15 kWh of electricalenergy is the amount of energy involvedif generated or used at the rate of 5 kWfor a continuous period of three hours.
Thermal equivalents
In national energy accounts, the practice
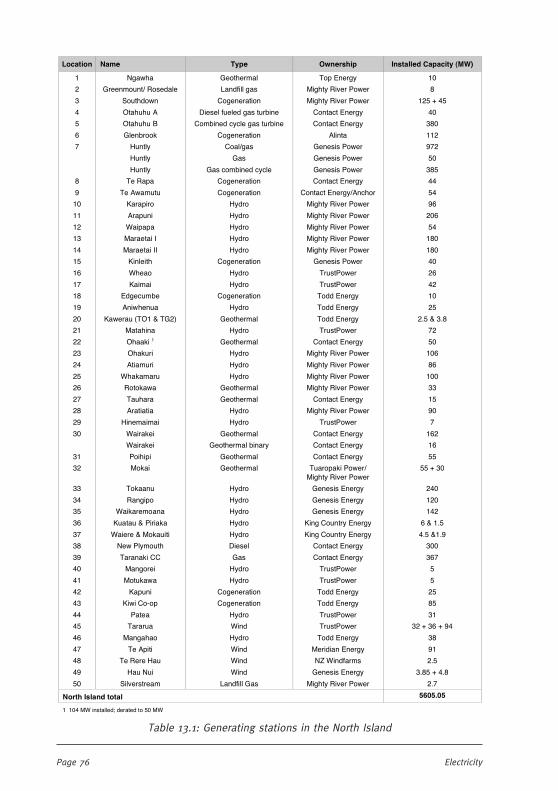
Page 76 Electricity
Table 13.1: Generating stations in the North Island
Location Name Type Ownership Installed Capacity (MW)
1 Ngawha Geothermal Top Energy 10
2 Greenmount/ Rosedale Landfill gas Mighty River Power 8
3 Southdown Cogeneration Mighty River Power 125 + 45
4 Otahuhu A Diesel fueled gas turbine Contact Energy 40
5 Otahuhu B Combined cycle gas turbine Contact Energy 380
6 Glenbrook Cogeneration Alinta 112
7 Huntly Coal/gas Genesis Power 972
Huntly Gas Genesis Power 50
Huntly Gas combined cycle Genesis Power 385
8 Te Rapa Cogeneration Contact Energy 44
9 Te Awamutu Cogeneration Contact Energy/Anchor 54
10 Karapiro Hydro Mighty River Power 96
11 Arapuni Hydro Mighty River Power 206
12 Waipapa Hydro Mighty River Power 54
13 Maraetai I Hydro Mighty River Power 180
14 Maraetai II Hydro Mighty River Power 180
15 Kinleith Cogeneration Genesis Power 40
16 Wheao Hydro TrustPower 26
17 Kaimai Hydro TrustPower 42
18 Edgecumbe Cogeneration Todd Energy 10
19 Aniwhenua Hydro Todd Energy 25
20 Kawerau (TO1 & TG2) Geothermal Todd Energy 2.5 & 3.8
21 Matahina Hydro TrustPower 72
22 Ohaaki 1 Geothermal Contact Energy 50
23 Ohakuri Hydro Mighty River Power 106
24 Atiamuri Hydro Mighty River Power 86
25 Whakamaru Hydro Mighty River Power 100
26 Rotokawa Geothermal Mighty River Power 33
27 Tauhara Geothermal Contact Energy 15
28 Aratiatia Hydro Mighty River Power 90
29 Hinemaimai Hydro TrustPower 7
30 Wairakei Geothermal Contact Energy 162
Wairakei Geothermal binary Contact Energy 16
31 Poihipi Geothermal Contact Energy 55
32 Mokai Geothermal Tuaropaki Power/ Mighty River Power
55 + 30
33 Tokaanu Hydro Genesis Energy 240
34 Rangipo Hydro Genesis Energy 120
35 Waikaremoana Hydro Genesis Energy 142
36 Kuatau & Piriaka Hydro King Country Energy 6 & 1.5
37 Waiere & Mokauiti Hydro King Country Energy 4.5 &1.9
38 New Plymouth Diesel Contact Energy 300
39 Taranaki CC Gas Contact Energy 367
40 Mangorei Hydro TrustPower 5
41 Motukawa Hydro TrustPower 5
42 Kapuni Cogeneration Todd Energy 25
43 Kiwi Co-op Cogeneration Todd Energy 85
44 Patea Hydro TrustPower 31
45 Tararua Wind TrustPower 32 + 36 + 94
46 Mangahao Hydro Todd Energy 38
47 Te Apiti Wind Meridian Energy 91
48 Te Rere Hau Wind NZ Windfarms 2.5
49 Hau Nui Wind Genesis Energy 3.85 + 4.8
50 Silverstream Landfill Gas Mighty River Power 2.7
North Island total 5605.05
1 104 MW installed; derated to 50 MW
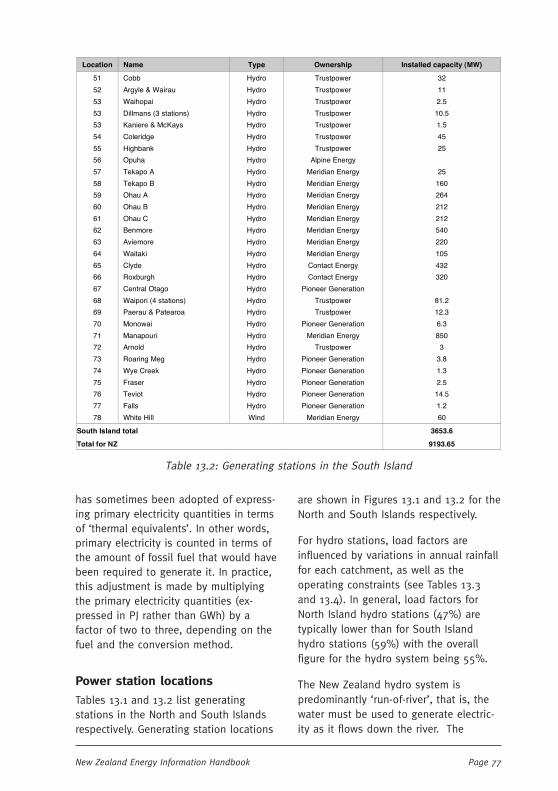
Page 77New Zealand Energy Information Handbook
has sometimes been adopted of express-ing primary electricity quantities in termsof ‘thermal equivalents’. In other words,primary electricity is counted in terms ofthe amount of fossil fuel that would havebeen required to generate it. In practice,this adjustment is made by multiplyingthe primary electricity quantities (ex-pressed in PJ rather than GWh) by afactor of two to three, depending on thefuel and the conversion method.
Power station locations
Tables 13.1 and 13.2 list generatingstations in the North and South Islandsrespectively. Generating station locations
are shown in Figures 13.1 and 13.2 for theNorth and South Islands respectively.
For hydro stations, load factors areinfluenced by variations in annual rainfallfor each catchment, as well as theoperating constraints (see Tables 13.3and 13.4). In general, load factors forNorth Island hydro stations (47%) aretypically lower than for South Islandhydro stations (59%) with the overallfigure for the hydro system being 55%.
The New Zealand hydro system ispredominantly ‘run-of-river’, that is, thewater must be used to generate electric-ity as it flows down the river. The
Table 13.2: Generating stations in the South Island
Location Name Type Ownership Installed capacity (MW)
51 Cobb Hydro Trustpower 32
52 Argyle & Wairau Hydro Trustpower 11
53 Waihopai Hydro Trustpower 2.5
53 Dillmans (3 stations) Hydro Trustpower 10.5
53 Kaniere & McKays Hydro Trustpower 1.5
54 Coleridge Hydro Trustpower 45
55 Highbank Hydro Trustpower 25
56 Opuha Hydro Alpine Energy
57 Tekapo A Hydro Meridian Energy 25
58 Tekapo B Hydro Meridian Energy 160
59 Ohau A Hydro Meridian Energy 264
60 Ohau B Hydro Meridian Energy 212
61 Ohau C Hydro Meridian Energy 212
62 Benmore Hydro Meridian Energy 540
63 Aviemore Hydro Meridian Energy 220
64 Waitaki Hydro Meridian Energy 105
65 Clyde Hydro Contact Energy 432
66 Roxburgh Hydro Contact Energy 320
67 Central Otago Hydro Pioneer Generation
68 Waipori (4 stations) Hydro Trustpower 81.2
69 Paerau & Patearoa Hydro Trustpower 12.3
70 Monowai Hydro Pioneer Generation 6.3
71 Manapouri Hydro Meridian Energy 850
72 Arnold Hydro Trustpower 3
73 Roaring Meg Hydro Pioneer Generation 3.8
74 Wye Creek Hydro Pioneer Generation 1.3
75 Fraser Hydro Pioneer Generation 2.5
76 Teviot Hydro Pioneer Generation 14.5
77 Falls Hydro Pioneer Generation 1.2
78 White Hill Wind Meridian Energy 60
South Island total 3653.6
Total for NZ 9193.65
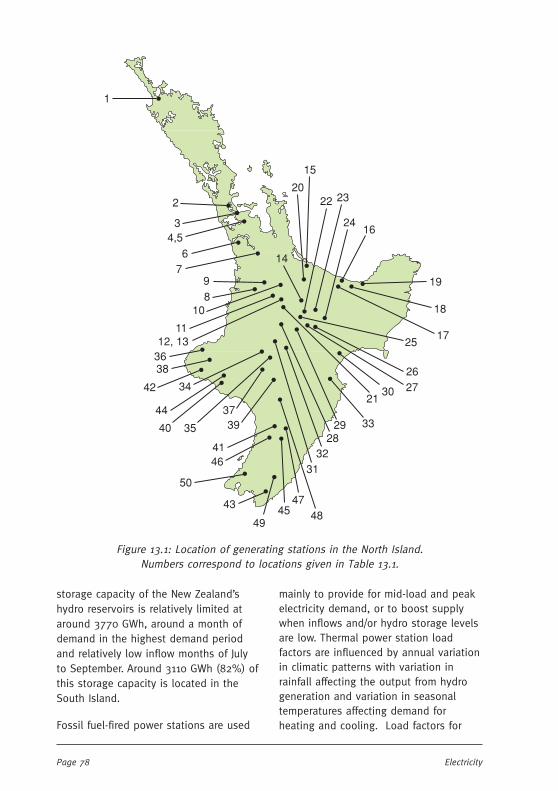
Page 78 Electricity
Figure 13.1: Location of generating stations in the North Island.Numbers correspond to locations given in Table 13.1.
storage capacity of the New Zealand’shydro reservoirs is relatively limited ataround 3770 GWh, around a month ofdemand in the highest demand periodand relatively low inflow months of Julyto September. Around 3110 GWh (82%) ofthis storage capacity is located in theSouth Island.
Fossil fuel-fired power stations are used
mainly to provide for mid-load and peakelectricity demand, or to boost supplywhen inflows and/or hydro storage levelsare low. Thermal power station loadfactors are influenced by annual variationin climatic patterns with variation inrainfall affecting the output from hydrogeneration and variation in seasonaltemperatures affecting demand forheating and cooling. Load factors for
15
202
34,5
67
98
10
1112, 13
3638
34
40 35
3739
4146
43
3132
2829 33
2130
26
2517
18
19
1624
2322
14
1
27
49
50
4547
48
42
44
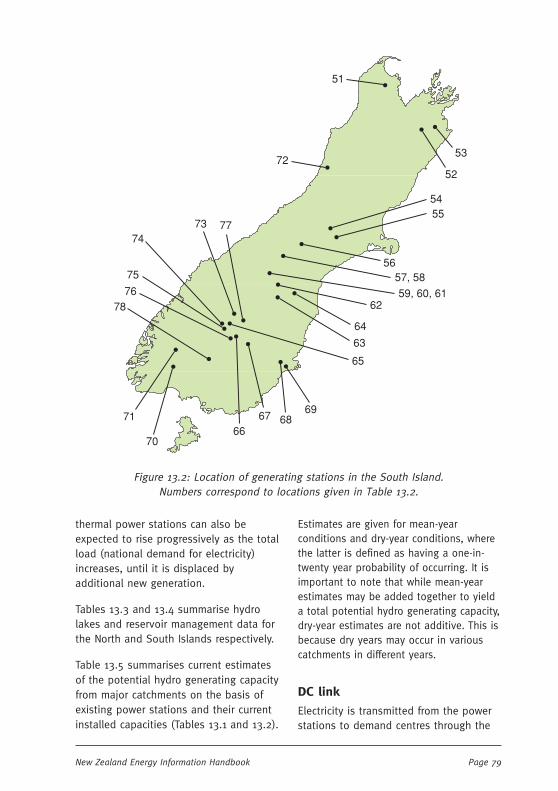
Page 79New Zealand Energy Information Handbook
Figure 13.2: Location of generating stations in the South Island.Numbers correspond to locations given in Table 13.2.
thermal power stations can also beexpected to rise progressively as the totalload (national demand for electricity)increases, until it is displaced byadditional new generation.
Tables 13.3 and 13.4 summarise hydrolakes and reservoir management data forthe North and South Islands respectively.
Table 13.5 summarises current estimatesof the potential hydro generating capacityfrom major catchments on the basis ofexisting power stations and their currentinstalled capacities (Tables 13.1 and 13.2).
Estimates are given for mean-yearconditions and dry-year conditions, wherethe latter is defined as having a one-in-twenty year probability of occurring. It isimportant to note that while mean-yearestimates may be added together to yielda total potential hydro generating capacity,dry-year estimates are not additive. This isbecause dry years may occur in variouscatchments in different years.
DC link
Electricity is transmitted from the powerstations to demand centres through the
7066
67 6869
65
63
64
6259, 60, 61
54
53
76
75
7473 77
78
52
51
72
71
57, 5856
55

Page 80 Electricity
Table 13.4: South Island lakes and reservoir management data
Operating range (m)
Lake or Station Lake area (km2)
Catchment area (km2)
Design flood (m)
Range Max. Min Extreme min
Tekapo A 87.90 1440 713.05 7.60 709.70 702.10 701.80
Tekapo B Canal Fed 667.95 3.15 677.15 674.00 674.00
Lake Pukaki 169.00 1420 534.10 13.80 532.00 518.20 518.00
Lake Ohau 61.20 1135 524.15 0.30 519.75 519.45 519.45
Ohau A Canal fed 1.10 517.50 516.40
Lake Ruataniwha
4.90 460.00 0.30 458.80 458.50 458.00
Ohau B Canal fed 0.60 458.80 458.20
Ohau C Canal fed 0.40 410.00 409.60
Benmore 74.50 8500 362.60 0.95 361.45 360.50 355.25
Aviemore 28.80 1165 269.20 0.60 268.30 267.70 265.25
Waitaki 6.20 70 234.50 2.10 230.80 228.70 227.00
Lake Hawea 141.70 1384 349.05 8.00 346.00 338.00 330.00
Lake Wanaka 193.00 2575 279.80 1.95 278.30 276.35
Lake Wakatipu 293.00 3067 310.95 1.05 310.65 309.60
Clyde 25.00 195.10 1.00 194.50 193.50
Roxburgh 5.90 8580 133.20 1.85 132.00 130.15 127.40
Lake Te Anau 352.00 3095 1.25 202.70 201.45 200.85
Lake Manapouri 141.00 5880 1.80 178060 176.80 175.85
Highbank Canal fed 338.55 0.55 336.45 335.90 335.90
Coleridge 36.00 974 509.60 3.95 509.30 505.35 505.35
Cobb 2.10 69 810.75 13.70 807.70 794.00 788.20
Arnold Run-of-river 80.16 0.91 79.55 78.64 76.20
Table 13.3: North Island lakes and reservoir management data
Operating range (m)
Lake or Station Lake area (km2)
Catchment area (km2)
Design flood (m)
Range Max. Min Extreme min
Moawhango 4.660 602 853.44 14.00 851.00 837.00 835.75
Rangipo 0.024 216 822.70 3.10 818.40 815.30 814.50
Otamangakau 2.430 613.00 1.23 611.73 610.50 600.30
Te Whaiau Canal fed 612.71 1.26 611.76 610.50 603.50
Rotoaira 15.800 117 565.25 0.61 564.65 564.04 561.90
Taupo 611.000 3510 357.39 1.25 357.10 355.85
Aratiatia 0.550 115 339.05 1.20 337.80 336.60 336.00
Ohakuri 12.600 1575 289.10 0.94 286.94 286.00 285.10
Atiamuri 2.300 465 253.70 1.35 252.90 251.55 250.95
Whakamaru 7.400 240 227.60 1.55 226.50 224.95 224.55
Maraetai 1 & 2 5.000 690 189.70 1.65 189.00 187.35 187.35
Waipapa 1.600 245 129.10 0.60 128.10 127.50 125.05
Arapuni 9.100 260 113.30 1.05 111.00 109.95 109.00
Karapiro 7.700 875 54.10 1.90 52.90 51.00 50.60
Waikaremoana 54.000 347 617.50 3.00 610.80 607.80 607.20
Lake Kaitawa 0.061 2.60 480.20 477.60 477.60
Tuai 349
Whakaremarino 0.298 275.25 1.40 275.10 273.70 273.40
Mangahao 1 0.440 87 11.90 357.90 364.00 360.66
Mangahao 2 0.192 9.37 342.37 333.00 333.00
Mangahao 3 0.073 10.37 342.37 332.00 332.00
Matahina 2.480 2844 76.80 3.05 76.20 73.15 71.63

Page 81New Zealand Energy Information Handbook
high voltage transmission system ownedand operated by TransPower New ZealandLtd. Figures 13.3 and 13.4 show the highvoltage network for the North and SouthIslands respectively.
Electricity is transferred between theNorth Island and the South Island bymeans of the DC link, of which the CookStrait cables are an integral part.Electricity can be transmitted in eitherdirection and the maximum operationalcapacity of the DC link is normally 1100MW in the northward direction and 600MW southward.
Terminology
Availability factor:Availability factor:Availability factor:Availability factor:Availability factor: The time when agenerating unit is available for service(i.e. total time less planned and forcedoutage time), expressed as a percentageof total time.
Table 13.5: Potential hydro generatingcapacity from major catchmentsgiven existing power stations
Hydro catchments
Mean year (GWh)
Dry year1 (GWh)
North Island:
Rangipo2 979 806
Tokaanu2 1613 1332
Waikato (total)2 3308 2683
Waikaremoana 507 327
Matahina 311 234
South Island:
Waitaki tributary inflows
561 439
Ohau inflows 1870 1523
Pukaki inflows 3008 2383
Tekapo inflows 2923 2313
Roxburgh 1737 916
Manapouri/ Te Anau 5043 3951
Cobb 232 147
Coleridge 214 157
1 One in 20 year occurrence; estimates for individual catchments are not additive
2 Rangipo, Tokaanu and Waikato total include the appropriate diversions
Base load:Base load:Base load:Base load:Base load: A level of electrical power thatis demanded on a continuous basis overa specified period.
Capacity or plant utilisation factor:Capacity or plant utilisation factor:Capacity or plant utilisation factor:Capacity or plant utilisation factor:Capacity or plant utilisation factor: Theratio of actual energy to total energypossible supplied over a period, usually ayear. For example: a turbine with a ratedcapacity of 1 MW and operating with acapacity factor of 40%, will generate1 MW x 0.4 x 8,760 h = 3,504 MWhannually (note that 8,760 is the numberof hours in a year).
Dry hydrological year:Dry hydrological year:Dry hydrological year:Dry hydrological year:Dry hydrological year: Normally taken asthe lowest mean annual flow to beexpected at a station or site over atwenty year period. Again calculated fromthe hydrological records for that stationor site.
Geothermal Generation:Geothermal Generation:Geothermal Generation:Geothermal Generation:Geothermal Generation: Geothermalpower stations use energy derived fromnaturally occurring underground heat. Hotwater is brought from the undergroundreservoir to the surface through wells,and is flashed to steam in special vesselsby release of pressure. The steam isseparated from the liquid and fed to aturbine. Spent geothermal fluid isinjected back into peripheral parts of thereservoir to help maintain reservoirpressure.
Hydro Generation: Hydro Generation: Hydro Generation: Hydro Generation: Hydro Generation: Hydroelectric stationsuse the potential energy of water storedin lakes by a dam. When the water fromthe dam is released, gravity causes it toflow down into the power station, wherethe potential energy is converted intokinetic energy by turbines.
Installed capacity:Installed capacity:Installed capacity:Installed capacity:Installed capacity: The ‘in-situ maximum’rating, usually expressed in megawatts(MW). It takes into account any perma-nent up or down rating.
Line losses:Line losses:Line losses:Line losses:Line losses: Losses incurred in the

Page 82 Electricity
Figure 13.3: North Island high voltage network (Source: Transpower)
transmission of electricity to bulk andretail consumers.
Load:Load:Load:Load:Load: The total power used or suppliedto a defined block (e.g. a customer)
integrated over a period (usually half anhour). Thus the national maximum loadis the maximum energy generated orconsumed in any half-hour of the year.

Page 83New Zealand Energy Information Handbook
Load factor:Load factor:Load factor:Load factor:Load factor: The ratio of average tomaximum power demand over a period,usually a year, expressed as a percentage.
Maximum Control Level:Maximum Control Level:Maximum Control Level:Maximum Control Level:Maximum Control Level: The water levelof a hydroelectric reservoir or storagelake above which the lake cannot beraised except under defined flood
Figure 13.4: Sorth Island high voltage network (Source: Transpower)
conditions given by the water right.
Mean hydrological year:Mean hydrological year:Mean hydrological year:Mean hydrological year:Mean hydrological year: The mean annualflow at a station or site, as determinedby hydrological records for that station orsite.
Minimum Control Level:Minimum Control Level:Minimum Control Level:Minimum Control Level:Minimum Control Level: The water level

Page 84 Electricity
of a hydroelectric reservoir or storagelake below which the lake cannot belowered for operating purposes asdefined by the water right.
Operating Range:Operating Range:Operating Range:Operating Range:Operating Range: The range in lake levelbetween the minimum control level andmaximum control level over which ahydro-electric reservoir or storage lakemay be legally operated.
River Flows: River Flows: River Flows: River Flows: River Flows: The mean rate of waterflowing down a river past a certain point
over a period of time. Expressed in cubicmetres per second (cumecs) or in litresper second.
Thermal Generation:Thermal Generation:Thermal Generation:Thermal Generation:Thermal Generation: Thermal powerstations burn gas and/or coal to producesteam in a boiler, which then turnsblades in a turbine. The blades are fixedto a shaft, which drives a generator andproduces electricity. When the steam haspassed through the turbines, it is cooledand recycled back to the boiler.
Page 85New Zealand Energy Information Handbook
14 14 14 14 14 Energy Demand & EfficiencyEnergy Demand & EfficiencyEnergy Demand & EfficiencyEnergy Demand & EfficiencyEnergy Demand & Efficiency
Introduction
Over time the concept of energy effi-ciency has moved beyond a purelytechnical consideration of the ratio ofenergy output/energy input to a broaderconcept of the benefits provided by usingenergy more efficiently. The EnergyEfficiency and Conservation Act 2000defines energy efficiency as “...a changeto energy use that results in an increasein net benefits per unit of energy”.
It’s a simple concept, but extremelydeceptive. The outcomes possible fromimproved energy efficiency can beexpressed in a variety of ways:
• Increase benefits while keepingenergy use constant.
• Keep benefits constant whiledecreasing energy use.
• Increase benefits and increase energyuse (so long as ∆benefits > ∆energyuse)
• Increase benefits and decrease energyuse.
• Decrease benefits and decreaseenergy use (so long as ∆benefits <∆energy use).1
By the definition above, all gains inenergy efficiency are good, but pursuingenergy efficiency improvements per se asa public policy goal is problematic unlessthe outcomes to be achieved are veryclear. Not only can there be co-benefits,there can also be hidden costs that arenot well understood.
The ongoing development of technologyand increasing energy prices mean that
new, more efficient technologies con-stantly become available. This meansthat there is generally a potential toimprove the efficiency with which we useenergy to support various aspects of ourlifestyles and industrial activities.Realising that potential requires thereplacement of existing technologies atthe end of their life with more efficienttechnologies. It is often also cost efficientto replace existing technologies ahead oftheir expected lifetime, or before theyhave worn out completely. Also, retrofitoptions can be available.
Potentials Potentials Potentials Potentials Potentials are typically quantified at threelevels:
Technical potential – assumes thereplacement of existing technologies withthe most efficient option currentlyavailable; replacing our existing car fleetwith hybrid cars would be an example.
Economic potential – this is a subset oftechnical potential; it assumes thereplacement of energy-using technologiesin all situations that achieve a giveneconomic return; realising the efficienciesfrom a range of upgrades in a sector orindustry with a payback of less than, say,three years is an example.
Market potential – – – – – this is a further subsetdescribing the extent of technologyreplacement likely to be achieved bymarket actions; the energy efficiencyimprovements resulting from the growing(unsubsidised) sales of heat pumps is anexample of market potential.
Realising potentials is constrained bybehavioural, technological, economic andtakeback constraints. Only recently have
1 McChesney, Smith and Baines, 2006, The Impact onHousing Energy Efficiency of Market Prices, Incentivesand Regulatory Requirements, CHRANZ.
Page 86 Energy Demand & Efficiency
the complex interaction of factors thatalter energy efficiency potentials startedto be assessed. As an example, theenergy savings potential from improve-ments in lighting efficiency will dependon the heating/cooling requirements ofthe particular building. Domesticdwellings usually require heating(particularly when lighting is simultane-ously needed) so that some the energybenefit from efficient lighting will beoffset by increased heating. In commer-cial buildings that usually requirecooling, the energy by savings fromefficient lighting will be enhanced by thereduced need for cooling.
Ensuring insulation and heating areoptimised is important if the full value ofother savings is to be realised. Con-versely lighting efficiency improvementsin large commercial buildings will providesomething like a 33% increase from grosssavings as the air conditioning systemsare typically constantly removing heatand face a reduction in operation iflighting efficiency is improved.
Developing cost effective interventionsaround the above constraints is the artand science of successful energy efficiencyadoption. The key to this is in under-standing the nature and scale of theenergy efficiency opportunities. Activitiessuch as monitoring and targeting energyuse, energy audits and energy billreconciliation are used to assess theenergy efficiency opportunity. For informa-tion on these, see www.ema.org.nz
Takeback/Rebound
There are real limitations to potentials.Typically new energy technologies provideboth service or productivity improvementsas well as energy savings. Users of thosetechnologies will vary the balance
between savings and service improve-ments according to their needs and thedegree to which they benefit from eitheroutcome. A good example of this takebackeffect occurs when a home is insulated;typically about two-thirds of the potentialsavings will not be taken as energysavings, but as an increase in deliveredheat. This is not a loss of efficiency –rather it’s a valuable outcome as theimproved comfort addresses an unsatis-fied need and may deliver more valuableoutcomes in terms of health and welfare.
Rebound occurs when money saved fromenergy savings, or for that matter anytype of savings, is spent on a newactivity, which in turn requires newongoing expenditure.
Energy efficiency is perhaps straightforward at a micro-economic level – itstypically a direct function of the thermo-dynamics of the technology and can beexplained by an engineering analysis oftechnology energy using characteristics.
At a sectoral or macro-economic level,energy efficiency is less easy to quantify.It is not energy intensity, and physicalindices usually do not adequately explainthe wealth effect of energy efficiency. Ingeneral, one must factor out economicgrowth, structural changes and externalfactors such as weather change.
In short, energy efficiency is a complexand wide-ranging subject. A comprehen-sive portrayal goes well beyond the scopeof this Handbook. As such, the followingdata serves to illustrate energy demandand efficiency concepts, rather thanattempting to proscribe what is or is notenergy efficient.
Transport
This is an important sector for New
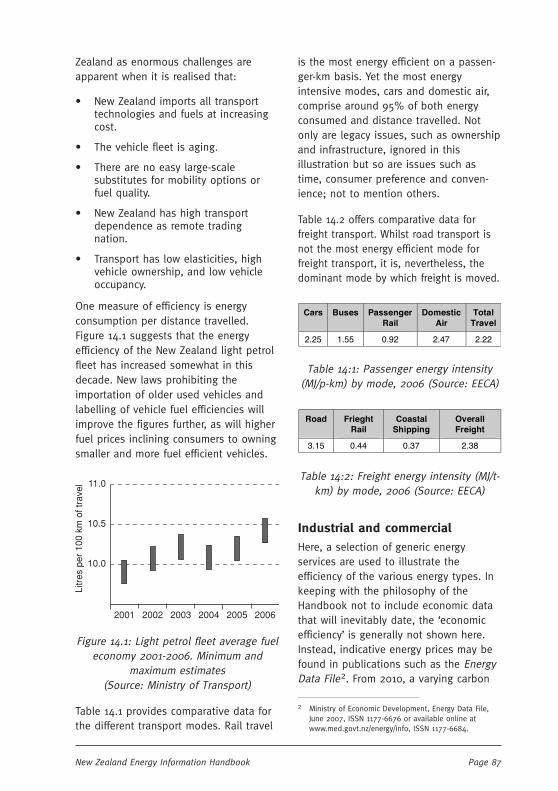
Page 87New Zealand Energy Information Handbook
Zealand as enormous challenges areapparent when it is realised that:
• New Zealand imports all transporttechnologies and fuels at increasingcost.
• The vehicle fleet is aging.
• There are no easy large-scalesubstitutes for mobility options orfuel quality.
• New Zealand has high transportdependence as remote tradingnation.
• Transport has low elasticities, highvehicle ownership, and low vehicleoccupancy.
One measure of efficiency is energyconsumption per distance travelled.Figure 14.1 suggests that the energyefficiency of the New Zealand light petrolfleet has increased somewhat in thisdecade. New laws prohibiting theimportation of older used vehicles andlabelling of vehicle fuel efficiencies willimprove the figures further, as will higherfuel prices inclining consumers to owningsmaller and more fuel efficient vehicles.
2001 2002 2003 2004 2005 2006
11.0
10.0
10.5
Litr
es p
er 1
00 k
m o
f tra
vel
Figure 14.1: Light petrol fleet average fueleconomy 2001-2006. Minimum and
maximum estimates(Source: Ministry of Transport)
Table 14.1 provides comparative data forthe different transport modes. Rail travel
is the most energy efficient on a passen-ger-km basis. Yet the most energyintensive modes, cars and domestic air,comprise around 95% of both energyconsumed and distance travelled. Notonly are legacy issues, such as ownershipand infrastructure, ignored in thisillustration but so are issues such astime, consumer preference and conven-ience; not to mention others.
Table 14.2 offers comparative data forfreight transport. Whilst road transport isnot the most energy efficient mode forfreight transport, it is, nevertheless, thedominant mode by which freight is moved.
Cars Buses Passenger Rail
Domestic Air
Total Travel
2.25 1.55 0.92 2.47 2.22
Table 14:1: Passenger energy intensity(MJ/p-km) by mode, 2006 (Source: EECA)
Road Frieght Rail
Coastal Shipping
Overall Freight
3.15 0.44 0.37 2.38
Table 14:2: Freight energy intensity (MJ/t-km) by mode, 2006 (Source: EECA)
Industrial and commercial
Here, a selection of generic energyservices are used to illustrate theefficiency of the various energy types. Inkeeping with the philosophy of theHandbook not to include economic datathat will inevitably date, the ‘economicefficiency’ is generally not shown here.Instead, indicative energy prices may befound in publications such as the EnergyData File2. From 2010, a varying carbon
2 Ministry of Economic Development, Energy Data File,June 2007, ISSN 1177-6676 or available online atwww.med.govt.nz/energy/info, ISSN 1177-6684.
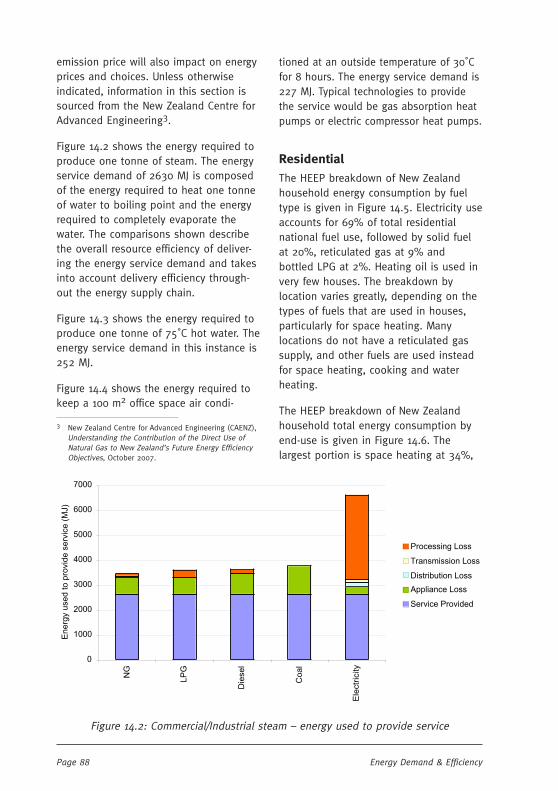
Page 88 Energy Demand & Efficiency
emission price will also impact on energyprices and choices. Unless otherwiseindicated, information in this section issourced from the New Zealand Centre forAdvanced Engineering3.
Figure 14.2 shows the energy required toproduce one tonne of steam. The energyservice demand of 2630 MJ is composedof the energy required to heat one tonneof water to boiling point and the energyrequired to completely evaporate thewater. The comparisons shown describethe overall resource efficiency of deliver-ing the energy service demand and takesinto account delivery efficiency through-out the energy supply chain.
Figure 14.3 shows the energy required toproduce one tonne of 75˚C hot water. Theenergy service demand in this instance is252 MJ.
Figure 14.4 shows the energy required tokeep a 100 m2 office space air condi-
tioned at an outside temperature of 30˚Cfor 8 hours. The energy service demand is227 MJ. Typical technologies to providethe service would be gas absorption heatpumps or electric compressor heat pumps.
Residential
The HEEP breakdown of New Zealandhousehold energy consumption by fueltype is given in Figure 14.5. Electricity useaccounts for 69% of total residentialnational fuel use, followed by solid fuelat 20%, reticulated gas at 9% andbottled LPG at 2%. Heating oil is used invery few houses. The breakdown bylocation varies greatly, depending on thetypes of fuels that are used in houses,particularly for space heating. Manylocations do not have a reticulated gassupply, and other fuels are used insteadfor space heating, cooking and waterheating.
The HEEP breakdown of New Zealandhousehold total energy consumption byend-use is given in Figure 14.6. Thelargest portion is space heating at 34%,
Figure 14.2: Commercial/Industrial steam – energy used to provide service
0
1000
2000
3000
4000
5000
6000
7000
NG
LP
G
Die
sel
Coal
Ele
ctr
icity
Energ
y u
sed to p
rovid
e s
erv
ice (
MJ)
Processing Loss
Transmission Loss
Distribution Loss
Appliance Loss
Service Provided
3 New Zealand Centre for Advanced Engineering (CAENZ),Understanding the Contribution of the Direct Use ofNatural Gas to New Zealand’s Future Energy EfficiencyObjectives, October 2007.
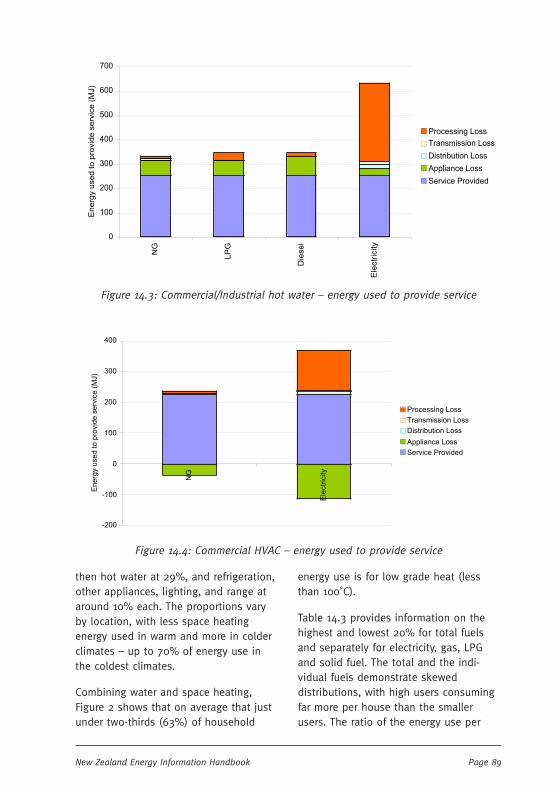
Page 89New Zealand Energy Information Handbook
Figure 14.3: Commercial/Industrial hot water – energy used to provide service
Figure 14.4: Commercial HVAC – energy used to provide service
0
100
200
300
400
500
600
700
NG
LP
G
Die
sel
Ele
ctr
icity
Energ
y u
sed to p
rovid
e s
erv
ice (
MJ)
Processing Loss
Transmission Loss
Distribution Loss
Appliance Loss
Service Provided
-200
-100
0
100
200
300
400
NG
Ele
ctr
icity
Energ
y u
sed to p
rovid
e s
erv
ice (
MJ)
Processing Loss
Transmission Loss
Distribution Loss
Appliance Loss
Service Provided
then hot water at 29%, and refrigeration,other appliances, lighting, and range ataround 10% each. The proportions varyby location, with less space heatingenergy used in warm and more in colderclimates – up to 70% of energy use inthe coldest climates.
Combining water and space heating,Figure 2 shows that on average that justunder two-thirds (63%) of household
energy use is for low grade heat (lessthan 100˚C).
Table 14.3 provides information on thehighest and lowest 20% for total fuelsand separately for electricity, gas, LPGand solid fuel. The total and the indi-vidual fuels demonstrate skeweddistributions, with high users consumingfar more per house than the smallerusers. The ratio of the energy use per
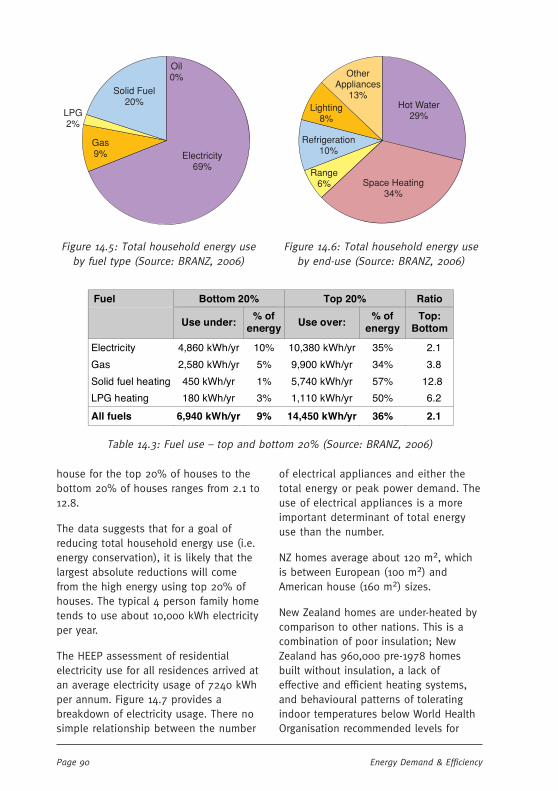
Page 90 Energy Demand & Efficiency
Electricity69%
Gas9%
LPG2%
Solid Fuel20%
Oil0%
Hot Water29%
Space Heating34%
Range6%
Refrigeration10%
Lighting8%
OtherAppliances
13%
Figure 14.5: Total household energy useby fuel type (Source: BRANZ, 2006)
Figure 14.6: Total household energy useby end-use (Source: BRANZ, 2006)
house for the top 20% of houses to thebottom 20% of houses ranges from 2.1 to12.8.
The data suggests that for a goal ofreducing total household energy use (i.e.energy conservation), it is likely that thelargest absolute reductions will comefrom the high energy using top 20% ofhouses. The typical 4 person family hometends to use about 10,000 kWh electricityper year.
The HEEP assessment of residentialelectricity use for all residences arrived atan average electricity usage of 7240 kWhper annum. Figure 14.7 provides abreakdown of electricity usage. There nosimple relationship between the number
of electrical appliances and either thetotal energy or peak power demand. Theuse of electrical appliances is a moreimportant determinant of total energyuse than the number.
NZ homes average about 120 m2, whichis between European (100 m2) andAmerican house (160 m2) sizes.
New Zealand homes are under-heated bycomparison to other nations. This is acombination of poor insulation; NewZealand has 960,000 pre-1978 homesbuilt without insulation, a lack ofeffective and efficient heating systems,and behavioural patterns of toleratingindoor temperatures below World HealthOrganisation recommended levels for
Table 14.3: Fuel use – top and bottom 20% (Source: BRANZ, 2006)
Fuel Bottom 20% Top 20% Ratio
Use under: % of
energy Use over: % of
energy Top:
Bottom
Electricity 4,860 kWh/yr 10% 10,380 kWh/yr 35% 2.1
Gas 2,580 kWh/yr 5% 9,900 kWh/yr 34% 3.8
Solid fuel heating 450 kWh/yr 1% 5,740 kWh/yr 57% 12.8
LPG heating 180 kWh/yr 3% 1,110 kWh/yr 50% 6.2
All fuels 6,940 kWh/yr 9% 14,450 kWh/yr 36% 2.1
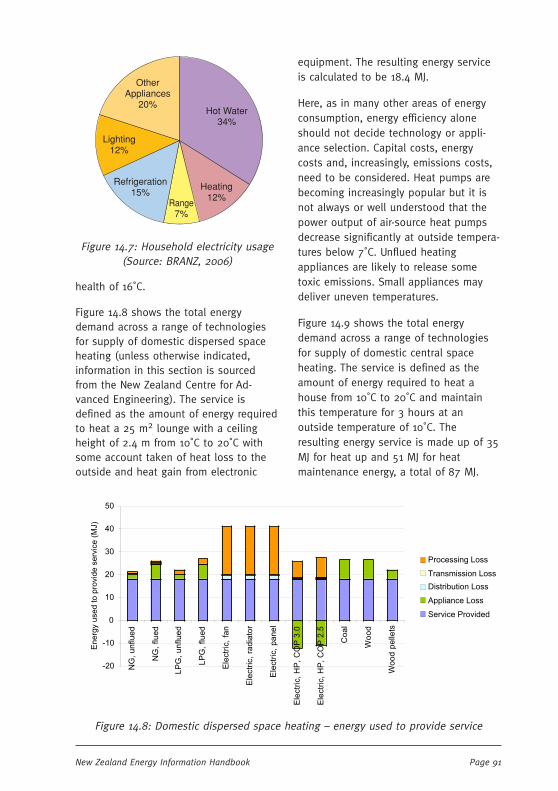
Page 91New Zealand Energy Information Handbook
health of 16˚C.
Figure 14.8 shows the total energydemand across a range of technologiesfor supply of domestic dispersed spaceheating (unless otherwise indicated,information in this section is sourcedfrom the New Zealand Centre for Ad-vanced Engineering). The service isdefined as the amount of energy requiredto heat a 25 m2 lounge with a ceilingheight of 2.4 m from 10˚C to 20˚C withsome account taken of heat loss to theoutside and heat gain from electronic
equipment. The resulting energy serviceis calculated to be 18.4 MJ.
Here, as in many other areas of energyconsumption, energy efficiency aloneshould not decide technology or appli-ance selection. Capital costs, energycosts and, increasingly, emissions costs,need to be considered. Heat pumps arebecoming increasingly popular but it isnot always or well understood that thepower output of air-source heat pumpsdecrease significantly at outside tempera-tures below 7˚C. Unflued heatingappliances are likely to release sometoxic emissions. Small appliances maydeliver uneven temperatures.
Figure 14.9 shows the total energydemand across a range of technologiesfor supply of domestic central spaceheating. The service is defined as theamount of energy required to heat ahouse from 10˚C to 20˚C and maintainthis temperature for 3 hours at anoutside temperature of 10˚C. Theresulting energy service is made up of 35MJ for heat up and 51 MJ for heatmaintenance energy, a total of 87 MJ.
Figure 14.8: Domestic dispersed space heating – energy used to provide service
-20
-10
0
10
20
30
40
50
NG
, unflued
NG
, flu
ed
LP
G,
un
flu
ed
LP
G,
flu
ed
Ele
ctr
ic,
fan
Ele
ctr
ic,
rad
iato
r
Ele
ctr
ic,
pa
ne
l
Ele
ctr
ic,
HP
, C
OP
3.0
Ele
ctr
ic,
HP
, C
OP
2.5
Co
al
Wo
od
Wo
od
pe
llets
Energ
y u
sed to p
rovid
e s
erv
ice (
MJ)
Processing Loss
Transmission Loss
Distribution Loss
Appliance Loss
Service Provided
Figure 14.7: Household electricity usage(Source: BRANZ, 2006)
Hot Water34%
Range7%
Refrigeration15%
OtherAppliances
20%
Lighting12%
Heating12%
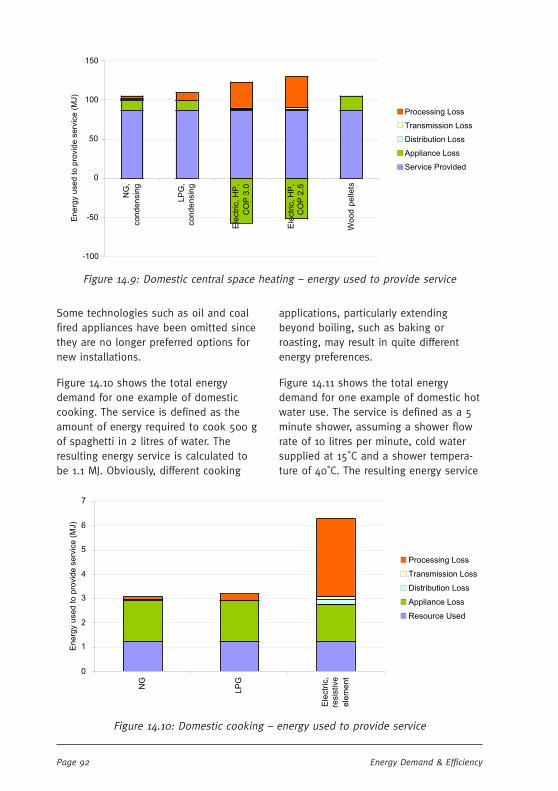
Page 92 Energy Demand & Efficiency
Figure 14.10: Domestic cooking – energy used to provide service
0
1
2
3
4
5
6
7
NG
LP
G
Ele
ctr
ic,
resis
tive
ele
me
nt
Energ
y u
sed to p
rovid
e s
erv
ice (
MJ)
Processing Loss
Transmission Loss
Distribution Loss
Appliance Loss
Resource Used
Some technologies such as oil and coalfired appliances have been omitted sincethey are no longer preferred options fornew installations.
Figure 14.10 shows the total energydemand for one example of domesticcooking. The service is defined as theamount of energy required to cook 500 gof spaghetti in 2 litres of water. Theresulting energy service is calculated tobe 1.1 MJ. Obviously, different cooking
applications, particularly extendingbeyond boiling, such as baking orroasting, may result in quite differentenergy preferences.
Figure 14.11 shows the total energydemand for one example of domestic hotwater use. The service is defined as a 5minute shower, assuming a shower flowrate of 10 litres per minute, cold watersupplied at 15˚C and a shower tempera-ture of 40˚C. The resulting energy service
Figure 14.9: Domestic central space heating – energy used to provide service
-100
-50
0
50
100
150
NG
,
co
nd
en
sin
g
LP
G,
co
nd
en
sin
g
Ele
ctr
ic,
HP
,
CO
P 3
.0
Ele
ctr
ic,
HP
,
CO
P 2
.5
Wo
od
pe
llets
Energ
y u
sed to p
rovid
e s
erv
ice (
MJ)
Processing Loss
Transmission Loss
Distribution Loss
Appliance Loss
Service Provided
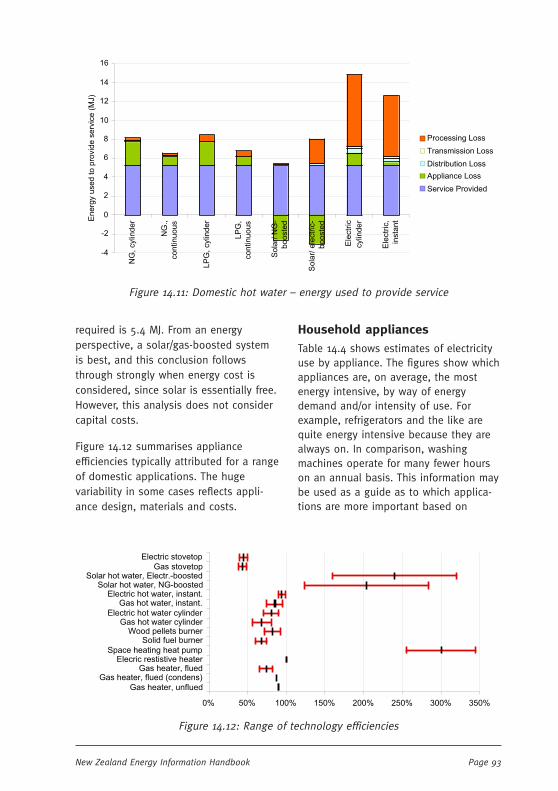
Page 93New Zealand Energy Information Handbook
required is 5.4 MJ. From an energyperspective, a solar/gas-boosted systemis best, and this conclusion followsthrough strongly when energy cost isconsidered, since solar is essentially free.However, this analysis does not considercapital costs.
Figure 14.12 summarises applianceefficiencies typically attributed for a rangeof domestic applications. The hugevariability in some cases reflects appli-ance design, materials and costs.
Household appliances
Table 14.4 shows estimates of electricityuse by appliance. The figures show whichappliances are, on average, the mostenergy intensive, by way of energydemand and/or intensity of use. Forexample, refrigerators and the like arequite energy intensive because they arealways on. In comparison, washingmachines operate for many fewer hourson an annual basis. This information maybe used as a guide as to which applica-tions are more important based on
Figure 14.11: Domestic hot water – energy used to provide service
-4
-2
0
2
4
6
8
10
12
14
16
NG
, cylin
der
NG
.,
continuous
LP
G,
cylin
de
r
LP
G,
continuous
Sola
r/ N
G-
booste
d
So
lar/
ele
ctr
ic-
booste
d
Ele
ctr
ic
cylin
de
r
Ele
ctr
ic,
insta
ntE
nerg
y u
sed to p
rovid
e s
erv
ice (
MJ)
Processing Loss
Transmission Loss
Distribution Loss
Appliance Loss
Service Provided
0% 50% 100% 150% 200% 250% 300% 350%
Gas heater, unflued
Gas heater, flued (condens)Gas heater, flued
Elecric restistive heaterSpace heating heat pump
Solid fuel burnerWood pellets burner
Gas hot water cylinderElectric hot water cylinder
Gas hot water, instant.Electric hot water, instant.
Solar hot water, NG-boostedSolar hot water, Electr.-boosted
Gas stovetop
Electric stovetop
Figure 14.12: Range of technology efficiencies

Page 94 Energy Demand & Efficiency
kWh/year Standard error
Computer/games 196 27
Dehumidifier 554 281
Dishwasher 211 28
Dryer 173 32
Elect blanket 49 9
Elect jug 157 12
Portable heater 71 64
Freezer 663 39
Fridge-Freezer 621 30
Heater 488 81
Iron 11 2
Large miscellaneous 116 57
Lighting (plug-in) 40 10
Microwave 78 5
Other climate control 289 105
Other cooking 19 6
Other entertainment 114 23
Rangehood 27 7
Refrigerator 367 62
Small miscellaneous 4 2
Spa 398 288
Toaster 20 3
TV 132 13
Vacuum cleaner 21 4
Washing machine 59 7
Table 14.4: Estimates of electricity use byappliances (Source: BRANZ)
energy efficiency considerations.
It should be noted that some modernheating devices (such as gas heaters andclothes driers) are designed to recoversome of the latent heat of condensationof water and can therefore appear tohave an abnormally high ‘efficiency’.
Heat pumps
Heat pumps are different from otherheating appliances, because heat is notgenerated from electricity or a fuel, butheat is extracted from one source(normally outside air or soil), raised intemperature level, and released whereneeded.
As heat is not actually generated fromthe energy content of a fuel, heat pumpshave apparent efficiencies in excess of100%. The performance of heat pumps isusually denoted by the coefficient ofperformance (COP). This is the ratio ofthe energy delivered as heat to theenergy input used to drive the device.
In contrast to efficiencies of combustionheating appliances or electric resistiveheating, the COP is strongly temperaturedependent. For example, as the tempera-ture difference between the outside(source) temperature and the inside(delivery) temperature decreases, the COPof a heat pump increases.
In order to compare the relativeefficiencies of different heat pump models,the Australian Minimum Energy Perform-ance Standard requires that heat pumpCOPs be compared at an outside tempera-ture of 7˚C. Such a test might give thetypical results shown in Table 14.5.
COP at Estimated Performance in
7oC (rated) Auckland Christchurch Dunedin
3.0 COP 3.2 COP 2.6 COP 2.2
3.5 COP 3.6 COP 3.0 COP 2.5
Table 14.5: Heat pump COPs atvarious locations
The figures in Table 14.5 can now bedirectly compared with the efficiency ofanother appliance.
Regional data
Tables 14.6 to 14.9, based on the HEEPresearch, provide the estimates of theannual gross energy in kWh for the fuelsand end-uses which were monitored in asignificant number of houses. These areaverages over all New Zealand houses –not the fuel use that would be found in a
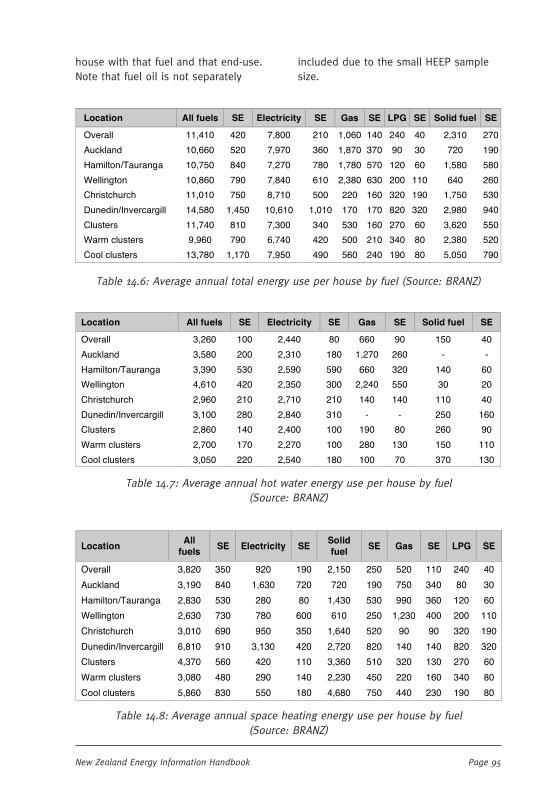
Page 95New Zealand Energy Information Handbook
house with that fuel and that end-use.Note that fuel oil is not separately
Location All fuels SE Electricity SE Gas SE LPG SE Solid fuel SE
Overall 11,410 420 7,800 210 1,060 140 240 40 2,310 270
Auckland 10,660 520 7,970 360 1,870 370 90 30 720 190
Hamilton/Tauranga 10,750 840 7,270 780 1,780 570 120 60 1,580 580
Wellington 10,860 790 7,840 610 2,380 630 200 110 640 260
Christchurch 11,010 750 8,710 500 220 160 320 190 1,750 530
Dunedin/Invercargill 14,580 1,450 10,610 1,010 170 170 820 320 2,980 940
Clusters 11,740 810 7,300 340 530 160 270 60 3,620 550
Warm clusters 9,960 790 6,740 420 500 210 340 80 2,380 520
Cool clusters 13,780 1,170 7,950 490 560 240 190 80 5,050 790
Table 14.6: Average annual total energy use per house by fuel (Source: BRANZ)
Location All fuels SE Electricity SE Gas SE Solid fuel SE
Overall 3,260 100 2,440 80 660 90 150 40
Auckland 3,580 200 2,310 180 1,270 260 - -
Hamilton/Tauranga 3,390 530 2,590 590 660 320 140 60
Wellington 4,610 420 2,350 300 2,240 550 30 20
Christchurch 2,960 210 2,710 210 140 140 110 40
Dunedin/Invercargill 3,100 280 2,840 310 - - 250 160
Clusters 2,860 140 2,400 100 190 80 260 90
Warm clusters 2,700 170 2,270 100 280 130 150 110
Cool clusters 3,050 220 2,540 180 100 70 370 130
Table 14.7: Average annual hot water energy use per house by fuel(Source: BRANZ)
Location All
fuels SE Electricity SE Solid fuel SE Gas SE LPG SE
Overall 3,820 350 920 190 2,150 250 520 110 240 40
Auckland 3,190 840 1,630 720 720 190 750 340 80 30
Hamilton/Tauranga 2,830 530 280 80 1,430 530 990 360 120 60
Wellington 2,630 730 780 600 610 250 1,230 400 200 110
Christchurch 3,010 690 950 350 1,640 520 90 90 320 190
Dunedin/Invercargill 6,810 910 3,130 420 2,720 820 140 140 820 320
Clusters 4,370 560 420 110 3,360 510 320 130 270 60
Warm clusters 3,080 480 290 140 2,230 450 220 160 340 80
Cool clusters 5,860 830 550 180 4,680 750 440 230 190 80
Table 14.8: Average annual space heating energy use per house by fuel(Source: BRANZ)
included due to the small HEEP samplesize.

Page 96 Energy Demand & Efficiency
Location All cooking SE Range SE Lighting SE Refrigeration SE
Overall 900 60 630 50 910 90 1,120 70
Auckland 1,030 100 650 90 1,460 300 1,030 160
Hamilton/Tauranga 910 210 590 190 620 110 1,100 100
Wellington 1,090 340 800 340 880 250 1,220 260
Christchurch 990 160 700 140 530 130 800 170
Dunedin/Invercargill 970 150 740 110 1,550 150 720 280
Clusters 760 70 570 70 680 90 1,260 110
Warm clusters 840 110 620 110 580 110 1,470 140
Cool clusters 620 70 430 60 800 140 1,000 110
Table 14.9: Average annual energy use per house for selected end-uses(Source: BRANZ)
Page 97New Zealand Energy Information Handbook
15 15 15 15 15 Energy StorageEnergy StorageEnergy StorageEnergy StorageEnergy Storage
Introduction
Energy storage plays a central role in allenergy systems. In electric powersystems, energy storage has twofunctions:
• to bridge a time gap between energyproduction and use; and
• to improve power quality. Energystorage is especially important ifpower sources are intermittent orproduction curves and demandcurves are offset.
Apart from conventional electrical energystorage systems, other forms of energystorage include thermal storage, chemicalstorage, and mechanical energy storage.Generally, energy storage is expensiveand all techniques are afflicted withsignificant losses.
Electrical energy storage
Electrical energy may be stored directlyas electrical charges in capacitors or inmagnetic fields in SuperconductingMagnetic Energy Storage (SMES) systems.Batteries store electrical energy aschemical charges.
Capacitors and supercapacitors
Capacitors are used for various purposesin electronic circuits. Some electronicdevices, such as cameras, use capacitorsas intermediate batteries to store energytemporarily.
Supercapacitors or ultra capacitors haveenergy densities several orders ofmagnitude higher than standard capaci-tors. They are therefore suitable forstoring significant amounts of energy. Themain advantage of supercapacitors over
batteries is their ability to store andrelease energy much faster, making themattractive for applications such asregenerative braking in automobiles.Batteries, on the other hand, have stillhigher energy densities. The position ofcapacitors versus batteries in terms ofenergy density and power density isshown in the Ragone chart in Figure 15.1.
Electrochemical storage – batteries
Batteries are the most cost effective andmost common type of energy storage forportable devices. Batteries haverelatively high charge-dischargeefficiencies and high energy densities.Ranges for specific energy and powerdensities for different battery types areshown in Figure 15.1. Lead acid batteriesare still the least-cost option for manylarge storage applications. For safetyand maintenance reasons, mobileapplications favour sealed lead acidbatteries, while valve regulated lead acidbatteries show better cost and perform-ance for stationary applications1.
Most batteries are heavy metal basedand can pose an environmental hazard.New Zealand currently has no effectivecollection and recycling system in place.
A critical advantage of capacitors overbatteries is their much longer lifetime(see Figure 15.1). While commerciallyavailable batteries last for up to 1000cycles, supercapacitors have lifetimes inthe range of one million cycles.Supercapacitors can have roundtripefficiencies of around 95% or more.
1 Ribeiro, P F, 2001. “Energy Storage Systems forAdvanced Power Applications”, Proceedings of the IEEE,98(12), pp 1744-1756.
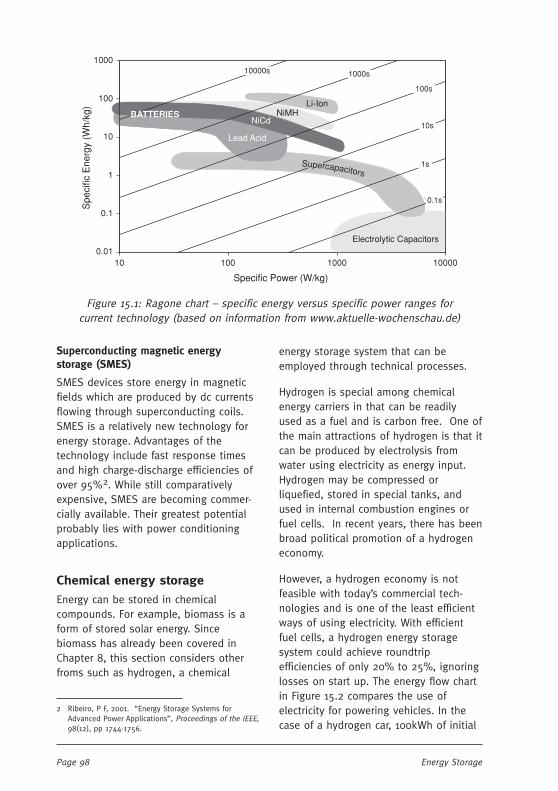
Page 98 Energy Storage
Superconducting magnetic energystorage (SMES)
SMES devices store energy in magneticfields which are produced by dc currentsflowing through superconducting coils.SMES is a relatively new technology forenergy storage. Advantages of thetechnology include fast response timesand high charge-discharge efficiencies ofover 95%2. While still comparativelyexpensive, SMES are becoming commer-cially available. Their greatest potentialprobably lies with power conditioningapplications.
Chemical energy storage
Energy can be stored in chemicalcompounds. For example, biomass is aform of stored solar energy. Sincebiomass has already been covered inChapter 8, this section considers otherfroms such as hydrogen, a chemical
energy storage system that can beemployed through technical processes.
Hydrogen is special among chemicalenergy carriers in that can be readilyused as a fuel and is carbon free. One ofthe main attractions of hydrogen is that itcan be produced by electrolysis fromwater using electricity as energy input.Hydrogen may be compressed orliquefied, stored in special tanks, andused in internal combustion engines orfuel cells. In recent years, there has beenbroad political promotion of a hydrogeneconomy.
However, a hydrogen economy is notfeasible with today’s commercial tech-nologies and is one of the least efficientways of using electricity. With efficientfuel cells, a hydrogen energy storagesystem could achieve roundtripefficiencies of only 20% to 25%, ignoringlosses on start up. The energy flow chartin Figure 15.2 compares the use ofelectricity for powering vehicles. In thecase of a hydrogen car, 100kWh of initial
Figure 15.1: Ragone chart – specific energy versus specific power ranges forcurrent technology (based on information from www.aktuelle-wochenschau.de)
1000
100
10
1
0.1
0.0110 100 1000 10000
Specific Power (W/kg)
Spe
cific
Ene
rgy
(Wh/
kg)
10000s 1000s
100s
10s
1s
0.1s
Electrolytic Capacitors
Lead Acid
NiCdNiMH
Li-IonBATTERIES
Supercapacitors
2 Ribeiro, P F, 2001. “Energy Storage Systems forAdvanced Power Applications”, Proceedings of the IEEE,98(12), pp 1744-1756.
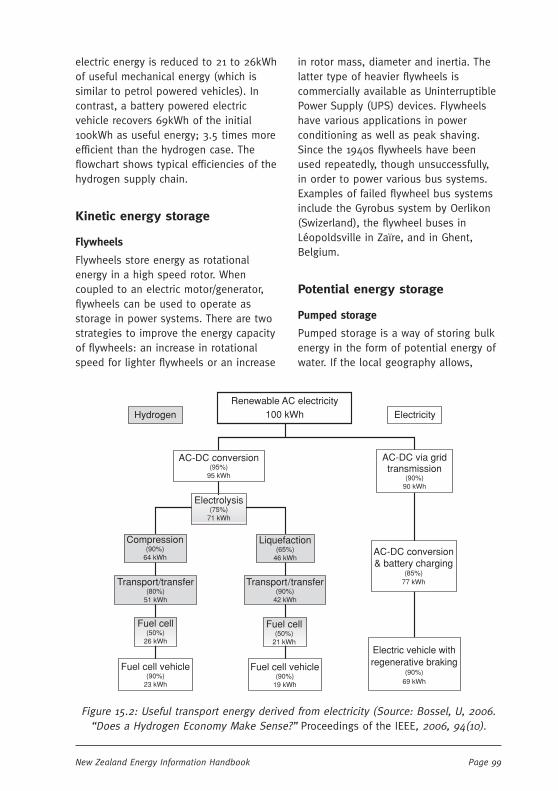
Page 99New Zealand Energy Information Handbook
electric energy is reduced to 21 to 26kWhof useful mechanical energy (which issimilar to petrol powered vehicles). Incontrast, a battery powered electricvehicle recovers 69kWh of the initial100kWh as useful energy; 3.5 times moreefficient than the hydrogen case. Theflowchart shows typical efficiencies of thehydrogen supply chain.
Kinetic energy storage
Flywheels
Flywheels store energy as rotationalenergy in a high speed rotor. Whencoupled to an electric motor/generator,flywheels can be used to operate asstorage in power systems. There are twostrategies to improve the energy capacityof flywheels: an increase in rotationalspeed for lighter flywheels or an increase
in rotor mass, diameter and inertia. Thelatter type of heavier flywheels iscommercially available as UninterruptiblePower Supply (UPS) devices. Flywheelshave various applications in powerconditioning as well as peak shaving.Since the 1940s flywheels have beenused repeatedly, though unsuccessfully,in order to power various bus systems.Examples of failed flywheel bus systemsinclude the Gyrobus system by Oerlikon(Swizerland), the flywheel buses inLéopoldsville in Zaïre, and in Ghent,Belgium.
Potential energy storage
Pumped storage
Pumped storage is a way of storing bulkenergy in the form of potential energy ofwater. If the local geography allows,
Figure 15.2: Useful transport energy derived from electricity (Source: Bossel, U, 2006.“Does a Hydrogen Economy Make Sense?” Proceedings of the IEEE, 2006, 94(10).
Renewable AC electricity100 kWhHydrogen Electricity
AC-DC conversion(95%)
95 kWh
AC-DC via gridtransmission
(90%)90 kWh
Electrolysis(75%)
71 kWh
Compression(90%)
64 kWh
Liquefaction(65%)
46 kWh
Transport/transfer(80%)
51 kWh
Transport/transfer(90%)
42 kWh
Fuel cell(50%)
26 kWh
Fuel cell(50%)
21 kWh
Fuel cell vehicle(90%)
23 kWh
Fuel cell vehicle(90%)
19 kWh
AC-DC conversion& battery charging
(85%)77 kWh
Electric vehicle withregenerative braking
(90%)69 kWh

Page 100 Energy Storage
pumped storage can be the most efficientand most cost effective way of storinglarge amounts of electric energy.Pumped storage systems use electricityto pump water from a lower to an upperreservoir, and produce electricity byreleasing water from the upper reservoirto drive a hydro turbine. Pumped storageis scaleable and can be used in systemsfrom a few kilowatts to several gigawatts.It is possible to use the same machine aspump and turbine. Often, pumpedstorage systems are part of conventionalhydroelectric plants, and, depending onreservoir sizes, offer a means of strategicstorage. Technical efficiencies are of theorder of 70% to 85%, while larger plantshave lower hydraulic resistance and arethus more efficient than smaller installa-tions. Depending on reservoir size andlocal climate, there are additional lossesthrough evaporation.
Worldwide there are about 100 majorpumped storage installations. Despite NewZealand’s high percentage of hydroelectricgeneration for the national grid, thereservoirs are relatively small. None ofNew Zealand’s large hydro electricschemes offers pumped storage. Rather,the reservoirs are effectively used as shortterm storage by discharging them in timesof high demand.
Springs
Springs are used for very small energystorage applications, such as watches.
Compressed air energy storage (CAES)
Compressing air as a form of storedenergy is an old concept but is presentlyenjoying renewed interest. There are twocategories of systems: Small systems formobile applications, where air is stored inhigh pressure bottles such as steel LPGbottles. Large systems employ under-
ground features as storage reservoirs,such as naturally occurring aquifers,depleted gas fields, solution-mined saltcaverns, or mechanically formed reser-voirs in rock formations3. Technicalefficiencies of compressing or expandingair are in the order of 75%, resulting in around trip efficiency of 55%.
Compressed air storage systems aresuitable for potential bulk energy storagefor load shifting. Whilst pumped hydrostorage, batteries and fuel cells havesome advantages, only compressed airenergy storage has the storage capacityof pumped hydro, but with lower costand less geographic restrictions4.
An interesting potential application is thelarge-scale direct air compression by windturbines for short-term bulk storage inorder to mitigate the fluctuating nature ofdirect electrical wind power.
Heat Energy Storage
Storing thermal energy can be anattractive option for thermal end uses.Heat has been traditionally stored assensible heat, for example in a thermosbottle, or as latent heat, such as in icestorage systems.
For sensible heat storage, the mostimportant characteristic of the storagemedia is its heat capacity in kJ/kg/K. Asthe most widely used medium for heatstorage, water has a high heat capacitycombined with global availability andeasy transportability. Water storage tanksare made from and insulated with a
3 Schoenung, S M and Burns, C, 1996. “Utility EnergyStorage Applications Studies”, IEEE Transactions onEnergy Conversion, 11(3), pp 658-665.
4 Bullough, C, et al., 2004. “Advanced AdiabaticCompressed Air Energy Storage for the Integration ofWind Energy”, Proceedings of the European WindEnergy Conference, EWEC, 2004, London.
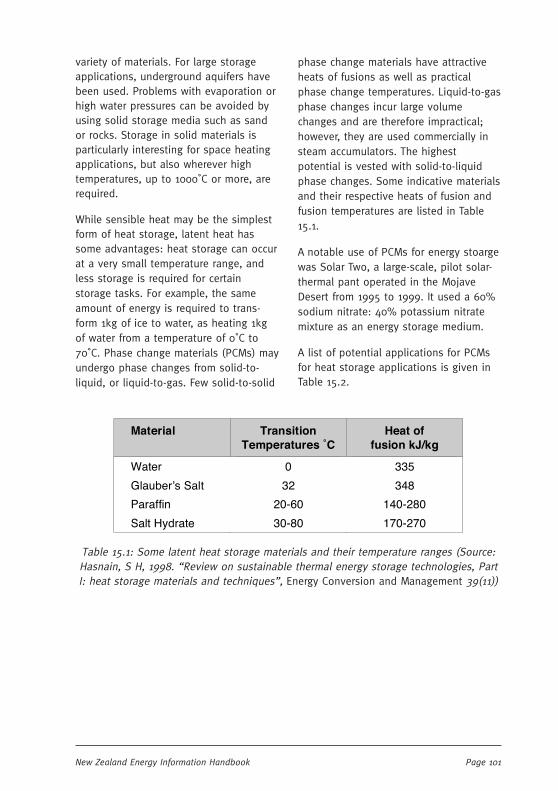
Page 101New Zealand Energy Information Handbook
variety of materials. For large storageapplications, underground aquifers havebeen used. Problems with evaporation orhigh water pressures can be avoided byusing solid storage media such as sandor rocks. Storage in solid materials isparticularly interesting for space heatingapplications, but also wherever hightemperatures, up to 1000˚C or more, arerequired.
While sensible heat may be the simplestform of heat storage, latent heat hassome advantages: heat storage can occurat a very small temperature range, andless storage is required for certainstorage tasks. For example, the sameamount of energy is required to trans-form 1kg of ice to water, as heating 1kgof water from a temperature of 0˚C to70˚C. Phase change materials (PCMs) mayundergo phase changes from solid-to-liquid, or liquid-to-gas. Few solid-to-solid
Material Transition Temperatures ˚C
Heat of fusion kJ/kg
Water 0 335
Glauber’s Salt 32 348
Paraffin 20-60 140-280
Salt Hydrate 30-80 170-270
Table 15.1: Some latent heat storage materials and their temperature ranges (Source:Hasnain, S H, 1998. “Review on sustainable thermal energy storage technologies, PartI: heat storage materials and techniques”, Energy Conversion and Management 39(11))
phase change materials have attractiveheats of fusions as well as practicalphase change temperatures. Liquid-to-gasphase changes incur large volumechanges and are therefore impractical;however, they are used commercially insteam accumulators. The highestpotential is vested with solid-to-liquidphase changes. Some indicative materialsand their respective heats of fusion andfusion temperatures are listed in Table15.1.
A notable use of PCMs for energy stoargewas Solar Two, a large-scale, pilot solar-thermal pant operated in the MojaveDesert from 1995 to 1999. It used a 60%sodium nitrate: 40% potassium nitratemixture as an energy storage medium.
A list of potential applications for PCMsfor heat storage applications is given inTable 15.2.

Page 102 Energy Storage
Table 15.2: Potential implementations of thermal storage by phase change materials(PCMs) (Source: Hasnain, S H, 1998. “Review on sustainable thermal energy storagetechnologies, Part I: heat storage materials and techniques”, Energy Conversion and
Management 39(11))
Mode of implementation PCMs technology
Load Target Objective Sector
Distributed PCM storage in gypsum boards
Space heating and air conditioning
Load shifting and conservation
All
Electrical heating units with PCM storage
Space heating Load shifting and conservation
Residential, commercial and institutional
Heat and cold PCM storage in air ducts
Space heating and air conditioning
Load shifting Commercial, institutional and industrial
PCM air preheaters for heat pumps
Space heating Load shifting and conservation
Residential, commercial and institutional
Curtain walls with PCM system
Space heating Conservation Commercial, institutional and industrial
Water heater with PCM storage
Water heating Load shifting Residential, commercial and institutional

Page 103New Zealand Energy Information Handbook
16 16 16 16 16 General Physical Conversion FactorsGeneral Physical Conversion FactorsGeneral Physical Conversion FactorsGeneral Physical Conversion FactorsGeneral Physical Conversion Factors
SI units of measurement
As with the conversion factors presentedin Section 2, the emphasis here is onhighlighting SI units in each case.
Tables of physical conversion factors aregiven for temperature (Table 16.1), length(Table 16.2), area (Table 16.3), volume(Table 16.4), mass (Table 16.5), pressure(Table 16.6), velocity (Table 16.7),flowrate (volumetric) (Table 16.8) anddensity (Table 16.9), and liquid specificgravity (Tables 16.10 and 16.11).
Temperature
The various units used in the measure-ment of temperature are defined asfollows:
• Celsius (also known as Centigrade), ascale on which the freezing point ofwater is 0 degrees, and the boilingpoint of water 100 degrees (at normalatmospheric pressure).
• Fahrenheit, a scale on which thefreezing point of water is 32 degreesand the boiling point of water is 212degrees (at normal atmosphericpressure).
• Kelvin is the absolute scale (and theInternational Standard [SI] measure oftemperature), whereby absolute zeroat -273.15°C is equal to 0K (note thatno degree symbol is used in SInotation). One Kelvin is the sametemperature increment as one degreeCelsius (so 273.15 K = 0°C).
• Rankine is the absolute Fahrenheitscale, whereby absolute zero at-459.69°F is equal to 0°R.
The general conversion factor is that 1.8Rankine or Fahrenheit degrees = 1 degreeCelsius or 1 K.
Mass/volume interrelationships
Because liquid fuels are sometimesmeasured by weight and sometimes byvolume, it is often necessary to translatedata from one basis to the other.Interrelationships of mass and volumeare determined precisely by specificgravity. Within the metric system,conversions can be made by multiplyingvolume by specific gravity, or by dividingmass by specific gravity.
Specific GravitySpecific GravitySpecific GravitySpecific GravitySpecific Gravity is the ratio of the mass ofa body to the mass of an equal volume ofwater at some specified temperature. Forgases, the specific gravity is often takenas the ratio of the mass of a quantity ofgas at a specified temperature andpressure to the mass of the samevolume of air at the same temperatureand pressure.
Since volumes change with changingtemperature and pressure, data onspecific gravity are usually accompaniedby reference to the temperature andpressure at which the relationship ismeasured. In the case of petroleum andits products, the relationship is usuallymeasured at 15° Celsius (59˚F) or 60°Fahrenheit (15.6°C) and at standardatmospheric pressure. Specific gravity isoften quoted as a percentage. Thus astated specific gravity of 85 means anactual specific gravity of 0.85.
API (American Petroleum Institute) Gravityis commonly used overseas for petroleumproducts and is precisely related to
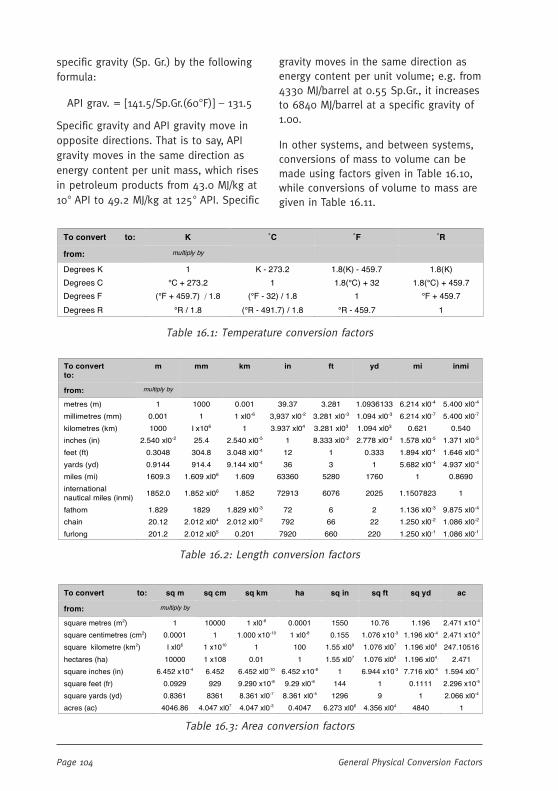
Page 104 General Physical Conversion Factors
specific gravity (Sp. Gr.) by the followingformula:
API grav. = [141.5/Sp.Gr.(60°F)] – 131.5
Specific gravity and API gravity move inopposite directions. That is to say, APIgravity moves in the same direction asenergy content per unit mass, which risesin petroleum products from 43.0 MJ/kg at10° API to 49.2 MJ/kg at 125° API. Specific
gravity moves in the same direction asenergy content per unit volume; e.g. from4330 MJ/barrel at 0.55 Sp.Gr., it increasesto 6840 MJ/barrel at a specific gravity of1.00.
In other systems, and between systems,conversions of mass to volume can bemade using factors given in Table 16.10,while conversions of volume to mass aregiven in Table 16.11.
To convert to: K ˚C ˚F ˚R
from: multiply by
Degrees K 1 K - 273.2 1.8(K) - 459.7 1.8(K)
Degrees C °C + 273.2 1 1.8(°C) + 32 1.8(°C) + 459.7
Degrees F (°F + 459.7) / 1.8 (°F - 32) / 1.8 1 °F + 459.7
Degrees R °R / 1.8 (°R - 491.7) / 1.8 °R - 459.7 1
Table 16.1: Temperature conversion factors
To convert to:
m mm km in ft yd mi inmi
from: multiply by
metres (m) 1 1000 0.001 39.37 3.281 1.0936133 6.214 xl0-4 5.400 xl0-4
millimetres (mm) 0.001 1 1 xl0-6 3,937 xl0-2 3.281 xl0-3 1.094 xl0-3 6.214 xl0-7 5.400 xl0-7
kilometres (km) 1000 I x106 1 3.937 xl04 3.281 xl03 1.094 xl03 0.621 0.540
inches (in) 2.540 xl0-2 25.4 2.540 xl0-5 1 8.333 xl0-2 2.778 xl0-2 1.578 xl0-5 1.371 xl0-5
feet (ft) 0.3048 304.8 3.048 xl0-4 12 1 0.333 1.894 xl0-4 1.646 xl0-4
yards (yd) 0.9144 914.4 9.144 xl0-4 36 3 1 5.682 xl0-4 4.937 xl0-4
miles (mi) 1609.3 1.609 xl06 1.609 63360 5280 1760 1 0.8690
international nautical miles (inmi)
1852.0 1.852 xl06 1.852 72913 6076 2025 1.1507823 1
fathom 1.829 1829 1.829 xl0-3 72 6 2 1.136 xl0-3 9.875 xl0-4
chain 20.12 2.012 xl04 2.012 xl0-2 792 66 22 1.250 xl0-2 1.086 xl0-2
furlong 201.2 2.012 xl05 0.201 7920 660 220 1.250 xl0-1 1.086 xl0-1
Table 16.2: Length conversion factors
To convert to: sq m sq cm sq km ha sq in sq ft sq yd ac
from: multiply by
square metres (m2) 1 10000 1 xl0-6 0.0001 1550 10.76 1.196 2.471 x10⁻⁴
square centimetres (cm2) 0.0001 1 1.000 x10⁻¹⁰ 1 xl0-8 0.155 1.076 x10⁻³ 1.196 xl0-4 2.471 x10⁻⁸
square kilometre (km2) I xl06 1 x10¹⁰ 1 100 1.55 xl09 1.076 xl07 1.196 xl06 247.10516
hectares (ha) 10000 1 x10⁸ 0.01 1 1.55 xl07 1.076 xl05 1.196 xl04 2.471
square inches (in) 6.452 x10⁻⁴ 6.452 6.452 xl0-10 6.452 x10⁻⁸ 1 6.944 x10⁻³ 7.716 xl0-4 1.594 xl0-7
square feet (fr) 0.0929 929 9.290 x10⁻⁸ 9.29 xl0-6 144 1 0.1111 2.296 x10⁻⁵
square yards (yd) 0.8361 8361 8.361 xl0-7 8.361 xl0-5 1296 9 1 2.066 xl0-4
acres (ac) 4046.86 4.047 xl07 4.047 xl0-3 0.4047 6.273 xl06 4.356 xl04 4840 1
Table 16.3: Area conversion factors

Page 105New Zealand Energy Information Handbook
To convert to: m3 cc l in3 ft3 yd3 US gal IMP gal Bbl (oil)
from: multiply by
cubic metres (m )
1 1 x10⁶ 1000 61020 35.31 1.308 264.2 220 6.290
cubic centimetres (cc)
1 x10⁻⁶ 1 0.001 6.102 x10⁻² 3.531 x10⁻⁵ 1.308 x10⁻⁶ 2.642 x10⁻⁴ 2.2 xl0-4 6.290 x10⁻⁶
lires (l) 0.001 1000 1 61.019886 0.0353147 1.308 x10⁻³ 0.2641722 0:2199692 6.290 x10⁻³
cubic inches (in) 1.639 x10⁻⁵ 16.388 0.0164 1 5.787 x10⁻⁴ 2.143X10⁻⁵ 4.329 x10⁻³ 3.605 x10⁻³ 1.031 x10⁻⁴
cubic feet (ft3) 2.832 x10⁻² 28317 28.32 1728 1 3.704 x10⁻² 7.481 6.229 0.1781
cubic yard (yd ) 0.765 7.646 x10⁵ 765 46656 27 1 201.97 168.18 4.809
US gallons (USgal)
3.785 x10⁻³ 3785 3.785 231 0.1337 4.951 x10⁻³ 1 0.833 2.381 x10⁻²
Imperial gallons (Impgal)
4.546 xl0-3 4546 4.546 277.4 0.161 5.945 x10⁻³ 1.20 1 2.859 x10⁻²
barrels (bbl) 0.159 1.590 x10⁵ 159 9701 5.615 2.079 x10⁻¹ 42 35 1
Table 16.4: Volume conversion factors
To convert to: kg g t oz lb cwt st ltv
from: multiply by
kilogram (kg) 1 1000 1 xl0-3 35.27 2.205 1.968 xl0-2 1.102 xl0-3 9.842 xl0-4
grams(g) 0.001 1 1 xl0-6 3.527 xl0-2 2.205 xl0-3 1.968 xl0-5 1.102 xl0-6 9.842 xl0-7
tonne (metric ton) (t) 1000 1 x10⁶ 1 35274 2205 20 1.102 0.984
once (oz) 2.835 xl0-2 28.35 2.835 xl0-5 1 0.0625 5.580 xl0-4 3.125 xl0-5 2.79 x10⁻⁵
pound (Ib) 0.4536 453.6 4.536 xl0-4 16 1 8.929 xl0-3 5 xl0-4 4.464 xl0-4
hundredweight (cwt) 50.80 5.080 xl04 5.080 xl0-2 1792 112 1 0.056 0.05
short ton (st) 907.2 9.072 xl05 0.907 32000 2000 17.86 1 0.893
long ton (It) 1016 1.016 xl06 1.016 35840 2240 20 1.12 1
Table 16.5: Mass conversion factors
To convert to: Pa kPa bar mb atm mmHg inHg psi ftH2O
from: multiply by
pascals1 (Pa) 1 0.001 1 xl0-5 0.01 9.869 xl0-6
7.501 x10⁻³ 2.953 xl0-4
1.450 xl0-4 3.346 xl0-4
kilopascals (kPa)
1000 1 0.01 10 9.869 xl0-3 7.50 0.295 0.145 0.335
bar 1x10⁻⁵ 100 1 1000 0.987 750 29.53 14.50 33.46
millibar (mb) 100 0.1 0.001 1 9.869 xl0-4 0.750 1953 xl0-2
1.450 xl0-2 3.346 xl0-2
atmospheres (atm) 1.013 xl05 101.325 1.01325 1013.25 1 760 29.92 14.70 33.90
mm of Mercury2
(mmHg(°C)) 133.32 0.133322 1.333 xl0-3
1.33322 1.316 xl0-3 1 3.937 xl0-2
1.934 xl0-2 4.460 xl0-2
inches of Mercury (inHg(˚C))
3386.4 3.386 3.386 xl0-2 33.8639 3.342 xl0-2
25.4 1 0.491 1.133
pounds per square inch (psi)
6894.8 6.895 6.895 xl0-2 68.95 6.805 xl0-2
51.715 2.036 1 2.307
feet of water @ 60°F (ftH2O)
2989 2.989 2.989 xl0-2 29.89 2.950 xl0-2
22.4 0.883 0.434 1
(1) Sometimes referred to explicitly as Newtons per square metre (N/m2); (2) Sometimes referred to as Torr
Table 16.6: Pressure conversion factors
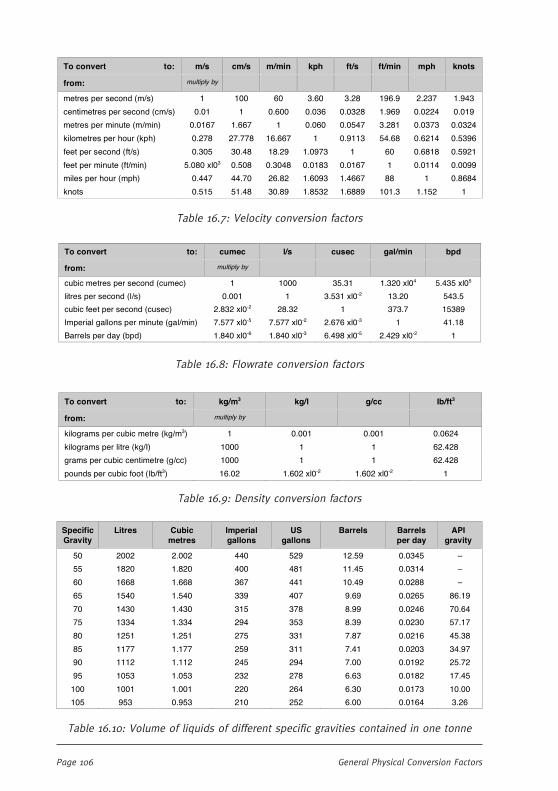
Page 106 General Physical Conversion Factors
To convert to: m/s cm/s m/min kph ft/s ft/min mph knots
from: multiply by
metres per second (m/s) 1 100 60 3.60 3.28 196.9 2.237 1.943
centimetres per second (cm/s) 0.01 1 0.600 0.036 0.0328 1.969 0.0224 0.019
metres per minute (m/min) 0.0167 1.667 1 0.060 0.0547 3.281 0.0373 0.0324
kilometres per hour (kph) 0.278 27.778 16.667 1 0.9113 54.68 0.6214 0.5396
feet per second (ft/s) 0.305 30.48 18.29 1.0973 1 60 0.6818 0.5921
feet per minute (ft/min) 5.080 xl03 0.508 0.3048 0.0183 0.0167 1 0.0114 0.0099
miles per hour (mph) 0.447 44.70 26.82 1.6093 1.4667 88 1 0.8684
knots 0.515 51.48 30.89 1.8532 1.6889 101.3 1.152 1
Table 16.7: Velocity conversion factors
To convert to: cumec l/s cusec gal/min bpd
from: multiply by
cubic metres per second (cumec) 1 1000 35.31 1.320 xl04 5.435 xl05
litres per second (l/s) 0.001 1 3.531 xl0-2 13.20 543.5
cubic feet per second (cusec) 2.832 xl0-2 28.32 1 373.7 15389
Imperial gallons per minute (gal/min) 7.577 xl0-5 7.577 xl0-2 2.676 xl0-3 1 41.18
Barrels per day (bpd) 1.840 xl0-6 1.840 xl0-3 6.498 xl0-5 2.429 xl0-2 1
Table 16.8: Flowrate conversion factors
To convert to: kg/m3 kg/l g/cc Ib/ft3
from: multiply by
kilograms per cubic metre (kg/m3) 1 0.001 0.001 0.0624
kilograms per litre (kg/I) 1000 1 1 62.428
grams per cubic centimetre (g/cc) 1000 1 1 62.428
pounds per cubic foot (Ib/ft3) 16.02 1.602 xl0-2 1.602 xl0-2 1
Table 16.9: Density conversion factors
Specific Gravity
Litres Cubic metres
Imperial gallons
US gallons
Barrels Barrels per day
API gravity
50 2002 2.002 440 529 12.59 0.0345 –
55 1820 1.820 400 481 11.45 0.0314 –
60 1668 1.668 367 441 10.49 0.0288 –
65 1540 1.540 339 407 9.69 0.0265 86.19
70 1430 1.430 315 378 8.99 0.0246 70.64
75 1334 1.334 294 353 8.39 0.0230 57.17
80 1251 1.251 275 331 7.87 0.0216 45.38
85 1177 1.177 259 311 7.41 0.0203 34.97
90 1112 1.112 245 294 7.00 0.0192 25.72
95 1053 1.053 232 278 6.63 0.0182 17.45
100 1001 1.001 220 264 6.30 0.0173 10.00
105 953 0.953 210 252 6.00 0.0164 3.26
Table 16.10: Volume of liquids of different specific gravities contained in one tonne
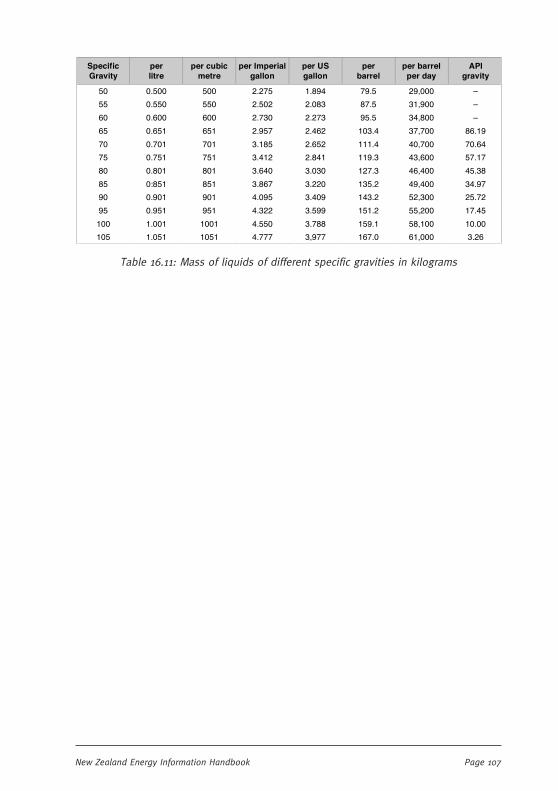
Page 107New Zealand Energy Information Handbook
Specific Gravity
per litre
per cubic metre
per Imperial gallon
per US gallon
per barrel
per barrel per day
API gravity
50 0.500 500 2.275 1.894 79.5 29,000 –
55 0.550 550 2.502 2.083 87.5 31,900 –
60 0.600 600 2.730 2.273 95.5 34,800 –
65 0.651 651 2.957 2.462 103.4 37,700 86.19
70 0.701 701 3.185 2.652 111.4 40,700 70.64
75 0.751 751 3.412 2.841 119.3 43,600 57.17
80 0.801 801 3.640 3.030 127.3 46,400 45.38
85 0:851 851 3.867 3.220 135.2 49,400 34.97
90 0.901 901 4.095 3.409 143.2 52,300 25.72
95 0.951 951 4.322 3.599 151.2 55,200 17.45
100 1.001 1001 4.550 3.788 159.1 58,100 10.00
105 1.051 1051 4.777 3,977 167.0 61,000 3.26
Table 16.11: Mass of liquids of different specific gravities in kilograms

Page 108 General Physical Conversion Factors

Page 109New Zealand Energy Information Handbook
References & Data SourcesReferences & Data SourcesReferences & Data SourcesReferences & Data SourcesReferences & Data Sources
References for specific data sources arelisted in each chapter as they occur. Thissection lists general sources consulted inproducing this publication, which can beused by those seeking additional informa-tion not covered in this document.
Since the publication of the secondedition in 1993, there has been anexplosive growth in web-based informa-tion sources. While this makes access todata easy, readers should be aware thatthe quality of the information on offervaries enormously. Sites such asWikipedia (www.wikipedia.org) are anexcellent starting point, but pages shouldbe checked for independent sources and,if necessary, confirmed at other sites.
Web addresses given in this section canbe considered authoritative, but noguarantee can be given as to theaccuracy of information obtained fromthe sites listed.
Note that, as with all web links, ad-dresses may change over time. All linkswere active as of March 2008.
Chapter 2: Units and Energy ConversionFactors
Data reproduced from:
– Baines, J T (ed.), 1993. New ZealandEnergy Information Handbook(Second Edition), Taylor Baines andAssociates, Christchurch;
supplemented by data from:
– the Bureau International Poids etMesures (www.bipm.org[English version] ) and
– the International Energy Agency(www.iea.org).
Chapter 3: Coal
Data obtained from:
– the Coal Association of New Zealand(www.coalassociation.org);
– Solid Energy (www.coalnz.com);
– Crown Minerals, Ministry of EconomicDevelopment(www.crownminerals.govt.nz);
– ASTM (www.astm.org); and
– Ministry for the Environment(www.mfe.govt.nz).
Chapter 4: Natural Gas
Data obtained from:
– the Ministry of Economic Develop-ment (www.med.govt.nz);
– Vector Ltd. (www.vector.co.nz);
– the Gas Association of New Zealand(www.ganz.org.nz); and
– Standards New Zealand(www.standards.co.nz).
Chapter 5: Petroleum
Data obtained from:
– the Ministry of Economic Develop-ment [Energy Greenhouse GasEmissions 2005] (www.med.govt.nz);
– New Zealand Refining Company(www.nzrc.co.nz);
– Guyol, NB (1977), Energy Interrela-tionships - a Handbook of Tables andConversion Factors for Combining andComparing International Energy Data,US Federal Energy Administration,Washington; and
– Glasstone, S (1982), EnergyDeskbook, US Department of Energy,Oak Ridge.
Page 110 References and Data Sources
Chapter 6: Geothermal
Data obtained from:
– White, B (2006), An Assessment ofGeothermal Direct Heat Use in NewZealand. (www.nzgeothermal.zorg.nz/publications/Reports/NZGADirectHeatAssessmentReport_2006.pdf );
– Lawless J V and Lovelock B G, 2001.“New Zealand’s geothermal resourcebase”, 6th Annual Seminar, NewZealand Geothermal Association,Taupo;
– NZGA 1 (no date) New ZealandGeothermal Association: DevelopmentPotential, on NZGA website:www.nzgeothermal.org.nz/geothermal_energygeothermal_development.asp);
– NZGA 2 (no date), New ZealandGeothermal Association: Emissions,on NZGA website:www.nzgeothermal.org.nz/environ-mental/emissions.asp; and
– the New Zealand Geothermal Associa-tion Inc (www.nzgeothermal.org.nz).
Chapter 7: Wood
Data obtained from:
– Tillman, D (1980), “Review ofmechanisms associated with woodcombustion”, Wood Science 13(4);
– Miller, W and Young, G (1989), “Woodproperties of firewood”, FRI Bulletin137, Rotorua;
– Energy Data File (2007), Ministry ofEconomic Development(www.med.govt.nz);
– Solid Energy (www.solidenergy.co.nz)
Chapter 8: Energy from Waste
Data obtained from:
– Ministry of Agriculture and Forestry(www.maf.govt.nz); and
– International Solid Waste Association(www.iswa.org).
Chapter 9: Solar
Data obtained from:
– Baines, JT and Smith, DJ (1982),Environmental Energy Flows in theNew Zealand Economic System,Centre for Resource Management,Lincoln University;
– NIWA (www.niwa.cri.nz); and
– the Sustainable Electricity Associationof New Zealand (www.seanz.org.nz).
Chapter 10: Wind
Data obtained from:
– Transpower (www.transpower.co.nz);
– NIWA (www.niwa.cri.nz); and
– the NZ Wind Energy Association(www.windenergy.org.nz).
Chapter 11: Oceans
Data obtained from:
– EECA (www.eeca.govt.nz); and
– NIWA (www.niwa.cri.nz).
Chapter 12: Emerging Forms of Energy
Data obtained from:
– Wickramanayake, WP (1981), DieselSubstitutes – Alternative Fuels for aDiesel Engine, ME Thesis, CAPE,University of Canterbury;
– Sims, R et al (no date), Tallow,Rapeseed Oil and their Esters asDiesel Fuel Extenders, ResearchPublication 2, Massey UniversityAgricultural Research Foundation;
– Pecher, IA and Henrys, SA (2003),Potential gas reserves in Gas HydrateSweet Spots on the Hikurangi Margin,New Zealand, Institute of Geological& Nuclear Sciences;

Page 111New Zealand Energy Information Handbook
– EECA (www.eeca.govt.nz); and
– Ministry of Economic Development(www.med.govt.nz).
Chapter 13: Electricity
Data obtained from:
– Transpower (www.transpower.co.nz);
– Energy Data File (2007), Ministry ofEconomic Development(www.med.govt.nz);
– Department of Electrical and Compu-ter Engineering, University ofCanterbury(www.elec.canterbury.ac.nz);
– the New Zealand Wind EnergyAssociation (www.windenergy.org.nz);and
– CAENZ (www.caenz.com).
Chapter 14: Energy Demand and Efficiency
Data obtained from:
– Isaacs NP, Camilleri M, French L,Pollard A, Saville-Smith K, Fraser R,Rossouw P and Jowett JH, 2006.Energy Use in New Zealand House-holds: Report on the Year 10 Analysisfor the Household Energy End-useProject (HEEP). BRANZ Ltd.,Judgeford, Porirua (Study Report 155 -available from www.branz.co.nz);
– Ministry of Economic Development(www.med.govt.nz);
– EECA (www.eec a.govt.nz);
– Ministry of Transport(www.transport.govt.nz); and
– CAENZ (www.caenz.com).
Chapter 15: Storage
Data obtained from:
– Electricity Storage Association(www.energystorage.org);
– Energy Storage Systems, SandiaNational Laboratories(www.sandia.gov/ess/index.html); and
– CAENZ (www.caenz.com).
Chapter 16: General Physical ConversionFactors
Data reproduced from:
– Baines, J T (ed.), 1993. New ZealandEnergy Information Handbook(Second Edition), Taylor Baines andAssociates, Christchurch;
checked by reference to:
– the National Institute of Standardsand Technology website (http://physics.nist.gov) and
– Wikipedia (http://en.wikipedia.org/wiki/Conversion_of_units).
General ReferenceThe following list is of organisations (bothNew Zealand and international) withenergy information data available on theirwebsites. This list is by no meansexhaustive, rather a starting point forthose readers seeking further information.Site access was confirmed March 2008.
New ZealandNew ZealandNew ZealandNew ZealandNew Zealand
Bioenergy Association of New Zealandwww.bioenergy.org.nz
Crown Minerals (MED)www.crownminerals.govt.nz
Electricity Commissionwww.electricitycommission.govt.nz
Energy Efficiency & ConservationAuthority (EECA)www.eeca.govt.nz
Energy Federation of New Zealandwww.energyfed.org.nz
Energy Librarywww.energylibrary.co.nz
Page 112 References and Data Sources
National Energy Research Institutewww.neri.org.nz
National Institute of Water & AtmosphericResearch (NIWA)www.niwa.cri.nz
New Zealand Centre for AdvancedEngineeringwww.caenz.com
New Zealand Climate Change Officewww.climatechange.govt.nz
New Zealand Ministry of Agriculture andForestrywww.maf.govt.nz
New Zealand Ministry of EconomicDevelopmentwww.med.govt.nz
New Zealand Ministry for the Environmentwww.mfe.govt.nz
New Zealand Photovoltaic Associationwww.photovoltaics.org.nz
New Zealand Wind Energy Associationwww.windenergy.org.nz
InternationalInternationalInternationalInternationalInternational
Department of Energy (US)www.energy.gov
Energy Efficiency & Renewable EnergyNetwork (US)www.eere.energy.gov
EPRI Energy Searchwww.energysearch.com
Global Energy Marketplace (GEM)www.crest.org/gem.html
International Energy Agency (IEA)www.iea.org
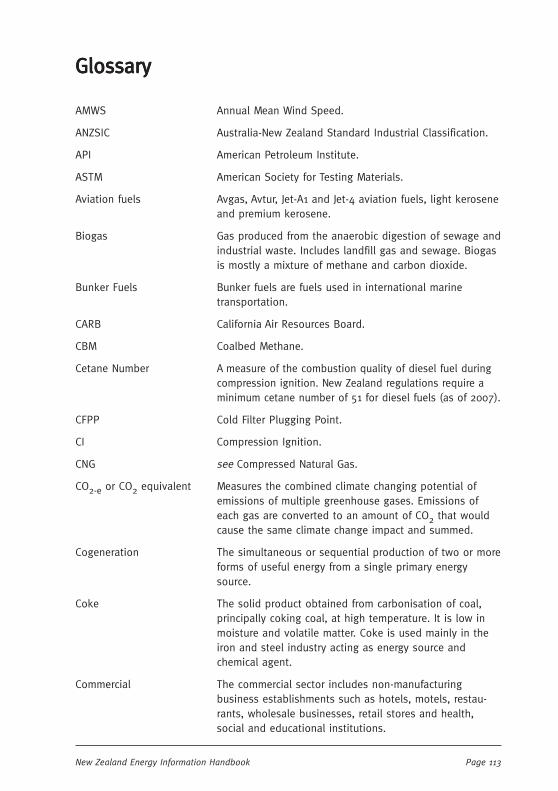
Page 113New Zealand Energy Information Handbook
GlossaryGlossaryGlossaryGlossaryGlossary
AMWS Annual Mean Wind Speed.
ANZSIC Australia-New Zealand Standard Industrial Classification.
API American Petroleum Institute.
ASTM American Society for Testing Materials.
Aviation fuels Avgas, Avtur, Jet-A1 and Jet-4 aviation fuels, light keroseneand premium kerosene.
Biogas Gas produced from the anaerobic digestion of sewage andindustrial waste. Includes landfill gas and sewage. Biogasis mostly a mixture of methane and carbon dioxide.
Bunker Fuels Bunker fuels are fuels used in international marinetransportation.
CARB California Air Resources Board.
CBM Coalbed Methane.
Cetane Number A measure of the combustion quality of diesel fuel duringcompression ignition. New Zealand regulations require aminimum cetane number of 51 for diesel fuels (as of 2007).
CFPP Cold Filter Plugging Point.
CI Compression Ignition.
CNG see Compressed Natural Gas.
CO2-e or CO2 equivalent Measures the combined climate changing potential ofemissions of multiple greenhouse gases. Emissions ofeach gas are converted to an amount of CO2 that wouldcause the same climate change impact and summed.
Cogeneration The simultaneous or sequential production of two or moreforms of useful energy from a single primary energysource.
Coke The solid product obtained from carbonisation of coal,principally coking coal, at high temperature. It is low inmoisture and volatile matter. Coke is used mainly in theiron and steel industry acting as energy source andchemical agent.
Commercial The commercial sector includes non-manufacturingbusiness establishments such as hotels, motels, restau-rants, wholesale businesses, retail stores and health,social and educational institutions.

Page 114 Glossary
Compressed Natural Gas (CNG) Natural gas which has been compressed, orcontained under pressure, in a small volume. Mainly usedas a transport fuel.
Condensate A light crude oil which is present in natural gas deposits.
Consumer energy The amount of energy consumed by final users. Itexcludes energy used or lost in the process of transform-ing energy into other forms and in bringing the energy tothe final consumers.
COP Coefficient of Performance.
Crude oil A mineral oil consisting of a mixture of hydrocarbons ofnatural origins, yellow to black in colour, of variabledensity and viscosity.
CTL Coal to Liquids.
DC Direct Current.
Diesel Automotive gas oil, marine diesel and blended heating oil.
Emission Factor A unique value for scaling emissions to activity data interms of a standard rate of emissions per unit of activity(e.g. grams of carbon dioxide emitted per barrel of fossilfuel consumed). It is used to calculate the amount ofgreenhouse gas emitted – the product of the emissionsfactor and the amount of energy used.
Energy balances The ratio of total useful output to energy input.
Feedstock This is raw material directly used in production.
Fossil fuels Coal, natural gas, LPG, crude oil and fuels derived fromcrude oil (including petrol and diesel). They are calledfossil fuels because they have been formed over longperiods of time from ancient organic matter.
Fractionation A distillation process used for the separation of thevarious components of a liquid mixture.
F-T Fisher-Tropsch.
FTP Federal Test Procedure.
Fuel oil Light fuel oil, heavy fuel oil and other fuel oils.
Gas production Defined as the quantity after the first separation point. Itincludes gas reinjected, flaring, own use, losses and LPGextracted.
GCV Gross Calorific Value.
GHG Greenhouse Gas.
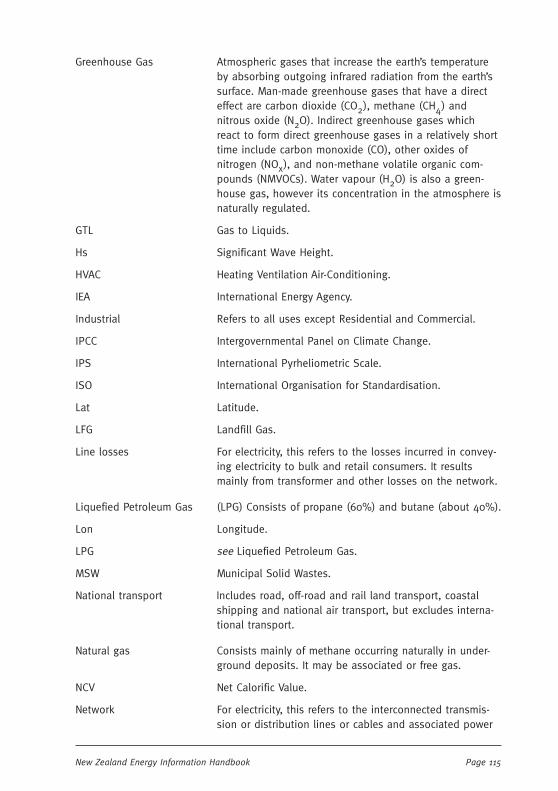
Page 115New Zealand Energy Information Handbook
Greenhouse Gas Atmospheric gases that increase the earth’s temperatureby absorbing outgoing infrared radiation from the earth’ssurface. Man-made greenhouse gases that have a directeffect are carbon dioxide (CO2), methane (CH4) andnitrous oxide (N2O). Indirect greenhouse gases whichreact to form direct greenhouse gases in a relatively shorttime include carbon monoxide (CO), other oxides ofnitrogen (NOx), and non-methane volatile organic com-pounds (NMVOCs). Water vapour (H2O) is also a green-house gas, however its concentration in the atmosphere isnaturally regulated.
GTL Gas to Liquids.
Hs Significant Wave Height.
HVAC Heating Ventilation Air-Conditioning.
IEA International Energy Agency.
Industrial Refers to all uses except Residential and Commercial.
IPCC Intergovernmental Panel on Climate Change.
IPS International Pyrheliometric Scale.
ISO International Organisation for Standardisation.
Lat Latitude.
LFG Landfill Gas.
Line losses For electricity, this refers to the losses incurred in convey-ing electricity to bulk and retail consumers. It resultsmainly from transformer and other losses on the network.
Liquefied Petroleum Gas (LPG) Consists of propane (60%) and butane (about 40%).
Lon Longitude.
LPG see Liquefied Petroleum Gas.
MSW Municipal Solid Wastes.
National transport Includes road, off-road and rail land transport, coastalshipping and national air transport, but excludes interna-tional transport.
Natural gas Consists mainly of methane occurring naturally in under-ground deposits. It may be associated or free gas.
NCV Net Calorific Value.
Network For electricity, this refers to the interconnected transmis-sion or distribution lines or cables and associated power

Page 116 Glossary
transformers for supplying power to customers.
NG see Natural Gas.
Non-energy use Use of primary energy for other purposes (e.g., bitumenfor roads) and natural gas used as feedstock for theproduction of methanol and ammonia/urea.
NZS New Zealand Standards.
Oil Oil includes crude oil, condensate and oil products.
OTEC Ocean Thermal Energy Conversion.
PM Particulate Matter.
PO.DAAC Physical Oceanography Distributed Active Archive Center.
Primary energy Energy, as it is first obtained from natural sources.
PSFO Power Station Fuel Oil.
Recoverable reserves Estimates of the total amounts of oil and gas that can beextracted during the lifetime of each field. These maydiffer from initial reserves estimates made at the com-mencement of production.
Refinery products Include refinery naphtha, mid distillate and motorgasoline blending components, eg, alkylate mix, offgraderegular, offgrade premium, reformate, cracked spirit.Synfuels used as refinery feedstock are also included inthis category.
Reserves Oil and gas reserves are expected reserves, estimated as‘proven and probable’ or P50 (ie, with a greater than 50%probability of being technically and economicallyproducible) reserves by the field operators.
Residential/domestic This refers to each separately metered private dwelling,i.e., private houses. It excludes hotels, hostels andinstitutions (which are included in the commercial sector),but does include normally unoccupied holiday homes andbeach houses.
Separation Splitting wellhead gas into a gas stream and a liquidstream.
Sp. Gr. Specific Gravity.
Specific energy Energy per unit mass.
Specific gravity Ratio of the density of the material of interest to thedensity of water.
SST Sea Surface Temperature.

Page 117New Zealand Energy Information Handbook
Syn Synthetic.
Total primary energy supply (TPES) The amount of energy available for use in NewZealand for energy transformation and end use. It includesenergy as it is first obtained from natural sources. Byconvention, fuels used for international transport areexcluded from total primary energy supply.
Tp Peak Period.
TS Total Solids.
Wobbe Index A number indicating the interchange ability of fuel gases.It relates fuel gas heating characteristics in a manner thatis useful for the blending of fuel gases, or to obtain aconstant heat flow from a gas of varying composition.
Wood residues Includes arisings, hog fuel, bark and black liquor.
Wood Includes wood supplied as fuel, wood waste and residues.

Page 118 Glossary

Page 119New Zealand Energy Information Handbook
AcknowledgementsAcknowledgementsAcknowledgementsAcknowledgementsAcknowledgements
The Energy Handbook is very much a co-operative effort and the Editors havebeen fortunate in having access to a widevariety of people who have been willingto contribute their time and expertise tomaking this project a reality.
In particular, we would like to acknowl-edge the contributions of those listedbelow.
Editorial Panel
James Baines (Taylor Baines); MartinBrown-Santirso (Statistics NZ); JaneBydder (Genesis); Scott Caldwell (CAENZ);Kent Hammond (MED); George Hooper(CAENZ); Duncan Mackenzie (SolidEnergy); Peter Nelligan (Rockgas); MurrayPoulter (NIWA); Paul Reilly (PB Power);Lewis Roland (Transpower); Bryan Scott(PB Power); Robert Tromop (EECA); andDavid Wilkinson (MED).
Additional Contributors
Andy Hamm (CAENZ) – Chapter 15.
Reviewers
Peer Review: Arthur Williamson.
Book Review: James Baines (TaylorBaines); Andy Hamm (CAENZ); DavidWilkinson (MED).
Topic Reviews: Fraser Clark (New ZealandWind Energy Association); Nigel Isaacs &Michael Camilleri (BRANZ); JeromeKerrigan (New Zealand Refining Com-pany); Mike Mongillo (GNS); Jim Seymour(Vector); and Andrew Tait (NIWA).
Organisations
The Editors are grateful to the followingorganisations for permission to reproducematerial:
• Ministry of Economic Development;
• NIWA;
• Transpower; and
• Vector.
Financial Supporters
CAENZ is grateful to the followingorganisations for financial support in theproduction of the Handbook:
• Energy Efficiency and ConservationAuthority;
• Genesis Energy;
• Meridian Energy;
• Ministry of Economic Development;
• PB Power;
• Rockgas;
• Solid Energy; and
• Statistics New Zealand.

Page 120 Acknowledgements
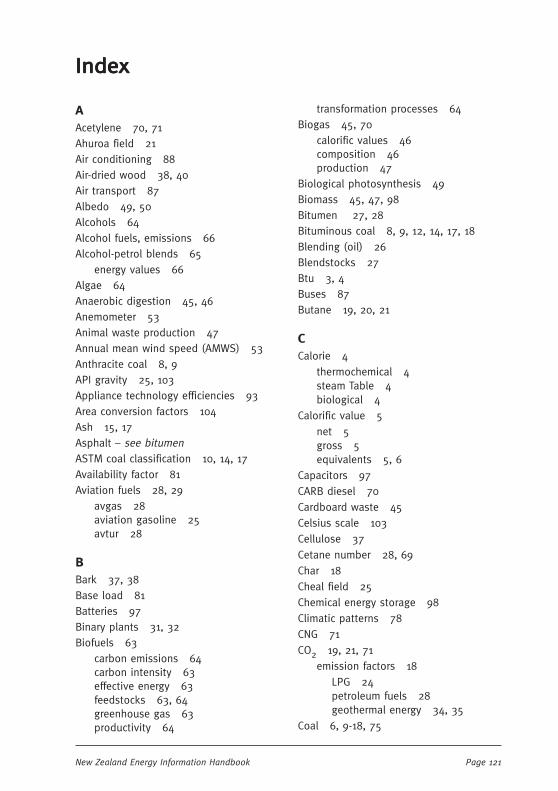
Page 121New Zealand Energy Information Handbook
IndexIndexIndexIndexIndex
AAcetylene 70, 71Ahuroa field 21Air conditioning 88Air-dried wood 38, 40Air transport 87Albedo 49, 50Alcohols 64Alcohol fuels, emissions 66Alcohol-petrol blends 65
energy values 66Algae 64Anaerobic digestion 45, 46Anemometer 53Animal waste production 47Annual mean wind speed (AMWS) 53Anthracite coal 8, 9API gravity 25, 103Appliance technology efficiencies 93Area conversion factors 104Ash 15, 17Asphalt – see bitumenASTM coal classification 10, 14, 17Availability factor 81Aviation fuels 28, 29
avgas 28aviation gasoline 25avtur 28
BBark 37, 38Base load 81Batteries 97Binary plants 31, 32Biofuels 63
carbon emissions 64carbon intensity 63effective energy 63feedstocks 63, 64greenhouse gas 63productivity 64
transformation processes 64Biogas 45, 70
calorific values 46composition 46production 47
Biological photosynthesis 49Biomass 45, 47, 98Bitumen 27, 28Bituminous coal 8, 9, 12, 14, 17, 18Blending (oil) 26Blendstocks 27Btu 3, 4Buses 87Butane 19, 20, 21
CCalorie 4
thermochemical 4steam Table 4biological 4
Calorific value 5net 5gross 5equivalents 5, 6
Capacitors 97CARB diesel 70Cardboard waste 45Celsius scale 103Cellulose 37Cetane number 28, 69Char 18Cheal field 25Chemical energy storage 98Climatic patterns 78CNG 71CO2 19, 21, 71
emission factors 18 LPG 24 petroleum fuels 28 geothermal energy 34, 35
Coal 6, 9-18, 75

Page 122 Index
analysis 14classification 14gasification 71grade 9, 11in-ground resources 12, 14mines 9New Zealand coalfields 11production 9properties 11rank 9, 11, 18resources 12 North Island 12 South Island 13tests 14type 9, 11
Coalbed methane 72Coastal shipping 87Co-generation 31Coke 18Coking coals 8, 10Commercial buildings 86Commercial HVAC energy 89Commercial/industrial hot water energy
89Commercial/industrial steam energy 88Compressed air storage (CAES) 100Conversion factors 104-106
temperature 104length 104area 104volume 105mass 105pressure 105velocity 106flowrate 106density 106
Cord 38Crucible Swelling Number 18Crude feedstocks 8, 25, 27Crude oil 8, 25CTL (coal-to-liquids) fuels 67-70
DDC link 79, 80Density conversion factors 106Derived units 3
Diesel 28, 29Diesel engines, emissions 70Diesel substitutes 66
alcohols 66animal fats 66calorific values 67vegetable oils 66
Digestor gas 45, 46Direct solar input 49Distillate fuel oil 28Domestic cooking 92Domestic dwellings 86Domestic energy usage 88-93
by fuel 90end-use 90, 96hot water 92, 93, 95space heating 95total use per house 95
Dry gas 19Dry hydrological year 81Dry-year conditions 79
EElectrical energy storage 97Electrical energy and power 75Electricity 75-84
high voltage network 82, 83generating stations 76-77, 78, 79units 75thermal equivalents 75, 77appliance use 94
Electrochemical storage 97Emerging forms of energy 63-73Energy
and work equivalents 4commodity units 3content of fuel 5demand 85-96from waste 45-48storage 97-102
Energy efficiency 85-96adoption 86monitoring 86potentials 85, 86 economic potential 85 market potential 85

Page 123New Zealand Energy Information Handbook
technical potential 85residential 88-93targeting 86
Energy Efficiency and Conservation Act2000 85
Enhanced geothermal systems (EGS) 31ETBE (ethyl tertiary butyl ether) 65Ethane 7, 19, 20, 72Ethanol 65, 66, 67
FFahrenheit scale 103Fermentation 45, 46, 70Firewood species density 40Fisher-Tropsch 68, 69Fixed carbon 17Flash steam power plants 31Flowrate conversion factors 106Flywheels 99
buses 99Foot-pound 4Fossil fuel-fired power stations 78, 79Free (surface) moisture 17
GGarden waste 45Gas 6
coke 8fields 22hydrates 72-73reticulation 22transmission system 23treatment 19
Gaseous fuels 70-71Geothermal energy 31-35, 75
energy conversion efficiencies 34energy regulatory status 32, 33field enthalpy 34fields 32flow rates 31fluid 34generation 6, 81generation capacity 32heat 33power stations 32reservoir temperature 31, 34
resources 31system energy content 34systems 31, 32
Global solar fluxes 49Green (wet) wood 37, 38, 39, 40GTL (gas-to-liquid) fuels 67-70
diesel 68fuel, energy content 68liquids 68naphtha 68production options 69
HHardwoods 37, 38Heat energy storage 100Heat pumps 91, 94
COPs 94Heavy fuel oil 7, 30HEEP (Household Energy End-use Project)
88, 94Hemicellulose 37High voltage network 82, 83Horsepower 4, 5Hot dry rock (HDR) 31Household appliances 93Hot water 88Huntly 10, 11, 12Hydro
electricity 6, 7generation 75, 77, 81lakes 79, 80micro 75installed capacities 79potential generation 79, 80
Hydrocarbons 25Hydrogen 70, 71, 98
economy 98storage 71, 98
Hydrothermal systems 31
IIEA energy equivalents 7, 8Incineration 45Industrial and commercial energy
efficiency 87-88

Page 124 Index
Inherent moisture 16Installed capacity 81Instantaneous wind speed 53, 54International Energy Agency (IEA) 6International Organisation for Standardi-
sation (ISO) 14
JJet fuels 7, 28joule 3, 4
KKapuni field 19, 20, 21, 25Kauri field 21Kawerau power station 33Kelvin scale 103Kerosene 7, 25, 29Kinetic energy storage 99Kitchen waste 45Kraft waste 45Kupe field 25kWh 4, 75
LLand area 50Landfill gas 45, 46, 48Latent heat 101Latent heat of vaporization 5Length conversion factors 104LIDAR 53Lighting efficiency 86Lignin 37, 43lignite 8, 9, 13-14, 17Line losses 81Load 82
factor 77, 82LPG 19, 21-24
energy data 24Lubricating oils 25, 26
MMaari field 25Mangahewa field 21Marine ecosystems 60
Marine energy 59technologies 60
Marsden Point refinery 25, 27Mass conversion factors 105Mass/volume interrelationships 103Maui field 20, 21. 25Maunufactured town gas 70, 71-72Maximum control level 83McKee field 21, 25Mean annual solar radiation 49Mean daily insolation 49Mean hydrological year 83Mean significant wave heights 60Mean wind energy fluxes 53Mean-year conditions 79Median wind speeds 55, 56-57Meso-scale modelling 53Metallurgical coke 18Methane 19, 20, 45, 46, 48, 71, 72Methanol 65, 66, 67Metric prefixes 3Micro-scale modelling 54Minimum control level 83Moisture content
coal 16wood 38, 39, 41
Mokai power station 33Motunui 67MTBE (methyl tertiary butyl ether) 65Municipal solid waste 45, 75
NNaphtha 7, 29Natural gas 7, 19-24, 70, 75
composition 19, 20, 21production 20
Net calorific value 5Ngawha power station 33North Island coalfields 11Nuclear generation 6, 7
OOcean
currents 59
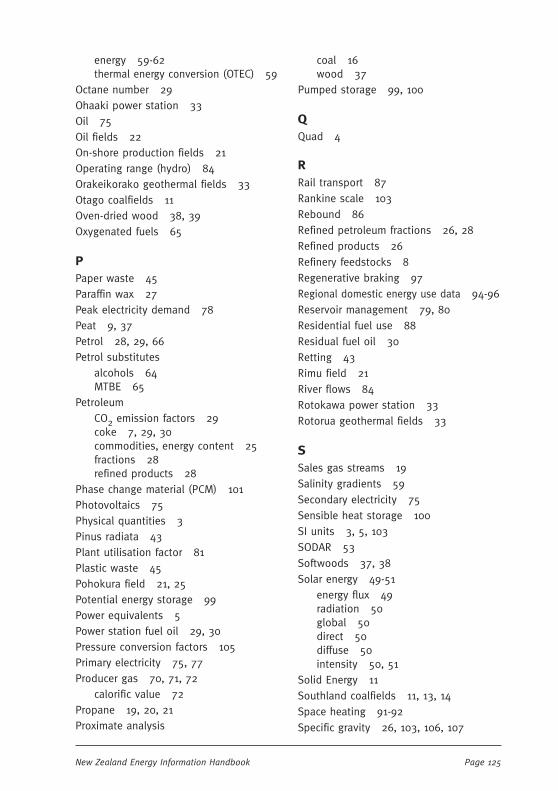
Page 125New Zealand Energy Information Handbook
energy 59-62thermal energy conversion (OTEC) 59
Octane number 29Ohaaki power station 33Oil 75Oil fields 22On-shore production fields 21Operating range (hydro) 84Orakeikorako geothermal fields 33Otago coalfields 11Oven-dried wood 38, 39Oxygenated fuels 65
PPaper waste 45Paraffin wax 27Peak electricity demand 78Peat 9, 37Petrol 28, 29, 66Petrol substitutes
alcohols 64MTBE 65
PetroleumCO2 emission factors 29coke 7, 29, 30commodities, energy content 25fractions 28refined products 28
Phase change material (PCM) 101Photovoltaics 75Physical quantities 3Pinus radiata 43Plant utilisation factor 81Plastic waste 45Pohokura field 21, 25Potential energy storage 99Power equivalents 5Power station fuel oil 29, 30Pressure conversion factors 105Primary electricity 75, 77Producer gas 70, 71, 72
calorific value 72Propane 19, 20, 21Proximate analysis
coal 16wood 37
Pumped storage 99, 100
QQuad 4
RRail transport 87Rankine scale 103Rebound 86Refined petroleum fractions 26, 28Refined products 26Refinery feedstocks 8Regenerative braking 97Regional domestic energy use data 94-96Reservoir management 79, 80Residential fuel use 88Residual fuel oil 30Retting 43Rimu field 21River flows 84Rotokawa power station 33Rotorua geothermal fields 33
SSales gas streams 19Salinity gradients 59Secondary electricity 75Sensible heat storage 100SI units 3, 5, 103SODAR 53Softwoods 37, 38Solar energy 49-51
energy flux 49radiation 50global 50direct 50diffuse 50intensity 50, 51
Solid Energy 11Southland coalfields 11, 13, 14Space heating 91-92Specific gravity 26, 103, 106, 107

Page 126 Index
Springs, energy storage 100Steam 88Storm-scale modelling 53Sub-bituminous coal 8, 9, 14Sulphur 17Superconducting magnetic energy storage
(SMES) 97, 98Syncrude 68Synoptic scale modelling 53Synthetic fuels 67
TTakeback 86Taranaki region 25
coalfields 11Tararua wind farm 54, 55Tariki field 21Taupo Volcanic Zone 32, 33Temperature 103 conversion factors 104 gradients 59Thermal generation 84Tidal currents 59Tidal power plants 59, 60Tonnes oil equivalent (toe) 6Transport 86 efficiency 86 energy from electricity 99 modes, comparative data 87 petrol fleet 87Tui field 25
UUltimate analysis
coal 15, 16wood 37
Uninterruptible power supply (UPS) 99
VVelocity conversion factors 106
Volatile matter 17Volume conversion factors 105
WWaikato coalfields 11
Waimangu geothermal fields 33
Waiotapu geothermal fields 33
Wairakei power station 33
Waste brine 35Waste 45
solid 45animal 47fuel properties 48
Water current velocities 60, 62
Watt 3, 5
Waves 59
heights 61periods 61power energy densities 59
West Coast coalfields 10, 11, 12
Wet gas 19
White spirits 27Wind energy 53-58
power 75resource 53speed 53turbines 53variability 54
Windfarms
operational 54, 55, 58planned 54, 58
Wobbe Index 19, 21
Wood 37-43
calorific values 38, 39-40, 42, 43composition 37extractives 37, 40pellets 43residues 41-42, 45species 37volumetric conversion factors 38