NEW ZEALAND CLIMATE TECH FOR THE WORLD
209
NEW ZEALAND CLIMATE TECH FOR THE WORLD How can New Zealand’s Climate Tech innovators succeed on the world stage? An analysis of New Zealand’s Climate Tech innovation ecosystem July 2021
Transcript of NEW ZEALAND CLIMATE TECH FOR THE WORLD

NEW ZEALAND CLIMATE TECH FOR THE WORLD
How can New Zealand’s Climate Tech innovators succeed on the world stage? An analysis of New Zealand’s Climate Tech innovation ecosystem
July 2021
July 2021NEW ZEALAND CLIMATE TECH FOR THE WORLD
Scope and Purpose ........................................................................................ 4
Methodology .................................................................................................. 5
Executive Summary ....................................................................................... 6
Critical Findings ............................................................................................ 10
Recommendations: Improving the Ecosystem......................................... 12
Laboratory New Zealand – New Zealand Technologies for Global Climate Challenges .................................................................... 13
Leading the Way in Low-Emissions Agriculture ....................................... 16
Digitalising Energy Decabonisation ........................................................... 23
Capitalising on Circularity in Energy and Materials ................................. 26
Productising Low-impact Consumer Goods ......................................................30
References .................................................................................................... 32
Contents

July 2021NEW ZEALAND CLIMATE TECH FOR THE WORLD
Energy & Power ........................... 36
Comparison Between Small Advanced Economies (SAEs) ..................... 38Waste Heat Recovery ................................. 40Smart Home Energy Analytics .................. 46Electrochemical Energy Storage ............... 52Geothermal ................................................. 58Energy Efficiency - Digital Platforms ........ 64Hydrogen - Transport & Refueling ........... 70
Agriculture & Food ...................... 76Comparison Between Small Advanced Economies (SAEs) ..................... 78Livestock...................................................... 79
Livestock Monitoring ............................ 80Livestock Breeding & Genetics ............ 82Methane Vaccines................................. 84
Feed Alternatives & Additives ................... 88Protein Replacements ............................... 93Aquaculture ................................................ 99Crops ......................................................... 103
Specialty Crops.................................... 105Precision Chemical Application ......... 107
Agricultural Digitalisation ........................ 111Agricultural Robotics .......................... 113Agricultural Software ......................... 115Agricultural Drones ............................ 117
CCS for Agriculture .................................. 122
Resources & Environment ....... 126
Comparison Between Small Advanced Economies (SAEs) ................... 128Wastewater Treatment ........................... 131B2C Carbon Emissions Tracking ............. 138Bioplastics ................................................. 143Zero Waste Products ............................... 148Natural Textiles ........................................ 153
Transport & Logistics ................ 158
Comparison Between Small Advanced Economies (SAEs) ................... 160EV Charging & Management ................... 164Aerospace Propulsion Modules ............. 170Maritime Electrification ........................... 175
Materials & Chemicals .............. 179
Comparison Between Small Advanced Economies (SAEs) ................... 181Advanced Materials: Green Building & Construction .............. 183Additive Manufacturing for Construction . 189Industrial Waste to Value ........................ 194CCUS - Point Source Capture .................. 199Surface Technologies .............................. 204
Appendices

4
July 2021NEW ZEALAND CLIMATE TECH FOR THE WORLD
This research seeks to answer the question, “How will New Zealand climate tech businesses succeed on the global stage?”
Climate tech is defined as technology that reduces or eliminates greenhouse gas emissions (directly or indirectly) or improves use of natural resources. This report summarises opportunities for New Zealand climate tech companies to compete on the global stage, and for the surrounding innovation ecosystem to support and foster climate tech innovation. Becoming competitive on the global stage requires innovators to successfully transfer research into commercialised products, raise requisite funds to scale and expand beyond the immediate New Zealand market, and most importantly, connect to owners of demand (direct customers, technology development partners, joint venture partners) in a
Scope and Purpose
way that secures New Zealand innovators a place in the global supply chain. Likewise, a proficient ecosystem is defined as one in which innovators can, in theory, access the research, finances, network and connections to demand necessary for global expansion without having to relocate headquarters overseas.
The intended audience for this report is New Zealand’s innovation ecosystem of innovators, customers, investors, government agencies, corporates, universities and others responsible for supporting and sustaining climate tech innovation. This report summarises findings during a detailed analysis process, examining global climate tech trends, New Zealand innovators’ positioning in relation to those trends, and the innovation ecosystem’s ability to support innovators navigating those trends. Further detail on the analysis is provided in the appendices of this report.
CONTENTS
HOW WILL NEW ZEALAND CLIMATE TECH BUSINESSES SUCCEED ON THE GLOBAL STAGE?

5
July 2021NEW ZEALAND CLIMATE TECH FOR THE WORLD
This report analyses five climate tech sectors (Agriculture & Food, Energy & Power, Resources & Environment, Materials & Chemicals, Transport & Logistics) to identify technology areas in which New Zealand innovators can innovate ahead of trends and potentially compete globally.
The analysis combines macroeconomic markers of market attractiveness (market size, growth rate, level of competition, policy drivers), a comparison of New Zealand innovators against comparable innovators globally, and a comparison of the New Zealand innovation ecosystem supporting relevant innovators.
Findings generated from this research serve to help the New Zealand climate tech innovation ecosystem to:
■ Benchmark existing strengths and weaknesses relevant to global climate tech trends.
■ Draw comparisons with other small, advanced economies (SAEs) that have successfully pushed climate tech innovations into global markets.
■ Identify critical gaps holding New Zealand’s innovators back from innovating on a global scale.
■ Re-evaluate changes in approach, both strategic and tactical, to create the conditions necessary for New Zealand climate tech to thrive globally.
Methodology
CONTENTS

NEW ZEALAND CLIMATE TECH FOR THE WORLD
NEW ZEALAND
10 46
2540
122
179
$ MI
LLIO
NS
July 2021
New Zealand has come to be known as a global thought leader on climate change issues, perhaps most visibly in the form of its ambitious commitment to net zero by 2050 and its impressive results in already being 85% of the way to a fully renewable electrical grid. New Zealand has launched world-leading innovators in climate tech areas in recent decades as well, including LanzaTech and AllBirds.
However, when compared to other small advanced economies (SAEs), New Zealand’s climate tech innovators struggle to raise the same amounts of funds that innovators in comparable economies are able to, well below the SAE average in terms of aggregate financing to climate tech, number of companies getting funded, and average investment amounts. As observed in Figure 1 below, among SAEs, New Zealand saw both the lowest amount of investment in climate tech and the fewest climate tech innovators receiving funding. New Zealand climate tech innovators raised 95% (19 times) less funding than climate tech innovators in the average SAE, and 84% (6 times) less than those in Finland, which ranks one spot above New Zealand in climate tech fundraising. New Zealand’s climate tech innovators
received 55 times less funding than the leading country, Sweden, 22 times less than those in Israel, 18 times less than those in Denmark, and 12 times less than those in Ireland. Some of this gap is explained by the variance in industry focus found in each SAE. For example, globally transportation and energy innovators receive far more funding on average versus agriculture or resources innovators. However, even countries in which agriculture or resources hold a similar economic importance (e.g. Israel, Finland, Sweden), all outpaced New Zealand’s amount of financing by wide margins in those sectors.
Executive Summary
0
5
10
15
20
25DENMARK
$ BILL
IONS
NUMBER OF COMPANIES RAISING CAPITAL
0
50
100
150
200
250
300
350
■ Agriculture & Food
KEY:
■ Energy & Power
■ Number of Companies
■ Materials & Chemicals
■ Resource & Environment
■ Enabling Technologies
■ Transportation & Logistics
FINLAND
IRELAND
ISRAEL
NETHERLANDS
NEW ZEALAND
NORWAY
SINGAPORE
SWEDEN
SWITZERLAND
AVERAGE SAE
93
117
87
306
223
54
109
136
234
199
156
Figure 1: Number of Companies Raising Capital 2011-2021
DEFINING SMALL ADVANCED ECONOMIES (SAES)“Small” economies are defined here as having a population of less than 20 million. “Advanced” economies are identified according to International Monetary Fund criteria of per capita income, export diversification, and integration into global financial system. The SAEs analysed in this report all have GDPs per capita of over US $30,000.
6 CONTENTS

NEW ZEALAND CLIMATE TECH FOR THE WORLD July 2021
Another trend that can be observed from the cross-SAE climate tech financing comparisons, is that the largest chunks of financing are coming in the later stages, stages that are notably missing from New Zealand’s financing stack, indicating that New Zealand innovators are not surviving long enough to access the types of financing necessary to grow or are not perceived by investors as holding significant growth potential. As observed in Figure 2 below, at the earlier stages, New Zealand’s innovators are funded far less than SAE peers: Finland, Netherlands, Norway, and Switzerland all have aggregate funding numbers below the SAE average but have Series A and B figures close to average and have launched at least double New Zealand’s number of funded innovators.
Figure 3 below illustrates the average financing mix in SAEs 2011-2021, compared with the financing mix in New Zealand. New Zealand’s financing was concentrated significantly more in the early stages (Grants through Series B) at 55%
0%
20%
40%
60%
80%
100%
■ Grant
KEY:
■ Series A
■ Follow-on Public Offering
■ PIPE
■ Structured Debt
■ Loan
■ Loan GuaranteePublicFinancing
Early-StageEquity
Late-StageEquity
DebtFinancing
■ Project Finance
■ Coin/Token Offering
■ Series B
■ Growth Equity
■ Seed
■ Buyout / Late-Stage Private Equity
NEW ZEALAND
NEW ZEALAND(EXCL. LANZATECH)
AVERAGE SAE
LANZATECH (42% OF SERIES B)
LANZATECH (70% OF GROWTH EQUITY)
LANZATECH (65% OF STRUCTUED DEBT)
Figure 2: Financing Mix, New Zealand and SAE Average
Figure 3: Financing Mix
compared to the SAE average of 13%. However, much of the later stage funding in these years was received by LanzaTech (approximately $117 million raised when it was based in New Zealand)267 and, with LanzaTech excluded from the investment analysis, if, 70% of financing is concentrated to companies in the early growth stages. Public sector funds are the primary source of financing in New Zealand 17% of the funding mix (23% without LanzaTech) versus 1% in the SAE average. A lack in volume of private-sector financing risks presenting innovators with shorter lifelines to growth, subsequent financing, and an overall aversion to innovation in capex-intensive sectors. For innovators to mature, it is necessary to be able to access capital that supports scaling of the business into new geographies and markets, as well as long-term access to debt financing that supports expansion of operations. An innovation ecosystem with an effective financing mix should see ample capital available at each stage of the growth journey, in order to effectively launch world-leading companies.
0
5
10
15
20
25
DENMARK
FINLAND
IRELAND
ISRAEL
NETHERLANDS
NEW ZEALAND
NORWAY
SINGAPORE
SWEDEN
SWITZERLAND
AVERAGE SAE
NUMBER OF COMPANIES RAISING CAPITAL
$ BILL
IONS
■ Buyout / Late- Stage Private Equity
KEY:
■ Follow-on Public Offering
■ Loan Guarantee
■ PIPE
■ Project Finance
■ Seed
■ Series A
■ Series B
■ Structured Debt
■ Number of Companies
■ Grant
■ Growth Equity
■ Coin/Token Offering
■ Loan
0
50
100
150
200
250
300
350
93
117
87
306
223
54
109
199
234
136156
7 CONTENTS

8
July 2021NEW ZEALAND CLIMATE TECH FOR THE WORLD
0
5
10
15
20
25
■ Average Ecosystem R&D-to-CommercialisationKEY: ■ Connection to Demand■ Financing
NEW ZEALAND(n = 30)
ISRAEL(n = 11)
SWEDEN(n = 15)
FINLAND(n = 9)
6.0
5.0
6.36.0
4.0
6.8
7.6
6.6
5.0
6.07.5
7.04.7
4.0
5.0
6.6
7.0
7.9
SWITZERLAND(n = 6)
NETHERLANDS(n = 7)
A lack of multinational companies is an additional challenge that New Zealand faces. Beyond the prototypical SAE challenge of a small home market, solutions for scaling innovation will involve an additional layer of complexity versus those adopted by other SAEs. As a result, New Zealand’s innovation ecosystem must view engagement with multinationals as a necessary component to scaling innovation and a goal of sustaining innovation. New Zealand’s innovation ecosystem will be tasked with pushing innovation out to global corporates but also pulling global corporates into the ecosystem (see Figure 8 for a conceptual framework for a “virtuous cycle” of climate tech innovation).
Most critically, a lack of multinational presence contributes to a lack of dynamism in the fundraising ecosystem – venture financing is often a lagging indicator of value to downstream customers, i.e. investments will move geographically to wherever financiers see new supply opportunities to meet demand. There is a symbiotic relationship between multinational presence and investments. Successful innovators need to understand their target markets and relationships with multinationals intimately at the early stages. This helps to ensure that innovators’ solutions are best tailored to demand owners’ pain points. See New Zealand’s Role in Global Climate Tech for suggestions on how New Zealand can both create innovation ecosystems that spurn leading- edge innovators but also attract multinationals for pilot testing and technology exploration engagements.
This research compared innovation ecosystems in target climate tech sectors on their ability to help companies succeed in three stages of the entrepreneurial journey (R&D-to-commercialisation pipeline, financing, connection to demand), and rated each layer of the ecosystem on a scale of one to ten, with ten indicating that a company could access all necessary opportunities through local resources. The methodology utilised involved first assessing global potential (i.e. market size, growth rate, level of competition), then comparing the support system (R&D resources, talent sources, investors, customers, technology development partners) engaged by stand-out innovators, and culminating in a side-by-side comparison of innovation ecosystems through the lenses of the three layers mentioned above. Figure 4 below summarises the average ratings of each of the three ecosystem layers in the countries most frequently observed during the research. Out of a highest possible score of 30, (30 indicating a “perfect ten” in all three categories), New Zealand scored the lowest, with the largest gaps coming in connection to demand. See Appendices for detailed analysis of technology areas and ecosystems.
Figure 4: Ecosystem Average Ratings (ecosystems most frequently reviewed during this research)
THERE IS A SYMBIOTIC RELATIONSHIP BETWEEN MULTINATIONAL PRESENCE AND INVESTMENTS. SUCCESSFUL INNOVATORS NEED TO UNDERSTAND THEIR TARGET MARKETS AND RELATIONSHIPS WITH MULTINATIONALS INTIMATELY AT THE EARLY STAGES.
CONTENTS

9
July 2021NEW ZEALAND CLIMATE TECH FOR THE WORLD
0 5 10 15 20 25 30
BAY AREA,CALIFORNIA
NEW ZEALAND
ISRAEL
SWEDEN
TRANSPORT & LOGISTICS
0 5 10 15 20 25 30
BAY AREA,CALIFORNIA
ENERGY & POWER
NETHERLANDS
SWEDEN
ISRAEL
NEW ZEALAND
0 5 10 15 20 25 30
SWITZERLAND
UK
NETHERLANDS
SWEDEN
NEW ZEALAND
ISRAEL
AGRICULTURE & FOOD
0 5 10 15 20 25
GERMANY
FINLAND
NEW ZEALAND
SWEDEN
CANADA
RESOURCES & ENVIRONMENT
0 5 10 15 20 25
UNITED STATES
FRANCE
GERMANY
FINLAND
CANADA
NEW ZEALAND
ISRAEL
SWEDEN
SWITZERLAND
MATERIALS & CHEMICALS
■ Average Ecosystem R&D-to-Commercialization Pipeline Rating
KEY:
■ Connection to Demand
■ Financing
9
While SAEs have an inherent economic disadvantage versus larger economies, there are still examples of SAE innovation ecosystems in a competitive position versus the incumbent ecosystem in larger economies (for example, Israel within five points of the US and Germany in materials and chemicals, Sweden and Finland as near-peers to Germany in resources and environment). Across the different industry groups, New Zealand’s innovation ecosystem lags that of other SAEs, even in the sectors that New Zealand considers central to its economy. New Zealand’s innovation ecosystem in Agriculture & Food is ahead of New Zealand’s innovation ecosystem for other industry groups. As indicated in Figure 5 below, SAEs that can consistently produce innovation in
climate tech leverage adjacencies in industry and actively leverage multi-sector synergies. For example, Israel and Sweden are used as comparators in almost all of the industry group analyses and their ecosystems score above the SAE average in each industry category.
This report seeks to understand the gaps between New Zealand’s climate tech innovation ecosystems and those of other SAEs. Additionally, it is meant to identify latent opportunities for New Zealand’s innovators and ecosystem and potential strategies to capitalise on those opportunities to carve out a stronger presence for New Zealand climate tech on the world stage.
Figure 5: Example Ecosystem Ratings (broken out by industry group)
CONTENTS
NEW ZEALAND CLIMATE TECH FOR THE WORLD
Critical Findings:
10
July 2021
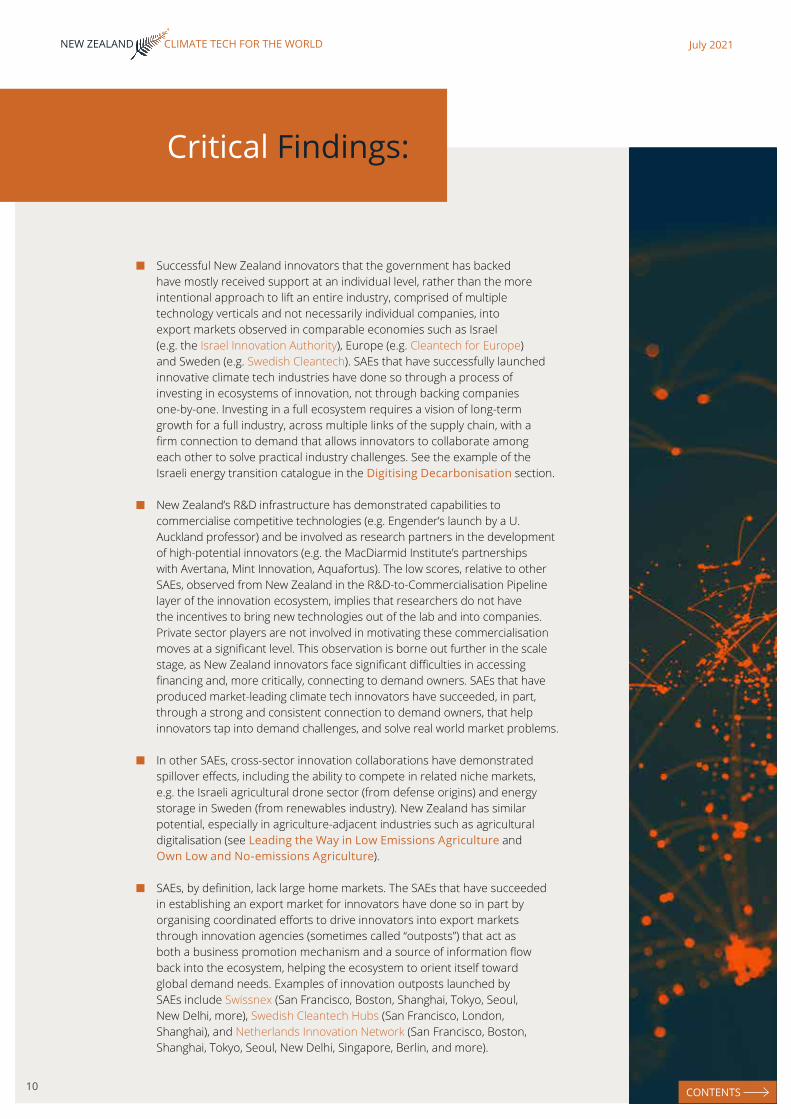
■ Successful New Zealand innovators that the government has backed have mostly received support at an individual level, rather than the more intentional approach to lift an entire industry, comprised of multiple technology verticals and not necessarily individual companies, into export markets observed in comparable economies such as Israel (e.g. the Israel Innovation Authority), Europe (e.g. Cleantech for Europe) and Sweden (e.g. Swedish Cleantech). SAEs that have successfully launched innovative climate tech industries have done so through a process of investing in ecosystems of innovation, not through backing companies one-by-one. Investing in a full ecosystem requires a vision of long-term growth for a full industry, across multiple links of the supply chain, with a firm connection to demand that allows innovators to collaborate among each other to solve practical industry challenges. See the example of the Israeli energy transition catalogue in the Digitising Decarbonisation section.
■ New Zealand’s R&D infrastructure has demonstrated capabilities to commercialise competitive technologies (e.g. Engender’s launch by a U. Auckland professor) and be involved as research partners in the development of high-potential innovators (e.g. the MacDiarmid Institute’s partnerships with Avertana, Mint Innovation, Aquafortus). The low scores, relative to other SAEs, observed from New Zealand in the R&D-to-Commercialisation Pipeline layer of the innovation ecosystem, implies that researchers do not have the incentives to bring new technologies out of the lab and into companies. Private sector players are not involved in motivating these commercialisation moves at a significant level. This observation is borne out further in the scale stage, as New Zealand innovators face significant difficulties in accessing financing and, more critically, connecting to demand owners. SAEs that have produced market-leading climate tech innovators have succeeded, in part, through a strong and consistent connection to demand owners, that help innovators tap into demand challenges, and solve real world market problems.
■ In other SAEs, cross-sector innovation collaborations have demonstrated spillover effects, including the ability to compete in related niche markets, e.g. the Israeli agricultural drone sector (from defense origins) and energy storage in Sweden (from renewables industry). New Zealand has similar potential, especially in agriculture-adjacent industries such as agricultural digitalisation (see Leading the Way in Low Emissions Agriculture and Own Low and No-emissions Agriculture).
■ SAEs, by definition, lack large home markets. The SAEs that have succeeded in establishing an export market for innovators have done so in part by organising coordinated efforts to drive innovators into export markets through innovation agencies (sometimes called “outposts”) that act as both a business promotion mechanism and a source of information flow back into the ecosystem, helping the ecosystem to orient itself toward global demand needs. Examples of innovation outposts launched by SAEs include Swissnex (San Francisco, Boston, Shanghai, Tokyo, Seoul, New Delhi, more), Swedish Cleantech Hubs (San Francisco, London, Shanghai), and Netherlands Innovation Network (San Francisco, Boston, Shanghai, Tokyo, Seoul, New Delhi, Singapore, Berlin, and more).
CONTENTS

NEW ZEALAND CLIMATE TECH FOR THE WORLD
11
July 2021
■ New Zealand will have an additional challenge in that, different from Switzerland, Sweden, and the Netherlands, it will not necessarily have dual efforts of multinationals and innovation outposts to generate synergies between each other in export markets. Overcoming this challenge will involve bringing multinationals into the conversation early, through investment and trade promotion, as the innovation ecosystem is being built out, to participate in the discussions around areas of focus and standards for technology. An example is that of Mekerot, the national water supply company of Israel, that leveraged a relationship with Microsoft to open testing opportunities for wastewater treatment innovators (see more detailed example in Wastewater Treatment). This type of collaboration not only provides live pilot-testing opportunities for innovators, but also hedges risk for the demand owner by leaning on the experience of a seasoned corporation and allowing the corporation exposure to innovative local companies in a hands-on way.
As this report indicates, New Zealand’s natural resources and intellectual capital are most likely to produce competitive advantages when the ecosystem focuses on achieving an effect in the market. Achieving a market effect is fundamentally different from supporting individual innovators; New Zealand’s small domestic market requires innovators to be pooled together in value chains that provide step-change gains to demand owners (i.e. remove years from R&D processes, open brand new markets, exponentially increase efficiency), involves government efforts to promote to demand owners, and long-term engagement between the innovation ecosystems and demand owners to ensure that innovation is targeted toward the broader, more consequential markets.
To demonstrate how certain actions can help New Zealand build its success in Climate Tech, this report illustrates a potential framework identifying areas where New Zealand can commit to market effects, pool innovators and resources, coordinate stakeholders, and connect innovation to areas with growing demand.
This conceptual framework is proposed to ensure that New Zealand has coordinated efforts to support innovators in fields with promising global markets and where New Zealand has competitive innovation advantages. A goal is to avoid one-by-one backing of companies and to instead create an environment that consistently produces winners by having strong connections to global demand and facilitates fluid networking interactions between innovators and resources.
CONTENTS

NEW ZEALAND CLIMATE TECH FOR THE WORLD
Recommendations: Improving the Ecosystem
12
July 2021
■ Commit – Focus objectives on ways that New Zealand innovation can impact markets in a meaningful way. Some examples in this report include the development of an agricultural digitalisation value chain and the development of a unique New Zealand model of industrial symbiosis around geothermal energy and forestry.
■ Cluster – Organise resources around achieving the market effect by identifying technology discipline crossovers that leverage New Zealand industrial and resource strengths. Organise collisions for innovators between industries through pilot testing and experimentation programmes.
■ Coordinate – Make intentional efforts to develop suites of products around New Zealand natural advantages and organise resources to lift suites of innovators into markets. An example highlighted in this report is that of developing a low-methane livestock supply chain that consists of both sets of technologies but also systems of operating models between technologies that can be exported as a New Zealand Model.
■ Connect to Demand – Systematically place coordinated solutions sets in front of demand owners worldwide. An example is innovation outposts that consist of the government promoting New Zealand solutions sets, groups of technologies, that together solve large efficiency or emissions-reduction challenges for customers in overseas markets and pulling global corporations into innovation programmes within New Zealand to create a market feedback loop. Another example put forward is to develop unique ecosystem advantages around technology piloting and launch in New Zealand to attract global innovators, raise competitiveness levels among innovators, and attract more corporate investment into the ecosystems. Cross-border innovation supports the development of local innovation ecosystems by allowing researchers, local governments, and the local private sector to engage with the most cutting-edge technologies - an example is a 2020 partnership between Technion (Israel) and Primus Power (US) to develop a bromine-based battery system specifically for deployment in Israel, where Israeli Chemicals runs world-leading Bromine production facilities.274
CONTENTS

13
July 2021NEW ZEALAND CLIMATE TECH FOR THE WORLD
Laboratory New Zealand – New Zealand Technologies for Global Climate Challenges
Commit to becoming the world’s leading source of innovation for low methane livestock raising and low or no-emissions crop raising.
Cluster digitalisation innovation with innovation in new and alternative livestock feeds. Leverage digitalisation to reduce waste and control energy use on farms. Place protein replacements in the stack of research priorities to complement low-emissions meat products and stay relevant to global consumers, leverage specialty crops innovation to support development of protein replacements industry.
Coordinate experimentation between farmers and innovators to test technologies but also pull in adjacent industries. Consider establishing experimentation zones to promote symbiosis between forestry, agriculture, and potentially geothermal energy.
Connect low emissions agriculture stack to Demand through intentional initiatives (such as an agricultural digitalisation body) and development of low-emissions agriculture value chain catalogues for overseas demand owners. Take an “innovation outpost” approach to bringing demand owners through experimentation zones to observe symbiosis and connect with innovators. Establish a consortium with multinationals directly involved.
Commit to exploring models that not only push forward energy-generating technology, but systems of developing local microeconomies, built on circular industries to be co-located in areas of natural geothermal resources.
Cluster players that have high needs for energy inputs, use for waste heat, and significant water needs in the low impact zones, e.g. dairy production and food processing. Encourage involvement of companies with significant by products that can be used for inputs to other industrial processes, especially forestry.
Coordinate opportunities for innovators to test technologies live in the low impact zones. Actively assess needs of companies operating in the zones and look for innovators operating at the nexus of indirectly related industries (e.g. as Hot Lime Labs does with forestry and horticulture). Don’t just bring in companies to be directly involved in processes, also create opportunities for digitalisation companies to participate in the form of “command centers” that oversee transmission of resources between actors and promote efficiencies, e.g. using the philosophy of the Rio de Janeiro Operations Center that invites innovators to test smart city and transportation technologies through their platforms.
Connect low impact zones to demand owners in industrial companies that have targets to reduce energy use and production of by-products, but also promote models to local governments in overseas regions that have similar geothermal resources that they wish to develop economic effects around. Provide training on the models developed and promote value chain participants for direct involvement in other regions’ projects developed with these models.
To place New Zealand’s innovators in a position to become climate tech exporters, we recommend the ecosystem take the below actions to leverage New Zealand’s unique natural and intellectual advantages to create meaningful solutions for global climate challenges.
Own Low and No-emissions Agriculture Pioneer No-Impact Geothermal Models
CONTENTS

14
July 2021NEW ZEALAND CLIMATE TECH FOR THE WORLD
Which trends should be pursued and how can innovators succeed?
The primary objective of this research is to understand which comparator innovation ecosystems offer a cohesive continuum of support from initial research, through growth financing, large-scale commercialisation, and finally to global competitiveness. New Zealand, as a small, innovative economy that is geographically isolated from much of the world, must use innovation resources efficiently and focus attention on those technologies which combine high global economic potential with significance to the local market. Accelerating climate tech innovation will involve a two-pronged ecosystem approach of coordinating parties to ensure innovators are innovating for the real world as soon as possible, with early exposure to pilot testing and value chain
integration opportunities and backing winners by facilitating connections to overseas demand owners and coordinating public and private financing resources to bridge growth.
Underpinning this report is a research process that reviewed climate innovation trends in each of Cleantech Group’s five taxonomy trees: Energy & Power, Agriculture & Food, Resources & Environment, Materials & Chemicals, and Transport & Logistics. The analysis then identified sectors of technology relevant to New Zealand’s economy, and specific technology development trends within those sectors that could potentially impact New Zealand’s economic development (positively or negatively) and had existing global market gaps for technology innovation (i.e. areas where innovators had potential to solve market needs, not only incumbents).
The chart below (Figure 6) demonstrates results of the analysis, with advice on technologies that New Zealand should attempt to advance efforts to develop, ones that New Zealand should explore developing, and ones that should simply be monitored and evaluated for potential New Zealand participation. The market trends (Y axis) suggest a level of benefit to pursuing the technology, considering market size, growth rate, and saturation of competition within the market. New Zealand Alignment and Ability to Lead (X axis) analyses the existing presence of high-potential innovators and the requisite local resources to support them, as well as the strength of the surrounding innovation ecosystem to generate sustained launch and growth of innovative companies in that technology area.
EVALUATE EXPLORE ADVANCEEV Charging and Management
Surface TechnologiesSpecialty Crops
Advanced Materials: Green Building & Construction
Aquaculture
CCUS - PointSource Capture
Precision ChemicalApplication
Bioplastics
GeothermalMaritimeElectrification
B2C CarbonEmissions Tracking
AgriculturalDrones
CCS forAgriculture
Feed Alternatives& Additives
AgriculturalRobotics
AgriculturalSoftware
LivestockMonitoring
Livestock Breeding& Genetics
MethaneVaccines Industrial
Waste to Value
NaturalTextiles
Waste Heat Recovery
ElectrochemicalEnergy Storage
Energy EfficiencyDigital Platforms
Smart HomeEnergy Analytics
Green AmmoniaProduction
Protein Replacements
Aerospace Propulsion Modules
Hydrogen Transport & Refuelling
Additive Manufacturingfor Construction Zero Waste Consumer Goods
WastewaterTreatment
NEW ZEALAND Alignment & Ability to Lead
MARK
ETPo
tent
ial &
Tim
ing
4
3
2
1
1 2 3 4
Figure 6: Proposed Prioritisation of Climate Technology Development
Potential to Succeed in Niches: Ecosystem Needs Wide Reach, Innovators Need to Go Deep
CONTENTS
15
July 2021NEW ZEALAND CLIMATE TECH FOR THE WORLD
EVALUATE EXPLORE ADVANCEEV Charging and Management
Surface TechnologiesSpecialty Crops
Advanced Materials: Green Building & Construction
Aquaculture
CCUS - PointSource Capture
Precision ChemicalApplication
Bioplastics
GeothermalMaritimeElectrification
B2C CarbonEmissions Tracking
AgriculturalDrones
CCS forAgriculture
Feed Alternatives& Additives
AgriculturalRobotics
AgriculturalSoftware
LivestockMonitoring
Livestock Breeding& Genetics
MethaneVaccines Industrial
Waste to Value
NaturalTextiles
Waste Heat Recovery
ElectrochemicalEnergy Storage
Energy EfficiencyDigital Platforms
Smart HomeEnergy Analytics
Green AmmoniaProduction
Protein Replacements
Aerospace Propulsion Modules
Hydrogen Transport & Refuelling
Additive Manufacturingfor Construction Zero Waste Consumer Goods
WastewaterTreatment
NEW ZEALAND Alignment & Ability to Lead
MARK
ETPo
tent
ial &
Tim
ing
4
3
2
1
1 2 3 4
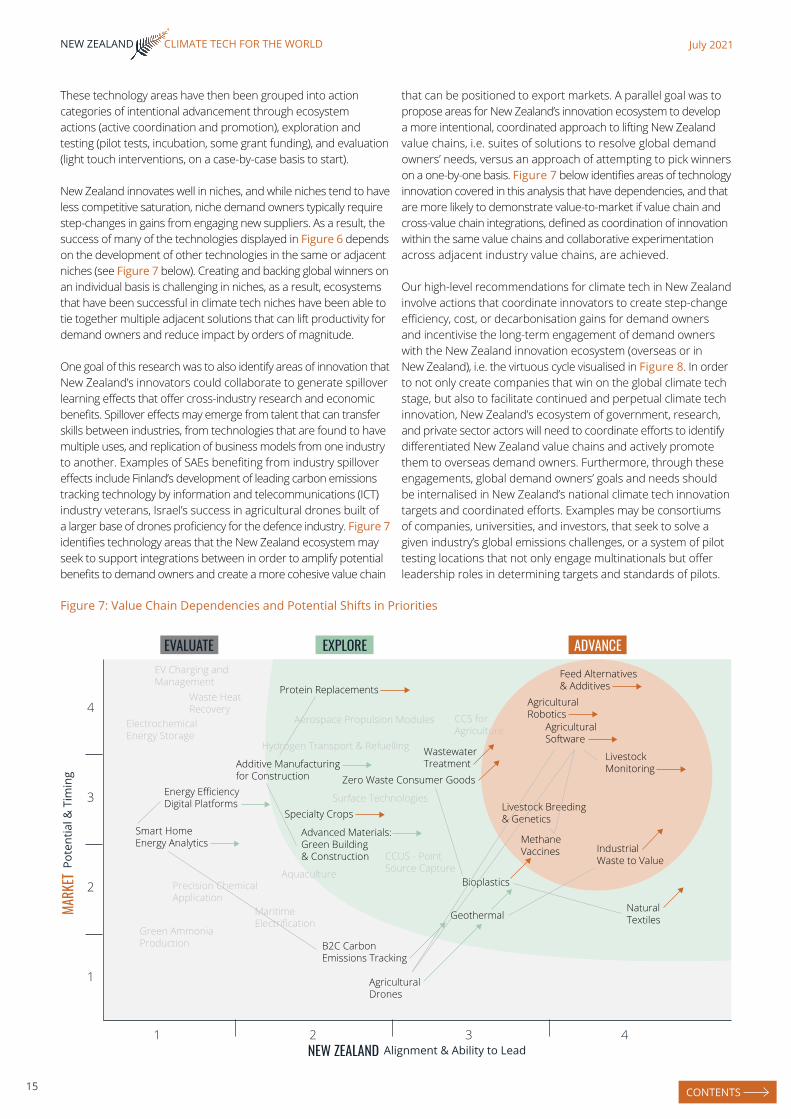
These technology areas have then been grouped into action categories of intentional advancement through ecosystem actions (active coordination and promotion), exploration and testing (pilot tests, incubation, some grant funding), and evaluation (light touch interventions, on a case-by-case basis to start).
New Zealand innovates well in niches, and while niches tend to have less competitive saturation, niche demand owners typically require step-changes in gains from engaging new suppliers. As a result, the success of many of the technologies displayed in Figure 6 depends on the development of other technologies in the same or adjacent niches (see Figure 7 below). Creating and backing global winners on an individual basis is challenging in niches, as a result, ecosystems that have been successful in climate tech niches have been able to tie together multiple adjacent solutions that can lift productivity for demand owners and reduce impact by orders of magnitude.
One goal of this research was to also identify areas of innovation that New Zealand’s innovators could collaborate to generate spillover learning effects that offer cross-industry research and economic benefits. Spillover effects may emerge from talent that can transfer skills between industries, from technologies that are found to have multiple uses, and replication of business models from one industry to another. Examples of SAEs benefiting from industry spillover effects include Finland’s development of leading carbon emissions tracking technology by information and telecommunications (ICT) industry veterans, Israel’s success in agricultural drones built of a larger base of drones proficiency for the defence industry. Figure 7 identifies technology areas that the New Zealand ecosystem may seek to support integrations between in order to amplify potential benefits to demand owners and create a more cohesive value chain
that can be positioned to export markets. A parallel goal was to propose areas for New Zealand’s innovation ecosystem to develop a more intentional, coordinated approach to lifting New Zealand value chains, i.e. suites of solutions to resolve global demand owners’ needs, versus an approach of attempting to pick winners on a one-by-one basis. Figure 7 below identifies areas of technology innovation covered in this analysis that have dependencies, and that are more likely to demonstrate value-to-market if value chain and cross-value chain integrations, defined as coordination of innovation within the same value chains and collaborative experimentation across adjacent industry value chains, are achieved.
Our high-level recommendations for climate tech in New Zealand involve actions that coordinate innovators to create step-change efficiency, cost, or decarbonisation gains for demand owners and incentivise the long-term engagement of demand owners with the New Zealand innovation ecosystem (overseas or in New Zealand), i.e. the virtuous cycle visualised in Figure 8. In order to not only create companies that win on the global climate tech stage, but also to facilitate continued and perpetual climate tech innovation, New Zealand’s ecosystem of government, research, and private sector actors will need to coordinate efforts to identify differentiated New Zealand value chains and actively promote them to overseas demand owners. Furthermore, through these engagements, global demand owners’ goals and needs should be internalised in New Zealand’s national climate tech innovation targets and coordinated efforts. Examples may be consortiums of companies, universities, and investors, that seek to solve a given industry’s global emissions challenges, or a system of pilot testing locations that not only engage multinationals but offer leadership roles in determining targets and standards of pilots.
Figure 7: Value Chain Dependencies and Potential Shifts in Priorities
CONTENTS

16
July 2021NEW ZEALAND CLIMATE TECH FOR THE WORLD
New Zealand agricultural products and practices have achieved global renown. The industry is the bedrock of New Zealand’s export strategy, as well as a key testing ground for new technologies in the country. Agricultural products accounted for 70% of New Zealand’s total merchandise exports in 2014, horticulture alone accounted for 10.3%.52
New Zealand holds critical competitive geographic advantages in maintaining its position as an agriculture supplier, largely down to key geographical factors:
■ Dual-seasonal dynamic – Production during Northern hemisphere off-season gives innovators an opportunity to test and pilot technologies nearly year-round.
■ Proximity to key Asian export markets.
New Zealand is home to more than 950 agricultural technology firms, primarily comprised of growth and harvesting technology (29%), data solutions (26%), and animal and crop health (22%).7
■ The top 20 New Zealand agritech firms generated $1.4 billion in revenue in 2019, with revenues growing at a 6.3% 5-year CAGR.7
■ New Zealand exports approximately $1.2 billion of agritech annually ($800 million by top 20 firms).7
■ Government estimates posit that better uptake of new agritech could be worth $17 billion for New Zealand farms; $9.8 billion increase in output, $7.3 billion increase in exports.7
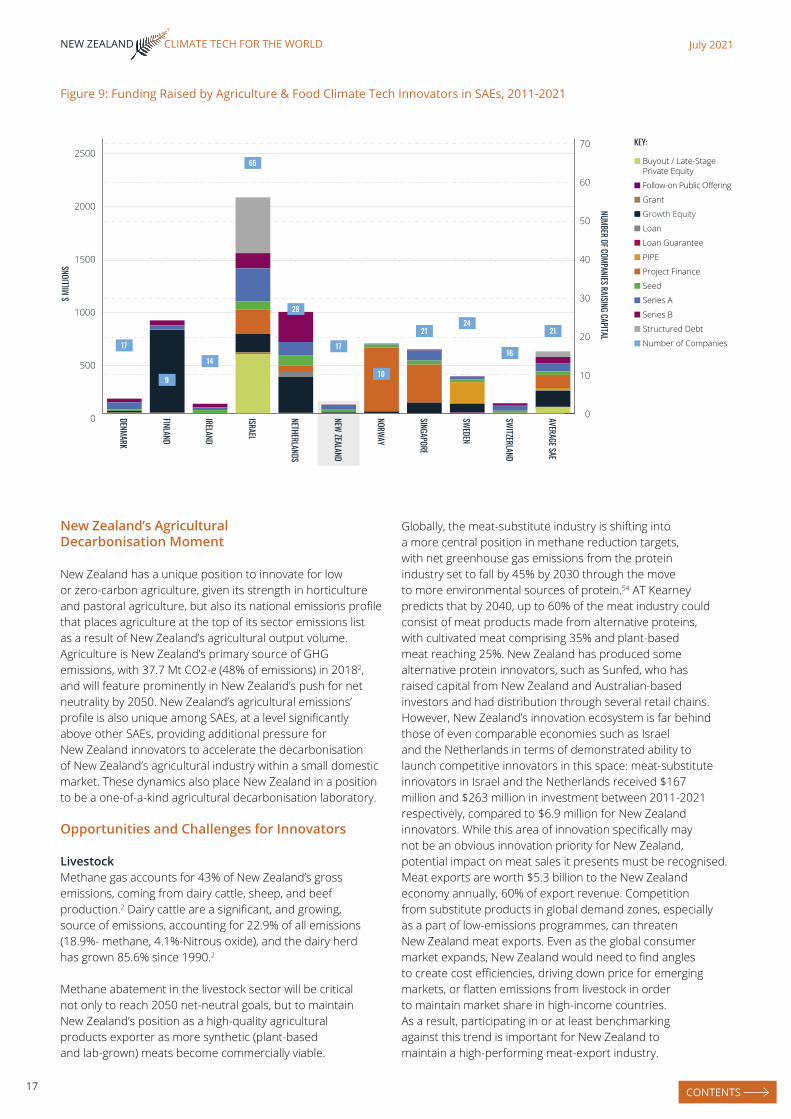
However, in the most innovative pockets of agricultural technology, New Zealand innovators have received considerably less investment than its SAE counterparts. For example, Figure 9 below shows that while New Zealand has had approximately an average (amongst SAEs) number of innovators accessing financing, the amounts of investment received is significantly less than in other SAEs. This observation was echoed in a separate study from Hon. Phil Twyford (Minister for Economic Development) which stated concerns that despite New Zealand’s strong position in agricultural innovation, it lacks a superstar billion-dollar agritech firm.
Co-ordinated Innovation Promotion:• Catalogued value chain approaches to promote groups of New Zealand technologies that solve larger percentages of demand owners needs
• Innovation outposts that keep overseas demand owners updated on New Zealand innovation, promote innovators, carry outmatchmaking support
Demand-led Innovation Engagement:• Steering roles on technology consortiums, committees• Information flow on emissions reduction targets and technology gaps
• Co-financed initiatives for applied research and pilots• Innovation ‘sensors’ that track New Zealand technology developments and engage with promisisng innovators• Pilot programs, accelerator programs extended to New Zealand
GLOBALCORPORATIONS
NEW ZEALANDPRIVATE SECTOR
(Investors andCompanies)
GLOBALINVESTORS
NEW ZEALANDRESEARCHINSTITUTES
NEW ZEALANDGOVERNMENT
Co-financedinvestment and
pilot testing funds
Co-financedinvestment and
pilot testing funds
Figure 8: Virtuous Cycle of a Sustained, Coordinated Approach to Cleantech Innovation Promotion
Leading the Way in Low-Emissions Agriculture
CONTENTS
17
July 2021NEW ZEALAND CLIMATE TECH FOR THE WORLD
Figure 9: Funding Raised by Agriculture & Food Climate Tech Innovators in SAEs, 2011-2021
New Zealand’s Agricultural Decarbonisation Moment
New Zealand has a unique position to innovate for low or zero-carbon agriculture, given its strength in horticulture and pastoral agriculture, but also its national emissions profile that places agriculture at the top of its sector emissions list as a result of New Zealand’s agricultural output volume. Agriculture is New Zealand’s primary source of GHG emissions, with 37.7 Mt CO2-e (48% of emissions) in 20182, and will feature prominently in New Zealand’s push for net neutrality by 2050. New Zealand’s agricultural emissions’ profile is also unique among SAEs, at a level significantly above other SAEs, providing additional pressure for New Zealand innovators to accelerate the decarbonisation of New Zealand’s agricultural industry within a small domestic market. These dynamics also place New Zealand in a position to be a one-of-a-kind agricultural decarbonisation laboratory.
Opportunities and Challenges for Innovators
LivestockMethane gas accounts for 43% of New Zealand’s gross emissions, coming from dairy cattle, sheep, and beef production.2 Dairy cattle are a significant, and growing, source of emissions, accounting for 22.9% of all emissions (18.9%- methane, 4.1%-Nitrous oxide), and the dairy herd has grown 85.6% since 1990.2
Methane abatement in the livestock sector will be critical not only to reach 2050 net-neutral goals, but to maintain New Zealand’s position as a high-quality agricultural products exporter as more synthetic (plant-based and lab-grown) meats become commercially viable.
Globally, the meat-substitute industry is shifting into a more central position in methane reduction targets, with net greenhouse gas emissions from the protein industry set to fall by 45% by 2030 through the move to more environmental sources of protein.54 AT Kearney predicts that by 2040, up to 60% of the meat industry could consist of meat products made from alternative proteins, with cultivated meat comprising 35% and plant-based meat reaching 25%. New Zealand has produced some alternative protein innovators, such as Sunfed, who has raised capital from New Zealand and Australian-based investors and had distribution through several retail chains. However, New Zealand’s innovation ecosystem is far behind those of even comparable economies such as Israel and the Netherlands in terms of demonstrated ability to launch competitive innovators in this space: meat-substitute innovators in Israel and the Netherlands received $167 million and $263 million in investment between 2011-2021 respectively, compared to $6.9 million for New Zealand innovators. While this area of innovation specifically may not be an obvious innovation priority for New Zealand, potential impact on meat sales it presents must be recognised. Meat exports are worth $5.3 billion to the New Zealand economy annually, 60% of export revenue. Competition from substitute products in global demand zones, especially as a part of low-emissions programmes, can threaten New Zealand meat exports. Even as the global consumer market expands, New Zealand would need to find angles to create cost efficiencies, driving down price for emerging markets, or flatten emissions from livestock in order to maintain market share in high-income countries. As a result, participating in or at least benchmarking against this trend is important for New Zealand to maintain a high-performing meat-export industry.
0
500
1000
1500
2000
2500
DENMARK
$ MILL
IONS
NUMBER OF COMPANIES RAISING CAPITAL
0
10
20
30
40
50
60
70
FINLAND
IRELAND
ISRAEL
NETHERLANDS
NEW ZEALAND
NORWAY
SINGAPORE
SWEDEN
SWITZERLAND
AVERAGE SAE
17
9
14
65
28
17
10
2124
16
21
■ Buyout / Late-Stage Private Equity
KEY:
■ Follow-on Public Offering
■ Loan Guarantee
■ PIPE
■ Project Finance
■ Seed
■ Series A
■ Series B
■ Structured Debt
■ Number of Companies
■ Grant
■ Growth Equity
■ Loan
CONTENTS
18
July 2021NEW ZEALAND CLIMATE TECH FOR THE WORLD
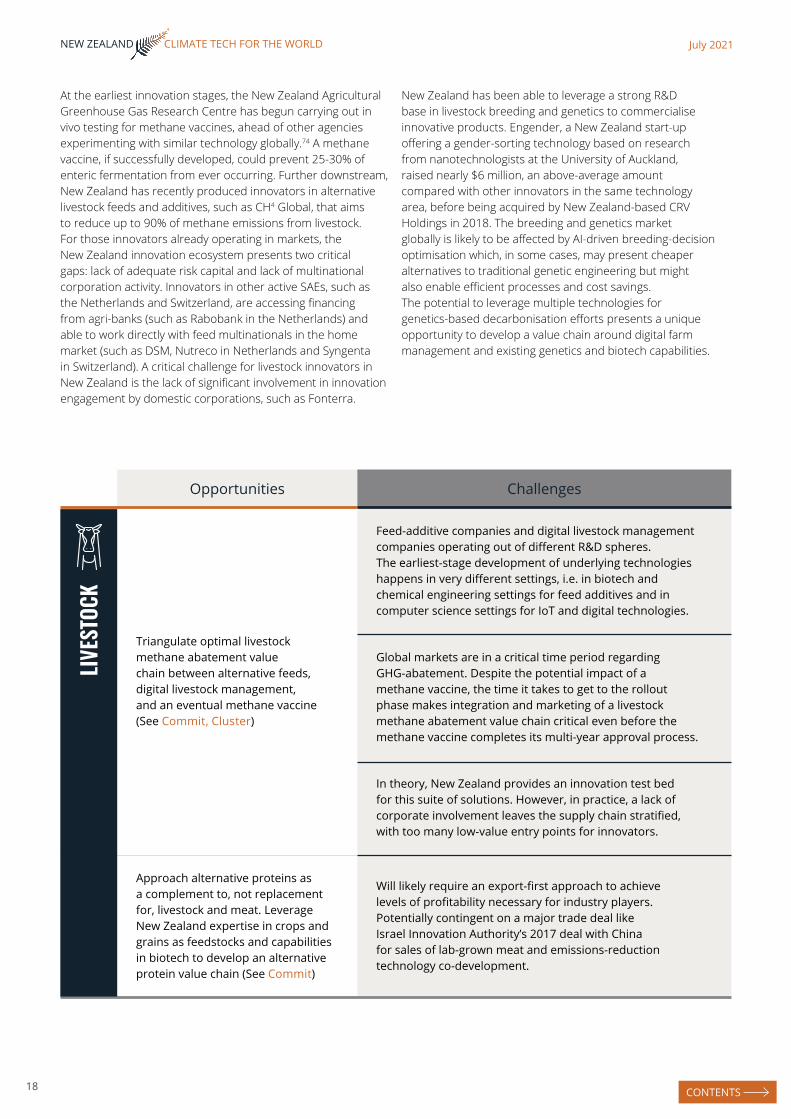
At the earliest innovation stages, the New Zealand Agricultural Greenhouse Gas Research Centre has begun carrying out in vivo testing for methane vaccines, ahead of other agencies experimenting with similar technology globally.74 A methane vaccine, if successfully developed, could prevent 25-30% of enteric fermentation from ever occurring. Further downstream, New Zealand has recently produced innovators in alternative livestock feeds and additives, such as CH4 Global, that aims to reduce up to 90% of methane emissions from livestock. For those innovators already operating in markets, the New Zealand innovation ecosystem presents two critical gaps: lack of adequate risk capital and lack of multinational corporation activity. Innovators in other active SAEs, such as the Netherlands and Switzerland, are accessing financing from agri-banks (such as Rabobank in the Netherlands) and able to work directly with feed multinationals in the home market (such as DSM, Nutreco in Netherlands and Syngenta in Switzerland). A critical challenge for livestock innovators in New Zealand is the lack of significant involvement in innovation engagement by domestic corporations, such as Fonterra.
Opportunities Challenges
Triangulate optimal livestock methane abatement value chain between alternative feeds, digital livestock management, and an eventual methane vaccine (See Commit, Cluster)
Feed-additive companies and digital livestock management companies operating out of different R&D spheres. The earliest-stage development of underlying technologies happens in very different settings, i.e. in biotech and chemical engineering settings for feed additives and in computer science settings for IoT and digital technologies.
Global markets are in a critical time period regarding GHG-abatement. Despite the potential impact of a methane vaccine, the time it takes to get to the rollout phase makes integration and marketing of a livestock methane abatement value chain critical even before the methane vaccine completes its multi-year approval process.
In theory, New Zealand provides an innovation test bed for this suite of solutions. However, in practice, a lack of corporate involvement leaves the supply chain stratified, with too many low-value entry points for innovators.
Approach alternative proteins as a complement to, not replacement for, livestock and meat. Leverage New Zealand expertise in crops and grains as feedstocks and capabilities in biotech to develop an alternative protein value chain (See Commit)
Will likely require an export-first approach to achieve levels of profitability necessary for industry players. Potentially contingent on a major trade deal like Israel Innovation Authority’s 2017 deal with China for sales of lab-grown meat and emissions-reduction technology co-development.
New Zealand has been able to leverage a strong R&D base in livestock breeding and genetics to commercialise innovative products. Engender, a New Zealand start-up offering a gender-sorting technology based on research from nanotechnologists at the University of Auckland, raised nearly $6 million, an above-average amount compared with other innovators in the same technology area, before being acquired by New Zealand-based CRV Holdings in 2018. The breeding and genetics market globally is likely to be affected by AI-driven breeding-decision optimisation which, in some cases, may present cheaper alternatives to traditional genetic engineering but might also enable efficient processes and cost savings. The potential to leverage multiple technologies for genetics-based decarbonisation efforts presents a unique opportunity to develop a value chain around digital farm management and existing genetics and biotech capabilities.
LIVES
TOCK
CONTENTS

19
July 2021NEW ZEALAND CLIMATE TECH FOR THE WORLD
Agricultural Digitalisation
The ubiquity of artificial intelligence (AI), cloud computing, robotics, and drones are bringing about a wave of agricultural technology solutions with safety enhancing, loss-preventing, and cost- reducing capabilities in agricultural innovation clusters, such as the California Bay Area, Boston, Israel, and Switzerland. New Zealand is competing, too in agricultural robotics, livestock monitoring, and enabling software (device interoperability systems, cloud data analysis, signals processing, etc.). Within SAEs, Israel has been the leader regarding growth of innovative start-ups in digital agriculture. However, New Zealand innovators in agricultural digitalisation have raised funds at a level comparable to that of the SAE average.
In addition to having a domestic market with potential to gain traction, New Zealand has plenty of technical talent waiting in the wings to support growth in this area. In fact, New Zealand developers scored highest of 120 countries on a global coding proficiency assessment in 2019. In 2019 there were 8,605 full-time computer science and IT students in New Zealand universities.14
Globally, uptake of agricultural digitalisation technologies is likely still only at the beginning of an upward-facing trend, with labor shortages still reported as a challenge for farmers (55% of farmers surveyed in California reported experiencing labor shortages even before the Covid-19 pandemic). Additionally, the prices of underlying digitalisation components (data storage, cameras, sensors, signal processors) dropping year-by-year and the cost of data acquisition dropping as more providers of satellite and drone-generated imagery enter the market.35
Taking advantage of trends will involve getting the attention of corporations early, and for innovators, especially in New Zealand, to look beyond their own borders for corporate participation in financing rounds and pilot tests. An early example is that of Robotics Plus, which, in 2018, raised $10 million in seed funding all from Japanese Yamaha Motor, a capital raise similar to seed and Series A rounds of comparable international agricultural robotics companies. Important to this example is Robotics Plus’s relationship with Global Pac Technologies, which has helped it achieve distribution throughout New Zealand, Australia, and the US. Patterns of innovation around agricultural robotics tend to place innovators in key robotics clusters (e.g. California, Massachusetts, Switzerland) and serving nearby local agricultural production markets. As a result, there is not a clear centre of global export for agricultural robotics, and New Zealand innovators will have to engage with international financiers and corporates early on to be able to compete in other innovators’ home markets.
Figure 10: Funding Raised by Agricultural Digitalisation (robotics, software, drones) Innovators in SAEs, 2011-2021
Funding Raised by Agricultural Digitalisation Innovators in SAEs, 2011-2021 (excluding Israel)
DENMARK
FINLAND
IRELAND
ISRAEL
NETHERLANDS
NEW ZEALAND
SWITZERLAND
AVERAGE SAE
0
20000
40000
60000
80000
100000
120000
$ MILL
IONS
NUMBER OF COMPANIES RAISING CAPITAL
■ Buyout / Late-Stage Private Equity
KEY:
■ Series B
■ Structured Debt
■ Number of Companies
■ Seed
■ Series A
■ Grant
■ Growth Equity
■ Project Finance
2 2
1
7
4
6
2
3
10
9
8
7
6
5
4
3
2
1
0
0
5
10
15
20
25
30
DENMARK
FINLAND
IRELAND
NETHERLANDS
NEW ZEALAND
SWITZERLAND
AVERAGE SAE
$ MILL
IONS
NUMBER OF COMPANIES RAISING CAPITAL
6
5
4
3
2
1
0
2 2
4
2
3
6
1
CONTENTS

20
July 2021NEW ZEALAND CLIMATE TECH FOR THE WORLD
Farm-management software innovation is expanding from traditional planning and workflow software to include comprehensive real-time monitoring, learning, and optimisation capabilities. Companies such as Gamaya in Switzerland are releasing drone-imaging and data-analysis products to create agricultural digitalisation stacks for customers to detect problems early and administer crop treatments with precision. This trend is likely to accelerate as more connected machines are able to make direct interventions in agriculture, such as fruit-picking robotics and crop- spraying drones. New Zealand innovators should seek out opportunities to form a unique New Zealand digitalisation stack that combines multiple solutions for planning, oversight, automation, and interventions on farms (including for livestock, through New Zealand innovators such as Halter). Value-chain integration is critical, especially to New Zealand companies who have not had large-scale adjacent industries to serve at home, the way that the Israeli drone industry has served defense customers, and the robotics industries in Switzerland and Boston have access to strong local talent markets, significant inbound talent flows to local universities and innovators generated by incumbents such as ABB and Boston Dynamics.
Opportunities Challenges
Create innovation support programmes to develop a New Zealand agriculture digitalisation stack that encompasses real-time tracking of livestock and/or crop growth, monitoring and management platforms, and precision interventions (See Cluster, Coordinate)
Lack of coordinated outbound innovation push, e.g. Swissnex in Switzerland that has made deliberate efforts to introduce Swiss drone technology into overseas markets.
Drastically different levels of investment necessary to finance software and hardware solutions. Hardware innovators in New Zealand face challenges accessing adequate financing from domestic funds.
Circulation of agricultural digitalisation technologies out of and into New Zealand through innovation outposts, i.e. find places for New Zealand innovators in foreign agricultural digitalisation value chains and vice versa (See Connect to Demand)
Attracting innovators from overseas into collaborations in New Zealand will require demonstrable engagement potential with farms’ corporations. Current momentum does not support a defensible case for this.
AGRI
CULT
URAL
DIG
ITISA
TION
NEW ZEALAND INNOVATORS SHOULD SEEK OUT OPPORTUNITIES TO FORM A UNIQUE NEW ZEALAND DIGITALISATION STACK THAT COMBINES MULTIPLE SOLUTIONS.
CONTENTS
21
July 2021NEW ZEALAND CLIMATE TECH FOR THE WORLD
Resilience and Circularity in Crops
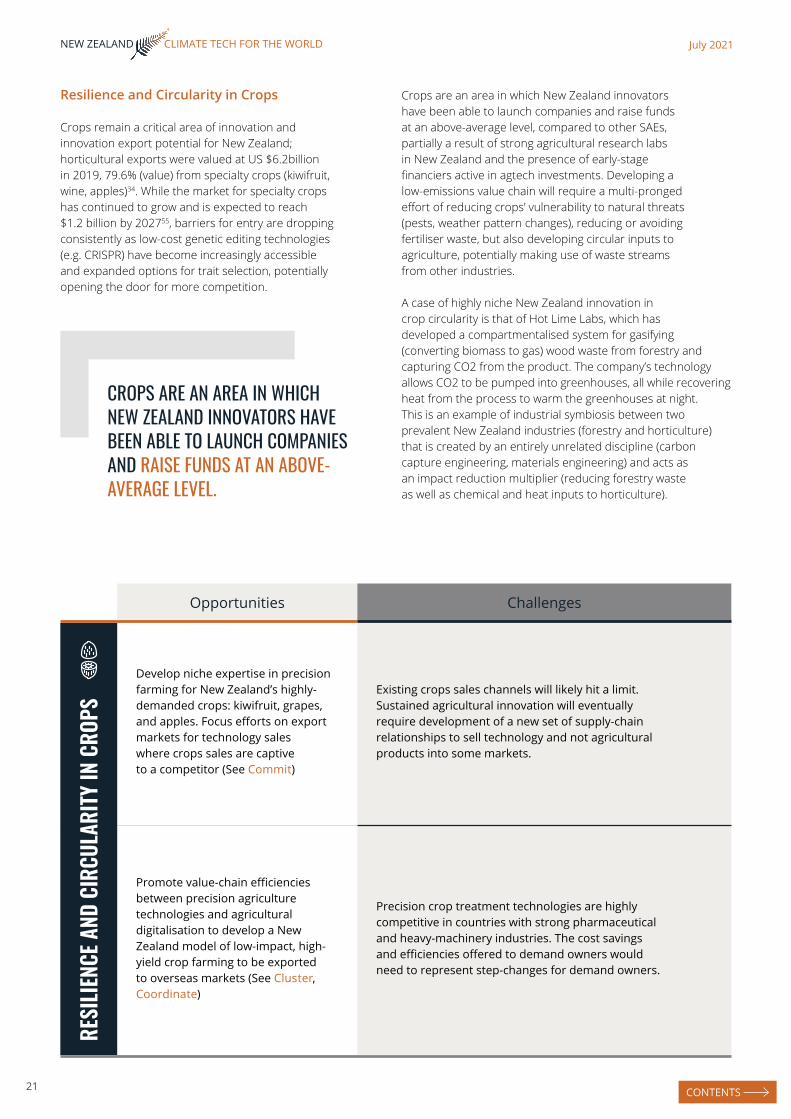
Crops remain a critical area of innovation and innovation export potential for New Zealand; horticultural exports were valued at US $6.2billion in 2019, 79.6% (value) from specialty crops (kiwifruit, wine, apples)34. While the market for specialty crops has continued to grow and is expected to reach $1.2 billion by 202755, barriers for entry are dropping consistently as low-cost genetic editing technologies (e.g. CRISPR) have become increasingly accessible and expanded options for trait selection, potentially opening the door for more competition.
Crops are an area in which New Zealand innovators have been able to launch companies and raise funds at an above-average level, compared to other SAEs, partially a result of strong agricultural research labs in New Zealand and the presence of early-stage financiers active in agtech investments. Developing a low-emissions value chain will require a multi-pronged effort of reducing crops’ vulnerability to natural threats (pests, weather pattern changes), reducing or avoiding fertiliser waste, but also developing circular inputs to agriculture, potentially making use of waste streams from other industries.
A case of highly niche New Zealand innovation in crop circularity is that of Hot Lime Labs, which has developed a compartmentalised system for gasifying (converting biomass to gas) wood waste from forestry and capturing CO2 from the product. The company’s technology allows CO2 to be pumped into greenhouses, all while recovering heat from the process to warm the greenhouses at night. This is an example of industrial symbiosis between two prevalent New Zealand industries (forestry and horticulture) that is created by an entirely unrelated discipline (carbon capture engineering, materials engineering) and acts as an impact reduction multiplier (reducing forestry waste as well as chemical and heat inputs to horticulture).
Opportunities Challenges
Develop niche expertise in precision farming for New Zealand’s highly-demanded crops: kiwifruit, grapes, and apples. Focus efforts on export markets for technology sales where crops sales are captive to a competitor (See Commit)
Existing crops sales channels will likely hit a limit. Sustained agricultural innovation will eventually require development of a new set of supply-chain relationships to sell technology and not agricultural products into some markets.
Promote value-chain efficiencies between precision agriculture technologies and agricultural digitalisation to develop a New Zealand model of low-impact, high-yield crop farming to be exported to overseas markets (See Cluster, Coordinate)
Precision crop treatment technologies are highly competitive in countries with strong pharmaceutical and heavy-machinery industries. The cost savings and efficiencies offered to demand owners would need to represent step-changes for demand owners.
RESIL
IENCE
AND
CIRC
ULAR
ITY IN
CROP
S
CROPS ARE AN AREA IN WHICH NEW ZEALAND INNOVATORS HAVE BEEN ABLE TO LAUNCH COMPANIES AND RAISE FUNDS AT AN ABOVE- AVERAGE LEVEL.
CONTENTS

22
July 2021NEW ZEALAND CLIMATE TECH FOR THE WORLD
Suggestions for the Agriculture & Food innovation ecosystem
■ Launch New Zealand agritech innovation outposts in key global markets – these outposts should be tasked with both observing and promoting innovative agricultural technologies (Connect to Demand)
- New Zealand innovation outposts should be in regions with significant demand ownership and innovation supply, such as the California Bay Area, ShenZhen (China), the Netherlands, and Israel.
- New Zealand agritech should be promoted alongside agricultural products where markets are receptive, but separate promotion efforts should be made for technology irrespective of New Zealand agricultural exports’ place in the deal.
- The innovation outpost should actively engage agritech innovators in overseas markets in order to a) feed observations on agritech capabilities overseas back to New Zealand innovation agencies and b) identify collaboration and value-chain integration opportunities with overseas innovators (e.g. Japan’s JETRO efforts to coordinate Japanese corporate innovation outposts in Silicon Valley).
- Teams in outposts should be tasked with identifying co-financing and technology-development programme opportunities with states and regions that are similarly supporting agritech, i.e. do not seek to replicate, but to plug innovators into innovation ecosystems where possible (e.g. the EU’s Startup Europe Comes to Israel, and Low Carbon Business Action Canada). Create a specialised entity for agricultural digitalisation – over and above supporting existing programmes, such as Callaghan Innovation’s Horticulture Automation Catalyst – form larger-scale entity with ability to support both innovation and connection to demand (Commit, Coordinate)
- Task the entity with creating an agricultural digitalisation plan that involves setting targets for cost, process, and resource efficiency, and support innovators with ability to reach those metrics.
- Create a panel of advisors by actively seeking input of major global agricultural demand owners, and pulling in corporations and large groups of farms to support the entity.
- Offer robust corporate participation opportunities, such as public-private research opportunities, financed project pilots. Foster competition between innovators within the entity and do not favour domestic corporations over overseas options.
- Aim to create a catalogue of digital solutions for agriculture developed in New Zealand, and compatible with digital infrastructure (sensors systems, cloud platforms) globally, that can be actively promoted to demand-owning countries systematically.
- Work with a similar innovative region that has a comparable interest in advancing supply and accelerating demand for agricultural digitalisation technologies to raise an investment fund that supports underlying technologies (e.g. the Israel-Colorado Innovation Fund that finances artificial intelligence for water, agriculture, energy, and circular economy).
■ Create intentional programme for adjusting to the rise of alternative proteins – pursue low and zero-emissions agricultural processes to circumvent export markets’ concerns over emissions content (Commit, Cluster)
■ Include genetics and livestock-management innovators in methane-reduction programmes Market the New Zealand ecosystem as a development zone for multinationals and global corporations to test their low-emissions agriculture innovations (especially around livestock) and later ‘import the New Zealand model back to their home countries.
- Consider how the methane-abatement ecosystem model can support development of a future market for methane vaccines, i.e. help other markets develop enough momentum so that the methane vaccine is relevant as one of the final steps to livestock methane abatement.PURSUE LOW AND ZERO-EMISSIONS
AGRICULTURAL PROCESSES TO CIRCUMVENT EXPORT MARKETS’ CONCERNS.
CONTENTS
23
July 2021NEW ZEALAND CLIMATE TECH FOR THE WORLD
Critical to New Zealand’s success in progressing toward a net-zero carbon target has been its significant carbon abatement in the energy sector, New Zealand’s second- largest source of emissions, with 31.9 Mt CO2-e (41% of emissions) in 2018.2 New Zealand has achieved 85% completion of its 2035 target to derive all electricity from renewable sources, geothermal (17%) and hydroelectric power (60%) account for most renewables deployed.4 At the same time, New Zealand is among the most energy-intensive OECD economies.63 Energy-related emissions are rising, driven by increasing energy use and automobile transport.64 The large proportion of hydroelectric generation means the production is dependent on fossil-fuel substitutes in times of drought.64
Energy usage is a component of nearly every industrial process and economic activity, so developing a comprehensive and exportable climate tech value chain will require some level of emphasis on energy innovation in New Zealand. Although many of New Zealand’s current innovation activities in energy have received a recommendation of “Evaluate” or “Explore” in this analysis (see Figure 7), leveraging the right synergies between multiple innovation activities may open space for better problem-solving capabilities.
New Zealand’s access to unique energy sources (namely geothermal and hydroelectric) enable it to develop novel models of energy innovation, as well as innovation in industrial sectors able to capitalise on this access. Likewise, New Zealand’s innovation ecosystem can differentiate itself based on niche approaches to leveraging geothermal for the build-up of low-emissions micro-economies, systems of local industries and companies that collaborate in an industrial symbiosis model.
Making New Zealand energy and materials innovation successful on the global stage will, again, involve developing a value-chain approach to improving innovators’ potential to grow at home and promoting them overseas, once matured to a stage that allows for mass scaling.
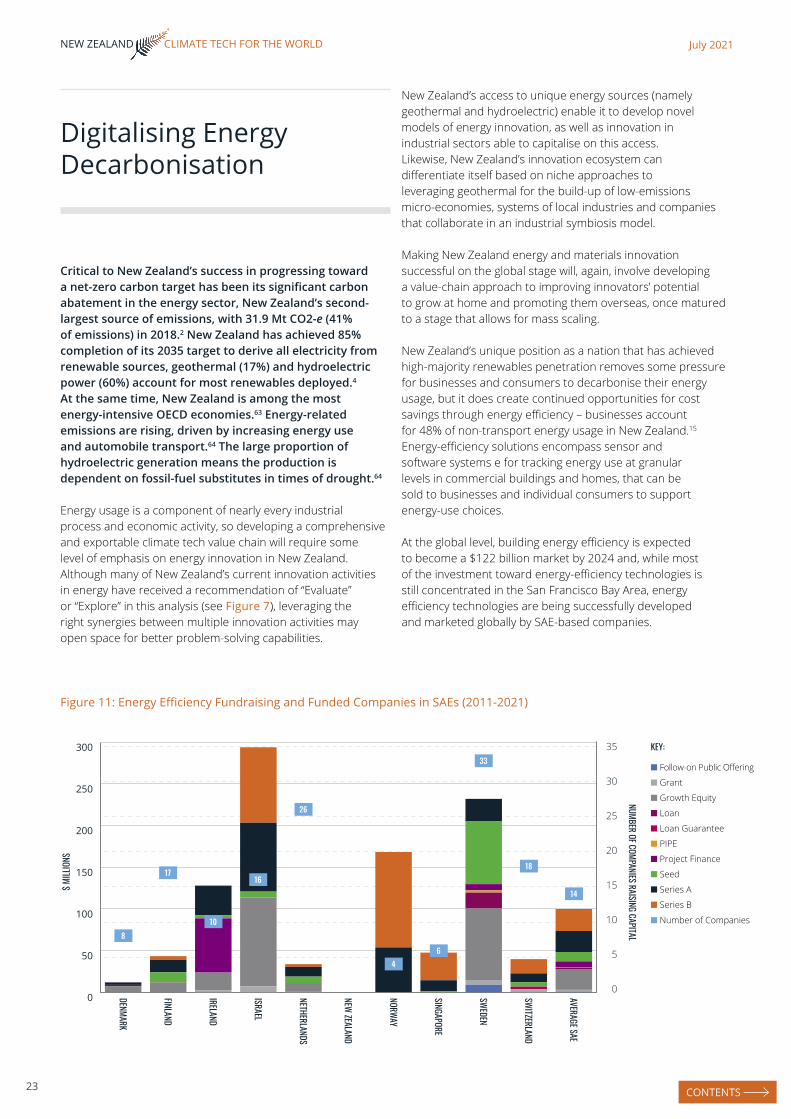
New Zealand’s unique position as a nation that has achieved high-majority renewables penetration removes some pressure for businesses and consumers to decarbonise their energy usage, but it does create continued opportunities for cost savings through energy efficiency – businesses account for 48% of non-transport energy usage in New Zealand.15 Energy-efficiency solutions encompass sensor and software systems e for tracking energy use at granular levels in commercial buildings and homes, that can be sold to businesses and individual consumers to support energy-use choices.
At the global level, building energy efficiency is expected to become a $122 billion market by 2024 and, while most of the investment toward energy-efficiency technologies is still concentrated in the San Francisco Bay Area, energy efficiency technologies are being successfully developed and marketed globally by SAE-based companies.
Figure 11: Energy Efficiency Fundraising and Funded Companies in SAEs (2011-2021)
0
5
10
15
20
25
30
35
■ Follow-on Public Offering
■ Loan Guarantee
■ PIPE
■ Project Finance
■ Seed
■ Series A
■ Series B
■ Grant
■ Growth Equity
■ Loan
0
50
100
150
200
250
300
DENMARK
FINLAND
IRELAND
NETHERLANDS
ISRAEL
NEW ZEALAND
SWITZERLAND
SWEDEN
SINGAPORE
NORWAY
AVERAGE SAE
$ MILL
IONS
KEY:
NUMBER OF COMPANIES RAISING CAPITAL
■ Number of Companies
8
17
10
16
26
46
33
18
14
Digitalising Energy Decarbonisation
CONTENTS

24
July 2021NEW ZEALAND CLIMATE TECH FOR THE WORLD
New Zealand has seen some initial activity from power companies and corporates in the energy-efficiency innovation ecosystem, for example Lightning Lab Electric support from General Electric, Westpac, and Genesis Energy.5 But is noticeably absent among peer SAEs regarding companies receiving investment in the sector.
An instructive case lies with the example of Israel, which leveraged strengths in adjacent technologies but has also taken a coordinated approach to connecting Israeli energy efficiency technology to key markets. While Israel has a significant hardware and especially sensor development base to build an energy efficiency industry off, software has played a pivotal role in the industry’s development as well: over $300 million was raised by 60 Israeli energy efficiency companies since 2011, with $157 million from 23 companies in software. While to some level, clustering the development of these multiple technology components together is creating success for the overall industry, the Israel Export & International Cooperation Institute and Ministry of Economy collaborated in 2019 to create the “Israeli Innovation for Energy Transition 2019” catalogue of innovators. Through this catalogue, the two departments built a diverse offering of Israeli technology solutions to energy efficiency problems, that could not only be engaged directly by a demand owner, but could be put together, forming a cohesive suite of technologies to enable an energy efficiency step-change. A mix of local market
(commercial developments – Phoebus Energy) and international customers (McDonald’s, Sprint, IBM – Panoramic Power) have engaged Israeli energy efficiency start-ups for technology solutions, and multinational collaboration with Israel Electric Corporation has yielded energy efficiency spin-outs (e.g. Fsight). A result of this dynamic is that Israeli innovators can create products for the global market through the local ecosystem, and the industry has potential to be sustained long-term by continued launch of new innovators out of R&D pipelines and corporate spin-outs.
An additional energy-efficiency market is the consumer smart home efficiency market. New Zealand enjoys a high penetration of renewables (~85%6) and high level of smart meter uptake in New Zealand homes (estimated 70-90%5), and while the global market for home energy efficiency is much smaller than that of commercial energy efficiency, there are technological approaches that can be carried over from the home energy efficiency market.
Sweden has successfully marketed its home-grown smart-home energy solutions to neighboring markets. Swedish start-up Eliq, for example, entered the Norwegian market through a collaboration with Innlandskraft, and into the UK with Bristol Energy. Like New Zealand, Sweden has a high penetration of renewable energy (54%) in homes, Sweden has leveraged adjacent capabilities in microgrids and district heating
Opportunities Challenges
Develop a value chain around green digital finance, including microloans and digital payments systems that allow customers to deploy a suite of resource-use reduction and impact tracking products to networks of users (See Commit, Cluster)
Business models for energy efficiency and personal emissions tracking require strong networking effects and channels tend to exist through corporations (power suppliers, real estate companies, banks).
Integrate with resource-specific and industry-specific technologies (see industrial symbiosis) to form high-value energy efficiency hardware and software stacks in niches (See Coordinate).
Target markets overseas will have significantly larger markets and New Zealand innovators will still likely need to compete for the niches.
If an agricultural digitalisation value chain is pursued, there would be opportunities to serve energy efficiency customers along the agriculture supply chain, strengthening the New Zealand agricultural digitalisation suite of solutions (See Commit, Cluster, Coordinate).
Energy efficiency companies will undoubtedly compete with some aspects of agricultural software companies’ energy use reduction value proposition.
DIGI
TALIS
ING
DECA
RBON
ISATIO
N
CONTENTS
25
July 2021NEW ZEALAND CLIMATE TECH FOR THE WORLD
to create a baseline market for home energy efficiency, with a “prosumer” higher-end class that innovators of new technologies can market to.
Although operating in a much larger home market, the US State of Colorado offers an example of how to build an energy efficiency ecosystem outside of a major software hub. As the home to National Renewable Energy Laboratory (NREL) and Rocky Mountain Institute (RMI), Colorado serves as the de facto energy transition research capital of the US. These national labs serve as a magnet for talent and R&D commercialisation (e.g. NREL IN2 incubator residential housing innovation programme). Efficiency is being addressed by innovation at all levels, including investments of nearly $2 million invested into university energy efficiency engineering programs in Colorado Office of Energy Efficiency & Renewable Energy3, a multi-layered ecosystem of energy efficiency innovation can be observed in Colorado. Nationwide, US power companies and global energy- service corporations are purchasing technology solutions and forming partnerships with Colorado-based innovators and, perhaps more significantly, Colorado energy efficiency companies have grown large enough to carry out regional mergers and acquisitions (e.g. Tendril and Simple Energy merger into Uplight).
New Zealand has seen some initial traction in digital entrepreneurs solving problems for overseas customers through personal emissions tracking software products. New Zealand innovator CoGo (Connecting Good) has signed up 20,000 customers to their carbon footprint tracker and are prepared to roll out the solution to hundreds of thousands of New Zealand-based customers, through a partnership with Westpac NZ. CoGo has crossed the difficult threshold of addressing international consumer carbon footprint tracking needs through a partnership with Natwest in the UK, along with research and talent partnerships with University of Leeds and University of Lancaster for long-term growth in the UK.
Potential New Zealand advantages in this segment lie in a growing workforce of computer scientists. However, significant difficulties lie in the relatively small size of the domestic market and lack of major financial/retail incumbents. Any long-term success in this sector will require innovators to be able to plug into a broader fintech ecosystem and have access to a talent pipeline skilled in launching and managing large software companies.
Suggestions for New Zealand’s Energy Efficiency and Carbon-tracking Ecosystem
■ Work to concentrate development of energy digitalisation around New Zealand’s centres of R&D expertise– the energy transition cluster in Colorado has been developed mostly around the gravitational pull of NREL and RMI but now is dynamic enough that start-ups can launch, raise funds, grow, and, in some cases, even be acquired in Colorado. (Cluster)
■ Most of the world has not achieved the same level of renewables penetration as New Zealand, New Zealand innovators should be encouraged to pursue opportunities to carry out pilot tests and experiment with data from overseas customer bases where energy costs for customers may be a more pronounced pain point. (Coordinate, Connect to Demand)
■ New Zealand is an ideal testing location for energy-efficiency companies that want to experiment with ‘top-of-the-pyramid’ energy efficiency and personal carbon-reduction customers, i.e. those customers with enough capital and motivation to address their hardest- to-abate carbon emitting activities. This applies to both business-to-business and business-to-consumer innovators that want to perfect digital solutions for “post-net zero” economies. (Coordinate)
■ Like Israel’s capitalisation on the sensors and tech hardware advantage to pursue energy efficiency technology, consider areas in which New Zealand innovators have potential to solve energy issues (e.g. geothermal innovation, agricultural industrial symbiosis) and direct energy efficiency or emissions digitalisation to those sectors best addressed by adjacent New Zealand innovations. (Commit, Cluster, Coordinate)
■ Digital uptake is most likely to occur in areas of supply chains that are already technology-enabled. As a result, innovators will have more receptive home-market customers in geographical areas already engaging digitalisation. A dynamic digitalisation ecosystem may be built around agriculture, using the operational efficiency technologies discussed in Agricultural Digitalisation above, but also complementing these with agriculture-focused energy efficiency solutions for agricultural facilities and digital finance products for farmers. (Commit, Cluster)
POTENTIAL NEW ZEALAND ADVANTAGES IN THIS SEGMENT LIE IN A GROWING WORKFORCE OF COMPUTER SCIENTISTS.
CONTENTS

26
July 2021NEW ZEALAND CLIMATE TECH FOR THE WORLD
Capitalising on Circularity in Energy and Materials
Central to innovating for sustainability is maintaining an underlying principle that by-products are better re-used, or never created, than managed. As a result, many of the sustainability technology fields with the most significant global uptake are predicated on business models that off-take (receive) resources from one business and make use of them elsewhere.
While New Zealand does not have the heavy industrial and corporate ecosystems out of which innovation ecosystems typically tend to emerge, New Zealand does have the unique advantage of being able to access geographically-limited sources of renewable energy such as geothermal and hydroelectric power. New Zealand also has strengths in operating natural resource-dependent industries, such as forestry and agriculture. With the emergence of innovators in waste-to-value concepts as well, there is a case to be made to embrace industrial symbiosis in New Zealand as an enhancement not just to local industries but also to sustainability innovators.
Industrial symbiosis is a concept pioneered in the late 1970’s by the city of Kalundborg, Denmark, in which a systematic network of heat, water, energy, and materials exchanges are facilitated across dozens of businesses for a circular industrial cluster. Industrial symbiosis concepts have sprung up around the world since, with notable presence in SAEs aiming to leverage unique local resources, such as the Norrköping Industrial Symbiosis Network in Sweden built around an E-On combined heat and power plant and Svensk Biogas plant and the HS Orka Resource Park, centered around a geothermal resource, in Iceland. New Zealand, too, is innovating in industrial symbiosis, leveraging resources such as biomass from wood processing and geothermal at Kawerau in the Central North Island of New Zealand.66 A similar concept of energy asset repurposing is currently the subject of a $2 million feasibility study between Meridian and Contact Energy: the two companies are exploring potential for a hydrogen production facility as an off-taker of hydropower once the Tiwai Point aluminum smelter on the South Island comes offline.268
GeothermalNew Zealand has reached 85% of its 2035 target to derive all electricity from renewable sources, chiefly using geothermal (17%) and hydroelectric power (60%).4 Energy-generation innovators typically expand primarily through partnerships with utilities, power companies, and energy service companies (ESCOs), but geothermal energy’s geographic restrictions also often requires that innovators form partnerships in industrial value chains as well.
New Zealand innovator Geo40 is an example of an innovator that presents both operational efficiencies and resource circularity to clients – recovering silica from geothermal reinjection fluid for reduced operational expenses and selling the silica by-products on international markets. Geo40 has partnered at different levels of the value chain with international companies, including with leading Swedish innovator Climeon to improve the cost-effectiveness and emissions-reduction properties of Climeon’s Heat Power Modules. Miraka, a Māori-owned firm in New Zealand’s central North Island, processes up to 250 million litres of milk per year using geothermal energy. Both companies are examples of the potential to maximise circularity within New Zealand’s energy industry, but also in adjacent industries, and build a unique operating advantage around geothermal resources as a production asset.
Wastewater TreatmentWastewater treatment, one of the turnkey segments in the industrial symbiosis technology stack, is driven by innovations that reduce energy usage, discharges, and materials usage. In other words, wastewater treatment innovation requires multidisciplinary technology innovation to achieve the step-change process efficiencies and capacity expansion that demand owners need, and with the complexity to address increasingly challenging water scarcity issues. Despite being considered a ‘water-rich’ nation, New Zealand has already seen global uptake of some of its wastewater treatment innovations. For example, Derecto, a New Zealand energy management for wastewater innovator, was acquired by Suez Environmental (France) in 2014, and Auckland-based osmotic technology innovator, Aquafortus, announced a 2020 joint venture with Warren Buffet-backed Pilot Corporation to deploy its technology in the US oil and gas sectors.
Globally, wastewater treatment is estimated to have a market size of $54.6 billion globally, and continue growing at 6.1% through 2045, driven in large part by the compounding issues of increased water scarcity and commitments by corporations to reduce energy use.67
Given the integrated nature of wastewater treatment (existing as a component in larger municipal or industrial processes), value-chain efficiencies are critical, and examples can be drawn from other SAEs that have been able to significantly scale wastewater treatment innovation beyond their borders. Sweden, for example, has a long history of operating wastewater treatment systems, dating back to the 1930s, and continues to fund specialised research in wastewater treatment, through the Sweden Royal Institute of Technology. Swedish innovators have cropped up across the supply chain; in technologies for electrochemical water treatment (Stockholm Water Technology), digital water-saving technologies (Aqua Robur, Xylem), and consumer-facing devices (Orbital Altered). There are also coordinated efforts by the Swedish government to promote Swedish wastewater treatment technologies to the rest of the world through Swedish Cleantech, a state-funded export platform that is a part of Smart City Sweden. The Swedish Cleantech portal contains a list of 146
CONTENTS

27
July 2021NEW ZEALAND CLIMATE TECH FOR THE WORLD
Swedish water and wastewater innovators, with functions to directly contact the company. In addition, the agency regularly hosts technical delegations to actively promote innovators to overseas demand owners.
Israel is a leading example of a country that has transformed itself from a water-stressed nation to a water management innovation powerhouse, reusing almost 90% of its wastewater. Since 2000, the Israeli government has invested more than $750 million into centralised water reclamation, spurring a domestic industry.68 Much of the country’s water management is centralised with national water company, Mekerot. Mekerot actively seeks the participation of innovators in its projects, collaborating directly with digital water management and quality testing start-ups as well as working with Microsoft Startups for Israel to open an accelerator and establish conduits into real-world testing for innovators.69 Israel’s wastewater innovation ecosystem has seen more than $1.4 billion worth of transactions since 2011, between Israeli demand owners and Israeli start-ups, innovators and global demand owners, and between overseas innovators and Israeli demand owners (e.g. Israel Chemicals Limited aka ICL and Swedish wastewater treatment innovator Tiami). Israel has transformed itself into both a testbed and launchpad for wastewater treatment innovators, domestic and foreign, that seeks to solve challenges associated with creating leading-edge solutions. Israel has also focused on forging direct connections with global demand and supply hubs, for example with Colorado through the Israel Colorado Innovation Fund with Innosphere Ventures, the fund invests in technology for water, agriculture, industry 4.0, and transportation.
Waste-to-value While data from the World Bank suggests New Zealand may be a substantial waste producer (as a ratio to GDP size269), the level of industrial waste streams are not well understood due to a lack of data.61 However, local industries such as steelmaking, aluminum manufacturing, and mining are all sources of feedstock for waste-to-value initiatives. In Auckland, construction and demolition waste is estimated to make up around 40% of all waste going to landfill.65 Moreover, the primary means of waste disposal is landfill, and these are significant sources of GHG emissions, despite the use of gas capture systems.65
Emissions from manufacturing industries and construction accounted for just under 18% total New Zealand emissions in 2018.56 Industrial waste streams from these sectors provide feedstock for waste-to-value initiatives including carbon capture and use (CCU), capturing carbon at point source from industrial processes, and mineral recovery. Partnerships with waste stream owners are vital to secure supply in this area.
On the demand side, the level of success differs by type of usage. The construction industry is slow to adapt, which provides a challenge for innovations such as cement and concrete substitutes. On the other hand, minerals and advanced composite or nanotech materials may command a price premium if the technology is sufficiently differentiated.
New Zealand’s location means innovators face additional questions about the appropriate business model. Technology licensing may be more appropriate given the climate costs of transporting heavy products. Indeed, New Zealand has produced innovators competing at high levels in the circular economy, for e-waste (Mint Innovation) and heavy industrial processes (Avertana); both companies have raised funds at levels on par with, or ahead of, comparable companies in other SAEs. Perhaps the best-known example of waste-to-value innovation scaling out of New Zealand is LanzaTech, which grew to become one of the world’s leading point-source carbon capture-to-value companies, but eventually relocated headquarters to the US in order to be closer to demand owners. Preventing further cases of company relocation or ensuring that similar companies maintain a sizeable New Zealand presence, will require that the ecosystem prioritises creating promotion channels for the technology exports and licensing, so that innovators do not need to engage trade-offs between accessing waste sources and paying off-takers, and maintaining a meaningful presence in New Zealand.
The ecosystem can take further inspiration from Iceland, whose entrepreneurs have looked outwards to find customers and development partnerships. An example from Iceland is that of the Icelandic innovator Carbon Recycling International’s partnership with Henan Shuncheung Group, which, upon completion will capture 160,000 tons of CO2 per year, equal to the emissions of nearly 60,000 cars.270 Technology export opportunities may be found in Asian countries with high waste production and limited existing industrial waste processing infrastructure.
Suggestions for the Industrial Symbiosis Ecosystem
■ Embrace the Māori waste avoidance philosophy and whole-of-ecosystem systems thinking to identify opportunities for industrial symbiosis testing, research, and eventual development of technological models that can be promoted to export markets. (Commit)
■ Explore latent (or active) Māori industry innovation and potential use around the technologies discussed in this section. Identify opportunities to infuse the Māori approach into future innovation efforts and make deliberate attempts to plug innovation into Māori industries that maintain a waste avoidance guiding philosophy. (Commit)
CONTENTS

28
July 2021NEW ZEALAND CLIMATE TECH FOR THE WORLD
■ New Zealand geothermal innovators should consider where their solutions add a unique value to production inputs or other downstream applications and form partnerships that can open new markets – the ecosystem should identify not just companies, but industrial processes that geothermal can power (e.g. food processing) and adjacent power sources (e.g. wood biomass from forestry) that can be piloted in geothermal sites, offering the opportunity to export a New Zealand model of industrial development around geothermal sites. (Cluster, Coordinate)
■ Geothermal is a sector that New Zealand companies seem to be able to access capital in, on a level like that of peers overseas. Multilaterals (e.g. Breakthrough Energy) are investing globally in the geothermal space. The value for investors is that New Zealand-created geothermal technologies (including waste heat) can be developed, piloted, and deployed in New Zealand. (Connect to Demand)
Opportunities Challenges
Granular technologies are more likely to be noticed by export markets when part of a value chain solution – think the Israeli energy efficiency for energy transition catalogue and Swedish Cleantech’s strategy of presenting technology suites as a tactic to achieve big-picture sustainability strategies of industrial corporates and governments with similar industrial fabric and geographic conditions to New Zealand. (See Commit, Cluster, Coordinate, Connect to Demand)
Will require coordination across multiple R&D disciplines, multiple industries, and with overseas demand owners. Achieving the desired effect will require government promotion efforts, but also efforts to infuse demand owners’ priorities into the beginning loop of R&D prioritisation.
Leverage New Zealand’s unique geographic position and resources to welcome overseas innovators to experiment with and pilot new technologies. (See Coordinate, Connect to Demand)
Benefits are obvious for the private sector but allowing foreign participants in government-funded or even government-guided innovation programmes is often controversial. A comprehensive and long-term forward- facing plan would need to be developed to express the benefits to stimulating and maintaining innovation in the given technologies through such an exercise.
Forge links with high need – highly experimental wastewater clusters, e.g. Israel, UK, California, Texas. Look to innovation clusters with similar goals and challenges regarding wastewater and consider co-financing acceleration (e.g. Israel-Colorado Innovation Fund water programme). (See Coordinate, Connect to Demand)
The lack of multinationals headquartered in New Zealand leaves most investment with domestic venture capital funds, which, while potentially motivated to partner with other investors, may not have the requisite funds to support comprehensive cross-border innovation.
ENER
GY &
MAT
ERIA
LS ■ In wastewater treatment, identify industrial challenges
that sit at the nexus of water efficiency, energy efficiency, and process efficiency (ability to address volume and improve speed), make concentrated efforts to zero in on these problems through challenges organised by New Zealand investors, government, and ideally global multinationals in New Zealand. Make challenge goals big and seek to induce multiparty pursuit of step-changes that can motivate overseas demand owners to engage New Zealand suites of solutions or invest directly in the ecosystem. (Commit, Coordinate)
■ If executed upon, use the South Island hydrogen facility not just for production, but also for pilot testing and demonstration of hydrogen production and hydrogen use innovation. Pull in multinational corporates to issue challenges at the testing facility and invite global innovators to use facilities and participate in challenges.
CONTENTS

29
July 2021NEW ZEALAND CLIMATE TECH FOR THE WORLD
Advanced Materials for Green Building and Construction
Low carbon construction materials include low carbon cements, concretes and concrete substitutes such as timbercrete, hempcrete and clay-based materials. Clinker production accounts for the largest share of cement emissions, and alternative cement formulations may substitute clinker with fly ash, pozzolan, slag derivatives or other materials. Geopolymers may be used in both cement and concrete as a low-carbon substitute ingredient. This section focusses on materials destined for end-use in the construction industry, but there is some overlap with waste-to-value (covered in a subsequent section) as increasingly, construction materials carry a proportion of waste-derived material.
The global cement and concrete products market is forecast to grow at a CAGR of 7% between 2020 and 2025, and over one third of global demand is in the Asia Pacific region.57 Adoption of low carbon cement and concrete is driven mostly by regulation. Concrete substitutes are still mostly at proof-of-concept stage and market size and decarbonisation impact will become clearer as models are defined. Other interesting construction trends are advanced manufacturing (3D concrete printing) – currently experiencing market growth of 100% per year, albeit from a small starting point – and industrialisation of the construction process, often using timber as a construction material. While timber is a promising low-carbon construction alternative with some growth potential, deployment at scale will ultimately be limited by availability of exploitable forest growth.
On the demand side, the conservative nature of the construction industry hinders adoption of innovative products and solutions. Successful companies have prior construction industry experience, which helps them engage with contractors and talk the same language. New Zealand’s Green Star certification is a promising demand-side support, especially when combined with local incentives such as reduced development costs for certified buildings. Public procurement, based on Environmental Product Declarations and embodied carbon limits, is another mechanism for kick starting demand.
Building codes, regulations and standards, which may not have been updated for recent materials developments, present a second barrier to adoption. CyBe Construction, a Netherlands-
based 3D printing company (and partner of Hamilton-based innovator Qorox) has created a global community to facilitate adoption of their solution.58 Construction companies discuss how to ensure compliance, sharing tips between regions with similar requirements, for example earthquake-resistance.
SAEs generally do not show strong investment activity in green construction, except for Norway, which has invested around $80m over the last ten years, of which $50m went to sustainable wood producer Kebony.31 In Finland, Tekes and VTT provide early-stage funding for sustainable construction innovation but have not yet produced innovation at scale. Denmark’s Create SDU researches additive manufacturing in architecture, and DTU FABLAB allows students to experiment with 3D printing equipment. Denmark has taken a particularly proactive approach in additive manufacturing for construction with the Green Transition Fund, which funded an initial investigation into world best in class techniques. Danish 3D construction innovator Cobod was a result of this initiative.58 The Danish government also employs a corporate matchmaking program which allows startups to meet potential partners and investors.
While not an SAE, France has been successful in developing a vibrant early-stage ecosystem for construction startups, through a combination of financial incentives and construction or concrete focused accelerators. Corporates such as Lafarge Holcim, Bouygues Construction and Vinci Construction also actively invest and partner with innovators.
Israel has also demonstrated a proactive approach in developing the construction-focused startup ecosystem. Until recently, Israeli construction sector startups were found only in hi-tech subsectors such as robotics and VR/AR. The Contech ‘Construction Innovation Zone’ was founded with the goal of turning Israel into an international leader and attractor-point in the construction tech and real estate tech sectors. The organisation connects innovators with contractors, developers, corporates, regulatory bodies, policy makers and investors. It also invites international delegations to Israel to discover new startups and develop funding programmes and accelerators in partnership with international corporates. The number of active startups tracked by the initiative has increased from 60 in 2018 to 175 in 2020, with an overall increase in startup activity of 800% over the last four years.59 Startups are grouped based on position in the value chain, allowing stakeholders to engage with solutions along the construction lifecycle.
Opportunities Challenges
Promote innovation along the whole value chain, either through industrialised models or by creating collaborative solutions with innovators along the building lifecycle. Target export markets with need for end-to-end solutions combining value with speed and environmental benefits.
New Zealand’s geographic location means product / machinery exports may not be the best option in terms of emissions intensity. For in-situ production, product formulations may need to be adapted according to local availability of raw materials.
MATE
RIAL
S
CONTENTS

30
July 2021NEW ZEALAND CLIMATE TECH FOR THE WORLD
Globally, zero waste products have increased in popularity in recent years, due partially to increasing response from the public against climate change but also improvements in the quality of products coming from companies employing differentiated production techniques. The zero-waste product industry already has a large market and wide commercial availability on a global scale, especially through consumer packaged goods (CPG) sales channels in North America and Europe, with many corporates engaging waste reduction techniques and products in consumer goods and food.72 New Zealand is already ahead of most advanced economies with regard to uptake of waste reduction in consumer retail, as an example, from July 1st, 2019 single-use shopping bags were banned in New Zealand.70
While the size of the New Zealand market is an ever-present challenge to innovators, low-impact consumer goods is one area in which the local customer base can serve as a true-north indicator of potential uptake in export markets. Bioplastics, biomimicry, and natural textiles are all potential opportunity areas for New Zealand innovators to innovate with the guidance of the local market, which in this case, can act as an indicator of demand owner preferences.
The New Zealand biotechnology research and talent community creates a base knowledge pool from which bioplastics can be innovated. Indeed, some biomaterials innovation commercialisation can be observed through cases such as Aduro Biopolymers, a University of Waikato spinout company. One critical challenge facing bioplastics innovators is the lack of a dynamic recycling ecosystem in New Zealand, which blunts motivation to innovate for new recycling models and keeps demand owners complacent. A contrast would be Germany, where high rates of recycling are mandated, bioplastics innovation is being supported by the German Federal Ministry of Food and Agriculture.272
Some New Zealand innovators are finding success in developing products that circumvent waste altogether, such as Ethique, a personal care brand that produces solid products without any need for bottles to begin with. Perhaps most notable, though, is AllBirds, the pioneer in wool-based sneakers that set a global trend followed by dozens of large shoemakers after them. AllBirds is an example of a company that crossed over between industries (livestock raising and fashion) to develop a distinct advantage around New Zealand resources that significantly reduces environmental impact (production requires 60% less energy than materials in synthetic shoes) and captures global consumer attention. Allbirds has raised over $202 million and is selling products in New Zealand, North America, Europe, and China.
Further developing novel production methods around sustainable consumer goods will likely require efforts to innovate toward demand owners from the research-level up. Take for example, the Swedish Energy Authority’s RE:Source Innovation Program, that supports R&D of resource-efficient textiles and has produced successful innovations built around novel production methods, such as Renewcell, a textile-to-textile recycler that has developed patented production technology and has listed on the Swedish stock exchange.
Productising Low-impact Consumer Goods
Opportunities Challenges
Key driver of sustainability in consumer goods and textiles is reduction of plastics. Novel production techniques, and development of products that remove the plastic need are a potential niche for New Zealand innovators to explore. (See Commit)
Capex for consumer goods is especially high, given the need for a comprehensive supply chain and physical production facilities. Innovators will need to look beyond New Zealand for requisite financing.
CONS
UMER
GOO
DS
CONTENTS

31
July 2021NEW ZEALAND CLIMATE TECH FOR THE WORLD
Suggestions for the Low-impact Consumer Goods Innovation Ecosystem
■ New Zealand has critical supply chain elements (natural raw materials, production scrap). Value chain effects should be explored with agricultural production, i.e. where New Zealand bioplastics innovators can partner with local agricultural producers to develop unique approaches to bioplastics production (e.g. Lactips’ use of caseins for packaging material in France271). (Cluster).
■ Look for opportunities exist for co-location of agricultural / dairy production and bioplastics production. Consider establishing coordinated pilot-testing zones for innovators crossing over between the two industries – for New Zealand innovators but also for overseas innovators testing technologies and production methods. (Cluster, Coordinate).
■ New Zealand is the 4th largest producer of wool globally, with an existing success case in wool textile products. The ecosystem should push for synergies with the agricultural and even robotics industries to develop novel production techniques and develop capabilities around turning wool into new products, not just supplying wool. (Commit).
■ In natural textiles, there is no clear winning innovation ecosystem, the critical relationships are with brands and retailers, most of which will reside overseas. Promoting New Zealand textile innovators to global accelerators, e.g. Factory45 (global, online), Fashion for Good (Netherlands), Plug-n-Play Sustainable Brands (US). (Connect to Demand).
■ Biggest challenge for the ecosystem will be on access to the major consumer goods incumbents (i.e. potential licensors and acquirors of technology) and global brand recognition. (Connect to Demand).
- Capabilities around inbound logistics (procurement, management of materials) and low-impact production can provide opportunities for innovators in this sector to expand backward in the value chain, acquiring sources of natural raw materials, or to developing standalone products (as Ethique has).
- Strong export promotion push will be necessary given the size of the home market.
CONTENTS

32
July 2021NEW ZEALAND CLIMATE TECH FOR THE WORLD
1 https://stats.oecd.org/Index.aspx?DataSetCode=AIR_GHG
2 https://www.mfe.govt.nz/sites/default/files/media/Climate%20Change/new-zealands-greenhouse- gas-inventory-1990-2018-snapshot.pdf
3 https://epi.yale.edu/epi-results/2020/country/nzl
4 Ministry of Business, Innovation & Employment, Energy in New Zealand 2019, NZ Geothermal Association
5 NZTE’s Doing Business in NZ Overview Dec 2020
6 https://www.mfe.govt.nz/sites/default/files/media/Climate%20Change/Primary%20Sector%20Climate %20Change%20Commitment.pdf
7 https://agritechnz.org.nz/wp-content/uploads/sites/3/2020/07/Aotearoa-Agritech-Unleashed- Report_digital.pdf
8 NZTech Digital Nation Report, 2016
9 Accelerating a Connected NZ, 2017
10 Shaping a Future NZ Report, 2018
11 https://www.freecodecamp.org/news/what-we-learned-about-2019-developer-hiring-trends-from-analyzing- 112-654-coding-tests-b05a3ba0ca7b/
12 Education Counts 2019
13 https://www.scionresearch.com/science/bio-based-products-and-technologies/Plastics-a-circular- economy-approach
14 https://nztech.org.nz/wp-content/uploads/sites/8/ 2020/07/Tech-Sector-Key-Metrics-2019-Update.pdf
15 https://static.scientificamerican.com/wv/assets/2016_SciAmWorldView.pdf
16 https://www.rnz.co.nz/news/business/408917/ chemical-sector-faces-environmental-and- technological-challenges-report
17 https://www.iccc.mfe.govt.nz/assets/PDF_Library/daed426432/FINAL-ICCC-Electricity-report.pdf
18 https://www.nzte.govt.nz/page/advanced-transportation
19 “ Strategy to 2040” Māori Economic Development Panel, November 2012
20 https://www.projectmoonshot.city/post/an-indigenous-view-on-doughnut-economics-from-new-zealand
21 “New Zealand firms: Reaching for the frontier” New Zealand Productivity Commission
22 https://static.scientificamerican.com/wv/assets/ 2016_SciAmWorldView.pdf
References
23 https://www.topuniversities.com/university-rankings/university-subject-rankings/2019/life-sciences-medicine
24 https://creativehq.co.nz/startups/
25 https://agritechnz.org.nz/wp-content/uploads/sites/3/2020/07/Aotearoa-Agritech-Unleashed- Report_digital.pdf
26 https://nzgif.co.nz/
27 https://www.nzgcp.co.nz/portfolio?sector=agri-tech
28 https://www.enterpriseangels.co.nz/project/ purpose-capital-impact-fund/
29 http://rapid.berkeley.edu/sponsors.html
30 https://www.mordorintelligence.com/industry- reports/agricultural-robots-market
31 Cleantech Group, i3 Database
32 https://beef2live.com/story-states-produce-food-value-0-107252
33 https://www.cdfa.ca.gov/Statistics/
34 https://www.freshfacts.co.nz/files/freshfacts-2018.pdf
35 http://www.cfbf.com/wp-content/uploads/2019/06/LaborScarcity.pdf
36 Environment at a Glance 2015, NZTE Analysis
37 OECD (2020), Patents on Environment Technologies
38 https://www.nzte.govt.nz/page/wood-processing
39 https://www.roboticsbusinessreview.com/agriculture/ 4-ways-robotics-change-agriculture-in-2019/
40 http://smartmachines.bluerivertechnology.com/
41 https://evokeag.com/robotics-to-save-time-and-food-waste/
41 Chris Sworder (Cleantech Group), Sector Insight: Agriculture & Food, Robots & Biotechnology
42 https://www.beehive.govt.nz/sites/default/files/ 2020-12/NZ%20Trade%20and%20Enterprise.pdf
43 https://www.eda.admin.ch/aboutswitzerland/en/home/wirtschaft/taetigkeitsgebiete/landwirtschaft.html
44 https://hbr.org/1999/03/competing-with-giants-survival-strategies-for-local-companies-in-emerging-markets
45 Delgado, Mercedes, Porter, Michael, Stern, Scott. “Clusters, Convergence, and Economic Performance” (2012)
46 Korres, George M., Drakopoulos, Stylianos. “Economics of Innovation: A Review in Theory and Models” (2009)
47 https://www.hbs.edu/ris/Publication%20Files/20-063_97e5ef89-c027-4e95-a462-21238104e0c8.pdf
48 https://www.mckinsey.com/~/media/McKinsey/Business%20Functions/Sustainability/Our%20Insights/Impact%20of%20the%20financial%20crisis%20on%20carbon%20economics%20Version%2021/Impact%20of%20the%20financial%20crisis%20on%20carbon%20economics%20Version%2021.pdf
49 https://www.epa.gov/sites/production/files/2018-01/documents/2018_chapter_5_agriculture.pdf
50 MIT Technology Review, “The Green Future Index 2021”, 2021
51 He Pou a Rangi Climate Change Commission, “2021 Draft Advice for Consultation”, 2021
52 Ministry for Primary Industries, “New Zealand Agriculture, A Policy Perspective”, 2017
53 https://www.iea.org/data-and-statistics?country=WORLD&fuel=CO2%20emissions&indicator=CO2BySector
54 https://static1.squarespace.com/static/585c3439be65942f022bbf9b/t/5d7fe0e83d119516bfc0017e/1568661791363/RethinkX+Food+and+Agriculture+Report.pdf
55 https://www.theinsightpartners.com/reports/ specialty-crops-market
56 https://www.stats.govt.nz/indicators/new-zealands-greenhouse-gas-emissions
57 Cement And Concrete Products Global Market Report 2021: COVID 19 Impact and Recovery to 2030 (yahoo.com)
58 Cleantech Group interviews
59 https://www.contech.me/startups
60 Universities New Zealand (universitiesnz.ac.nz)
61 https://www.callaghaninnovation.govt.nz/sites/ all/files/new-waste-to-value-report-2020.pdf
62 https://www.procurement.govt.nz/assets/procurement-property/documents/sustainable-construction-construction-procurement.pdf
63 https://www.oecd.org/environment/country-reviews/Highlights_OECD_EPR_NewZealand.pdf
CONTENTS
33
July 2021NEW ZEALAND CLIMATE TECH FOR THE WORLD
64 https://www.oecd-ilibrary.org/docserver/5kg51mc6k98 r-en.pdf?expires=1619194296&id=id&accname=guest& checksum=C3F6F2D050EE6F82BDB5F677784D7764
65 https://www.aucklandcouncil.govt.nz/plans-projects-policies-reports-bylaws/our-plans-strategies/topic-based-plans-strategies/environmental-plans-strategies/docswastemanagementplan/waste-assessment-2017.pdf
66 http://embracechange.co.nz/what/what-is-it
67 https://www.marketsandmarkets.com/PressReleases/wastewater-treatment-service.asp
68 https://www.fluencecorp.com/israel-leads-world-in-water-recycling/
69 https://www.jpost.com/israel-news/using-israeli-technology-to-live-in-a-water-stressed-world-627227
70 https://ourauckland.aucklandcouncil.govt.nz/articles/news/2019/06/no-single-use-plastic-shopping-bags-from-1-july/
71 https://www.ul.com/news/measuring-carbon-reduction-disposal-alternatives-how-zero-waste-reduces-ghg-emissions
72 https://zerowasteeurope.eu/zero-waste-in-business/
73 https://www.theverge.com/2021/3/1/22306971/rocket-lab-neutron-public-spac
74 https://www.gminsights.com/industry-analysis/waste-heat-recovery-system-market?utm_source=globenewswire.com&utm_medium=referral&utm_campaign=Paid_globenewswire
75 Lygnerud, K.; Werner, S. Risk of industrial heat recovery in district heating systems. Energy Procedia2017,116, 152–157
76 https://www.scoop.co.nz/stories/AK2005/S00582/metro-sports-facilitys-eco-friendly-energy-system-a-new-zealand-first.htm
77 https://genless.govt.nz/assets/Business-Resources/International-technology-scan.pdf
78 https://www.nowi-energy.com/
79 https://www.lse.ac.uk/granthaminstitute/wp-content/uploads/2018/01/Consultation-response-Industrial-Heat-Recovery-Support-Programme.pdf
80 CTG sector insight – Residential Energy Management: Disaggregation & NILM
81 based on average 9.3% reduction of energy usage by activating smart heating (Sustainability ⚡⚡ Tibber) as a % of global CO2 emissions from energy (Global Energy Review: CO2 Emissions in 2020 – Analysis – IEA)
82 https://www.nrel.gov/docs/fy13osti/57709.pdf
83 https://www.weforum.org/agenda/2020/09/sweden-energy-production-renewable-power-district-heating/
84 https://www.ge.com/news/reports/innovation-powering-new-zealands-energy-sector
85 Ministry of Business, Innovation & Employment, Energy in New Zealand 2019, New Zealand Geothermal Association
86 Ministry for Primary Industries, “New Zealand Agriculture, A Policy Perspective”, 2017
87 https://www.smart-energy.com/industry-sectors/energy-grid-management/smart-energy-app-helps-norway-consumers-cut-energy-use-by-7/
88 https://smartgrids.no/wp-content/uploads/sites/4/2014/04/Smart-Grid-Norway_Status-and-outlook-2017.pdf
89 Source: CTG sector insight – Electrochemical batteries, chemistry & software
90 Source: jrc114616_li-ion_batteries_two-pager_final.pdf (europa.eu)
91 https://gtep.technion.ac.il/israel-national-research-center-for-electrochemical-propulsion/
92 https://nocamels.com/2020/12/bird-foundation-energy-clean-projects-invest/
93 https://www.macdiarmid.ac.nz/what-we-do/into-the-marketplace/macdiarmid-institute-spinout-companies/
94 https://www.iea.org/reports/geothermal
95 http://css.umich.edu/sites/default/files/Geothermal%20Energy_CSS10-10_e2019.pdf
96 https://www.energy.gov/sites/prod/files/2019/06/f63/GeoVision-full-report-opt.pdf
97 http://www.etip-dg.eu/front/wp-content/uploads/D4.6-Report-on-Competitiveness.pdf
98 https://www.icebookshop.com/Products/Geothermal-Energy,-Heat-Exchange-Systems-and-Energ.aspx
99 https://www.thinkgeoenergy.com/e-on-plans-geothermal-district-heating-project-in-malmo-sweden/
100 https://nea.is/geothermal/
101 Integrated Building Management Systems Market - Actionable Research on COVID-19|Advent of The IoT to Boost the Market Growth | Technavio | Business Wire
102 CTG sector insight – Intelligent Building Management;
103 UNEP-1.pdf (ipcc.ch)
104 http://rapid.berkeley.edu/sponsors.html
105 https://www.mordorintelligence.com/industry-reports/agricultural-robots-market
106 http://www.cfbf.com/wp-content/uploads/2019/06/LaborScarcity.pdf
107 https://www.roboticsbusinessreview.com/agriculture/ 4-ways-robotics-change-agriculture-in-2019/
108 http://smartmachines.bluerivertechnology.com/
109 https://www.export.gov.il/en/cleantech/cleantechcatalogue
110 https://innovationisrael.org.il/en/article/clean-energy-sector-2030#footnote2_trwyop2
111 https://www.eeca.govt.nz/our-work/programmes-and-funding/productive-and-low-emissions-business/
112 https://genless.govt.nz/running-a-business/co-funding-and-support/business-co-funding-and-support-programmes/technology-demonstration-projects/
113 IEA: The Future of Hydrogen
114 Hydrogen Council: The Path to Hydrogen Competitiveness
115 Material Economics: Mainstreaming Green Hydrogen in Europe
116 Based on current transportation emissions: 17% of total 37Gt: Hydrogen Council: Path to Hydrogen Competitiveness
117 New reality: electric trucks and their implications on energy demand | McKinsey Energy Insights
118 Update: Impacts of Heavy-Duty Diesel Truck Emissions | Energy Technologies Area (lbl.gov)
119 Hydrogen: The next wave for electric vehicles? | McKinsey
120 Dia 1 (hyer.eu)
121 17 February 2021, Germany-New Zealand Green Hydrogen Alliance Passes First Hurdle, News, University of Otago, New Zealand
122 Government releases plans for green hydrogen to curb greenhouse gas emissions - New ZealandHerald
123 Hydrogen plant for Southland in the future? | Stuff.co.nz
124 PGF investment in green hydrogen | Beehive.govt.nz
125 https://www.marketsandmarkets.com/Market-Reports/livestock-monitoring-market-72634532.html
126 https://www.mckinsey.com/~/media/mckinsey/industries/agriculture/our%20insights/reducing%20agriculture%20emissions%20through%20improved%20farming%20practices/agriculture-and-climate-change.pdf
127 https://www.mla.com.au/globalassets/mla-corporate/prices--markets/documents/trends--analysis/fast-facts--maps/2020/mla-beef-fast-facts-2020.pdf
128 https://www.mckinsey.com/~/media/mckinsey/industries/agriculture/our%20insights/reducing%20agriculture%20emissions%20through%20improved%20farming%20practices/agriculture-and-climate-change.pdf
129 https://nifa.usda.gov/topic/animal-breeding
130 https://www.ft.com/content/b7e766c4-ad5c-11e8-8253-48106866cd8a
131 https://www.mdpi.com/2076-393X/8/3/460/htm
132 https://www.abc.net.au/news/rural/2015-11-10/mitigating-methane-emissions-from-cattle-via-vaccine/6925676
133 https://www.grandviewresearch.com/press-release/global-veterinary-animal-vaccines-market
134 https://www.stuff.co.nz/environment/climate-news/300039760/funding-boost-gives-methane-vaccine-a-better-shot
135 https://www.stuff.co.nz/national/politics/116816786/government-sets-deadline-for-farmer-emissions
136 https://www.abc.net.au/news/rural/2015-11-10/mitigating-methane-emissions-from-cattle-via-vaccine/6925676
137 https://digital.hbs.edu/platform-rctom/submission/before-the-burp-can-dsm-be-the-cattlemans-savior/
138 https://www.stuff.co.nz/business/farming/124093975/fonterra-partners-with-science-giant-dsm-to-reduce-methane-emissions-in-cows
139 https://www.globalmethane.org/documents/ ag_fs_eng.pdf
140 https://www.sciencedaily.com/releases/2001/06/010611071759.htm
141 https://britishmeatindustry.org/industry/imports-exports/#:~:text=Exports%20account%20for%20about%2017,of%20Ireland%20and%20the%20Netherlands.&text=Beef%20accounts%20for%20the%20largest,pork%20bringing%20in%20around%2020%25.
142 https://assets.publishing.service.gov.uk/government/uploads/system/uploads/attachment_data/file/884101/agricaccounts-tiffstatsnotice-07may20i.pdf
143 https://www.grandviewresearch.com/industry-analysis/animal-feed-additives-market
144 https://www.mckinsey.com/~/media/mckinsey/industries/agriculture/our%20insights/reducing%20agriculture%20emissions%20through%20improved%20farming%20practices/agriculture-and-climate-change.pdf
145 https://www.businessinsider.com/meat-substitutes-impossible-foods-beyond-meat-sales-skyrocket-2019-5?r=US&IR=T
CONTENTS
https://www.macdiarmid.ac.nz/what-we-do/into-the-marketplace/macdiarmid-institute-spinout-companies/

34
July 2021NEW ZEALAND CLIMATE TECH FOR THE WORLD
146 https://static1.squarespace.com/static/585c3439be65942f022bbf9b/t/5d7fe0e83d119516bfc0017e/1568661791363/RethinkX+Food+and+Agriculture+Report.pdf
147 https://www.mpi.govt.nz/science/plant-protein-report/
148 http://www.fao.org/3/i7558e/i7558e.pdf
149 https://www.government.nl/latest/news/2020/01/17/dutch-agricultural-exports-worth-%E2%82%AC94.5-billion-in-2019
150 http://www.fao.org/fishery/countrysector/naso_israel/en
151 https://www.aquaculture.ca/
152 https://www.researchgate.net/publication/341122426_New_Zealand_aquaculture_industry_research_opportunities_and_constraints_for_integrative_multitrophic_farming
153 https://www.mpi.govt.nz/dmsdocument/15895/direct
154 https://www.theinsightpartners.com/reports/specialty-crops-market
155 https://www.globenewswire.com/news-release/2019/07/31/1894943/0/en/Global-Microencapsulated-Pesticides-Market-is-Expected-to-Reach-USD-817-45-Million-by-2025-Fior-Markets.html
156 https://www.grandviewresearch.com/press-release/global-precision-farming-market
157 https://www.teagasc.ie/rural-economy/rural-economy/agri-food-business/agriculture-in-ireland/
158 http://rapid.berkeley.edu/sponsors.html
159 https://www.mordorintelligence.com/industry-reports/agricultural-robots-market
160 http://www.cfbf.com/wp-content/uploads/2019/06/LaborScarcity.pdf
161 https://www.roboticsbusinessreview.com/agriculture/ 4-ways-robotics-change-agriculture-in-2019/
162 http://smartmachines.bluerivertechnology.com/
163 https://www.globenewswire.com/news-release/2021/01/05/2153465/0/en/Global-Size-of-Agricultural-Robots-and-Drones-Market-Will-Reach-USD-13-58-Billion-by-2026-Facts-Factors.html
164 https://sdgs.un.org/goals/goal14
165 https://www.fortunebusinessinsights.com/agriculture-drones-market-102589
166 http://blogs.edf.org/growingreturns/2018/08/02/drones-climate-change-agriculture-wildlife-ecosystem-resilience/
167 http://www.fao.org/e-agriculture/blog/how-drone-technology-bringing-environmental-benefits-farms-1
168 https://taranis.ag/2019/11/09/drones-in-the-air-and-sensors-in-the-ground-how-israeli-farmers-plan-to-feed-billions/
169 https://www.haaretz.com/israel-news/business/drones-and-sensors-how-israeli-farmers-plan-to-feed-billions-1.6550712
170 https://www.swissinfo.ch/eng/pa-22-_swiss-government-sets-out-new-greener-farming-policy/45556992
171 https://www.swissinfo.ch/eng/innovation_crop-spraying-drones-to-be-authorised-/45121230
172 https://www.swissinfo.ch/eng/swiss-innovation_welcome-to-the-drone-valley/44375836
173 https://www.prnewswire.com/news-releases/carbon-capture-and-storage-market-size-worth-10-45-billion-by-2026--cagr-11-5-polaris-market-research-301178700.html
174 https://www.mckinsey.com/~/media/mckinsey/industries/agriculture/our%20insights/reducing%20agriculture%20emissions%20through%20improved%20farming%20practices/agriculture-and-climate-change.pdf
175 https://www.vttresearch.com/sites/default/files/2021-03/Food-research-and-innovation-strategy-for-Finland_2021-2035.pdf
176 https://www.marketsandmarkets.com/PressReleases/wastewater-treatment-service.asp
177 https://www.epa.gov/sites/production/files/2017-06/documents/wastewater-guide.pdf
178 https://www.un.org/waterforlifedecade/quality.shtml
179 https://www.bmu.de/en/topics/water-waste-soil/water-management/wastewater/#:~:text=The%20current%20situation%20in%20Germany,10%2C000%20waste%20water%20treatment%20facilities.
180 https://www.fluencecorp.com/israel-leads-world-in-water-recycling/
181 https://www.prnewswire.com/news-releases/carbon-footprint-management-market-worth--12-2-billion-by-2025--exclusive-report-by-marketsandmarkets-301030257.html
182 https://www.pewresearch.org/science/2020/09/29/concern-over-climate-and-the-environment-predominates-among-these-publics/
183 https://www.c40.org/researches/consumption- based-emissions
184 https://nztech.org.nz/wp-content/uploads/sites/8/ 2020/07/Tech-Sector-Key-Metrics-2019-Update.pdf
185 https://softwarefromfinland.com/
186 The Digital Economy and Society Index (DESI) 2019
187 https://www.ellenmacarthurfoundation.org/assets/downloads/EllenMacArthurFoundation_TheNewPlasticsEconomy_Pages.pdf
188 https://www.nrdc.org/stories/single-use-plastics-101#:~:text=We%20produce%20300%20million%20tons,to%20plastic%20production%20and%20use).
189 https://www.cell.com/one-earth/pdf/S2590-3322(20)30305-5.pdf
190 https://www.alliedmarketresearch.com/bioplastics-market
191 https://www.recyclingtoday.com/article/national-sword-china-plastics-recycling/
192 https://ec.europa.eu/environment/news/plastic-waste-shipments-new-eu-rules-importing-and-exporting-plastic-waste-2020-12-22_en
193 https://www.unpri.org/download?ac=9630
194 https://www.ciel.org/news/plasticandclimate/
195 https://ourauckland.aucklandcouncil.govt.nz/articles/news/2019/06/no-single-use-plastic-shopping-bags-from-1-july/
196 https://swiftcurrentonline.com/ag-news/federal-government-invests-4-5-million-to-manage-on-farm-plastic-waste
197 https://www.foodpackagingforum.org/news/germany-to-promote-bioplastic-packaging
198 https://www.connexionfrance.com/Practical/Environment/France-tightens-plastics-ban
199 https://www.grandviewresearch.com/industry- analysis/zero-waste-shampoo-market
200 https://www.businesswire.com/news/home/20200324005308/en/Global-Zero- Waste-Packaging-Market---Outlook-Projections- from-2019-to-2027---ResearchAndMarkets.com
201 https://www.ul.com/news/measuring-carbon- reduction-disposal-alternatives-how-zero-waste-reduces-ghg-emissions
202 https://zerowasteeurope.eu/zero-waste-in-business/
203 https://blogs.ei.columbia.edu/2020/02/20/plastic-production-climate-change/
204 Download: /Brochure_Climate_Protection.pdf
205 Downloads/Brochure_Climate_Protection.pdf
206 https://www.epa.gov/transforming-waste-tool/how-communities-have-defined-zero-waste
207 https://www.rubicon.com/blog/companies-zero-waste/
208 https://zerowasteeurope.eu
209 https://zerowasteeurope.eu/about
210 https://www.nspackaging.com/news/new-zealand-plastic-packaging/
211 http://therubbishtrip.co.nz/thoughts-and-musings/zero-waste-in-new-zealand-in-2019-a-year-in-review/
212 https://www.ncsl.org/research/environment-and-natural-resources/state-beverage-container-laws.aspx
213 https://www.theguardian.com/environment/2020/oct/30/us-and-uk-citizens-are-worlds-biggest-sources-of-plastic-waste-study
214 https://www.mckinsey.com/business-functions/sustainability/our-insights/style-thats-sustainable- a-new-fast-fashion-formula
215 https://www.businesswire.com/news/home/20210111005582/en/Global-Ethical-Fashion-Market-Report-2020-Opportunities-Strategies-COVID-19-Impacts-Growth-and-Change-2019-2030---ResearchAndMarkets.com#:~:text=The%20global%20ethical%20fashion%20market%20reached%20a%20value%20of%20nearly,(CAGR)%20of%206.8%25.
216 https://www.sciencedirect.com/science/article/pii/S0959652618305985#bib63
217 https://www.ellenmacarthurfoundation.org/assets/downloads/A-New-Textiles-Economy_Full-Report_Updated_1-12-17.pdf
218 https://textile-zukunft.de/wp-content/uploads/ 2014/10/EU-policy-on-used-textiles.pdf
219 ecotextile.com/2020010325494/labels-legislation-news/new-law-could-lead-to-synthetic-fibre-ban.html
220 https://study.com/academy/lesson/new-zealand- textile-industry.html#:~:text=New%20Zealand% 20leads%20the%20world,sheep%20that%20have %20been%20crossbred
221 https://apparelinsider.com/sweden-passes-epr-laws-on-textiles-clothing/#:~:text=STOCKHOLM%20%E2%80%93%20Sweden%20has%20become%20only,start%20on%201%20January%202024
222 https://good.net.nz/nz-clothing-industry-co-creating-new-environmental-strategy/
223 Global Cement and Concrete Products Market Report (2021 to 2030) - COVID-19 Impact and Recovery (yahoo.com)
CONTENTS
http://therubbishtrip.co.nz/thoughts-and-musings/zero-waste-in-new-zealand-in-2019-a-year-in-review/

35
July 2021NEW ZEALAND CLIMATE TECH FOR THE WORLD
224 ClimateWorks: Decarbonizing Concrete, March 2021
225 Based on 80% (CTG estimate) decarbonization by 2050 of 10% global emissions of 2019 global emissions 33bn tonnes (IEA)
226 https://www.researchandmarkets.com/reports/5157262/3d-concrete-printing- market-by-printing-type
227 CTG analysis (not published)
228 ClimateWorks: Decarbonizing Concrete, March 2021
229 2019 global emissions 33bn tonnes CO2e (IEA)
230 One-quarter of Dubai’s buildings will be 3D printed by 2025 | World Economic Forum (weforum.org)
231 Global construction waste to almost double by 2025 | Building Design + Construction (bdcnetwork.com)
232 Global Non-Ferrous Slag Volumes to Reach 133. 7 Million Tonnes by 2029 | Smithers
233 Industrial Waste Management Market worth US$ 1.1 Trn by 2026 (transparencymarketresearch.com)
234 2019 global emissions 33bn tonnes CO2e (IEA)
235 Based on 80% footprint reduction of cement-free concrete (Betolar.fi) on cement & concrete emissions of 10% global GHG emissions. Neustark makes a similar global emissions reduction claim on website
236 CTG primary research
237 10 high-tech solutions to make construction smart and safe - ISRAEL21c
238 ICEF: Global Roadmap for Implementing CO2 Utilization
239 Transforming Industry through CCUS – Analysis – IEA
240 https://www.mckinsey.com/business-functions/sustainability/our-insights/driving-co2-emissions-to-zero-and-beyond-with-carbon-capture-use-and-storage#
241 Flagships — Liquid Wind - eMPowering our Future.
242 Innovation and entrepreneurship | Chalmers
243 Reducing the cost of CO2 capture in process industries | RISE
244 https://www.fortunebusinessinsights.com/electric-vehicle-ev-charging-stations-market-102058
245 jrc114616_li-ion_batteries_two-pager_final.pdf (europa.eu)
246 https://techcrunch.com/2013/05/26/better-place-bankruptcy-liquidating-greentech/
247 https://www.neaman.org.il/Files/Electric%20Vehicles%20Charging%20Infrastructure%20in%20Israel%20SNI_20180614170611.810.pdf
248 https://www.canterbury.ac.nz/life/parking/evc/
249 https://www.uu.se/en/news/article/?id=10882&area= 2,5,10,16,17,38,50&typ=artikel&lang=en
250 https://www.auckland.ac.nz/en/for/the-media/ourstories/going-wireless.html
251 https://www.auckland.ac.nz/en/business/our-research/research-institutes-centres/energy-centre/our-research/transport.html
252 https://www.globenewswire.com/news-release/2020/10/16/2109803/0/en/Space-Propulsion-Market-by-Type-System-Component-Platform-Orbit-End-user-Orbit-Support-Service-and-Region-Global-Forecast-to-2025.html
253 https://www.fortunebusinessinsights.com/industry-reports/small-satellite-market-101917
254 https://new-zealand.globalfinder.org/company_page/argo-navis
255 https://www.crunchbase.com/organization/skyroot-aerospace/company_financials
256 https://assets.publishing.service.gov.uk/government/uploads/system/uploads/attachment_data/file/536903/bis-16-310-aerospace-supply-chain-study.pdf
257 https://en.wikipedia.org/wiki/Sun-synchronous_orbit
258 https://www.weforum.org/agenda/2020/10/visualizing-easrth-satellites-sapce-spacex/
259 https://www.idtechex.com/en/research-report/ electric-boats-and-ships-2017-2027/509
260 https://www.transportenvironment.org/what- we-do/shipping-and-environment/shipping-and-climate-change
261 https://zerojet.nz/our-impact
262 https://www.fortunebusinessinsights.com/electric- boat-market-103647
263 http://choosewashingtonstate.com/why-washington/our-key-sectors/maritime/
264 https://www.statista.com/statistics/1155988/ us-recreational-boating-vessels/
265 https://plugboats.com/electric-boat-company- ipo-raises-over-27-million/
266 https://www.maritimenz.govt.nz/recreational/ safety-campaigns/documents/Recreational- boating-survey-2020.pdf
267 https://new-zealand.globalfinder.org/
268 https://contact.co.nz/aboutus/media-centre/2020/12/10/meridian-and-contact- to-investigate-potential-green-hydrogen- facility-in-lower-south-island
269 https://www.oecd-ilibrary.org/sites/ 9789264268821-en/index.html?itemId=/ content/publication/9789264268821-en&_ csp_=8f65655d155463ebf0a186484e88cc30&itemIGO =oecd&itemContentType=book
270 https://www.carbonrecycling.is/news-media/2021/2/9/major-milestones-reached-in-the-first-commercial-co2-to-methanol-plant
271 https://www.lactips.com/about/who-are-we/?lang=en
272 https://www.foodpackagingforum.org/news/germany-to-promote-bioplastic-packaging
273 Ireland Department of Public Expenditure and Reform. “Smalll Advanced Open Economies - a comparative analysis”. (2019)
274 https://www.timesofisrael.com/israelis-looking-to-harness-local-br
CONTENTS
https://www.transportenvironment.org/what-we-do/shipping-and-environment/shipping-and-climate-change
https://www.transportenvironment.org/what-we-do/shipping-and-environment/shipping-and-climate-change

March 2019
NEW ZEALAND CLIMATE TECH FOR THE WORLD
Appendix 1Energy & Power
36

37
Contents
Energy & Power – Comparison between Small Advanced Economies (SAEs)
Energy & Power Analysis
Waste Heat Recovery
Smart Home Energy Analytics
Electrochemical energy storage
Geothermal
Energy efficiency - digital platforms
Hydrogen - transport & refueling
CONTENTS

Overview – Energy & Power Innovation in Small Advanced Economies (SAEs)
38
Energy & Power Investments (2010 – 2020) and Funded Innovators in SAEsFunding Raised ($) Number of Companies

39
Contents
Energy & Power – Comparison between Small Advanced Economies (SAEs)
Energy & Power Analysis
Waste Heat Recovery
Smart Home Energy Analytics
Electrochemical energy storage
Geothermal
Energy efficiency - digital platforms
Hydrogen - transport & refueling
CONTENTS

Waste Heat Recovery Innovation in SAEs
40
Waste Heat Recovery Investments (2010 – 2020) and Funded Innovators in SAEs

Waste Heat Recovery – Trend Analysis
41
➢ North Sweden Cleantech is a regional innovation and export platform for green technology, clean energy and sustainable solutions from Västerbotten and Örnsköldsvik, including in waste heat recovery
➢ Smart City Sweden is a state-funded platform for sustainable city solutions that engages global delegations interested in investing in smart & sustainable city solutions from Sweden. Smart City Sweden has supported waste heat recovery companies like Againity, Climeon, and Swerod.
➢ Sweden has the largest percentage of industrial heat recovery in its district heating systems in the world21. In Sweden, 20% of buildings use geothermal heat pumps.
Organic rankine cycle (ORC) tech, converting hot water-to-electricity for geothermal, power generation, maritime.
Sweden
Electrified turbomachinery products for improving internal combustion engines.
Southampton, UK
• Description: Waste heat from a range of different processes is captured and reused, either within the same process, on the same site, or by another company/market.
• External potential: Market estimated to be around $50.4 billion globally, with an 8% CAGR through 2025.20 Enhancing heat transfer and optimizing system performance is cheaper than building new systems, players are building retrofit systems in-house.74
• Timing: New recovery technologies providing opportunities to capture low-grade heat from broader range of sources. Industrial market leads with exhaust heat, flue gas from burners and boilers as the major heat source. With technological advances, there are growing opportunities for low-temperate heat capture, which was previously expensive and inefficient. Europe is the largest supplier of waste heat-to-power systems, driven by emission regulations, but China is the fastest growing, driven by industrialization.
• CO2 reduction potential: Electric turbo compounding technology can reduce engine exhaust, fuel consumption, CO2 emissions of existing system by 15%, or generate 10% extra power. In North America and Europe, water heat recovery could replace 1.5b MWh annually of the natural gas consumption used to provide space heating and domestic hot water.75
• Environmental impact reduction potential: Efficiency gains allow for less use of oil and other feedstock use, less eventual waste of raw materials.
External Potential
Timing of Trend
4 4
Example innovators
Summary
Key ClustersSweden
United Kingdom➢ $67 million from the UK Industrial Strategy Challenge Fund awarded to 4 smart energy pilot projects, including
Smart Hubs Smart Local Energy System project will combine air-source heat pumps and gas boilers into 250 properties, supplied by Passiv Systems, and Switch2 Energy will create a heat network fed by a marine-source heat pump provided by ICAX.
➢ The Energy Superhub Oxford private-public project in pilots using 320 ground heat pumps connect to batteries across UK (Habitat Energy, Kensa, Oxford City Council, RedT Energy and the University of Oxford).
➢ Increasing demand in UK, driven by Renewable Heat Incentive (RHI) tariff extension.

Diversity in mgmt. / ownership
Innovators and Ecosystems: Waste Heat Recovery
42
EcosystemFundraising by Year and Type
Company Size (Paid-in Capital and Employees)
Local Participants
External Participants
2
Alignment w/ Strength
Source: Cleantech Group i3 Database
Incubators / Accelerators
Grants
Angel Financing
Equity Financing
Debt Financing
Customers
Talent Pipelines
Partnerships
Emissions Reduction
• University of Canterbury
• University of Auckland
• Pacific Channel
• 98mn tonnes CO2 annual for 100K systems
• 5-7% fuel savings, up to 10% additional power.
• 500mn tones CO2 per annum
• 5-7% conversion of waste heat energy to electricity
(Auckland, NZ)(En Harod, Israel /
Utah, US) (Malmö, Sweden) (Dublin, Ireland)
(Southampton, UK) (Sweden)
• The UK BEIS Industrial Energy Efficiency Accelerator
• Climate-KIC • Net Zero Mission
• Swedish Energy Agency
• UK Department for Business, Energy, and Industrial Strategy
• Irish Gov. Disruptive Tech. Innovation Fund
• Enterprise Ireland• EU Horizon 2020
• Swedish Energy Agency• Israeli Ministry of Industry,
Trade and Labor• EASME - EU Executive Agency
for SMEs
• Auckland UniServices
• Peter Enberg
• Breakthrough Energy
• Gullspång Invest, LMK Forward, Blue
• Ombu Group, Octopus Ventures, Fjord Capital, Asster, I2BF Global Ventures, WHEB, RAB Capital
• Keiretsu Forum Northwest, NDRC
• OGCI Climate Investments
• Tene Capital. Kibbutz EH
• The Swedish Export Credit Corp
• DNB, EU Investment Fund
• Boost&Co
• SSAB• Geo40
• Baseload Power Taiwan, WWF, Virgin Voyages
• Viking Line
• Luleå Uni of Technology,
• Uni of Göttingen
• Aggreko• Powertech System
Integrators
• + 800 systems deployed worldwide across 20 countries.
• Cummins, Wartsila
• Uni. of Leicester• Uni. of Cambridge
• Cummins
• Uni. College Dublin• Dublin Institute of
Technology• Loughborough Uni.
• SWEP
• Burger King Sweden & Scandanavia
• Svecon
• Lund University• Umea University
• Abengoa Solar. A.O. Smith
• Tel Aviv University• Weber State
University0
20
40
60
80
100
0
10
20
30
40
50
60
Vortex Qnergy Enjay Exergyn Bowman Climeon
Mill
ions
Capital Number of Employees
0
5
10
15
20
25
2017
2010
2015
2016
2018
2014
2016
2007
2010
2014
2016
2018
Vortex Qnergy Enjay Exergyn Bowman Power Climeon
Mill
ions
Seed Series A Series BGrowth Equity Grant Structured Debt
Zero-carbon method of capturing low-grade waste heat from
thermal processes to generate electricity
Micro-combined heat and power (CHP), solar power generation,
and remote power
Profitable energy recovery from restaurant ventilation
Technology that commercially converts low-grade waste heat
to power
Electrified turbomachinery products for improving internal
combustion engines
ORC tech, converting hot water-to-electricity for geothermal, power generation, maritime
Acquirer

NZ Ecosystem in Global Context: Waste Heat Recovery
43
40%
25%
35%
Overview
R&D-to-commercializationpipeline strength
Connection to demand
4
4
2
7
8
7
6
4
6
7
8.5
6.5
New Zealand Sweden Netherlands United Kingdom
Evaluation 3.3 7.3 5.5 7.2
• Increasing significant projects (e.g. waste water heat recovery at new Christchurch sports complex) but slow-growing pool of innovators. 76
• Gen Less (EECA) has identified key potential markets in NZ (especially in dairy process heat) and is carrying out international technology scans77
• Beyond Vortex, limited examples of home-grown innovation
• Gen Less finances waste heat recovery on an individual project basis.
• Some participation from private investors (e.g. Pacific Channel investment in Vortex), but still limited.
• Collaborations possible with outside companies and other fast-growing innovators (Geo40 – Climeon partnership is good template).
• Gen Less connecting businesses to providers of waste heat recovery equipment, provides a conduit into local markets.
• Waste heat recovery baked into many industrial and commercial processes and new construction projects (e.g. data centres) are leveraging the technology
• Support from Swedish Energy Agency for early-stage innovators (including Climeon and Enjay)
• Local supply chains able to support technology commercialization (Climeon units produced by Swedish Mastec)
• 11 deals for $59 m between 2011 – 2021
• Support at the early stages from gov’t and EU agencies
• At the later stages, pan-European funds and corporates participating (e.g. Breakthrough – Baseload, Climeon)
• Baseload Capital bringing innovators into global geothermal projects (e.g. Climeon in Taiwan)
• Energy companies participating as investors (Chevron – Baseload) and partners (SSAB – Climeon)
• Local heavy industry provides significant testing network and programmes for innovators through Horizon 2020 have set up a robust partnership network
• REWARDHeat programme under Horizon 2020 brings together 27 corporates and research universities at 8 demonstration sites to develop waste heat capture and use technology.
• Research and spin-outs happening at TU Delft (e.g. Nowi Energy)
• 4 Deals for $12 m between 2011 – 2021
• Specialized local energy & environment investors, e.g. Dutch Greentech Fund
• Early-scale research and industry demand only being bridged partially
• Energy service / maintenance companies engaging with innovators as technology partners (e.g. Alliander – Kiwa, LF Energy, Spectral, Locamotion)
• Local and global corporates engaging innovators as customers for manufacturing solutions (e.g. Carlserg, BMW, Smurfit – HeatMatrix Group
• 40% of UK industrial energy use is in process heating, creating a wide surface area for application. Government has programmes for technology development and application
• Universities (Bath, LSE) generating research on opportunities for technology application in UK industries.
• Grants from Department for Business, Energy, and Industrial Strategy (BEIS) including the Energy Entrepreneurs Fund
• 23 deals for $68.8 m between 2011 – 2021
• Strong mix of local investors (Fjord, Ombu, Octopus) and global corporates (BP Ventures)
• Global accelerators engaging local innovators (e.g. Techstars –Supercritical)
• Local uptake (hotels, health clubs) of technology supports expansion in home market
• Global energy equipment and systems integrators working with UK innovators (e.g. Speed ElectroService, Projectioneering, Alternative Energy Systems, Powertech Systems Integration – Bowman Power Group)
1
Ability to Lead
Financing strength

Takeaways: Waste Heat Recovery
44
Takeaways for NZ Climate Tech Innovators• Many areas of potential collaboration between innovators creating
unique technology around waste heat capture and those innovating for use of waste heat – see Geo40 and Climeon partnership as an example of cross-sectoral (and international) collaboration. NZ capabilities around geothermal as an industrial process input can potentially be leveraged as an advantage.
• Multilateral financing organisations (OGCI, Climate-KIC, Breakthrough Energy) providing significant support to the sector in Europe, NZ innovators should seek out multilaterals that support the Pacific region and be aware of projects that may have multilateral backing (e.g. ADB, AIIB) that are occurring in the Pacific.
Takeaways for NZ Climate Tech Ecosystem• Uptake of waste heat recovery innovation is happening through
large-scale manufacturers and energy companies – the ecosystem should look for opportunities to market NZ waste heat-to-value value chain solutions to such manufacturers versus on-off solutions.
• Look to areas of manufacturing locally that can benefit from geothermal and waste heat inputs for production methods – food & beverage products (e.g. Miraka), materials & chemicals (e.g. Geo40), and support innovators in accessing end-market customers overseas.
• High CAPEX involved with pilot-testing waste heat applications, successful companies are supported by a dynamic Series B and beyond (growth equity, structured debt) financing mix.

45
Contents
Energy & Power – Comparison between Small Advanced Economies (SAEs)
Energy & Power Analysis
Waste Heat Recovery
Smart Home Energy Analytics
Electrochemical energy storage
Geothermal
Energy efficiency - digital platforms
Hydrogen - transport & refueling
CONTENTS

Smart Home Energy Analytics Innovation in SAEs
46
Smart Home Energy Analytics Investments (2010 – 2020) and Funded Innovators in SAEs

Smart Home Energy Analytics – Trend Analysis
47
➢ Equinor Ventures invests in ambitious, early-stage energy companies (including eSmart). Statkraft drives partnerships that will transform industry and aims to demonstrate leadership in new technologies, invested in Deepki and Metron.
➢ Cleantech Scandinavia supports innovation throughout Scandinavia and the Baltics, connecting innovators with investors, cities, corporates and government organisations.
➢ BKK GreenInvest, Nysno are investors in sustainable businesses and technologies.
➢ Research Council of Norway distributes funding for a portfolio of energy, transport and low emissions projects.
Developer of smart home and energy services. Platform provides real time efficiency and price data to help lower consumption and includes smart EV charging(Førde, Norway)
Provider of energy management systems which help utilities improve customer engagement(Gothenburg, Sweden)
• Description: Consumer-centric monitoring and smart control of energy consumption enabling platform-level data collection and analytics• External potential: Estimated market of $7.7bn in 2019, expected to grow to around $27bn in 2025 (23.3% CAGR)80. Power-as-a-service business models are enabled by
improvements in sensor and connectivity technology and decreasing cost of AI and analytics. Mostly national, US market is consolidating, leading EU innovators beginning to internationalize, emerging trend in Asia, powered by electricity market deregulation
• Timing: Smart features could reduce the friction associated with consumption shifts, which have been difficult to implement before now. Data-driven business models require attention to privacy issues.
• CO2 reduction potential: up to 2.93Gt CO2e81
• Environmental impact reduction potential: May encourage switch to more energy efficient devices, predictive analytics could extend appliance lifetimes. Load-shaping reduces deployment of (usually fossil fuel powered) peak load. More efficient load-balancing at system level could eventually lead to avoidance of grid extensions.
External Potential
Timing of Trend
3 3
Example innovators
Summary
Key ClustersNorway
Sweden➢ Vattenfall was an early pioneer in smart home technology, with an unsuccessful project cancelled in 2001. Company is
focused on digitalisation of the value chain.
➢ University of Gothenburg, Chalmers university. Eliq was born out of a master’s thesis and the company actively pursues internship and thesis collaborations.
➢ Cleantech Scandinavia supports innovation throughout Scandinavia and the Baltics, connecting innovators with investors, cities, corporates and government organisations.
➢ National research institution Ri.Se partners with industry, academia and the public sector to find solutions for sustainable energy systems.

Innovators and Ecosystems: Smart Home Energy Analytics
48
EcosystemFundraising by Year and Type
Company Size (Paid-in Capital and Employees)
Local Participants
External Participants
1
Alignment w/ Strength
Source: Cleantech Group i3 Database
Incubators / Accelerators
Grants
Angel Financing
Equity Financing
Debt Financing
Customers
Talent Pipelines
Partnerships
Emissions Reduction
Diversity in mgmt. / ownership
3/9 in C-suite women, 2/9 non-
white
• University of Otago
(Auckland, NZ) (Førde, Norway) (Gothenburg, Sweden) (Toronto, Canada) (Colorado, US)
• 5.33 TWh offset
• Plug and Play Tech centre
• Ontario Ministry of Energy • RFF Vest
• Greenstart• Ontario Emerging Technologies Fund• CBC Investment
Group
• Petter Stordalen, BKK GreenInvest
• Rubicon Venture Capital , Morgan Stanley, Zoma Capital, Engie, NV, Sunpower, Siemens, GE
• Export Development Canada, Ontario Capital Growth Corporation, BDC Capital
• Amazon,, AGL Energy, Tech Capital, GXP, ThomvestVentures , Relay Ventures
• Inven Capital , Contrarian Ventures
• Eight Roads Ventures• Balderton Capital• Founders Fund• WellStreet
• Nordea
• 80 global utilities• Bristol Energy, Green
Yellow• Vattenfall, CGE
Eidsiva, Bixia
• Customers in Sweden, Norway & Germany
• Google• Enel X• Ecobee
• Stanford University• Syracuse University
• Enbala• Carrier• Uplight
• Cambridge University, Queens University
• Uni. Western Ontario, Uni/ of Waterloo
• Grönare
• Chalmers University of Technology
• University of Gothenburg
• NTNU• University of Cambridge,
KTH Royal Institute, Tesla
(London, UK)
• Free Electrons• CrowdCube, UK Dept
for Business, Energy, and Industrial Strategy
• Ofgem
• InnoEnergy• Earthworm, Centrica
• Energy Web
• Centrica
• University of Hertfordshire
• University of Manchester
• 9.3% reduction in energy usage with smart heating
0
100
200
300
400
500
600
0
20
40
60
80
100
120
140
160
Osho Verv Tibber Eliq Ecobee Uplight
Mill
ions
Capital Number of Employees
0
20
40
60
80
100
120
2017
2019
2017
2020
2016
2020
2010
2016
2005
2008
2010
2012
2015
2020
Osho Verv Tibber Eliq Ecobee Uplight
Mill
ions
Seed Series A Series B Growth Equity Grant
Home operation / automation Developer of smart home and energy services
Provider of energy management solutions to help with
engagement for utilities
home monitoring and data analytics platform
Smart thermostats for residential and commercial
applications
Provider of Energy Services Management (ESM) solutions
Acquirer

NZ Ecosystem in Global Context: Smart Home Energy Analytics
49
40%
25%
35%
Overview
R&D-to-commercializationpipeline strength
Connection to demand
3
2
4
7
5
6
4
6
4
8
7
9.5
New Zealand Sweden Norway Colorado, US
Evaluation 3.1 6.2 4.5 8.3
• High penetration of renewables (~85%6) and high level of smart meter uptake in NZ homes (estimated 70-90%5),
• Talent - 8,605 full-time computer science and IT students in NZ universities 7
• Early-stage support infrastructure for energy efficiency innovators developing (Lightning Lab Electric, Callaghan Digital Energy Hub).
• Low presence of specialized energy investors in ecosystem, both domestic and foreign.
• Some corporate and utility participation in innovation ecosystem, e.g. Lightning Lab Electric support from General Electric, Westpac, and Genesis Energy. 84
• High penetration of renewables (54%), microgrids, and district heating create baseline market for home energy efficiency. Large “prosumer” class.
• Swedish Energy Agency supplies early-stage innovators with grants, project finance, and loans (~$20m since 2011).
• Chalmers University and Uppsala University have early-stage commercialization funds with energy seed investments.
• 17 smart home energy efficiency deals totaling $33.3 m 2011-2021.
• EU investors contributing significant % of capital (e.g. Innoenergy, Inven, Contrarian).
• IKEA investing in and partnering with energy efficiency and storage start-ups.
• Foreign customers buying smart home energy solutions from Swedish innovators (e.g. Bristol Energy – Eliq deal).
• Innovators tapping into neighbouring markets (see Norway analysis)
• Special challenges to solve related to distributed generation resources, specific opportunities due to high electric vehicle ownership.
• R&D efforts in smart home energy still developing - In 2016 the Norwegian National Smart Grid Laboratory at Norwegian University of Science & Technology (NTNU) and SINTEF Energy research was formally opened.12
• 6 deals for $107 m 2011-2021, low volume of domestic investors but strong ability of ecosystem to attract investments where high-potential start-ups lie.
• Utilities bringing innovators into market – Innlandskraft partnered with Eliq (Sweden) to pilot test in 1,100+ homes8
• Corporate efforts focused mostly on grid modernization – distributed nature of generation resources makes home efficiency goals highly localized.
• De facto energy transition research capital of US – home to National Renewable Energy Laboratory (NREL) and Rocky Mountain Institute (RMI).
• National labs serves as magnet for talent and R&D commercialization (e.g. NREL IN2 incubator residential housing innovation programme).
• Office of Energy Efficiency & Renewable Energy invested nearly $2m into university energy efficiency engineering programmes in Colorado.3
• Early-stage accelerators (e.g. Techstars) have local operations investing in smart home
• 27 smart home energy efficiency deals 2011-2021 totaling $131m
• Local investors with successful smart home exist (supporting both local and outside start-ups)
• Start-ups able to achieve scale at home, and even carry out mergers & acquisitions in Colorado (e.g. Tendril and Simple Energy into Uplight).
• Energy majors Enel and Engie have formed technology partnerships with CO smart home innovators.
• NV Energy, Sunpower, Think Energy buying technology from CO smart home start-ups.
1
Ability to Lead
Financing strength

Takeaways: Smart Home Energy Analytics
50
Takeaways for NZ Climate Tech Innovators• Most of the world has not achieved the same level of renewables
penetration as NZ - pursue opportunities to carry out pilot tests and experiment with data from overseas customer bases where energy costs for customers may be a more pronounced pain point
• Energy service companies (ESCOs) and utilities may have financing or services bundles that they deliver to residential customers –consider opportunities to leverage these channels as an additional market conduit
• Experiment in remote regions of NZ to develop advantages around delivering value in off-grid or far-from-grid markets
Takeaways for NZ Climate Tech Ecosystem• Pursue opportunities for utilities to bring innovators into pilot tests
or even to market (e.g. example of Innlandskraft bringing Eliq to homes in Norway)
• Make efforts to concentrate innovation around Crown labs – the energy transition cluster in Colorado has been developed mostly around the gravitational pull of NREL and RMI but now is dynamic enough that start-ups can launch, raise funds, grow, and in some cases even be acquired in Colorado

51
Contents
Energy & Power – Comparison between Small Advanced Economies (SAEs)
Energy & Power Analysis
Waste Heat Recovery
Smart Home Energy Analytics
Electrochemical energy storage
Geothermal
Energy efficiency - digital platforms
Hydrogen - transport & refueling
CONTENTS

Energy Storage Innovation in SAEs
52
Energy Storage Investments (2010 – 2020) and Funded Innovators in SAEs
Funding Raised ($) Number of Companies Funding Raised ($)
Number of Companies
Energy Storage Investments (2010 – 2020) and Funded Innovators in SAEs (excluding Sweden)

Electrochemical Energy Storage – Trend Analysis
53
➢ Technion and five other top research universities collaborating on the Israel National Research centre for Electrochemical Propulsion (INREP) to reduce Israel’s reliance on fossil fuels.
➢ Collaboration between City of Haifa, Technion, and Primus Power (US) to pilot at-scale grid batter storage
➢ The Israel-US Binational Industrial Research and Development (BIRD) Foundation invests annually ($7.15 m in 2020) in cleantech collaboration projects between Israeli and American companies
Developer of high-density energy storage systems based on metal-air battery technologies
Lod, IsraelDeveloper of high-performance batteries and battery systems with one of Europe’s largest battery factories, due to start production in 2021.
Stockholm, Sweden
• Description: Energy storage systems generating energy from chemical reactions, with applications in consumer electronics and EV sectors
• External potential: $120bn global market in 201889. Global manufacturing tripled from 2013 to 2018, driven by increasing EV demand. Over the same period costs decreased by 73%. Demand for EVs and storage, combined with further performance improvements and cost decreases, are expected to contribute to at least a further 700% sales growth to 2040.
• Timing: With over 350 new EV models planned by manufacturers for the coming years, and increasing demands for energy storage, this sector is on a sustained growth trajectory. Manufacturing was originally concentrated in Asia (especially China, Japan and Korea). With €60bn committed investment in production capacity, the EU may attain shares of up to 25% by 2028. North America is also investing in capacity.
• CO2 reduction potential: With 80% EV adoption and 80% grid decarbonization, 2050 vehicle emissions can be reduced to 20% of 1990 levels90
• Environmental impact reduction potential: Chemical batteries are not carbon neutral and end-of-life strategies (second life or recycling) are important to avoid negative environmental impact. Extraction and processing of raw materials is also a challenge to be addressed.
External Potential
Timing of Trend
4 4
Example innovators
Summary
Key ClustersIsrael
Sweden➢ Norsk Hydro and Vatenfall are actively purchasing from and partnering with innovators through joint ventures,
project developments, and technology developments, accelerating growth of key start-ups (Northvolt, SaltX, ferroamp)
➢ The Swedish Energy Agency has deployed over $200m in capital to clean energy start-ups in the form of grant, loans, and project financing since 2011.
➢ ALMI Invest is a Swedish is a $150m evergreen fund with half of its capital from European Union structural funds, and has invested over $50m in clean energy start-ups since 2011.
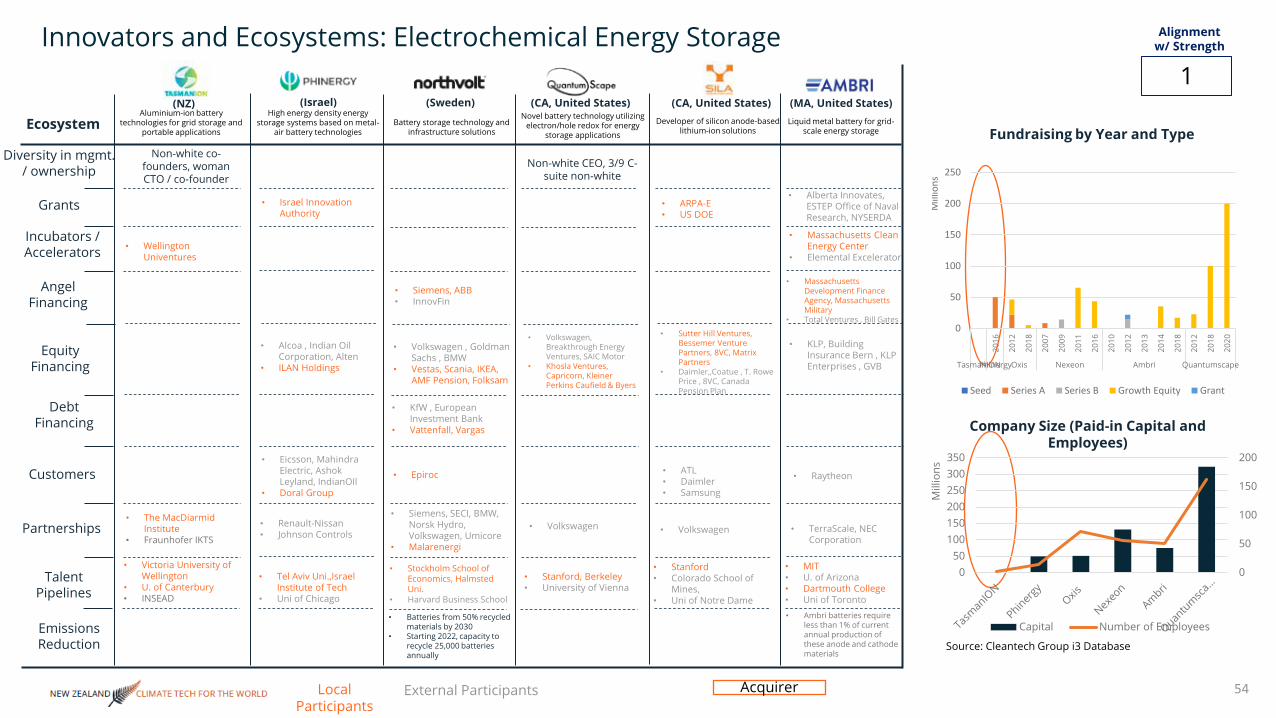
Innovators and Ecosystems: Electrochemical Energy Storage
54
EcosystemFundraising by Year and Type
Company Size (Paid-in Capital and Employees)
Local Participants
External Participants
1
Alignment w/ Strength
Source: Cleantech Group i3 Database
• Wellington Univentures
Incubators / Accelerators
Grants
Angel Financing
Equity Financing
Debt Financing
Customers
Talent Pipelines
Partnerships
(NZ)
Emissions Reduction
Diversity in mgmt. / ownership
Non-white co-founders, woman CTO / co-founder
Non-white CEO, 3/9 C-suite non-white
• The MacDiarmid Institute
• Fraunhofer IKTS
• Victoria University of Wellington
• U. of Canterbury• INSEAD
• Ambri batteries require less than 1% of current annual production of these anode and cathode materials
• Batteries from 50% recycled materials by 2030
• Starting 2022, capacity to recycle 25,000 batteries annually
(Israel) (Sweden) (CA, United States) (CA, United States) (MA, United States)
• Massachusetts Clean Energy Center
• Elemental Excelerator
• Alberta Innovates, ESTEP Office of Naval Research, NYSERDA
• ARPA-E• US DOE
• Israel Innovation Authority
• Massachusetts Development Finance Agency, Massachusetts Military
• Total Ventures , Bill Gates
• Siemens, ABB• InnovFin
• KLP, Building Insurance Bern , KLP Enterprises , GVB
• TerraScale, NEC Corporation
• Raytheon
• MIT• U. of Arizona• Dartmouth College• Uni of Toronto
• Volkswagen
• ATL• Daimler• Samsung
• Stanford• Colorado School of
Mines,• Uni of Notre Dame
• Stanford, Berkeley• University of Vienna
• KfW , European Investment Bank
• Vattenfall, Vargas
• Volkswagen , Goldman Sachs , BMW
• Vestas, Scania, IKEA, AMF Pension, Folksam
• Siemens, SECI, BMW, Norsk Hydro, Volkswagen, Umicore
• Malarenergi
• Epiroc
• Stockholm School of Economics, Halmsted Uni.
• Harvard Business School
• Alcoa , Indian Oil Corporation, Alten
• ILAN Holdings
• Renault-Nissan• Johnson Controls
• Eicsson, Mahindra Electric, Ashok Leyland, IndianOIl
• Doral Group
• Tel Aviv Uni.,Israel Institute of Tech
• Uni of Chicago
• Volkswagen
• Volkswagen, Breakthrough Energy Ventures, SAIC Motor
• Khosla Ventures, Capricorn, Kleiner Perkins Caufield & Byers
• Sutter Hill Ventures, Bessemer Venture Partners, 8VC, Matrix Partners
• Daimler,,Coatue , T. Rowe Price , 8VC, Canada Pension Plan
0
50
100
150
200
050
100150200250300350
Mill
ions
Capital Number of Employees
0
50
100
150
200
250
2016
2012
2018
2007
2009
2011
2016
2010
2012
2013
2014
2018
2012
2018
2020
TasmanIONPhinergyOxis Nexeon Ambri Quantumscape
Mill
ions
Seed Series A Series B Growth Equity Grant
Aluminium-ion battery technologies for grid storage and
portable applications
High energy density energy storage systems based on metal-
air battery technologiesBattery storage technology and
infrastructure solutions
Novel battery technology utilizing electron/hole redox for energy
storage applications
Developer of silicon anode-based lithium-ion solutions
Liquid metal battery for grid-scale energy storage
Acquirer
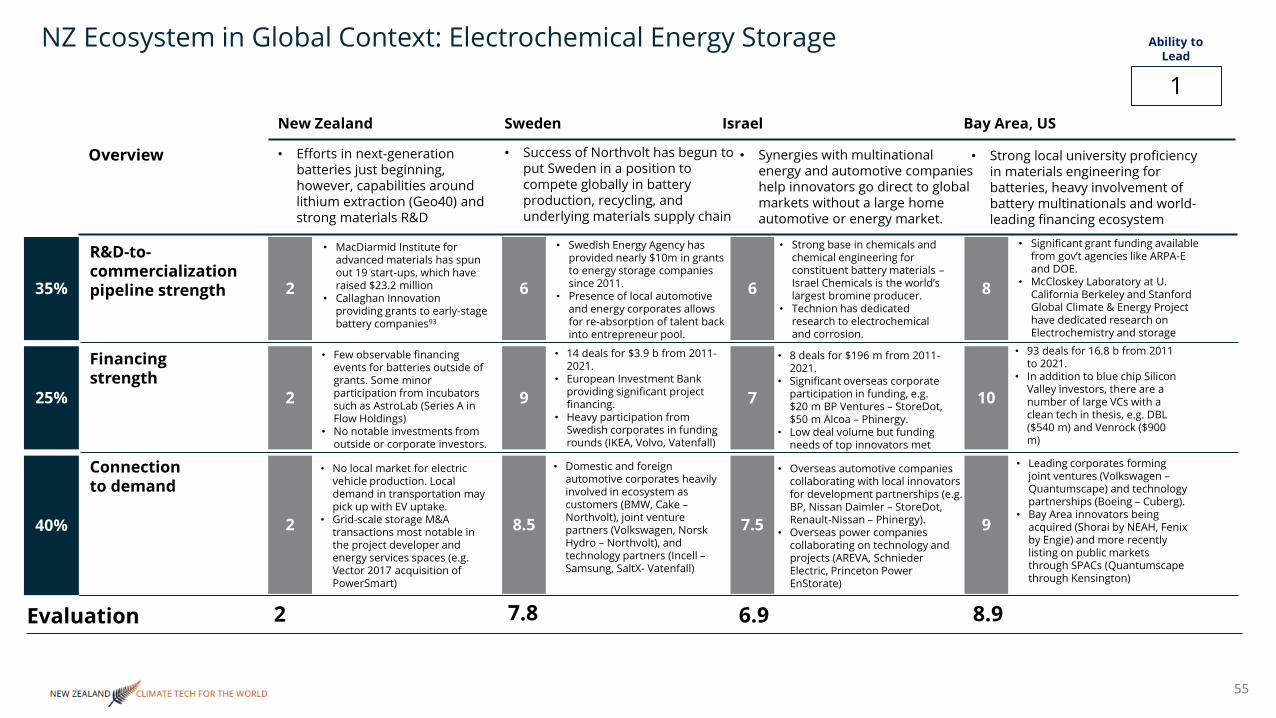
NZ Ecosystem in Global Context: Electrochemical Energy Storage
55
40%
25%
35%
Overview
R&D-to-commercializationpipeline strength
Connection to demand
2
2
2
8.5
9
6
7.5
7
6
9
10
8
New Zealand Sweden Israel Bay Area, US
Evaluation 2 7.8 6.9 8.9
• Efforts in next-generation batteries just beginning, however, capabilities around lithium extraction (Geo40) and strong materials R&D
• MacDiarmid Institute for advanced materials has spun out 19 start-ups, which have raised $23.2 million
• Callaghan Innovation providing grants to early-stage battery companies93
• Few observable financing events for batteries outside of grants. Some minor participation from incubators such as AstroLab (Series A in Flow Holdings)
• No notable investments from outside or corporate investors.
• No local market for electric vehicle production. Local demand in transportation may pick up with EV uptake.
• Grid-scale storage M&A transactions most notable in the project developer and energy services spaces (e.g. Vector 2017 acquisition of PowerSmart)
• Success of Northvolt has begun to put Sweden in a position to compete globally in battery production, recycling, and underlying materials supply chain
• Swedish Energy Agency has provided nearly $10m in grants to energy storage companies since 2011.
• Presence of local automotive and energy corporates allows for re-absorption of talent back into entrepreneur pool.
• 14 deals for $3.9 b from 2011-2021.
• European Investment Bank providing significant project financing.
• Heavy participation from Swedish corporates in funding rounds (IKEA, Volvo, Vatenfall)
• Domestic and foreign automotive corporates heavily involved in ecosystem as customers (BMW, Cake –Northvolt), joint venture partners (Volkswagen, Norsk Hydro – Northvolt), and technology partners (Incell –Samsung, SaltX- Vatenfall)
• Synergies with multinational energy and automotive companies help innovators go direct to global markets without a large home automotive or energy market.
• Strong base in chemicals and chemical engineering for constituent battery materials –Israel Chemicals is the world’s largest bromine producer.
• Technion has dedicated research to electrochemical and corrosion.
• 8 deals for $196 m from 2011-2021.
• Significant overseas corporate participation in funding, e.g. $20 m BP Ventures – StoreDot, $50 m Alcoa – Phinergy.
• Low deal volume but funding needs of top innovators met
• Overseas automotive companies collaborating with local innovators for development partnerships (e.g. BP, Nissan Daimler – StoreDot, Renault-Nissan – Phinergy).
• Overseas power companies collaborating on technology and projects (AREVA, Schnieder Electric, Princeton Power EnStorate)
• Strong local university proficiency in materials engineering for batteries, heavy involvement of battery multinationals and world-leading financing ecosystem
• Significant grant funding available from gov’t agencies like ARPA-E and DOE.
• McCloskey Laboratory at U. California Berkeley and Stanford Global Climate & Energy Project have dedicated research on Electrochemistry and storage
• 93 deals for 16.8 b from 2011 to 2021.
• In addition to blue chip Silicon Valley investors, there are a number of large VCs with a clean tech in thesis, e.g. DBL ($540 m) and Venrock ($900 m)
• Leading corporates forming joint ventures (Volkswagen –Quantumscape) and technology partnerships (Boeing – Cuberg).
• Bay Area innovators being acquired (Shorai by NEAH, Fenix by Engie) and more recently listing on public markets through SPACs (Quantumscape through Kensington)
1
Ability to Lead
Financing strength

Takeaways: Electrochemical Energy Storage
56
Takeaways for NZ Climate Tech Innovators• Pursue opportunities to engage open innovation with global
automotive and energy companies – strategic investors from industry incumbents is a critical source of equity financing through the growth stages of battery companies
• Leading battery companies are now taking ownership over parts of the supply chain (e.g. Northvolt, Tesla), attempt to access unique innovations in supply chain and reverse logistics within NZ to develop a unique model around materials handling
Takeaways for NZ Climate Tech Ecosystem• Avoid isolated approaches to supporting development of battery
technology – supply chain elements (raw materials and refining) and value chain elements (opportunities to apply in utilities, electric vehicle infrastructure, microgrids, etc.) and reverse logistics (battery recycling and material recovery) need to be built up to create opportunities for success in battery innovation
• Lack of domestic automobile producers makes the importance of utilities’ engagement with innovators more pronounced
• Lack of chemicals industrial base (most NZ chemicals imported) creates a distinct disadvantage, try to build up capabilities around materials recovery and re-use (e.g. Avertana and Mint Innovation), industrial waste processing (e.g. Geo40) and connect with battery innovators
57
Contents
Energy & Power – Comparison between Small Advanced Economies (SAEs)
Energy & Power Analysis
Waste Heat Recovery
Smart Home Energy Analytics
Electrochemical energy storage
Geothermal
Energy efficiency - digital platforms
Hydrogen - transport & refueling
CONTENTS

Geothermal Innovation in SAEs
58
Geothermal Investments (Including Iceland) (2010 – 2020) and Funded Innovators in SAEs
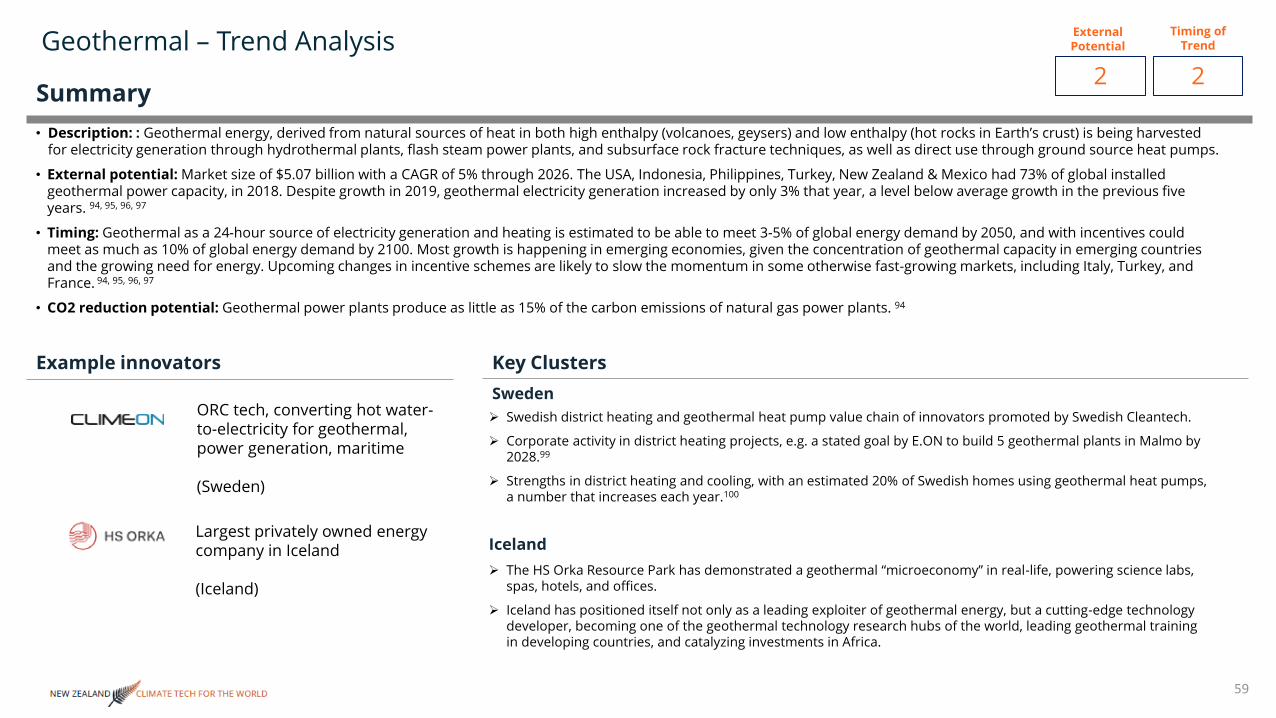
Geothermal – Trend Analysis
59
➢ Swedish district heating and geothermal heat pump value chain of innovators promoted by Swedish Cleantech.
➢ Corporate activity in district heating projects, e.g. a stated goal by E.ON to build 5 geothermal plants in Malmo by 2028.99
➢ Strengths in district heating and cooling, with an estimated 20% of Swedish homes using geothermal heat pumps, a number that increases each year.100
ORC tech, converting hot water-to-electricity for geothermal, power generation, maritime
(Sweden)
Largest privately owned energy company in Iceland
(Iceland)
• Description: : Geothermal energy, derived from natural sources of heat in both high enthalpy (volcanoes, geysers) and low enthalpy (hot rocks in Earth’s crust) is being harvested for electricity generation through hydrothermal plants, flash steam power plants, and subsurface rock fracture techniques, as well as direct use through ground source heat pumps.
• External potential: Market size of $5.07 billion with a CAGR of 5% through 2026. The USA, Indonesia, Philippines, Turkey, New Zealand & Mexico had 73% of global installed geothermal power capacity, in 2018. Despite growth in 2019, geothermal electricity generation increased by only 3% that year, a level below average growth in the previous five years. 94, 95, 96, 97
• Timing: Geothermal as a 24-hour source of electricity generation and heating is estimated to be able to meet 3-5% of global energy demand by 2050, and with incentives could meet as much as 10% of global energy demand by 2100. Most growth is happening in emerging economies, given the concentration of geothermal capacity in emerging countries and the growing need for energy. Upcoming changes in incentive schemes are likely to slow the momentum in some otherwise fast-growing markets, including Italy, Turkey, and France. 94, 95, 96, 97
• CO2 reduction potential: Geothermal power plants produce as little as 15% of the carbon emissions of natural gas power plants. 94
External Potential
Timing of Trend
2 2
Example innovators
Summary
Key ClustersSweden
Iceland➢ The HS Orka Resource Park has demonstrated a geothermal “microeconomy” in real-life, powering science labs,
spas, hotels, and offices.
➢ Iceland has positioned itself not only as a leading exploiter of geothermal energy, but a cutting-edge technology developer, becoming one of the geothermal technology research hubs of the world, leading geothermal training in developing countries, and catalyzing investments in Africa.

Diversity in mgmt. / ownership
Ecosystem
Innovators and Ecosystems: Geothermal
60
Fundraising by Year and Type
Company Size (Paid-in Capital and Employees)
Local Participants
External Participants
3
Alignment w/ Strength
Source: Cleantech Group i3 Database
Incubators / Accelerators
Grants
Angel Financing
Equity Financing
Debt Financing
Customers
Talent Pipelines
Partnerships
(NZ)
Emissions Reduction
Woman CEO Woman CEO
• Callaghan Innovation
• Ice Angels
• Tohuku Electric• Norske Skog• Contact Energy• Mercury
• University of Otago
• Euroz Broker (AU)• Baseload Capital• Efu Investment• Lindsay Investments• Climeon• Jarden
(Switzerland) (New York, US)(Calgary, Canada) (Iceland)(Sweden)
• 90% reduction • 98mn tonnes CO2 annual for 100K systems
• Joules Accelerator • NYC ACRE• Switzerland Innovation
• Vickers Venture, BP Ventures, Temasek, Eversource Capital, Chevron Technology Ventures BDC Capital
• Royal Dutch Shell• Enex Power Germany
• Queen's University• University of
Saskatchewan
Breakthrough Energy, GV, Comcast Ventures , Collaborative Fund, NEA, Lennar, Building Ventures, Catchlight Venture, Zhen Fund, BoxGroup , Borealis Ventures , Transcendent Holdings
• ConEdison Solutions
• Stanford University• Northwestern
University• Harvard Law School
• Venture KICK, InnoSeed
• Ecole polytechnique fédérale de Lausanne
• Ecole Centrale Paris
• The Swedish Export Credit Corp
• DNB, EU Investment Fund
• Breakthrough Energy• Gullspång Invest, LMK
Forward, Blue
• SSAB• Geo40
• Baseload Power Taiwan
• WWF, Virgin Voyages, Viking Line
• Luleå Uni of Technolog,
• Uni of Göttingen
0
20
40
60
80
100
01020304050607080
Mill
ions
Capital Number of Employees
0
10
20
30
40
50
2015
2017
2019
2020
2018
2020
2012
2020
2020
2017
2018
2019
2020
2021
2019
2020
2021
Geo40 ClimeonKensaEnerdrapeDandelion Eavor
Mill
ions
Seed Series A Series BGrowth Equity Grant Structured Debt
Producer of silica from geothermal fluids after electricity generation
ORC tech, converting hot water-to-electricity for geothermal, power
generation, maritime
• Provincial Growth Fund
Developer of modular geo-thermal panels for
buildings
Largest privately owned energy company in
Iceland
Closed-loop conduction-only geothermal energy solutions
Software-enabled residential geothermal
systems
• Jarovarmi
• Carbon Recycling International
• Svartsengi• Reykjanes
Acquirer

NZ Ecosystem in Global Context: Geothermal
61
40%
25%
35%
Overview
R&D-to-commercializationpipeline strength
Connection to demand
5.5
5.5
6
8
8
8
7
6
4
7
9.5
4
New Zealand Iceland Sweden Calgary, CA
Evaluation 5.7 8 5.7 6.6
• One of the few nations with geothermal resources to support utility-scale projects. Innovators in geothermal energy, industrial processes, and digitalisation.
• Focused research on seismology occurring at Crown Research Institutes, especially GNS Science.
• Geothermal Institutes at U. Auckland.
• Institute of Earth Science and Engineering at U. Auckland and Auckland UniServices
• 8 deals for $41.5 m from 2011-2021
• Geo40 is a case of an NZ company bringing in investment from overseas partners and funds (e.g. Climeon and Baseload Capital)
• Where proficiencies are demonstrated, international partners are willing to collaborate on projects and pilots within NZ.
• Some adjacent technologies have successfully grown and exited, e.g. Seequent in the geothermal imaging and analysis, acquired by Bentley Systems 3/2021.
• Geothermal is critical to energy sector – 66% of primary energy use and 25% of all electricity generation.
• Iceland Energy University at U. Reykjavic and U. Iceland strong on geothermal engineering.
• Iceland is research hub for thermodynamics and renewable energy – U. Florida, NC State, U. Oregon have all offered study opportunities in Iceland to engineers.
• 4 deals for $385 m from 2011 – 2021
• Strong synergies with Chinese investors both directly in Iceland companies and in joint ventures.
• Home market is strong enough for companies to build entire business off – HS Orka alone serves 9% of country’s power needs and 10% heating.
• Strong industrial symbiosis culture – HS Orka Resource Park powers 9 businesses and hundreds of people working in the park.
• ~20% of Swedish homes have a geothermal heat pump, with 25,000 expanding every year. Significant market uptake. Corporates involved in district heating projects (e.g. E-on in Malmo)100, 99
• Geothermal energy research taking place at Uppsala U.
• Geothermal spinouts into start-ups not necessarily observed as a trend.
• 5 deals for $54.8 m from 2011 – 2021
• Innovators attracting capital from major international players (e.g. Baseload –Chevron, Breakthrough)
• Innovators able to crack overseas markets through partnerships and establishment of subsidiaries (e.g. Climeon in Taiwan, Climeon collaboration with Geo40)
• Coordinated effort by Swedish Cleantech to promote Swedish geothermal equipment value chain for district heating and heat pumps.
• Not traditionally a geothermal leader due to availability of other resources, but has seen strong innovation and at-scale deployment in recent years.
• Geothermal Energy Lab at U. Calgary, strong research in geosciences and geophysics.
• 9 deals for $1.27 billion 2011-2021• Significant involvement of leading
strategic investors (e.g. BP Ventures, Eversource Ventures, Chevron)
• Robust government financing from BDC Capital, Sustainable Development Technology Canada, Natural Resources Canada
• Deployment projects by Eavor have attracted corporate involvement, Royal Dutch Shell will support drilling, and Enex will help bring Eavor technology to Germany to build a geothermal heat and power projects
3
Ability to Lead
Financing strength

Takeaways: Geothermal
62
Takeaways for NZ Climate Tech Innovators• Innovators in geothermal expand heavily through partnerships with
both utilities and ESCOs (Geo40 has already done so) but also with other companies in the geothermal value chain
• NZ geothermal innovators should consider where their solutions add a unique value to production inputs or other downstream applications and form partnerships that can open new markets
Takeaways for NZ Climate Tech Ecosystem• Geothermal is a sector that NZ companies seem to be able to
access capital in, on a level similar to that of peers overseas. Multilaterals (e.g. Breakthrough Energy) are investing globally in the geothermal space. The value for investors is that NZ-created geothermal technologies (including waste heat) can be developed, piloted, and deployed in NZ
• The ecosystem should pull together innovators that can offer a value chain effect – geothermal extraction, usage in industrial processes, residential / commercial building usage, etc. and market as a suite of solutions to overseas companies
63
Contents
Energy & Power – Comparison between Small Advanced Economies (SAEs)
Energy & Power Analysis
Waste Heat Recovery
Smart Home Energy Analytics
Electrochemical energy storage
Geothermal
Energy efficiency - digital platforms
Hydrogen - transport & refueling
CONTENTS

Energy Efficiency Innovation in SAEs
64
Energy Efficiency Investments (2010 – 2020) and Funded Innovators in SAEsFunding Raised ($) Number of Companies
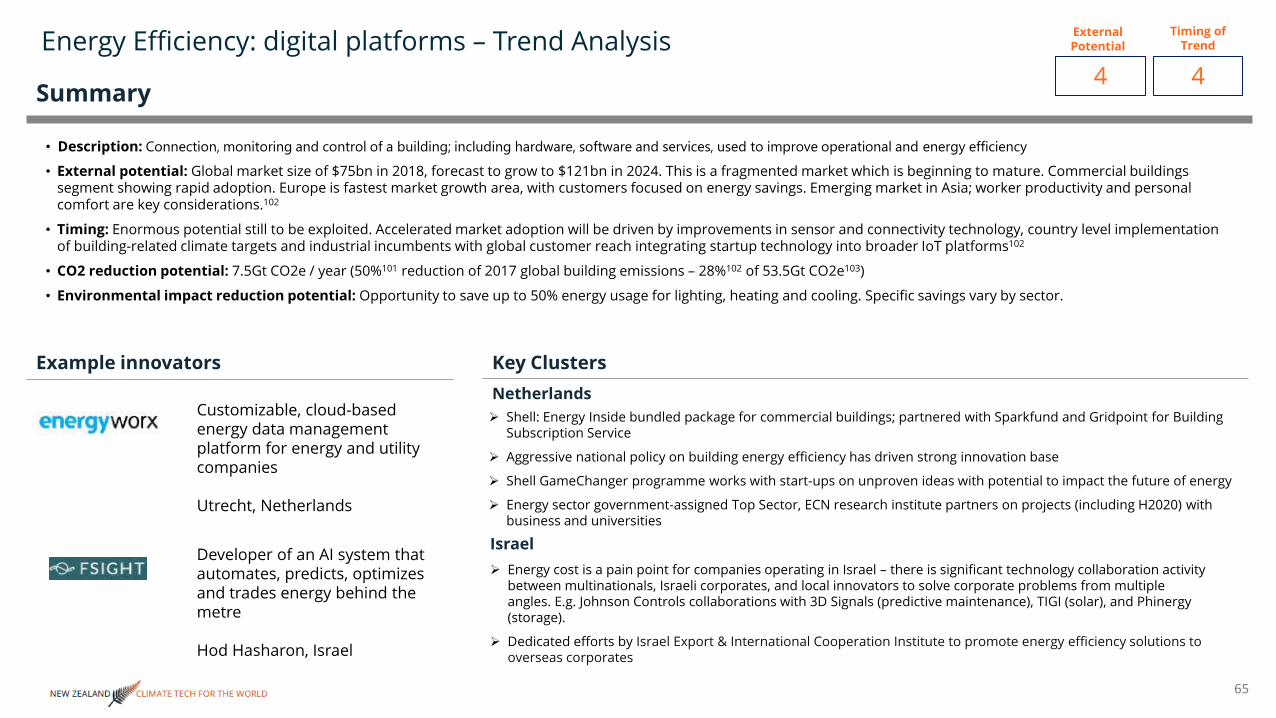
Energy Efficiency: digital platforms – Trend Analysis
65
➢ Shell: Energy Inside bundled package for commercial buildings; partnered with Sparkfund and Gridpoint for Building Subscription Service
➢ Aggressive national policy on building energy efficiency has driven strong innovation base
➢ Shell GameChanger programme works with start-ups on unproven ideas with potential to impact the future of energy
➢ Energy sector government-assigned Top Sector, ECN research institute partners on projects (including H2020) with business and universities
Customizable, cloud-based energy data management platform for energy and utility companies
Utrecht, Netherlands
Developer of an AI system that automates, predicts, optimizes and trades energy behind the metre
Hod Hasharon, Israel
• Description: Connection, monitoring and control of a building; including hardware, software and services, used to improve operational and energy efficiency• External potential: Global market size of $75bn in 2018, forecast to grow to $121bn in 2024. This is a fragmented market which is beginning to mature. Commercial buildings
segment showing rapid adoption. Europe is fastest market growth area, with customers focused on energy savings. Emerging market in Asia; worker productivity and personal comfort are key considerations.102
• Timing: Enormous potential still to be exploited. Accelerated market adoption will be driven by improvements in sensor and connectivity technology, country level implementation of building-related climate targets and industrial incumbents with global customer reach integrating startup technology into broader IoT platforms102
• CO2 reduction potential: 7.5Gt CO2e / year (50%101 reduction of 2017 global building emissions – 28%102 of 53.5Gt CO2e103)
• Environmental impact reduction potential: Opportunity to save up to 50% energy usage for lighting, heating and cooling. Specific savings vary by sector.
External Potential
Timing of Trend
4 4
Example innovators
Summary
Key ClustersNetherlands
Israel➢ Energy cost is a pain point for companies operating in Israel – there is significant technology collaboration activity
between multinationals, Israeli corporates, and local innovators to solve corporate problems from multiple angles. E.g. Johnson Controls collaborations with 3D Signals (predictive maintenance), TIGI (solar), and Phinergy (storage).
➢ Dedicated efforts by Israel Export & International Cooperation Institute to promote energy efficiency solutions to overseas corporates

Innovators and Ecosystems: Energy Efficiency: digital platforms
66
EcosystemFundraising by Year and Type
Company Size (Paid-in Capital and Employees)
Local Participants
External Participants
1
Alignment w/ Strength
Source: Cleantech Group i3 Database
Incubators / Accelerators
Grants
Angel Financing
Equity Financing
Debt Financing
Customers
Talent Pipelines
Partnerships
Emissions Reduction
Diversity in mgmt. / ownership 2/5 C-suite women
(Auckland, NZ) (Israel) (Utrecht, Netherlands)
(Singapore) (Paris, France) (Bay Area, US)
• 40% of U.S. carbon emissions created by buildings
• 10-15% total energy savings
• 5-12%
• Hotel room 30% every savings per year
• 10-40% savings (depending on sector)
• Elemental Excelerator• StartX Stanford
• EIT Digital Accelerator• Entrepreneur First• SparkLabs
• Free Electrons, Via-ID
• Steve Girsky • JB Straubel
• Pierre Lorinet• SGInnovate
• Cox Enterprises, CEAS Investments. GRC Sino Green Fund, JCI Ventures, Ulupono Initiative, Ekistic Ventures
• SV Tech Ventures , Radicle Impact
• NTT Docomo Ventures , Statkraft Ventures, , Breed Reply
• BNP Paribas. Financiere Fonds Prives
• Openspace Ventures , Gaw Capital , Aurum Investment
• ENGIE New Ventures, EDP Ventures
• SET Ventures, henQ
• New Zealand Green Investment Finance, unnamed strategic investors
• Generate Capital
• Onset
• Alexander & Baldwin, Carlyle Group. L&B Realty Advisors
• University of Cambridge
• Stanford University
• NTT Facilities, Nanyang Technological Uni. of Singapore. ADVANTIS . Edison
• Airflux. Dalkia
• Danone. Arcelormittal
• ESCP Europe• Université Paris - Val-
de-Marne (Paris XII)
• UCLAN• National University of
Singapore
• Google. ATOS. SIA Partners
• Greenbird
• EDP• Engie
• Berlin College, Avans University of Applied Sciences
• ASB Bank, Webstar, Goodman, Wilson Hellaby
• Tel Aviv University
• SBP Beteilgungsverwaltung
• SAP• LIMAK• RD Energy• Delek• OPC Energy
0
20
40
60
80
100
120
2015
2018
2016
2019
2020
2018
2019
2020
2018
2019
2018
2019
ESPBarghest Energyworx Sensor Flow MetronCarbon Lighthouse
Mill
ions
Seed Series A Series BGrowth Equity Grant Structured Debt
020406080100120140160
020406080
100120140
Mill
ions
Capital Number of Employees
Software and services for carbon emissions reduction
AI system that automates, predicts, optimizes and trades energy
behind the meterDeveloper of a platform analyzing energy data
Wireless room automation & energy
management solutions
Energy management platform for industrial
groups
Energy Savings-as-a-Service for commercial real estate portfolios
Acquirer

NZ Ecosystem in Global Context: Energy Efficiency: digital platforms
67
40%
25%
35%
Overview
R&D-to-commercializationpipeline strength
Connection to demand
3.5
2
4
8.5
8
7
5
5
6
10
10
9
New Zealand Israel Netherlands Bay Area, US
Evaluation 3.3 7.9 5.4 9.7
• Despite high renewables penetration, drivers for energy efficiency are still clear –businesses account for 48% of non-transport energy usage111, 112
• The NZ Energy Efficiency & Conservation Authority (EECA) is supporting up to 40% (max $100,000) funding for innovative energy efficiency technology development. 111
• Early-stage support (Lightning Lab Electric, CI Digital Energy Hub).
• Low presence of private sector energy investors in ecosystem, both domestic and foreign.
• Few significant fundraising events for NZ innovators.
• EECA is providing connections to energy-saving technology for high energy usage businesses and public sector organisations
• Some corporate and utility participation in innovation ecosystem, e.g. Lightning Lab Electric support from General Electric, Westpac, and Genesis Energy. 111
• Strong sensors and software industry provide local supply chain, cases of globally successful industrial efficiency platforms (Augury)
• Presence of multinationals that collaborate with Israel Electric Corporation has yielded spin-outs (e.g. Fsight).
• The Office of the Chief Scientist (Ministry of Energy) funds R&D in advanced energy and efficiency, including seed funding.
• 23 deals for $157 m between 2011 – 2021
• Corporate deeptech investors also participating in energy efficiency rounds (Qualcomm)
• Strong mix of local (Israel Cleantech Ventures) and global investors
• Israel Export & International Cooperation Institute, Ministry of Economy, collaborated to create the “Israeli Innovation for Energy Transition 2019” catalogue of innovators
• Mix of local market (commercial developments – Phoebus Energy) and international customers (McDonald’s, Sprint, IBM – Panoramic Power)
• Strong research in IoT technology development at the early stage and connections to EU programmes, domestic corporates skipping over domestic innovators
• Early-stage support available to energy efficiency innovators through Climate-KIC
• Research commercialization in IoT technologies occurring through Delft University and the centre for Wireless Technology Eindhoven
• 29 deals for $29 m between 2011 – 2021
• Strong cluster of incubators supporting energy efficiency –Techleap.nl, Shell E4, Rockstart
• Some local investors engaging local innovators (e.g. Enfuro –HelloEnergy)
• Heavy engagements in innovation ecosystems globally by leading Dutch corporates Royal Dutch Shell and Philips, but few domestic energy efficiency engagements.
• Domestic energy service and maintenance providers partnering selectively with innovators (e.g. Alliander –Spectral Energy)
• Highly concentrated digital technology hub, with critical corporate players and leading innovators (Carbon Lighthouse, Ohmconnect, Particle)
• University incubators spinning out market-beating energy efficiency technologies (e.g. Stanford StartX – Carbon Lighthouse, Verdigris, Brilliant).
• 119 deals for $1.76 b between 2011-2021
• Strong support at the early stages through leading accelerators like Y Combinator and Elemental.
• Investment from diverse corporate sectors
• Local corporates partnering with innovators (e.g. Nest – Ohmconnect) and heavy presence of outside corporates engaging ecosystem (Shell – igrenEnergi, Siemens, IBM –Vigilant, Dell – Modius)
• Heavy M&A activity (e.g. Johnson Controls – Qolsys, Siemens – Comfy, Kock – EFT Energy, Engie – Opterra Energy)
1
Ability to Lead
Financing strength

Takeaways: Energy Efficiency: digital platforms
68
Takeaways for NZ Climate Tech Innovators• Demonstrating integration capability is critical to achieving scale –
successful innovators, including those from SAEs, all have corporate partnerships (with leading software and sensor / hardware companies) as a common component of their growth journey.
• Energy efficiency pilots for corporate buildings / real estate portfolios can be carried out in essentially any urban setting, some companies (e.g. Fsight in Israel) have grown through a combination of solving efficiency issues for heavy users of energy locally and then working through larger corporate customers to achieve scale.
Takeaways for NZ Climate Tech Ecosystem• Synergies between an underlying hardware / sensor tech base and
software proficiencies can be observed in the case of Israel: over $300m raised by 60 energy efficiency companies since 2011, with $157m from 23 companies in software. It is clear that to some level, clustering developments of these components together is creating success for the overall industry.
• Israel has marketed the value chain of its energy efficiency solutions to overseas markets through a coordinated inter-departmental effort, with the result that international corporates are coming to Israel to buy energy efficiency technology.
• Volume of output is important to achieve the same results as Israel. As a contrast, about half of Netherlands investments in energy efficiency were in software (although in a much smaller number than Israel’s), and Netherlands’s corporates are buying energy efficiency technology from overseas innovators, in many cases skipping over the pool of domestic innovators.
• Conduits into corporate ecosystems are critical, both on partnerships and on product marketing – Silicon Valley companies enjoy an outsized benefit in global markets as a result of their ability to fund very expensive R&D and product development at home, while partnering with leading tech firms to co-develop technology, and market to industrial incumbents that have a presence in Silicon Valley or who are existing customers of leading tech companies.

69
Contents
Energy & Power – Comparison between Small Advanced Economies (SAEs)
Energy & Power Analysis
Waste Heat Recovery
Smart Home Energy Analytics
Electrochemical energy storage
Geothermal
Energy efficiency - digital platforms
Hydrogen - transport & refueling
CONTENTS

Hydrogen Innovation in SAEs
70
0
10
20
30
40
50
60
70
80
Dant
herm
Pow
er
Ever
fuel
Gree
n Hy
drog
en S
yste
ms
H2 Lo
gic
Sere
nerg
y
Tops
oe F
uel C
ell
CellE
ra
GenC
ell
H2Pr
o
Terr
agen
ic
Hirin
ga E
nerg
y
EH G
roup
Eng
inee
ring
GRZ
Tech
nolo
gies
H2 E
nerg
y
INER
GIO
SoHH
ytec
Denmark Israel NewZealand
Switzerland
Mill
ions
Structured Debt
Series B
Series A
Seed
Project Finance
Growth Equity
Grant
Hydrogen Investments (2010 – 2020) and Funded Innovators in SAEs

Hydrogen (transport & refueling) – Trend Analysis
71
➢ Shell working on multiple hydrogen refueling projects with on-site production, joint sponsor (with Toyota) of H2 Refuel Accelerator.
➢ TU Eindhoven and ECN involved in EU-sponsored hydrogen research projects
➢ Arnhem cluster brings together local SMEs and universities, transport infrastructure projects in the Netherlands, Latvia and Estonia120
➢ Government has targeted 3-4GW electrolyser capacity by 2030, €9bn investment plan, public-private partnership in hydrogen safety innovation; FCH-JU very active promoter of hydrogen throughout Europe
Developer of electrochemical compression equipment for refuelling stations
Arnhem, Netherlands
Installer and operator of hydrogen fueling stations
Herning, Denmark
• Description: Hydrogen refueling infrastructure and supply of hydrogen produced from renewables (green hydrogen) for transport applications, including FCEVs and heavy duty
• External potential: Growth driven by increasingly strict emissions regulation globally: hydrogen is the only feasible route to decarbonization in sectors such as heavy industry and some heavy-duty transport. Business models continue to evolve as value chain projects demonstrate optimal routes to commercialisation
• Timing: Sustained growth depends on balancing supply with demand scaling. Mass vehicle production and reducing delivered cost of fuel is a priority for trucks; shipping and aviation represent opportunities due to limited low-carbon fuel alternatives1,, heavy duty trucks and long-distance coaches expected to be competitive by 2030 and this will drive demand114. Clusters of innovation in Europe, USA, China, South Korea and Japan: 50% hydrogen startups globally are located in Europe115.
• CO2 reduction potential: 3.15Gt CO2e if 50% of global transportation converts to hydrogen116
• Environmental impact reduction potential: Trucks currently account for over one third of global diesel demand and 3% global energy use.117 Conversion of the fleet to hydrogen would also reduce air pollution, especially diesel particulate matter and nitrogen oxides118. As an alternative to EVs, FCEVs avoid the resource and energy-intensity of battery production119
External Potential
Timing of Trend
3 3
Example innovators
Summary
Key ClustersNetherlands
Denmark➢ Triangle region aims to be a global hub for green fuels, FCH-JU very active promoter of hydrogen throughout
Europe
➢ DTU involved in EU-sponsored hydrogen research projects
➢ Danish Energy Agency funds startups and demonstration projects such as Orsted offshore floating production project
➢ City of Copenhagen, Copenhagen airport and 5 other companies involved in world’s largest production project, aiming to supply fuel for heavy road vehicles, shipping and aviation

Innovators and Ecosystems: Hydrogen (transport & refueling)
72
Ecosystem Fundraising by Year and Type
Company Size (Paid-in Capital and Employees)
Local Participants
External Participants
3
Alignment w/ Strength
Source: Cleantech Group i3 Database
Incubators / Accelerators
Grants
Angel Financing
Equity Financing
Debt Financing
Customers
Talent Pipelines
Partnerships
(NZ)
Emissions Reduction
Diversity in mgmt. / ownership 15% 50%
Danish Energy Agency
• Mitsui, TR Group, Hyzon Motors
• FirstGas, Ballance Agri-nutrients, Waitomo
(Denmark) (Essen, Germany)(Switzerland)(Netherlands)
• Foresight Cleantech Accelerator
• OGE, TUV, Horvath & Partners
• Sustainable Development Technology Canada
• Just Business
• Shell Ventures, AP Ventures
• ITM, HyGear• H2H Energy (entry
into Australian and NZ markets)
• Shell Technology Centre
• US Naval Research Lab
(Delta, Canada)
• Trafigura
• Trafigura
• NEL ASA, Hyundai Motor
• Alpiq
• European Investment Bank
• Hydrogen Sweden, NL government
• Green Hydrogen Hub, Orsted
• Province of South Holland
New Zealand government
0
10
20
30
40
50
60
70
80
2020 2018 2019 2020 2020 2020
Hiringa HyET Everfuel H2Energy
Evety Hydra
Mill
ions
Seed Series A Series BGrowth Equity Grant Structured Debt
0
10
20
30
40
0
20
40
60
80
Hiringa HyET Everfuel H2Energy
Evety Hydra
Mill
ions
Capital Number of Employees
Building and operating hydrogen generation and distribution
infrastructure
Operator of the largest fuel cell testing and development facility in
The Netherlands
Installer and operator of hydrogen fueling
stations
Hydrogen production and supply, refueling stations
Hydrogen usage processes and professional implementation
Hydrogen as a Service for diesel-powered heavy-
duty vehicles
Acquirer

Innovators and Ecosystems: Green Ammonia Production
73
Ecosystem Fundraising by Year and Type
Company Size (Paid-in Capital and Employees)
Local Participants
External Participants
1
Alignment w/ Strength
Source: Cleantech Group i3 Database
• Wellington Univentures
Incubators / Accelerators
Grants
Angel Financing
Equity Financing
Debt Financing
Customers
Talent Pipelines
Partnerships
(NZ)
Emissions Reduction
Diversity in mgmt. / ownership Female CEO 3/5 non-white C-suite,
1/5 female C-suite
• Victoria University of Wellington
• -300 gCO2e / MJ carbon intensity
• Zero carbon ammonia production
Ambient Ammonia
(Iceland) (Netherlands) (New Mexico, US) (Colorado, US)
• The Yield Lab• New Energy Challenge (finalist)
• Startup Energy Reykjavík Accelerator
• Plug & Play Tech Center
• Colorado Office of Economic Development and International Trade
• ARPA-E, SBIR
• SABIC Hydrogen Challenge, Horizon2020
• Iceland Technology Development Fund
• AP Ventures• Rockies Venture Club
• Idaho National Lab
• Colorado School of Mines
• Uni of Alaska Fairbanks• Worcester Polytechnic
• Cross River Infrastructure Partners
• Newlight Partners , Cottonwood, Sun Mountain Capital, Fortista
• DLL. H2Gen Technical Services. H2 ZEST. iGas Energy, Intralink Japan, Hyzon, New Mexico Gas
• Nutrien
• Uni of Southern California
• Harvard Business School
• Koolen Industrie
• Trammo, Haldor Topsoe
• Duiker Combustion Engineers
• University Delft
• Eyrir Invest
• MAN
• Chalmers Uni of Technology
• Uni. Of Iceland, Lund Uni 0
10
20
30
40
50
60
0
2
4
6
8
10
12
Ambient Atmonia Starfire Bayotech Proton Gencell
Mill
ions
Capital Number of Employees
0
20
40
60
80
100
120
140
160
2017 2015 2019 2020 2016 2017 2018 2020 2021 2019 2011 2017 2020
AmbientAtmonia Starfire Bayotech Proton Gencell
Mill
ions
Seed Series A Series BGrowth Equity Grant Structured DebtProject Finance Loan Loan Guarantee
Nitrogen breaking at mild conditions
Developer of novel ammonia production
methods for crop fertilizerPressurized and cooled
ammonia storage facilities
On-site hydrogen production solutions using gas-as-a-service
Producer of clean ammonia for energy
storage and fuel
Acquirer

NZ Ecosystem in Global Context: Hydrogen (transport & refueling)
74
40%
25%
35%
Overview
R&D-to-commercializationpipeline strength
Connection to demand
8
7
6
9
6
9
8
8
7
8
5
8
New Zealand Netherlands Denmark Switzerland
Evaluation 7.1 8.3 7.7 7.3
• Good renewable resources, no decisive strategy on import vs produce, political will to drive renewable energy and hydrogen economy
• University of Auckland, Otago programmes in clean mobility
• Joint German-New Zealand research centre on green hydrogen121
• Dedicated green financing instruments
• Provincial Growth Fund $19.9m South Taranaki production facility124
• Funding events in production, distribution & utilisation
• Memorandum of cooperation with Japan, export possibilities with Asia-Pacific, Japan and Korea122
• Meridian and Contact investigating production investment122
• Overseas partners collaborating with local innovators (Mitsui, Hyzon Motors)
• Strong hydrogen policy• Leading academic & research
centres• Most innovation by corporates• Regional industry & transport hub
• TU Delft, TU Eindhoven, ECN involved in next-generation production research
• Horizon 2020, European Green Hydrogen Accelerator
• Lack of dedicated hydrogen incubators / accelerators
• Most funding by corporates
• Gas network provides opportunity to convert for transport to neighbouring countries
• Xebec – HyGear acquisition • Shell, Gasunie; Neste, Engie,
Paul Wurth, Sunfire involved in project collaborations
• Strong academic activity • Renewable energy potential and
track record• Public sector, venture and debt
funding
• DTU active in next-generation production research
• Horizon 2020, European Green Hydrogen Accelerator
• Lack of dedicated hydrogen incubators / accelerators
• €66m invested in last decade• Everfuel $25.5m; Green
Hydrogen Systems $24.3m• Funding for production and
delivery scaleup
• Strong corporate – innovator partnership activity with local and overseas partners
• Everfuel – H2Fuel/H2CO acquisitions
• Haldor Topsoe, Gas Storage Denmark, Corre Energy investing in projects
• Academic – industry links• Aims to export refueling
capability to neighbouring countries
• Investment mostly at seed stage
• Energypolis co-locates research and commercial applications, Cleantech Alps supports SMEs, research and startups with funding and internationalisaton
• Switzerland Innovation Foundation runs 4 innovation parks with energy and transportation specialisations
• $3.3m invested in last decade• No significant venture
investments
• Strong innovator - corporate partnership activity
• Sunfire – Industrie Haute Technologie acquisition
• Alpiq partnership with H2 Energy for hydropowered production
• H2 Mobility Switzerland partnership to develop a commercial cycle for renewable hydrogen
2.5
Ability to Lead
Financing strength

Takeaways: Hydrogen (transport & refueling)
75
Takeaways for NZ Climate Tech Innovators• Some off grid applications are already cost-effective for zero-carbon
hydrogen
• Heavy duty trucking expected to be cost-competitive by 2030, delivered cost of fuel and vehicle cost/availability will be key drivers. Shipping is also an opportunity due to limited low carbon alternatives
• Collaboration with corporate partners can help to share the high CAPEX needed for hydrogen investments
• Consider storage and transport applications for export opportunities
• Green ammonia technology development is CAPEX-intensive, seek to engage grants and non-dilutive financing where possible
• Demonstration of technology requires work with utilities and automotive companies, many of which are overseas, consider how to engage through open innovation challenges and also pursue export promotion support from relevant government bodies
Takeaways for NZ Climate Tech Ecosystem• The game isn't over yet, at the moment we are judging success
mainly by size and amount of project investments. Successful business models will become clearer over next five years
• Decisive policy is needed to send a clear demand signal and drive market investments
• Ensure support for each part of the value chain as the industry develops.
• Near-term cost decreases will be driven by improvements in electricity production and balance of plant; on a 10-20 year time frame electrolysers will become the cost-bottleneck – invest now in R&D to deliver next-generation technologies which will drive future cost improvements
• No de facto global leading cluster for green ammonia innovation, markets likely to be moved by corporates with hydrogen proficiency – however, innovation in the US (although spread out geographically) tends to be tied closely to work with national labs and government grant-awarding bodies.
• Consider opportunities to push domestic innovators into global innovation challenges, e.g. the SABIC Hydrogen challenge
• Partnerships with utilities are critical for at-scale technology demonstrations

March 2019
NEW ZEALAND CLIMATE TECH FOR THE WORLD
Appendix 2Agriculture & Food
76

77
ContentsAgriculture & Food– Comparison between Small Advanced Economies (SAEs)Livestock
Livestock Monitoring
Livestock Breeding & Genetics
Methane Vaccines
Feed Alternatives and AdditivesProtein ReplacementsAquacultureCrops
Specialty Crops
Precision Chemical Application
Agricultural digitalisationAgricultural Robotics
Agricultural Drones
Agricultural Software
CCS for Agriculture
CONTENTS
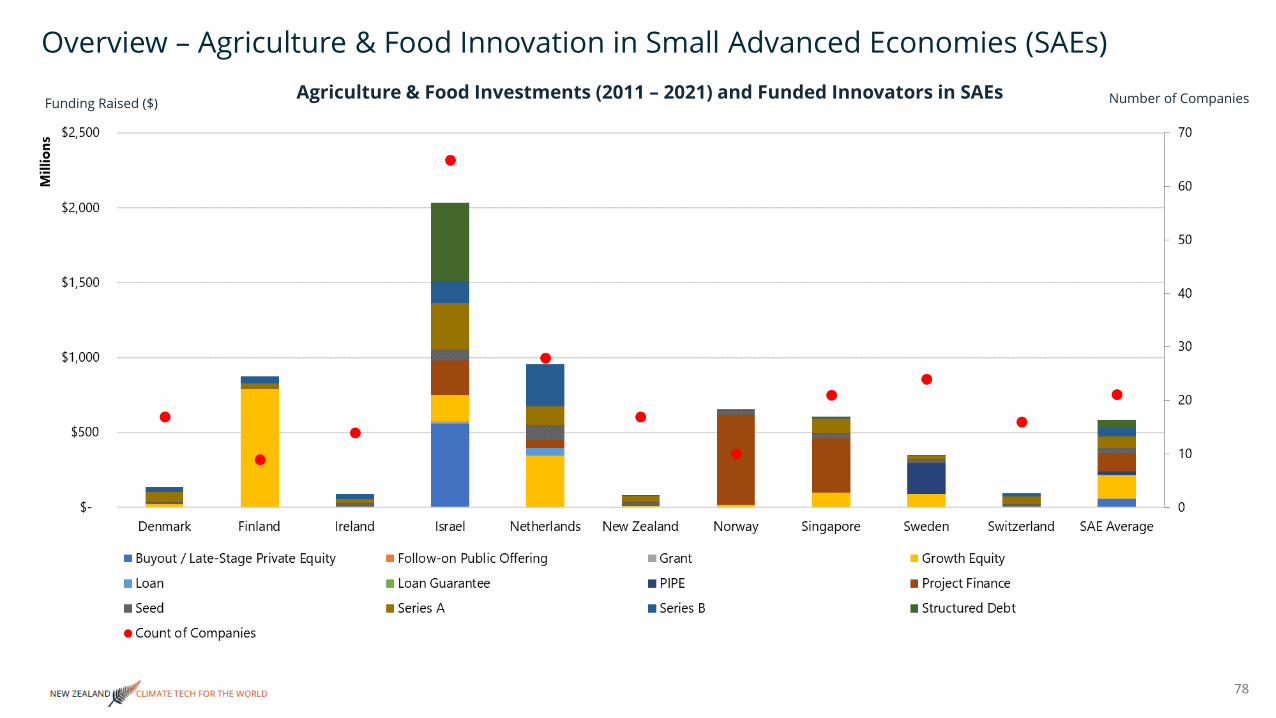
Overview – Agriculture & Food Innovation in Small Advanced Economies (SAEs)
78
Agriculture & Food Investments (2011 – 2021) and Funded Innovators in SAEsFunding Raised ($) Number of Companies

79
ContentsAgriculture & Food– Comparison between Small Advanced Economies (SAEs)Livestock
Livestock Monitoring
Livestock Breeding & Genetics
Methane Vaccines
Feed Alternatives and AdditivesProtein ReplacementsAquacultureCrops
Specialty Crops
Precision Chemical Application
Agricultural digitalisationAgricultural Robotics
Agricultural Drones
Agricultural Software
CCS for Agriculture
CONTENTS

Livestock Monitoring – Trends Analysis
80
➢ Strong domestic and export market for livestock innovation, second only to Brazil on beef exports. Australian red meat domestic and export market valued at $28.5 billion in 2018-19.
➢ National science agency CSIRO provides a broad range of grant funding and startup support to catalyze innovation. Recent livestock monitoring research includes Ceres Tag, eGrazor, and Agersens.
Developer of a livestock eartag system
NSW, Australia
Developer of AI engine to deliver data analytics to dairy farmers
Amsterdam, Netherlands
• Description: The use of hardware and/or software to detect disease and optimize management of animals.
• External potential: The livestock monitoring market is expected to grow from $1.4 billion in 2021 to $2.3 billion by 2026 at a CAGR of 10.4% during this period. Growth is fueled by camera and tag-based IoT technology for in beef and dairy operations where costs, land-value, and retail price are high, and adoption of basic monitoring technologies in lower value markets. In the US, consolidation into large herds is occurring to bring economies of scale, despite an increasing number of bankruptcies in the dairy industry. In Europe, smaller average herd sizes offer a better route to market for high tech. solutions aimed at the livestock industry. 125, 126, 127
• Timing: Livestock operations are looking for high efficiency operation as the market enters a further decade of consolidation. Significant headwinds include supply chain bottlenecks highlighted by Covid-19 related supply chain shock and reduced consumer demand for livestock-based products. Incumbents in this industry are looking to east Asian markets for growing demand of livestock products in line with growing middle-class populations.
• Environmental impact reduction potential: Animal health monitoring and illness prevention is estimated to have a decarbonization potential of ~411 MtCO₂e, at cost savings of ~$5/tCO₂e, by 2050. Livestock contribute 24% of all anthropogenic greenhouse gas emissions, and 45% of all methane emissions. More efficient livestock practises reduces the total number of livestock required for the same output, and so early disease detection and optimization of management is critical to reduce this sector’s environmental impact. 125, 126, 127
External Potential
Timing of Trend
4 3
Example innovators
Summary
Key ClustersAustralia
Netherlands➢ Land availability is key constraint on Netherlands agricultural industry, particularly for dairy and other livestock
operations.
➢ Key livestock machinery developers, such as Lely, are based in the Netherlands, offering an important talent pool focused on livestock operational efficiency.
➢ Major agriculture and food brands have HQ in Netherlands, including Cargill, Kraft Heinz, Danone, and Kikkoman.
➢ Strong R&D network through leading research institutions like Wageningen University and the Dairy Campus.

Innovators and Ecosystems: Livestock Monitoring
81
Fundraising by Year and Type
Company Size (Paid-in Capital and Employees)
Local Participants
External Participants
4
Alignment w/ Strength
Source: Cleantech Group i3 Database
Acquirer
Ecosystem
Emissions Reduction
Auckland, New Zealand
Edinburgh, United Kingdom
Weibern, Austria Netherlands Harmelen, Netherlands
Finley, Australia
Developer of livestock tracking collar
Developer of dairy livestock tracking collar
Developer of a livestock eartag system
Developer of a livestock tracking collar
Developer of AI engine to deliver data analytics to
dairy farmersDeveloper livestock
tracking eartag system
Incubators / Accelerators
Grants
Angel Financing
Equity Financing
Debt Financing
Customers
Talent Pipelines
Partnerships
Diversity in mgmt. / ownership
• Auckland University of Technology
• University of Canterbury
• Herriot Watt University
• Edinburgh Napier Uni.• ETH Zurich• Uni. Of Gottingen
• Charles Sturt University
• Visvevaraya Tech. Uni.• Bauhaus Universitat
Weimar
• INSEAD• Endhoven University• University of
Amsterdam
• Wageningen• HAS• HU Utrecht
• Zoetis
• Data Collective DCVC• Founders Fund• Ubiquity Ventures• Promus Ventures• Tuhua Fund• K1W1
• Innovate UK • Finodex Accelerator
• Finodex Accelerator• Pearse Lyons
Accelerator
• Artesian VC• Wayra
• SproutX • Horizon 2020
• Breed Reply
• Elias Tabet
• ADM Capital• Kersia• PYMWYMIC• Breed Reply• Sistema VC• AgFunder
• DSM• Danone• Yara• Syngenta• Cargill
0123456789
2018 2019 2008 2014 2016 2017 2017 2016 2018 2019 2020
Halter IceRobotics Smartbow IOTAg Connecterra
Mill
ions
Seed Series A Series BGrowth Equity Grant Project Finance
0
40
80
0204060
Mill
ions
Capital Number of Employees
• 1/5 founding team non-white
• Female sales director
• Callaghan Innovation

Livestock Breeding & Genetics – Trend Analysis
82
➢ Strong R&D network through leading research institutions like Leiden University and Wageningen University.
➢ Long history of genetic R&D, with a particular expertise in pig and poultry breeding.
➢ Land resource constraints increase the need for genetic optimization and selective breeding.
Developer of a biotech solution to sex chicklets before hatching
Leiden, Netherlands
Spin-out from Recombinetics, focused on genetic improvement for animal welfare, methane emission reduction, and disease resistance
MN, USA
• Description: Improving the genetic traits of farmed animals through optimized selective breeding and genetic engineering techniques.
• External potential: The global animal genetics market size was estimated at $6.11 billion in 2018 and is anticipated to grow to $8.54 billion by 2026. This market has mainly focused on animal feed efficiency. Countries such as the US have seen an overall reduction in the number of cattle, but beef and milk production has increased. Genetics are looking to improve disease resistance and methane emissions in order to respond to antibiotic resistance, consumer preferences, and environmental regulation. 128, 129
• Timing: AI-driven farm decision support tools are taking herd data and providing breeding intelligence in order to optimize selective breeding. This level of technology could be used in developing markets where more expensive genetics-based solutions are prohibitively expensive. While there is no market currently, a market that prices methane reduction from genetic engineering could incentivize the technology’s adoption to reduce the methane emissions intensity.
• Environmental impact reduction potential: Greenhouse gas–focused genetic selection and breeding could have a ~506 MtCO₂e impact, at zero cost, by 2050. 20% of an animal’s methane emissions can be attributed to genetics alone. Assuming other factors, such as productivity, remain steady, applying such commercial genetics in the United States could reduce methane emissions from about 53 kilograms per cow to about 42 kilograms per cow. 128, 129
External Potential
Timing of Trend
4 2
Example innovators
Summary
Key Clusters
Netherlands
USA – Mid-West➢ The US has a more permissive regulatory framework for genetic engineering compared to other advanced
agricultural economies.
➢ Global soybean production centre with 75% of agricultural land devoted to soy bean production. Animal feed is a key market for export, and so supporting innovation for the livestock sector is well supported.
➢ Well funded R&D centres such as AgriNovus in Indiana and the Donald Danforth Plant Science Centre.

Innovators and Ecosystems: Livestock Breeding & Genetics
83
Fundraising by Year and Type
Company Size (Paid-in Capital and Employees)
Local Participants
External Participants
4
Alignment w/ Strength
Source: Cleantech Group i3 Database
Acquirer
Ecosystem
Emissions Reduction
Hamilton, NZ Australia Leiden, Netherlands Minnesota, USA
IsraelDeveloper of a sperm
sorting system for genetic optimization
Developer of a livestock tag and pedigree data
platform
Developer of a biotech solution to sex chicklets
before hatching
Developer of a solution to sex chicklets before
hatchingDeveloper of selective trait breeding systems
Incubators / Accelerators
Grants
Angel Financing
Equity Financing
Debt Financing
Customers
Talent Pipelines
Partnerships
Diversity in mgmt. / ownership
• Reduced greenhouse gases & water usage (not quantified)
• 50% incubation reduction: reduced electricity, transport & waste disposal
• Auckland University of Technology
• University of New England
• Leiden University• TU Delft• Utrecht University
• University of Minnesota
• Iowa State University
• Pas Reform Hatchery Technologies
• DSM Twilmij• Philips NatureDynamics
• Recombinetics (Parent)
• Kheiron Biotech• Semex
• CRV
• Pacific Channel• New Zealand Venture
Investment Fund
• VisVires New Protein• Evonik Venture Capital• Leiden University
• ICE Angels Nominees• Enterprise Angels• Arc Angels
• SOSV• Hax Accelerator
• FFAR
• SOSV• Indie Bio
• University of New England
• EASME
• EIC Accelerator Pilot
• Tropic Biosciences
• Pearse Lyons Accelerator
• Creative Destruction Lab
• EASME• MassChallenge
• Tel Aviv University• The Hebrew
University• University of Haifa
• Bill and Melinda Gates Foundation
0
1
2
3
4
5
2015 2016 2020 2014 2018 2016 2017
Engender SmartShepherd In Ovo eggXYt
Mill
ions
Seed Series A Series B Growth Equity Grant
0
20
40
0
5
10
Mill
ions
Capital Number of Employees
• No diversity among founders / C-suite
• Advisory 2/15 female
• Female director
• Callaghan Innovation

Methane Vaccines – Trend & Ecosystem Analysis
84
• Description: Methane-inhibiting vaccines for ruminants that reduce methane emissions from enteric fermentation by at least 20% while not negatively impacting livestock production.
• External potential: Specific market size unclear – animal vaccines market size estimated at just under $10 bn in 2021 with a 6.3% CAGR through 2026 73. Demonstration of profitability is more difficult than for traditional animal vaccines (that reduce loss of livestock due to disease) or alternative feeds for methane reduction (that may market a price advantage) – requiring vaccines to rely on potential cost savings to farmers in regions under regulatory pressure to reduce methane emissions.
• Timing: Reduction of enteric fermentation is a critical line item in any national 1.5C or GHG abatement strategy, some countries are beginning to develop targeted programmes for reduction of agricultural methane reduction, e.g. Australia’s Agriculture Methane Research and Monitoring programme.
• Environmental impact reduction potential: Enteric fermentation from livestock accounts for 5% of all GHG emissions from human activity worldwide – methane (CH4) emitted from enteric fermentation is able to trap heat 30 times more than carbon dioxide. 130 Studies as early as 2004 indicated that a 7.7% reduction in CH4 emissions from enteric fermentation was possible with a methane vaccine 131 but have recently been estimated at 25-30% by leading experts in NZ 132
External Potential
Timing of Trend
2 3Summary
New Zealand Highlights
➢ The NZ Government will fully fold agriculture emissions into an emissions pricing scheme, with a price on emissions beginning in 2025135
➢ The NZ Climate Change Commission released a 2021 plan including suggestions that methane from livestock drop 6.5 per cent annually, and end up with an annual average of about 16 per cent below 2018 levels 2031-35 138
4
Alignment w/ Strength
3
Ability to Lead
➢ New Zealand Agricultural Greenhouse Gas Research Centre is conducting research on methane vaccines as a part of $50m of funding 2010-2020 and $50m for 2021-2025134
➢ Methane vaccine development efforts in NZ have led to a stage of maturity allowing for in vivo testing, a critical step prior to being able to carry out live animal testing136

NZ Ecosystem in Global Context: Livestock
85
Overview
R&D-to-commercializationpipeline strength
Connection to demand
8
5
7
8
9
8
9
8
8
8
6
7
New Zealand UK Netherlands Australia
Evaluation 6.9 8.3 8.4 7.2
• Strong agriculture R&D• Low presence of financing • Strong agriculture market• Low presence of multinationals• Strong reputation for quality
• Massey U, U. Auckland, Waikato U. spinning companies out
• Callaghan Innovation loans are available
• Demand-driven R&D tax credit (15% at $430 million/year) 21
• Seed and early-stage financing supporting ag tech evident
• Few NZ-based investors to support larger equity and debt rounds
• Corporate and external investors are accessing companies in standout cases
• Meat exports worth $5.3 billion to New Zealand economy annually 60% of export revenue
• Strong international reputation for NZ branded meat products
• Lack of innovation outposts in overseas markets to promote innovation
• Strong private companies (Fonterra) in this sector yet meagre innovation activities
• Leading academic institutions• Leading R&D in agriculture• Global financial centre• Extensive internationalization of
Ag. services and innovation
• Innovate UK well funded coordinator of public grants and early-stage support
• UK BEIS and DEFRA active in support innovation through grants and pilots
• 5+ research universities looking at livestock and agriculture
• 10+ VC and equity investors based in London dedicated to agtech investment.
• Over $3.6 billion invested in UK agtech companies in 10 years
• Total income from farming industry $14.4 billion (0.53% GVA, 2019) 141,
142
• Livestock is around 58% of market share by value
• Exports account for only 17% of revenue. 141, 142
• Traditionally an entrepot for European expansion
• Uncertain trade situation post-Brexit
• Resource-based economy with focus on minerals, mining and agricultural exports
• Strong public research support and connection to export markets.
• CSIRO responsible for R&D coordination
• Strong presence of livestock management corporates due to high volume of trade
• Small number of commercial scale innovations
• 10+ equity investment funds with ag technology in thesis, typically early-stage investors
• Active angels and family offices• Lack of domestic Series B+ funding
even for leading startups (AgriWebb Series B led by Telus Canada)
• Livestock (cattle & sheep) industry turnover $72.8 billion in 2018-19. Key sector for Aus. economy.
• 12,000 jobs supported in Indonesia, a major recipient of live trade animals
• Importance of export market has driven significant scrutiny on animal management and welfare innovation
3
Ability to Lead
Financing strength
• Wageningen University and HZ University are centres of European agricultural research
• Strong public support through DOEN, Invest-NL, and other public funded grant and support institutions.
• 10+ agri-focused VC investors• Active local agri-banks to connect
innovation to global investors (RaboBank)
• Strong presence of multi-sector VC and private equity finance to scale startups
• Livestock sector contributes $10.9 billion to the Dutch economy
• Dutch agricultural exports worth $110 billion (2019)
• Leading feed and animal welfare companies based here to connect innovation to global markets (DSM, Nutreco)
• World class agricultural exporting economy
• World class agricultural R&D• Strong domestic and export market
for livestock products
40%
25%
35%

Scoring: Livestock
86
Trends
Market NZ PositionAlignment w/
StrengthExternal Potential Ability to leadTiming of
Trend
4 3 4 3Livestock Monitoring
Takeaways for NZ Climate Tech Innovators• Focus on data-driven farm management and improved genetic
selection as these are key tools for this trend. Cost and emissions intensity will put pressure on finding efficiency gains in livestock production systems.
• Leverage NZ’s existing livestock products supply chain to develop solutions that improve quality, safety, welfare, and traceability. These characteristics have value globally and can be easily exported.
• Do not rely on private sector partnerships in NZ. There is little evidence of investment and innovation support from large companies operating in this sector.
• Develop strong use case studies to increase adoption. Adoption rates correlate with good communication of benefits to farmers.
Takeaways for NZ Climate Tech Ecosystem• Prepare for a reduced size of the livestock industry (number of
farms and head of animals), but potentially increased value.
• Nurture sales channels with Asian markets. This is where NZ has strong export volumes and where demand is likely to grow. In these markets key differentiators will increasingly be animal welfare, product safety, and traceability.
• Accelerate corporate engagement with innovation. To remain competitive, they need to engage innovation through accelerators, pilot opportunities, and commercialization partnerships.
• Key areas to develop for NZ livestock industry include innovative farm management systems, methane reduction ingredients, and supply chain tracking solutions.
4 2 3 3Livestock Breeding & Genetics
2 3 4 3Methane Vaccines

87
Contents
Agriculture & Food– Comparison between Small Advanced Economies (SAEs)Livestock
Livestock Monitoring
Livestock Breeding & Genetics
Methane Vaccines
Feed Alternatives and AdditivesProtein ReplacementsAquacultureCrops
Specialty Crops
Precision Chemical Application
Agricultural digitalisationAgricultural Robotics
Agricultural Drones
Agricultural Software
CCS for Agriculture
CONTENTS

Feed Alternatives and Additives – Trend Analysis
88
➢ Strong R&D network through leading research institutions such as Wageningen University.
➢ Major feed and animal-product corporations and are based, or have their European base, in the Netherlands including DSM, Cargill, Danone, and Kikkoman.
➢ Strong agri-finance support through institutions such as Rabobank to deliver agricultural loans, specialty finance for the agricultural sector, and support for startups through The Rabobank Innovation Fund, Rabo Food and Agri Innovation Fund, and Startup Bootcamp.
Developer of insect farming systems
Netherlands
Developer of seaweed production system for livestock methane reduction
Sweden
• Description: Animal feed with lower emissions intensity and resource use in production and feed additives that benefit animal health and the environment.
• External potential: The global animal feed additives market was valued at $37.83 billion in 2019 and is projected to expand to $49.1 billion in 2027 at a CAGR of 3.8%. The animal feed market is valued at around $370 billion, with expected CAGR of 3.5 – 4% over the next four years. 40% of this growth is expected to come from Asia Pacific due to the 78% rise in protein demand expected by 2050. 143, 144
• Timing: Innovation in this industry is critical. The GHG intensity of current livestock practises is unsustainable. For farmers, rising global feed costs is putting pressure on an industry that struggled to meet demand during supply chain shock due to covid-19, where high wholesale prices for meat products were not passed down to the farmgate. Antibiotic resistance, particularly in hog farming, has led to pathogenic crisis such as African Swine Flu. Optimizing nutrition and vaccination through a feed mix that is more sustainably sourced has become critical to the industry’s future.
• Environmental impact reduction potential: Optimization of the animal feed mix could have a ~370 MtCO₂e impact, at cost of ~$131/tCO₂e, by 2050. The expanded use of animal feed additives could have an impact of ~299 MtCO₂e, at cost of ~$88/tCO₂e by 2050. While there are proven chemical feed additives in the market such as Bovear from DSM, many seaweed-based alternatives are becoming available claiming 80+% methane reduction through >1% feed addition. 143, 144
External Potential
Timing of Trend
4 4
Example innovators
Summary
Key ClustersNetherlands
Sweden➢ Strong innovation R&D ecosystem including SLU, Lantmännen, Dataväxt, Federation of Swedish farmers, the
cooperative Lantmannen, and SMHI.
➢ Strong technology talent pool through innovative corporates including Ericsson, Telia, and Volvo.
➢ Low commercialization of agricultural startups, but many examples of food and sustainable food and forestry products internationalization.
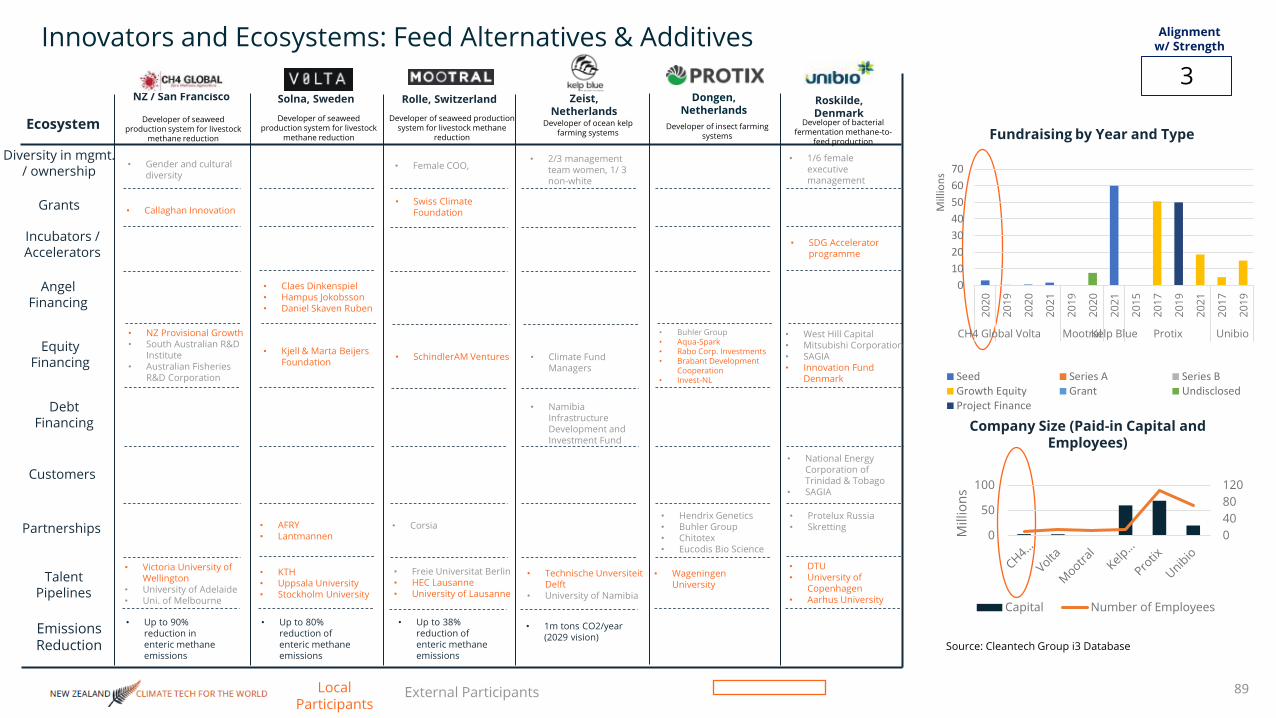
Innovators and Ecosystems: Feed Alternatives & Additives
89
Fundraising by Year and Type
Company Size (Paid-in Capital and Employees)
Local Participants
External Participants
3
Alignment w/ Strength
Source: Cleantech Group i3 Database
Ecosystem
Emissions Reduction
NZ / San Francisco Solna, Sweden Rolle, Switzerland Dongen, Netherlands
Roskilde, Denmark
Zeist, Netherlands
Developer of seaweed production system for livestock
methane reduction
Developer of seaweed production system for livestock
methane reduction
Developer of seaweed production system for livestock methane
reduction
Developer of ocean kelp farming systems
Developer of insect farming systems
Developer of bacterial fermentation methane-to-
feed production
Incubators / Accelerators
Grants
Angel Financing
Equity Financing
Debt Financing
Customers
Talent Pipelines
Partnerships
Diversity in mgmt. / ownership
• 1m tons CO2/year (2029 vision)
• Up to 90% reduction in enteric methane emissions
• Victoria University of Wellington
• University of Adelaide• Uni. of Melbourne
• KTH• Uppsala University• Stockholm University
• Freie Universitat Berlin• HEC Lausanne• University of Lausanne
• Technische Unversiteit Delft
• University of Namibia
• Wageningen University
• DTU• University of
Copenhagen• Aarhus University
• Corsia• Protelux Russia• Skretting
• National Energy Corporation of Trinidad & Tobago
• SAGIA
• NZ Provisional Growth• South Australian R&D
Institute• Australian Fisheries
R&D Corporation
• Kjell & Marta Beijers Foundation • SchindlerAM Ventures • Climate Fund
Managers
• Buhler Group• Aqua-Spark• Rabo Corp. Investments• Brabant Development
Cooperation• Invest-NL
• West Hill Capital• Mitsubishi Corporation• SAGIA• Innovation Fund
Denmark
• Swiss Climate Foundation
• Claes Dinkenspiel• Hampus Jokobsson• Daniel Skaven Ruben
• Up to 80% reduction of enteric methane emissions
• AFRY• Lantmannen
• Namibia Infrastructure Development and Investment Fund
• Up to 38% reduction of enteric methane emissions
• Hendrix Genetics• Buhler Group• Chitotex• Eucodis Bio Science
• SDG Accelerator programme
010203040506070
2020
2019
2020
2021
2019
2020
2021
2015
2017
2019
2021
2017
2019
CH4 Global Volta MootralKelp Blue Protix Unibio
Mill
ions
Seed Series A Series BGrowth Equity Grant UndisclosedProject Finance
04080120
0
50
100
Mill
ions
Capital Number of Employees
• Gender and cultural diversity
• Female COO,• 2/3 management
team women, 1/ 3 non-white
• 1/6 female executive management
• Callaghan Innovation

NZ Ecosystem in Global Context: Feed Alternatives & Additives
90
Overview
5
5
7
4
6
7
9
8
9
7
6
7
New Zealand Sweden Netherlands Switzerland
Evaluation 5.7 5.6 8.8 6.8
• Strong agriculture R&D in universities, and gov’t support
• Low presence of financing • Strong agriculture market• Low presence of multinationals
• Massey U, U. Auckland, Waikato U. spinning companies out
• Callaghan Innovation loans are available
• Pastoral farming system reduces focus on feed additive research
• Demand-driven R&D tax credit (15% at $430 million/year) 21
• Seed and early-stage financing supporting ag tech (e.g. Powerhouse)
• Few NZ-based investors to support larger equity and debt rounds, corporate and external investors are accessing companies in standout cases (e.g. Robotics Plus)
• Meat exports worth $5.3 billion to New Zealand economy annually. 60% of export value
• Typically grass-fed herd, low use of lot feeding for additives
• Lack of multinational feed companies
• Lack of innovation outposts in overseas markets to promote innovation
• Strong public R&D spending with good Universities
• Small but active and well funded VC community focused on climate tech. solutions
• RISE Foundation supports R&D in collaboration with Ag. industry
• 3% of GDP spent R&D, focusing on green technology and life sciences (Volta, Mycorena)
• Strong Seed and Series A investors including public, private, and corporate investors
• Later-stage funding and exit opportunities through ‘small’ IPO options on Stockholm exchanges
• Small domestic market for feed alternatives and additives
• Good agricultural export channels
• Reputation for high animal welfare standards and food quality
• Few mulitnationals to aid global expansion
• Outward-facing economy, emphasis on technology exports
• Strong multinationals with AgroSciences divisions
• ETH Zurich, EPFL ag talent / spin-offs
• Relevant gov’t agencies & NGOs – Innosuise, Agroscope, Swiss Climate Foundation
• 10+ equity investment funds with ag technology in thesis,
• Active angel networks and family offices supporting early stage
• Syngenta, BASF, Dow Agrosciences, Bayer Crop Sciences, Dupont all active in Switzerland
• Key commodity trading houses with presence here (Bunge)
• Strong science & tech global promotion infrastructure through Swissnex, Swiss Global Enterprise
3
Ability to Lead
• Wageningen University and HZ University are centres of European agricultural research
• Strong public support through DOEN, Invest-NL, and other public funded grant and support institutions.
• 10+ agri-focused VC investors• Active local agri-banks to
connect innovation to global investors (RaboBank)
• Strong presence of multi-sector VC and private equity finance to scale startups
• Animal feed market in Netherlands is the fastest growing in Europe.
• Livestock sector contributes $10.9 billion to the Dutch economy
• Dutch agricultural exports worth $110 billion (2019)
• Leading feed companies based here (DSM, Nutreco, Skretting)
• World class agricultural exporting economy
• World class agricultural R&D• Strong domestic and export
market for livestock products
R&D-to-commercializationpipeline strength
Connection to demand
Financing strength
40%
25%
35%
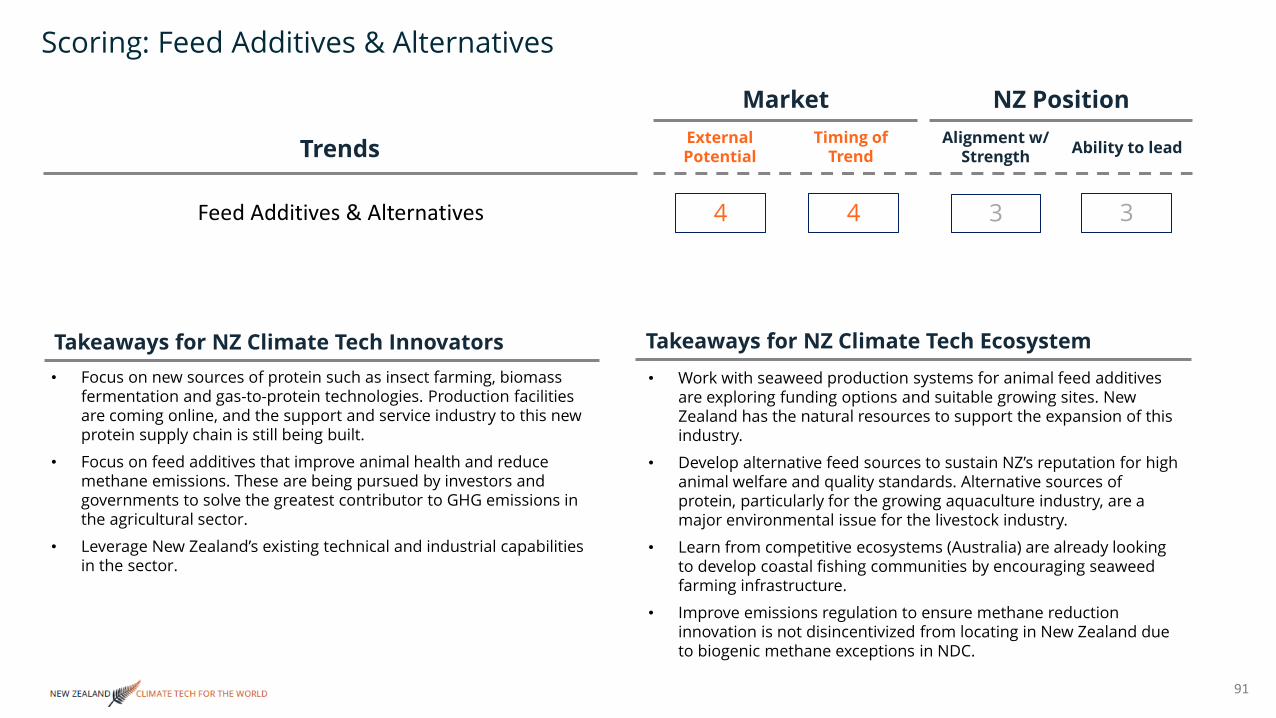
Scoring: Feed Additives & Alternatives
91
Trends
Market NZ PositionAlignment w/
StrengthExternal Potential Ability to leadTiming of
Trend
4 4 3 3Feed Additives & Alternatives
Takeaways for NZ Climate Tech Innovators• Focus on new sources of protein such as insect farming, biomass
fermentation and gas-to-protein technologies. Production facilities are coming online, and the support and service industry to this new protein supply chain is still being built.
• Focus on feed additives that improve animal health and reduce methane emissions. These are being pursued by investors and governments to solve the greatest contributor to GHG emissions in the agricultural sector.
• Leverage New Zealand’s existing technical and industrial capabilities in the sector.
Takeaways for NZ Climate Tech Ecosystem• Work with seaweed production systems for animal feed additives
are exploring funding options and suitable growing sites. New Zealand has the natural resources to support the expansion of this industry.
• Develop alternative feed sources to sustain NZ’s reputation for high animal welfare and quality standards. Alternative sources of protein, particularly for the growing aquaculture industry, are a major environmental issue for the livestock industry.
• Learn from competitive ecosystems (Australia) are already looking to develop coastal fishing communities by encouraging seaweed farming infrastructure.
• Improve emissions regulation to ensure methane reduction innovation is not disincentivized from locating in New Zealand due to biogenic methane exceptions in NDC.

92
ContentsAgriculture & Food– Comparison between Small Advanced Economies (SAEs)Livestock
Livestock Monitoring
Livestock Breeding & Genetics
Methane Vaccines
Feed Alternatives and AdditivesProtein ReplacementsAquacultureCrops
Specialty Crops
Precision Chemical Application
Agricultural digitalisationAgricultural Robotics
Agricultural Drones
Agricultural Software
CCS for Agriculture
CONTENTS

Overview – Protein Replacement Innovation in Small Advanced Economies (SAEs)
93
Protein Replacement Investments (2011 – 2021) and Funded Innovators in SAEsFunding Raised ($) Number of Companies
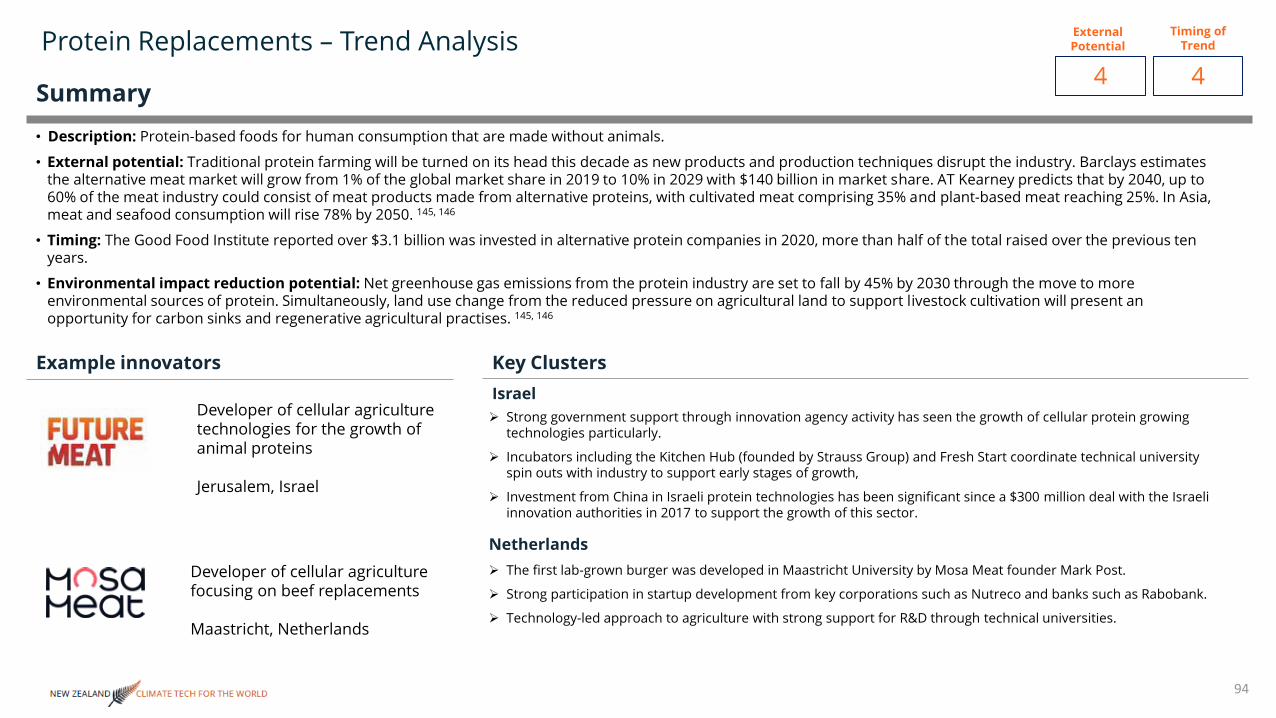
Protein Replacements – Trend Analysis
94
➢ Strong government support through innovation agency activity has seen the growth of cellular protein growing technologies particularly.
➢ Incubators including the Kitchen Hub (founded by Strauss Group) and Fresh Start coordinate technical university spin outs with industry to support early stages of growth,
➢ Investment from China in Israeli protein technologies has been significant since a $300 million deal with the Israeli innovation authorities in 2017 to support the growth of this sector.
Developer of cellular agriculture technologies for the growth of animal proteins
Jerusalem, Israel
Developer of cellular agriculture focusing on beef replacements
Maastricht, Netherlands
• Description: Protein-based foods for human consumption that are made without animals.
• External potential: Traditional protein farming will be turned on its head this decade as new products and production techniques disrupt the industry. Barclays estimates the alternative meat market will grow from 1% of the global market share in 2019 to 10% in 2029 with $140 billion in market share. AT Kearney predicts that by 2040, up to 60% of the meat industry could consist of meat products made from alternative proteins, with cultivated meat comprising 35% and plant-based meat reaching 25%. In Asia, meat and seafood consumption will rise 78% by 2050. 145, 146
• Timing: The Good Food Institute reported over $3.1 billion was invested in alternative protein companies in 2020, more than half of the total raised over the previous ten years.
• Environmental impact reduction potential: Net greenhouse gas emissions from the protein industry are set to fall by 45% by 2030 through the move to more environmental sources of protein. Simultaneously, land use change from the reduced pressure on agricultural land to support livestock cultivation will present an opportunity for carbon sinks and regenerative agricultural practises. 145, 146
External Potential
Timing of Trend
4 4
Example innovators
Summary
Key ClustersIsrael
Netherlands➢ The first lab-grown burger was developed in Maastricht University by Mosa Meat founder Mark Post.
➢ Strong participation in startup development from key corporations such as Nutreco and banks such as Rabobank.
➢ Technology-led approach to agriculture with strong support for R&D through technical universities.

Innovators and Ecosystems: Protein Replacements
95
Fundraising by Year and Type
Company Size (Paid-in Capital and Employees)
Local Participants
External Participants
1
Alignment w/ Strength
Source: Cleantech Group i3 Database
Ecosystem
Emissions Reduction
Auckland, New Zealand
Rehovot, Israel Maastricht, Netherlands Solna, Sweden Pennsylvania, USA
Stockholm, Sweden
Pea protein-based chicken alternative
Developer of cellular agriculture technologies
Developer of cellular agriculture
Developer of plant-based salmon alternatives
Developer of plant-based dairy alternatives
Developer of plant-based tuna alternative
Incubators / Accelerators
Grants
Angel Financing
Equity Financing
Debt Financing
Customers
Talent Pipelines
Partnerships
Diversity in mgmt. / ownership
• 80% less GHG• 99% less land use• 96% less
freshwater
• Auckland University of Technology
• The Hebrew University
• Technion• Weizmann• Ben-Gurion
• Cambridge University• Maastricht University• Eindhoven University• Zuyd Hogeschool• Wageningen University
• NA • Stockholm University• KTH Royal Institute• Lund University
• Ibmec• Harvard University• Ohio University
• Nutreco • Bumble Bee Foods
• Coles• Kaiso• Hawaii Poke• Foodora• Mahalo
• Whole Foods Market• Thrive Market
• New Crop Capital• Blackbird Ventures• Quadrant Private Equity• NZ Growth Capital
Partners• K1W1
• Tyson Ventures• S2G Ventures• Emerald Tech. Ventures• Archer Daniels Midland• ADM Capital• Neto Group
• Merck• Bell Food Group• Mitsubishi• Lowercarbon Capital• Blue Horizon Ventures• Nutreco
• Katapult Ocean• ProVeg International• Wave Ventures• Veg Capital• Kale United
• Astanor Ventures• Northzone Ventures,
Inventure Capital• Purple Orange• Martas Explorers• Creandum
• New Crop Capital• PHW group• Stray Dog Capital• Blue Horizon• 301 Inc• CPT Capital
• Chris Hadley• Jitse Groen • Henry Soesanto
• Joshua Ismin• Eric Wahlforss
• Woody Harrelson• Shailene Woodley• Paris Hilton• Lance Bass
• Bits X Bites• Thrive Accelerator
• Katapult Ocean • Thrive Accelerator
• The Hebrew University
• Working on calculation of impact
0102030405060708090
100
2016
2018
2018
2019
2020
2018
2020
2021
2020
2018
2019
2020
Sunfed Future Meat Mosa MeatHookedGood Catch
Mill
ions
Seed Series A Series B Growth Equity
0
40
80
050
100150
Mill
ions
Capital Number of Employees
• 1/3 C-suite non-white
• Female, non-white founder
• Female EVP R&D • Non-white & female co-founders

NZ Ecosystem in Global Context: Protein replacements
96
Overview
4
3
2
6
7
9
9
9
7
6
9
New Zealand Israel Netherlands Sweden
Evaluation 3 7.3 8.2 7.5
• Low R&D in universities, and gov’t support
• Low presence of financing • Strong conventional protein• Low presence of multinationals
• Good universities provide talent pool (Auckland University of Technology)
• Little evidence of further support in this sector
• Some availability of early-stage finance, often targeting Australia and New Zealand.
• $6.9M invested in protein replacement startups since 20111
• Meat exports worth $5.3 billion to New Zealand economy annually, 60% of export revenue147
• Lack of multinational feed companies
• Lack of innovation outposts in overseas markets to promote innovation
• World-leading biotech cluster• Coordinated public-private
support for innovation• Strong internationalization of
technology solutions• Technion, Weizmann Institute,
Hebrew University participating in spinoffs49
• Strong biotech capability• Specialist accelerators incl.
corporates (e.g. Strauss)• Strong international support (E.g.
investment from China 2017)
• 50+ agtech investors (ave. amount <$5m)50
• $167M invested in protein replacement startups since 20111
• Partnerships with local investors and international corporates to support local ecosystem51
• Mars, Mondelez developing local solutions
• Small domestic sales market but kosher principles increase alt. protein adoption
• Strong internationalization of technology solutions in alternative proteins
• World leading agritech cluster• Strong technical universities• Strong startup support ecosystem
beyond agri. and food technologies
• Wageningen University & research has produced 15 spinoffs since 201147
• Specialist incubators; corporate involvement from e.g. Rabobank, Unilever
• European hub for VCs in alt. proteins (Anterra, Unovis)
• $263M invested in protein replacement startups since 20111
• Engaged conventional protein service companies
• Livestock sector contributes $10.9 billion to the Dutch economy
• Dutch agricultural exports worth $110 billion (2019)
• Leading feed companies based here (DSM, Nutreco, Skretting)
• Leading public R&D spending intensity• Good Universities and connection with
Nordic R&D cluster• Small but well funded VC investors
• Strong public funding for R&D (3.3% 2018)
• Bloomer accelerator, Nordic Foodtech
• Strong Nordic R&D cluster (VTT, Wageningen, KTH)
• >$5m invested in protein replacement startups since 20111
• Small but active and well funded VC community focused on climate tech. solution-
• Leading international brands in alternative foods categories (Oatly)
• Strong consumer association with quality and healthy products
• Strong regional market for alternative proteins
2
Ability to Lead
7
R&D-to-commercializationpipeline strength
Connection to demand
Financing strength
40%
25%
35%
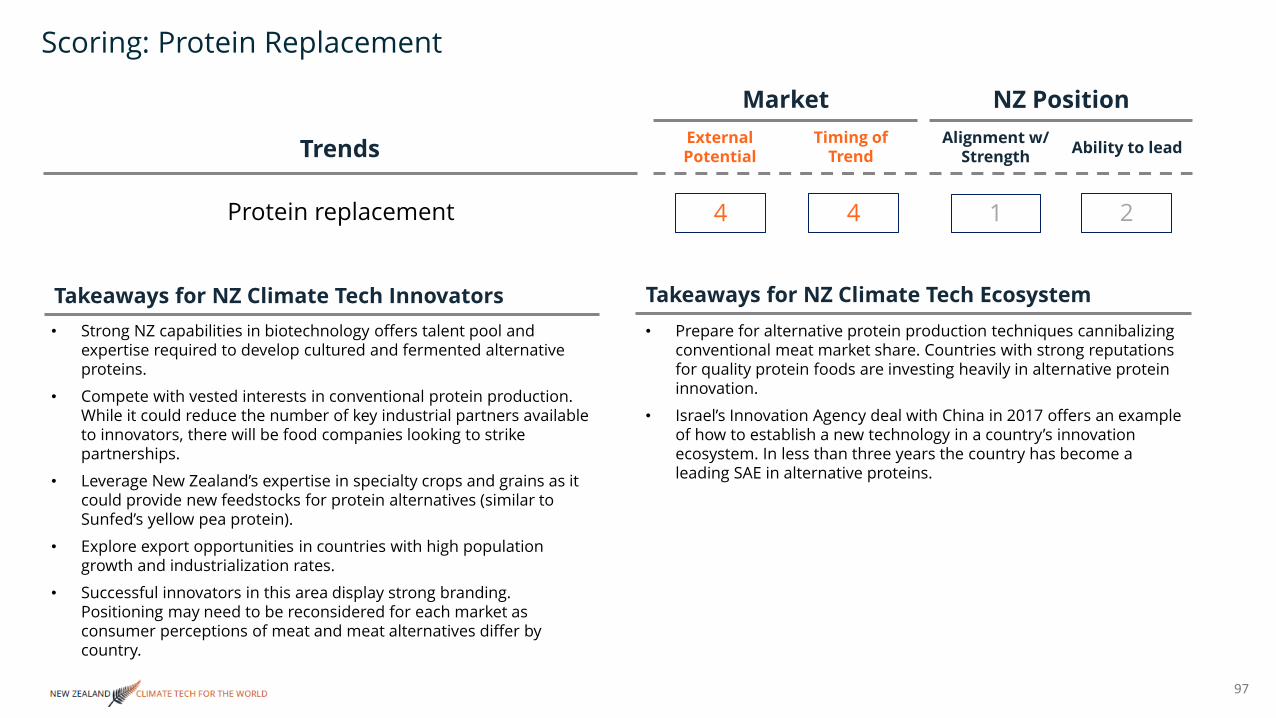
Scoring: Protein Replacement
97
Trends
Market NZ PositionAlignment w/
StrengthExternal Potential Ability to leadTiming of
Trend
4 4 1 2Protein replacement
Takeaways for NZ Climate Tech Innovators• Strong NZ capabilities in biotechnology offers talent pool and
expertise required to develop cultured and fermented alternative proteins.
• Compete with vested interests in conventional protein production. While it could reduce the number of key industrial partners available to innovators, there will be food companies looking to strike partnerships.
• Leverage New Zealand’s expertise in specialty crops and grains as it could provide new feedstocks for protein alternatives (similar toSunfed’s yellow pea protein).
• Explore export opportunities in countries with high population growth and industrialization rates.
• Successful innovators in this area display strong branding. Positioning may need to be reconsidered for each market as consumer perceptions of meat and meat alternatives differ by country.
Takeaways for NZ Climate Tech Ecosystem• Prepare for alternative protein production techniques cannibalizing
conventional meat market share. Countries with strong reputations for quality protein foods are investing heavily in alternative protein innovation.
• Israel’s Innovation Agency deal with China in 2017 offers an example of how to establish a new technology in a country’s innovation ecosystem. In less than three years the country has become a leading SAE in alternative proteins.

98
ContentsAgriculture & Food– Comparison between Small Advanced Economies (SAEs)Livestock
Livestock Monitoring
Livestock Breeding & Genetics
Methane Vaccines
Feed Alternatives and AdditivesProtein ReplacementsAquacultureCrops
Specialty Crops
Precision Chemical Application
Agricultural digitalisationAgricultural Robotics
Agricultural Drones
Agricultural Software
CCS for Agriculture
CONTENTS
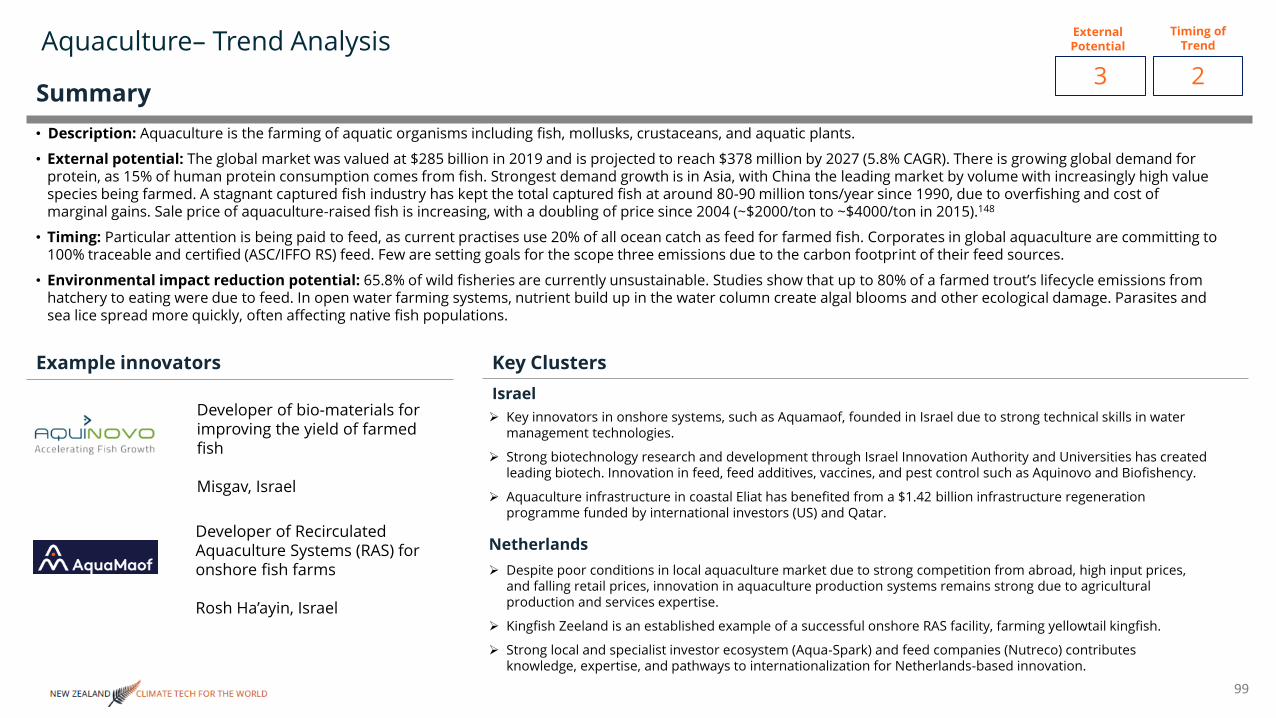
Aquaculture– Trend Analysis
99
➢ Key innovators in onshore systems, such as Aquamaof, founded in Israel due to strong technical skills in water management technologies.
➢ Strong biotechnology research and development through Israel Innovation Authority and Universities has created leading biotech. Innovation in feed, feed additives, vaccines, and pest control such as Aquinovo and Biofishency.
➢ Aquaculture infrastructure in coastal Eliat has benefited from a $1.42 billion infrastructure regeneration programme funded by international investors (US) and Qatar.
Developer of bio-materials for improving the yield of farmed fish
Misgav, Israel
Developer of Recirculated Aquaculture Systems (RAS) for onshore fish farms
Rosh Ha’ayin, Israel
• Description: Aquaculture is the farming of aquatic organisms including fish, mollusks, crustaceans, and aquatic plants.
• External potential: The global market was valued at $285 billion in 2019 and is projected to reach $378 million by 2027 (5.8% CAGR). There is growing global demand for protein, as 15% of human protein consumption comes from fish. Strongest demand growth is in Asia, with China the leading market by volume with increasingly high value species being farmed. A stagnant captured fish industry has kept the total captured fish at around 80-90 million tons/year since 1990, due to overfishing and cost of marginal gains. Sale price of aquaculture-raised fish is increasing, with a doubling of price since 2004 (~$2000/ton to ~$4000/ton in 2015).148
• Timing: Particular attention is being paid to feed, as current practises use 20% of all ocean catch as feed for farmed fish. Corporates in global aquaculture are committing to 100% traceable and certified (ASC/IFFO RS) feed. Few are setting goals for the scope three emissions due to the carbon footprint of their feed sources.
• Environmental impact reduction potential: 65.8% of wild fisheries are currently unsustainable. Studies show that up to 80% of a farmed trout’s lifecycle emissions fromhatchery to eating were due to feed. In open water farming systems, nutrient build up in the water column create algal blooms and other ecological damage. Parasites and sea lice spread more quickly, often affecting native fish populations.
External Potential
Timing of Trend
3 2
Example innovators
Summary
Key ClustersIsrael
Netherlands➢ Despite poor conditions in local aquaculture market due to strong competition from abroad, high input prices,
and falling retail prices, innovation in aquaculture production systems remains strong due to agricultural production and services expertise.
➢ Kingfish Zeeland is an established example of a successful onshore RAS facility, farming yellowtail kingfish.
➢ Strong local and specialist investor ecosystem (Aqua-Spark) and feed companies (Nutreco) contributes knowledge, expertise, and pathways to internationalization for Netherlands-based innovation.

Innovators and Ecosystems: Aquaculture
100
Fundraising by Year and Type
Company Size (Paid-in Capital and Employees)
Local Participants
External Participants
2
Alignment w/ Strength
Source: Cleantech Group i3 Database
Ecosystem
Emissions Reduction
Auckland, New Zealand
Rosh Ha‘ayin, Israel
Israel Kats, Netherlands
Québec, CanadaHaifa, Israel
Precision Seafood Harvesting Developer of Recirculated Aquaculture Systems (RAS)
Developer of microbially fermented animal health
products
Developer of oral aquaculture health products
Developer of onshore grow out facilities for Kingfish
Developer of aquaculture monitoring hardware and
management software
Incubators / Accelerators
Grants
Angel Financing
Equity Financing
Debt Financing
Customers
Talent Pipelines
Partnerships
Diversity in mgmt. / ownership
• ‘Significant’ reduction in viral infections in shrimp
• Ben Gurion Uni.• Weizmann Institute• Uni. of Stirling
• Tel Aviv University• The Hebrew
University
• Wageningen• IDC Herzliya• Uni. of Stirling
• 8F Asset Management • Billund Aquaculture • Bayer
• Greig NL (Canada)• Pure Salmon
(France/Poland)• Proximar (Japan)
• The Trendlines Group• Neovia
• ADM Capital• Creadev• Rabo Corporate
Investment• Nutreco
• Aqua-Spark• Obvious Ventures• Real Ventures• YUL Ventures
• Bradley Horowitz
• The Trendlines Group • Founder Fuel
• VisVires New Protein• Nutreco• The Trendlines Group
• Technion Israel Institute of Technology
• Tel Aviv University• The Hebrew
University• University of Haifa
• Moana New Zealand (Māori)
• Sealord Group• Sanford Limited
• Université Laval• Ghent University
• Reduced damage/stress to fish (not quantified)
• 4/18 women on management team
• 1/3 senior team female
• 1/5 women on leadership team,
• 1/12 female / non-white management
• Minimizes environmental impact esp. on outflow water
• Primary Growth Partnership with Ministry of Primary Industry
0
40
80
0204060
Mill
ions
Capital Number of Employees
0
50
100
150
200
250
2019 2017 2020 2018 2020 2015 2018
Tiaki AquaMaof Aquinovo ViAqua Kingfish XpertSea
Mill
ions
Seed Series A Series B
Growth Equity Grant Project Finance
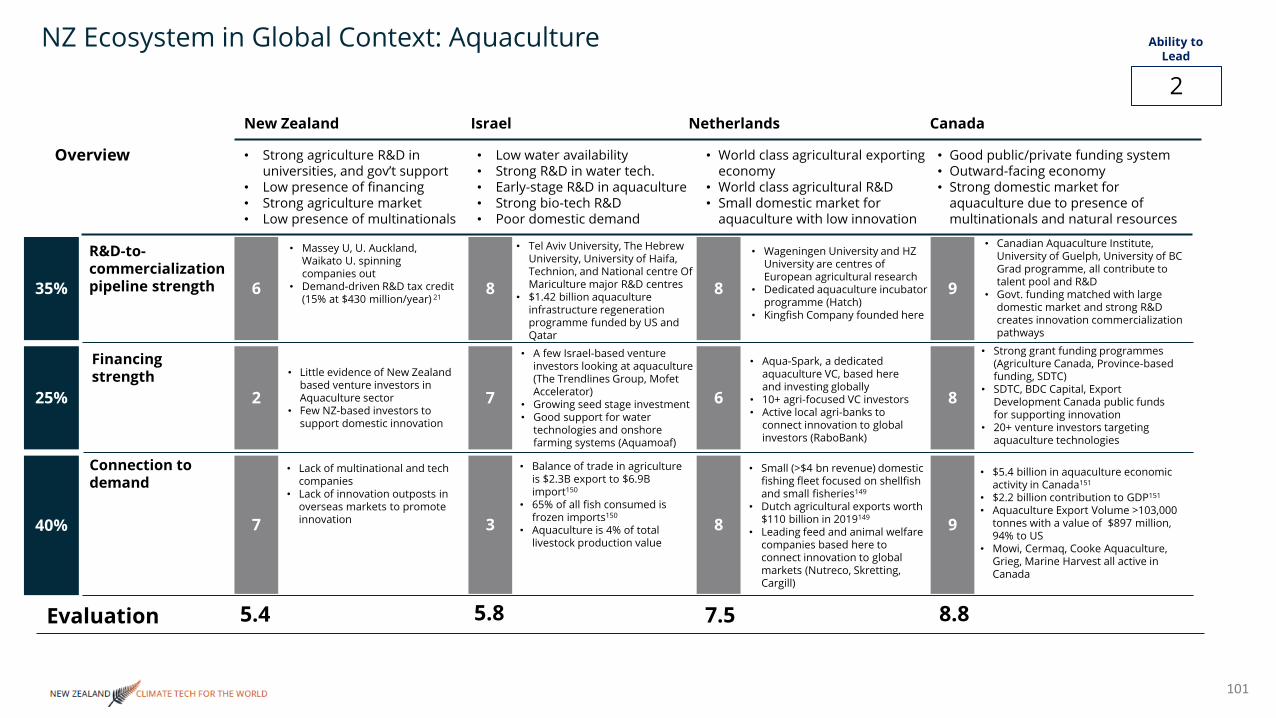
NZ Ecosystem in Global Context: Aquaculture
101
Overview
7
2
6
3
7
8
8
6
8
9
8
9
New Zealand Israel Netherlands Canada
Evaluation 5.4 5.8 7.5 8.8
• Strong agriculture R&D in universities, and gov’t support
• Low presence of financing • Strong agriculture market• Low presence of multinationals
• Massey U, U. Auckland, Waikato U. spinning companies out
• Demand-driven R&D tax credit (15% at $430 million/year) 21
• Little evidence of New Zealand based venture investors in Aquaculture sector
• Few NZ-based investors to support domestic innovation
• Lack of multinational and tech companies
• Lack of innovation outposts in overseas markets to promote innovation
• Low water availability• Strong R&D in water tech.• Early-stage R&D in aquaculture• Strong bio-tech R&D• Poor domestic demand
• Tel Aviv University, The Hebrew University, University of Haifa, Technion, and National centre Of Mariculture major R&D centres
• $1.42 billion aquaculture infrastructure regeneration programme funded by US and Qatar
• A few Israel-based venture investors looking at aquaculture (The Trendlines Group, Mofet Accelerator)
• Growing seed stage investment• Good support for water
technologies and onshore farming systems (Aquamoaf)
• Balance of trade in agriculture is $2.3B export to $6.9B import150
• 65% of all fish consumed is frozen imports150
• Aquaculture is 4% of total livestock production value
• World class agricultural exporting economy
• World class agricultural R&D• Small domestic market for
aquaculture with low innovation
• Wageningen University and HZ University are centres of European agricultural research
• Dedicated aquaculture incubator programme (Hatch)
• Kingfish Company founded here
• Aqua-Spark, a dedicated aquaculture VC, based here and investing globally
• 10+ agri-focused VC investors• Active local agri-banks to
connect innovation to global investors (RaboBank)
• Small (>$4 bn revenue) domestic fishing fleet focused on shellfish and small fisheries149
• Dutch agricultural exports worth $110 billion in 2019149
• Leading feed and animal welfare companies based here to connect innovation to global markets (Nutreco, Skretting, Cargill)
• Good public/private funding system • Outward-facing economy• Strong domestic market for
aquaculture due to presence of multinationals and natural resources
• Canadian Aquaculture Institute, University of Guelph, University of BC Grad programme, all contribute to talent pool and R&D
• Govt. funding matched with large domestic market and strong R&D creates innovation commercialization pathways
• Strong grant funding programmes (Agriculture Canada, Province-based funding, SDTC)
• SDTC, BDC Capital, Export Development Canada public funds for supporting innovation
• 20+ venture investors targeting aquaculture technologies
• $5.4 billion in aquaculture economic activity in Canada151
• $2.2 billion contribution to GDP151
• Aquaculture Export Volume >103,000 tonnes with a value of $897 million, 94% to US
• Mowi, Cermaq, Cooke Aquaculture, Grieg, Marine Harvest all active in Canada
2
Ability to Lead
R&D-to-commercializationpipeline strength
Connection to demand
Financing strength
40%
25%
35%

Scoring: Aquaculture
102
Trends
Market NZ PositionAlignment w/
StrengthExternal Potential Ability to leadTiming of
Trend
3 2 2 2Aquaculture
Takeaways for NZ Climate Tech Innovators• Take advantage of NZ’s investment in new aquaculture
infrastructure. Both land-based RAS systems and open water pens are increasingly sophisticated and capable of farming higher value species more reliably.
• New Zealand’s natural resources are a competitive advantage as open ocean farming further offshore is developed to combat environmental challenges posed by near-shore aquaculture systems.
• Work on support and service infrastructure for both open ocean systems and onshore systems. Opportunity exists across the value chain from genetics, feed inputs and additives, fish health, and the farming hardware/software for growing systems.
Takeaways for NZ Climate Tech Ecosystem• New Zealand’s aquaculture industry is primed for development and
is anticipating increasing its export earnings to NZ$3 billion by 2035 from $600+ million today.152, 153
• While government support may enable large infrastructure projects for farming systems, innovative support and services that are more easily exported to other markets may be challenged by lack of R&D infrastructure and financing in NZ.
• The lack of multinational presence creates a partnership and learning-by-doing gap for NZ innovators compared to their counterparts in other clusters. This also reduces the options for eventual exits.
• organisations such as The Trendlines Group in Israel are working with a portfolio of solutions, many in aquaculture, that they are investing in and introducing to investors through their global network (Singapore, SF).

103
ContentsAgriculture & Food– Comparison between Small Advanced Economies (SAEs)Livestock
Livestock Monitoring
Livestock Breeding & Genetics
Methane Vaccines
Feed Alternatives and AdditivesProtein ReplacementsAquacultureCrops
Specialty Crops
Precision Chemical Application
Agricultural digitalisationAgricultural Robotics
Agricultural Drones
Agricultural Software
CCS for Agriculture
CONTENTS

0
5
10
15
20
25
0
200
400
600
800
1000
1200
1400
1600
Mill
ions
Overview – Crop Innovation in Small Advanced Economies (SAEs)
104
Crop Investments (2011 – 2021) and Funded Innovators in SAEsFunding Raised ($)
Netafim ($559 m)
Netafim ($500 m)
Number of Companies Funding Raised ($)
Number of Companies
Crop Investments (2011 – 2021) in SAEs Excluding Israel
0
1
2
3
4
5
6
7
8
9
0
5
10
15
20
25
30
35
40
45
50
Mill
ions

Specialty Crops – Trend Analysis
105
➢ Access to strong talent pool through Oxford, Cambridge, and Imperial College London Universities.
➢ Public funding for innovation is easily available through organisations like Innovate UK and the Seed Enterprise Investment Scheme.
➢ Crop and agricultural science research centres such as Rothamstead, Cirencester Agricultural College, Harper Adams, create a strong talent pool and lower R&D and trial costs.
Developer of commercial varieties of tropical specialty crops
London, UK
Developer of food quality traits such as protein content in food crops
Israel
• Description: Intensively cultivated fruit, vegetable, nut, and horticulture crops often bred to optimize growing and environmental resilience characteristics.
• External potential: The specialty crops market was valued at $982.2 million in 2019 and is projected to reach $1.2 billion by 2027, giving a CAGR of 2.6% from 2020 to 2027. The industry is driven by increasing abiotic stress from climate change leading to yield losses in specialty crops, which are often grown in equatorial climates which are the most vulnerable. Specialty crop companies are also breeding new strains that are more resistant to disease and pests, and well as increasing measures of quality and functionality such as protein content.154
• Timing: The adoption of low-cost genetic editing tools such as CRISPR has lowered the barrier to entry for startups in this market and broadened the potential range in-field and quality traits that can be optimized for. World food prices remained low between 2015 – 2020 but are set to increase. As food prices increase more focus will be put on in-field trait development of specialty crops.
• Environmental impact reduction potential: Varies significantly by crop and geography.
External Potential
Timing of Trend
4 2
Example innovators
Summary
Key ClustersUnited Kingdom
Israel➢ Strong biotechnology research and development through Israel Innovation Authority, Technion and Universities
has created leading biotech.
➢ Strong local ecosystem of venture and growth investors in agriculture including The Trendlines Group, Terra Venture Partners, Hanaco Ventures.
➢ Strong internationalization through government supported foundations such as the BIRD Foundation to support US-Israel joint development.
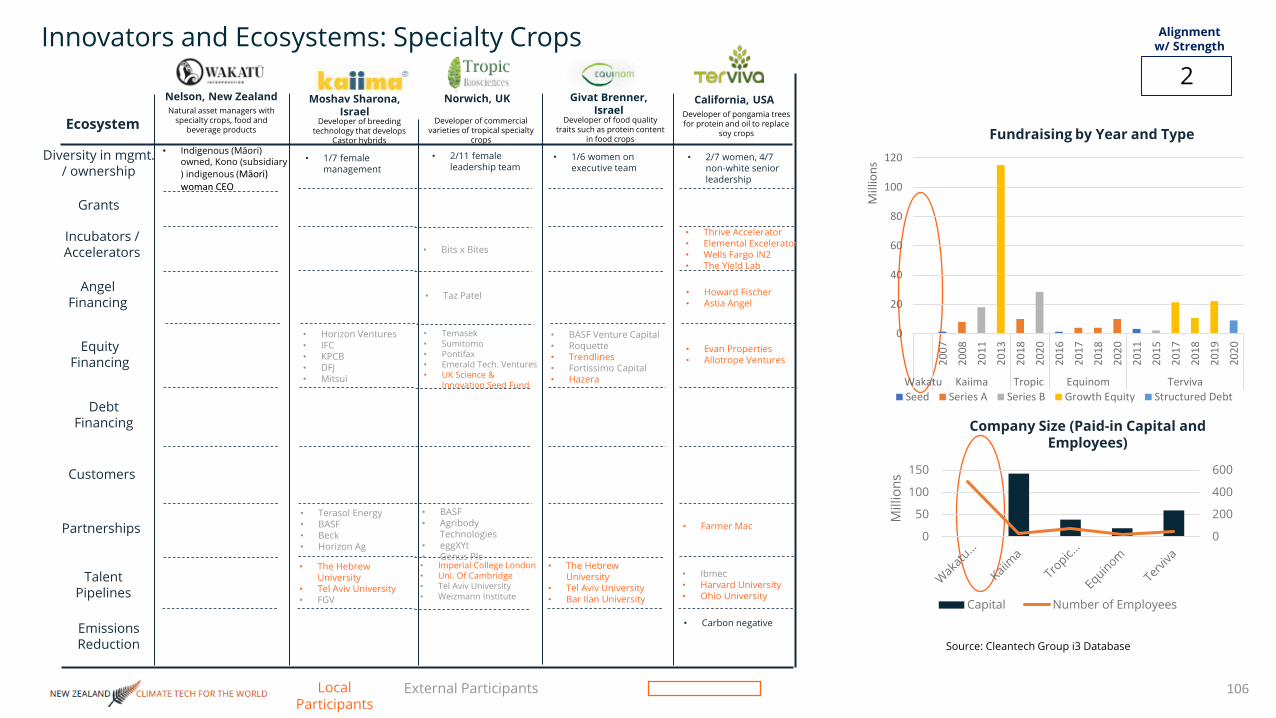
• Indigenous (Māori) owned, Kono (subsidiary ) indigenous (Māori) woman CEO
Innovators and Ecosystems: Specialty Crops
106
Fundraising by Year and Type
Company Size (Paid-in Capital and Employees)
Local Participants
External Participants
2
Alignment w/ Strength
Source: Cleantech Group i3 Database
Ecosystem
Emissions Reduction
Nelson, New Zealand Moshav Sharona, Israel
Givat Brenner, Israel
California, USANorwich, UKNatural asset managers with
specialty crops, food and beverage products
Developer of breeding technology that develops
Castor hybrids
Developer of commercial varieties of tropical specialty
crops
Developer of food quality traits such as protein content
in food crops
Developer of pongamia trees for protein and oil to replace
soy crops
Incubators / Accelerators
Grants
Angel Financing
Equity Financing
Debt Financing
Customers
Talent Pipelines
Partnerships
Diversity in mgmt. / ownership
• Carbon negative
• The Hebrew University
• Tel Aviv University• FGV
• Imperial College London• Uni. Of Cambridge• Tel Aviv University• Weizmann Institute
• The Hebrew University
• Tel Aviv University• Bar Ilan University
• Ibmec• Harvard University• Ohio University
• Farmer Mac• BASF• Agribody
Technologies• eggXYt• Genus Plc
• Horizon Ventures• IFC• KPCB• DFJ• Mitsui
• Temasek• Sumitomo• Pontifax• Emerald Tech. Ventures• UK Science &
Innovation Seed Fund
• BASF Venture Capital• Roquette• Trendlines• Fortissimo Capital• Hazera
• Evan Properties• Allotrope Ventures
• Howard Fischer• Astia Angel
• Bits x Bites
• Thrive Accelerator• Elemental Excelerator• Wells Fargo IN2• The Yield Lab
• Terasol Energy• BASF• Beck• Horizon Ag
• Taz Patel
0
20
40
60
80
100
120
2007
2008
2011
2013
2018
2020
2016
2017
2018
2020
2011
2015
2017
2018
2019
2020
Wakatu Kaiima Tropic Equinom Terviva
Mill
ions
Seed Series A Series B Growth Equity Structured Debt
0
200
400
600
0
50
100
150
Mill
ions
Capital Number of Employees
• 1/7 female management
• 2/11 female leadership team
• 1/6 women on executive team
• 2/7 women, 4/7 non-white senior leadership

Precision Chemical Application – Trend Analysis
107
➢ With water use being a national security priority as well as a key innovation sector (Netafim) in Israel, effective chemical use in agricultural land reduces water use intensity.
➢ Incubators including the Kitchen Hub and Fresh Start coordinate technical university spin outs with industry to support early stages of growth,
Developer of precision spraying technology
Ireland
Developer AI to improve pest control processes
Israel
• Description: Use of precision spraying and microencapsulation technologies for more targeted and controlled release of agricultural inputs.
• External potential: The global microencapsulated pesticides market is expected to grow from USD 334.16 Million in 2017 to USD 817.45 Million by 2025, at a CAGR of 11.83% during the forecast period from 2018-2025. The precision farming market more broadly is predicted to grow from $16.7 billion in 2021 to $16.4 billion in 2028. The development of new chemical and biological crop inputs is required to meet regulatory and environmental targets. New products are typically more expensive than conventional chemicals, and so precision application aims to reduce the quantity used, reducing overall resource intensity of production. 155, 156
• Timing: As chemical usage in agriculture is increasingly controlled by regulation and the banning of chemicals such as neonicotinoids in Europe and Glyphosate (most recently in Mexico), the improved efficiency and targeting of higher cost chemicals is required.
• Environmental impact reduction potential: 70% of pesticide currently used does not reach the crop, leading to overuse and high water usage in spraying processes. Increased adoption of controlled-release and stabilized fertilizers could decarbonize the agriculture sector ~75 MtCO₂e, at cost of ~$65/tCO₂e, by 2050. Reducing nitrogen over-application in China and India alone could account for ~88 MtCO₂e decarbonization at cost savings of ~$97/tCO₂e by 2050. 155, 156
External Potential
Timing of Trend
3 2
Example innovators
Summary
Key ClustersIsrael
Ireland➢ Good agricultural accelerator network with European headquarters for US-based programmes The Yield Lab and
Thrive.
➢ Connection to European Union and favorable tax regimes attracts large international corporations despite small domestic agricultural market.

Innovators and Ecosystems: Precision Chemical Application
108
Fundraising by Year and Type
Company Size (Paid-in Capital and Employees)
Local Participants
External Participants
1
Alignment w/ Strength
Source: Cleantech Group i3 Database
Ecosystem
Emissions Reduction
Auckland, New Zealand
Dublin, Ireland Paris, France Lund, SwedenTel Aviv, Israel
Developer of a controlled release nitrogen fertilizer
Developer of precision spraying technology
Developer of fluidic encapsulation technology
Developer AI to improve pest control processes
Provider of satellite imagery to help reduce
fertilizer use
Incubators / Accelerators
Grants
Angel Financing
Equity Financing
Debt Financing
Customers
Talent Pipelines
Partnerships
Diversity in mgmt. / ownership
• Reduce drift 70%• Reduce water
usage 25-50%
• Auckland University of Technology
• University College Dublin
• Harper Adams University
• ESPCI Paris• Chimie ParisTech• AgroParisTech
• The Hebrew University
• Ben-Gurion University• IDC Herzliya• University of Oxford
• Stockholm University• KTH Royal Institute• Halmstad University
• Farmlands Coop• PGG Wrightson
• Astanor Ventures• WakeUp Capital• SVG Ventures
• Demeter IM• BPIFrance
• Jerusalem VP• Syngenta Ventures• One Way Ventures• Panache Ventures• Hyperplane VC
• Seedrs• Norrsken VC• Almi Invest
• Thrive Accelerator• Pearse Lyons
Accelerator
• Microsoft AI for Good• Techstars
• Ballance Agri-Nutrients
• Trimble• Groenoord• PAR• Senwes• Airtec
• Wilco
• 2B Angels
• Israel Innovation Authority
• Volcani centre
• Rockstart• Fast Track Malmo
• FarmLEAP• Agdata• Tanibox• Don State TU• UP42
• 1/3 C-suite non-white
• Callaghan Innovation
0
200
0
5
10
15
Eko360 MagGrow Kapsera Greeneye Vultus
Mill
ions
Capital Number of Employees
01234
5678
2018 2020 2018 2019 2018 2019 2020 2018 2019
Eko360 MagGrow Kapsera Greeneye Vultus
Mill
ions
Seed Series A Series B Growth Equity Grant

NZ Ecosystem in Global Context: Crops
109
Overview
4
2
6
6
7
8
8
8
9
5
4
5
New Zealand Israel UK Ireland
Evaluation 4.2 7.0 8.4 4.8
• Strong agriculture R&D in universities, and gov’t support
• Low presence of financing • Strong agriculture market• Low presence of multinationals
• Massey U, U. Auckland, Waikato U. spinning companies out
• Callaghan Innovation loans are supporting crop innovation
• Demand-driven R&D tax credit (15% at $430 million/year) 21
• Seed and early-stage financing supporting ag tech (e.g. Powerhouse)
• Few NZ-based investors to support larger equity and debt rounds, corporate and external investors are accessing companies in standout cases
• Horticultural exports valued at $6.2 bn in 2019
• 79.6% (value) from specialty crops (kiwi, wine, apples)
• Lack of innovation outposts in overseas markets to promote innovation
• Small domestic market• Connected to EU with attractive
business tax rates• Strong relative size of early-stage
support organisations• SVG Thrive has European outpost• The Yield Lab European outpost• Strong Universities (Trinity College
Dublin, Teagsac)• 1.5% of GDP spent R&D, 25% tax
credit for small businesses• US-Ireland R&D Partnership Call
(DAERA / NIFA collaboration)
• Few early-stage investors based in Ireland
• Many investors focused on connection to international finance (Atlantic Bridge)
• Active role for Enterprise Ireland in agriculture & food investment
• Agri-food generated 7% of gross value added (€13.9 billion), 9.8% of Ireland’s merchandise exports and 8.5% of employment. (2016) 157
• Grass-based agricultural system attracts few innovative technologies due to low-intensity farming practises
• Favorable tax regime could attract European market entrants
2
Ability to Lead
• World-leading biotech cluster• Coordinated public-private
support for innovation• Strong internationalization of
technology solutions• Technion, Weizmann Institute,
Hebrew University participating in spinoffs49
• Strong biotech capability• Specialist accelerators incl.
corporates (e.g. Strauss)• Strong international support
• 50+ agtech investors (avg. amount <$5m)50
• Partnerships with local investors and international corporates to support local ecosystem
• Small domestic sales market but kosher principles increase alt. protein adoption
• Strong internationalization of technology solutions in alternative proteins
• Leading academic institutions• Leading R&D in agriculture• Global financial centre• Extensive internationalization
of Ag. services and innovation• Innovate UK well funded
coordinator of public grants and early-stage support
• UK BEIS and DEFRA active in support innovation through grants and pilots
• 5+ research universities looking at livestock and agriculture
• 10+ VC and equity investors based in London dedicated to agtech investment.
• Over $3.6 billion invested in UK agtech companies in 10 years
• Total income from farming industry $14.4 billion (0.53% GVA, 2019)
• Livestock is around 58% of market share by value
• Exports account for only 17% of revenue.
• Traditionally an entrepot for European expansion
• Uncertain trade situation post-Brexit
R&D-to-commercializationpipeline strength
Connection to demand
Financing strength
40%
25%
35%

Scoring: Crops
110
Trends
Market NZ PositionAlignment w/
StrengthExternal Potential Ability to leadTiming of
Trend
4 2 2 2Specialty Crops
Takeaways for NZ Climate Tech Innovators• Leverage New Zealand’s high agricultural R&D spending combined
with its focus on specialty crop types such as kiwifruit, grape, apple. This provides a good market to integrate precision farming technologies.
• Focus on digital solutions. Hardware solutions such as microencapsulation and precision sprayers are being developed in economies with experience in pharmaceuticals and heavy machinery. Significant improvements can be made by combining digital solutions with existing hardware.
• New Zealand’s nitrogen cap provides good regulatory framework to integrate precision chemical application in high value crops.
• Develop strong use case studies to increase adoption. Adoption rates correlate with good communication of benefits to farmers.
Takeaways for NZ Climate Tech Ecosystem• Precision chemical technologies in other markets have been created
through chemical clusters and biopharmaceutical expertise, both of which are lacking in New Zealand.
• Despite specialty crops being a significant part of the agricultural economy, little evidence of crop innovation (in genetics especially) was evident.
• Other SAEs are seeing innovators move to international clusters (e.g. Tropic Biosciences Israel -> London) due to the level of expertise required and small global talent pool.
• Promoting international R&D partnerships could be a path towards increased innovation.
3 2 1 2Precision Chemical Application

111
ContentsAgriculture & Food– Comparison between Small Advanced Economies (SAEs)Livestock
Livestock Monitoring
Livestock Breeding & Genetics
Methane Vaccines
Feed Alternatives and AdditivesProtein ReplacementsAquacultureCrops
Specialty Crops
Precision Chemical Application
Agricultural digitalisationAgricultural Robotics
Agricultural Drones
Agricultural Software
CCS for Agriculture
CONTENTS

Overview – Agricultural Digitalisation Innovation in Small Advanced Economies (SAEs)
112
Agricultural Digitalisation Investments (2011 – 2021) and Funded Innovators in SAEs
Funding Raised ($) Number of Companies
Agricultural Digitalisation Investments (2011 –2021) and Funded Innovators in SAEs (excluding
Israel)Funding Raised ($) Number of Companies

Agricultural Robotics (Outdoor) – Trend Analysis
113
➢ Google X – Project Mineral, applying Waymo technology to autonomous agricultural robots
➢ Thrive Accelerator (SVG Ventures)– Recognized as top global agriculture accelerator, with investments in Farmwise, Harvest, and Tortuga
➢ Comet Labs – Legend (Lenovo) Holdings-backed robotics and AI-focused incubator / VC
➢ RAPID (Robot Assisted Precision Irrigation Delivery) – Cal. U. Berkeley, UDSA, NSF collaboration to develop low-cost autonomous irrigation robots and UAVs
Developer of connected and autonomous robots for outdoor weeding applications
San Francisco, CA, USA
Mobile robot for transport and arrangement of potted plants in horticultural environments
Billerica, MA, USA
• Description: Hardware tools to increase speed, accuracy, timing, and reduce human error in outdoor farming (as opposed to indoor / vertical farming). Solutions include automation for picking, packing, irrigation, and weeding.
• External potential: Estimated global market size of $7.4 billion in 2021, $10.8 bn by 2023 for outdoor agricultural robotics (figure includes UAV and software, in addition to robotic hardware). Driver error accounts for between 15%-22% of operational costs for tractor usage on outdoor farms. 163 Problem of weeding is growing each year – weeds more resistant to herbicides, requiring 3 billion pounds of herbicides ($25 billion) to be used each year. 160 Robotics-as-a-service models are coming online, with potential to drop cost barriers and access new markets.159
• Timing: 55% of farmers surveyed in California reported that labor shortages are a challenge, a challenge that preceded Covid-19 and has been exacerbated by the pandemic. Technologies with the ability to automate single processes are mature in the market, however, multi-purpose automation is largely still in the R&D phases and will be key to unlocking the most lucrative productivity gains. Clusters of innovation are observable mostly in the US, Northern Europe, and Western Europe, with innovators located close to demand pools, but without large-scale servicing of global demand by one cluster. 160
• Environmental impact reduction potential: Potential for up to 2.5 billion lb reduction in herbicide usage globally, reducing demand by 83%. 162
External Potential
Timing of Trend
4 4
Example innovators
Summary
Key ClustersNorthern California
Massachusetts➢ Life Science Partners – 5+ funds in firm history totaling over $1 bn, solving urgent health needs and funding
solutions including precision agriculture and agricultural robotics
➢ MassRobotics – Industry network of 350 Boston-area robotics companies and 18 universities
➢ Greentown Labs – MIT-spinoff incubator, North America’s largest cleantech incubator, has incubated local champion agricultural robotics companies such as Root.AI
➢ MIT 77 Lab – Autonomous robotics research lab focused on human-robotic collaboration, with specific divisions focused on agricultural robotics

Innovators and Ecosystems: Agricultural Robotics
114
Ecosystem
Incubators / Accelerators
Fundraising by Year and Type
Company Size (Paid-in Capital and Employees)
Grants
Angel Financing
Equity Financing
Debt Financing
Customers
Talent Pipelines
Partnerships
Tauranga, New Zealand
• Yamaha Motors
• Global Pac Technologies (Distribution US, AUS, NZ)
• Massey University
Norway
• Propogator Ventures• Rabo Food and Agri Fund• Nysno Climate
Investments• ADM Capital
• Norwegian School of Economics
• NTNU
• NMBU• University of Lincoln
Yverdon-les-Bains, CH
• Business Angels Switzerland
• CapAgro• BASF Venture Capital• 4FO Ventures
• Bucher Landtechnik (Distribution)
• EPFL• HES-SO• HEIG-VD• ETH Zurich
• EPFL • Swiss Climate
Foundation• Innosuisse
• Thrive Accelerator
Local Participants
External Participants
3
Alignment w/ Strength
Source: Cleantech Group i3 Database
• U. Auckland Centre for Automation and Robotic Engineering
Billerica, MA, USA
• Thrive Accelerator
• Cultivian Ventures• Life Science Partners• MassVentures• Entrée Capital
• Mousse Partners• Cultivian Ventures• Life Science Partners
• 30+ nurseries and farms in US Northeast
• Umass Amherst• MIT
• Jaybridge Robotics
San Francisco, CA., USA
• Calibrate Venture• Alumni Ventures• Felicis Ventures• Cavallo Ventures
• Farms – Salinas Valley (CA)
• Farms – Yuma (AZ)
• Stanford • Cal. State Polytech
San Lius Obispo
• U. California Dept. Ag • Western Growers
Association
Hayward, CA, USA
• Comet Labs• Thrive Accelerator• SRI International
• Google Ventures• KPCB Edge• Yamaha Motors• Tellus Partners
• Apple farms in CA and WA
• T&G Global (NZ) 41
• Stanford• Brigham Young• Carnegie Mellon
• Kubota• Washington Tree
Fruit Research Commission
• Thrive Accelerator
Emissions Reduction
Diversity in mgmt. / ownership • 2/5 C-suite women
• 95% herbicide reduction
• No loss of yield
UK Department for Business, Energy and Industriall Strategy
Acquirer
Developer of robotics solutions for agricultural
and horticultural useDeveloper of farm robots Designer, developer and vendor
of autonomous agriculture robots for weeding fields
Developer of smart and autonomous robots for
weeding
Developer of robotics for the agricultural produce picking
industry
Developer of a robot for use in the transportation
of potted plants in horticultural agriculture
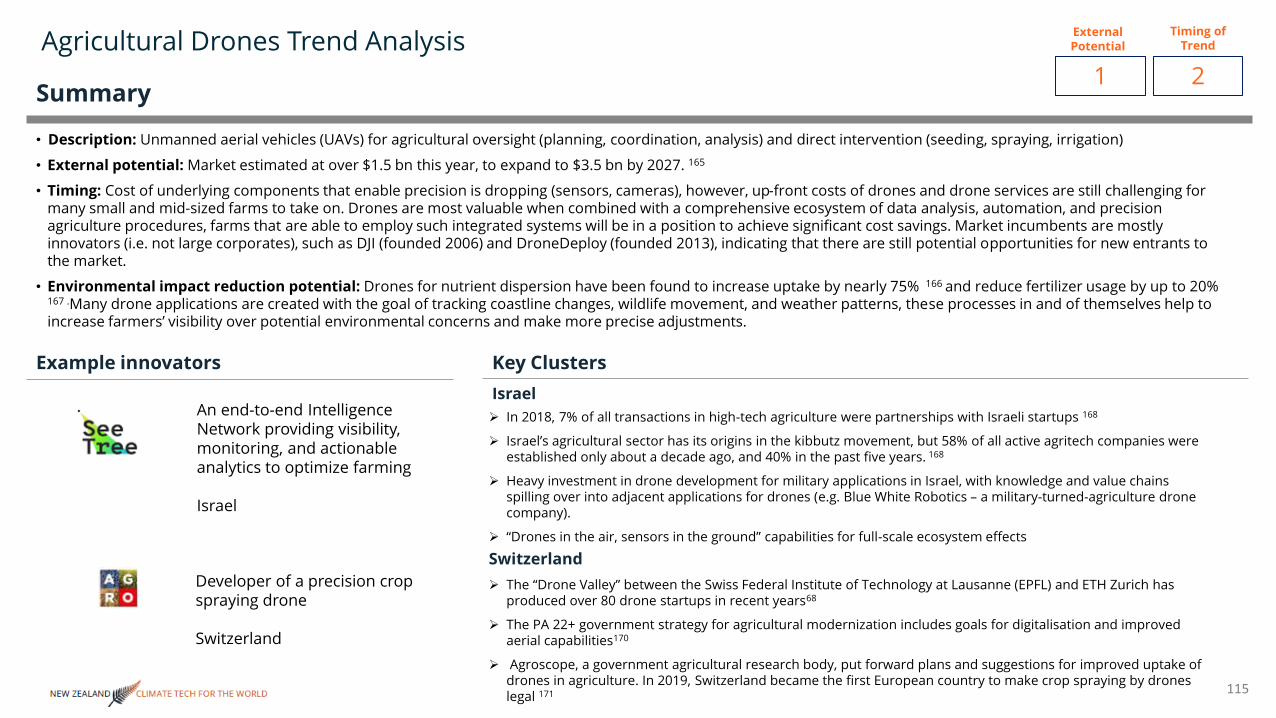
Agricultural Drones Trend Analysis
115
➢ In 2018, 7% of all transactions in high-tech agriculture were partnerships with Israeli startups 168
➢ Israel’s agricultural sector has its origins in the kibbutz movement, but 58% of all active agritech companies were established only about a decade ago, and 40% in the past five years. 168
➢ Heavy investment in drone development for military applications in Israel, with knowledge and value chains spilling over into adjacent applications for drones (e.g. Blue White Robotics – a military-turned-agriculture drone company).
➢ “Drones in the air, sensors in the ground” capabilities for full-scale ecosystem effects
An end-to-end Intelligence Network providing visibility, monitoring, and actionable analytics to optimize farming
Israel
Developer of a precision crop spraying drone
Switzerland
• Description: Unmanned aerial vehicles (UAVs) for agricultural oversight (planning, coordination, analysis) and direct intervention (seeding, spraying, irrigation)
• External potential: Market estimated at over $1.5 bn this year, to expand to $3.5 bn by 2027. 165
• Timing: Cost of underlying components that enable precision is dropping (sensors, cameras), however, up-front costs of drones and drone services are still challenging for many small and mid-sized farms to take on. Drones are most valuable when combined with a comprehensive ecosystem of data analysis, automation, and precision agriculture procedures, farms that are able to employ such integrated systems will be in a position to achieve significant cost savings. Market incumbents are mostly innovators (i.e. not large corporates), such as DJI (founded 2006) and DroneDeploy (founded 2013), indicating that there are still potential opportunities for new entrants to the market.
• Environmental impact reduction potential: Drones for nutrient dispersion have been found to increase uptake by nearly 75% 166 and reduce fertilizer usage by up to 20% 167 .Many drone applications are created with the goal of tracking coastline changes, wildlife movement, and weather patterns, these processes in and of themselves help to increase farmers’ visibility over potential environmental concerns and make more precise adjustments.
External Potential
Timing of Trend
1 2
Example innovators
Summary
Key ClustersIsrael
Switzerland➢ The “Drone Valley” between the Swiss Federal Institute of Technology at Lausanne (EPFL) and ETH Zurich has
produced over 80 drone startups in recent years68
➢ The PA 22+ government strategy for agricultural modernization includes goals for digitalisation and improved aerial capabilities170
➢ Agroscope, a government agricultural research body, put forward plans and suggestions for improved uptake of drones in agriculture. In 2019, Switzerland became the first European country to make crop spraying by drones legal 171

Innovators and Ecosystems: Agricultural Drones
116
Fundraising by Year and Type
Company Size (Paid-in Capital and Employees)
Local Participants
External Participants
2
Alignment w/ Strength
Source: Cleantech Group i3 Database
Acquirer
Ecosystem
Emissions Reduction
Aerial robotic systems, based on advanced multi-rotor airframes,
ready-to-fly aircraft.
An end-to-end Intelligence network providing visibility, monitoring, and actionable
analytics to optimize farming
Developer of fruit-picking drones Developer of software that uses hyperspectral imaging
and analytics technology
Developer of a precision crop spraying drone
Developer of precision analytics tools for large
agricultural farms
Incubators / Accelerators
Grants
Angel Financing
Equity Financing
Debt Financing
Customers
Talent Pipelines
Partnerships
Diversity in mgmt. / ownership
• U. Canterbury• Hebrew University of
Jerusalem• Tel Aviv University• Technion
• U. New Brunswick• McGill U.
• Maverick Ventures Israel
• OurCrowd• AgFunder
• BDC Capital• New Brunswick
Innovation Foundation• Monstanto• Mahindra• McCain Foods
• Thrive Accelerator
• BBC• Fox Sports• NASA
• Farm customers in Israel, South Africa, the US, Brazil
• Swiss Federal Office of Environment
• Syngenta• Global Aerospoace
New Zealand Israel Israel Switzerland Switzerland Canada
0
5
10
15
20
25
30
35
2013
2015
2016
2017
2019
2020
2017
2019
2020
2020
2021
2016
2017
2019
2014
2016
2018
Aeronavics See Tree Tevel Gamaya Resson
Mill
ions
Seed Series A Series B Growth Equity Grant
0
100
0204060
Mill
ions
Capital Number of Employees
Woman Co-founder
• Callaghan Innovation
• Crowdfunding
• Canaan Partners Israel
• International Finance Corporation (IFC)
• Hanaco Ventures
• Iangels• Uri Levine
1/6 C-suite women
• Pilots in Spain, US, Italy, in apple plantations over 100 Ha
• Tel Aviv University• Technion
• Ziv Aviram• Amichai Steimberg
External Participants
• EPFL• ETH Zurich• INSEAD
• VI Partners• Sandoz Foundation • Mahindra• ICOS Capital• Seed4Equity
• EIT Digital Accelerator
• Nvidia Inception Award
• 1/3 C-suite non-white
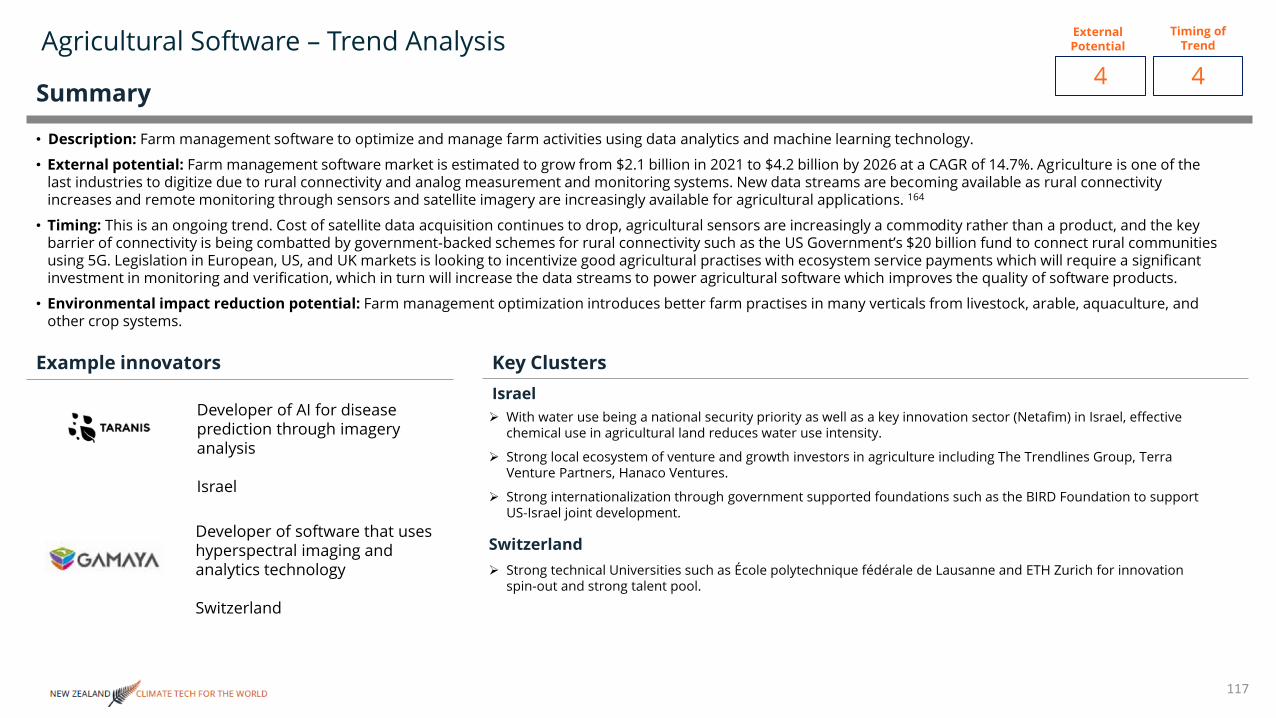
Agricultural Software – Trend Analysis
117
➢ With water use being a national security priority as well as a key innovation sector (Netafim) in Israel, effective chemical use in agricultural land reduces water use intensity.
➢ Strong local ecosystem of venture and growth investors in agriculture including The Trendlines Group, Terra Venture Partners, Hanaco Ventures.
➢ Strong internationalization through government supported foundations such as the BIRD Foundation to support US-Israel joint development.
Developer of AI for disease prediction through imagery analysis
Israel
Developer of software that uses hyperspectral imaging and analytics technology
Switzerland
• Description: Farm management software to optimize and manage farm activities using data analytics and machine learning technology.
• External potential: Farm management software market is estimated to grow from $2.1 billion in 2021 to $4.2 billion by 2026 at a CAGR of 14.7%. Agriculture is one of the last industries to digitize due to rural connectivity and analog measurement and monitoring systems. New data streams are becoming available as rural connectivity increases and remote monitoring through sensors and satellite imagery are increasingly available for agricultural applications. 164
• Timing: This is an ongoing trend. Cost of satellite data acquisition continues to drop, agricultural sensors are increasingly a commodity rather than a product, and the key barrier of connectivity is being combatted by government-backed schemes for rural connectivity such as the US Government’s $20 billion fund to connect rural communities using 5G. Legislation in European, US, and UK markets is looking to incentivize good agricultural practises with ecosystem service payments which will require a significant investment in monitoring and verification, which in turn will increase the data streams to power agricultural software which improves the quality of software products.
• Environmental impact reduction potential: Farm management optimization introduces better farm practises in many verticals from livestock, arable, aquaculture, and other crop systems.
External Potential
Timing of Trend
4 4
Example innovators
Summary
Key ClustersIsrael
Switzerland➢ Strong technical Universities such as École polytechnique fédérale de Lausanne and ETH Zurich for innovation
spin-out and strong talent pool.
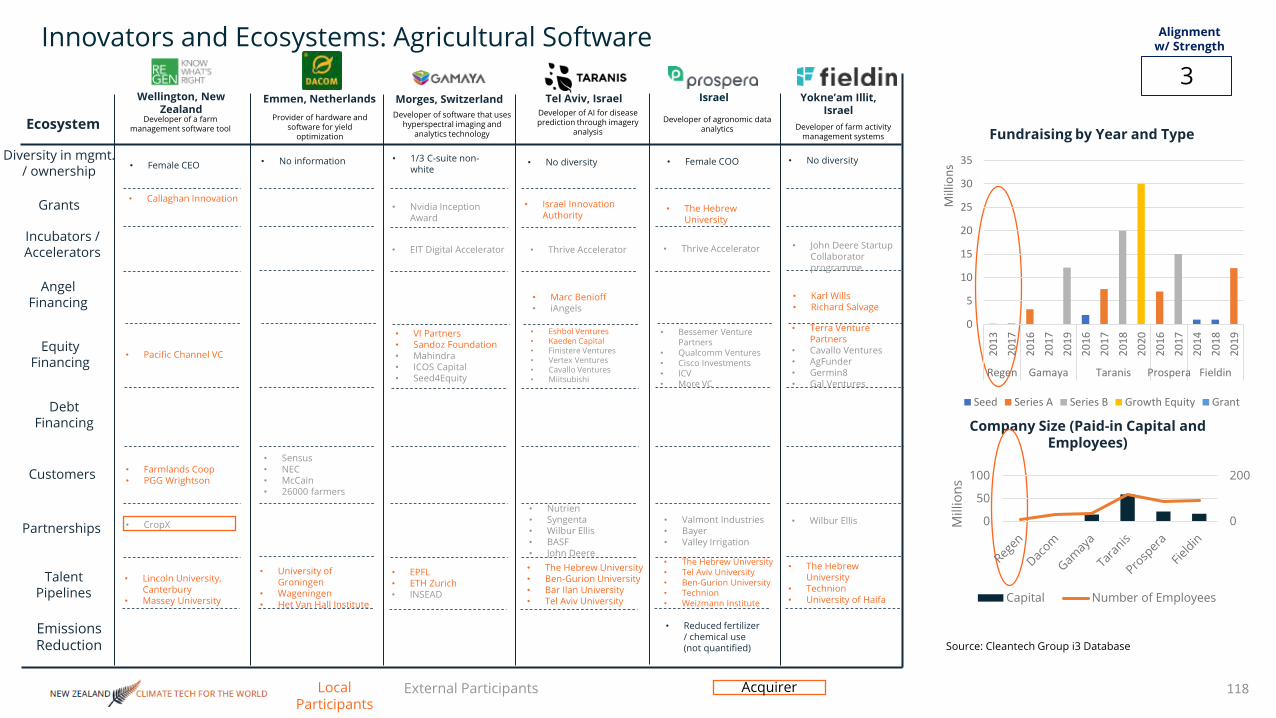
Innovators and Ecosystems: Agricultural Software
118
Fundraising by Year and Type
Company Size (Paid-in Capital and Employees)
Local Participants
External Participants
3
Alignment w/ Strength
Source: Cleantech Group i3 Database
Acquirer
Ecosystem
Emissions Reduction
Wellington, New Zealand
Emmen, Netherlands Morges, Switzerland Israel Yokne’am Illit, Israel
Tel Aviv, Israel
Developer of a farm management software tool
Provider of hardware and software for yield
optimization
Developer of software that uses hyperspectral imaging and
analytics technology
Developer of AI for disease prediction through imagery
analysisDeveloper of agronomic data
analytics Developer of farm activity management systems
Incubators / Accelerators
Grants
Angel Financing
Equity Financing
Debt Financing
Customers
Talent Pipelines
Partnerships
Diversity in mgmt. / ownership
• Lincoln University, Canterbury
• Massey University
• University of Groningen
• Wageningen• Het Van Hall Institute
• EPFL• ETH Zurich• INSEAD
• The Hebrew University• Ben-Gurion University• Bar Ilan University• Tel Aviv University
• The Hebrew University
• Technion• University of Haifa
• VI Partners• Sandoz Foundation • Mahindra• ICOS Capital• Seed4Equity
• Eshbol Ventures• Kaeden Capital• Finistere Ventures• Vertex Ventures• Cavallo Ventures• Miitsubishi
• Terra Venture Partners
• Cavallo Ventures• AgFunder• Germin8• Gal Ventures
• Karl Wills• Richard Salvage
• Thrive Accelerator • John Deere Startup Collaborator programme
• Reduced fertilizer / chemical use (not quantified)
• The Hebrew University• Tel Aviv University• Ben-Gurion University• Technion• Weizmann Institute
• The Hebrew University
• Marc Benioff• iAngels
• Israel Innovation Authority
• Nutrien• Syngenta• Wilbur Ellis• BASF• John Deere
• EIT Digital Accelerator
• Farmlands Coop• PGG Wrightson
• CropX
• Sensus• NEC• McCain• 26000 farmers
• Valmont Industries• Bayer• Valley Irrigation
• Thrive Accelerator
• Bessemer Venture Partners
• Qualcomm Ventures• Cisco Investments• ICV• More VC
• Wilbur Ellis
• Nvidia Inception Award
0
5
10
15
20
25
30
35
2013
2017
2016
2017
2019
2016
2017
2018
2020
2016
2017
2014
2018
2019
Regen Gamaya Taranis Prospera Fieldin
Mill
ions
Seed Series A Series B Growth Equity Grant
0
200
0
50
100
Mill
ions
Capital Number of Employees
• Female CEO • No information • 1/3 C-suite non-white
• No diversity • Female COO • No diversity
• Callaghan Innovation
• Pacific Channel VC

NZ Ecosystem in Global Context: Agricultural Digitalisation
119
Overview
7
5
8
8
7
8
8
8
10
7
6
9
New Zealand Israel Massachusetts (USA) Switzerland
Evaluation 6.9 7.8 8.7 7.5
• Strong agriculture R&D in universities, and gov’t support
• Low presence of financing • Strong agriculture market• Low presence of multinationals
• Massey U, U. Auckland, Waikato U. spinning companies out
• Callaghan Innovation loans are supporting ag robotics (e.g. Greentech Robotics)
• Demand-driven R&D tax credit (15% at $430 million/year) 21
• Seed and early-stage financing supporting ag tech (e.g. Powerhouse)
• Few NZ-based investors to support larger equity and debt rounds, corporate and external investors are accessing companies in standout cases (e.g. Robotics Plus)
• Horticultural exports alone valued at $5.5 bn in 2018 34
• $48 bn invested in horticultural products in 2018 34
• Lack of multinational robotics and tech companies
• Lack of innovation outposts in overseas markets to promote innovation
• Top US academic zone• Significant robotics cluster• Top US life sciences cluster• Robotics / plant science /
agricultural automation bleed overs
• Ag. Robotics research winning NSF grants in MA
• MIT, Harvard, Umass ag robotics talent / spin-offs
• 35 research universities with robotics programmes
• 10+ incubators with robotics programmes
• MassVentures, the state’s VC, is seeding ag robotics companies
• 20+ equity investment funds with ag technology in thesis 31
• Approximately $1.5 bn invested in Boston-area precision agriculture startups since 2011 31
• Leading robotics corporates –Boston Dynamics, Irobot, Rethink Robotics, Jaybridge, 350 robotics companies
• Leading agtech corporates HQ’d in MA – Indigo, CiBO, American Robotics
• John Deere, Monsanto active partnerships w/ MA agtech startups
• Outward-facing economy, emphasis on technology exports
• Strong multinationals – Robotics, Chemicals & pharmaceuticals (some with AgroSciences divisions)
• ETH Zurich, EPFL ag robotics talent / spin-offs
• Relevant gov’t agencies & NGOs –Innosuise, Agroscope, Swiss Climate Foundation
• Corporate participation – Google, Microsoft, IBM, founding members of digitalsuisse
• 10+ equity investment funds with ag technology in thesis, $35 m invested since 2011 (Ecorobotix and Gamaya account for $26 m) 31
• Active angel networks and family offices supporting early stage
• ~$6 bn revenues in non-livestock agriculture 43
• BASF, Dow Agrosciences, Bayer Crop Sciences, Dupont all active in Switzerland
• Strong digital industry – ABB• Google has innovation outpost for
robotics in Zurich• Strong science & tech global
promotion infrastructure – Swissnex, Swiss Global Enterprise
3
Ability to Lead
• World-leading biotech cluster• Coordinated public-private
support for innovation• Strong internationalization of
technology solutions• Technion, Weizmann Institute,
Hebrew University participating in spinoffs49
• Resource constraints increase use of optimization technologies
• Specialist accelerators incl. corporates (e.g. Strauss)
• High military investment in tech.
• 50+ agtech investors (avg. amount <$5m)50
• Partnerships with local investors and international corporates to support local ecosystem
• BIRD Foundation active at bringing Israeli tech. to US market.
• Good number of innovative companies with experience of internationalization (Netafim)
• International corporates have innovation centres in-country to facilitate connection to demand.
• Israeli drone sector widely recognized for contributions to innovation in military applications
R&D-to-commercializationpipeline strength
Connection to demand
Financing strength
40%
25%
35%

Scoring: Agricultural Digitalisation
120
Trends
Market NZ PositionAlignment w/
StrengthExternal Potential Ability to leadTiming of
Trend
4 3 3 3Agricultural Robotics
Takeaways for NZ Climate Tech Innovators• The trends in agricultural robotics are strong, and the demand pull
is likely on the upswing – independent of Covid-19 labor shortages, automation of outdoor agricultural production stands to gain important improvements in efficiency, cost, safety, and compliance through more automation.
• The technology is mature enough to be commercialized large-scale, but multifunctionality of robots will be a force multiplier on efficiency and cost gains once it comes to commercial maturity.
• New Zealand has technical and business capabilities in the sector –companies are being spun out of universities and able to serve the market.
Takeaways for NZ Climate Tech Ecosystem• Growth is potentially challenged by lack of financing in NZ, which
may not affect innovators’ ability to serve the domestic market, but will ultimately create struggles to export robotics products, given that innovators in other ecosystems have access to comparable or superior R&D resources and significantly more capital.
• The lack of multinational presence creates a partnership and learning-by-doing gap for NZ innovators compared to their counterparts in other clusters. This also reduces the options for eventual exits.
• NZ does not have the same overseas innovation promotion in this sector that counterpart clusters do, creating a heavier lift for innovators seeking to expand globally. A good example is Swissnex, promoting Swiss science & technology through innovation, education, and business promotion exchanges globally, Swissnex has achieved success in promoting Swiss drones in the US and China (Solar Impulse world tour was once a Swissnex project).
4 3 3 3Agricultural Software
1 2 2 3Agricultural Drones

121
ContentsAgriculture & Food– Comparison between Small Advanced Economies (SAEs)Livestock
Livestock Monitoring
Livestock Breeding & Genetics
Methane Vaccines
Feed Alternatives and AdditivesProtein ReplacementsAquacultureCrops
Specialty Crops
Precision Chemical Application
Agricultural digitalisationAgricultural Robotics
Agricultural Drones
Agricultural Software
CCS for Agriculture
CONTENTS

CCUS for Agriculture – Trend Analysis
122
➢ Access to strong talent pool through Oxford, Cambridge, and Imperial College London Universities.
➢ Public funding for innovation is easily available through organisations like Innovate UK and the Seed Enterprise Investment Scheme.
➢ Crop and agricultural science research centres such as Rothamstead, Cirencester Agricultural College, Harper Adams, create a strong talent pool and lower R&D and trial costs.
Developer of a CO2 to fertilizer and plastics technology(UK)
Developer of biochar from waste biomass methane emissions(Finland)
• Description: The capture of carbon dioxide for agricultural purposes including increasing yield in greenhouses and carbon sequestration.
• External potential: The global carbon capture and storage market, including all industries, was valued at $6 billion in 2020 and is expected to reach $10.45 billion by 2026 giving a CAGR of 11.5%. Significant market share is taken by energy intensive industries that use high quality and concentration CO2 waste for other industrial purposes, but technology such as Direct Air Capture to combat climate change are increasingly funded. In agriculture, carbon capture occurs through pyrolysis of biomass to create biochar to use as a soil amendment. CO2 is also used to enrich greenhouse environments to stimulate plant growth. Finally, an emerging market is being created around carbon sequestration payments for farmers who are sequestering carbon in agricultural soils.173
• Timing: Several government initiatives and policies to reduce greenhouse gases emission across the sectors will further propel the market. CO2 enrichment is a niche application, but carbon sequestration payments could offer a new revenue stream to farmers and increase the value of soil amendments and biological fertilizer in the next two to five years.
• Environmental impact reduction potential: Low- and no-tillage practises could have a decarbonization potential of~119 MtCO₂e, at cost savings of ~$41/tCO₂e, by 2050. The environmental impact of CO2 enrichment in greenhouses has not been calculated, as fuel is often burnt to supply the CO2.174
External Potential
Timing of Trend
4 4
Example innovators
Summary
Key ClustersUK
Finland➢ Finland has a strong science base, high public expenditure on R&D, and highly ranked universities.
➢ In 2017 Finland merged Finpro – the Finnish trade promotion organisation – and Tekes – the Finnish Funding Agency for Innovation –as Business Finland to administer public funding for R&D and innovation combined with internationalization efforts.
➢ Small but active venture investor community (Loudspring, Inventure, Fortum).
➢ Focused on biomass waste solutions due to significant forestry industry.

Innovators and Ecosystems: CCUS for Agriculture
123
Fundraising by Year and Type
Company Size (Paid-in Capital and Employees)
Local Participants
External Participants
2
Alignment w/ Strength
Source: Cleantech Group i3 Database
Ecosystem
Emissions Reduction
Lower Hutt, NZ Swindon, UK Helsinki, Finland Pleasanton, CA, USA Sunnyvale, CA, USAUSADeveloper of wood biomass
conversion to CO2 for greenhouses
Developer of a CO2 to fertilizer and plastics
technology
Developer of biochar from waste biomass methane emissions
Developer a biochar product for drop-in fuels and soil
enhancement
Developer of microbial conversion of CO2 to feed, materials, and chemicals
Developer of technology that transforms CO2 into protein
products
Incubators / Accelerators
Grants
Angel Financing
Equity Financing
Debt Financing
Customers
Talent Pipelines
Partnerships
Diversity in mgmt. / ownership
• 90% carbon footprint reduction compared to conventional fertilizer production
• Uses locally sourced wood residue in modest quantities
• Auckland University of Technology
• Victoria University of Wellington
• Sharif UT
• Royal Agricultural University
• Vienna University of Economics and Business
• Kiel University
• UC Santa Barbara• Harvard Business
School
• Uni. Of Cali., Berkeley• Uni. Of California,
Davis
• Skretting
• Coles
• Concord Energy• Google• National Carbon
Technologies
• New Crop Capital• Blackbird Ventures
• Wittington Investments
• Lifeline Ventures• Wave Ventures• Starlight VC
• BP Ventures• Constellation TV• Concord Energy• GV• North Bridge Venture
Partners
• California Energy Commission
• Kapor Capital
• Joyance Partners• Purple Orange
Ventures• Indie Bio• Dreamworx
• Chris Hadley• David Helgason• Bragiel Brothers• Mika Ihamuotila
• Thrive Accelerator• Feed X• IgniteX• Indie Bio• Chevron Tech Ventures
• 1 ton of Carbo Culture biochar keeps 3.2 tons of CO2 from returning to the atmosphere
• Department for Business Energy and Industrial Strategy
• Innovate UK• Viridor• Severn Trent
• StartX Stanford
• Agustin Coppel
• USDA
Acquirer
• Microvi Biotechnologies
• Air Protein
• California Energy Commission
• US Department Of Energy
• Uni. Of Cali., Berkeley• Uni. Of California, Davis• Harvard University• Denmark TU• INSEAD
0
100
0100200300
Mill
ions
Capital Number of Employees
0
20
40
60
80
100
120
2018
2019
2020
2018
2020
2009
2011
2013
2014
2017
2018
2012
2019
Hot L CCm carbo Cool Planet Kiverdinovo..
Mill
ions
Seed Series A Series B Growth Equity Grant
• 1/5 female directors
• 1/2 female co-founder
• 1/5 female, 2/5 non-white management

NZ Ecosystem in Global Context: CCUS in Agriculture
124
Overview
5
3
3
8
9
9
5
6
4
New Zealand UK Finland
Evaluation 3.8 8.6 5.3
• Strong agriculture R&D in universities, and gov’t support
• Low presence of financing • Strong agriculture market• Low presence of multinationals
• Callaghan Innovation loans are supporting innovation
• Demand-driven R&D tax credit (15% at $430 million/year) 21
• Seed and early-stage financing supporting ag tech
• Few NZ-based investors to support larger equity and debt rounds
• Horticultural exports alone valued at $5.5 bn in 2018 34
• $48 bn invested in horticultural products in 2018 34
• Lack of innovation outposts in overseas markets to promote innovation
• Innovation-led economy• Good Universities and connection
with Nordic R&D cluster
• Good R&D facilities (VTT, ABS School, Uni. Of Helsinki
• Well funded startup support from Sitra, Business Finland
• Research activities support industrial needs
• Fragmented research initiatives
• 7 deals for $24.85 million 2011-2021
• Innovators using sequestered carbon for soils and food production are being supported primarily by domestic investors, but with adequate funding.
• Total agrifood industry added value $22.5 billion (2019)175
• Low export totals in agricultural products, typically specialty oats
1
Ability to Lead
• Leading academic institutions• Leading R&D in agriculture• Global financial centre• Extensive internationalization
of Ag. services and innovation
• Innovate UK well funded coordinator of public grants and early-stage support
• UK BEIS and DEFRA active in support innovation through grants and pilots
• 5+ research universities looking at livestock and agriculture
• 10+ VC and equity investors based in London dedicated to agtech investment.
• Strong material and chemical innovation for CO2 and decarbonization solutions
• Over $3.6 billion invested in UK agtech companies in 10 years
• Traditionally an entrepot for European expansion
• Uncertain trade situation post-Brexit
• Strong decarbonization drive expected in domestic market with ELMs regulation
R&D-to-commercializationpipeline strength
Connection to demand
Financing strength
40%
25%
35%
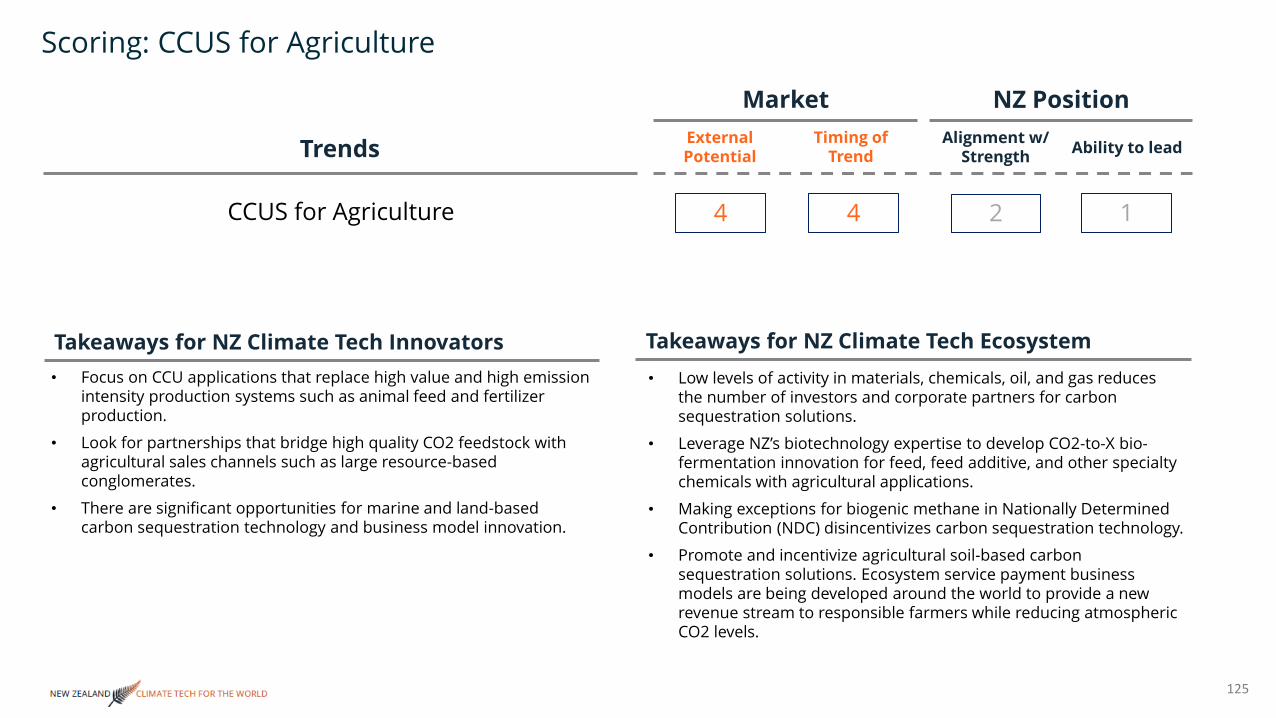
Scoring: CCUS for Agriculture
125
Trends
Market NZ PositionAlignment w/
StrengthExternal Potential Ability to leadTiming of
Trend
4 4 2 1CCUS for Agriculture
Takeaways for NZ Climate Tech Innovators• Focus on CCU applications that replace high value and high emission
intensity production systems such as animal feed and fertilizer production.
• Look for partnerships that bridge high quality CO2 feedstock with agricultural sales channels such as large resource-based conglomerates.
• There are significant opportunities for marine and land-based carbon sequestration technology and business model innovation.
Takeaways for NZ Climate Tech Ecosystem• Low levels of activity in materials, chemicals, oil, and gas reduces
the number of investors and corporate partners for carbon sequestration solutions.
• Leverage NZ’s biotechnology expertise to develop CO2-to-X bio-fermentation innovation for feed, feed additive, and other specialty chemicals with agricultural applications.
• Making exceptions for biogenic methane in Nationally Determined Contribution (NDC) disincentivizes carbon sequestration technology.
• Promote and incentivize agricultural soil-based carbon sequestration solutions. Ecosystem service payment business models are being developed around the world to provide a new revenue stream to responsible farmers while reducing atmospheric CO2 levels.

March 2019
NEW ZEALAND CLIMATE TECH FOR THE WORLD
Appendix 3Resources & Environment
126
127
Contents
Resources & Environment – Comparison between Small Advanced Economies (SAEs)
Resources & Environment Analysis
Wastewater Treatment
B2C Carbon Emissions Tracking
Bioplastics
Zero Waste Products
Natural Textiles
CONTENTS

Overview – Resources & Environment Innovation in Small Advanced Economies (SAEs)
128
Resources & Environment Investments (2010 – 2020) and Funded Innovators in SAEsFunding Raised ($) Number of Companies
United Envirotech
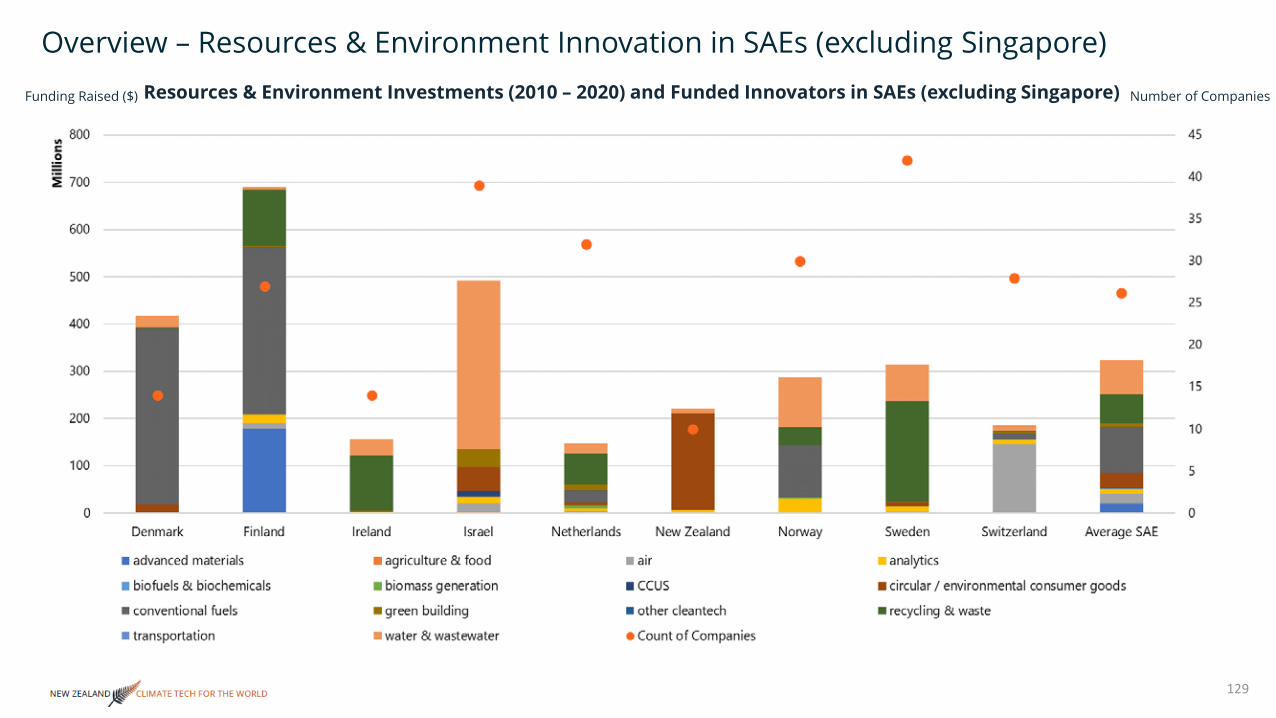
Overview – Resources & Environment Innovation in SAEs (excluding Singapore)
129
Resources & Environment Investments (2010 – 2020) and Funded Innovators in SAEs (excluding Singapore)Funding Raised ($) Number of Companies

130
Contents
Resources & Environment – Comparison between Small Advanced Economies (SAEs)
Resources & Environment Analysis
Wastewater Treatment
B2C Carbon Emissions Tracking
Bioplastics
Zero Waste Products
Natural Textiles
CONTENTS

Overview – Investments into Wastewater Treatment in SAEsWastewater Treatment Investments (2010 – 2020) and Funded Innovators in SAEsFunding Raised ($)
United Envirotech
131

Funding Raised ($) Number of Companies
Overview – Investments into Wastewater Treatment in SAEs (excl. Israel and Singapore)Wastewater Treatment Investments (2010 – 2020) and Funded Innovators in SAEs (excl. Israel and Singapore)
132

Wastewater Treatment– Trend Analysis
133
Advanced wastewater treatment systems, with a long history (dating back to 1930s). Sweden’s proficiency in adjacencies (digital infrastructure for water, consumer water-saving devices) offers a more comprehensive value chain for the big picture of overall water savings
➢ Sweden Royal Institute of Technology operates specialized research in wastewater treatment through the Department of Industrial Biotechnology
➢ Cleantech Sweden actively promotes Swedish innovation in wastewater to other countries, especially developing countries
SWT specializes in the development of low cost and low energy electrochemical water desalination system
Vallingby, Sweden
Atlantium provides safe and sustainable water treatment solutions based on UV disinfection, fiber optics, and hydraulics.
Bet Shemesh, Israel
• Description: Wastewater treatment systems used to filter, purify and separate water from dissolved and suspended materials, harmful bacteria, virus’, fungus and chemicals.
• External potential: The market size for wastewater treatment is estimated to be worth $48.5 billion in 2019, growing at a CAGR of 6.1% to reach $65.1 billion by 2045176.
• Timing: Wastewater treatment technologies vary greatly and many like membranes are well established. Most innovations seek to reduce electricity and chemical input and save as much water as possible, often for commercial and industrial reuse. Compounding issues of water scarcity and commitments to reduce energy use have increased corporate interest and investment in a typically slow-moving industry.
• CO2 reduction potential: Wastewater and water utilities use a lot of energy particularly for aeration, the process by which oxygen is pumped into water to accelerate biological treatment. In the US water and wastewater utilities account for 35% of typical U.S municipal energy budgets, resulting in 45 million tons of GHGs annually177.
• Environmental impact reduction potential: Potential to reduce the 2 million tons of sewage and other effluents discharged into the world's waters, every year more people die from unsafe water than all forms of violence.178
External Potential
Timing of Trend
4 3
Example innovators
Summary
Key ClustersSweden
Israel87% of wastewater is treated, making Israel the world leader. As a comparison, the US reuses roughly 10% of wastewater
➢ Heavy government investment created a high-performing wastewater treatment industry, mostly centralized at high-volume plants, however, a trend of decentralized treatment is developing through innovators
➢ Water-specialized cross-border investment funds between Israel and other innovation clusters, e.g. the Israel –Colorado innovation fund

Innovators and Ecosystems: Wastewater Treatment
134
Fundraising by Year and Type
Company Size (Paid-in Capital and Employees)
Local Participants
External Participants
3
Alignment w/ Strength
Source: Cleantech Group i3 Database
Ecosystem
Emissions Reduction
Auckland, NZ San Diego, US Vallingby, Sweden Milwaukee, Australia
Espoo, FinlandBet Shemesh, Israel
Aquafortus specializes in high water recovery and ZLD brine
management technologies.
Aquacycl provides the Bioelectrochemical Treatment
Technology for onsite wastewater treatment
SWT specializes in the development of low cost and low energy
electrochemical water desalination system
Atlantium provides safe and sustainable water treatment solutions based on UV disinfection, fiber optics, and hydraulics.
BioGill is a clean tech company established to commercialize advanced water treatment
technology
Sofi Filtration is a high capacitypolishing filter.
Incubators / Accelerators
Grants
Angel Financing
Equity Financing
Debt Financing
Customers
Talent Pipelines
Partnerships
Diversity in mgmt. / ownership
• Eliminates 80% of incoming primary sludge
• 90% reduction in treatment footprint
• Zero liquid discharge, clean water output.
• MIT• Yale• Oxford• University of Otago
• Waseda University• U. Southern California
• PetroH20 (Aquafortus US licensee) joint venture w/ Pilot Corporation
• Alstom
• NZ Growth Capital Partners
• Aeris Capital• Aurum Ventures• Elron Electronics• Pitango Venture
Capiatal
• Launch Taranaki
• Callaghan Innovation • Aster Capital
2/3 C-suite women, 1/3 non-white 3/5 C-suite non-white 2/14 C-suite women 2/5 C-suite women
• 10-15% water saving • 80-90% water
recovery
• Reduced chemical and energy use in wastewater treatment
• Improving reaction rate in biological wastewater treatment
• Resilient self-cleaning filters, reducing the need for chemicals.
• Imagine H2O• Astrolab
• Plug and Play Tech Centre• The Roddenberry
Foundation• ImagineH20
• Vinnova• EU, EIT InnoEnergy
• Tekes - Finnish Funding Agency for Technology and innovation
• Tech Coast Angels • The Chemical Angel
Network
• Cavendish Impact Capital
• Next Wave Impact • Almi
• Softbank China Venture Capital,
• BW Ventures, Southern Cross Venture Partners.
• Emerald Technology Ventures,
• Loudspring
• The Coastal Brewing Company
• Sweden’s Royal Institute of Technology
• Vinnova• Almi
• DOW Chemicals
2/3 C-suite women, 2/3 non-white
• LUT University• ETH Zurich
• Waseda University• U. Southern California
• Tel Aviv University• Technion• Ben-Gurion U. of Negev
• Imagine H2O
• Swine farm in CA• Residential sewage
plant in Mexico
• Ontario Power• Unnamed North
American power plant• Namdal Rensefisk
(Norway)
• Fortum• GTK • Terrafame• Lindstrom• Anglo American
0
50
100
0204060
Mill
ions
Capital Number of Employees
0
5
10
15
20
2018
2019
2020
2018
2019
2005
2006
2013
2015
2016
2012
2016
2012
2013
2015
2020
Aquafortus Aquacycl Atlantium BioGill Sofi
Mill
ions
Seed Series A Series BGrowth Equity Grant Project Finance
Acquirer

NZ Ecosystem in Global Context: Wastewater Treatment
135
40%
25%
35%
Overview
R&D-to-commercializationpipeline strength
Connection to demand
6
5
5
8.5
7
7.5
9
9
9
6
6.5
5.5
New Zealand Sweden Israel Australia
Evaluation 5.4 7.8 9 6
• Although considered a “water rich” country, water shortages (as in Auckland) have occurred recently. Observable class of innovators emerging, including some with a global footprint.
• Water treatment research occurring at Massey U., environmental engineering dept at U. Auckland.
• Innovation in water and effluent management for agriculture (e.g.Regen, acquired in 2020) creates relevant research adjacency.
• 10 deals for 7.13 m between 2011–2021
• Companies able to access grant and seed funding at the early stages from a mix of local players
• NZ innovators able to access international acceleration opportunities (e.g. Aquafortus –ImagineH2O)
• Initial success cases of joint ventures / licensing deals in larger markets
• Local wastewater entities are engaging with innovators but mostly on digital technologies (e.g. Bay of Plenty, Nat’l Institute of Water & Atmospheric research – Aquatic Informatics) and energy efficiency (Derceto)
• 90% of population connected to conventional wastewater treatment facilities. Innovation occurring around circularity e.g.sludge management for biofuels.
• Swedish Energy Agency supporting wastewater start-ups with significant grants.
• Strong in downstream digital water-saving technologies (leak detection, e.g. Aqua Robur, Xylem) and consumer-facing systems (Orbital, Altered).
• 35 deals for $97.14 m between 2011 – 2021
• Innoenergy providing seed financing to wastewater innovators
• Project financing coming from consortia of Swedish-foreign investors
• Swedish Cleantech promotes “sustainable water solutions for the world” and has a portal on their website to search innovators and request meetings
• Innovators accessing overseas investment and exit opportunities (e.g. Tiami – ICL)
• Global corporates engaging Swedish innovators as development partners (e.g. ConocoPhillips –Xzero)
• Historically afflicted by water scarcity – now reuses 87% of its wastewater. Government has put over $750 m into centralized water reclamation since 2000, spurring a domestic industry. 180
• Adjacent innovation industries have grown to serve the wastewater industry (energy efficiency, digital facility management)
• Government and universities frequently cooperate with innovators to solve specific problems (e.g. Technion – Kando Covid-19 detection project)
• 36 deals for $1.4 b between 2011 –2021
• Innovators accessing global acceleration opportunities (e.g.Kando – Elemental, Utilis – Microsoft AI for good)
• Strong capital market between Israeli investors and global corporates participating
• Innovators achieving technology partnerships and deals with global incumbents (e.g. Atalantium with Alstom).
• Innovators being acquired by overseas wastewater developers (e.g. Emefcy with RWL Water Group)
• Local corporates undertaking cross-border acquisitions (ICL – Tiami)
• Australia’s persistent droughts and history of water-intensive industries (mining, agriculture), give it unique experience in managing wastewater under very specific circumstances
• Innovation capabilities more observable in domestic wastewater treatment solutions (e.g.Nexus eWater)
• Universities collaborating with innovators (e.g.U. Queensland – Unitywater) and making seed investments (e.g. ANU Connect – Nexus eWater)
• 10 deals for $64.2 m between 2011 – 2021• Standout start-ups are able to access
growth financing through a mix of local and global investors, e.g. BioGill through BW Ventures, Softbank, and Southern Cross
• Global corporates engaging innovators as channel partners (e.g. Dow – BioGill) and development partners (Veolia – Unitywater, Cemex - Calix).
• Australian corporates were forming partnerships with innovators in early part of the decade but have slowed down.
2/3
Ability to Lead
Financing strength

Takeaways: Wastewater Treatment
136
Takeaways for NZ Climate Tech Innovators• Imagine H2O accelerator is a common denominator player among
standout innovators in not only the wastewater segment but water management in general, Aquafortus is an example of an NZ innovator competing in this venue. Elemental Exclerator (Hawaii) is a similar, highly selective, springboard to market for water innovators.
• Although based on limited analysis, wastewater treatment is one of the most diverse sectors observed during this exercise (thus far) –while it would be conjecture to state a conclusion tying diversity to company performance, a hypothesis is that attracting and retaining key talent to compete against the highest-performing innovators requires a diverse c-suite and/or board.
Takeaways for NZ Climate Tech Ecosystem• Similar to other sectors, a “value chain” approach will be most
critical to ensuring that NZ wastewater treatment innovators end up in larger markets – Suez’s acquisition of Derceto (2014) and Aquafortus’s initial licensing success overseas are initial examples of NZ innovators’ solving energy management / efficiency issues for overseas water utilities using different technologies.
- Consider where the Māori waste management philosophy and whole-of-ecosystem systems thinking can play a role – is there latent (or active) Māori innovation around this issue? Are there opportunities to infuse the Māori approach into future innovation efforts?
- Granular technologies are more likely to be noticed by export markets when part of a value chain solution – think the Israeli “energy efficiency for energy transition catalogue” and Sweden’s “sustainable water solutions for the world” strategy of presenting technology suites as a tactic to achieve big-picture sustainability strategies.
• Look to innovation clusters with similar goals and challenges regarding wastewater and consider co-financing acceleration (e.g.Israel-Colorado Innovation Fund water programme)
• Forge links with “high need – highly experimental” wastewater clusters, e.g. Israel, UK, California, Texas.
137
Contents
Resources & Environment – Comparison between Small Advanced Economies (SAEs)
Resources & Environment Analysis
Wastewater Treatment
B2C Carbon Emissions Tracking
Bioplastics
Zero Waste Products
Natural Textiles
CONTENTS

B2C Carbon Emissions Tracking – Trend Analysis
138
➢ Finland was the home of nearly 2,000 fintech investments between 2011 – 2021, creating a full-fledged fintech industry that has come to count emissions tracking as one of its sub-sectors.
➢ History of Nokia as a once-global leader has provided a base for Finland’s continued development of TMT and digital technologies
➢ Software from Finland – an industry consortium in Finland that brings together innovators and corporates for networking, sets standards, and provides trainings to global players
Developer of purchase-based carbon footprint tracker
Espoo, Finland
Tomorrow is a bank that funds and promotes renewable energy, solar and wind power, and sustainable agriculture
Germany
• Description: B2C emissions tracking platforms, usually mobile apps, for individuals to monitor their personal carbon footprint. Some companies act as carbon offset retailers allowing individuals to offset their calculated carbon footprint. Some solutions also integrate metrics already monitored by individuals on apps like travel and food consumption.
• External potential: The total Carbon Management System Market was valued at USD 9.0 billion in 2020 and expected to reach USD 12.2 billion by 2025 and grow at a CAGR of 6.21%. However, the B2C footprint tracking market is a smaller part of this total market which includes B2B tracking services and consultancy services181.
• Timing: Consumer interest in climate change is at an all time high, a Pew Research Centre 2019 survey found that the majority of publics across the globe see climate change as a very serious problem and think their government is doing too little to address it182. This market is in early and pilot stages, although as its software-based and capitalizing on existing tracking measures and established services like voluntary carbon markets, the market is developing quickly.
• CO2 reduction potential: C40 Cities assessed the consumption-based emissions of its 79 C40 cities, calculating 3.5GtCO2 annually182.
• Environmental impact reduction potential: Potentially to reduce emissions in consumption-based emissions via positive purchasing or reduction in transportation, the food system and even financial services products. The engagement with the voluntary carbon offset market will also drive mitigation and carbon sequestration.
External Potential
Timing of Trend
1 2
Example innovators
Summary
Key ClustersFinland
Germany➢ Fraunhofer Institutes around Germany have created an efficient public-private mechanism for experimenting
with otherwise risky innovation and creating “heat maps” around digital technologies that can be applied to multiple industries
➢ Major credit card providers collaborating with German fintech start-ups for digital payment processing, financial management, and personal carbon accounting services

Innovators and Ecosystems: B2C Carbon Emissions Tracking
139
Fundraising by Year and Type
Company Size (Paid-in Capital and Employees)
Local Participants
External Participants
3
Alignment w/ Strength
Source: Cleantech Group i3 Database
Ecosystem
Emissions Reduction
Wellington, NZ Espoo, Finland Berlin, Germany Hamburg, Germany Singapore
CoGo helps consumers to find ethical and sustainable businesses in NZ through
a mobile app
Enfuce offers payment and open banking services to banks,
fintechs, financial operators, and merchants
Klima provides CO2 offsetting services used to reverse the
effects of climate change
Normative calculates the sustainability impact of economic
activities on the planet
Tomorrow is a bank that funds and promotes renewable energy, solar and
wind power, and sustainable agriculture
Capture is an app that empowers you to track, reduce and remove
your carbon footprint.
Incubators / Accelerators
Grants
Angel Financing
Equity Financing
Debt Financing
Customers
Talent Pipelines
Partnerships
Diversity in mgmt. / ownership
• South Pole, Pachama
• B2C• Summa Equity• Sortera, Bonavva,
Castellum, Elekta
• Novartis, PropertyGuru, Experian
• Dulwich College International, Quintet Private Bank
• ByFounders, Wave Ventures,
• Luminar Ventures• Eric Wahlforss
• ETF Partners • Antler
• Joules Accelerator
• Callaghan Innovation
1 / 4 C-suite women
2/7 Board of Directors women
1 C-suite woman 1 C-suite woman 2/4 C-suite women, 2/4 non-white
Stockholm, Sweden
• James Watt, Mark Sainsbury, Andrew Thorburn, Jason Stockwood, Richard Collier Keywood
• Angel HQ• ICE Angels
• Christian Reber (founder of Pitch), Jens Begemenn, (Founder of Wooga), Niklas (co-founder of Blinkist)
• Nordea Bank, Maki.vc• Finnvera, LähiTapiola
• E.ventures• HV Capital, 468 Capital
• SME Climate Hub — co-hosted by the International Chamber of Commerce (ICC),
• Growth Capital Partners
• Victoria U. of Wellington• U. Auckland
• 15,000 partners on app• Living Wage
Foundation• Social Enterprise UK
• Hanken School of Economics
• Aalto U.
Not Applicable Not Applicable Not Applicable Not Applicable 9,436 sqm of rainforest protected by investments Not Applicable
• Uppsala U. • Stockholm School of
Economics• Lund University
• U. Hamburg• Leuphana U. of
Luenburg• Freiie U. Berlin
• B2C: 7,000 customer • B2C
• Gold Standard• Verified Carbon
Standard• Climate, Community &
Biodiversity Standards
• B2C – 50,000 customers
• Pleo• St1• Rocker• Indo• Asiakastieto
• Visa – Tomorrow has a visa debit cart
• Card issuing partnerships: Visa, Mastercard, AWS, Verizon
0
50
100
05
1015
Mill
ions
Capital Number of Employees
0
2
4
6
8
10
12
2017 2019 2020 2019 2021 2020 2019 2019 2019 2020
CoGo Enfuce KlimaNormativeTomorrowCapture
Mill
ions
Seed Series A Series BGrowth Equity Grant UndisclosedStructured Debt
Acquirer

NZ Ecosystem in Global Context: B2C Carbon Emissions Tracking
140
40%
25%
35%
Overview
R&D-to-commercializationpipeline strength
Connection to demand
2
2
6.5
5
2
4
8
6
7.5
9
7.5
8
New Zealand Sweden Finland Germany
Evaluation 3.6 3.9 7.3 8.3
• NZ advantages lie in a growing class of computer science scholars, difficulties lie in size of home market and lack of major financial / retail incumbents
• NZ is developing talent in digital technologies – NZ developers scored highest on a global coding proficiency assessment in 2019. In 2019 there were 8,605 full-time computer science and IT students in NZ universities 184
• 4 deals for $5.5 m 2011 – 2021• Early stage investors (angel groups,
seed / series A funds) supporting this sector.
• Retailers and users participating in the space, presence of large retailers and banks not observed in ecosystem.
• History of digital and telecommunications engineering proficiency (Ericsson, Spotify, etc.), successful B2B carbon accounting innovators
• This area of innovation is not a key focus of the ecosystem, amongst the larger digital climate tech sectors (e.g. commercial and residential energy management, digital transportation management)
• 3 deals for $3.27 m 2011 – 2021 (2 investments in Normative, one in CarbonCloud)
• Innovators accessing overseas acceleration opportunities (e.g.Normative – Joules Accelerator)
• Few examples of substantial capital raises
• Despite the limited focus on this area in Sweden, diverse groups of corporates and NGOs are engaging: Oatly, Estrella, WWF with CarbonCloud and Heimfrid (cleaning services), Summa Equity with Normative
• Significant pool of software engineering talent and innovation, highest utilization rate of digital technologies (Digital Economy and Society Index)186
• Software talent pools strong due to consistent focus of Finland on ICT and participation in cross-EU projects
• Innovation occurring in adjacencies, e.g. One Click LCA for construction. Spillover effects and industry buy-in
• 2 deals for $17.24 2011 – 2021 (both deals in Enfuce)
• Scandinavian banks participating (e.g. Nordea Bank – Enfuce)
• Strong synergies across Finnish software industry – Software from Finland industry association has brought together hundreds of software start-ups and corporates.
• Global card-issuers collaborating with Finnish innovators (e.g. Visa, Mastercard, AWS – Enfuce)
• Strong presence of innovators in B2C and B2B innovators. Significant talent pool from local universities and top software companies.
• Public-private research institutions, most notably the Fraunhofer Institutes, taking on software experimentation.
• Presence of SAP supplies a pool of talent that can develop cross-industry software, not just in one niche.
• 7 deals for $28.14 m 2011 – 2021• Major European investors
participating in the B2C and B2B sectors (e.g. Demeter, BCG Digital –Plan A, Environmental Tech Fund –Tomorrow)
• Presence of major software companies (SAP is especially active with climate companies) is a home-market advantage.
• Major card services engaging with innovators (e.g. Visa – Tomorrow). This is ultimately the best conduit into engaging consumer spending and accessing transaction percentages.
2
Ability to Lead
Financing strength

Takeaways: B2C Carbon Emissions Tracking
141
Takeaways for NZ Climate Tech Innovators• Market based on consumer interest and concern, reliant on the
offset market which is insecure. There is security in demand in the offset market, but all other market infrastructure is nonexistent making it unstable.
• Solutions can be localized e.g., apps display local recycling schedules, making it easy to promote in local clusters. Which may explain the geographical fragmentation of this market.
• Low cap-ex, investment needed to promote use. Most innovators are providing free versions of the app to encourage loyalty which they can convert to a paid-for version.
• Another stable income stream is corporations, who buy app access in bulk, giving employees access as both CSR, action on their scope three emissions and an employee benefit.
• At time present, partnerships with card companies (see Visa –Tomorrow partnership, Enfuce’s ability to read card transactions) is the most efficient way to 1) access scalable user pools and b) sustain a business model off of transaction percentages. These partnerships leapfrog the one-by-one relationship-building stage with retailers.
Takeaways for NZ Climate Tech Ecosystem• A competitive environment in this sector is most likely to emerge from
digital payment / microloan innovators that layer on the carbon monitoring capabilities. A critical decision to develop an ecosystem that supports this technology is whether the ecosystem intends to compete in fintech.
• Business model dependent on networking effects (users, businesses), natural disadvantage in NZ. To export, will need big banks and retailers engaging an innovator that has a) cutting-edge software / algorithms and market-beating performance or b) highly cross-compatible back-end infrastructure with rapid deployment capabilities (infrastructure agnostic).
• Standout software solutions generated in NZ should be promoted to credit / debit card companies (Visa / Mastercard / UnionPay, etc.) and payment processors (Paypal, Stripe, Plaid, etc.) for the most efficient conduit into scalable markets.

142
Contents
Resources & Environment – Comparison between Small Advanced Economies (SAEs)
Resources & Environment Analysis
Wastewater Treatment
B2C Carbon Emissions Tracking
Bioplastics
Zero Waste Products
Natural Textiles
CONTENTS

Bioplastics – Trend Analysis
143
➢ July 2019: Sky Ocean Ventures launched the Ocean Plastics Innovation Challenge to search for innovative solutions to solve single-use plastic and ocean pollution.
➢ August 2020: Biome Bioplastics received a $360 thousand from Innovate UK. The funding was awarded as part of a collaborative project to scale-up Biome's compostable bioplastic materials with the University of Nottingham's Department of Chemical and Environmental Engineering.
➢ October 2020: The English ban on supplying plastic straws and stirrers and plastic-stemmed cotton buds has come into force in England. This also follows a raise on plastic bag tax, a ban on microbeads and plans to establish a £500 million Blue Planet Fund to protect the ocean from plastic pollution, warming sea temperatures and overfishing.
United States➢ April 2020: Mobius, developer of processes for production of renewable chemicals, materials, and energy from
waste - primarily biodegradable plastics made from lignin, raised $250,000 in Grant funding when selected to join cohort 6 for the Wells Fargo IN2 (1) accelerator programme.
➢ January 2020: Loliware, developer and supplier of seaweed-based material including alternative drinks straws, raised $6 million in a seed round. Investors included New York Ventures and Closed Loop Partners.
Compostable packaging for food and fashion industries
Hod Hasharon, Israel
Developer of compostable bioplastic from wood and plant-based binders
Helsinki, Finland
• Description: Around 50% of all bio-based plastics produced are drop-in plastics — bio-based, non-biodegradable materials obtained from renewable sources with identical technical properties as their petroleum counterparts, such as bioderived-PE and PET. Certain plastics (biobased and non-biobased) may be biodegradable and/or compostable. Biodegradable plastics are those which degrade over time with the help of micro-organisms, while compostable plastics degrade under conditions and within a certain timeframe (and are certified as such). According to the New Plastics Economy, producers reported using an average of 62% renewable feedstocks, and an average of 42% feedstock from responsibly managed sources187.
• External potential: Across the world we produce 300 million tons of plastic per year 9, technically 85% of plastics can be substituted with bio-based plastics10 . The bioplastics market was valued at $4.6 billion in 2019 and expected to be worth $13.2 billion by 2027 growing at a CAGR of 13.8% 190.
• Timing: China’s 2018 National Sword Policy, banning imports of all but the cleanest waste imports, started a chain reaction with other major importers implementing bans191. In turn, the EU has banned exports of unsorted plastics to non-OECD countries13. Initially, this shifted recycling from a money earner to a cost due to additional processing costs, thus disincentivising plastic use and funnelling investment into plastic alternatives. Similarly, the US, China, EU and many other countries have all introduced regulations to enforce EPR or ban some single-use plastics193.
• CO2 reduction potential: In 2019 alone, the production and incineration of plastic will add more than 850 million metric tons of greenhouse gases to the atmosphere—equal to the pollution from 189 new 500-megawatt coal-fired power plant. This contribution is growing, by 2030, emissions could reach 1.34 gigatons per year. 194
External Potential
Timing of Trend
2 3
Example innovators
Summary
Key ClustersUnited Kingdom

Innovators and Ecosystems: Bioplastics
144
Fundraising by Year and Type
Company Size (Paid-in Capital and Employees)
Local Participants
External Participants
4
Alignment w/ Strength
Source: Cleantech Group i3 Database
Ecosystem
Emissions Reduction
Wellington, NZHod Hashoron,
IsraelArhus, Denmark Saint Jean Bonnefonds,
FranceGeorgia, USHelsinki, Finland
Humble Bee aims to replace existing unsustainable plastics with
superior, biologically-inspired materialsTIPA is an Israeli company
manufacturing biodegradable plastic packaging
Cellugy, is a biotech startup replacing single-use plastics with 100% natural
bio-cellulose
Sulapac is a fully biodegradable material innovation made of
sustainably sourced wood and plant-based binders
Lactips has created water-soluble, biodegradable plastic substitute made of
casein (a milk protein) that is edible
RWDC is the developer of Solon, an environmentally safe alternative to
petroleum-derived, single-use plastics
Incubators / Accelerators
Grants
Angel Financing
Equity Financing
Debt Financing
Customers
Talent Pipelines
Partnerships
Diversity in mgmt. / ownership 1/3 C-suite
women
4/10 Board of Directors women
6/7 C-suite women, 2/7 non-white
2/7 C-suite womenWomen co-founders
Woman CEO½ C-suite women
1/9 C-suite women, 4/9 non-
white
• Sky Ocean Ventures & National Geographic via Ocean Plastics Innovation Challenge, Accelerace
• Thrive Accelerator
• Green Alley Award, EASME
• Austin Hearst
• Sparkbox Ventures, Go Global Day One, NZVIF, NZ Growth Capital Partners
• Horizon Ventures, Tridos Bank, Blue Horizon
• GreenSoil Investments, Aviv Venture Capital, Millennium Food-Tech
• The European Innovation Council
• CHANEL, Ardent Venture, Sky Ocean Ventures, Bonnier Ventures
• Lifeline Ventures, Tekes
• Mitsibishi Chemical Holdings, BASF
• BPI France, Demeter, BNP Paribas, Phitrust
• WI Harper Group, Flint Hills Resources Eversource Retirement Plan Master Trust
• Vickers Venture Partners
• Riverford Organic Farmers, Abel & Cole • Stora Enso • BASF
• IMCD Group
• Commonwealth Packaging Company, ULMA Packaging, PerfoTec
• Callaghan Innovation
• ICE Angels
• U. Otago• Victoria U. Wellington• Queen Mary U.
London
• Bar-Ilan U.• Tel Aviv U. • Ben-Gurion U.
• Aarhus U. • Duke Fuqua
• Agro Food Park• Eit Food• Cleantech Scandinavia• Sky Ocean Ventures
• U. Helsinki• Tampere U. of
Technology
• ITOCHU• IMCD• Plastribution
• Université Jean Monnet Saint-Etienne
• U. Georgia
0
50
100
0
100
200
Mill
ions
Capital Number of Employees
0
20
40
60
80
100
120
140
2016 2018 2013 2017 2020 2020 2018 2016 2020 2019
Humble Bee TIPA CellugySulapac LactipsRWDC Industries
Mill
ions
Seed Series A Series BGrowth Equity Grant Convertible Debt
Acquirer

NZ Ecosystem in Global Context: Bioplastics
145
40%
25%
35%
Overview
R&D-to-commercializationpipeline strength
Connection to demand
1
2
3
6
4
6
6
8
5
6
5
3
New Zealand Canada Germany France
Evaluation 2 5.5 6.2 4.7
• From July 1st, 2019 single-use shopping bags were banned. The NZ Government Government's Provincial Growth Fund (PGF) has previously invested in bioplastic infrastructure 195.
• The science behind many companies originates from local universities including the University of Waikato.
• Aduro Biopolymers is a spin-out company formed by WaikatoLink Limited, the technology transfer office of the University of Waikato.
• 2 deals for <$200k between 2011–2021• Companies able to access seed, Series A
and Growth Equity funding from players in Australia and New Zealand.
• Local players include New Zealand Growth Partners and Sparkbox Investments Limited.
• Little engagement with local partners.
• March 2021 the Canadian Minister of Agriculture announced project funding of over $4.5 CAD for bioplastic research to manage on farm waste 196.
• Government research agencies involved in the commercialization of technologies e.g., the National Research Council of Canada Development Partnership with Solegear.
• 13 deals for $28 m between 2011–2021
• Access to local accelerator programmes include Sustainable Development Technology Canada and the Natural Gas Innovation Fund.
• Partnerships with external Fast Moving Consumer Goods (FMCG) companies like ABinBev with its 100+ Accelerator programme, as they meet its sustainability commitments.
• Partnerships between innovators to advance technology offerings e.g.Teknor Apex and Cerestech.
• Germany has the highest recycling rate in Europe. The German Government have also invested project financing into bioplastics for food18.
• The Germany government have invested in bioplastics via the German Federal Ministry of Education and Research.
• The Institute for Bioplastics and Bio composites is based in Germany and supported by the University of Hannover.
• 4 deals for $2.175bn between 2011–2021
• Access to European funding including the European Regional Development Fund.
• Local chemical expertise in companies like BASF and Evonik. These corporates are partnering or acquiring startups like LACTEL or developing their own technologies
• Strong history of action on plastic, banned some single use plastics in 2019 extending this ban in 2020 and plans to ban all single use plastics198.
• Strong action on plastic waste in France, however single-use plastic bans contain some bio-based alternatives. Efforts are being made to change this.
• 7 deals for $74 m between 2011 – 2021• Investment from local corporates and
customers like L’Oreal • Local VC investors include Demeter and BPI
France.• Local accelerator programmes include Holding
Incubatrice Chimie Verte
• Development partnerships with large local chemicals companies like BASF to commercialize technologies and for distribution.
1
Ability to Lead
Financing strength
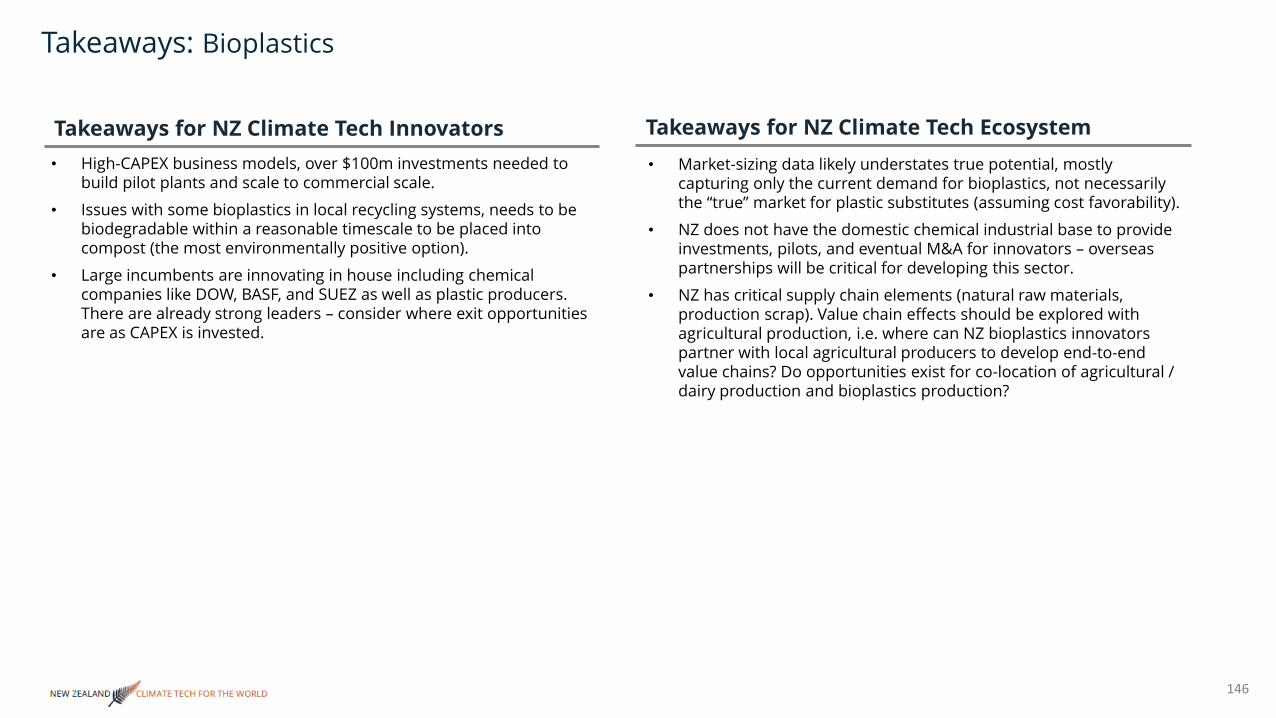
Takeaways: Bioplastics
146
Takeaways for NZ Climate Tech Innovators• High-CAPEX business models, over $100m investments needed to
build pilot plants and scale to commercial scale.
• Issues with some bioplastics in local recycling systems, needs to be biodegradable within a reasonable timescale to be placed into compost (the most environmentally positive option).
• Large incumbents are innovating in house including chemical companies like DOW, BASF, and SUEZ as well as plastic producers. There are already strong leaders – consider where exit opportunities are as CAPEX is invested.
Takeaways for NZ Climate Tech Ecosystem• Market-sizing data likely understates true potential, mostly
capturing only the current demand for bioplastics, not necessarily the “true” market for plastic substitutes (assuming cost favorability).
• NZ does not have the domestic chemical industrial base to provide investments, pilots, and eventual M&A for innovators – overseas partnerships will be critical for developing this sector.
• NZ has critical supply chain elements (natural raw materials, production scrap). Value chain effects should be explored with agricultural production, i.e. where can NZ bioplastics innovators partner with local agricultural producers to develop end-to-end value chains? Do opportunities exist for co-location of agricultural / dairy production and bioplastics production?

147
Contents
Resources & Environment – Comparison between Small Advanced Economies (SAEs)
Resources & Environment Analysis
Wastewater Treatment
B2C Carbon Emissions Tracking
Bioplastics
Zero Waste Products
Natural Textiles
CONTENTS

Zero Waste Products – Trend Analysis
148
➢ The US is home to many companies that are leaders in the zero-waste product industry. Unilever claims that zero waste not only saved them over $225 million but also created many jobs in the process. 206
➢ Subaru reuses or recycles everything. Subaru manufacturing plants in the U.S. and two of the company’s manufacturing plants in Japan haven’t sent waste to local landfills in over 12 years. Once their U.S. plant becamezero waste, Subaru saw a savings of $1 – $2 million annually. 207
➢ The EPA conducts Zero Waste Alliances all over the United States, through bringing together communities, corporations and public servants to guide business and lifestyle changes.
Developer of a low-waste shopping and delivery service with reusable packaging
New Jersey, United States
LastObject creates a reusable, sustainable and sanitary alternative to single-use items
Copenhagen, Denmark
• Description: Developers of Fast-Moving Consumer Goods (FMCG) product usually made without plastics or packaging, leaving zero waste or only biodegradable materials.
• External potential: The global zero waste shampoo market size was valued at USD 101.78 million in 2018 and is estimated to expand at a CAGR of around 7.18% over the forecast period from 2019 to 202515. Similarly, The global zero-waste packaging market was valued at USD 1312.16 million in the year 2018 and is anticipated to grow at a CAGR of 8.78% over the forecast period 2020-2027 200.
• Timing: Zero waste products are gaining popularity in recent years, due to increasing response from the public against climate change. Nielsen's report revealed that demand for zero-waste sustainable products and packaging are growing twice as fast as other items.17 The zero-waste product industry already has a large market and wide commercial availability on a global scale– with an emphasis on North America and Europe, with many corporates leading the charge for zero-waste in consumer goods and food.203
• CO2 reduction potential: Cutting emissions associated with plastics requires reducing waste, retaining materials by refurbishing or remanufacturing, and recycling. Under this type of circular business model, the CIEL report say carbon dioxide emissions would decrease by 62 million metric tons per year.204
• Environmental impact reduction potential: Globally, about 40% of plastics are used as packaging.204 A centre for International Environmental Law (CIEL) report found that as of the end of 2015, 8,300 million metric tons of virgin plastic had been produced globally, two-thirds of which remains in the environment. 21 Wide adoption of zero-waste products has the potential to significantly reduce plastic wastes and other pollutants, on both land and water.
External Potential
Timing of Trend
4 4
Example innovators
Summary
Key ClustersUnited States
Europe➢ Several European cities are now offering people a greener way to shop. Sara Wolf and Milena Glimbovski are
about to open their first zero waste store Original Unverpackt in Berlin, Germany, which has received enormous public support and has raised over €100,000, exceeding its initial target of €45,000. 208
➢ Zero Waste Europe is a Brussels-based NGO that connects and supports a vibrant network of 31 national and local NGOs promoting the zero-waste strategy as a way to make Europe more sustainable. 209 Local groups are responsible for promoting zero waste, managing and monitoring the network of zero waste municipalities, and engaging with companies and decision-makers.

Innovators and Ecosystems: Zero-waste Products
149
Fundraising by Year and Type
Company Size (Paid-in Capital and Employees)
Local Participants
External Participants
4
Alignment w/ Strength
Source: Cleantech Group i3 Database
Ecosystem
Emissions Reduction
(Christchurch, New Zealand)
(Denmark) (Germany) (Philadelphia, US)(New Jersey, US)
Ethique is the world’s first zero-waste beauty company
LastObject creates a reusable, sustainable and sanitary alternative to
single-use items
Develops cleaning product tablets, where customers reuse and add water
at home to create liquid cleaning products
Developer of a low-waste shopping and delivery service
with reusable packaging
Developer of plastic-free detergent pods
Incubators / Accelerators
Grants
Angel Financing
Equity Financing
Debt Financing
Customers
Talent Pipelines
Partnerships
Diversity in mgmt. / ownership
• U. Canterbury• U. Auckland
• Copenhagen Business School
• Technical U. of Denmark
• Munich U. of Applied Sciences
• Technical U. of Munic
• McGill U. • ESSCA Ecole de
management• Rutgers U.
• Distribution through EU, US, Canada, AUS, NZ, China, Thailand
• SUEZ• McDonalds• Tesco• Kroger• Walgreens
• Bansk Group LP• Equity Financing
• HV Capital, Vorwerk Ventures, Holtzbrinck Venture
• Better Ventures, Felix Capital
• Nestle, Impact assets, Proctor and Gamble, Aptar
• Suez Ventures, Sky Ocean Ventures, Quadia
• The Craftory, Ernesto Schmitt
• Ice Angels (IceHouse Ventures)
• Kisckstarter
½ C-suite womenWoman founder,
1/5 C-suite women
2/3 C-suite women, 1/3 non-
white
Saved 9 million single-use plastic bottles (250+ tonnes of plastic). 7m litres of water saved. 1000+T carbon offset
• B2C – global through e-commerce
• B2C – EU, US, Canada AUS, NZ, China, Thailand
• B2C – EU through e-commerce
2 million plastic bottles saved, carbon neutral shipping
• B2C – US through major retailers (Walgreens, Kroger, Tesco)
• B2C – US through major retailers (Walgreens, Kroger, Tesco)
050100150
0102030
Mill
ions
Capital Number of Employees
0
5
10
15
20
25
30
2015 2017 2018 2020 2021 2019 2020 2020
Ethique Everdrop Loop Dropps
Mill
ions
Seed Series A Series BGrowth Equity Grant Undisclosed
Acquirer

NZ Ecosystem in Global Context: Zero Waste Products
150
40%
25%
35%
Overview
R&D-to-commercializationpipeline strength
Connection to demand
4
2
2
2
5
6
7
9.5
6
7
5
6
New Zealand Canada United States United Kingdom
Evaluation 2.8 4.2 7.3 6.2
• March 2021, announced plans to add a levy for plastic packaging, thus disincentivizing the use of plastics 210.
• May 2019, a situational analysis report by the National Resource Recovery Taskforce (set up to consider options for New Zealand’s resource recovery sector considering China’s import restrictions on recycling) was released 211.
• 4 deals worth a total of $1.2 million between 2011–2021.
• Limited financing in this NZ, deals which have occurred are from local investors like Icehouse Ventures.
• Majority of innovators providing zero-waste shopping via refill business models which can bootstrap.
• Local consortiums like Zero Waste New Zealand are facilitating partnerships with innovators via its partnership programme. Although majority of these partnerships are non-commercial.
• Majority of innovation in business models, multiple bricks and mortar zero waste stored in Canadian Cities where environmental awareness is high.
• 28 deals worth a total of $283 million between 2011–2021.
• Local investors are 50% of total investors for Innovators including the Government of Canada, Sustainable Development Technology Canada and BDC Canada.
• Partnerships with local accelerator programmes including EcoFuel.
• US has strong history of facilitating reverse logistics, as needed with refill and reuse business models, with its bottle bill in 11 states 210. However, the biggest plastic waste producer in the world 213.
• US advantages with thriving cleantech ecosystem and research expertise in global trade and logistics.
• 238 deals worth a total of $4 bn between 2011–2021.
• Majority of investments early stages seed to Series A
• Partnerships with Ocean Focused Accelerator programmes concerned with reducing plastic waste e.g. Ocean Solutions Accelerator.
• Other US accelerator programmes include Third Derivative and ABinBev’s 100+ Accelerator.
• Bans on single use plastic and a strong cleantech ecosystem to address plastic waste positions the United Kingdom as a leader in this sector.
• The UK Research Institute (UKRI) launched the sustainable packaging challenge to develop a more sustainable packaging supply chain.
• However, Plans to implement deposit return scheme for plastic packaging and strong waste-to-energy industry, which may undermine zero waste models.
• 26 deals worth a total of $241 million between 2011–2021.
• Range of deals in seed, Series A and Growth Equity.
• Innovators developing alternative materials in zero waste packaging have established long-term vendor partnerships with local food distributers e.g., Transcend Packaging have partnered with McDonalds UK to supply paper straws.
2/3
Ability to Lead
Financing strength
• Canada has spearheaded the international Ocean Plastics Charter, committed to a ban single-use plastics by 2021, collaborated with the Canadian Council of Minister of the Environment (CCME), an organisation comprised of 14 federal, provincial and territorial ministers of the environment, on a national Strategy on Zero Plastic Waste.

Takeaways: Zero Waste Products
151
Takeaways for NZ Climate Tech Innovators• Driven by action on plastic, particularly in relation to Ocean
pollution.
• Regulatory element, The US, China and EU have all introduced regulations to enforce EPR or ban some single-use plastics.
• Consumer awareness of environmental and health impacts of plastics drives demand for plastic free products.
• Plastic has deep and long-lasting impacts on the environment. The Ocean Conservancy found over 60% of all seabirds and 100% of sea turtles had plastic in their bodies. With 40% of the global economy relying on biodiversity, plastic pollution is causing serious economic impact. In 2018, plastic pollution cost the APAC region $1.3 billion, impacting fishing, tourism and shipping industries.
• Alternative materials can have equally negative environmental impacts. For example, McDonalds came under scrutiny last year because its paper straws (supplied by Transcend Packaging) were not recyclable.
• Recycling as an option has also come under scrutiny for poor collection rate, number of recyclables sent to incineration and inefficient export markets.
• Not much innovation, mostly business model innovation like subscription-based models for FMCGs e.g. Deodorant.
Takeaways for NZ Climate Tech Ecosystem• Natural value chain effects with bioplastics and sustainable
production of underlying natural ingredients. Biggest challenge for the ecosystem will be on access to the major consumer goods incumbents (i.e. potential licensors and acquirors of technology) and global brand recognition.
- Capabilities around inbound logistics (procurement, management of materials) and low-impact production can provide opportunities for innovators in this sector to expand backward in the value chain, acquiring sources of natural raw materials, or to developing standalone products (as Ethique has).
- Strong export promotion push will be necessary given the size of the home market.

152
Contents
Resources & Environment – Comparison between Small Advanced Economies (SAEs)
Resources & Environment Analysis
Wastewater Treatment
B2C Carbon Emissions Tracking
Bioplastics
Zero Waste Products
Natural Textiles
CONTENTS

Overview – Investments into Natural Textiles in SAEsNatural Textiles Investments (2010 – 2020) and Funded Innovators in SAEsFunding Raised ($)
153
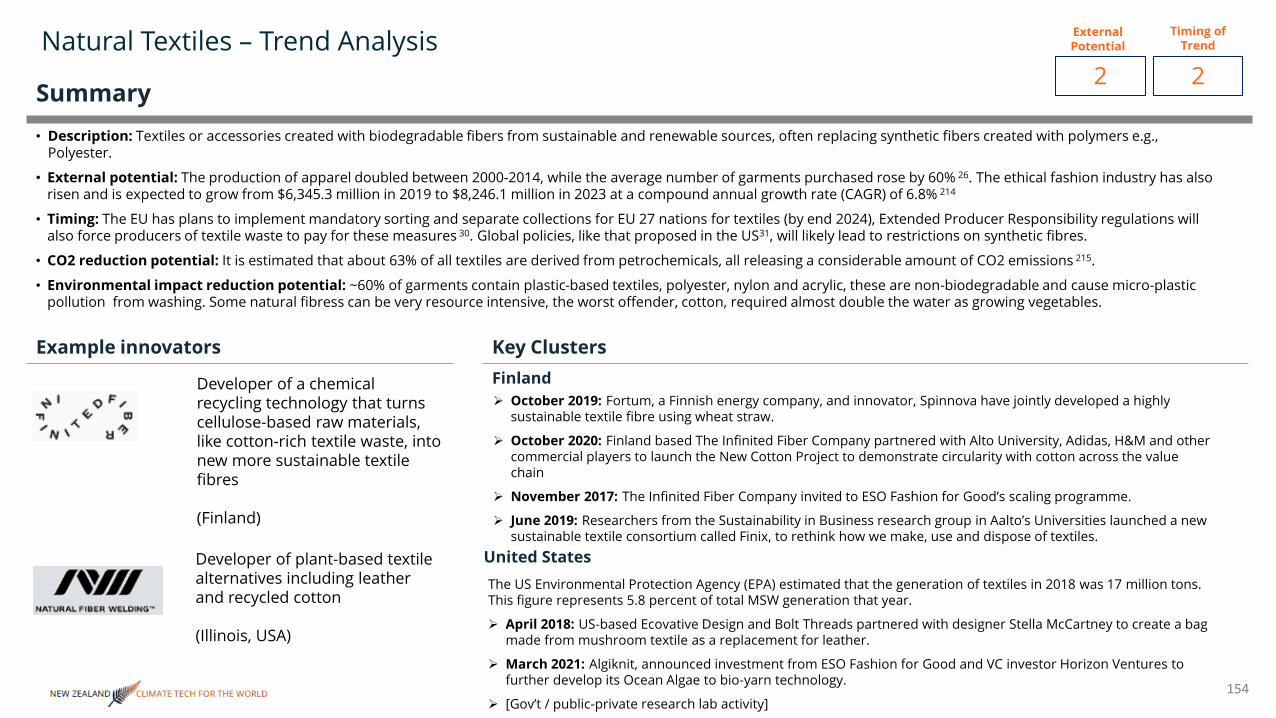
Natural Textiles – Trend Analysis
154
➢ October 2019: Fortum, a Finnish energy company, and innovator, Spinnova have jointly developed a highly sustainable textile fibre using wheat straw.
➢ October 2020: Finland based The Infinited Fiber Company partnered with Alto University, Adidas, H&M and other commercial players to launch the New Cotton Project to demonstrate circularity with cotton across the value chain
➢ November 2017: The Infinited Fiber Company invited to ESO Fashion for Good’s scaling programme.
➢ June 2019: Researchers from the Sustainability in Business research group in Aalto’s Universities launched a new sustainable textile consortium called Finix, to rethink how we make, use and dispose of textiles.
Developer of a chemical recycling technology that turns cellulose-based raw materials, like cotton-rich textile waste, into new more sustainable textile fibres
(Finland)
Developer of plant-based textile alternatives including leather and recycled cotton
(Illinois, USA)
• Description: Textiles or accessories created with biodegradable fibers from sustainable and renewable sources, often replacing synthetic fibers created with polymers e.g., Polyester.
• External potential: The production of apparel doubled between 2000-2014, while the average number of garments purchased rose by 60% 26. The ethical fashion industry has also risen and is expected to grow from $6,345.3 million in 2019 to $8,246.1 million in 2023 at a compound annual growth rate (CAGR) of 6.8% 214
• Timing: The EU has plans to implement mandatory sorting and separate collections for EU 27 nations for textiles (by end 2024), Extended Producer Responsibility regulations will also force producers of textile waste to pay for these measures 30. Global policies, like that proposed in the US31, will likely lead to restrictions on synthetic fibres.
• CO2 reduction potential: It is estimated that about 63% of all textiles are derived from petrochemicals, all releasing a considerable amount of CO2 emissions 215.
• Environmental impact reduction potential: ~60% of garments contain plastic-based textiles, polyester, nylon and acrylic, these are non-biodegradable and cause micro-plastic pollution from washing. Some natural fibress can be very resource intensive, the worst offender, cotton, required almost double the water as growing vegetables.
External Potential
Timing of Trend
2 2
Example innovators
Summary
Key ClustersFinland
United States The US Environmental Protection Agency (EPA) estimated that the generation of textiles in 2018 was 17 million tons. This figure represents 5.8 percent of total MSW generation that year.
➢ April 2018: US-based Ecovative Design and Bolt Threads partnered with designer Stella McCartney to create a bag made from mushroom textile as a replacement for leather.
➢ March 2021: Algiknit, announced investment from ESO Fashion for Good and VC investor Horizon Ventures to further develop its Ocean Algae to bio-yarn technology.
➢ [Gov’t / public-private research lab activity]

Innovators and Ecosystems: Natural Textiles
155
Fundraising by Year and Type
Company Size (Paid-in Capital and Employees)
Local Participants
External Participants
4
Alignment w/ Strength
Source: Cleantech Group i3 Database
Ecosystem
Emissions Reduction
(New Zealand / San Francisco) Espoo, Finland Copenhagen, Denmark San Francisco, USCopenhagen, Denmark
Allbirds: Developer and retailer of footwear made with natural materials like merino wool and eucalyptus fiber
Developer of a chemical recycling technology that turns cellulose-based raw materials, like cotton-rich textile
waste, into new more sustainable textile fibers
Producer of plant-based and alternatives to animal leather
based on waste fruit
Developer and retailer of shoes, handbags and accessories made
from recycled plastic.
Incubators / Accelerators
Grants
Angel Financing
Equity Financing
Debt Financing
Customers
Talent Pipelines
Partnerships
Diversity in mgmt. / ownership
Transformed 100 million plastic water bottles and kept 100 tons of ocean bound marine plastics out of waterways
Eco friendly. Claims to reduce CO2 emissions by 85% using zero harmful chemicals.
Using sheep's wool, Allbirds' process uses 60% less energy than materials used in typical synthetic shoes.
• U. California Berkeley• San Francisco State• U. Auckland• Stanford
• Aarhus University• Copenhagen Business
School
• San Francisco State U.
• U. California Berkeley
• Chinatown Market, World Central Kitchen, JUST
• Jeff Staple, Air New Zealand, Shake Shack
• Adidas, H&M, RGE• Fashion for Good, VTT
Technical Research Centre of Finland
• B2C – NZ, US, EU, China
T. Rowe Price, Bailie Gifford, TDM Growth Partners, Rockefeller Capital, Franklin Templeton, Fidelity Management , IPD Capital, Tiger Global Management
• EU Executive Agency for SME's, Virata Crop, H&M, RGE,
• Business Finland, Fortum, Valve Ventures
• Jensengroup• Vaekstfonden
• Bumble Ventures• Nordic Eye
• Goldman Sachs Investment Partners, Brian Spaly
• Lightspeed Venture Partners, M13, Finn Capital Partners, Grace Beauty Capital
• Steen Ulf Jensen
• European Commission
• Business Finland
2/3 C-suite women 1 / 4 C-suite women
1 /2 C-suite women 3/6 C-suite women
Manufacturer and retailer of essentials clothing made with recycled
materials and organic cotton
Gives viscose factories a new fiber and a safer process by getting rid of Carbon Disulfide (CS2).
• Rockstart Accelerator
• Piloting with potential future customers (below)
• B2C – global through e-commerce
• B2C – SF, Boston, DC, NY, LA
0
100
200
0
100
200
Mill
ions
Capital Number of Employees
0
20
40
60
80
100
120
140
2015
2016
2017
2018
2020
2018
2019
2020
2019
2020
2017
2016
2017
2018
AllBirds Infinited BeyondOrganic Rothy's
Mill
ions
Seed Series A Series BGrowth Equity Grant Convertible Debt
Acquirer

NZ Ecosystem in Global Context: Natural Textiles
156
40%
25%
35%
Overview
R&D-to-commercializationpipeline strength
Connection to demand
4
8
2
6
5
5
5
3
4
6
1
2
New Zealand Sweden Finland Switzerland
Evaluation 4.3 5.4 4.2 3.4
• New Zealand leads the world in the production of Wool exporting more wool than any other nation except for Australia 220.
• Research expertise in textile construction, fibre and new material development at Massey University.
• The University of Otago, the top 1% ranked university in the world, has a leading Centre for Material Science and Technology.
• 5 deals worth a total of $202 m between 2011–2021.
• External VC investors from the US and UK.
• The Textile Product Stewardship Project sits within the Textile Reuse programme which was established in 2016. The partnership programme drives large scale, collaborative projects creating new technologies and solutions 222.
• Sweden has a long history in natural textile, in December 2020 Sweden passed Extended Producer Responsibility regulations for textiles 221.
• The Swedish Energy Authority's RE:Source Innovation programme supports the research and development of innovations of resource efficient textiles including innovator Re:newcell.
• 13 deals worth a total of $86 million between 2011–2021.
• Range of deals in Sweden from Early to later stages.
• Local corporate investors and corporates including IKEA and H&M.
• Partnerships with local chemical and materials players are providing project finance for commercial scale plants e.g. TreeToTextile partnership with Stora Enso in February 2021.
• Accelerator programmes in Europe include Fashion for Good and H&M Global Change Awards.
• Strong forestry industry enables stable feedstocks of cellulose fibers for natural textiles. Finland has a history of making the majority offabrics domestically.
• The VTT Technical Research Centre of Finland and Aalto University has several natural textile innovation projects under development.
• 10 deals worth a total of $42 million between 2011–2021.
• Local investors include Business Finland and European Inv Business Finland
• The European Commission including the EU Executive Agency for SMEs are key investors.
• Project development partnerships with large apparel corporates including Adidas and H&M.
• Beneficiaries of accelerator programmes in Europe include Fashion for Good and H&M Global Change Awards.
• Switzerland has a thriving textile manufacturing equipment industry. However, most textile production occurs outside of Switzerland.
• The International Textile Manufacturers Federation supports research and innovation with incumbents.
• Research expertise is lacking in this area.
• 5 deals worth a total of $1.4 m between 2011–2021.
• Majority early-stage investments Grant to Series A
• Key investors include apparel incumbents, H&M and Patagonia.
• Local climate funds include Technology Fund.
• Local accelerator programmes include the Circular Economy Transition.
• The Federal Office for the Environment, programme for Sustainable Textiles Switzerland 2030 as a as a multi-stakeholder dialogue to support sustainable textile development.
2/3
Ability to Lead
Financing strength

Takeaways: Natural Textiles
157
Takeaways for NZ Climate Tech Innovators• Clothing consumption is rising. Due to economies of scale,
globalization, supply chain efficiencies and increased consumer spending on apparel, production doubled between 2000-2014, while the average number of garments purchased rose by 60%.
• Key driver is action on plastics, ~ 60% of garments contain plastic-based textiles, polyester, nylon and acrylic. These are non-biodegradable and cause micro-plastic pollution from washing,
• Another key driver is consumer demand due to increased awareness of environmental impact of traditional fabrics.
• Natural fibers need to be resource efficient. Over 75% of garments made have some element of cotton, which is land- and resource intensive, depletes soils and causes leaching from the heavy use of pesticides and fertilizers. Land use change for cotton is a significant contributor to habitat loss across the world.
• Brands are big investors in this space looking to create secure supplies of more sustainable materials e.g.. Renewcell & H&M. However, brands are not used to investing high cap-ex in new systems like chemical recycling infrastructure.
• Functionality is a key concern for brands, new materials need to perform the same if not better than synthetics.
• Majority of brands are not acting on fast fashion.
Takeaways for NZ Climate Tech Ecosystem• NZ is the 4th largest producer of wool globally, with an existing
success case in wool textile products. The ecosystem should push for synergies with the agricultural and even robotics industries to develop novel production techniques and develop capabilities around turning wool into new products, not just supplying wool.
• There is no clear winning innovation ecosystem, the critical relationships are with brands and retailers, most of which will reside overseas. Promoting NZ textile innovators to global accelerators, e.g. Factory45 (global, online), Fashion for Good (Netherlands), Plug-n-Play Sustainable Brands (US)

March 2019
NEW ZEALAND CLIMATE TECH FOR THE WORLD
Appendix 4Transport & Logistics
158

159
Contents
Transport & Logistics – Comparison between Small Advanced Economies (SAEs)
Transport & Logistics Analysis
EV charging and management
Aerospace propulsion modules
Maritime electrification
CONTENTS

Overview – Transport & Logistics Innovation in Small Advanced Economies (SAEs)
160
Transport & Logistics Investments (2010 – 2020) and Funded Innovators in SAEsFunding Raised ($) Number of Companies
Grab ($9.06 Billion)

Transport & Logistics Innovation in Israel and Singapore
161
Transport & Logistics Investments (2010 – 2020) and Funded Innovators in Israel and SingaporeFunding Raised ($) Number of Companies

Transport & Logistics Innovation in SAEs (Excluding Israel and Singapore)
162
Investments (2010 – 2020) and Funded Innovators in SAEs (Excluding Israel and Singapore)Funding Raised ($) Number of Companies

163
Contents
Transport & Logistics – Comparison between Small Advanced Economies (SAEs)
Transport & Logistics Analysis
EV charging and management
Aerospace propulsion modules
Maritime electrification
CONTENTS

EV Charging and Management in SAEs
164
EV Charging and Management Investments (2010 – 2020) in SAEsFunding Raised ($)
Bankrupt (2013)
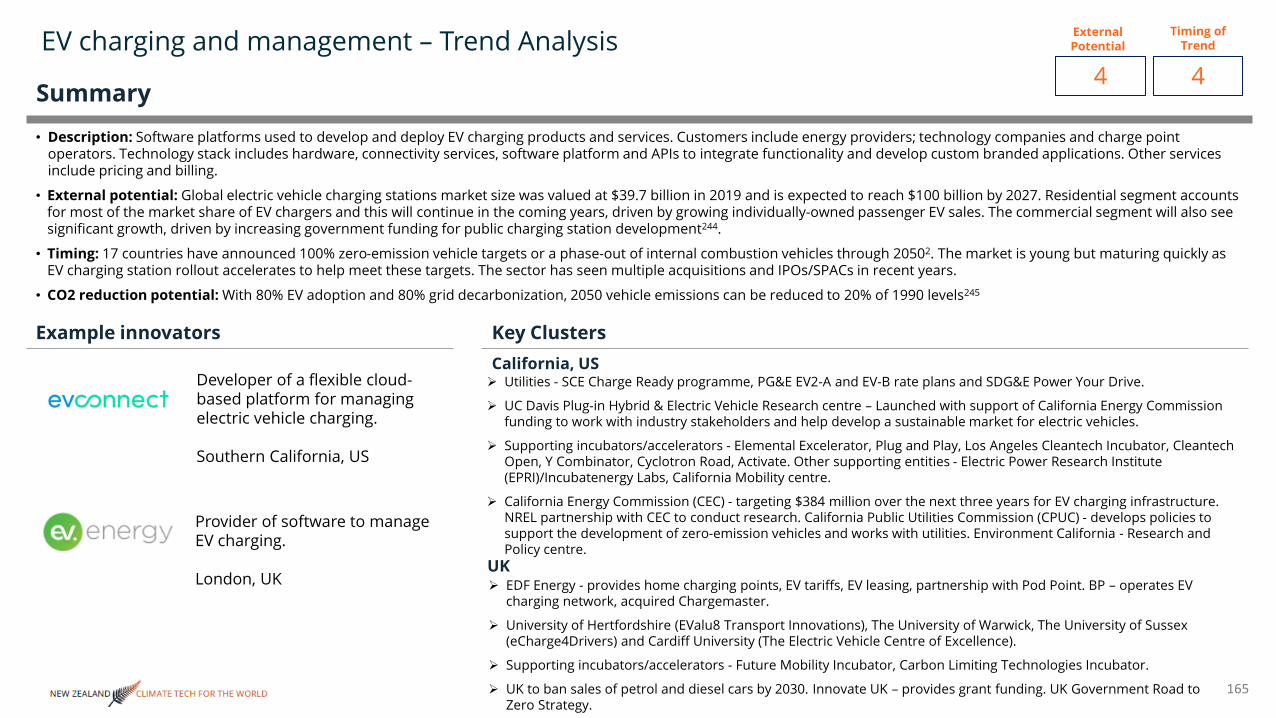
EV charging and management – Trend Analysis
165
➢ Utilities - SCE Charge Ready programme, PG&E EV2-A and EV-B rate plans and SDG&E Power Your Drive.
➢ UC Davis Plug-in Hybrid & Electric Vehicle Research centre – Launched with support of California Energy Commission funding to work with industry stakeholders and help develop a sustainable market for electric vehicles.
➢ Supporting incubators/accelerators - Elemental Excelerator, Plug and Play, Los Angeles Cleantech Incubator, Cleantech Open, Y Combinator, Cyclotron Road, Activate. Other supporting entities - Electric Power Research Institute (EPRI)/Incubatenergy Labs, California Mobility centre.
➢ California Energy Commission (CEC) - targeting $384 million over the next three years for EV charging infrastructure. NREL partnership with CEC to conduct research. California Public Utilities Commission (CPUC) - develops policies to support the development of zero-emission vehicles and works with utilities. Environment California - Research and Policy centre.
Developer of a flexible cloud-based platform for managing electric vehicle charging.
Southern California, US
Provider of software to manage EV charging.
London, UK
• Description: Software platforms used to develop and deploy EV charging products and services. Customers include energy providers; technology companies and charge point operators. Technology stack includes hardware, connectivity services, software platform and APIs to integrate functionality and develop custom branded applications. Other services include pricing and billing.
• External potential: Global electric vehicle charging stations market size was valued at $39.7 billion in 2019 and is expected to reach $100 billion by 2027. Residential segment accounts for most of the market share of EV chargers and this will continue in the coming years, driven by growing individually-owned passenger EV sales. The commercial segment will also see significant growth, driven by increasing government funding for public charging station development244.
• Timing: 17 countries have announced 100% zero-emission vehicle targets or a phase-out of internal combustion vehicles through 20502. The market is young but maturing quickly as EV charging station rollout accelerates to help meet these targets. The sector has seen multiple acquisitions and IPOs/SPACs in recent years.
• CO2 reduction potential: With 80% EV adoption and 80% grid decarbonization, 2050 vehicle emissions can be reduced to 20% of 1990 levels245
External Potential
Timing of Trend
4 4
Example innovators
Summary
Key ClustersCalifornia, US
UK➢ EDF Energy - provides home charging points, EV tariffs, EV leasing, partnership with Pod Point. BP – operates EV
charging network, acquired Chargemaster.
➢ University of Hertfordshire (EValu8 Transport Innovations), The University of Warwick, The University of Sussex (eCharge4Drivers) and Cardiff University (The Electric Vehicle Centre of Excellence).
➢ Supporting incubators/accelerators - Future Mobility Incubator, Carbon Limiting Technologies Incubator.
➢ UK to ban sales of petrol and diesel cars by 2030. Innovate UK – provides grant funding. UK Government Road to Zero Strategy.

Innovators and Ecosystems: EV charging and management
166
Ecosystem
Fundraising by Year and Type
Company Size (Paid-in Capital and Employees)
Local Participants
External Participants
2
Alignment w/ Strength
Source: Cleantech Group i3 Database
• Vodafone Xone
HQ
Incubators / Accelerators
Grants
Angel Financing
Equity Financing
Debt Financing
Customers
Talent Pipelines
Partnerships
Christchurch, NZ Sweden Israel California, US
Emissions Reduction
Diversity in mgmt. / ownership
UK
Vodafone XoneNew York State Energy
Research and Development Authority
Innovate UK
• Plug and Play Tech Accelerator
• The Future Mobility Incubator, Incubatenergy, Free Electrons
• Microsoft AI For Good, Entrepreneur First
• EVC, Vattenfall, Cadez Electronics
• Eneco, Smappee, Gireve
• ICT Netheralnds
• FreeWire Technologies, Hilton, Current, Kore Telematics
• American Electric Power, Silicon Valley Clean Energy, VW/Elli +3
• National Grid, EDF Energy, UK Power Networks, Igloo Energy +2
• Dalarna University, Uppsala University, Linkoping University
• Tel Aviv University• Ben-Gurion U. of
Negev• Technion
• University of Amsterdam, University of Groningen
• UCLA, • Arizona
State University,
• EQT Partners
• Equipment and battery retailers in USA and Europe
• A35 Toll Road (Italy)• Eurovia• EnBW• Tel Aviv-Yafo
Municipality
• Offers commercial and residential solutions to EV charging management
• Yahoo, New York Power Authority, Audi, Marriot, Verizon
• Altor Equity Partners • Afcon Holdings• Migdal• Halman Aldubi
• Eneco Group• SET Ventures, BOM
Brabant Ventures, ICT Group
Netherlands
• Angel HQ• Canterbury Angel
Investors• Enterprise Angels
• Vector, Openloop, Parkable, Singer Electrical
0102030405060
2019
2020
2020
2015
2018
2012
2013
2015
2017
2018
2020
2019
EvnexElectreonGreenflux EVConnect ev.energy
Mill
ions
Seed Series A Series BGrowth Equity Grant Project FinancePIPE Undisclosed
020406080
05
10152025
Mill
ions
Capital Number of Employees
Acquirer

NZ Ecosystem in Global Context: EV charging and management
167
40%
25%
35%
Overview
R&D-to-commercializationpipeline strength
Connection to demand
2
1
6
5
5
7
3
2
5
10
10
9
New Zealand Israel Sweden California, US
Evaluation 3.2 5.7 3.5 9.7
• Historical proficiencies in charging research, lack of automotive industry and low penetration of EVs domestically makes for a weak demand pull.
• U. Auckland has a history of successfully developing wireless charging IP – Qualcomm acquired Inductive Power Technology and Halo IPT in 2015.250
• U. Auckland undertaking research into inductive power tech and EV infrastructure.251
• 3 deals for $1.85 m 2011 – 2021• Financing available primarily
through grant agencies (e.g. Callaghan Innovation) and angel networks (e.g. Enterprise Angels)
• No observable participation from international or corporate funds.
• Some local corporate partnership with overseas innovators – Vector electric / gas partnered with Chargetrip (NL) in 2019.
• A key challenge is that NZ does not have a local automotive industry.
• Low EV penetration creates weak demand from consumers for charging infrastructure.
• Key proficiencies in chemical and electrical engineering. Government dedication to “smart roads” with built-in charging capabilities.
• Research into energy storage and EV batteries has produced competitive start-ups (e.g. Phinergy, StoreDots), learnings and talents spilling over.
• Research into both electric road technology and policy being undertaken at local universities.247
• 5 deals for $830 m 2011 – 2021• Bankruptcy of Better Place in
2013 still deters investors from the sector to a degree.35
• Large growth equity rounds can be raised, but require large teams of co-investors (e.g. Electreon).
• The “smart road” angle of Israeli innovators is very niche, but is gaining strong support in the home market, likely softening costs to deployment in the future. Some overseas parties are gaining interest in the sector, e.g. Electreon’s multiple projects developing in Europe.
• Strong proficiency in energy storage for EVs (e.g. Northvolt), spillover effects beginning but not yet emergent in mainstream innovation.
• Uppsala University has an Electric Transport Group applying Swedish proficiency and know-how in energy storage to the built and urban environment. 248
• Uppsala research partnership with Vatenfall and China Euro Vehicle for smart EV charging.249
• 6 deals for $5.73 m 2011 – 2021• Swedish EV charging companies
accessing grants from EU entities such as EIT Innoenergy.
• Companies turning mostly to angel investors for financing in this sector, little VC and corporate involvement
• Examples exist of local corporate engagement with innovators from outside of the country (e.g. Scania –Evbox, Vatenfall Connected Kerb), few local collaboration examples.
• Engagement by local municipalities and companies with micro-DER companies, which could be plugged into charging infrastructure.
• Innovation at every level of the value chain – battery systems (Proterra), vehicle production (Proterra – buses), system management (Chargepoint, Driivz, EVConnect).
• Deep research into the cutting edge of EV charging, e.g. current Stanford research into wireless charging (published 2020)
• Arpa-E collaboration with UC Berkeley on bi-directional charging
• Studies on charging behavior at UC Berkeley
• 53 deals for $1.7 b 2011 – 2021• Heavy participation from automotive
CVCs – BMW i-Ventures, Daimler, etc. • Heavy participation from large global
funds – Soros Capital, Canada Pension Plan, Braemar Energy Ventures
• High EV penetration in California creates a local demand pull. Automotive corporates (e.g. Tesla – Fastned, Uber –Ample), heavy vehicle producers (Freightliner Custom Chassis Corporation – Proterra) and industry associations (e.g. National Association of Trucks Stop Owners – Chargepoint) are partnering with innovators.
1
Ability to Lead
Financing strength

Takeaways: EV charging and management
168
Takeaways for NZ Climate Tech Innovators• Innovators should look to connections with corporates overseas to
ensure that products are future-proof. Innovators should pursue acceleration and piloting opportunities overseas, in areas where EV penetration is high, to develop real-life capabilities around serving markets with high EV ownership.
• Strategic investors (auto makers, power companies, battery companies) are critical to accessing growth financing in EV charging and management, innovators should pursue opportunities where they exist (likely overseas) to ensure that technology can, in theory, clear standards for strategic investors once EV uptake begins in earnest in NZ.
• Where possible, consider what the next gen will be – Israel is a good case study in innovators leapfrogging the current technological convention to innovate for tomorrow’s EV charging environment (wireless and “smart road”) charging.
Takeaways for NZ Climate Tech Ecosystem• Ministry of Transport has indicated that around 1.2 million EVs
could enter the national fleet by 2034/35. For NZ companies to own the charging, management, and infrastructure markets, it is likely that the ecosystem will need to form comprehensive value chain partnerships that maximize customization to local market conditions and incentivize auto makers to use local networks versus importing their existing partners from overseas.
• The research base can support experimentation to drive down cost of technology commercialization. Innovators that can create cost-effective solutions can play a critical role in making uptake of EVs affordable for consumers.
• Feedback loops need to be established between NZ innovators, battery companies, battery recycling companies, and auto makers to ensure that NZ innovators are able to innovate for where the market is going and don’t wait for the market to pick up in NZ to get started. Foreign competitors will be too strong and cheap by 2035.

169
Contents
Transport & Logistics – Comparison between Small Advanced Economies (SAEs)
Transport & Logistics Analysis
EV charging and management
Aerospace propulsion modules
Maritime electrification
CONTENTS

Aerospace propulsion modules – Trend Analysis
170
➢ Spire Global - locations in DC, San Francisco and Boulder. SpaceX – private satellite launch, partnership with NASA. Boeing HorizonX – investor and partner. Spin Global, Spaceflight and General Atomics are active as customers to startups.
➢ Universities with strong aerospace research programmes include MIT, Embry Riddle Aeronautical University, University of North Dakota and Texas A&M.
➢ Active investors and incubators/accelerators include AeroInnovate, BoomStartup, Iowa Startup Accelerator, NASA Frontier Development Lab, NASA Research Park Ames Research centre, Light Speed Innovations, Khosla Ventures and Space Angels Network.
➢ NASA, U.S. Department of Energy and U.S. Army are active in research, funding and development support.
Developer of a range of rocket launch systems and technologies for small satellites.
(New Zealand / Los Angeles, US)
Developer of propulsion systems for satellites specifically water-based propulsion systems.
(Bangalore, India)
• Description: Sustainable propulsion modules for small low orbit satellites.
• External potential: Global space propulsion market is $6.7 billion in 2020, projected to grow to $14.2 billion by 2025252. Global small satellite market size was $3.07 billion in 2019 and is projected to reach $9.75 billion by 2027. Nano satellites held the largest share of the market in 2019 (market segmented by nano, micro and mini). Growth is driven by increasing R&D activity and rising number of space laboratories for planned missions to asteroids, the moon and mars. Mini satellite segment is estimated to experience significant growth due to increasing use for earth observation; micro segment will witness moderate growth due to rising use of CubeSat for space research and scientific applications. Communications application is predicted to witness highest CAGR through 2027 due to increasing adoption of communication antennas in government and commercial sectors253.
• Timing: Industry is driven by federal initiatives and subsidies. As per International Space Law, every state must register their space objects with the international registry. Five United Nations Treaties on outer space (Outer Space Treaty, Rescue Agreement, Liability Convention, Registration Convention, Moon Agreement)2. Many upcoming launches delayed due to the Covid-19 pandemic. Industry also faced a slight decline from 2018 to 2019, but number of space launches expected to steadily increase after 2021252.
External Potential
Timing of Trend
3 4
Example innovators
Summary
Key ClustersUnited States
India➢ Indian Institute of Technology (IIT) Madras Incubation Cell – research and startup incubation
➢ Artha Venture Fund – investments in aerospace and spacetech. Speciale Invest – venture fund with investments in spacetech. CIIE.Co – government-backed incubator and centre of excellence.
➢ Indian Space Research organisation – government-run space agency, maintains one of the largest fleets of communication satellites and remote sensing satellites.

• Indian Institute of Technology, Madras, Anna University, Madras Institute of Technology
• First Cheque, groX Ventures, KA Enterprises, StartupXseed Ventures, IDFC-Parampara Fund, Karsemven Fund, Survam Partners
• Globevestor, LetsVenture, LionRock Capital
• Speciale Invest, Pi Ventures, Artha India Ventures
• InnovationQuarter• Icehouse Ventures, Aera
VC, Tuhua Fund, New Zealand Ministry of Business, Innovation and Employment
Innovators and Ecosystems: Aerospace propulsion modules
171
Ecosystem
Fundraising by Year and Type
Company Size (Paid-in Capital and Employees)
Local Participants
External Participants
2
Alignment w/ Strength
Source: Cleantech Group i3 Database
HQ
Incubators / Accelerators
Grants
Angel Financing
Equity Financing
Debt Financing
Customers
Talent Pipelines
Partnerships
Christchurch, NZ Bangalore, India
Emissions Reduction
Diversity in mgmt. / ownership
TX, USA
• CIIE.CO, SINE• Airbus Bizlab
Accelerator• IIT Madras Incubator,
CIIE.CO
• Anand Mahindra • Dylan Taylor, SeedInvest
• Skyroot Aerospace, SatSure
• Leaf Space, HOSTmi• Indian Space Research
organisation
• Exoluanch, Satlantis, Isilaunch Israel Aerospace Industries, Airbus Defense
• NASA
• Delft University of Technology
• Texas A&M, Texas Tech, University of Texas at Austin
• NASA, General Atomics, Spaceflight Industries, Spire Global, Geometric Space Corporation
• SK Ventures, Tank Stream Ventures
Chennai, India
• YES!Delft• Callaghan Innovation
• Callaghan Innovation
• European Space Agency, HOSTmi, Arianespace, Hiber, US Airforce
• Orbital Transports, SpaceX
• Oamaru Airport, Waitaki District Council, TriasRnD
NZ / CA, USA
• Callaghan Innovation
• NASA
• OHB Group, Synspective
• Astro Digital, Rideshare, Capella Space, DARPA
• High-Tech Grunderfonds, ELECNOR, Heartcore Capital
• BGF Ventures, Octopus Ventures
UK
• EASME, Horizon 2020• UK Space Agency
• Highlands, Island Enterprise, Calor
• NASA, European Space Agency
020406080
100120140
2018
2017
2018
2020
2019
2019
2020
2021
2010
2011
2013
2014
2015
2017
2018
2019
2014
2016
DawnAerospace
OrbexBellatrixAgnikul Rocket Lab Firefly
Mill
ions
Seed Series A Series B Growth Equity Grant
0100200300400
050
100150200
Mill
ions
Capital Number of Employees
Acquirer

NZ Ecosystem in Global Context: Aerospace propulsion modules
172
40%
25%
35%
Overview
R&D-to-commercializationpipeline strength
Connection to demand
6
6.5
7.5
5
5
4
9
10
10
8
8
8
New Zealand India US UK
Evaluation 6.7 4.7 9.6 8
• Multiple successful innovators (Rocket Lab, Dawn Aerospace) with international presence. Unique geographic position for orbital launches.
• Aerospace research at U. Auckland and U. Canterbury
• High-performing NZ students are being supported for participation in NASA internships.
• Companies spinning out of universities – e.g. Kea Aerospace – U. Canterbury,
• $4.7 million invested through 5 deals 2011 – 202147
• Heavyweight angel investors supporting early-stage innovation (Mark Rocket, Michael Fay – Rocket Lab)
• Rocket Lab successfully accessed critical grants (e.g. NASA) and financing from blue chip investors
• NZ will not be the demand owner for this sector but has demonstrated ability to bring innovators to key demand owners.
• Presence of small aircraft manufacturers in-country, e.g.Pacific Aerospace.
• Still emerging, India recently drafted the Spacecom Policy which is expected to open upits space sector to private companies and foreign investors.
• Indian innovation in non-propulsion space technologies (satellites, imaging, robotics), is increasing and will likely be the primary space sector, potentially generating spillovers.
• $10.5 m invested through 7 deals 2011 – 2021255
• Financing coming mostly in small amounts from large groups of local investors. Mix of angel groups and seed funds.
• Start-ups accessing global corporate accelerators (e.g.Manatsu – Shell E4)
• First deals with Indian Space Research organisation and innovators for piloting / test (Pixxel) provide optimism for innovators’ potential to participate in the space.
• Beyond the gravitational demand pull of NASA, a competitive and dynamic private sector has emerged with companies like SpaceX, Blue Origin, and Rocket Lab
• Top global aerospace universities (Stanford, MIT, Georgia Tech, U. Michigan) building large talent pools.
• Significant grants available from supporting / buying bodies – NASA, DARPA
• $2.4 b invested through 117 deals 2011 – 2021
• Blue chip tech investors (Sequoia, Lighthouse, Lightspeed, Morgan Stanley Alternative Investments) investing in propulsion
• Proximity to NASA and US Military are important for accessing demand pull.
• Presence of large aerospace and defense firms places critical buyers and supply chain in the US – Boeing, GE Aviation, General Dynamics, Lockheed Martin, Northrop Grumman, United Technologies Corporation
• Private space industry growing with government designation of 3 commercial spaceports 2014-2020. Leadership in innovation by Virgin Orbit, Orbex, Skyrora.
• Aerospace research happening at UK universities and through research consortiums.
• History of aviation and aerospace industry domestically, although producers have noted a degradation in local supply chain competitiveness. 256
• $196.6 m invested through 18 deals 2011-2021
• Access to financing from the UK Space Agency and EU Horizon 2020 programmes.
• Early stage and growth stage equity financing from both local and foreign investors.
• Active partnership ecosystem, with UK aerospace, defense, and commercial jet companies partnering with innovators, although with more noticeable partnerships with overseas innovators.
• UK Innovators being contracted for launch missions by both local (e.g.In-Space Missions – Orbex) and global clients (e.g. TriSept – Orbex)
2
Ability to Lead
Financing strength

Takeaways: Aerospace propulsion modules
173
Takeaways for NZ Climate Tech Innovators• Larger markets (US and UK) are receptive to working with overseas
innovators pursuing partnerships, acceleration, and financing opportunities. Larger markets can also facilitate more exposure to resources and understanding of key demand owners’ priorities.
• Accessing industry insiders (who have connections, experience at potential partners and customers) will require some overseas presence – Rocket Lab has successfully recruited former US Military, SpaceX talent, and graduates of Harvard, MIT, Stanford, etc., through their production operations in the US.
Takeaways for NZ Climate Tech Ecosystem• “Market” for aerospace propulsion modules is going to be with large
space exploration agencies and companies that deliver satellites into space. NZ has successfully bridged two companies into those markets, continuing this success will require ensuring access to pilot and joint R&D opportunities early in the technology development lifecycle of companies.
- The market size as currently understood likely does not fully capture the potential for growth in coming years – between 2009 and 2019 2,298 satellites were launched, whereas just less than 10,000 are predicted to be launched between 2019 and 2028.257, 258
- The market size is also potentially underestimated in that the space tourism industry has not yet emerged. In theory, orbital launches may increase by an order of magnitude in the coming years.
• Testing is possible on the Banks Peninsula due to its conditions for Sun-synchronous orbital (satellite passes over any given point of the planet's surface at the same local mean solar time) launch.45 Rocket Lab has carried out multiple launches from a site there and was constructing new pads as of 2020. The ability for physical tests to be carried out in NZ is an advantage that can be exploited not only for continued testing of entrepreneurial solutions but development of local clusters.

174
Contents
Transport & Logistics – Comparison between Small Advanced Economies (SAEs)
Transport & Logistics Analysis
EV charging and management
Aerospace propulsion modules
Maritime electrification
CONTENTS

Maritime electrification – Trend Analysis
175
➢ Vattenfall, Echandia Marine, Callenberg Technology Group, Stena Line
➢ Swedish Transport Administration; Sweden has goal to become fossil fuel-free by 2045; Swedish Maritime Administration (funding)
➢ Finnboat (Finnish Marine Industries Foundation)
Manufacturer of high-end electric boats.
Stockholm, Sweden
Designer and builder of solar-electric yachts and commercial catamarans.
Singapore
• Description: Zero-emission propulsion systems based on battery electric drives. Segment includes small boats and tenders.
• External potential: Market for hybrid and pure electric boats and ships is projected to grow to >$20 billion globally by 2027259. Recreational boats is largest and fastest growing subsegment (by sales), followed by underwater leisure and autonomous underwater vessels. By value, on-water commercial is largest market. Leisure vessels on inland water waterways (particularly in Europe and the U.S.) will become largest sector, driven by regulations and voluntary commitments by operators. Ideal application is small to medium craft.
• Timing: Early market activity in areas large amount of water transport, especially with presence of ambitious climate initiatives (Northern Europe, Singapore, Washington State).
• CO2 reduction potential: In the period 2007-2012, shipping emitted 1,000 Mt CO2 per year (3.1% of annual global emissions). If other sectors reduce emissions to keep global temperature increase below 2 degrees Celsius, shipping could represent 10% of global GHG emissions by 20502. A single 5 HP four-stroke engine has the same emissions impact as 38 cars3. Outboards do not have comparable emissions reduction technologies as cars, such as exhaust gas reticulation and catalytic converters, making the level of nitrogen oxide and hydrocarbon emissions dramatically higher.
• Environmental impact reduction potential: No pollutants (e.g. NOx, Sox) distributed into waterways, safer environment for marine life262
External Potential
Timing of Trend
2 2
Example innovators
Summary
Key ClustersSweden
Singapore➢ BOS Offshore & Marine, BH Global, Penguin, Durapower Technology and Bureau Veritas Maritime are part of
plug-in hybrid electric fast launch project.
➢ Nanyang Technical University (NTU) active in research on electric propulsion for marine vessels.
➢ PSA Container Port and Jurong Port acting as testbeds for innovation.
➢ Maritime Port Authority (MPA) and Singapore Maritime Institute are seeking proposals on electrification of harbourcraft.

Innovators and Ecosystems: Maritime electrification
176
Ecosystem
Local Participants
External Participants
2
Alignment w/ Strength
HQ
Incubators / Accelerators
Grants
Angel Financing
Equity Financing
Debt Financing
Customers
Talent Pipelines
Partnerships
Auckland, NZ Sweden Singapore WA, USA
Emissions Reduction
Diversity in mgmt. / ownership
Slovenia
Female founder/CEO Female CEO
• Callaghan Innovation Project Grant
• Peter Dahlberg • Chris Anderson• Christer von der Burg
• Duffy Duffield• Megan Smith• Jeff Wilke• Tom Alberg
• Offshore Cruising Tenders
• Bintang Timur Samudera• Maldive Yacht Support• Allmode• Z-Power Automation• Penguin International
• Torqeedo • Highfield Boats• Bass Pro Shops• Still Water Design
• Alumero Group• Impol• Ansys• Sava Zavarovalnica• Podkriznik
• KTH Royal Institute of Technology, Uppsala University
• KTH Royal Institute of Technology, Chalmers University of Technology
• University of Washington
• Marin Rowing Association
• Electric Water Sports
• Startmate
• Hi8Capital• SynerLeap
• L37 Venture Partners
• Alpvent
Sweden
• Zero emissions released
• Eliminates 125X as much pollution as switching from a typical gas-powered car to an electric car.
• 99% reduced local emissions when charging with an average EU electricity mix
• Zero CO2 emissions if the batteries are charged with solar energy.
• CO2 emissions cut by 50% if electricity comes from fossil fuel power plants.
• One 5 HP four-stroke engine has same environmental impact as 38 cars.
• New Zealand Growth Capital Partners
• K1W1• Icehouse• NZGCP
Fundraising by Year and Type
Company Size (Paid-in Capital and Employees)
Source: Cleantech Group i3 Database
01020304050
0
50
100
Mill
ions
Capital Number of Employees
0
5
10
15
20
25
30
35
20182020201920202016201720182019202020162019
ZeroJet X Shore PureWaterCraft Quadrofoil
Mill
ions
Seed Series A Series BGrowth Equity Grant Structured Debt
• Arc Angels
Acquirer

NZ Ecosystem in Global Context: Maritime electrification
177
40%
25%
35%
Overview
R&D-to-commercializationpipeline strength
Connection to demand
5
2
6
6
4
7
6
6
6
New Zealand Sweden Washington, US
Evaluation 4.6 5.9 6
• History of know-how in shipbuilding and design, first jet boat was invented in NZ. Comprehensive marine science research ecosystem.
• Research at a half dozen universities in marine science –NZ is good testbed for marine environment protection.
• Dedicated recreational vessel research – U. Auckland Yacht Research Unit in the mechanical engineering dept.
• $350 k in 5 deals from 2011 –2021
• Key missing element is investment (domestic and foreign) in underlying battery and electric motor start-ups
• Home market estimated at around 215k recreational boats263
• In the short term, NZ is one of the few recreational boating markets expected to expand (during Covid-19 recovery).
• Emerging maritime electrification scene with Candela, GreenStar Marine, and X Shore. Swedish proficiency in battery manufacturing places important know-how in country
• Key supply chain advantages –local producers of maritime electric motors (Electro-Mobile, Nordic Genset) and batteries (Lime Power).
• $7 m in 2 deals from 2011 –2021
• Financing for innovators coming in significant part from crowdfunding (GreenStar Marine - $577k, X Shore - $1.6 m) and angel investors (X Shore - $5.4 m)
• Sweden began hosting an all-electric boat show in 2019, with most of the exhibitors being Swedish companies.
• Marketplaces for electric boats, including Go Electric, are providing distribution and promotion channels for local innovators.
• Washington State is a key supply and demand market – 2% of the state’s employment is maritime related, nearly 25% of the US’s shipyards are in Washington. 263
• Washington’s maritime industry creates an important knowledge base around production and go-to-market.
• $37.5 m in 6 deals from 2011 – 2021• Involvement from high-profile angel
investors, e.g. Amazon Worldwide Consumer CEO Jeff Wilke.
• “Maritime Blue” programme accelerating and financing local innovators
• Recreational market is local –there are over 1 m recreational boats on the water on the US West Coast (CA, WA, OR). 264
• Major recreational boat manufacturers have shown willingness to partner with producers of electric boat engines (e.g. Tracker – Pure Watercraft)
2.5
Ability to Lead
Financing strength
Takeaways: Maritime electrification
178
Takeaways for NZ Climate Tech Innovators• No de facto global innovation hub, customers (globally) are fairly
dispersed. Connections to export markets through traditional means (export promotion, international distribution, etc.) are likely necessary to keep pace with demand as it picks up.
• Achieving economies of scale will be mutually inclusive with battery development proficiency and charging. Companies that succeed in this sector, as in electric vehicles, will need to have deep connections through the value chain. Talent, investors, and other resources with automotive backgrounds should not be overlooked when developing a company in this sector.
• Electric boats are expensive everywhere – there is still time for NZ innovators to make breakthroughs and develop cost advantages that beat competitors on a global scale.
• NZ’s strengths in marine science can be leveraged to develop, test, and pilot maritime technologies that have distinctly lower impact on natural environments.
Takeaways for NZ Climate Tech Ecosystem• A fractured and slow-growing market. The ecosystem is likely better
poised to serve maritime electrification through a dual track of: a) developing energy storage and charging solutions and b) a general “zero-emissions” boating innovation pursuit, including biofuel / drop-in fuel development and hydrogen fuel cells for marine applications.
• Building export capabilities will require an ability to compete on price, necessitating underlying efficiencies on production and supply chain. Both issues are typically challenging for island / remote countries. First-loss capital and grants that absorb the supply chain / procurement learning curves are likely necessary to develop competitive innovators.

March 2019
NEW ZEALAND CLIMATE TECH FOR THE WORLD
Appendix 5Materials & Chemicals
179

180
Contents
Materials & Chemicals – Comparison between Small Advanced Economies (SAEs)
Materials & Chemicals Analysis
Advanced Materials: Green Building & Construction
Additive Manufacturing for Construction
Industrial Waste to Value
CCUS – Point Source Capture
Surface Technologies
CONTENTS

Overview – Materials & Chemicals Innovation in Small Advanced Economies (SAEs)
181
Materials & Chemicals Investments (2010 – 2020) and Funded Innovators in SAEsFunding Raised ($) Number of Companies

182
Contents
Materials & Chemicals – Comparison between Small Advanced Economies (SAEs)
Materials & Chemicals Analysis
Advanced Materials: Green Building & Construction
Additive Manufacturing for Construction
Industrial Waste to Value
CCUS – Point Source Capture
Surface Technologies
CONTENTS

Advanced Materials Innovation in Small Advanced Economies (SAEs)
183
Advanced Materials Investments (2010 – 2020) and Funded Innovators in SAEs
Funding Raised ($) Number of Companies Funding Raised ($)
Advanced Materials: Green Building and Construction Investments (2010 – 2020) and Funded Innovators in SAEs

Advanced Materials – Green building & construction: Trend Analysis
184
➢ Government support in attracting international corporates for collaboration / investment
➢ ConTech specialist incubator connects innovators with industry, funding and government support. Assists startups with product-market fit
Concrete sea defences which foster biodiversity
Tel Aviv, Israel
Crosslinked clay cement
Aquitaine, France
• Description: Alternative cements, low carbon concrete and concrete alternatives
• External potential: The global cement and concrete products market size was $333.26bn in 2020 and is expected to reach $481.23bn in 2025, growing with CAGR of 7%223.
• Timing: Cement production is accelerating in emerging regions, driven by economic development and population growth3. Cement and concrete accounted for 9-10% of global energy-related CO2 emissions in 20193 and adoption of green materials will be driven by stricter emissions targets at national level.
• CO2 reduction potential: Potential savings of 264Mt CO2e by 2050, based on 80% of current cement and concrete emissions 225
• Environmental impact reduction potential: Building materials should be considered in the context of overall lifecycle emissions for the building: materials which increase overall energy efficiency also reduce operational emissions of the building. Potential for better land use, reduction in disruption of wildlife habitats, dust/visual pollution due to limestone quarrying.
External Potential
Timing of Trend
3 3
Example innovators
Summary
Key ClustersIsrael
France➢ Lafarge Holcim, Vinci, Saint-Gobain pursuing in-house innovation, external collaboration and investment in
innovators
➢ Université Gustave Eiffel, CNRS participating in H2020 projects
➢ Impulse Partners, Cement Lab, CSTB Lab all construction-focused, have accelerated 600+ construction sector startups
➢ Many schemes (government and private) providing grants and financing to early-stage ventures
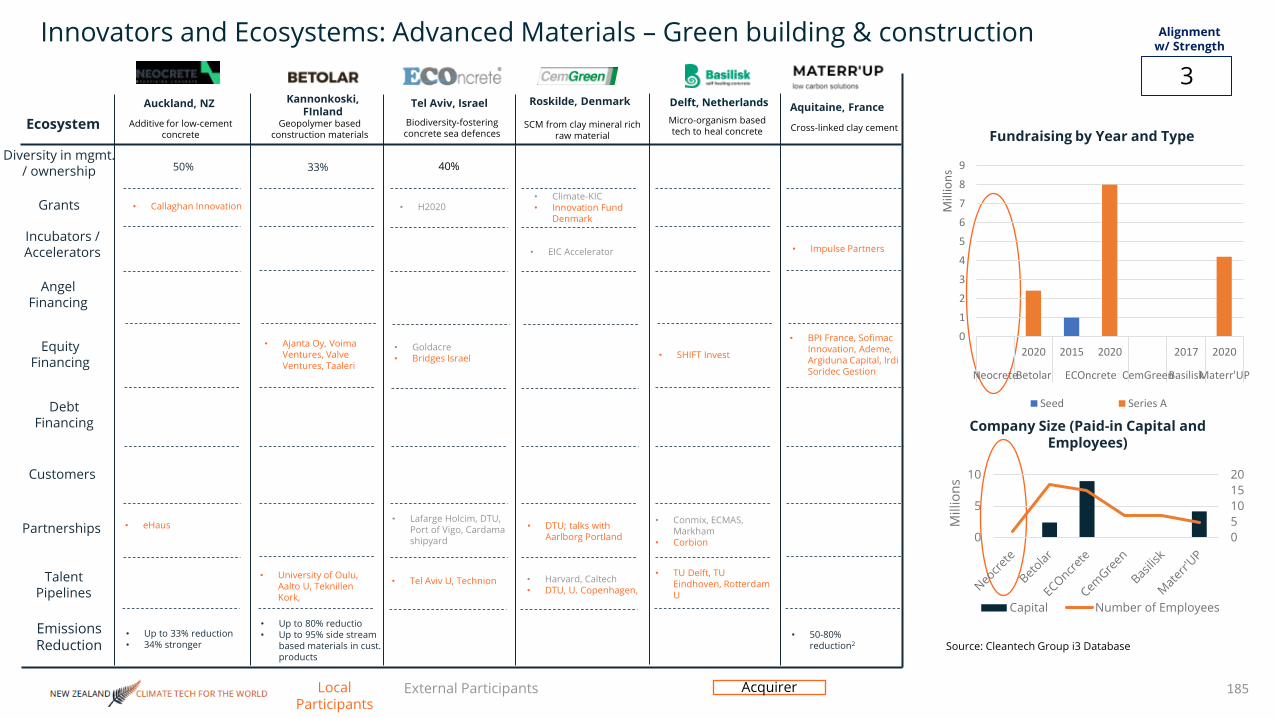
Innovators and Ecosystems: Advanced Materials – Green building & construction
185
Fundraising by Year and Type
Company Size (Paid-in Capital and Employees)
Local Participants
External Participants
3
Alignment w/ Strength
Source: Cleantech Group i3 Database
Ecosystem
Emissions Reduction
Auckland, NZ Kannonkoski, FInland
Tel Aviv, Israel Delft, Netherlands
Additive for low-cement concrete
Geopolymer based construction materials
Biodiversity-fostering concrete sea defences
Micro-organism based tech to heal concrete Cross-linked clay cement
Incubators / Accelerators
Grants
Angel Financing
Equity Financing
Debt Financing
Customers
Talent Pipelines
Partnerships
Diversity in mgmt. / ownership
• 50-80% reduction2
• Up to 80% reductio• Up to 95% side stream
based materials in cust. products
• Up to 33% reduction• 34% stronger
• University of Oulu, Aalto U, Teknillen Kork,
• Tel Aviv U, Technion • Harvard, Caltech• DTU, U. Copenhagen,
• TU Delft, TU Eindhoven, Rotterdam U
• eHaus• Lafarge Holcim, DTU,
Port of Vigo, Cardama shipyard
• DTU; talks with Aarlborg Portland
• Conmix, ECMAS, Markham
• Corbion
• Ajanta Oy, Voima Ventures, Valve Ventures, Taaleri
• Goldacre• Bridges Israel • SHIFT Invest
• BPI France, Sofimac Innovation, Ademe, Argiduna Capital, Irdi Soridec Gestion
• EIC Accelerator • Impulse Partners
• Callaghan Innovation • H2020• Climate-KIC• Innovation Fund
Denmark
50% 33% 40%
Roskilde, Denmark
SCM from clay mineral rich raw material
Aquitaine, France
0123456789
2020 2015 2020 2017 2020
NeocreteBetolar ECOncrete CemGreenBasiliskMaterr'UP
Mill
ions
Seed Series A
05101520
0
5
10
Mill
ions
Capital Number of Employees
Acquirer

NZ Ecosystem in Global Context: Green Building & Construction
186
40%
25%
35%
Overview
R&D-to-commercializationpipeline strength
Connection to demand
7
0
6
5
3
8
5
2
7
7
5
9
New Zealand Finland Israel France
Evaluation 4.9 5.6 5 7.2
• Local availability of pozzolan, key ingredient in green concrete
• Green Star & EPD basis for demand-side pull
• U. Canterbury research into earthquake-resistant construction materials
• Auckland Uni services supports commercialization in materials innovation
• No notable investments in last decade
• Allied Concrete / eHaus adopting progressive construction materials
• Green Star rating system enables demand-side evaluation
• Research & commercial links with other Nordic countries
• Exploitation of tech sector spillovers
• Aalto university’s A Grid houses several accelerators
• Tekes, VTT research and commercialize sustainable construction innovation
• $2.4m invested in last decade (Betolar Series A)
• Sitra Innovation fund invests in forward-looking SMEs
• Homegrown VCs, not specialized
• Presence of multinationals in other sectors supplies executives with international experience and contacts
• Strong track record in tech. innovation
• Construction sector disruption driven by safety concerns & labor shortages
• ConTech accelerator connects startups with ecosystem and government support
• Israel Innovation Authority subsidizes innovation for low-tech applications
• No notable investments in last decade
• Digital / robotics focused startups attracting more funding
• Israel Export Institute & Foreign Trade Administration organized Contech / Proptech Expo to present Israeli innovators to international corporations
• Absence of local corporates means strong focus on internationalization
• Early-stage funding and ecosystem support has led to a surge in startup activity
• Main growth opportunities in corporate partnerships
• Government incentives for startups/commercialization
• Lafarge, Impulse Partners construction-focused accelerators provide industry exposure and promote corporate partnerships
• U. Gustave Eiffel, CNRS involved in H2020 research projects
• $15m invested in last decade• Good availability of early-stage
funding, gap in growth equity and scale-up support
• Lafarge Holcim, GCC Groupe, Bouygues Construction, Saint-Gobain partnering with innovative startups for project development
• Strong domestic construction industry, slow to adopt innovation
1
Ability to Lead
Financing strength

Takeaways: Advanced Materials – Green building & construction
187
Takeaways for NZ Climate Tech Innovators• Collaborate with decision makers (architects, designers, specifiers,
buyers) to communicate performance benefits of innovative materials
• Marketing is key: measure the environmental impact of your solution and communicate it
• Target regions where local authorities offer reduced development costs to Green Star certified buildings
• Industry knowledge and contacts can help combat construction industry inertia
• Opportunities in construction materials incorporating locally available raw materials (e.g. pozzolans) as an alternative to SCM imports
• Future opportunities around the intersection of construction and technology (e.g. incorporation of sensors, AI for real-time curing data)
Takeaways for NZ Climate Tech Ecosystem• Ensure regulation, certification & standards are updated for green
materials
• Educate buyers about advantages of green materials
• Green procurement, materials performance requirements based on Environmental Product Declarations & Green Star ratings to kick start markets
• Consider investment support for production of local materials inputs (e.g. pozzolans)

188
Contents
Materials & Chemicals – Comparison between Small Advanced Economies (SAEs)
Materials & Chemicals Analysis
Advanced Materials: Green Building & Construction
Additive Manufacturing for Construction
Industrial Waste to Value
CCUS – Point Source Capture
Surface Technologies
CONTENTS
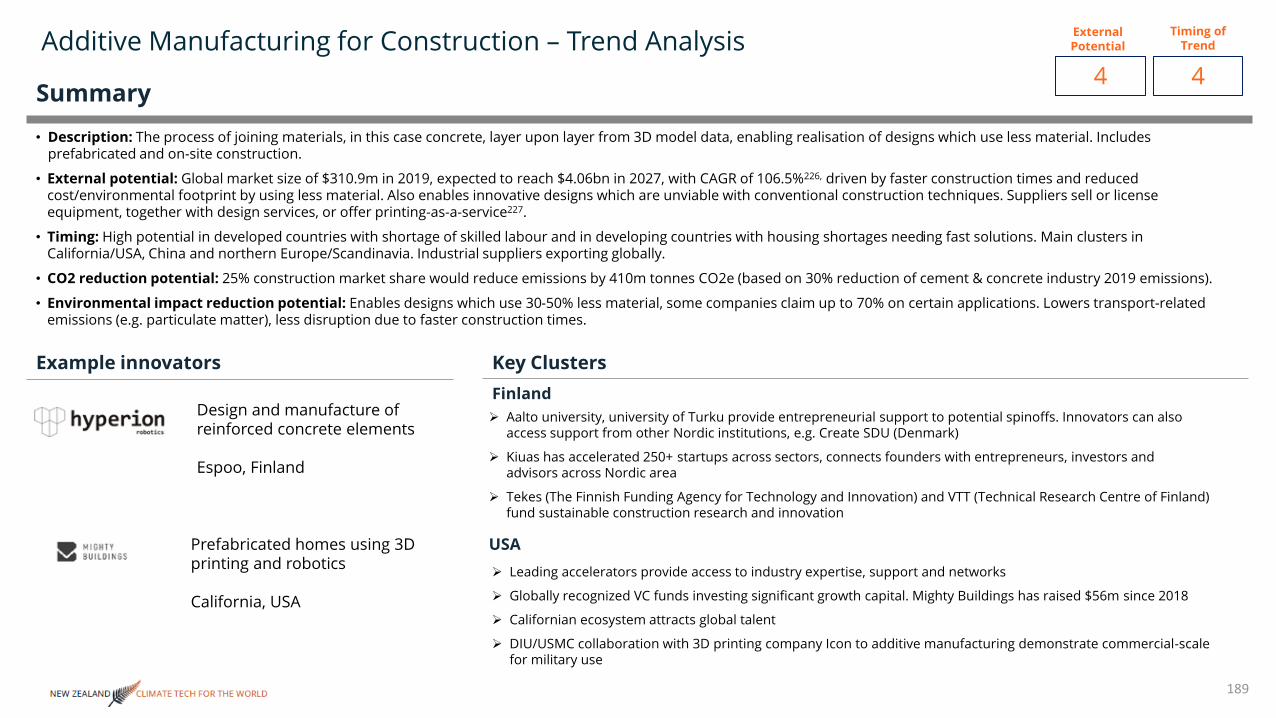
Additive Manufacturing for Construction – Trend Analysis
189
➢ Aalto university, university of Turku provide entrepreneurial support to potential spinoffs. Innovators can also access support from other Nordic institutions, e.g. Create SDU (Denmark)
➢ Kiuas has accelerated 250+ startups across sectors, connects founders with entrepreneurs, investors and advisors across Nordic area
➢ Tekes (The Finnish Funding Agency for Technology and Innovation) and VTT (Technical Research Centre of Finland) fund sustainable construction research and innovation
Design and manufacture of reinforced concrete elements
Espoo, Finland
Prefabricated homes using 3D printing and robotics
California, USA
• Description: The process of joining materials, in this case concrete, layer upon layer from 3D model data, enabling realisation of designs which use less material. Includes prefabricated and on-site construction.
• External potential: Global market size of $310.9m in 2019, expected to reach $4.06bn in 2027, with CAGR of 106.5%226, driven by faster construction times and reduced cost/environmental footprint by using less material. Also enables innovative designs which are unviable with conventional construction techniques. Suppliers sell or license equipment, together with design services, or offer printing-as-a-service227.
• Timing: High potential in developed countries with shortage of skilled labour and in developing countries with housing shortages needing fast solutions. Main clusters in California/USA, China and northern Europe/Scandinavia. Industrial suppliers exporting globally.
• CO2 reduction potential: 25% construction market share would reduce emissions by 410m tonnes CO2e (based on 30% reduction of cement & concrete industry 2019 emissions).
• Environmental impact reduction potential: Enables designs which use 30-50% less material, some companies claim up to 70% on certain applications. Lowers transport-related emissions (e.g. particulate matter), less disruption due to faster construction times.
External Potential
Timing of Trend
4 4
Example innovators
Summary
Key ClustersFinland
USA➢ Leading accelerators provide access to industry expertise, support and networks
➢ Globally recognized VC funds investing significant growth capital. Mighty Buildings has raised $56m since 2018
➢ Californian ecosystem attracts global talent
➢ DIU/USMC collaboration with 3D printing company Icon to additive manufacturing demonstrate commercial-scale for military use

Innovators and Ecosystems: Additive Manufacturing for Construction
190
Fundraising by Year and Type
Company Size (Paid-in Capital and Employees)
Local Participants
External Participants
2
Alignment w/ Strength
Source: Cleantech Group i3 Database
Ecosystem
Emissions Reduction
Hamilton, NZEspoo, FInland Fribourg, Switzerland Copenhagen,
DenmarkSan Francisco,
USAAdditive manufacturing &
construction 4.0
Design & manufacture of concrete components
3D concrete printing technology for construction
3D construction printers and automated processes
Prefabricated homes by 3D printing & robotics
Incubators / Accelerators
Grants
Angel Financing
Equity Financing
Debt Financing
Customers
Talent Pipelines
Partnerships
Diversity in mgmt. / ownership
• Up to 2kg/home• Committed to net
zero by 2028
• Up to 30% CO2 reduction
• 40-50% material saving
• 40% less CO2 emissions
• 70% less waste
• Aalto university • IMD • TU Delft, Avans U, TU Eindhoven,
• DTU, Copenhagen Bus. School, KEA, Aalborg U, Oregard Gymnasium
• Tomsk Polytechnik U, Tomsk State U, Bauman Moscow State Tech. U, Higher School of Econ.
• CyBe Construction• Kuka, Iberdrola,
Thinking Huts, Create SDU
• Aalto Universty
• Holcim Switzerland • Korodur (materials), Qorox (distribution)
• Lafarge Holcim, GE• DTU
• Hamilton City Council• RWB Groupe, Monod-
Piguet• Printed Farms, L&T
Construction, Peri Group
• Mutschler Ventures • Investiere, Swiss
Immo Lab, Capital Risque Fribourg
• ArcTern Ventures• Khosla Ventures, Zeno
Ventures, BOLD Capital Partners
• Kiuas • Kickstart, VentureLab • Y Combinator
• Kickstart, VentureKick • Climate-KIC • Green Transition Fund
Founder 100% 40%
Oss, Netherlands
3D concrete printers and design software
05
1015202530354045
2018 2019 2020 2013 2018 2019 2021
QoroxHyperion Mobbot CyBeCOBODMighty Buildings
Mill
ions
Seed Series A Series B Grant Structured Debt Undisclosed
050100150
0
50
100
Mill
ions
Capital Number of Employees
Acquirer

NZ Ecosystem in Global Context: Additive Manufacturing for Construction
191
40%
25%
35%
Overview
R&D-to-commercializationpipeline strength
Connection to demand
6
0
7
3
0
8
7
7
9
9
8
9
New Zealand Finland Denmark USA
Evaluation 4.9 4 7.7 8.8
• Progressive green building standards provide market pull
• Massey U, U. Auckland offer robotics & AI programmes and commercialization support; U. Wellington has a number oftech spinoffs
• PreFab NZ advocates for construction innovation
• No notable investments in last decade
• Green procurement (e.g.Hamilton City Council) kick-starting new markets
• Property Developers (e.g.Mansons TLCM) following Green Star certification can drive demand
• Combination of sustainable construction research priorities and tech capability
• Access to Nordic network
• Aalto university, university of Turku supporting spinoffs
• Tekes and VTT provide funding for sustainable construction innovation
• Kiuas accelerator has 250+ alumni companies (no sector focus)
• No notable investments in last decade
• Construction exports have fallen due to weakened demand
• Forward-looking government innovation agenda
• Access to Nordic / wider EU network
• Proactive government support for construction innovation e.g. Green Transition Fund
• Create SDU researches additive manufacturing in architecture
• DTU FABLAB best equipped machine fleet in the Nordics
• Peri Group equity participation in Cobod, 2018
• Investment by EU corporates (eg Cobod/Peri Group)
• Cobod/Lafarge/GE wind turbine development partnership
• Government-led corporate matchmaking programme
• World class tech accelerators• Availability of funding with
specialized, knowledgeable investors
• Many world-class accelerators producing high growth startups
• R&D funding available to corporates as well as SMEs
• Size of ecosystem produces entrepreneurs with prior startup/accelerator experience
• $131m invested in last decade• Icon and Mighty Buildings
account for $110• Funding focused on seed to
Series B• Active network of Venture
Funds investing in construction tech
• Residential offers can be configured online by potential buyers
• DIU/USMC collaboration to additive manufacturing demonstrate commercial-scale for military use
1
Ability to Lead
Financing strength

Takeaways: Additive Manufacturing for Construction
192
Takeaways for NZ Climate Tech Innovators• New ventures can establish credibility through demonstration /
show projects
• Customers need design support to realize full potential efficiency gains (machinery and software go hand in hand)
• Opportunity for increased climate impact by developing green concrete formulations using locally-available raw materials
• Opportunity to work proactively with authorities to develop new standards and regulations
• Partnerships with building materials companies can provide a route to market
• Other opportunities in innovative applications e.g.GE/Lafarge/Cobod wind towers; Hyperion Robotics/Iberdrola transmission infrastructure
• High-growth Asian countries where housing demand outstrips supply are potential export targets
• Partner with universities to expose future talent to technology solutions
• Market dynamics currently enable 100% yearly growth financed by sales; however well-financed players could start to increase market share internationally as the market matures
Takeaways for NZ Climate Tech Ecosystem• Adapt regulations and standards for performance-based rather
than specification-based evaluation, with flexibility to allow for locally-available raw materials
• Encourage revision of university curricula to incorporate state of the art construction technologies
• Market is in early stages and currently supports a variety of business models, which may coalesce with development
• Higher growth business models (as a service) need large fundraises

193
Contents
Materials & Chemicals – Comparison between Small Advanced Economies (SAEs)
Materials & Chemicals Analysis
Advanced Materials: Green Building & Construction
Additive Manufacturing for Construction
Industrial Waste to Value
CCUS – Point Source Capture
Surface Technologies
CONTENTS

Industrial Waste to Value: Trend Analysis
194
➢ High technology capability means many construction startups focus on robotics and automation aspects237
➢ Government has acted proactively to widen innovation via grants to low-tech and promotion of whole construction value chain internationally
➢ ConTech incubator works with startups along whole value chain, connects innovators with investment, assists with product-market fit
Construction elements from advanced earth materials
Holon, Israel
Cement-free, carbon-negative concrete using steel slag
Montreal, Canada
• Description: Raw materials or products derived from industrial waste streams.
• External potential: Construction waste expected to double to 2.2bn tons by 2025231. Global non-ferrous slag volumes are forecast to reach 133.7m tons by 20292232. New processing techniques allow 10% raw material substitution in plasterboard manufacturing7, up to 100% cement substitution in concrete236
• Timing: Global waste production is increasing, driven by population growth and industrialization4. Clusters in Asia Pacific (driven by high waste production, esp. China and India), North America and Europe (driven by increasing environmental restrictions).
• CO2 reduction potential: 50% cement substitution with waste-derived alternatives could reduce cement & concrete emissions by 40% (1.3bn tonnes CO2e)236
• Environmental impact reduction potential: Reduction of slag heaps, avoidance of demolition piles or landfill disposal.
External Potential
Timing of Trend
4 3
Example innovators
Summary
Key ClustersIsrael
Canada➢ COSIA, Harsco supporting innovation through development partnerships and innovation challenges
➢ Funding availability from early-stage to growth equity
➢ Carbicrete is an alumnus of McGill University’s entrepreneurship centre

Innovators and Ecosystems: Industrial Waste to Value
195
Fundraising by Year and Type
Company Size (Paid-in Capital and Employees)
Local Participants
External Participants
4
Alignment w/ Strength
Source: Cleantech Group i3 Database
Ecosystem
Emissions Reduction
Auckland, NZ Taupo, New Zealand] Israel
(Montreal, Canada)Mineral & chemical
products from industrial waste streams
Silica from geothermal fluids
Circular building elements Low-cost building materials from CO2
Incubators / Accelerators
Grants
Angel Financing
Equity Financing
Debt Financing
Customers
Talent Pipelines
Partnerships
Diversity in mgmt. / ownership
• Carbon-negative• 92% GHG savings• 70% upcycled
natural quarry waste
• U. Auckland • University of Otago• Ben-Gurion U,
Technion • McGill U,
• Nzanza Light Materials
• MacDiarmid Institute (R&D)
• Tobuko Electric, Nroske Skog, Climeon
• Contact Energy, Mercury
• CO2 Solutions
• Provincial Growth Fund
• SQN Capital • Canada Economic
Development for Quebec
• GRC Sino Green Fund, EFU Fukutake
• K1W1, Ice Angels, lewis Holdings Ltd,, Sparkbox Investments Ltd
• Euroz Broker, Baseload Capital, Efu Investment, Lindsay Investments, Climeon
• Jarden
• Undisclosed seed round
• Harsco• Innovobot
• Enterprise Angels • Ice Angels
• LevelTwo • ConTech • Innovobot
• Callaghan Innovation • Callagnhan Innovation • EASME/Horizon 2020• Israel Innovation
Authority
• SDTC, Technoclimat
Diversity 20% 50%
Zürich, SwitzerlandBerne, SwitzerlandRecycled concrete as CO2
reservoirCement-free concrete mix from construction
waste
• 90% CO2 reduction• 30kg/ton fresh
concrete• Climate neutral
concrete by 2025
• ETH Zurich, école d’architecture de Grenoble
• Holcim
• Climate-KIC• Kickstart
• Innobooster
• Climate-KIC• Mass Challenge
• Horizon 2020• Innobooster
28%
02468
10121416
2014
2015
2016
2017
2015
2016
2017
2019
2020
2019
2019
2020
2019
2018
2019
2020
Avertana Geo40 CriaterraNeustarkOxaraCarbiCrete
Mill
ions
Seed Series A Series BGrowth Equity Grant Structured DebtConvertible Debt Loan
0
10
20
30
0
10
20
30
Mill
ions
Capital Number of Employees
• ETH Zurich
Acquirer

NZ Ecosystem in Global Context: Industrial waste to value - Global Leading Ecosystems
196
40%
25%
35%
Overview
R&D-to-commercializationpipeline strength
Connection to demand
8
7
8
6
6
5
7
5
8
9
8
7
New Zealand Israel Switzerland Canada
Evaluation 7.8 5.7 6.9 8.1
• Strong university/innovator R&D collaboration
• Maturing ecosystem support• Machinery and raw materials
export track record
• U. Auckland, AUT, U Otago, Victoria U. R&D partnerships, commercialization offices
• MacDiarmid Institute R&D collaboration
• LevelTwo has supported several deeptech success stories
• $43m invested between Avertana, Geo40 & Mint Innovation since 2016
• Early stage and growth funding available
• Icehouse Ventures/LevelTwo partnership will boost innovation funding
• Machinery and raw materials export track record
• Proactive government support to bridge gap in lower-tech construction solutions
• ConTech incubator takes value chain approach, connects startups with investment and industry
• Criaterra has raised around $3m in grant funding
• Wider Israeli Contech & proptech sector saw investment increase from $30m <2015 to $900m in last five years
• Government-organized programmes to promote domestic startups with international corporates
• Materials and cities research centre• Strong early-stage ecosystem
support • Construction corporates engaging in
innovation
• ETH Zurich has 15 materials research groups, future cities lab investigates waste as a building material
• Kickstart, H2020, Climate-KIC nurturing early stageinnovators
• $370k invested in sector since 2011
• Exclusively grant and seed funding
• Neustark / Holcim partnership• Lafarge / Solidia development
partnership
• Well-educated workforce with high engineering skills
• Availability of funding• Corporates supporting &
participating in innovation
• Carbicrete is a product of McGill university’s Dobson Centre for entrepreneurship
• $44.5m invested since 2011, of which $10m to Carbicrete
• Funding availability at all growth stages
• Harsco/Carbicrete/concrete block manufacturer development consortium
• organisations such as COSIA supporting waste to value innovation
4
Ability to Lead
Financing strength
Takeaways: Industrial Waste to Value
197
Takeaways for NZ Climate Tech Innovators• Build partnerships with waste producers / owners of waste streams
to ensure access to raw materials
• Look for export markets with supportive regulatory framework (potential issues: slag transport, getting waste-derived materials into construction cycle)
• Testing & certification to prove that product has requisite performance
• Local partners can help with certification, standardization
• Construction industry inertia is a barrier to adoption: inside industry knowledge can help
• Promote awareness of performance / environmental benefits of product amongst decision makers (designers, architects, potential end customers)
• Expansion into finished goods, incorporation of sensors / analytics future opportunities to add value
Takeaways for NZ Climate Tech Ecosystem• Educate industry and consumers about circular construction
benefits
• Adapt standards & certification to provide clear, performance-based guidelines about materials derived from waste streams
• Mandate low carbon products, green procurement (based on Environmental Product Declaration performance data)
• Invest in R&D into incorporation of sensors / analytics

198
Contents
Materials & Chemicals – Comparison between Small Advanced Economies (SAEs)
Materials & Chemicals Analysis
Advanced Materials: Green Building & Construction, Concrete
Additive Manufacturing for Construction
Industrial Waste to Value
CCUS – Point Source Capture
Surface Technologies
CONTENTS
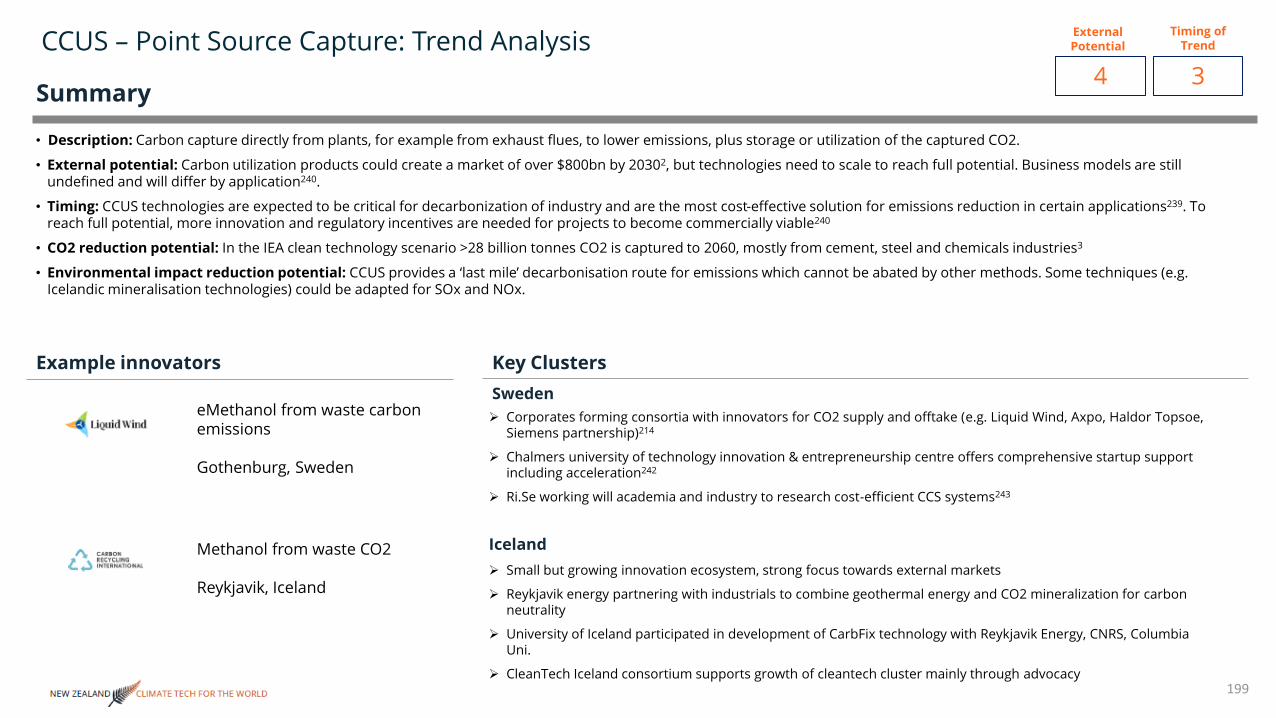
CCUS – Point Source Capture: Trend Analysis
199
➢ Corporates forming consortia with innovators for CO2 supply and offtake (e.g. Liquid Wind, Axpo, Haldor Topsoe, Siemens partnership)214
➢ Chalmers university of technology innovation & entrepreneurship centre offers comprehensive startup support including acceleration242
➢ Ri.Se working will academia and industry to research cost-efficient CCS systems243
eMethanol from waste carbon emissions
Gothenburg, Sweden
Methanol from waste CO2
Reykjavik, Iceland
• Description: Carbon capture directly from plants, for example from exhaust flues, to lower emissions, plus storage or utilization of the captured CO2.
• External potential: Carbon utilization products could create a market of over $800bn by 20302, but technologies need to scale to reach full potential. Business models are still undefined and will differ by application240.
• Timing: CCUS technologies are expected to be critical for decarbonization of industry and are the most cost-effective solution for emissions reduction in certain applications239. To reach full potential, more innovation and regulatory incentives are needed for projects to become commercially viable240
• CO2 reduction potential: In the IEA clean technology scenario >28 billion tonnes CO2 is captured to 2060, mostly from cement, steel and chemicals industries3
• Environmental impact reduction potential: CCUS provides a ‘last mile’ decarbonisation route for emissions which cannot be abated by other methods. Some techniques (e.g.Icelandic mineralisation technologies) could be adapted for SOx and NOx.
External Potential
Timing of Trend
4 3
Example innovators
Summary
Key ClustersSweden
Iceland➢ Small but growing innovation ecosystem, strong focus towards external markets
➢ Reykjavik energy partnering with industrials to combine geothermal energy and CO2 mineralization for carbon neutrality
➢ University of Iceland participated in development of CarbFix technology with Reykjavik Energy, CNRS, Columbia Uni.
➢ CleanTech Iceland consortium supports growth of cleantech cluster mainly through advocacy

Innovators and Ecosystems: CCUS – Point Source Capture
200
Fundraising by Year and Type
Company Size (Paid-in Capital and Employees)
Local Participants
External Participants
3
Alignment w/ Strength
Source: Cleantech Group i3 Database
Ecosystem
Emissions Reduction
(Auckland, NZ) Gothenburg, Sweden Oslo, Norway Nijmegen, Netherlands
Reykyavik, Iceland
Waste to fuel technology eMethanol from waste carbon emissions
Methanol from waste CO2
Energy from hydrocarbons with
integrated CO2 captureCarbon capture & biogas
upgrading
Incubators / Accelerators
Grants
Angel Financing
Equity Financing
Debt Financing
Customers
Talent Pipelines
Partnerships
Diversity in mgmt. / ownership
• 30% cost of capture reduction compared to state of the art MEA
• [Reduction Claim]• >70% efficiency
including capture
• China plant will recycle 150k tonnes CO2 /year
• U. Illinois, Northwestern
• University of Auckland
• Aalborg U. • Chalmers U Swedish
university of ag. Sciences
• Háskóli Íslands, Reykjavik U.
• Institute for Energy Technology, Christian Michelson Research
• Total, SkyNRG • Övik Enerji
• Henan Shuncheng Group, Oorja Fuel Cells
• Innovation centre Iceland
• Coast Centre Base • Viridor Waste Management
• TNO (research)
• Shougang Steel
• Western Technology Investment
• Viridor• Rabobank
• Khosla Ventures, BASF Venture Cap.
• K1W1, NZ Superannuation Fund,
• EIT InnoEnery, crowdfunding
• Methanex• AP Ventures, Toyota,
Danske Bank• Nysno Climate
Investments, Stratel
• Undisclosed
• Startup Lab
• US Dept of Energy• Government of New
Zealand• Horizon 2020 • Startup Lab, Enova
• Climate-KIC• Ministry of Economic
Affairs
27% 25% 20%
CanadaTechnology for carbon capture from industrial
sources
• One plant can capture 1m tons CO”7yr
• U. Brit. Colombia, BCIT
• Total, Lafarge Holcim, Climeworks
• Suncor (R&D)
• Enhance Energy
• OGCI Climate Inv, Chevron Tech. Ventures
• Suncor Energy, Export Development Canada
• UK T&I• NRCC, SDTC, IRAP
Some diversity in board and
management
020406080
100120140160180200
2005
2010
2012
2014
2018
2020
2020
2018
2020
2014
2011
2014
2017
2019
LanzaTech LiquidC ZEGCarbonoRo Svante
Mill
ions
Seed Series A Series B Growth EquityGrant Project Finance Structured Debt Loan
0100200300
0100200300400
Mill
ions
Capital Number of Employees
Acquirer

NZ Ecosystem in Global Context: CCUS – Point Source Capture
201
40%
25%
35%
Overview
R&D-to-commercializationpipeline strength
Connection to demand
5
2
7
8
4
6
7
4
5
9
9
9
New Zealand Sweden Iceland Canada
Evaluation 4.7 6.3 5.6 9
• Strong universities with commercialization support
• Emerging deeptech ecosystem
• U. Auckland, AUT, U Otago commercialization offices
• MacDiarmid Institute R&D collaboration
• LevelTwo has supported several deeptech success stories
• No recent venture investments in sector
• LevelTwo / Icehouse Ventures partnership could boost funding in this area
• Lanzatech transferred to Chicago in 2010 for ‘ease of shipping and doing business’
• Strong decarbonization roadmap
• Low presence of financing• Development through
corporate partnerships
• Chalmers University venture creation company has accelerated 50+ startups
• ISIA created 30 engagements with Indian market
• Ri.Se working with academia and industry for cost-efficient CCS systems
• $2.6m invested in CCUS tech since 2011
• Mainly early-stage funding, relatively small amounts
• Ovik Enerji, Swedish biofuels in project development partnerships
• Vattenfall JV with Aker Carbon Capture
• Swedish industry roadmaps to carbon neutrality provide stable demand signals
• Geothermal resources• Domestic biotech capability • International outlook
• University of Iceland pursues international collaboration
• Technology Development Fund offers startup grants
• $5m invested in CCUS since 2011 (one deal, CRI growth equity)
• Only 3 domestic VC funds, limited angel investors
• CRI partnership with Henan Shuncheng Group for China development
• Reykjavik energy industry partnerships to neutralize emissions
• CRI – Statkraft partnership for commercial scale Norway plant
• Geology favorable for sequestration
• Good availability of financing• Industrial corporates investing in
decarbonization
• BCIT has 200+ technical programmes• Canmet Energy Ottawa runs several
R&D projects to facilitate large scale CCUS deployment
• Alberta Carbon Conversion Technology Centre is a purpose-built demonstration facility
• $402m invested in CCUS since 2011• Svante $100m growth equity, Feb
2021• Equity funding at all stages, debt /
project finance also • Government support at federal &
provincial levels
• Oli & gas corporates recognize need to clean up
• Corporate experience in well-drilling, injecting into geological formations
• Several industry innovation alliances focused on decarbonization
• Shell Canada Energy, Chevron consortium retrofit capture programme (government funded)
2.5
Ability to Lead
Financing strength

Takeaways: CCUS – Point Source Capture
202
Takeaways for NZ Climate Tech Innovators• Establish collaborative research partnerships with public or private
entities
• For point source capture look for industrial emitter partners to supply CO2 – may not be in primary line of business to start, but important to begin testing at the device level
• Many successful ventures involve co-development with utilization partner (off taker) – important to quantify at early stages how big a market tor potential market for the end product of the capture is going to be.
• Think about internationalization from day one – US, China, Canada, EU are going to be critical markets, demonstrating value to incumbents in these countries is critical
Takeaways for NZ Climate Tech Ecosystem• Supportive regulatory environment is essential to allow these
technologies to scale and reach commercial viability
• Significant CAPEX and time to demonstrate pilots, successful companies have accessed national and regional government funding
• Research centres are fundamental to drive continued technology development
• A significant challenge in NZ is that there is a difficulty accessing supply (CO2) and demand (off takers, primarily buyers of alternative fuels). In general, this will be a difficult industry to keep at home, building advantage around point source CCUS capture is most likely to come in the form of value chain efficiencies that promote larger schemes of NZ solutions for alternative energy inputs to production (e.g. geothermal) and production of alternative fuels (e.g. biofuels).

203
Contents
Materials & Chemicals – Comparison between Small Advanced Economies (SAEs)
Materials & Chemicals Analysis
Advanced Materials: Green Building & Construction
Additive Manufacturing for Construction
Industrial Waste to Value
CCUS – Point Source Capture
Surface Technologies
CONTENTS

Nanotechnology Innovation in Small Advanced Economies (SAEs)
204
Nanotechnology Investments (2010 – 2020) and Funded Innovators in SAEs
Funding Raised ($) Number of Companies
Funding Raised ($)
Nanotechnology (excluding Israel) Investments (2010 – 2020) and Funded Innovators in SAEs
Number of Companies

Surface Technologies: Trend Analysis
205
➢ International corporates invest and partner e.g. DENSO and 3M in Canatu
➢ Canatu formed as a spinout from Aarhus University and has since collaborated with Tampere University. Aalto University, Aarhus University, Helsinki University of Tech (TKK) provide talent pipeline
➢ Otanano research platform operated by VTT and Aalto University has track record in commercializing nanotech spinoffs
➢ Grant funding and research support from EU programmes. Finnish Funding Agency for Innovation (TEKES) invests in leading companies directly
Thin film and carbon nanomaterials
Helsinki, Finland
PVD-coatings for fuel cells and other application
Linkoping, Sweden
• Description: Advanced surface technologies and coatings applied to surfaces in order create or improve a material's functionalities, e.g. for corrosion protection, water and ice protection, friction reduction, antifouling properties, self-cleaning, heat and radiation resistance, and thermal management.
• External potential: Coatings are used globally across sectors including automotive, energy, industrial and electronics. Enabler of better batteries and fuel cells, and lighter parts in aerospace and automotive applications.
• Timing: Application for solar e.g. thin film is more developed. Interest in electronics, aerospace/automotive, batteries and fuel cells is growing.
• CO2 reduction potential: Enabling reduction in other applications.
• Environmental impact reduction potential: An innovative PV thin film coating might improve solar PV efficiency by 10%.
External Potential
Timing of Trend
4 3
Example innovators
Summary
Key ClustersFinland
Sweden➢ Local and international corporates investing and partnering e.g. Scania with ANS
➢ Strong talent pipeline from Uppsala University, Linkoping University and KTH
➢ Limited ESO activity
➢ Grant funding and research support from EU programmes including Eurostars

Innovators and Ecosystems: Surface Technologies
206
Fundraising by Year and Type
Company Size (Paid-in Capital and Employees)
Local Participants
External Participants
3
Alignment w/ Strength
Source: Cleantech Group i3 Database
Ecosystem
Emissions Reduction
(Auckland, NZ) Helsinki, FInland
Sweden Netherlands Boston, USASweden
Nanoparticle additives and coatings
thin film and carbon nanomaterials
low-friction coatingsPVD-coatings for fuel
cells and other application
Engineering coatings, solar, and sensor
solutionsProtective nanocoatings
Incubators / Accelerators
Grants
Angel Financing
Equity Financing
Debt Financing
Customers
Talent Pipelines
Partnerships
Diversity in mgmt. / ownership
• The University of Auckland
• Aalto University, Aarhus University, Helsinki University of Tech. (TKK)
• Uppsala University, Linkoping University
• KTH
• Linkoping University • TU Delft (majority) • MIT, Northeastern University, University of Iowa
• University of Auckland • Faurecia• Tampere University of
Technology
• Ford, Sunnen• Scania
• Hyundai Motor• NET (China)
• Kusumoto Chemicals• NSG Pilkington
• Henkel
• 5 unnamed blue-chip clients
• Denso (licensing) • ‘Major automotive OEM’
• Beijing Shouhang Resources Saving
• ABM Composites• Daikin Industries, ECO
Group
• Tesla, Ford• LG
• European Investment Bank
• Swedish Energy Agency
• Undisclosed participant
• Powerhouse Ventures (Christchurch)
• Tekes (Finalnd)• Denso , 3M New
Ventures , Faurecia Ventures
• BASF Venture Capital , Fouriertransform,
• Attentus Göteborg
• Hyundai Motor• Clean-Tech Real Estate
Consortium • Timeless Investments
, Shape Capital ,
• Material Impact Fund• Ireon Ventures,
Henkel Tech Ventures, Emerald Technology Ventures
• UniServices, K1W1, ICE Angels
• Aarhus University • Sixth Swedish National Pension Fund
• Undisclosed participants (2013)
• Callaghan Innovation • Techleap
• Callaghan Innovation• Horizon 2020• Business Finland • Eurostars • Eurostars SME
programme (2015)• Climate-KIC• EASME
16%
PVD= physical vapor deposition
• Plug and Play Tech Center
• Coen van Oostrom, Daan van der Vorm
0
5
10
15
20
25
30
2017 2019 2010 2014 2017 2009 2017 2019 2018 2013 2020
Cirrus Canatu ANS ImpactPhyseeActnano
Mill
ions
Seed Series A Series BGrowth Equity Grant UndisclosedLoan Structured Debt PIPE
0
20
40
60
020406080
Mill
ions
Capital Number of Employees
Acquirer

NZ Ecosystem in Global Context: Surface Technologies
207
40%
25%
35%
Overview
R&D-to-commercializationpipeline strength
Connection to demand
7
5
7
9
9
7
9
5
7
9
8
9
New Zealand Finland Sweden Massachusetts, USA
Evaluation 6.5 8.3 7.7 8.8
• Talent pipeline and research from Auckland university. National equity and grant funding support. Global partnerships
• University of Auckland active in research. Cirrus Materials founded on research from UoA
• Callaghan innovation provides research grants. Funded Cirrus research on Surface Finishing
• $100k invested in 1 company since 2011*
• Limited number of innovators and investment across the investment cycle
• Cirrus Materials has joint R&D development in 24 locations. 5 (unnamed) blue chip clients
• Talent pipeline and research from several universities. Strong equity fundraising. Global partnerships and investment. Access to EU grant funding
• Aalto, Helsinki and Tampere Universities leading research.
• AoF and Sitra provide research and innovation funding
• National venture ESOs. Some with Cleantech focus.
• Innovators access EU funding and specialized ESOs
• $122M invested in 4 companies since 2011
• Canatu raised $17M in 2019 Picosun raised $14M in 2019
• Recent funding in growth equity stage (external funders)
• Innovators accessing external customers and partnerships
• Denso partnered and invested in Canatu in 2019. 3M also invested.
• Talent pipeline and research from Linkoping and Uppsala Universities. Global partnerships and investment. Access to EU grant funding
• Linkoping University and Uppsala University source of innovation. Impact Coatings (LU) and ANS (UU) founded on research
• Innovators access EU funding e.g. Eurostars grants for Impact Coatings and ANS
• $2.5M+ invested in 2 companies since 2011*
• Applied Nano Surfaces raised an undisclosed amount of growth equity in 2017
• Innovators accessing external customers and partnerships
• BASF invested in ANS in 2017. A ‘major automotive OEM’ became a customers in 2021
• Hyundai partnered and invested an undisclosed amount in Impact Coatings in 2019.
• Talent pipeline and research from MIT. Global partnerships and investment. Leading incubators
• MIT source of innovation and talent. Actnano founded MIT-led technology hub in Boston in 2018
• Access to national grant funding from NSF and others
• Innovators accessing national accelerators including Plug and Play e.g.Metalmark Innovations
• $63M invested in 5 companies 2011*
• Actnano raised $12M in 2020 (external/internal)
• Recent funding in seed and series A stages
• Actnano has had global presence (China and South Korea) since 2017. Henkel partnered and invested in 2020. PTT is also an investor via GC ventures
• Henkel partnered and invested in NBD Nano in 2017. BASF has also invested
3
Ability to Lead
Financing strength
**Some funding not included e.g. for Impact Coatings is now public but has attracted 2 funding rounds since 2019 ($14.6M + $undisclosed)
*Some funding likely undisclosed e.g. funding in Cirrus from Uniservices

Takeaways: Surface Technologies
208
Takeaways for NZ Climate Tech Innovators• External funding in this area tends to be specialized & global,
consider international as well as domestic financing
• Investors are materials specialists / experts (e.g. Canatu/3M New Ventures)
• Develop partnerships with chemicals / materials companies to validate technology and refine use cases
Takeaways for NZ Climate Tech Ecosystem• R&D funding for research institutes and university programmes to
keep up with technological developments
• Promote demand-led development through challenge programmes
• Ensure university curricula are developing skills for the future

Cleantech Group
San Francisco600 California Street, Floor 11,San Francisco, CA 94108 United States
+1 (415) [email protected]
Cleantech Group Europe Ltd5 New Street Square, London EC4A 3TW United Kingdom
+44 (0) [email protected]
cleantech.com