BTEC Level 3 Subsidiary Diploma in Production Arts Make-up Unit 95 Changing Gender.
Upload
nguyennguyetCategory
view
213download
0
Executive Summary FAS GEC Climate Survey July, 2012 1
New York University Faculty of Arts and Science Gender Equity Committee
Worklife Climate Survey Executive Summary Spring, 2012
To: Dean Tom Carew, FAS Members of the FAS Dean’s Advisory Committee on Policy and Planning From: FAS Gender Equity Committee 11/12 AY P&P members: Carol Shoshkes Reiss (chair), David Poeppel, Lawrence Mead WFC members: Sydney C. Ludvigson, Madeline Heilman, Shara E. Bailey FAS Office of Institutional Research: David Vintinner, Rachel Krug External Specialists: Vicki J. Rosser, Nathan Slife, U. Nevada Las Vegas History: In response to a request from the GEC in the 2010 report to Acting Dean Jess Benhabib authorized the solicitation of proposals for a Climate Survey from outside experts in the field. Three groups responded. After discussions and consideration, the proposal of Dr. Vicki J. Rosser, University of Nevada at Las Vegas was selected. The GEC developed a series of questions with the input of Dr Rosser during the Fall term, 2011, and the questionnaire was submitted to the Institutional Review Board for approval. It was administered during the early Spring semester, 2012 to FAS Tenure Track and Tenured faculty members who had been at NYU for at least one academic year. Data were analyzed and our report was developed in late May and early June, 2012. It should be noted that the timing of the survey coincided with one of the most polarized periods of faculty and administration in recent years. Demographics: The response to the request to complete the survey was strong, with 48% of the 673 eligible faculty members completing surveys. Of the respondents, 37% self-identified as female, a higher frequency then their distribution in the pool (~29%). 74% of the faculty self-identified as Caucasian, with ~12% indicating a minority group affiliation. The distribution of responses among the ranks of faculty reflected their relative presence in the FAS faculty. Survey questions: Qualitative Data and Open-ended Optional comments in response to the following questions were analyzed. Answers were recorded on a scale of 1 to 5, with “1” indicating the most negative response and “5” indicating the most positive sentiment. For some questions, the language of the query led
Executive Summary FAS GEC Climate Survey July, 2012 2
to “reverse coding” of the response, where “1” was designated the most positive reply, these exceptions are noted in the tables and narrative. 1. How do faculty members perceive the quality of their institutional and professional worklife at NYU? 2. Are there differences in the quality of FAS institutional and professional worklife by: 1) academic division (i.e., Humanities, Sciences, and Social Sciences), or 2) faculty demographics (i.e., sex, race/ethnicity, and academic rank)? 3. How do faculty members perceive the NYU 2031construction plans by academic division and faculty demographics? 4. How do faculty members perceive their “voice” in university relations by academic division and faculty demographics? 5. What is the current level of faculty satisfaction? Are there differences in job satisfaction by academic division or faculty demographics? 6. What is the current level of faculty morale? Are there differences in morale by academic division or faculty demographics? 7. How likely are the faculty to leave (i.e., intended departure) their position, career, or institution? Are there differences in intended departure by academic division or faculty demographics? 8. What themes emerge from respondents’ representative open-ended comments regarding FAS professional and institutional issues, intra-and inter-department relations, and personal factors/responsibilities? Findings: In general, relations among faculty members, between faculty members and their chairs/department, their research and their teaching assignments were moderately to strongly positive. Faculty felt they had a voice in their department and enjoyed a good standard of living. On the personal side, faculty expressed the need for university-provided childcare (both daycare and preschool) and concern over the limitations of available Faculty Housing and the cost of non-university housing options. There were concerns expressed about the lack of transparency in the promotion and tenure process. There were some very strongly negative feelings expressed about both faculty voice in university decisions, the Global Network, FAR4, the merit salary process, and concerns about the need to obtain outside offers to "game the system" and get raises or other perks such as improved housing, and especially about the proposed NYU 2031 plans.
Executive Summary FAS GEC Climate Survey July, 2012 3
Distinctions between groups of faculty: Gender: In many areas (Service, Compensation, Diversity in recruitment, Interpersonal relations, Family responsibilities, NYU2031, a Voice in University relations, and Morale), female faculty members were less positive than their male colleagues. In each of the above areas where the faculty feels on average negative, women feel more negative than do men, sometimes by a large margin, as discussed below. We find this gender gap in responses to be one of several significant problem areas for NYU. Associate Professors were less positive than more junior and more senior colleagues in Teaching, Service, Tenure, Compensation, Diversity in recruitment, Department voice, Interpersonal relations, Satisfaction, Morale, and more likely to leave NYU. Both Assistant and Associate Professors were more dissatisfied than more senior faculty about Housing and Family responsibilities. Faculty members in Humanities departments reported the lowest morale among the divisions, and were less satisfied in response to questions about Salary, Benefits and Standard of living. Non-white faculty members reported more often an unwelcoming tension between personal and professional activities. Their professional accomplishments and teaching/service contributions in their units were perceived as being more likely to be overlooked. Lack of consensus: Responses to questions on some issues revealed an extreme lack of consensus. These included the benefits of loan packages for the purchase of housing, the belief that there are "special deals" in teaching, and satisfaction with university support for graduate students. The full analysis of data prepared by Dr Rosser with input from the GEC, the survey questions (Appendix #1) and eight additional appendices with statistical analyses of the data follow this Executive Summary. Bright Spots about NYU in the Survey
The faculty feels positive about matters that are largely under the control of the individual or department, such as teaching and research and relations among colleagues. Relations among faculty are also primarily influenced by individuals in one’s immediate work environment, rather than by the university administration. The faculty feels positively about:
Teaching: Faculty generally feel good about their teaching (Table 2, and item 2, page 30); they are able to teach the courses they want and they feel that their undergraduate teaching load is appropriate (item 4, overall mean 4.21). Department/Unit Relations: Faculty generally feel they are treated with respect by their department chair (items 62 and 63, page 33, overall means 4.23 and 4.08, respectively), that they fit in intellectually (item 64, overall mean 4.02), that they
Executive Summary FAS GEC Climate Survey July, 2012 4
can voice their opinions in their department (item 66, overall mean 3.91), and relations within the department are collegial (item 65, overall mean 3.92). Job Satisfaction: Faculty feel intellectually stimulated by their work (item 106, page 35), are enthusiastic about it (item 105), and have enough autonomy to do the work they want to do (item 107). The answers to these questions are the most positive in the survey as a whole, for item 106 the overall mean of 4.54, for item 107 overall mean 4.52, for item 105 overall mean 4.41, and for item 108 overall mean 4.25 (page 36, Appendix 6).
Problem Areas For NYU in the Survey The faculty feels more negative about matters that are largely under the control of the University or that pertain to interactions (or lack thereof) with the University administration. These include: Compensation/salary issues: Both men and women feel more negative than the midpoint about compensation (Table 3), but women feel more negative than men. Faculty members feel negative about the annual raises and merit review process (items 31 and 32 on page 32—salary increases have on average been out-paced by inflation for the past 9 years). Questions about the role of outside offers in keeping salaries from sliding over time contributed the strongest influence on dissatisfaction. Faculty members agree strongly with the statement that they must continually seek outside offers to increase their salary significantly (items 33 and 34), resulting in very low average scores on these questions, equal to 1.78 and 1.47, respectively. These are the two lowest mean scores of the 119 items in the survey. They also feel that long-time faculty members have fallen behind in salary (item 38) with average score of 1.85 (4th lowest score). Outside offer issues also arise as a major theme in the open-ended comments: faculty feel they must get to the point where they are unhappy and seriously consider leaving in order to keep real salaries from eroding. We should emphasize that, in each of these areas, women feel more negatively than do men. Responses to items 33 and 34 in particular show that women feel more negatively impacted by the policy of raising salaries above the standard Merit pool only when a faculty member presents a credible offer to leave NYU. But from the answers to item 35, “I believe NYU would make a counteroffer to keep me, if I have an offer elsewhere,” we see that this discrepancy is not attributable to a gender difference in perception about counteroffers. Moreover, it is also not attributable to a reported difference in intention to leave NYU (item 118). Indeed, according to item 118, both women and men, in about the same proportion, say that they are unlikely to leave NYU. It follows that the discrepancy must be explained by a gender gap in the degree of discomfort with a system that requires an individual to seriously entertain outside offers in

Executive Summary FAS GEC Climate Survey July, 2012 5
order to keep salaries rising—even when that individual has no true interest in relocating. This result may also be related to the large gender gap displayed in the answer to item 38 “Long time faculty members have unfairly fallen behind in salary,” where women averaged a much lower value of 1.85 versus 2.44 for men (page 32). (That is, women agreed with this statement more often than did men.) Faculty Consultation/Faculty Governance in University Decision Making: There is only one question on this matter, item 61, “Faculty members are not given enough voice in university decisions.” For this question the scale was 1 to 5 with “1” indicating high concern/low agreement and “5” indicating low concern/high agreement. The overall mean for this item is 1.82, which is the third most negative item in the survey (tied with that of the NYU2031 question), of the 119 total items. Thus the faculty feels quite negative, by an amount well below the midpoint, that they do not have enough “voice” in university decisions. This sentiment is also reflected in the open-ended comments where there were a large number of responses (14) about “university autocratic decision-making.” By a large margin, women feel that they have even less voice in university decisions than do men, with an average score of 1.65 for women versus 1.94 for men (page 33). Although unintentional, the survey was distributed during a period when historical norms of faculty-administration relations were disrupted by unprecedented concerns about the proposed expansion of the university (NYU 2031) and Protection Service’s Travelers policy. Family Responsibilities: Women feel more negative than the midpoint about how dependent care/family responsibilities (Table 5) are affecting their careers, while men feel more positive than the midpoint. This category pertains to items 95, 96, 99 and 101-103 of the survey. Apparently, item 97 “Availability of daycare for preschool children is inadequate” was omitted from this category (and doesn’t appear in any of the 14 climate dimensions). Yet it should not be overlooked, since there was strong agreement with this sentiment, more so by women than men. Notice that this item was not reverse coded, even though to be consistent with the treatment elsewhere (where an item is reverse coded if a higher numerical score indicates greater agreement with a negative sentiment) it should have been. There are also strong gender differences in the answer to item 102 “Caregiving responsibilities for my children have slowed my career progression,” with women agreeing more often (mean score of 2.16) than men (mean score 2.94). NYU 2031: The single question on NYU2031 (item 94 “I am concerned about the NYU2031 construction plans for Washington Square Village and Silver Towers/Coles”) is tied for third most negative of the 119 items with an overall mean of 1.82 (page 35). Women feel significantly more negatively than do men about NYU2031, with mean score of 1.57 for women versus 2.00 for men.
Executive Summary FAS GEC Climate Survey July, 2012 6
Negative feelings about NYU2031 dominate the open-ended questions as well, with a total of 58 comments expressing concern about NYU2031 (5 under the category of “professional issues,” 38 under the category of “personal factors/responsibilities,” and 15 under “additional” open-ended comments.) Morale: While the overall score for “morale” (Table 7) is above the midpoint for both men and women, women report lower morale than men. A closer examination of the items that make up this category (items 109-115, page 37 Appendix 7) is instructive. The most positive aspects of “morale” pertain to “sharing a common purpose with my colleagues” (item 115), “NYU supports my scholarly goals” (item 112), and “I am loyal to NYU” (item 109). These questions may well reflect the autonomous work experience, rather than morale pertaining to University administration/leadership. On questions more related to the latter category, i.e., “NYU values the faculty” (item 111) and “This is a fair institution,” (item 113), the overall mean is below the midpoint, with women substantially more negative than men (2.71 versus 3.08 on item 111, and 2.55 versus 3.08 on item 113). Promotion and Tenure issues: Although both women and men recorded responses that averaged above the midpoint on tenure and promotion issues (Table 2), we list this as a problem area because women feel less positive about tenure and promotion than do men. This category pertains to items 24-29, page 32. In fact, women feel more negative than the midpoint on the question of whether their department mentors them (item 24), whereas men feel (slightly) more positive than the midpoint. Women feel less positive about fairness in tenure (item 26), they less often agree with the statement that they are “provided constructive feedback” (item 27), they feel less confident they will be promoted (item 28), and are less likely to know what is necessary to be promoted to full professor (item 29). Thus, even though the overall score is positive, there are some disconcerting gender gaps here. Global Network University: Open-ended comments are negative about the “global university” paradigm—see 10 comments under “Additional” open-ended comments. In summary, most FAS faculty members are happy with their autonomous work experience, and with their departments, chairs, and working conditions. However, there are serious concerns in several areas, including salary fairness, housing, NYU 2031, and university governance that require attention. Feelings both positive and negative sometimes differ by gender and minority status in important ways, with women and minorities less satisfied then men. In terms of faculty ranks, Associate Professors are less satisfied then are other tenured or tenure-track faculty.

FACULTY OF ARTS AND SCIENCE WORKLIFE CLIMATE SURVEY
NEW YORK UNIVERSITY
Sponsored by the
Gender Equity Committee
Carol Shoshkes Reiss, David Poeppel, Lawrence Mead (P&P)
Sydney C. Ludvigson, Shara E. Bailey, Madeline Heilman (WFC)
Ex-officio: David Vintinner, Rachel Krug (OIR)
Conducted by
Vicki J. Rosser, Professor & Principal Investigator
Nathan M. Slife, Project Assistant
May, 2012
1
FACULTY OF ARTS AND SCIENCE WORKLIFE CLIMATE SURVEY
NEW YORK UNIVERSITY
Summary of the Findings
In the spring of 2012, the Faculty of Arts and Science (FAS) Gender Equity Committee (GEC)
sponsored a survey to measure the quality of institutional and professional worklife (climate) of
the FAS at New York University. The instrument was adapted from a satisfaction, morale, and
departure survey conducted at other postsecondary institutions and state-wide systems. The
instrument was pilot tested by the GEC and revised to reflect the concerns of the FAS affiliated
with each of the three academic divisions (i.e., Humanities, Sciences, and Social Sciences).
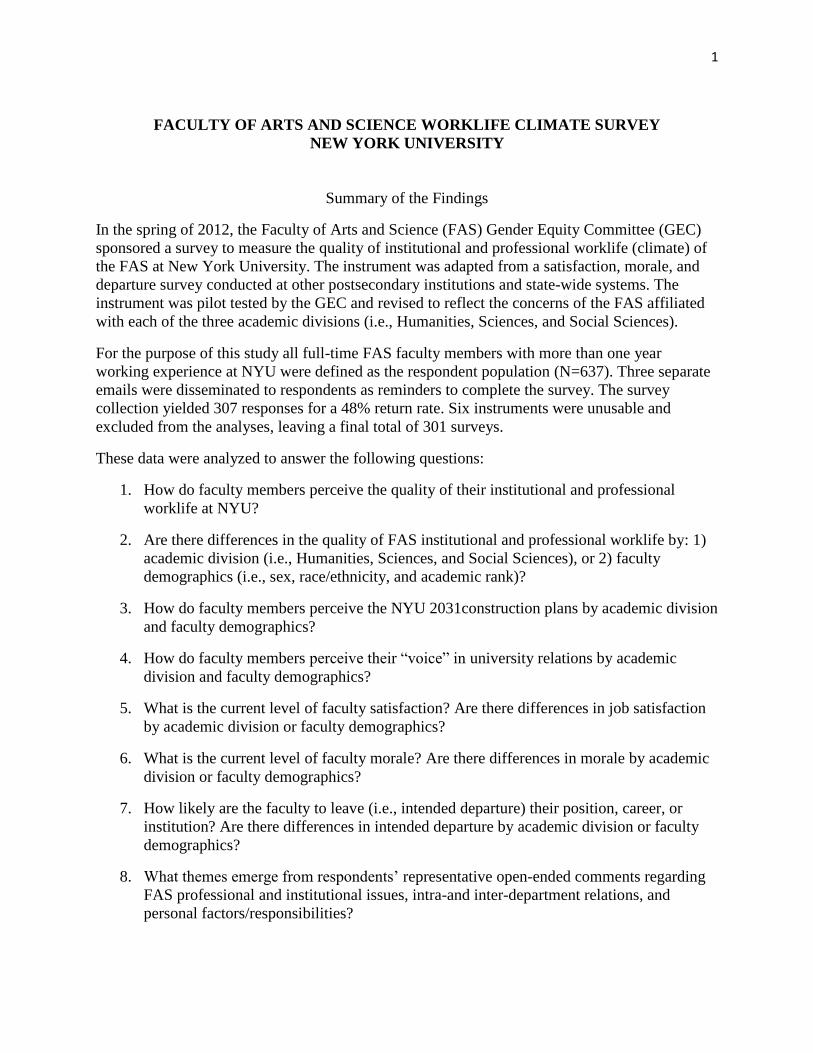
For the purpose of this study all full-time FAS faculty members with more than one year
working experience at NYU were defined as the respondent population (N=637). Three separate
emails were disseminated to respondents as reminders to complete the survey. The survey
collection yielded 307 responses for a 48% return rate. Six instruments were unusable and
excluded from the analyses, leaving a final total of 301 surveys.
These data were analyzed to answer the following questions:
1. How do faculty members perceive the quality of their institutional and professional
worklife at NYU?
2. Are there differences in the quality of FAS institutional and professional worklife by: 1)
academic division (i.e., Humanities, Sciences, and Social Sciences), or 2) faculty
demographics (i.e., sex, race/ethnicity, and academic rank)?
3. How do faculty members perceive the NYU 2031construction plans by academic division
and faculty demographics?
4. How do faculty members perceive their “voice” in university relations by academic
division and faculty demographics?
5. What is the current level of faculty satisfaction? Are there differences in job satisfaction
by academic division or faculty demographics?
6. What is the current level of faculty morale? Are there differences in morale by academic
division or faculty demographics?
7. How likely are the faculty to leave (i.e., intended departure) their position, career, or
institution? Are there differences in intended departure by academic division or faculty
demographics?
8. What themes emerge from respondents’ representative open-ended comments regarding
FAS professional and institutional issues, intra-and inter-department relations, and
personal factors/responsibilities?
2
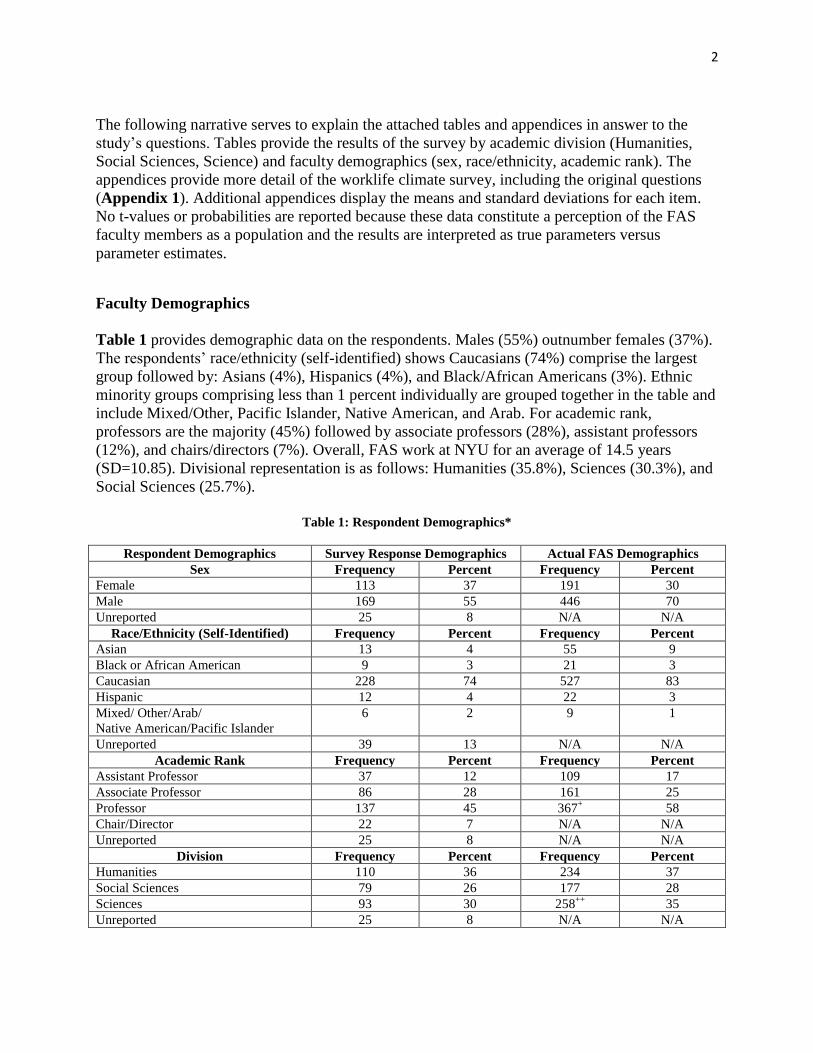
The following narrative serves to explain the attached tables and appendices in answer to the
study’s questions. Tables provide the results of the survey by academic division (Humanities,
Social Sciences, Science) and faculty demographics (sex, race/ethnicity, academic rank). The
appendices provide more detail of the worklife climate survey, including the original questions
(Appendix 1). Additional appendices display the means and standard deviations for each item.
No t-values or probabilities are reported because these data constitute a perception of the FAS
faculty members as a population and the results are interpreted as true parameters versus
parameter estimates.
Faculty Demographics
Table 1 provides demographic data on the respondents. Males (55%) outnumber females (37%).
The respondents’ race/ethnicity (self-identified) shows Caucasians (74%) comprise the largest
group followed by: Asians (4%), Hispanics (4%), and Black/African Americans (3%). Ethnic
minority groups comprising less than 1 percent individually are grouped together in the table and
include Mixed/Other, Pacific Islander, Native American, and Arab. For academic rank,
professors are the majority (45%) followed by associate professors (28%), assistant professors
(12%), and chairs/directors (7%). Overall, FAS work at NYU for an average of 14.5 years
(SD=10.85). Divisional representation is as follows: Humanities (35.8%), Sciences (30.3%), and
Social Sciences (25.7%).
Table 1: Respondent Demographics*
Respondent Demographics Survey Response Demographics Actual FAS Demographics
Sex Frequency Percent Frequency Percent
Female 113 37 191 30
Male 169 55 446 70
Unreported 25 8 N/A N/A
Race/Ethnicity (Self-Identified) Frequency Percent Frequency Percent
Asian 13 4 55 9
Black or African American 9 3 21 3
Caucasian 228 74 527 83
Hispanic 12 4 22 3
Mixed/ Other/Arab/
Native American/Pacific Islander
6 2 9 1
Unreported 39 13 N/A N/A
Academic Rank Frequency Percent Frequency Percent
Assistant Professor 37 12 109 17
Associate Professor 86 28 161 25
Professor 137 45 367+ 58
Chair/Director 22 7 N/A N/A
Unreported 25 8 N/A N/A
Division Frequency Percent Frequency Percent
Humanities 110 36 234 37
Social Sciences 79 26 177 28
Sciences 93 30 258++
35
Unreported 25 8 N/A N/A
3
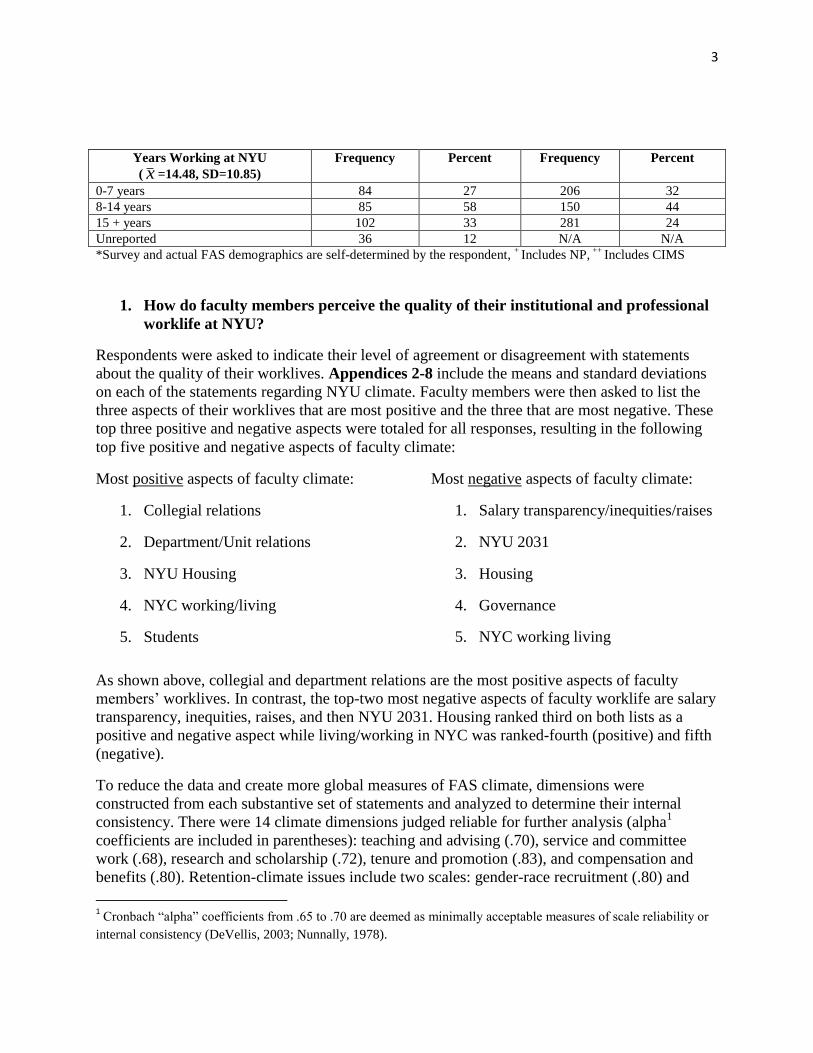
Years Working at NYU
( x =14.48, SD=10.85)
Frequency Percent Frequency Percent
0-7 years 84 27 206 32
8-14 years 85 58 150 44
15 + years 102 33 281 24
Unreported 36 12 N/A N/A
*Survey and actual FAS demographics are self-determined by the respondent, +
Includes NP, ++
Includes CIMS
1. How do faculty members perceive the quality of their institutional and professional
worklife at NYU?
Respondents were asked to indicate their level of agreement or disagreement with statements
about the quality of their worklives. Appendices 2-8 include the means and standard deviations
on each of the statements regarding NYU climate. Faculty members were then asked to list the
three aspects of their worklives that are most positive and the three that are most negative. These
top three positive and negative aspects were totaled for all responses, resulting in the following
top five positive and negative aspects of faculty climate:
Most positive aspects of faculty climate:
1. Collegial relations
2. Department/Unit relations
3. NYU Housing
4. NYC working/living
5. Students
Most negative aspects of faculty climate:
1. Salary transparency/inequities/raises
2. NYU 2031
3. Housing
4. Governance
5. NYC working living
As shown above, collegial and department relations are the most positive aspects of faculty
members’ worklives. In contrast, the top-two most negative aspects of faculty worklife are salary
transparency, inequities, raises, and then NYU 2031. Housing ranked third on both lists as a
positive and negative aspect while living/working in NYC was ranked-fourth (positive) and fifth
(negative).
To reduce the data and create more global measures of FAS climate, dimensions were
constructed from each substantive set of statements and analyzed to determine their internal
consistency. There were 14 climate dimensions judged reliable for further analysis (alpha1
coefficients are included in parentheses): teaching and advising (.70), service and committee
work (.68), research and scholarship (.72), tenure and promotion (.83), and compensation and
benefits (.80). Retention-climate issues include two scales: gender-race recruitment (.80) and
1 Cronbach “alpha” coefficients from .65 to .70 are deemed as minimally acceptable measures of scale reliability or
internal consistency (DeVellis, 2003; Nunnally, 1978).
4
gender-race issues (.79). Inter-and intra-department relations consist of four scales: university
relations renamed to inter-department relations (.70), department relations (.84), department
voice (.79), and interpersonal relations (.86). There are two personal dimensions that were also
judged as reliable: housing (.75) and dependent family responsibilities (.71). While the standard
of living personal dimension (.57) alpha was low, the dimension was retained. Appendix 9
provides a more refined breakdown of the 14 climate dimensions, satisfaction, morale, and
intended departure dimensions.
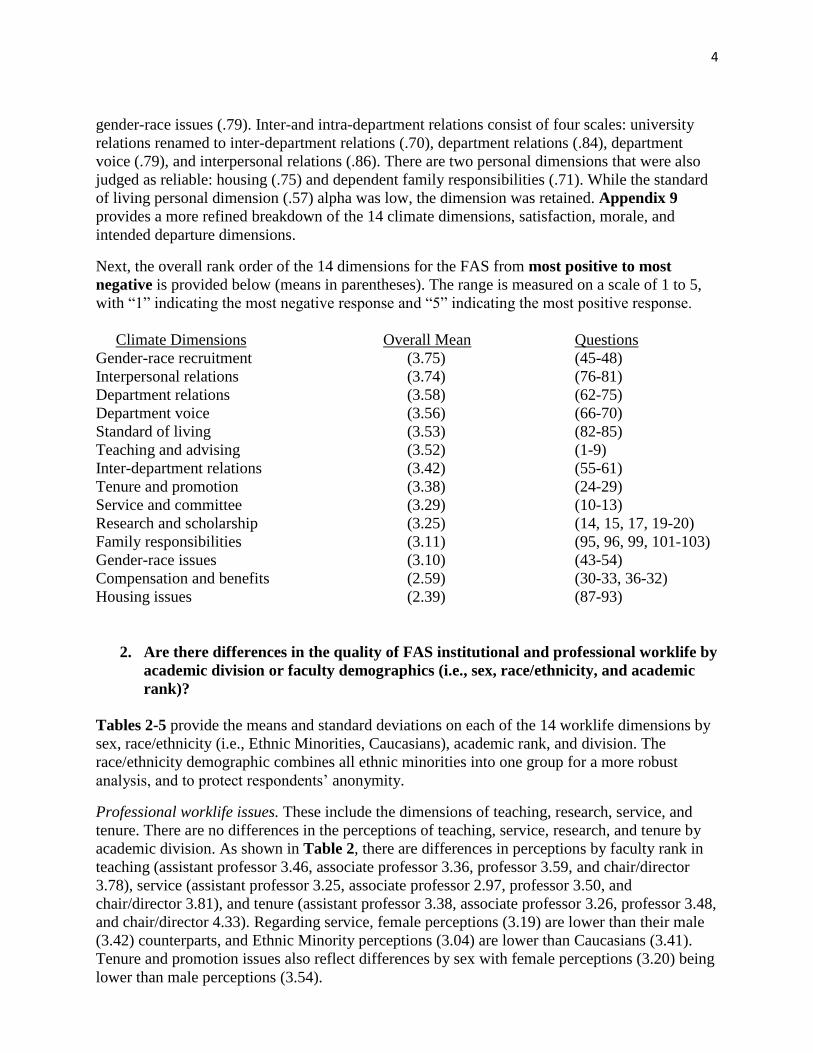
Next, the overall rank order of the 14 dimensions for the FAS from most positive to most
negative is provided below (means in parentheses). The range is measured on a scale of 1 to 5,
with “1” indicating the most negative response and “5” indicating the most positive response.
Climate Dimensions Overall Mean Questions
Gender-race recruitment (3.75) (45-48)
Interpersonal relations (3.74) (76-81)
Department relations (3.58) (62-75)
Department voice (3.56) (66-70)
Standard of living (3.53) (82-85)
Teaching and advising (3.52) (1-9)
Inter-department relations (3.42) (55-61)
Tenure and promotion (3.38) (24-29)
Service and committee (3.29) (10-13)
Research and scholarship (3.25) (14, 15, 17, 19-20)
Family responsibilities (3.11) (95, 96, 99, 101-103)
Gender-race issues (3.10) (43-54)
Compensation and benefits (2.59) (30-33, 36-32)
Housing issues (2.39) (87-93)
2. Are there differences in the quality of FAS institutional and professional worklife by
academic division or faculty demographics (i.e., sex, race/ethnicity, and academic
rank)?
Tables 2-5 provide the means and standard deviations on each of the 14 worklife dimensions by
sex, race/ethnicity (i.e., Ethnic Minorities, Caucasians), academic rank, and division. The
race/ethnicity demographic combines all ethnic minorities into one group for a more robust
analysis, and to protect respondents’ anonymity.
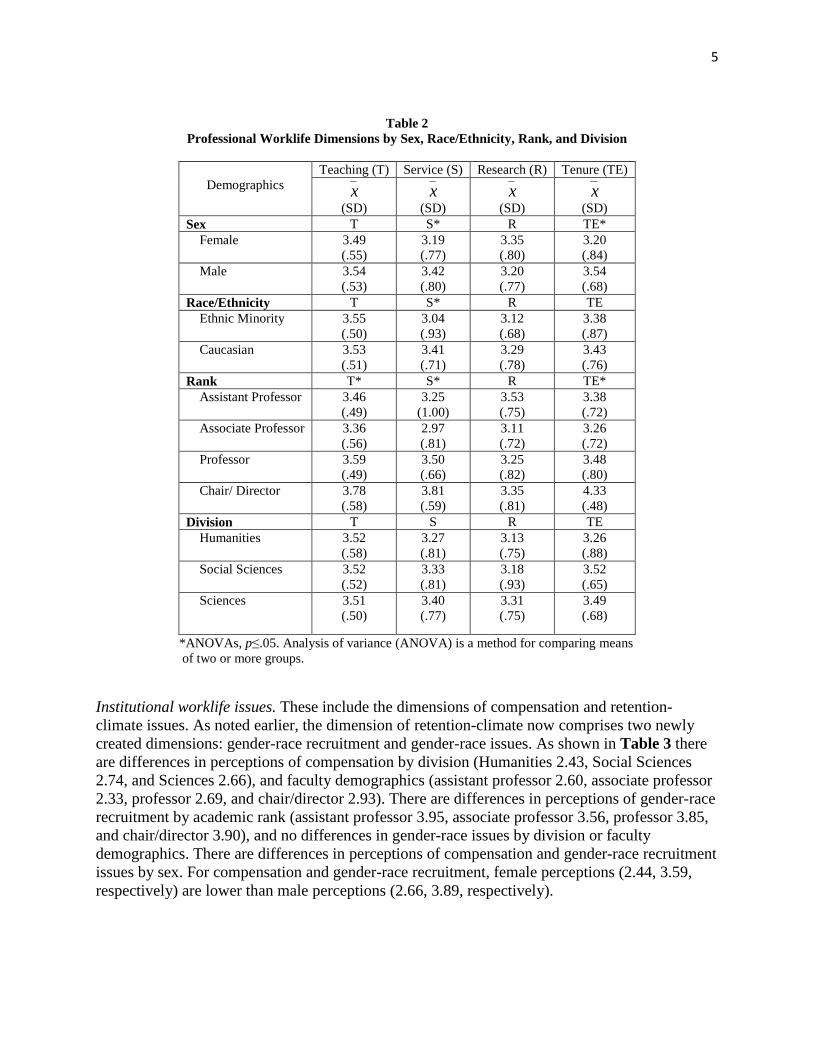
Professional worklife issues. These include the dimensions of teaching, research, service, and
tenure. There are no differences in the perceptions of teaching, service, research, and tenure by
academic division. As shown in Table 2, there are differences in perceptions by faculty rank in
teaching (assistant professor 3.46, associate professor 3.36, professor 3.59, and chair/director
3.78), service (assistant professor 3.25, associate professor 2.97, professor 3.50, and
chair/director 3.81), and tenure (assistant professor 3.38, associate professor 3.26, professor 3.48,
and chair/director 4.33). Regarding service, female perceptions (3.19) are lower than their male
(3.42) counterparts, and Ethnic Minority perceptions (3.04) are lower than Caucasians (3.41).
Tenure and promotion issues also reflect differences by sex with female perceptions (3.20) being
lower than male perceptions (3.54).
5
Table 2
Professional Worklife Dimensions by Sex, Race/Ethnicity, Rank, and Division
*ANOVAs, p≤.05. Analysis of variance (ANOVA) is a method for comparing means
of two or more groups.
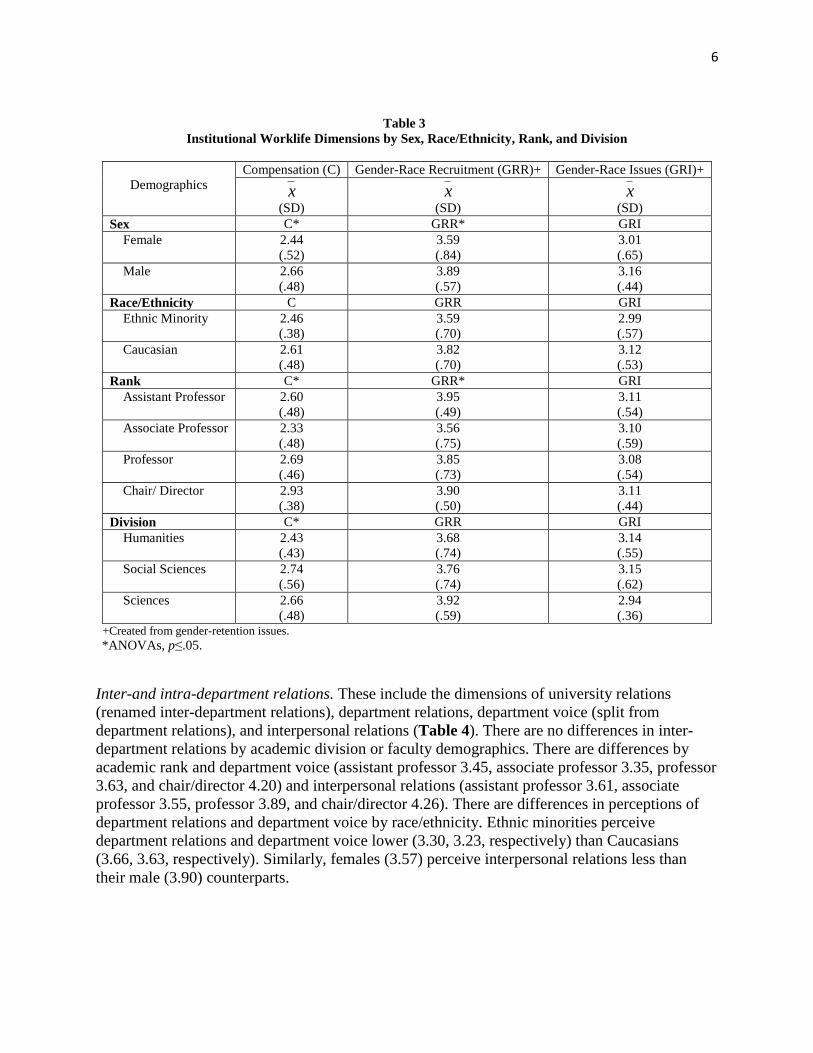
Institutional worklife issues. These include the dimensions of compensation and retention-
climate issues. As noted earlier, the dimension of retention-climate now comprises two newly
created dimensions: gender-race recruitment and gender-race issues. As shown in Table 3 there
are differences in perceptions of compensation by division (Humanities 2.43, Social Sciences
2.74, and Sciences 2.66), and faculty demographics (assistant professor 2.60, associate professor
2.33, professor 2.69, and chair/director 2.93). There are differences in perceptions of gender-race
recruitment by academic rank (assistant professor 3.95, associate professor 3.56, professor 3.85,
and chair/director 3.90), and no differences in gender-race issues by division or faculty
demographics. There are differences in perceptions of compensation and gender-race recruitment
issues by sex. For compensation and gender-race recruitment, female perceptions (2.44, 3.59,
respectively) are lower than male perceptions (2.66, 3.89, respectively).
Demographics
Teaching (T) Service (S) Research (R) Tenure (TE)
x
(SD)
x
(SD)
x
(SD)
x
(SD)
Sex T S* R TE*
Female 3.49
(.55)
3.19
(.77)
3.35
(.80)
3.20
(.84)
Male 3.54
(.53)
3.42
(.80)
3.20
(.77)
3.54
(.68)
Race/Ethnicity T S* R TE
Ethnic Minority 3.55
(.50)
3.04
(.93)
3.12
(.68)
3.38
(.87)
Caucasian 3.53
(.51)
3.41
(.71)
3.29
(.78)
3.43
(.76)
Rank T* S* R TE*
Assistant Professor 3.46
(.49)
3.25
(1.00)
3.53
(.75)
3.38
(.72)
Associate Professor 3.36
(.56)
2.97
(.81)
3.11
(.72)
3.26
(.72)
Professor 3.59
(.49)
3.50
(.66)
3.25
(.82)
3.48
(.80)
Chair/ Director 3.78
(.58)
3.81
(.59)
3.35
(.81)
4.33
(.48)
Division T S R TE
Humanities 3.52
(.58)
3.27
(.81)
3.13
(.75)
3.26
(.88)
Social Sciences 3.52
(.52)
3.33
(.81)
3.18
(.93)
3.52
(.65)
Sciences 3.51
(.50)
3.40
(.77)
3.31
(.75)
3.49
(.68)
6
Table 3
Institutional Worklife Dimensions by Sex, Race/Ethnicity, Rank, and Division
Demographics
Compensation (C) Gender-Race Recruitment (GRR)+ Gender-Race Issues (GRI)+
x
(SD)
x
(SD)
x
(SD)
Sex C* GRR* GRI
Female 2.44
(.52)
3.59
(.84)
3.01
(.65)
Male 2.66
(.48)
3.89
(.57)
3.16
(.44)
Race/Ethnicity C GRR GRI
Ethnic Minority 2.46
(.38)
3.59
(.70)
2.99
(.57)
Caucasian 2.61
(.48)
3.82
(.70)
3.12
(.53)
Rank C* GRR* GRI
Assistant Professor 2.60
(.48)
3.95
(.49)
3.11
(.54)
Associate Professor 2.33
(.48)
3.56
(.75)
3.10
(.59)
Professor 2.69
(.46)
3.85
(.73)
3.08
(.54)
Chair/ Director 2.93
(.38)
3.90
(.50)
3.11
(.44)
Division C* GRR GRI
Humanities 2.43
(.43)
3.68
(.74)
3.14
(.55)
Social Sciences 2.74
(.56)
3.76
(.74)
3.15
(.62)
Sciences 2.66
(.48)
3.92
(.59)
2.94
(.36) +Created from gender-retention issues.
*ANOVAs, p≤.05.
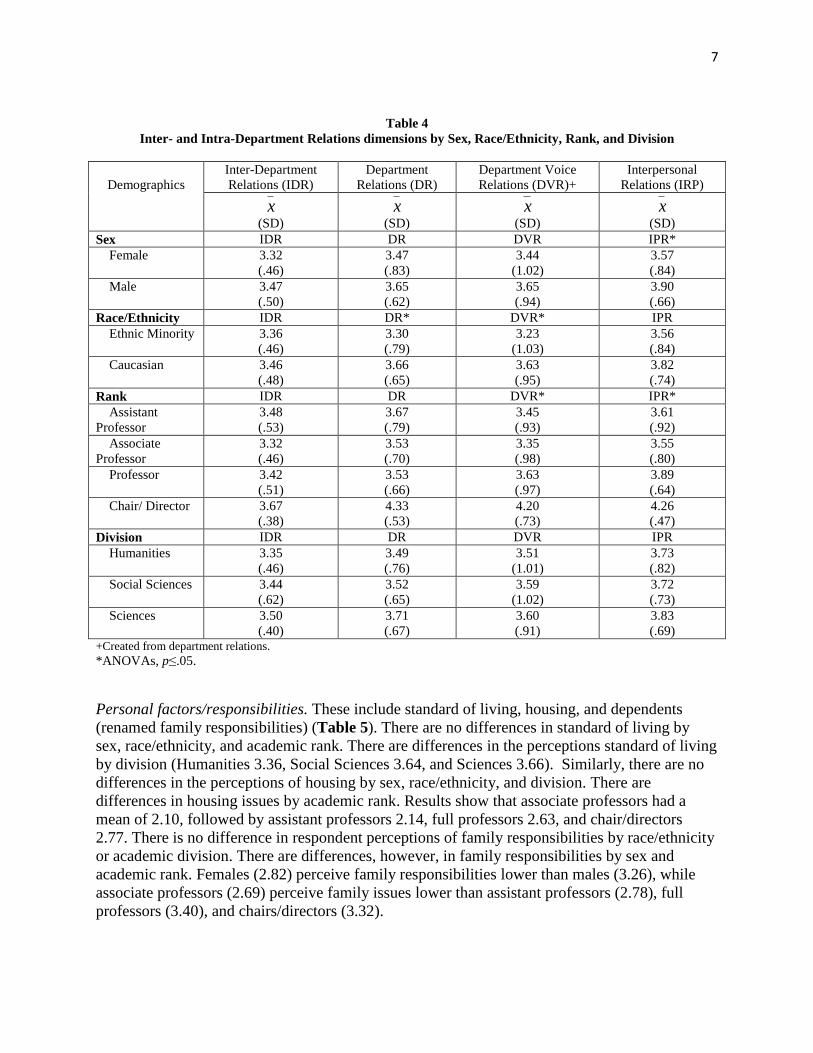
Inter-and intra-department relations. These include the dimensions of university relations
(renamed inter-department relations), department relations, department voice (split from
department relations), and interpersonal relations (Table 4). There are no differences in inter-
department relations by academic division or faculty demographics. There are differences by
academic rank and department voice (assistant professor 3.45, associate professor 3.35, professor
3.63, and chair/director 4.20) and interpersonal relations (assistant professor 3.61, associate
professor 3.55, professor 3.89, and chair/director 4.26). There are differences in perceptions of
department relations and department voice by race/ethnicity. Ethnic minorities perceive
department relations and department voice lower (3.30, 3.23, respectively) than Caucasians
(3.66, 3.63, respectively). Similarly, females (3.57) perceive interpersonal relations less than
their male (3.90) counterparts.
7
Table 4
Inter- and Intra-Department Relations dimensions by Sex, Race/Ethnicity, Rank, and Division
Demographics
Inter-Department
Relations (IDR)
Department
Relations (DR)
Department Voice
Relations (DVR)+
Interpersonal
Relations (IRP)
x
(SD)
x
(SD)
x
(SD)
x
(SD)
Sex IDR DR DVR IPR*
Female 3.32
(.46)
3.47
(.83)
3.44
(1.02)
3.57
(.84)
Male 3.47
(.50)
3.65
(.62)
3.65
(.94)
3.90
(.66)
Race/Ethnicity IDR DR* DVR* IPR
Ethnic Minority 3.36
(.46)
3.30
(.79)
3.23
(1.03)
3.56
(.84)
Caucasian 3.46
(.48)
3.66
(.65)
3.63
(.95)
3.82
(.74)
Rank IDR DR DVR* IPR*
Assistant
Professor
3.48
(.53)
3.67
(.79)
3.45
(.93)
3.61
(.92)
Associate
Professor
3.32
(.46)
3.53
(.70)
3.35
(.98)
3.55
(.80)
Professor 3.42
(.51)
3.53
(.66)
3.63
(.97)
3.89
(.64)
Chair/ Director 3.67
(.38)
4.33
(.53)
4.20
(.73)
4.26
(.47)
Division IDR DR DVR IPR
Humanities 3.35
(.46)
3.49
(.76)
3.51
(1.01)
3.73
(.82)
Social Sciences 3.44
(.62)
3.52
(.65)
3.59
(1.02)
3.72
(.73)
Sciences 3.50
(.40)
3.71
(.67)
3.60
(.91)
3.83
(.69) +Created from department relations.
*ANOVAs, p≤.05.
Personal factors/responsibilities. These include standard of living, housing, and dependents
(renamed family responsibilities) (Table 5). There are no differences in standard of living by
sex, race/ethnicity, and academic rank. There are differences in the perceptions standard of living
by division (Humanities 3.36, Social Sciences 3.64, and Sciences 3.66). Similarly, there are no
differences in the perceptions of housing by sex, race/ethnicity, and division. There are
differences in housing issues by academic rank. Results show that associate professors had a
mean of 2.10, followed by assistant professors 2.14, full professors 2.63, and chair/directors
2.77. There is no difference in respondent perceptions of family responsibilities by race/ethnicity
or academic division. There are differences, however, in family responsibilities by sex and
academic rank. Females (2.82) perceive family responsibilities lower than males (3.26), while
associate professors (2.69) perceive family issues lower than assistant professors (2.78), full
professors (3.40), and chairs/directors (3.32).

8
Table 5
Personal Factors/Responsibilities Dimensions by Sex, Race/Ethnicity, Rank, and Division
Demographics
Standard of
Living (SL)
Housing (H) Dependents (FR)
(Family Responsibilities)
x
(SD)
x
(SD)
x
(SD)
Sex SL H FR*
Female 3.52
(.82)
2.32
(.67)
2.82
(.60)
Male 3.55
(.70)
2.47
(.66)
3.26
(.61)
Race/Ethnicity SL H FR
Ethnic Minority 3.54
(.80)
2.57
(.44)
2.82
(.76)
Caucasian 3.56
(.73)
2.43
(.69)
3.19
(.58)
Rank SL H* FR*
Assistant Professor 3.58
(.78)
2.14
(.64)
2.78
(.44)
Associate Professor 3.34
(.81)
2.10
(.61)
2.69
(.66)
Professor 3.62
(.70)
2.63
(.61)
3.40
(.48)
Chair/ Director 3.74
(.49)
2.77
(.58)
3.32*
(.57)
Division SL* H FR
Humanities 3.36
(.80)
2.31
(.64)
2.96
(.58)
Social Sciences 3.64
(.74)
2.47
(.70)
3.02
(.71)
Sciences 3.66
(.64)
2.45
(.67)
3.33
(.57)
*ANOVAs, p≤.05.
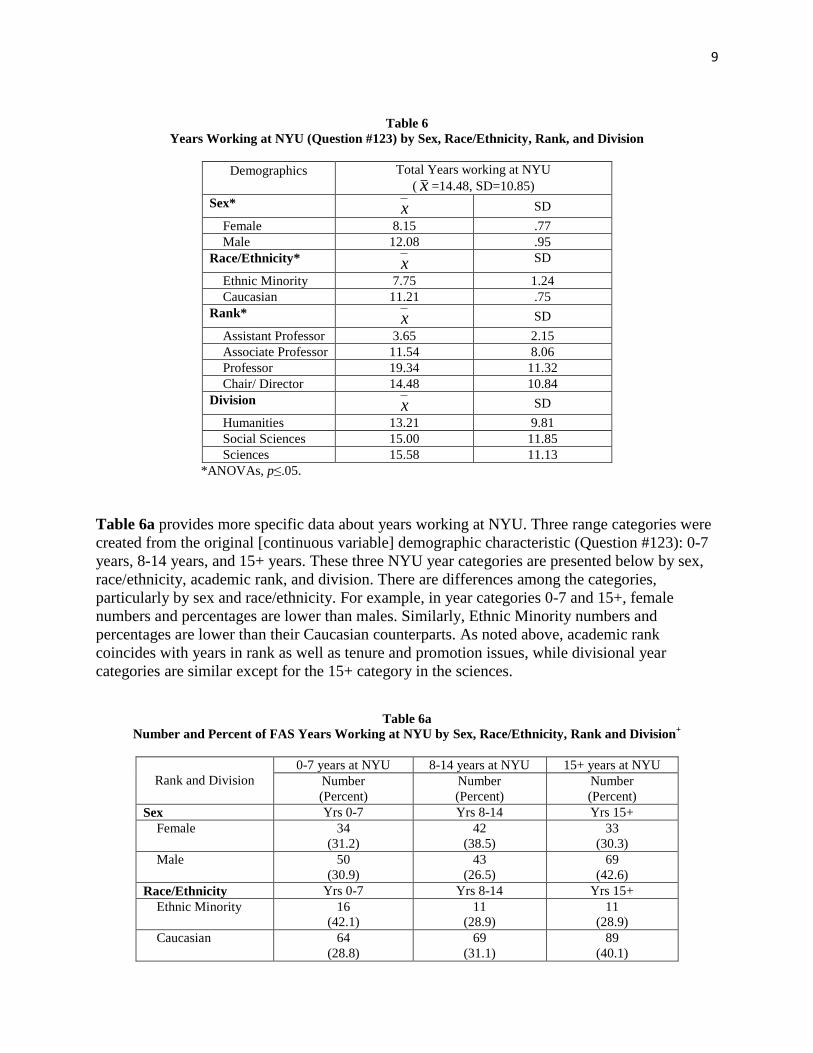
Years working at NYU (question #123). This demographic characteristic is presented to help
guide future data interpretation regarding sex, race/ethnicity, academic rank, and division.
Faculty members were asked to indicate the number of years they have worked at NYU. As
shown in Table 6, there are differences in years working at NYU by sex, race/ethnicity, and
rank. Female faculty and Ethnic Minorities (8.15, 7.75, respectively) have served less time at
NYU compared to their male and Caucasian colleagues (12.08, 11.21, respectively). While there
are differences with regard to academic rank by years at NYU, rank tenure and promotion issues)
most often coincides with years in the position. Years at NYU is relatively even across the three
divisions, and thus no differences among the divisions.
9
Table 6
Years Working at NYU (Question #123) by Sex, Race/Ethnicity, Rank, and Division
Demographics
Total Years working at NYU
( x =14.48, SD=10.85)
Sex* x SD
Female 8.15 .77
Male 12.08 .95
Race/Ethnicity* x SD
Ethnic Minority 7.75 1.24
Caucasian 11.21 .75
Rank* x SD
Assistant Professor 3.65 2.15
Associate Professor 11.54 8.06
Professor 19.34 11.32
Chair/ Director 14.48 10.84
Division x SD
Humanities 13.21 9.81
Social Sciences 15.00 11.85
Sciences 15.58 11.13
*ANOVAs, p≤.05.
Table 6a provides more specific data about years working at NYU. Three range categories were
created from the original [continuous variable] demographic characteristic (Question #123): 0-7
years, 8-14 years, and 15+ years. These three NYU year categories are presented below by sex,
race/ethnicity, academic rank, and division. There are differences among the categories,
particularly by sex and race/ethnicity. For example, in year categories 0-7 and 15+, female
numbers and percentages are lower than males. Similarly, Ethnic Minority numbers and
percentages are lower than their Caucasian counterparts. As noted above, academic rank
coincides with years in rank as well as tenure and promotion issues, while divisional year
categories are similar except for the 15+ category in the sciences.
Table 6a
Number and Percent of FAS Years Working at NYU by Sex, Race/Ethnicity, Rank and Division+
Rank and Division
0-7 years at NYU 8-14 years at NYU 15+ years at NYU
Number
(Percent)
Number
(Percent)
Number
(Percent) Sex Yrs 0-7 Yrs 8-14 Yrs 15+
Female 34
(31.2)
42
(38.5)
33
(30.3)
Male 50
(30.9)
43
(26.5)
69
(42.6)
Race/Ethnicity Yrs 0-7 Yrs 8-14 Yrs 15+
Ethnic Minority 16
(42.1)
11
(28.9)
11
(28.9)
Caucasian 64
(28.8)
69
(31.1)
89
(40.1)
10
Rank Yrs 0-7 Yrs 8-14 Yrs 15+
Assistant Professor 34
(91.9)
3
(8.1)
0
(0)
Associate Professor 27
(33.3)
35
(43.2)
19
(23.5)
Professor 18
(13.6)
41
(31.1)
73
(55.3)
Chair/ Director 5
(23.8)
6
(28.6)
10
(47.6)
Division Yrs 0-7 Yrs 8-14 Yrs 15+
Humanities 32
(29.9)
40
(37.4)
35
(32.7)
Social Sciences 24
(32.4)
24
(32.4)
26
(35.1)
Sciences 28
(31.0)
21
(23.3)
41
(45.6) +
Year categories created from Question #123.
*Chi square, p≤.05. Chi Square is used for comparing categorical data.
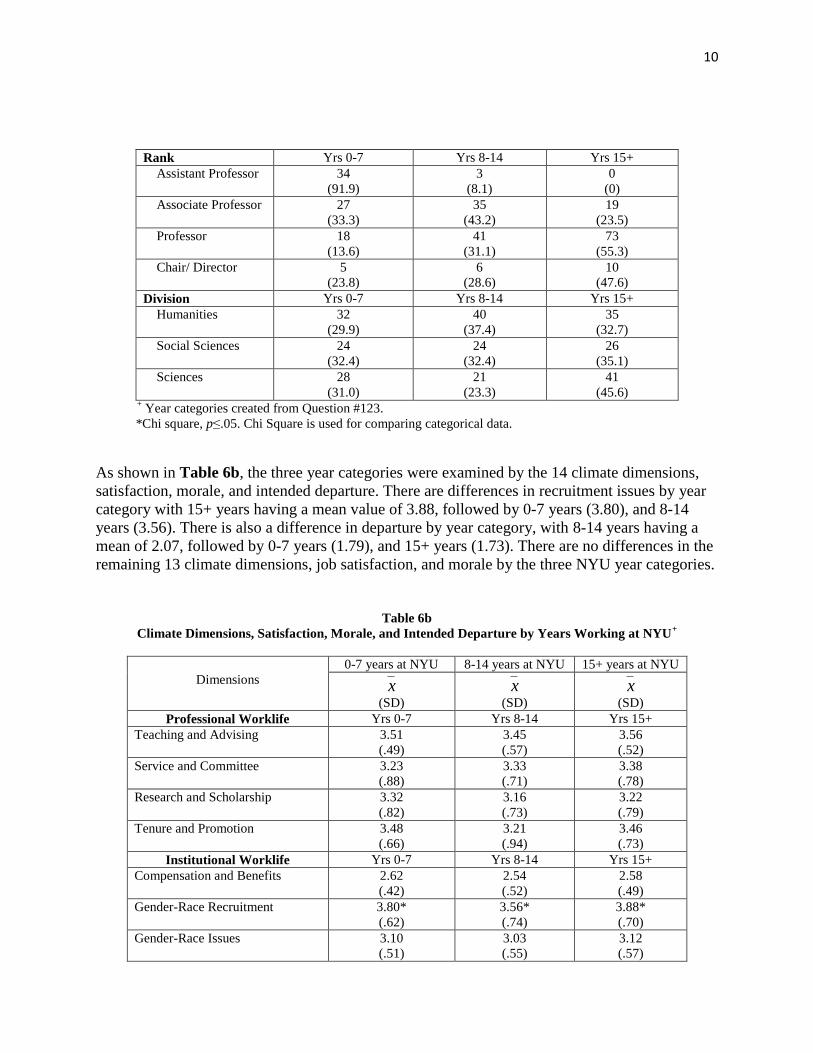
As shown in Table 6b, the three year categories were examined by the 14 climate dimensions,
satisfaction, morale, and intended departure. There are differences in recruitment issues by year
category with 15+ years having a mean value of 3.88, followed by 0-7 years (3.80), and 8-14
years (3.56). There is also a difference in departure by year category, with 8-14 years having a
mean of 2.07, followed by 0-7 years (1.79), and 15+ years (1.73). There are no differences in the
remaining 13 climate dimensions, job satisfaction, and morale by the three NYU year categories.
Table 6b
Climate Dimensions, Satisfaction, Morale, and Intended Departure by Years Working at NYU+
Dimensions
0-7 years at NYU 8-14 years at NYU 15+ years at NYU
x
(SD)
x
(SD)
x
(SD)
Professional Worklife Yrs 0-7 Yrs 8-14 Yrs 15+
Teaching and Advising 3.51
(.49)
3.45
(.57)
3.56
(.52)
Service and Committee 3.23
(.88)
3.33
(.71)
3.38
(.78)
Research and Scholarship 3.32
(.82)
3.16
(.73)
3.22
(.79)
Tenure and Promotion 3.48
(.66)
3.21
(.94)
3.46
(.73)
Institutional Worklife Yrs 0-7 Yrs 8-14 Yrs 15+
Compensation and Benefits 2.62
(.42)
2.54
(.52)
2.58
(.49)
Gender-Race Recruitment 3.80*
(.62)
3.56*
(.74)
3.88*
(.70)
Gender-Race Issues 3.10
(.51)
3.03
(.55)
3.12
(.57)

11
Inter- and Intra-Dept. Relations Yrs 0-7 Yrs 8-14 Yrs 15+
Inter-department Relations 3.50
(.47)
3.48
(.42)
3.35
(.54)
Department Relations 3.72
(.69)
3.54
(.78)
3.51
(.65)
Department Voice 3.62
(.91)
3.68
(.97)
3.39
(1.01)
Interpersonal Relations 3.75
(.80)
3.74
(.77)
3.75
(.72)
Personal
Factors/Responsibilities
Yrs 0-7 Yrs 8-14 Yrs 15+
Standard of Living 3.62
(.77)
3.54
(.76)
3.42
(.73)
Housing 2.35
(.75)
2.31
(.65)
2.54
(.62)
Family Responsibilities 2.92
(.64)
3.07
(.76)
3.21
(.07)
Satisfaction, Morale, Departure Yrs 0-7 Yrs 8-14 Yrs 15+
Job Satisfaction 4.37
(.65)
4.45
(.58)
4.45
(.55)
Morale 3.91
(.78)
3.65
(1.03)
3.75
(1.09)
Future Plans
(Intended Departure)
1.79*
(.78)
2.07*
(.92)
1.73*
(.98) +
Year categories created from Question #123.
*ANOVAs, p≤.05.
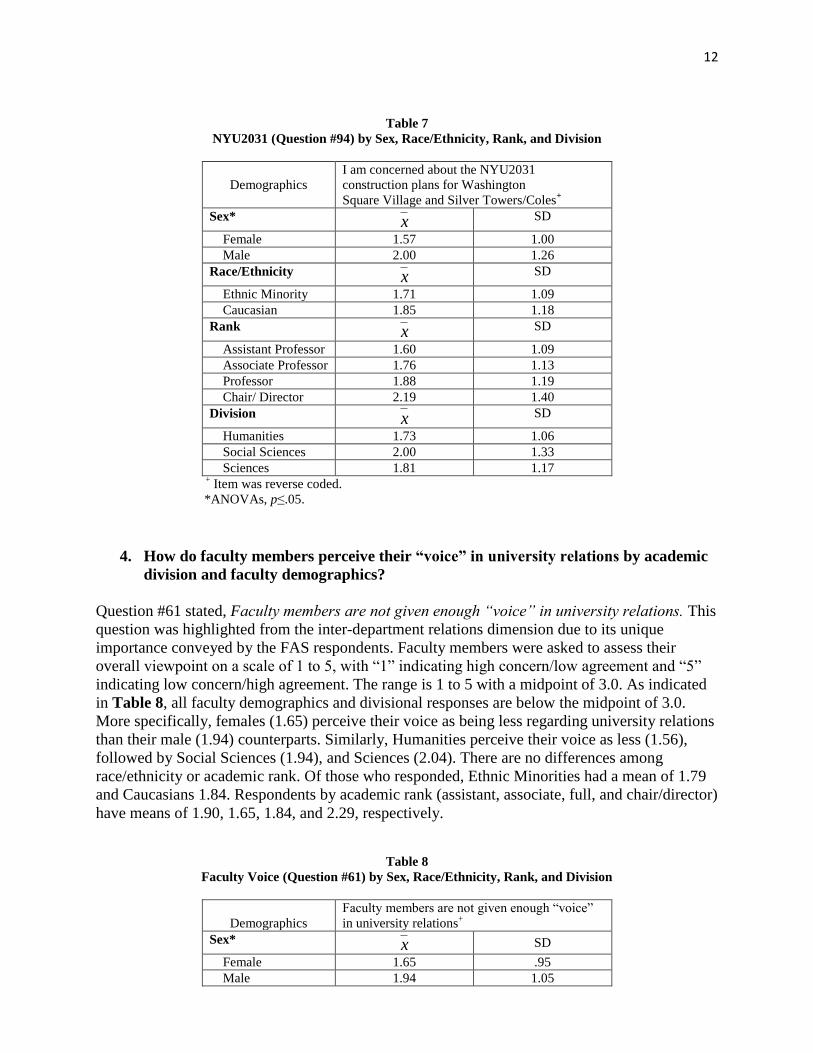
3. How do faculty members perceive the NYU 2031construction plans by academic
division and faculty demographics?
Question #94 stated, I am concerned about the NYU2031 construction plans for Washington
Square Village and Silver Towers/Coles. This question was removed from the housing
dimension due to its distinctiveness and importance conveyed by the FAS respondents.
Faculty members were asked to assess their overall viewpoint on a scale of 1 to 5, with “1”
indicating high concern/low agreement and “5” indicating low concern/high agreement. The
range is 1 to 5 with a midpoint of 3.0. As indicated in Table 7, all faculty demographics and
divisional responses are below the midpoint of 3.0. More specifically, females (1.57) perceive
this plan lower than their male (2.00) counterparts. There are no differences among
race/ethnicity, academic rank or division. Of those who responded, Ethnic Minorities had a mean
of 1.71 and Caucasians 1.85. Respondents by academic rank (assistant, associate, full, and
chair/director) have means of 1.60, 1.76, 1.88, and 2.19, respectively. By division results indicate
that Humanities had a mean of 1.73, followed by Sciences (1.81) and Social Sciences (2.00).
12
Table 7
NYU2031 (Question #94) by Sex, Race/Ethnicity, Rank, and Division
Demographics
I am concerned about the NYU2031
construction plans for Washington
Square Village and Silver Towers/Coles+
Sex* x SD
Female 1.57 1.00
Male 2.00 1.26
Race/Ethnicity x SD
Ethnic Minority 1.71 1.09
Caucasian 1.85 1.18
Rank x SD
Assistant Professor 1.60 1.09
Associate Professor 1.76 1.13
Professor 1.88 1.19
Chair/ Director 2.19 1.40
Division x SD
Humanities 1.73 1.06
Social Sciences 2.00 1.33
Sciences 1.81 1.17
+ Item was reverse coded.
*ANOVAs, p≤.05.
4. How do faculty members perceive their “voice” in university relations by academic
division and faculty demographics?
Question #61 stated, Faculty members are not given enough “voice” in university relations. This
question was highlighted from the inter-department relations dimension due to its unique
importance conveyed by the FAS respondents. Faculty members were asked to assess their
overall viewpoint on a scale of 1 to 5, with “1” indicating high concern/low agreement and “5”
indicating low concern/high agreement. The range is 1 to 5 with a midpoint of 3.0. As indicated
in Table 8, all faculty demographics and divisional responses are below the midpoint of 3.0.
More specifically, females (1.65) perceive their voice as being less regarding university relations
than their male (1.94) counterparts. Similarly, Humanities perceive their voice as less (1.56),
followed by Social Sciences (1.94), and Sciences (2.04). There are no differences among
race/ethnicity or academic rank. Of those who responded, Ethnic Minorities had a mean of 1.79
and Caucasians 1.84. Respondents by academic rank (assistant, associate, full, and chair/director)
have means of 1.90, 1.65, 1.84, and 2.29, respectively.
Table 8
Faculty Voice (Question #61) by Sex, Race/Ethnicity, Rank, and Division
Demographics
Faculty members are not given enough “voice”
in university relations+
Sex* x SD
Female 1.65 .95
Male 1.94 1.05

13
Race/Ethnicity x SD
Ethnic Minority 1.79 1.01
Caucasian 1.84 1.02
Rank x SD
Assistant Professor 1.90 .90
Associate Professor 1.65 .84
Professor 1.84 1.11
Chair/ Director 2.29 1.02
Division* x SD
Humanities 1.56 .83
Social Sciences 1.94 1.08
Sciences 2.04 1.11
+ Item was reverse coded.
*ANOVAs, p≤.05.
5. What is the current level of faculty satisfaction? Are their differences in job
satisfaction by division or faculty demographics (i.e., sex, race/ethnicity, and
academic rank)?
For the purpose of this study, job satisfaction is related to an individual’s feelings about her/his
job. As shown in Appendix 6, four statements (# 105-108) are included in the dimension of job
satisfaction (alpha=.86, Appendix 9), and the means and standard deviations are also provided.
Faculty members were asked to assess their overall satisfaction on a scale of 1 to 5, with “1”
indicating low satisfaction and “5” indicating high satisfaction. The range is 1 to 5 with a
midpoint of 3.0. The overall mean of faculty satisfaction is 4.43.
As shown, Table 9 provides the means and standard deviations for faculty members on job
satisfaction by sex, race/ethnicity, academic rank, and division. There are no differences in sex,
race/ethnicity, and division by job satisfaction. There is a difference by rank and satisfaction; that
is, chairs/directors have the highest job satisfaction (mean of 4.65) followed by full professors
(4.49), assistant professors (4.37) and associate professors (4.30). Regarding divisional
satisfaction, the means are all above the midpoint and there are no differences among the
divisions.
6. What is the current level of faculty morale? Are there differences in morale by
academic division or faculty demographics (i.e., sex, race/ethnicity, and academic
rank)?
For the purpose of this study faculty morale is related to how an individual views or feels about
the organization. As shown in Appendix 7, seven statements (# 109-115) are included in the
dimension of morale (alpha=.88, Appendix 9), and the means and standard deviations are also
provided. Faculty members were asked to assess their morale relating to NYU on a scale of 1 to
5, with “1” indicating low morale and “5” indicating high morale. The range is 1 to 5 with a
midpoint of 3.0. The overall mean of faculty morale is 3.78.
Moreover, Table 9 provides the means and standard deviations for faculty members on morale
by sex, race/ethnicity, academic rank, and division. There is a difference in morale among
14
females and males, with women faculty having a mean of 3.55 compared to 3.94 for men. There
is no difference in morale by race/ethnicity. Differences in morale among faculty ranks indicate
that chairs/directors have the highest mean (4.42) followed by assistant professors (3.89),
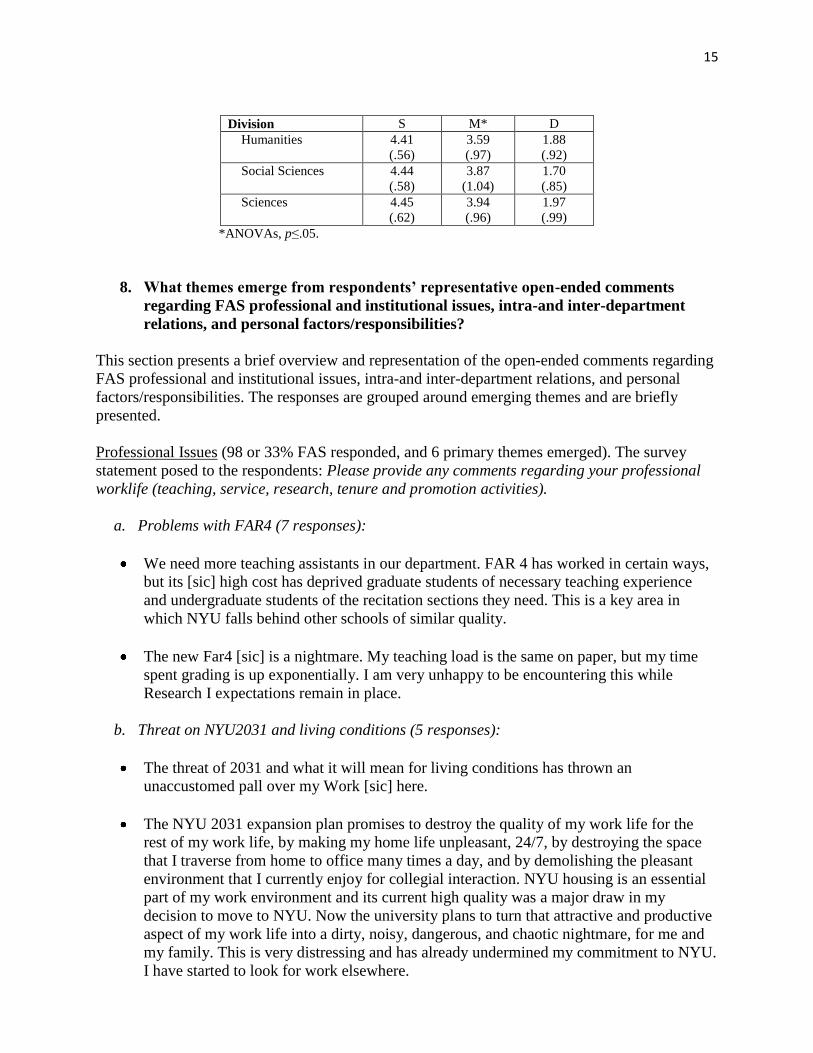
professors (3.80) and associate professors (3.56). Regarding divisional morale, while the means
are all above the midpoint, there are differences with the Sciences having a mean of 3.94,
followed by the Social Sciences (3.87, and the Humanities (3.59).
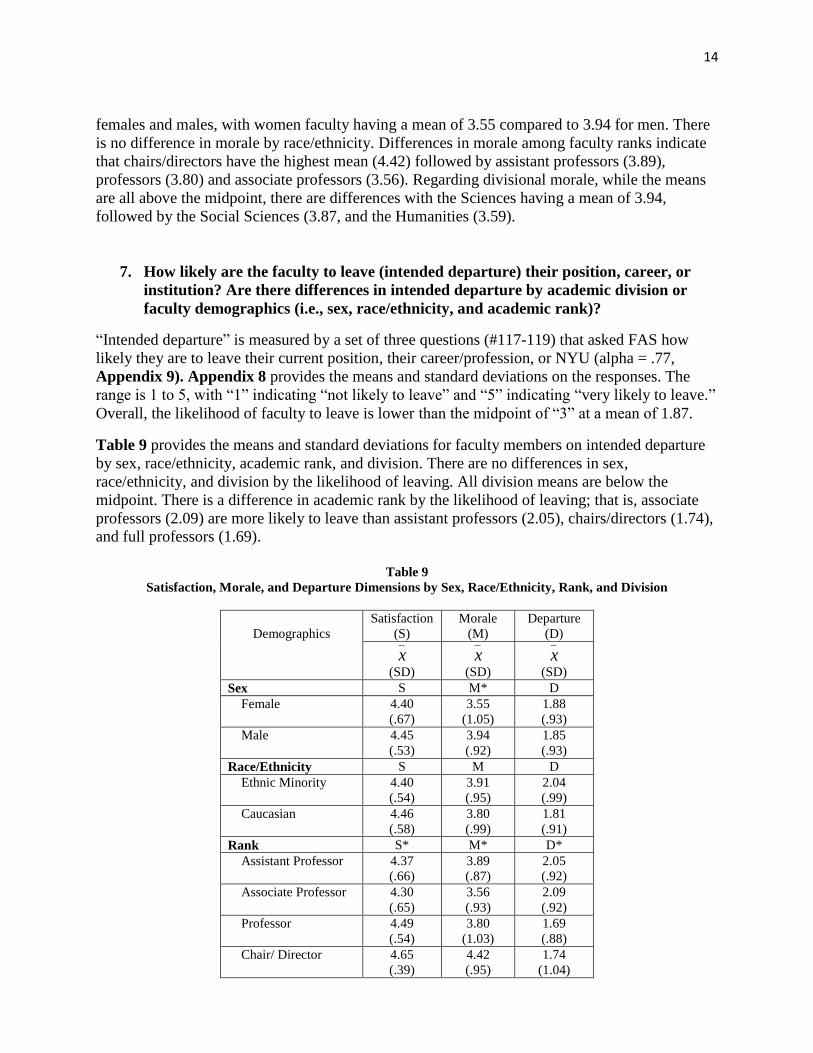
7. How likely are the faculty to leave (intended departure) their position, career, or
institution? Are there differences in intended departure by academic division or
faculty demographics (i.e., sex, race/ethnicity, and academic rank)?
“Intended departure” is measured by a set of three questions (#117-119) that asked FAS how
likely they are to leave their current position, their career/profession, or NYU (alpha = .77,
Appendix 9). Appendix 8 provides the means and standard deviations on the responses. The
range is 1 to 5, with “1” indicating “not likely to leave” and “5” indicating “very likely to leave.”
Overall, the likelihood of faculty to leave is lower than the midpoint of “3” at a mean of 1.87.
Table 9 provides the means and standard deviations for faculty members on intended departure
by sex, race/ethnicity, academic rank, and division. There are no differences in sex,
race/ethnicity, and division by the likelihood of leaving. All division means are below the
midpoint. There is a difference in academic rank by the likelihood of leaving; that is, associate
professors (2.09) are more likely to leave than assistant professors (2.05), chairs/directors (1.74),
and full professors (1.69).
Table 9
Satisfaction, Morale, and Departure Dimensions by Sex, Race/Ethnicity, Rank, and Division
Demographics
Satisfaction
(S)
Morale
(M)
Departure
(D)
x
(SD)
x
(SD)
x
(SD)
Sex S M* D
Female 4.40
(.67)
3.55
(1.05)
1.88
(.93)
Male 4.45
(.53)
3.94
(.92)
1.85
(.93)
Race/Ethnicity S M D
Ethnic Minority 4.40
(.54)
3.91
(.95)
2.04
(.99)
Caucasian 4.46
(.58)
3.80
(.99)
1.81
(.91)
Rank S* M* D*
Assistant Professor 4.37
(.66)
3.89
(.87)
2.05
(.92)
Associate Professor 4.30
(.65)
3.56
(.93)
2.09
(.92)
Professor 4.49
(.54)
3.80
(1.03)
1.69
(.88)
Chair/ Director 4.65
(.39)
4.42
(.95)
1.74
(1.04)
15
Division S M* D
Humanities 4.41
(.56)
3.59
(.97)
1.88
(.92)
Social Sciences 4.44
(.58)
3.87
(1.04)
1.70
(.85)
Sciences 4.45
(.62)
3.94
(.96)
1.97
(.99)
*ANOVAs, p≤.05.
8. What themes emerge from respondents’ representative open-ended comments
regarding FAS professional and institutional issues, intra-and inter-department
relations, and personal factors/responsibilities?
This section presents a brief overview and representation of the open-ended comments regarding
FAS professional and institutional issues, intra-and inter-department relations, and personal
factors/responsibilities. The responses are grouped around emerging themes and are briefly
presented.
Professional Issues (98 or 33% FAS responded, and 6 primary themes emerged). The survey
statement posed to the respondents: Please provide any comments regarding your professional
worklife (teaching, service, research, tenure and promotion activities).
a. Problems with FAR4 (7 responses):
We need more teaching assistants in our department. FAR 4 has worked in certain ways,
but its [sic] high cost has deprived graduate students of necessary teaching experience
and undergraduate students of the recitation sections they need. This is a key area in
which NYU falls behind other schools of similar quality.
The new Far4 [sic] is a nightmare. My teaching load is the same on paper, but my time
spent grading is up exponentially. I am very unhappy to be encountering this while
Research I expectations remain in place.
b. Threat on NYU2031 and living conditions (5 responses):
The threat of 2031 and what it will mean for living conditions has thrown an
unaccustomed pall over my Work [sic] here.
The NYU 2031 expansion plan promises to destroy the quality of my work life for the
rest of my work life, by making my home life unpleasant, 24/7, by destroying the space
that I traverse from home to office many times a day, and by demolishing the pleasant
environment that I currently enjoy for collegial interaction. NYU housing is an essential
part of my work environment and its current high quality was a major draw in my
decision to move to NYU. Now the university plans to turn that attractive and productive
aspect of my work life into a dirty, noisy, dangerous, and chaotic nightmare, for me and
my family. This is very distressing and has already undermined my commitment to NYU.
I have started to look for work elsewhere.

16
c. Undervaluing teaching (4 responses):
Senior faculty have typically "negotiated" a teaching load that does not include
undergraduate teaching; or have negotiated a lower teaching load that then pushes the
teaching burden to junior and associate faculty. In addition to being not equitable, it
creates a department ethos that undervalues undergraduate education overall. Core
undergraduate teaching and service fall primarily to Associate faculty, who then take on
so much administrative responsibility over years that their own research and promotion is
jeopardized.
NYU needs to devote more attention to teaching and to program development. I have
been actively involved in administrative service to my department, and trying to get
anything done, beyond managing crises, is extremely difficult. NYU should lead the way
in innovative teaching here, at both the graduate and undergraduate level, and not only
going after world-class researchers.
d. Special deals made in/between departments (4 responses):
As for teaching loads, the most problematic deals are not even those cut within
departments but across them. Why should one dept in the humanities have a 2-1 load and
another 2-2 load. That creates extraordinary resentment and undercuts confidence in the
university administration to levy any sense of fairness.
We are all aware of special deals individual faculty cut in other departments and of the
differential treatment across departments, divisions, and schools. This contributes to a
more general demoralization and exhaustion that trickle down into departmental life.
e. Tenure review issues (4 responses):
Tenure at NYU is a black box. We are barely told anything during the process and from
sitting on a tenure committee…I discovered that it would be possible for a candidate to
be sunk for subjective "collegiality" issues without having had any warning that this
could even be a factor to worry about.
Since I've been to NYU we have tenured everyone who has come up. Many clearly
deserved it, but some did not. In my department, there is a lot of pressure to be
supportive and go along with things. I wish honest discussion was more encouraged,
although this has gotten better in the last few years. I think an elite university should not
tenure everyone, so I think this is a problem.
f. Service loads (4 responses):
Service load is very unevenly spread among department members. Rewards for service
are minimal. There is a fairly obvious gender imbalance when it comes to service. Male
faculty members tend to do much less, and are consequently promoted earlier and
command higher salaries. Service is insufficiently recognized in the promotion from

17
Associate to Full Professor. In the current situation, one should advise all associate
professors not to accept service appointment before promotion.
Senior faculty members perform little onerous service beyond chairing the department
and running job search or tenure committees. The most difficult assignments, the DGS
and DUGS positions (often performed by senior faculty at Harvard and Yale), are the
sole preserve of associates.
Institutional Issues (89 or 30% FAS responded, and 5 primary themes emerged). The survey
statement posed to the respondents: Please provide any comments regarding your institutional
worklife (compensation and benefits, retention-climate issues).
a. Gender Imbalance (8 responses):
There is widespread opinion among women in my department that gender parity is
slipping, that things are moving backward.
I'd like to see more women and minorities recruited and treated with great respect.
b. Higher salary by soliciting outside offers (15 responses):
The compensation situation at NYU is outrageous. There is little effort to reward
excellence in teaching. The most effective route to proper compensation is to obtain
outside offers.
Regarding compensation, the system is secretive, and tends to reward those who make
salary demands, or solicit outside offers. Personally, I find this undignified and a waste
of time, and as a result (as I've recently learned), my salary has fallen significantly below
that of some of my colleagues of similar rank and productivity.
NYU relies too much on a business model of low-balling initial faculty salaries and
rewarding only in-hand offers with raises. The former tends to demoralize younger/naive
faculty, often resulting in their leaving (they don't feel loved/valued) and the latter either
results in faculty leaving or in rewarding bad behavior (i.e., getting a raise because you
threatened but didn't leave). If you wait for someone to get another offer it is like
insisting your spouse nearly have an affair before you buy flowers. Sometimes the
spouse will simply leave. Instead, we should be rewarding good behavior before folks
are unhappy enough to look around for someone who makes them feel more loved.
c. Faculty diversity (14 responses):
We don't notice gender or ethnicity. We care deeply about advancing knowledge in our
field. If anyone tried to notice gender or ethnicity, we wouldn't let them.
There's no awareness in my department of the importance of recruiting and retaining
minorities or people with different life-experiences.
18
I have been at other universities with more incentives for hiring minorities. The
incentives here (as I understand) are essentially no incentive in the long run.
d. No gender imbalance (6 responses):
The environment of my department is outstanding with regards to gender and minority
issues.
I don't feel there is gender disparity in terms of faculty treatment or
promotion/expectations. Since I have been here (4 years) we have had both male and
female faculty members as chairs and in leading positions on searches and in committees.
e. Salary compression issues (7 responses):
There has been and now is extreme disparity between salaries for faculty at the same
rank, with some full professors making 4 or 5 times as much as others. Some of this
disparity has to do with prominence in the profession, but it remains too great, and some
long-time very productive faculty members are grossly underpaid.
Long-term, loyal tenured faculty members who have come up through the ranks have
quite clearly lagged behind on salary and compensation. This is demoralizing and creates
potential resentment with departments, and a strain on retention: it clearly encourages
faculty to keep an eye on the job market in order to pursue counter-offers to leverage
salary and housing. People often begin by pursuing outside offers for this reason, and
then end up leaving. This is costly to the faculty and NYU community in all aspects.
Intra- and Inter-Department Relations (60 or 20% FAS responded, and 2 primary themes
emerged). The survey statement posed to the respondents: Please provide any comments
regarding your intra- and inter-department relations (inter-department relations, department
relations, and interpersonal relations).
a. University autocratic decision making (14 responses):
I think many faculty are upset about the large-scale plans of the university, most of which
have been developed with minimal faculty consultation. I'm thinking particularly of: 1)
the 2031 construction plans, which will surely have a profound negative impact on
faculty retention and recruitment over the next 18 years, while saddling NYU with a
massive debt, and enraging the community within which we live; and 2) the ""global
university"" initiatives, which seem to be aimed primarily at spreading around NYU's
name and increasing its size (as opposed to its *quality*).
Decision-making at NYU is hugely top-down. This starts at the level of the president and
extends to the provost. It seems as if this may also continue to the FAS level. Many
initiatives are inflicted on the faculty and departments as unfunded (labor) mandates,
which are not responsive in any way to legitimate criticisms or problems. It is
discouraging, frankly. So far as I can tell, this view is shared by everyone in my
department.

19
b. Department relations (10 responses):
At the center of what has made my career at NYU ideal stands my department, which has
offered a fantastic work environment for over 20 years, despite changes in the larger
university and in personnel. My department has a culture of professional courtesy and
team spirit, of highest intellectual standards joined to real humanity of attitude, and a
willingness to work with people across the years with whatever obstacles larger life may
bring.
I have the most supportive, understanding chair and colleagues I could wish for. We all
speak about how terrific the departmental environment is for us all.
Relations within the department are generally good, but some long-time members feel
like second-class citizens because of all the attention paid to new hires.
Personal Factors/Responsibilities (100 or 33% FAS responded, and 3 primary themes emerged).
The survey statement posed to the respondents: Please provide any comments regarding your
personal factors/responsibilities (standard of living, housing, dependents).
a. NYU2031 is a mistake (38 responses):
It is my largest concern. It is a huge academic mistake that will make NYU a worse
university, and, on a personal level, I am certain that if it goes through I will (very
reluctantly) have to leave NYU.
The current NYU2031 plan is the worst thing that could happen to NYU. It will kill
quality of life, and make both faculty retention and recruitment very difficult.
One of the ways that NYU recruits and retains top-quality faculty is through the
subsidized housing it offers within walking distance to campus; that value will be gone
under the 2031 plan, not just the retention but the recruitment of faculty is at stake.
The 2031 expansion plan is a complete disaster. Because of it, the faculty's morale,
including mine, is at an all-time low.
b. Housing issues-other (6 responses):
Through the years I have found the housing office notoriously irresponsible regarding
basic questions of safety, asbestos, lead, toxic chemicals in leaking steam pipes, etc.
My main complaints about NYU of late are about housing. There are many issues: I
know that NYU warehouses apartments, rents them to non-NYU people for unclear
reasons, makes deals of various sorts with favored faculty. But none of that would bother
me IF there were decent apartments available for retirees.
20
In my experience, the criteria for faculty housing are *completely* opaque, and the office
that manages seems charges with discouraging faculty from living in faculty housing.
c. Preschool/day-care (8 responses):
On-campus care for dependents is badly needed. There are institutions where such
facilities exist at an affordable rate. When a child gets sick, and is not allowed to go to
school, it becomes a big problem for teaching faculty.
NYU's lack of a day care center for children from faculty must be unique these days for
top 50 ranked universities.
It would be incredibly helpful if NYU provided childcare and preschool for children
under five, as is very common at other universities.
Additional open-ended comments (93 or 31% FAS responded, and 4 primary themes emerged).
The survey statement posed to the respondents: If you have any additional comments that you
would like to offer, we invite you to add them now. Four primary themes emerged from this
group of open-ended comments and they are all inter-related from the previous themes noted
above about university administration: Global network university is problematic (10 responses),
university top down decision making (5 responses), NYU2031 is a mistake (15 responses), no
shared governance/consultation with the faculty (7 responses).
Further Analyses
The analyses provided here are descriptive. Further analyses could be conducted with these data
to answer such questions as: What combination of the 14 worklife climate scales explain the
variation in satisfaction, morale, or intended departure? Do demographic variables such as sex,
race/ethnicity, and academic rank contribute to the explanation of variance in satisfaction,
morale, and intended departure? And finally, does the combination of the 14 worklife climate
scales and demographic characteristics explain variance across the three FAS divisions at NYU?
In other words, how does worklife climate measured in this study vary in its ability to explain
satisfaction, morale or intended departure for different faculty demographics in different FAS
divisions?
References
DeVellis, R.F. (2003). Scale development: Theory and applications. Thousand Oaks: Sage
Publications.
Nunnally, J.C. (1978). Psychometric theory (2nd
ed.), New York: McGraw Hill.

21
APPENDICES
22
Appendix 1
Faculty of Arts and Sciences Climate Survey, Spring 2012
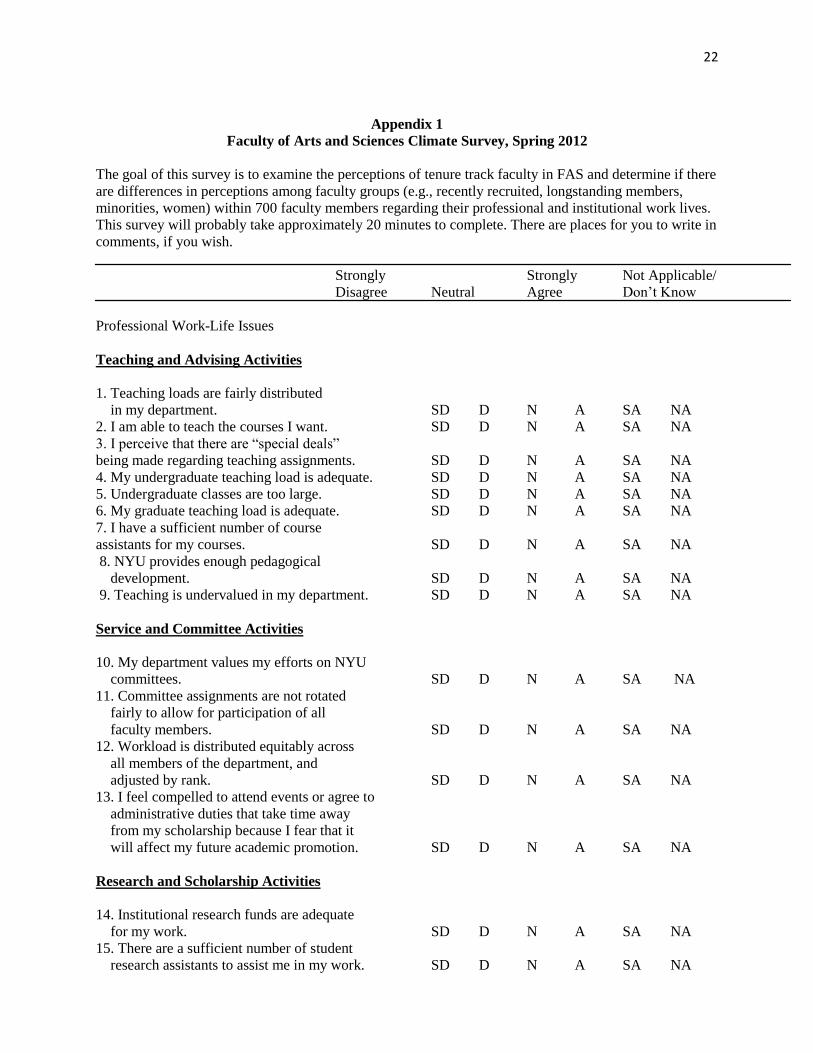
The goal of this survey is to examine the perceptions of tenure track faculty in FAS and determine if there
are differences in perceptions among faculty groups (e.g., recently recruited, longstanding members,
minorities, women) within 700 faculty members regarding their professional and institutional work lives.
This survey will probably take approximately 20 minutes to complete. There are places for you to write in
comments, if you wish.
Strongly Strongly Not Applicable/
Disagree Neutral Agree Don’t Know
Professional Work-Life Issues
Teaching and Advising Activities
1. Teaching loads are fairly distributed
in my department. SD D N A SA NA
2. I am able to teach the courses I want. SD D N A SA NA
3. I perceive that there are “special deals”
being made regarding teaching assignments. SD D N A SA NA
4. My undergraduate teaching load is adequate. SD D N A SA NA
5. Undergraduate classes are too large. SD D N A SA NA
6. My graduate teaching load is adequate. SD D N A SA NA
7. I have a sufficient number of course
assistants for my courses. SD D N A SA NA
8. NYU provides enough pedagogical
development. SD D N A SA NA
9. Teaching is undervalued in my department. SD D N A SA NA
Service and Committee Activities
10. My department values my efforts on NYU
committees. SD D N A SA NA
11. Committee assignments are not rotated
fairly to allow for participation of all
faculty members. SD D N A SA NA
12. Workload is distributed equitably across
all members of the department, and
adjusted by rank. SD D N A SA NA
13. I feel compelled to attend events or agree to
administrative duties that take time away
from my scholarship because I fear that it
will affect my future academic promotion. SD D N A SA NA
Research and Scholarship Activities
14. Institutional research funds are adequate
for my work. SD D N A SA NA
15. There are a sufficient number of student
research assistants to assist me in my work. SD D N A SA NA
23
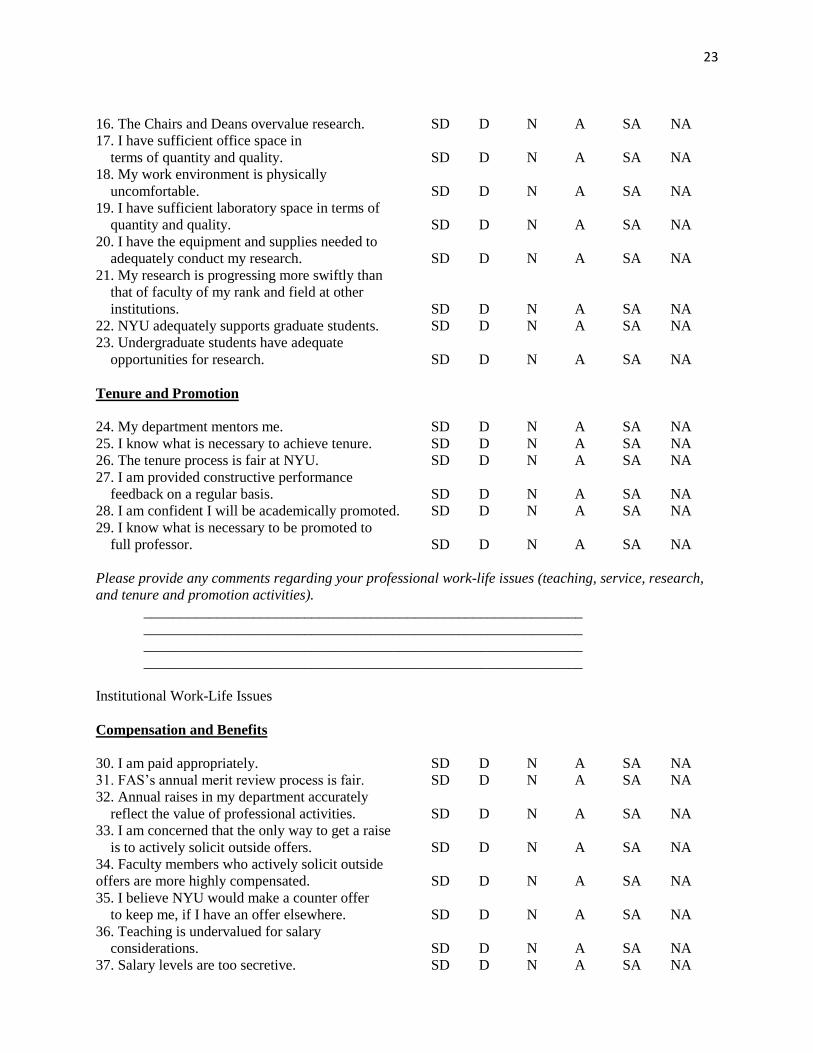
16. The Chairs and Deans overvalue research. SD D N A SA NA
17. I have sufficient office space in
terms of quantity and quality. SD D N A SA NA
18. My work environment is physically
uncomfortable. SD D N A SA NA
19. I have sufficient laboratory space in terms of
quantity and quality. SD D N A SA NA
20. I have the equipment and supplies needed to
adequately conduct my research. SD D N A SA NA
21. My research is progressing more swiftly than
that of faculty of my rank and field at other
institutions. SD D N A SA NA
22. NYU adequately supports graduate students. SD D N A SA NA
23. Undergraduate students have adequate
opportunities for research. SD D N A SA NA
Tenure and Promotion
24. My department mentors me. SD D N A SA NA
25. I know what is necessary to achieve tenure. SD D N A SA NA
26. The tenure process is fair at NYU. SD D N A SA NA
27. I am provided constructive performance
feedback on a regular basis. SD D N A SA NA
28. I am confident I will be academically promoted. SD D N A SA NA
29. I know what is necessary to be promoted to
full professor. SD D N A SA NA
Please provide any comments regarding your professional work-life issues (teaching, service, research,
and tenure and promotion activities).
____________________________________________________________
____________________________________________________________
____________________________________________________________
____________________________________________________________
Institutional Work-Life Issues
Compensation and Benefits
30. I am paid appropriately. SD D N A SA NA
31. FAS’s annual merit review process is fair. SD D N A SA NA
32. Annual raises in my department accurately
reflect the value of professional activities. SD D N A SA NA
33. I am concerned that the only way to get a raise
is to actively solicit outside offers. SD D N A SA NA
34. Faculty members who actively solicit outside
offers are more highly compensated. SD D N A SA NA
35. I believe NYU would make a counter offer
to keep me, if I have an offer elsewhere. SD D N A SA NA
36. Teaching is undervalued for salary
considerations. SD D N A SA NA
37. Salary levels are too secretive. SD D N A SA NA
24
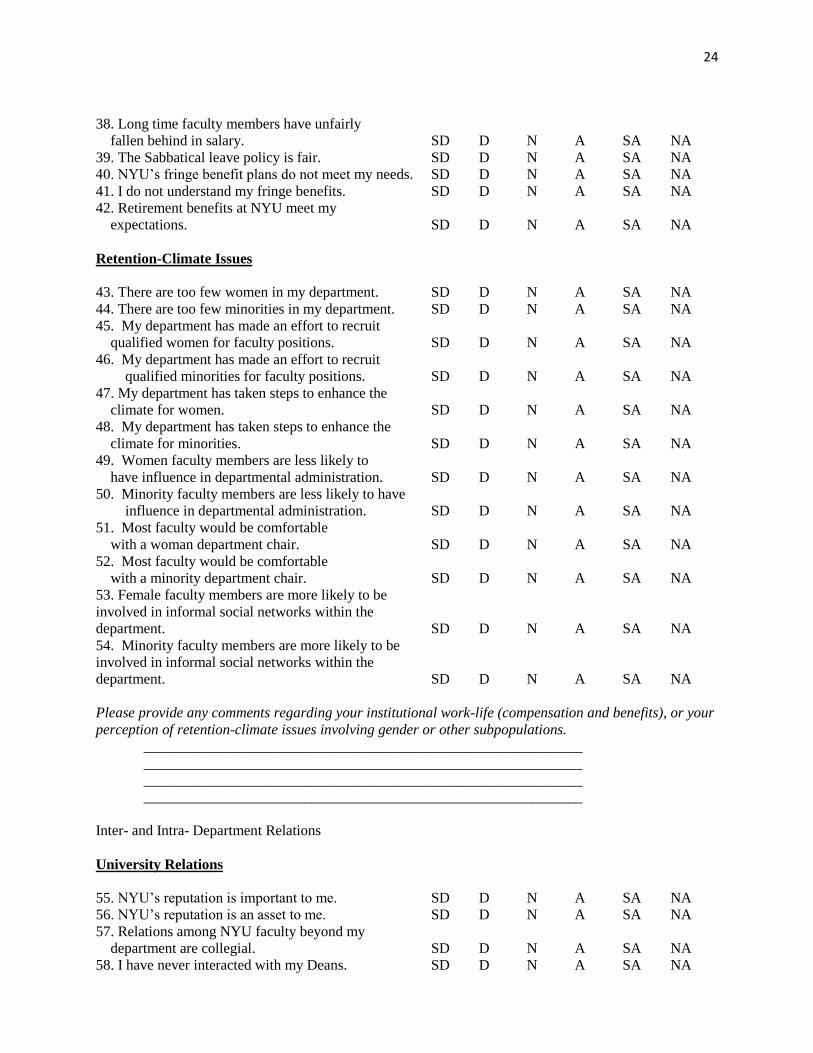
38. Long time faculty members have unfairly
fallen behind in salary. SD D N A SA NA
39. The Sabbatical leave policy is fair. SD D N A SA NA
40. NYU’s fringe benefit plans do not meet my needs. SD D N A SA NA
41. I do not understand my fringe benefits. SD D N A SA NA
42. Retirement benefits at NYU meet my
expectations. SD D N A SA NA
Retention-Climate Issues
43. There are too few women in my department. SD D N A SA NA
44. There are too few minorities in my department. SD D N A SA NA
45. My department has made an effort to recruit
qualified women for faculty positions. SD D N A SA NA
46. My department has made an effort to recruit
qualified minorities for faculty positions. SD D N A SA NA
47. My department has taken steps to enhance the
climate for women. SD D N A SA NA
48. My department has taken steps to enhance the
climate for minorities. SD D N A SA NA
49. Women faculty members are less likely to
have influence in departmental administration. SD D N A SA NA
50. Minority faculty members are less likely to have
influence in departmental administration. SD D N A SA NA
51. Most faculty would be comfortable
with a woman department chair. SD D N A SA NA
52. Most faculty would be comfortable
with a minority department chair. SD D N A SA NA
53. Female faculty members are more likely to be
involved in informal social networks within the
department. SD D N A SA NA
54. Minority faculty members are more likely to be
involved in informal social networks within the
department. SD D N A SA NA
Please provide any comments regarding your institutional work-life (compensation and benefits), or your
perception of retention-climate issues involving gender or other subpopulations.
____________________________________________________________
____________________________________________________________
____________________________________________________________
____________________________________________________________
Inter- and Intra- Department Relations
University Relations
55. NYU’s reputation is important to me. SD D N A SA NA
56. NYU’s reputation is an asset to me. SD D N A SA NA
57. Relations among NYU faculty beyond my
department are collegial. SD D N A SA NA
58. I have never interacted with my Deans. SD D N A SA NA

25
59. I have colleagues at NYU who give me career
advice or guidance. SD D N A SA NA
60. Endowed chairs are awarded in an unfair manner. SD D N A SA NA
61. Faculty members are not given enough “voice”
in university decisions. SD D N A SA NA
Department Relations
62. My department chair treats me with respect. SD D N A SA NA
63. My chair supports my career. SD D N A SA NA
64. I fit intellectually within my department. SD D N A SA NA
65. Relations within my department are collegial. SD D N A SA NA
66. I feel I can voice my opinions openly in
my department. SD D N A SA NA
67. I do not have a voice in how resources are
allocated within my department. SD D N A SA NA
68. I feel like an equal participant in the
decision-making in my department. SD D N A SA NA
69. I feel isolated in my department. SD D N A SA NA
70. I feel excluded from informal networks in
my department. SD D N A SA NA
71. I generally feel comfortable with the
atmosphere in my department. SD D N A SA NA
72. Teaching by Clinical Faculty (CF) members
in my department enables me to focus on
my research. SD D N A SA NA
73. CF members actively participate in
departmental decision making. SD D N A SA NA
74. CF members are valued in my department. SD D N A SA NA
75. CF members are as committed to NYU as I am. SD D N A SA NA
Interpersonal Relations
76. Colleagues treat me with respect. SD D N A SA NA
77. Faculty meetings allow for all participants
to share their views. SD D N A SA NA
78. I have to work harder than some of my
colleagues to be perceived as a legitimate scholar. SD D N A SA NA
79. Faculty members in my department are
supportive of colleagues with family obligations. SD D N A SA NA
80. My department chair is supportive of my need
to maintain a balance between my work duties
and my personal/family responsibilities. SD D N A SA NA
81. My department is a place where faculty can raise
personal issues. SD D N A SA NA
Please provide any comments regarding your Intra- and Inter- department relations (university,
department, and interpersonal relations).
____________________________________________________________
____________________________________________________________
____________________________________________________________
26
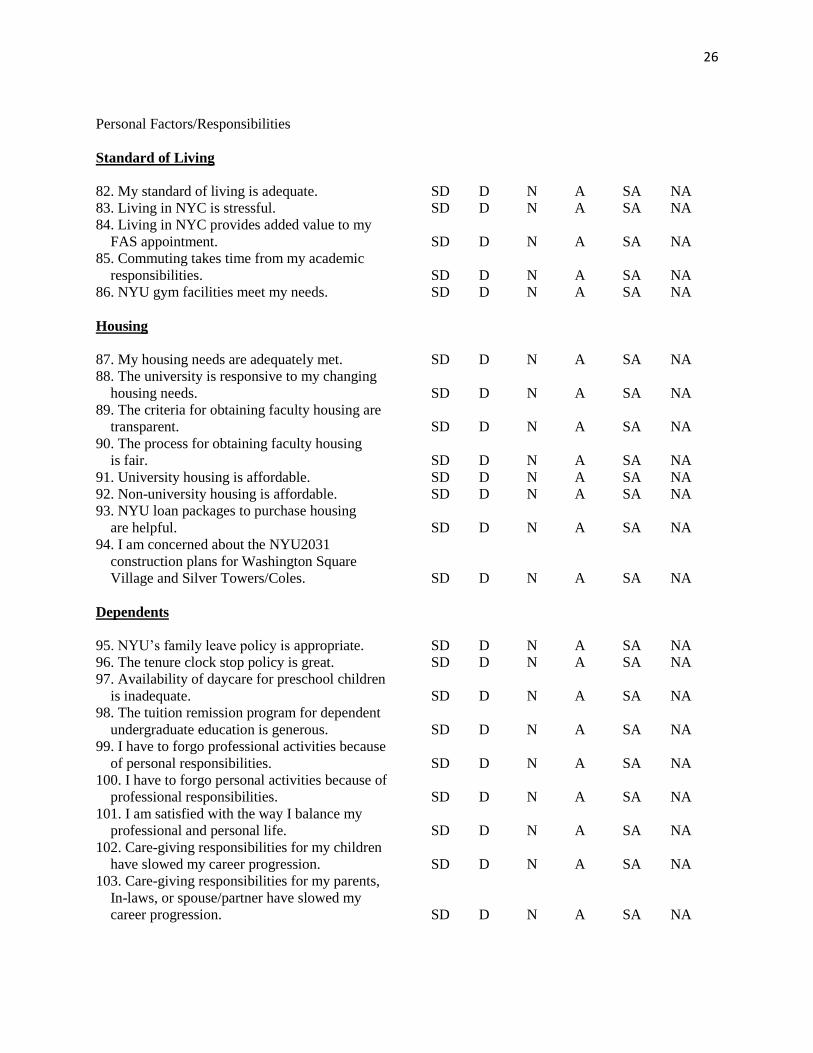
Personal Factors/Responsibilities
Standard of Living
82. My standard of living is adequate. SD D N A SA NA
83. Living in NYC is stressful. SD D N A SA NA
84. Living in NYC provides added value to my
FAS appointment. SD D N A SA NA
85. Commuting takes time from my academic
responsibilities. SD D N A SA NA
86. NYU gym facilities meet my needs. SD D N A SA NA
Housing
87. My housing needs are adequately met. SD D N A SA NA
88. The university is responsive to my changing
housing needs. SD D N A SA NA
89. The criteria for obtaining faculty housing are
transparent. SD D N A SA NA
90. The process for obtaining faculty housing
is fair. SD D N A SA NA
91. University housing is affordable. SD D N A SA NA
92. Non-university housing is affordable. SD D N A SA NA
93. NYU loan packages to purchase housing
are helpful. SD D N A SA NA
94. I am concerned about the NYU2031
construction plans for Washington Square
Village and Silver Towers/Coles. SD D N A SA NA
Dependents
95. NYU’s family leave policy is appropriate. SD D N A SA NA
96. The tenure clock stop policy is great. SD D N A SA NA
97. Availability of daycare for preschool children
is inadequate. SD D N A SA NA
98. The tuition remission program for dependent
undergraduate education is generous. SD D N A SA NA
99. I have to forgo professional activities because
of personal responsibilities. SD D N A SA NA
100. I have to forgo personal activities because of
professional responsibilities. SD D N A SA NA
101. I am satisfied with the way I balance my
professional and personal life. SD D N A SA NA
102. Care-giving responsibilities for my children
have slowed my career progression. SD D N A SA NA
103. Care-giving responsibilities for my parents,
In-laws, or spouse/partner have slowed my
career progression. SD D N A SA NA
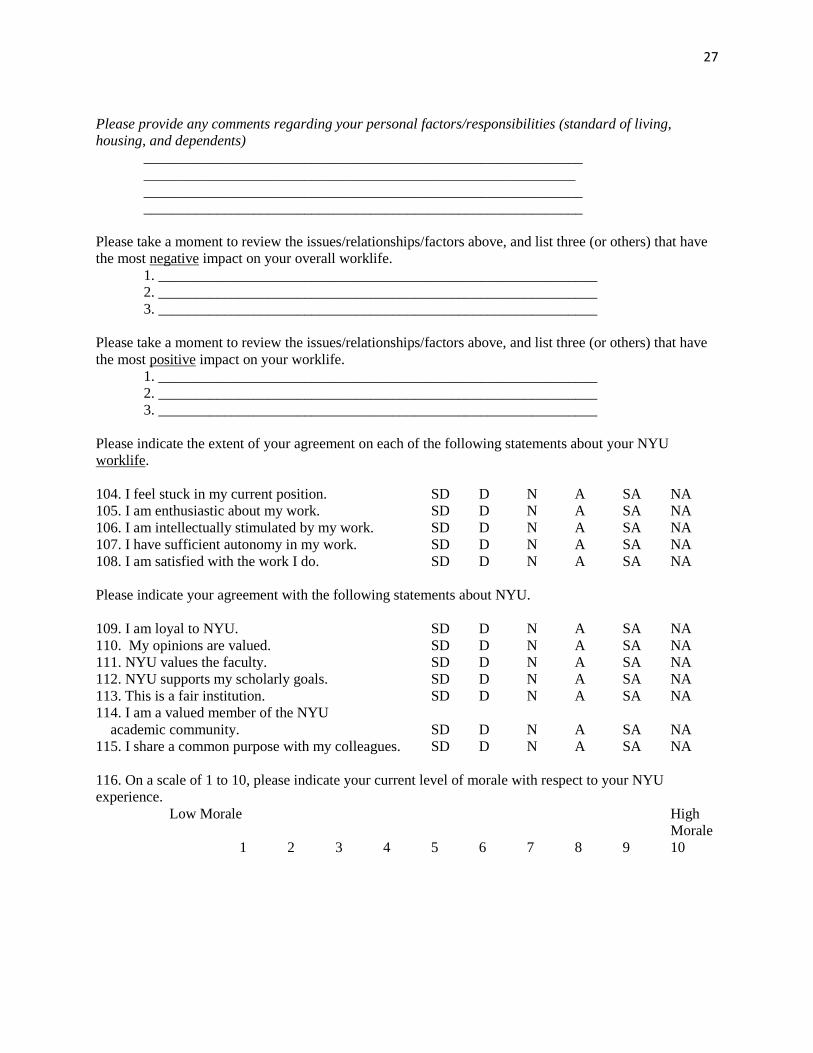
27
Please provide any comments regarding your personal factors/responsibilities (standard of living,
housing, and dependents)
____________________________________________________________
___________________________________________________________
____________________________________________________________
____________________________________________________________
Please take a moment to review the issues/relationships/factors above, and list three (or others) that have
the most negative impact on your overall worklife.
1. ____________________________________________________________
2. ____________________________________________________________
3. ____________________________________________________________
Please take a moment to review the issues/relationships/factors above, and list three (or others) that have
the most positive impact on your worklife.
1. ____________________________________________________________
2. ____________________________________________________________
3. ____________________________________________________________
Please indicate the extent of your agreement on each of the following statements about your NYU
worklife.
104. I feel stuck in my current position. SD D N A SA NA
105. I am enthusiastic about my work. SD D N A SA NA
106. I am intellectually stimulated by my work. SD D N A SA NA
107. I have sufficient autonomy in my work. SD D N A SA NA
108. I am satisfied with the work I do. SD D N A SA NA
Please indicate your agreement with the following statements about NYU.
109. I am loyal to NYU. SD D N A SA NA
110. My opinions are valued. SD D N A SA NA
111. NYU values the faculty. SD D N A SA NA
112. NYU supports my scholarly goals. SD D N A SA NA
113. This is a fair institution. SD D N A SA NA
114. I am a valued member of the NYU
academic community. SD D N A SA NA
115. I share a common purpose with my colleagues. SD D N A SA NA
116. On a scale of 1 to 10, please indicate your current level of morale with respect to your NYU
experience.
Low Morale High
Morale
1 2 3 4 5 6 7 8 9 10

28
Future Plans (Within 2 Years) Not Very
Likely Likely
117. How likely are you to leave your 1 2 3 4 5
current position?
118. How likely are you to leave NYU? 1 2 3 4 5
119. How likely are you to leave your
career/profession? 1 2 3 4 5
Demographic Information
120. Please indicate your Sex:
______ Female
______ Male
121. Please indicate your Race/Ethnicity:
____________________________________________________________
122. Please indicate your academic rank:
______ Assistant Professor
______ Associate Professor
______ Professor
______ Chair/Director
123. Please indicate the number of years you have been working as a faculty member at NYU:
____________________________________________________________
124. Please indicate your Division:
______ Humanities
______ Social Sciences
______ Sciences
125. Please indicate your Department name(s):
____________________________________________________________
If you have any additional comments that you would like to offer, we invite you to add them now:
____________________________________________________________
____________________________________________________________
____________________________________________________________
____________________________________________________________
Thank you for participating in this survey. The results, when tabulated, will be first presented at P&P, and
then at the FAS meeting in 2012.

29
Appendix 2
Means and Standard Deviations Professional Work-life Issues
Professional Work-life Issues* Total FAS Sex Race/Ethnicity
Teaching and Advising Activities x
(SD) Female Male
Ethnic
Minority Caucasian
1. Teaching loads are fairly distributed in my department. 3.80
(1.07)
3.71
(1.07)
3.88
(1.05)
3.74
(1.04)
3.85
(1.04)
2. I am able to teach the courses I want. 4.21
(.84)
4.15
(.91)
4.27
(.77)
4.23
(.87)
4.24
(.81)
3. I perceive that there are “special deals” being made
regarding teaching assignments. +
2.83
(1.27)
2.89
(1.24)
2.83
(1.29)
2.84
(1.40
2.85
(1.25)
4. My undergraduate teaching load is adequate. 4.13
(.63)
4.03
(.69)
4.21
(.56)
4.21
(.53)
4.13
(.63)
5. Undergraduate classes are too large. +
2.99
(1.17)
2.85
(1.11)
3.18
(1.22)
3.16
(1.26)
2.93
(1.18)
6. My graduate teaching load is adequate. 3.99
(.87)
3.93
(.92)
4.07
(.82)
4.10
(.64)
3.99
(.90)
7. I have a sufficient number of course assistants for my
courses.
3.52
(1.12)
3.44
(1.10)
3.56
(1.15)
3.60
(.95)
3.52
(1.14)
8. NYU provides enough pedagogical development. 3.10
(1.03)
3.11
(1.06)
3.08
(1.00)
3.22
(.99)
3.06
(1.02)
9. Teaching is undervalued in my department. +
3.19
(1.19)
3.21
(1.18)
3.19
(1.20)
3.03
(1.29)
3.27
(1.15)
Service and Committee Activities Total FAS Female Male Ethnic
Minority Caucasian
10. My department values my efforts on NYU
committees.
3.52
(.99)
3.59
(.94)
3.53
(.97)
3.57
(1.12)
3.57
(.91)
11. Committee assignments are not rotated fairly to allow
for participation of all faculty members. +
3.12
(1.14)
3.02
(1.19)
3.22
(1.10)
2.82
(1.20)
3.21
(1.11)
12. Workload is distributed equitably across all members
of the department, and adjusted by rank.
3.10
(1.18)
2.97
(1.19)
3.23
(1.15)
2.85
(1.31)
3.21
(1.11)
13. I feel compelled to attend events or agree to
administrative duties that take time away from my
scholarship because I fear that it will affect my future
academic promotion. +
3.51
(1.15)
3.23
(1.18)
3.75
(1.08)
2.70
(1.27)
3.73
(1.03)
Research and Scholarship Activities Total FAS Female Male Ethnic
Minority Caucasian
14. Institutional research funds are adequate for my work. 3.00
(1.22)
3.04
(1.16)
2.96
(1.27)
3.03
(1.16)
3.00
(1.24)
15. There are a sufficient number of student research
assistants to assist me in my work.
2.87
(1.21)
2.64
(1.19)
2.99
(1.17)
2.47
(1.22)
2.94
(1.19)
16. The Chairs and Deans overvalue research. +
3.73
(1.14)
3.55
(1.06)
3.87
(.98)
3.55
(.98)
3.80
(1.03)
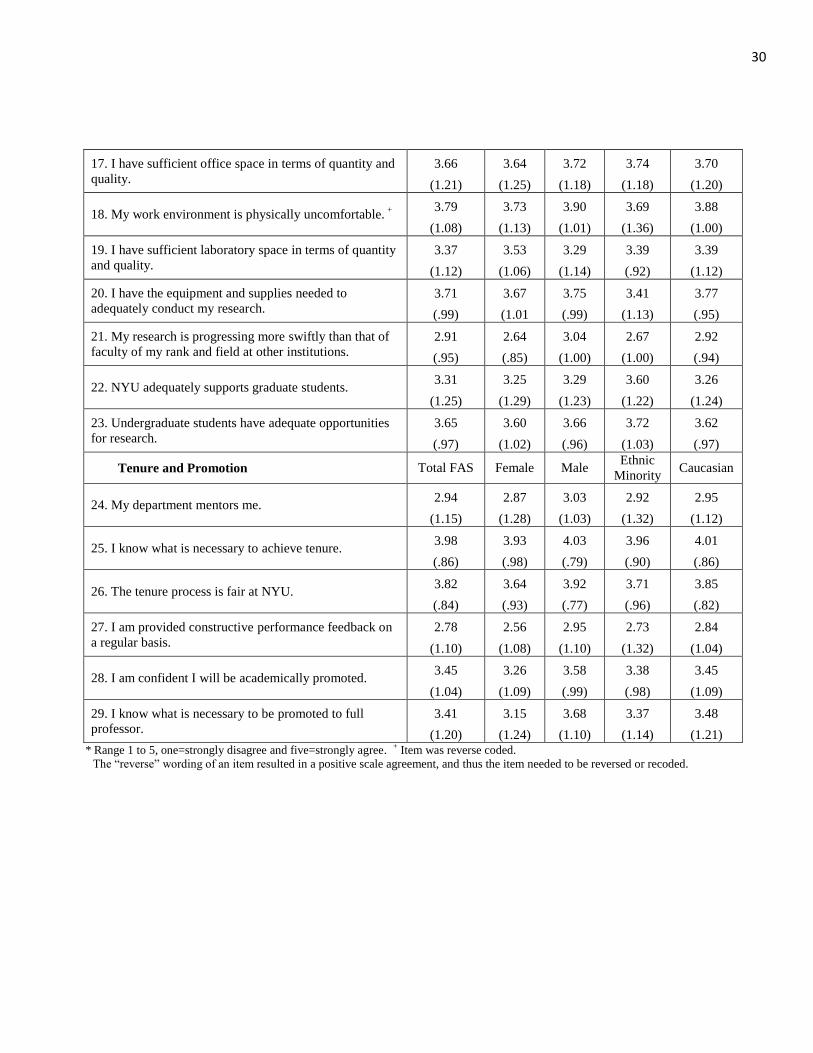
30
17. I have sufficient office space in terms of quantity and
quality.
3.66
(1.21)
3.64
(1.25)
3.72
(1.18)
3.74
(1.18)
3.70
(1.20)
18. My work environment is physically uncomfortable. +
3.79
(1.08)
3.73
(1.13)
3.90
(1.01)
3.69
(1.36)
3.88
(1.00)
19. I have sufficient laboratory space in terms of quantity
and quality.
3.37
(1.12)
3.53
(1.06)
3.29
(1.14)
3.39
(.92)
3.39
(1.12)
20. I have the equipment and supplies needed to
adequately conduct my research.
3.71
(.99)
3.67
(1.01
3.75
(.99)
3.41
(1.13)
3.77
(.95)
21. My research is progressing more swiftly than that of
faculty of my rank and field at other institutions.
2.91
(.95)
2.64
(.85)
3.04
(1.00)
2.67
(1.00)
2.92
(.94)
22. NYU adequately supports graduate students. 3.31
(1.25)
3.25
(1.29)
3.29
(1.23)
3.60
(1.22)
3.26
(1.24)
23. Undergraduate students have adequate opportunities
for research.
3.65
(.97)
3.60
(1.02)
3.66
(.96)
3.72
(1.03)
3.62
(.97)
Tenure and Promotion Total FAS Female Male Ethnic
Minority Caucasian
24. My department mentors me. 2.94
(1.15)
2.87
(1.28)
3.03
(1.03)
2.92
(1.32)
2.95
(1.12)
25. I know what is necessary to achieve tenure. 3.98
(.86)
3.93
(.98)
4.03
(.79)
3.96
(.90)
4.01
(.86)
26. The tenure process is fair at NYU. 3.82
(.84)
3.64
(.93)
3.92
(.77)
3.71
(.96)
3.85
(.82)
27. I am provided constructive performance feedback on
a regular basis.
2.78
(1.10)
2.56
(1.08)
2.95
(1.10)
2.73
(1.32)
2.84
(1.04)
28. I am confident I will be academically promoted. 3.45
(1.04)
3.26
(1.09)
3.58
(.99)
3.38
(.98)
3.45
(1.09)
29. I know what is necessary to be promoted to full
professor.
3.41
(1.20)
3.15
(1.24)
3.68
(1.10)
3.37
(1.14)
3.48
(1.21) * Range 1 to 5, one=strongly disagree and five=strongly agree. + Item was reverse coded.
The “reverse” wording of an item resulted in a positive scale agreement, and thus the item needed to be reversed or recoded.
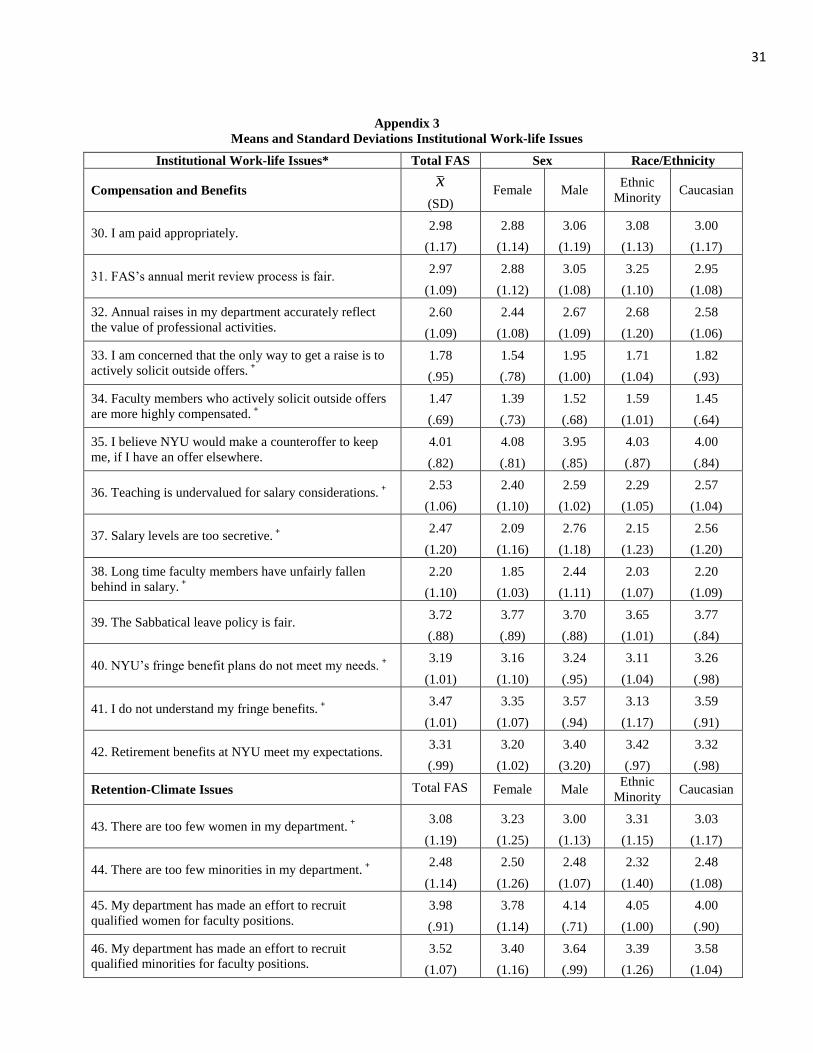
31
Appendix 3
Means and Standard Deviations Institutional Work-life Issues
Institutional Work-life Issues* Total FAS Sex Race/Ethnicity
Compensation and Benefits x
(SD) Female Male
Ethnic
Minority Caucasian
30. I am paid appropriately. 2.98
(1.17)
2.88
(1.14)
3.06
(1.19)
3.08
(1.13)
3.00
(1.17)
31. FAS’s annual merit review process is fair. 2.97
(1.09)
2.88
(1.12)
3.05
(1.08)
3.25
(1.10)
2.95
(1.08)
32. Annual raises in my department accurately reflect
the value of professional activities.
2.60
(1.09)
2.44
(1.08)
2.67
(1.09)
2.68
(1.20)
2.58
(1.06)
33. I am concerned that the only way to get a raise is to
actively solicit outside offers. +
1.78
(.95)
1.54
(.78)
1.95
(1.00)
1.71
(1.04)
1.82
(.93)
34. Faculty members who actively solicit outside offers
are more highly compensated. +
1.47
(.69)
1.39
(.73)
1.52
(.68)
1.59
(1.01)
1.45
(.64)
35. I believe NYU would make a counteroffer to keep
me, if I have an offer elsewhere.
4.01
(.82)
4.08
(.81)
3.95
(.85)
4.03
(.87)
4.00
(.84)
36. Teaching is undervalued for salary considerations. +
2.53
(1.06)
2.40
(1.10)
2.59
(1.02)
2.29
(1.05)
2.57
(1.04)
37. Salary levels are too secretive. +
2.47
(1.20)
2.09
(1.16)
2.76
(1.18)
2.15
(1.23)
2.56
(1.20)
38. Long time faculty members have unfairly fallen
behind in salary. +
2.20
(1.10)
1.85
(1.03)
2.44
(1.11)
2.03
(1.07)
2.20
(1.09)
39. The Sabbatical leave policy is fair. 3.72
(.88)
3.77
(.89)
3.70
(.88)
3.65
(1.01)
3.77
(.84)
40. NYU’s fringe benefit plans do not meet my needs. +
3.19
(1.01)
3.16
(1.10)
3.24
(.95)
3.11
(1.04)
3.26
(.98)
41. I do not understand my fringe benefits. +
3.47
(1.01)
3.35
(1.07)
3.57
(.94)
3.13
(1.17)
3.59
(.91)
42. Retirement benefits at NYU meet my expectations. 3.31
(.99)
3.20
(1.02)
3.40
(3.20)
3.42
(.97)
3.32
(.98)
Retention-Climate Issues Total FAS Female Male Ethnic
Minority Caucasian
43. There are too few women in my department. +
3.08
(1.19)
3.23
(1.25)
3.00
(1.13)
3.31
(1.15)
3.03
(1.17)
44. There are too few minorities in my department. +
2.48
(1.14)
2.50
(1.26)
2.48
(1.07)
2.32
(1.40)
2.48
(1.08)
45. My department has made an effort to recruit
qualified women for faculty positions.
3.98
(.91)
3.78
(1.14)
4.14
(.71)
4.05
(1.00)
4.00
(.90)
46. My department has made an effort to recruit
qualified minorities for faculty positions.
3.52
(1.07)
3.40
(1.16)
3.64
(.99)
3.39
(1.26)
3.58
(1.04)

32
47. My department has taken steps to enhance the
climate for women.
3.44
(1.02)
3.25
(1.21)
3.65
(.78)
3.59
(1.14)
3.47
(.97)
48. My department has taken steps to enhance the
climate for minorities.
3.14
(1.02)
3.10
(1.12)
3.24
(.91)
2.95
(1.20)
3.25
(.96)
49. Women faculty members are less likely to have
influence in departmental administration. +
3.79
(1.11)
3.42
(1.29)
4.06
(.87)
3.34
(1.38)
3.89
(1.04)
50. Minority faculty members are less likely to have
influence in departmental administration. +
3.57
(1.08)
3.41
(1.19)
3.71
(.96)
3.17
(1.36)
3.69
(.99)
51. Most faculty would be comfortable with a woman
department chair.
4.34
(.96)
4.18
(1.11)
4.46
(.78)
4.32
(1.00)
4.37
(.94)
52. Most faculty would be comfortable with a minority
department chair.
4.24
(.96)
4.04
(1.13)
4.36
(.83)
3.63
(1.37)
4.36
(.84)
53. Female faculty members are more likely to be
involved in informal social networks within the
department.
2.85
(1.02)
2.89
(1.25)
2.81
(.85)
3.24
(.94)
2.77
(1.04)
54. Minority faculty members are more likely to be
involved in informal social networks within the
department.
2.63
(.76)
2.78
(.84)
2.52
(.71)
2.96
(.90)
2.57
(.75)
* Range 1 to 5, one=strongly disagree and five=strongly agree + Item was reverse coded
Appendix 4
Means and Standard Deviations Inter- and Intra- Department Relations
Inter- and Intra- Department Relations* Total FAS Sex Race/Ethnicity
University Relations (Inter-Department Relations) x
(SD) Female Male
Ethnic
Minority Caucasian
55. NYU’s reputation is important to me. 4.27
(.65)
4.26
(.61)
4.28
(.66)
4.41
(.55)
4.25
(.65)
56. NYU’s reputation is an asset to me. 3.98
(.84)
3.96
(.86)
3.99
(.83)
3.95
(.97)
3.98
(.83)
57. Relations among NYU faculty beyond my
department are collegial.
3.81
(.77)
3.81
(.87)
3.81
(.66)
4.03
(.76)
3.79
(.72)
58. I have never interacted with my Deans. +
3.79
(1.09)
3.83
(1.04)
3.76
(1.13)
3.56
(1.21)
3.88
(1.05)
59. I have colleagues at NYU who give me career
advice or guidance.
3.40
(1.12)
3.34
(1.16)
3.45
(1.07)
3.18
(1.29)
3.45
(1.06)
60. Endowed chairs are awarded in an unfair manner. +
2.80
(1.06)
2.57
(1.01)
2.95
(1.07)
2.94
(.80)
2.82
(1.07)
61. Faculty members are not given enough “voice” in
university decisions. +
1.82
(1.02)
1.65
(.95)
1.94
(1.05)
1.79
(1.01)
1.84
(1.02)

33
Department Relations Total FAS Female Male Ethnic
Minority Caucasian
62. My department chair treats me with respect. 4.23
(1.01)
4.25
(1.01)
4.26
(.99)
4.00
(1.21)
4.31
(.95)
63. My chair supports my career. 4.08
(1.04)
4.15
(1.01)
4.06
(1.03)
3.97
(1.13)
4.14
(.99)
64. I fit intellectually within my department. 4.02
(1.02)
3.95
(1.15)
4.09
(.91)
4.18
(.91)
4.01
(1.04)
65. Relations within my department are collegial. 3.92
(1.08)
3.83
(1.19)
3.99
(.99)
3.87
(1.10)
3.96
(1.06)
66. I feel I can voice my opinions openly in my
department.
3.91
(1.10)
3.67
(1.31)
4.09
(.88)
3.67
(1.22)
3.99
(1.05)
67. I do not have a voice in how resources are allocated
within my department. +
3.17
(1.21)
3.02
(1.21)
3.28
(1.19)
2.60
(1.28)
3.31
(1.15)
68. I feel like an equal participant in the decision-
making in my department.
3.47
(1.22)
3.42
(1.22)
3.55
(1.20)
3.23
(1.37)
3.57
(1.15)
69. I feel isolated in my department. +
3.80
(1.12)
3.72
(1.19)
3.86
(1.07)
3.64
(1.29)
3.85
(1.10)
70. I feel excluded from informal networks in my
department. +
3.73
(1.10)
3.61
(1.16)
3.80
(1.04)
3.51
(1.19)
3.76
(1.09)
71. I generally feel comfortable with the atmosphere in
my department.
3.79
(1.09)
3.68
(1.18)
3.90
(1.00)
3.67
(1.22)
3.85
(1.06)
72. Teaching by Clinical Faculty (CF) members in my
department enables me to focus on my research.
2.99
(1.23)
2.79
(1.30)
3.14
(1.16)
2.79
(1.18)
3.07
(1.21)
73. CF members actively participate in departmental
decision making.
2.69
(1.19)
2.80
(1.13)
2.62
(1.23)
2.79
(1.10)
2.67
(1.20)
74. CF members are valued in my department. 3.32
(1.15)
3.27
(1.04)
3.32
(1.18)
3.30
(1.13)
3.33
(1.11)
75. CF members are as committed to NYU as I am. 3.45
(1.09)
3.41
(1.13)
3.46
(1.04)
3.30
(1.26)
3.50
(1.03)
Interpersonal Relations Total FAS Female Male Ethnic
Minority Caucasian
76. Colleagues treat me with respect. 4.08
(.85)
3.96
(.98)
4.17
(.74)
4.00
(1.01)
4.10
(.83)
77. Faculty meetings allow for all participants to share
their views.
3.86
(1.07)
3.68
(1.20)
3.99
(.96)
3.67
(1.20)
3.92
(1.04)
78. I have to work harder than some of my colleagues to
be perceived as a legitimate scholar. +
3.56
(1.14)
3.22
(1.20)
3.79
(1.01)
2.95
(1.35)
3.67
(1.04)
79. Faculty members in my department are supportive of
colleagues with family obligations.
3.90
(.83)
3.82
(.89)
3.98
(.76)
3.74
(.95)
3.96
(.79)
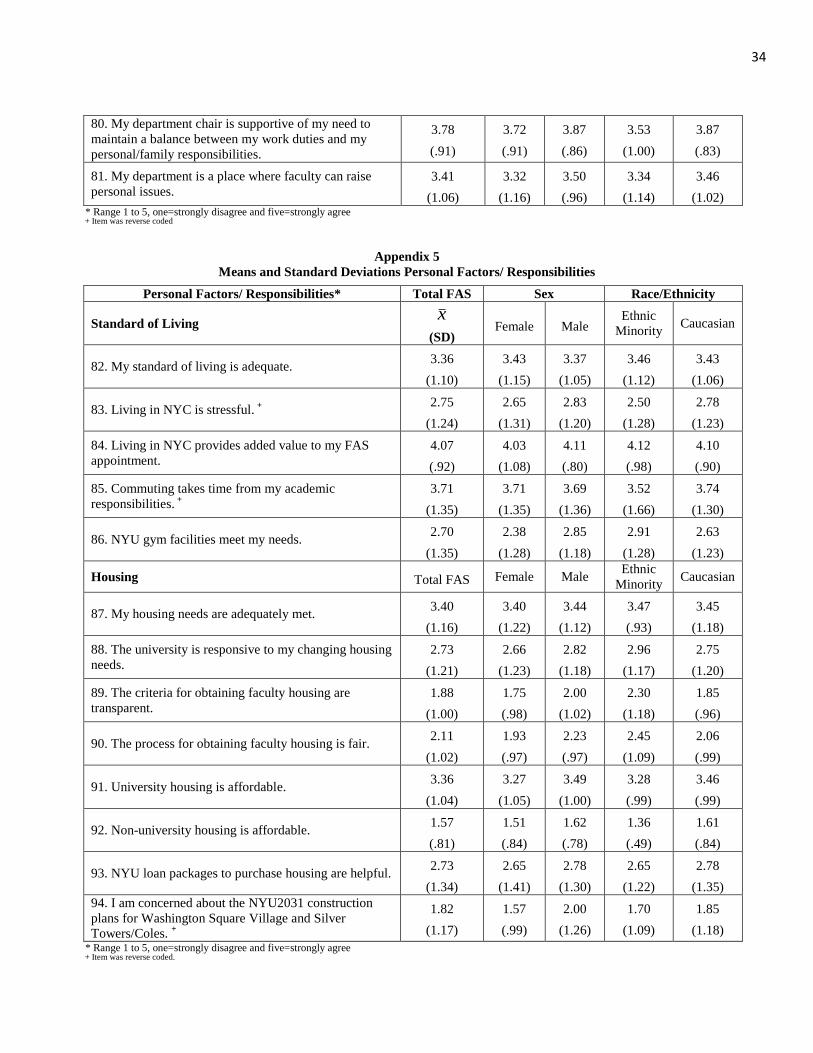
34
80. My department chair is supportive of my need to
maintain a balance between my work duties and my
personal/family responsibilities.
3.78
(.91)
3.72
(.91)
3.87
(.86)
3.53
(1.00)
3.87
(.83)
81. My department is a place where faculty can raise
personal issues.
3.41
(1.06)
3.32
(1.16)
3.50
(.96)
3.34
(1.14)
3.46
(1.02) * Range 1 to 5, one=strongly disagree and five=strongly agree + Item was reverse coded
Appendix 5
Means and Standard Deviations Personal Factors/ Responsibilities
Personal Factors/ Responsibilities* Total FAS Sex Race/Ethnicity
Standard of Living x
(SD) Female Male
Ethnic
Minority Caucasian
82. My standard of living is adequate. 3.36
(1.10)
3.43
(1.15)
3.37
(1.05)
3.46
(1.12)
3.43
(1.06)
83. Living in NYC is stressful. +
2.75
(1.24)
2.65
(1.31)
2.83
(1.20)
2.50
(1.28)
2.78
(1.23)
84. Living in NYC provides added value to my FAS
appointment.
4.07
(.92)
4.03
(1.08)
4.11
(.80)
4.12
(.98)
4.10
(.90)
85. Commuting takes time from my academic
responsibilities. +
3.71
(1.35)
3.71
(1.35)
3.69
(1.36)
3.52
(1.66)
3.74
(1.30)
86. NYU gym facilities meet my needs. 2.70
(1.35)
2.38
(1.28)
2.85
(1.18)
2.91
(1.28)
2.63
(1.23)
Housing Total FAS Female Male Ethnic
Minority Caucasian
87. My housing needs are adequately met. 3.40
(1.16)
3.40
(1.22)
3.44
(1.12)
3.47
(.93)
3.45
(1.18)
88. The university is responsive to my changing housing
needs.
2.73
(1.21)
2.66
(1.23)
2.82
(1.18)
2.96
(1.17)
2.75
(1.20)
89. The criteria for obtaining faculty housing are
transparent.
1.88
(1.00)
1.75
(.98)
2.00
(1.02)
2.30
(1.18)
1.85
(.96)
90. The process for obtaining faculty housing is fair. 2.11
(1.02)
1.93
(.97)
2.23
(.97)
2.45
(1.09)
2.06
(.99)
91. University housing is affordable. 3.36
(1.04)
3.27
(1.05)
3.49
(1.00)
3.28
(.99)
3.46
(.99)
92. Non-university housing is affordable. 1.57
(.81)
1.51
(.84)
1.62
(.78)
1.36
(.49)
1.61
(.84)
93. NYU loan packages to purchase housing are helpful. 2.73
(1.34)
2.65
(1.41)
2.78
(1.30)
2.65
(1.22)
2.78
(1.35)
94. I am concerned about the NYU2031 construction
plans for Washington Square Village and Silver
Towers/Coles. +
1.82
(1.17)
1.57
(.99)
2.00
(1.26)
1.70
(1.09)
1.85
(1.18)
* Range 1 to 5, one=strongly disagree and five=strongly agree + Item was reverse coded.

35
Dependents (Family Responsibilities) Total FAS Female Male Ethnic
Minority Caucasian
95. NYU’s family leave policy is appropriate. 3.67
(.86)
3.58
(.91)
3.73
(.83)
3.59
(.91)
3.74
(.80)
96. The tenure clock stop policy is great. 3.89
(.86)
3.97
(.86)
3.82
(.82)
3.87
(1.06)
3.93
(.73)
97. Availability of daycare for preschool children is
inadequate.
4.01
(1.23)
4.23
(1.15)
3.83
(1.26)
3.86
(1.24)
4.05
(1.20)
98. The tuition remission program for dependent
undergraduate education is generous.
2.53
(1.19)
2.53
(1.24)
2.56
(1.17)
2.72
(1.28)
2.51
(1.16)
99. I have to forgo professional activities because of
personal responsibilities. +
2.80
(1.15)
2.63
(1.13)
2.89
(1.15)
2.31
(1.01)
2.87
(1.14)
100. I have to forgo personal activities because of
professional responsibilities. +
2.50
(1.10)
2.29
(1.08)
2.68
(1.08)
2.08
(.94)
2.60
(1.11)
101. I am satisfied with the way I balance my
professional and personal life.
3.34
(1.01)
3.22
(1.04)
3.46
(.95)
2.97
(1.06)
3.43
(.97)
102. Caregiving responsibilities for my children have
slowed my career progression. +
2.69
(1.20)
2.16
(1.14)
2.94
(1.14)
2.11
(1.13)
2.76
(1.19)
103. Caregiving responsibilities for my parents, in-laws,
or spouse/partner have slowed my career progression. +
3.20
(1.22)
2.80
(1.29)
3.46
(1.09)
2.62
(1.24)
3.34
(1.19) * Range 1 to 5, one=strongly disagree and five=strongly agree + Item was reverse coded.
Appendix 6
Means and Standard Deviations for Job Satisfaction
Job Satisfaction* Total FAS Sex Race/Ethnicity
Statements about My Job Satisfaction x
(SD) Female Male
Ethnic
Minority Caucasian
104. I feel stuck in my current position. 2.51
(1.18)
2.74
(1.25)
2.36
(1.12)
2.65
(1.19)
2.47
(1.19)
105. I am enthusiastic about my work. 4.41
(.69)
4.38
(.76)
4.43
(.64)
4.46
(.68)
4.42
(.68)
106. I am intellectually stimulated by my work. 4.54
(.61)
4.50
(.72)
4.56
(.52)
4.56
(.68)
4.55
(.59)
107. I have sufficient autonomy in my work. 4.52
(.68)
4.49
(.72)
4.54
(.65)
4.41
(.78)
4.58
(.61)
108. I am satisfied with the work I do. 4.25
(.83)
4.22
(.88)
4.27
(.77)
4.15
(.93)
4.29
(.81) * Range 1 to 5, one=strongly disagree and five=strongly agree
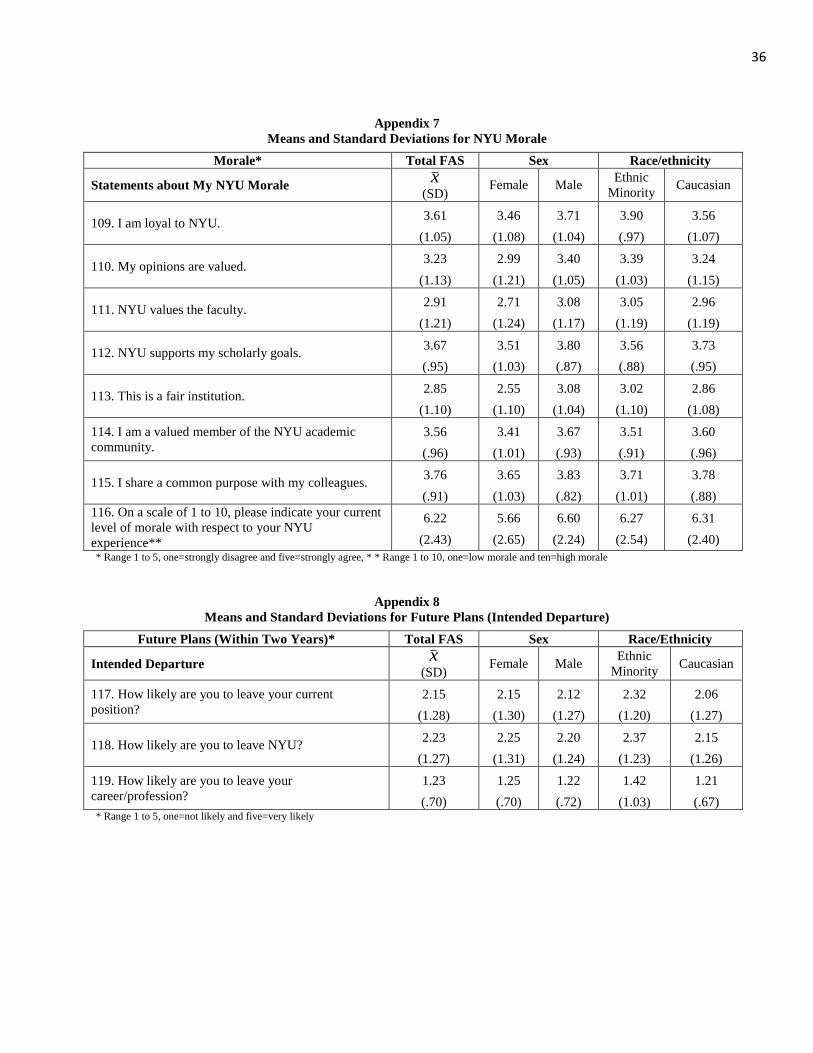
36
Appendix 7
Means and Standard Deviations for NYU Morale
Morale* Total FAS Sex Race/ethnicity
Statements about My NYU Morale x
(SD) Female Male
Ethnic
Minority Caucasian
109. I am loyal to NYU. 3.61
(1.05)
3.46
(1.08)
3.71
(1.04)
3.90
(.97)
3.56
(1.07)
110. My opinions are valued. 3.23
(1.13)
2.99
(1.21)
3.40
(1.05)
3.39
(1.03)
3.24
(1.15)
111. NYU values the faculty. 2.91
(1.21)
2.71
(1.24)
3.08
(1.17)
3.05
(1.19)
2.96
(1.19)
112. NYU supports my scholarly goals. 3.67
(.95)
3.51
(1.03)
3.80
(.87)
3.56
(.88)
3.73
(.95)
113. This is a fair institution. 2.85
(1.10)
2.55
(1.10)
3.08
(1.04)
3.02
(1.10)
2.86
(1.08)
114. I am a valued member of the NYU academic
community.
3.56
(.96)
3.41
(1.01)
3.67
(.93)
3.51
(.91)
3.60
(.96)
115. I share a common purpose with my colleagues. 3.76
(.91)
3.65
(1.03)
3.83
(.82)
3.71
(1.01)
3.78
(.88)
116. On a scale of 1 to 10, please indicate your current
level of morale with respect to your NYU
experience**
6.22
(2.43)
5.66
(2.65)
6.60
(2.24)
6.27
(2.54)
6.31
(2.40)
* Range 1 to 5, one=strongly disagree and five=strongly agree, * * Range 1 to 10, one=low morale and ten=high morale
Appendix 8
Means and Standard Deviations for Future Plans (Intended Departure)
Future Plans (Within Two Years)* Total FAS Sex Race/Ethnicity
Intended Departure x
(SD) Female Male
Ethnic
Minority Caucasian
117. How likely are you to leave your current
position?
2.15
(1.28)
2.15
(1.30)
2.12
(1.27)
2.32
(1.20)
2.06
(1.27)
118. How likely are you to leave NYU? 2.23
(1.27)
2.25
(1.31)
2.20
(1.24)
2.37
(1.23)
2.15
(1.26)
119. How likely are you to leave your
career/profession?
1.23
(.70)
1.25
(.70)
1.22
(.72)
1.42
(1.03)
1.21
(.67) * Range 1 to 5, one=not likely and five=very likely

37
Appendix 9
Means and Standard Deviations Professional Work-life Issues
Professional Work-life Issues*
Teaching and Advising Activities (Alpha .70, x =3.52, sd=.54)
1. Teaching loads are fairly distributed in my department.
2. I am able to teach the courses I want.
3. I perceive that there are “special deals” being made regarding teaching assignments.
4. My undergraduate teaching load is adequate.
5. Undergraduate classes are too large.
6. My graduate teaching load is adequate.
7. I have a sufficient number of course assistants for my courses.
8. NYU provides enough pedagogical development.
9. Teaching is undervalued in my department.
Service and Committee Activities (Alpha .68, x =3.29, sd=.81)
10. My department values my efforts on NYU committees.
11. Committee assignments are not rotated fairly to allow for participation of all faculty members.
12. Workload is distributed equitably across all members of the department, and adjusted by rank.
13. I feel compelled to attend events or agree to administrative duties that take time away from my scholarship
because I fear that it will affect my future academic promotion.
Research and Scholarship Activities (Alpha .72, x =3.25, sd=.80)
14. Institutional research funds are adequate for my work.
15. There are a sufficient number of student research assistants to assist me in my work.
16. The Chairs and Deans overvalue research.*
17. I have sufficient office space in terms of quantity and quality.
18. My work environment is physically uncomfortable.*
19. I have sufficient laboratory space in terms of quantity and quality.
20. I have the equipment and supplies needed to adequately conduct my research.
21. My research is progressing more swiftly than that of faculty of my rank and field at other institutions.*
22. NYU adequately supports graduate students.*
23. Undergraduate students have adequate opportunities for research.*
*Items eliminated from the dimension.
Tenure and Promotion (Alpha .83, x =3.38, sd=.74)
24. My department mentors me.
25. I know what is necessary to achieve tenure.
26. The tenure process is fair at NYU.
27. I am provided constructive performance feedback on a regular basis.
28. I am confident I will be academically promoted.
29. I know what is necessary to be promoted to full professor.
Institutional Work-life Issues
Compensation and Benefits (Alpha .80, x =2.59, sd=.50)
30. I am paid appropriately.
31. FAS’s annual merit review process is fair.
32. Annual raises in my department accurately reflect the value of professional activities.
33. I am concerned that the only way to get a raise is to actively solicit outside offers.
34. Faculty members who actively solicit outside offers are more highly compensated.*
35. I believe NYU would make a counteroffer to keep me, if I have an offer elsewhere.*
36. Teaching is undervalued for salary considerations.
37. Salary levels are too secretive.
38. Long time faculty members have unfairly fallen behind in salary.
39. The Sabbatical leave policy is fair.
40. NYU’s fringe benefit plans do not meet my needs.
41. I do not understand my fringe benefits.
42. Retirement benefits at NYU meet my expectations.
*Items eliminated from the dimension.

38
Retention-Climate Issues*
Gender-Race Recruitment* (Alpha .80, x =3.75, sd=.72)
45. My department has made an effort to recruit qualified women for faculty positions.
46. My department has made an effort to recruit qualified minorities for faculty positions.
47. My department has taken steps to enhance the climate for women.
48. My department has taken steps to enhance the climate for minorities.
Gender-Race Issues * (Alpha .79, x =3.10, sd=.54)
43. There are too few women in my department.
44. There are too few minorities in my department.
49. Women faculty members are less likely to have influence in departmental administration.
50. Minority faculty members are less likely to have influence in departmental administration.
51. Most faculty would be comfortable with a woman department chair.
52. Most faculty would be comfortable with a minority department chair.
53. Female faculty members are more likely to be involved in informal social networks within the department.
54. Minority faculty members are more likely to be involved in informal social networks within the department.
*Gender-Race Recruitment and Gender-Race issues were created from Retention-Climate Issues
Inter- and Intra- Department Relations
Inter-Department Relations (Alpha .70, x =3.42, sd=.49)
55. NYU’s reputation is important to me.
56. NYU’s reputation is an asset to me.
57. Relations among NYU faculty beyond my department are collegial.
58. I have never interacted with my Deans.
59. I have colleagues at NYU who give me career advice or guidance.
60. Endowed chairs are awarded in an unfair manner.
61. Faculty members are not given enough “voice” in university decisions.
Department Relations (Alpha .84, x =3.58, sd=.69)
62. My department chair treats me with respect.
63. My chair supports my career.
64. I fit intellectually within my department.
65. Relations within my department are collegial.
68. I feel like an equal participant in the decision-making in my department.
71. I generally feel comfortable with the atmosphere in my department.
72. Teaching by Clinical Faculty (CF) members in my department enables me to focus on my research.
73. CF members actively participate in departmental decision making.
74. CF members are valued in my department.
75. CF members are as committed to NYU as I am.
Department Voice* (Alpha .79, x =3.56, sd=.97)
66. I feel I can voice my opinions openly in my department.
67. I do not have a voice in how resources are allocated within my department.
69. I feel isolated in my department.
70. I feel excluded from informal networks in my department.
*Department voice was created from department relations
Interpersonal Relations (Alpha .86, x =3.74, sd=.77)
76. Colleagues treat me with respect.
77. Faculty meetings allow for all participants to share their views.
78. I have to work harder than some of my colleagues to be perceived as a legitimate scholar.
79. Faculty members in my department are supportive of colleagues with family obligations.
80. My department chair is supportive of my need to maintain a balance between my work duties and my
personal/family responsibilities.
81. My department is a place where faculty can raise personal issues.
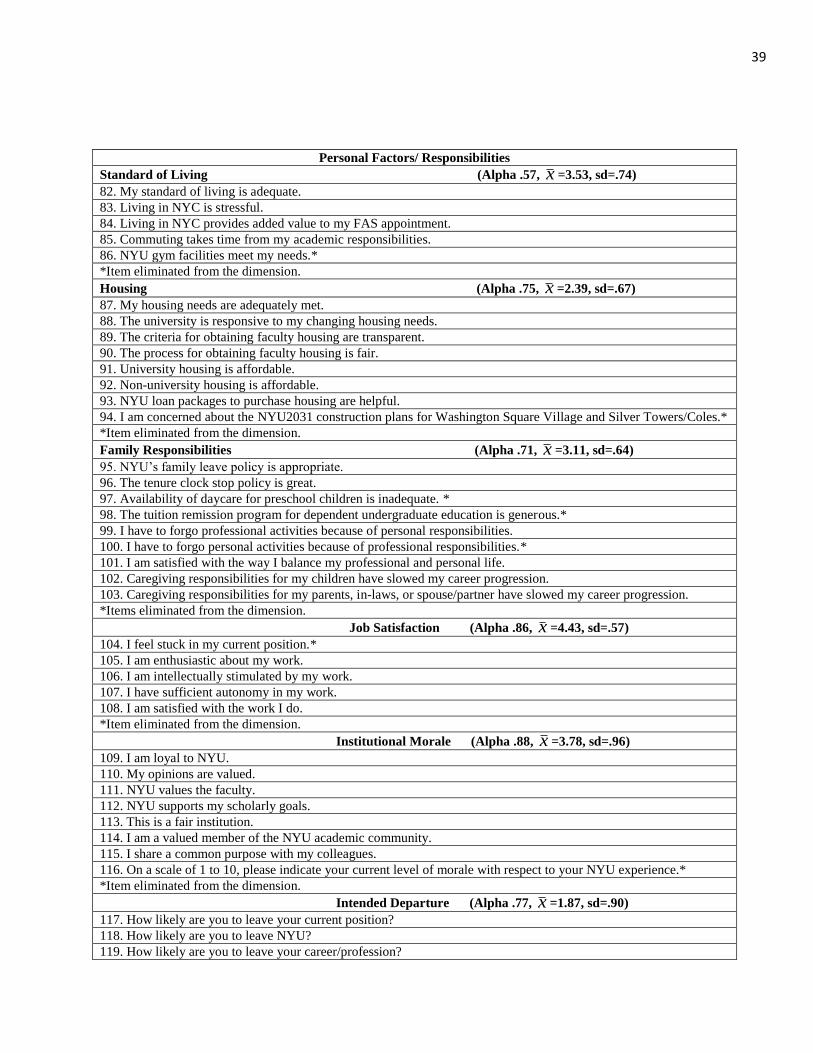
39
Personal Factors/ Responsibilities
Standard of Living (Alpha .57, x =3.53, sd=.74)
82. My standard of living is adequate.
83. Living in NYC is stressful.
84. Living in NYC provides added value to my FAS appointment.
85. Commuting takes time from my academic responsibilities.
86. NYU gym facilities meet my needs.*
*Item eliminated from the dimension.
Housing (Alpha .75, x =2.39, sd=.67)
87. My housing needs are adequately met.
88. The university is responsive to my changing housing needs.
89. The criteria for obtaining faculty housing are transparent.
90. The process for obtaining faculty housing is fair.
91. University housing is affordable.
92. Non-university housing is affordable.
93. NYU loan packages to purchase housing are helpful.
94. I am concerned about the NYU2031 construction plans for Washington Square Village and Silver Towers/Coles.*
*Item eliminated from the dimension.
Family Responsibilities (Alpha .71, x =3.11, sd=.64)
95. NYU’s family leave policy is appropriate.
96. The tenure clock stop policy is great.
97. Availability of daycare for preschool children is inadequate. *
98. The tuition remission program for dependent undergraduate education is generous.*
99. I have to forgo professional activities because of personal responsibilities.
100. I have to forgo personal activities because of professional responsibilities.*
101. I am satisfied with the way I balance my professional and personal life.
102. Caregiving responsibilities for my children have slowed my career progression.
103. Caregiving responsibilities for my parents, in-laws, or spouse/partner have slowed my career progression.
*Items eliminated from the dimension.
Job Satisfaction (Alpha .86, x =4.43, sd=.57)
104. I feel stuck in my current position.*
105. I am enthusiastic about my work.
106. I am intellectually stimulated by my work.
107. I have sufficient autonomy in my work.
108. I am satisfied with the work I do.
*Item eliminated from the dimension.
Institutional Morale (Alpha .88, x =3.78, sd=.96)
109. I am loyal to NYU.
110. My opinions are valued.
111. NYU values the faculty.
112. NYU supports my scholarly goals.
113. This is a fair institution.
114. I am a valued member of the NYU academic community.
115. I share a common purpose with my colleagues.
116. On a scale of 1 to 10, please indicate your current level of morale with respect to your NYU experience.*
*Item eliminated from the dimension.
Intended Departure (Alpha .77, x =1.87, sd=.90)
117. How likely are you to leave your current position?
118. How likely are you to leave NYU?
119. How likely are you to leave your career/profession?