New York State Education Department Understanding The Process: Science Assessments and the New York...
38
New York State Education Department Understanding The Process: Science Assessments and the New York State Learning Standards
-
Upload
silas-morgan-nash -
Category
Documents
-
view
217 -
download
2
Transcript of New York State Education Department Understanding The Process: Science Assessments and the New York...

New York State Education Department
Understanding The Process:
Science Assessments and the New York State Learning Standards

January 2002
NYSED
New York State Learning Standards• April 1994, the Board of Regents approved a
plan to revise the State assessment system based on learning standards.
• July 1996, the Board of Regents approved 28 learning standards in seven standard areas:– Math Science and Technology, Social Studies,
The Arts, English Language Arts, Languages other than English, Career Development and Occupational Studies, Family Consumer Science/Health/Physical Education
January 2002
NYSED
New York State Learning Standards• Learning standards outline what students
should know, understand and be able to do in a specific subject area
• Learning standards contain content and performance standards– Content Standard
The knowledge, skills, and understandings that individuals can habitually demonstrate over time as a consequence of instruction and experience
– Performance Standards Levels of student achievement in domains of study

January 2002
NYSED
New York State Learning Standards• Learning standards consist of performance
indicators at the: – Elementary ( K-4) ,– Intermediate (5-8), and – Commencement (9-12) levels
• Performance indicators are embedded in the learning standards and are aligned to Science Core Curriculum Guides and State Assessments

January 2002
NYSED
State Assessments• Provide a uniform measure of student achievement
across all districts, all schools, all classrooms • State tests assess the extent to which students have
achieved the learning standards in a content area • Are important indicators of student achievement of
the learning standards • Are used to understand individual student needs in
conjunction with other appropriate measures• Drive necessary changes in curriculum and
classroom instruction

January 2002
NYSED
Science Assessments• Elementary Science Elementary Science Program
Evaluation Test (ESPET) Administered at Grade 4
• Intermediate Science Intermediate Level Science Administered at Grade 8
• Commencement Level Regents Science ExamsLiving EnvironmentPhysical Setting/Earth SciencePhysical Setting/ChemistryPhysical Setting/Physics
January 2002
NYSED Test Development Process
in Science• The test development process ensures assessments created are fair, valid and reliable measures of student performance in relation to meeting the State learning standards
• The process involves 19 steps and approximately two-three years to develop a State assessment
January 2002
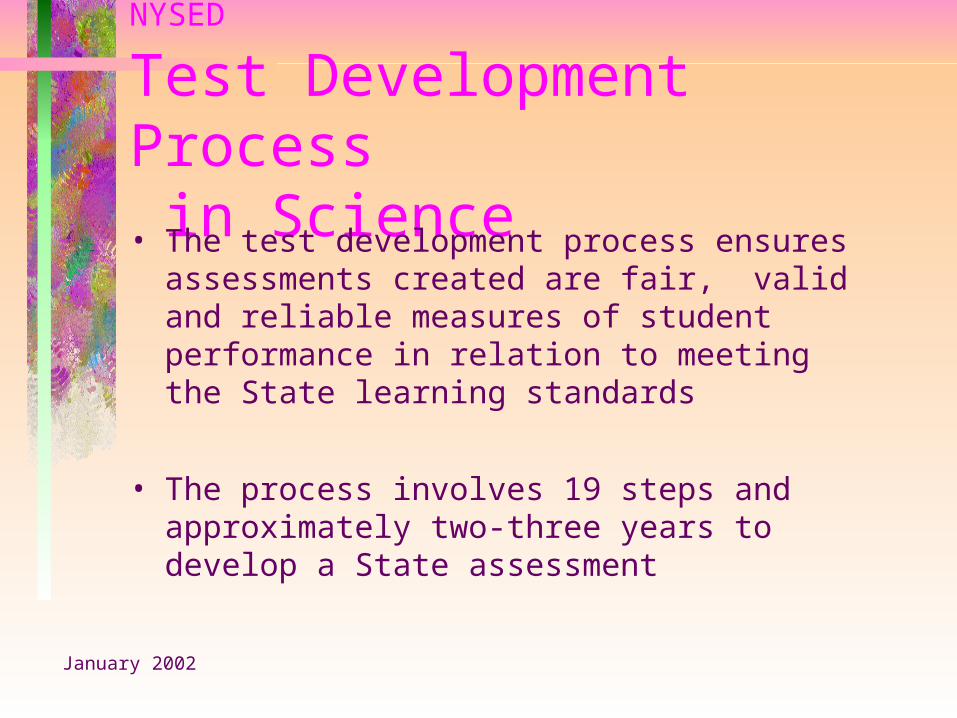
NYSED Test Development Process
Item W ritingSolic it item w ritersTrain item w riters
Test item s are subm itted and review ed
Testing Item sPre Test item s/form sF ield tes t item s/form s
O perational form s/Tests
Test AnalaysisPre test data/F ield tes t dataItem analys is /Test analys is
Exam review com m ittees/ S tandards setting s tudy
L ea rn ing S ta nd a rd s
C O R E G uid e s /S ub je c t S p e c ific C o nte nt A r e aT e st S p e c ific a t io ns /T e st B lue p r int

January 2002
NYSED
Test Development …continued• Review learning standards in subject content
area• Design test specifications- “test blueprint”• Solicit and train Item Writers• Publish prototypes of items/generic rubrics;
(sample tests)• Review and edit submitted items• Pre-test items; scan pretests, read and score
performance items• Perform item analysis; review items and data

January 2002
NYSED
Test Development …continued• Field test forms; scan field tests; read and score
performance items • Perform item and test analysis• Submit to Statewide Examination Review
Committees:Sensitivity Review - ensures that all people are depicted in accord
to dignity ; certified trained reviewers review or reject test items
Bias Analysis - evaluates whether a test question asks the same question and at the same level of difficulty across sub- groups of test takers
• Determine student performance levels through Standards Setting Study - “cut scores”

January 2002
NYSED
Test Construction• New York State teachers and content
consultants, in coordination with Office of State Assessment and Curriculum and Instruction, determine test specifications
• A “test blueprint” determines the percentage of questions weighted for each standard and key ideas

January 2002
NYSED
Item WritingNew York State Teachers & Content
Specialists • Are trained as item writers by New York
State Education Department staff
• Align State learning standards contained in Science Core curriculum guides to all test items generated
• Write items and scoring rubrics for State tests in science

January 2002
NYSED
Pre-Tests• Prospective test items are “pre-tested” by a
diverse sample of students across the State
• Approximately 200 students for each item are tested
• Results from pre-tested items are statistically analyzed to determine question “item difficulty,” and fairness

January 2002
NYSED
Field Tests• Field test items are developed from pre-
test questions and administered in “short forms” to a representative sample of students across the State; (800-1000)
• Field tests are comparable in difficulty from different test forms based on statistical
analysis and student performance

January 2002
NYSED
Field Tests• Each field test form is “equated,” meaning
two or more test forms are constructed to cover the same explicit content, conform to the same statistical specifications, and are administered under identical procedures
• Two or more essentially parallel tests are
placed on a common scale -“ equating”
January 2002
NYSED
Field Tests to Operational Tests• “State Assessments,” operational tests, are
assembled from Field Test Forms
• Statistical analysis ensures different test forms are comparable in fairness, validity and reliability
• Operational tests are placed on a “scale score,” a derived score to which raw scores are converted by numerical transformation; raw scores to standard scores
• Full length forms are presented to the State Examinations Review Committee for sensitivity and bias review

January 2002
NYSED
Standard Setting Process• State Tests assess the extent to which students have met the
learning standards in a content area
• Although scores for the Regents Exams are placed on a numerical scale based on field test data, there are essentially
Three Performance Levels Does not meet the standardsMeets the standards
Meets the standards with distinction

January 2002
NYSED
Standard SettingPerformance Levels• Standard Setting committee members are
given definitions of student performance levels
• Student performance levels are applied to all State assessments that are developed including Regents tests

January 2002
NYSEDStandard Setting…Three Performance Levels Example: Physical Setting /Earth Science• Does Not Meet Learning Standards• Meets Learning Standards• Meets Learning Standards with Distinction
– The student demonstrates, on demand, proficiency, in terms of Physical Setting /Earth Science content, concepts, science skills and basic science knowledge in any or most of the science learning standards and key ideas that are addressed for productive citizenship and has sufficient knowledge and skill for the demands of most work places or post secondary academic environments

January 2002
NYSED
Setting the “cut score”• The Board of Regents has determined “65” as
passing a NY State Regents Examination and “85” as passing with distinction
• “Passing” =“Proficient”, the performance needed to achieve learning standards
• To determine the “passing score” or “65” a formal Standards Setting study is conducted based on the reasoned judgement of subject matter specialists and student performance data

January 2002
NYSED
Scoring and Scaling• Based on statistics from student pre-test and
field test data, items are placed on a logarithmic scale according to item difficulty level and student ability
• The two points “passing/65” and “passing with distinction/85” are then algebraically mapped to scale, 0-100 (not raw score but scale score

January 2002
NYSED
Standards Setting Committee• Committee members are:
-knowledgeable in the learning standards for science -from public and nonpublic schools -are current and former classroom teachers -represent urban, suburban and rural schools -selected members from business and industry
• Each member makes individual judgements with respect to the item difficulty, scaling and equating of field tests, and professional expertise
January 2002
NYSED
Standards Setting Process• New York State Teachers and content experts
use the “book marking” method in conjunction with professional judgement to set a “cut score”
• In the “bookmarking” procedure, multiple choice and constructed response items are ordered in terms of their item difficulty
• Test items corresponding to various points on the scale are presented as examples of test items at that difficulty level
• The purpose of the items is to illustrate the meaning of the difficulty scale at specific points

January 2002
NYSED
Standard Setting Process• Test items used come from an “anchor” form; a
test form upon which all cut points are set and all later forms of the test will be equated
• Committee members apply their professional judgements to these ordered items
• A “cut-score” , or performance standard, is a specified point on a scale score, “65”, and is set such that scores at or above that point are acted upon differently from scores below that point

January 2002
NYSED
Science Regents Scoring and Scaling• The Conversion Chart provided for each test
administration translates raw scores to scale scores (performance standards) and then maps to a 0-100 scale.

January 2002
NYSED
Science Regents ExaminationsScoring• Test administration for each test form is
“equated” so that the same “scale score”, represents the same level of achievement
• Test forms vary somewhat in the mix of easier and more difficult items, resulting in the relationship between the raw score and the scale score also varying from each test
administration
January 2002
NYSED
Science Regents Examinations• Syllabus - Based
• Addressed a selective student population
• Assessments were designed from course of study
• Syllabi contained prescriptive content
• Standards -Based
• Universal access to all students
• Assessments are derived from the standards
• Standards drive the content of the courses designed

January 2002
NYSEDThis item’s difficulty level, based on field test data, was the easiest question on the
ES June 2001 exam.
January 2002
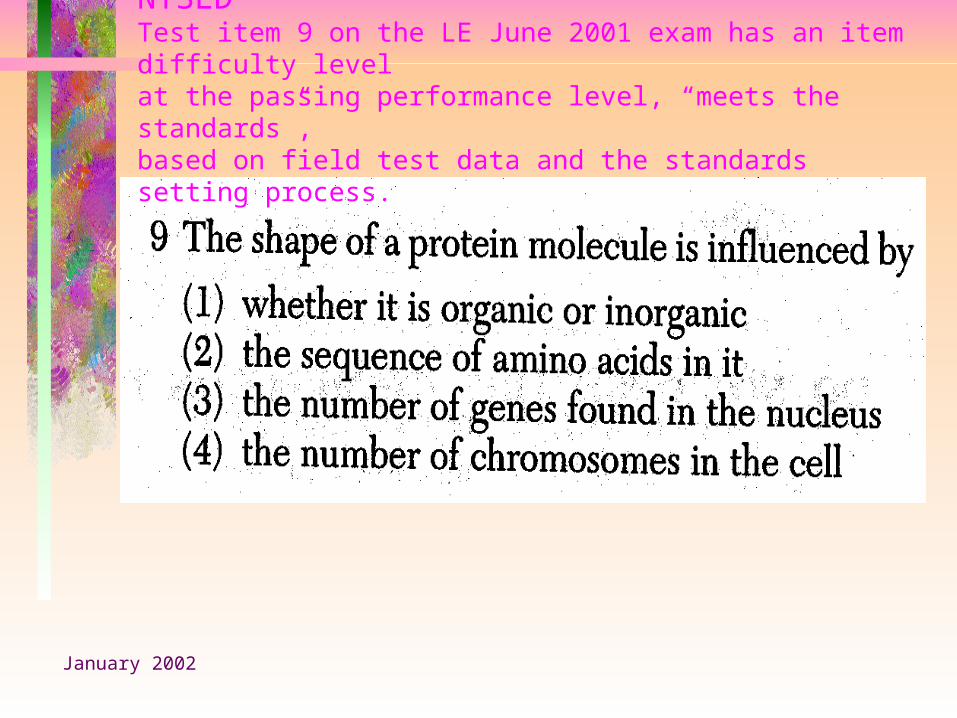
NYSEDTest item 9 on the LE June 2001 exam has an item difficulty level at the passing performance level, “meets the standards”, based on field test data and the standards setting process.

January 2002
NYSEDThis item’s difficulty level, based on field test data, is an example of a test item at the designated passing performance level, “meets the standards”.

January 2002
NYSEDTest item 30 on the LE June 2001 exam has an item difficulty level at the passing performance level, “meets the standards”, based on field test data and the standards setting process.

January 2002
NYSEDThis item’s difficulty level, based on field test data, is another example of a question on the ES June 2001exam that “meets the standards”.

January 2002
NYSEDThis item’s difficulty level, based on field test data, was one of the most difficult questions on the LE June 2001 exam.

January 2002
NYSEDThis item’s difficulty level, based on field test data, was the most difficult question on the ES June 2001 exam.

January 2002
NYSED
Science Regents Examinations• Old “65”/passing was
determined by a “Raw Score”
• A students score was based on a maximum of 100 points.
• Test item difficulty varied from each test form
• New “65”/passing is determined by a “scale score”
• A student score is derived by converting a raw score to a scale score based on student field test data
• The item difficulty values represent the same level of difficulty from each test administration

January 2002
NYSED
Science Regents ExaminationNumber of Students Tested - Total StateRegents Test 1997-1998 1998-1999 1999-2000
Biology 131,992 141,424 149,605
Earth Science 68,405 80,512 75,357
Earth Sciencepro mod
54,318Total 122,723
63,556Total 144,068
67,114Total 142,471
Chemistry 98,016 104,230 104,763
Physics 48,345 49,517 50,159

January 2002
NYSED
Regents Science ExaminationsStatisticsRegents Science Total # of Students
Tested 2001Increase # of Students
Tested 1997-2001
Regents BiologyLiving Environment
70,387179,489
Total 249,876
117,884
Earth SciencePhysical Setting/ES
36,804129,564
Total 166,368
43,645
Chemistry 113,253 15,237
Physics 50,663 2,318
January 2002
NYSED
Reliability of State Assessments• Reliability focuses on the consistency of test
scores (performance) for a group of tests takers across measures of time
• Reliability is best achieved by evaluating the whole test before considering smaller portions of the test
• Inter- rater reliability is conducted after each test
administration (Teams of teachers are provided uniform training and scoring procedures to re-score 10% of the Regents examinations audited)