Q Q uality Promotion & uality Promotion & C C apacity Development…….

NEW YORK STATE DEPARTMENT OF HEALTH OFFICE OF HEALTH INSURANCE PROGRAMS OFFICE OF QUALITY AND PATIENT SAFETY
EXTERNAL QUALITY REVIEW ALL PLAN SUMMARY TECHNICAL REPORT FOR:
NEW YORK STATE MEDICAID MANAGED CARE ORGANIZATIONS
Reporting Year 2017
FINAL REPORT
Published April 2019

All-Plan Summary Report | Reporting Year 2017 Technical Report i
Table of Contents I. About This Report ..................................................................................................................................1
Purpose of This Report .......................................................................................................................................1
History of the New York State Medicaid Managed Care Program .....................................................................1
Scope of This Report ..........................................................................................................................................1
Structure of This Report .....................................................................................................................................2
II. MCO Corporate Profiles ..........................................................................................................................3
III. Enrollment and Provider Network ...........................................................................................................5
Enrollment ..........................................................................................................................................................5
Provider Network ...............................................................................................................................................6
Board Certification .............................................................................................................................................7
Primary Care and OB/GYN Access and Availability Survey—2017 .....................................................................9
IV. Utilization ............................................................................................................................................ 10
Encounter Data ................................................................................................................................................ 10
QARR Use of Services Measures ..................................................................................................................... 11
V. Performance Indicators ........................................................................................................................ 12
Validation of Performance Measures ............................................................................................................. 12
Summary of HEDIS® 2018 Information System Audit™ .................................................................................. 12
HEDIS®/QARR Performance Measures............................................................................................................ 13
Quality Indicators ............................................................................................................................................ 13
Access/Timeliness Indicators .......................................................................................................................... 21
NYSDOH-Calculated Prenatal Care Measures ................................................................................................. 25
Member Satisfaction ....................................................................................................................................... 26
NYSDOH Quality Incentive............................................................................................................................... 27
Performance Improvement Projects ............................................................................................................... 28
VI. Structure and Operation Standards ....................................................................................................... 29
Compliance with NYS Structure and Operation Standards ............................................................................. 29
VII. Strengths and Opportunities for Improvement ...................................................................................... 32
VIII. Appendix ............................................................................................................................................. 33
References ....................................................................................................................................................... 33

All-Plan Summary Report | Reporting Year 2017 Technical Report ii
List of Tables Table 1: MCO Corporate Profiles ................................................................................................................................4
Table 2: Medicaid and CHP Enrollment—2016-2017 .................................................................................................5
Table 3: HEDIS®/QARR Board Certification Rates—2017 ...........................................................................................8
Table 4: Medicaid Encounter Data—2017 .............................................................................................................. 10
Table 5: QARR Use of Services Rates—2017 ........................................................................................................... 11
Table 6a: HEDIS®/QARR MCO Performance Rates 2017—Effectiveness of Care1 .................................................. 15
Table 6b: HEDIS®/QARR MCO Performance Rates 2017—Acute and Chronic Care1 .............................................. 18
Table 6c: HEDIS®/QARR MCO Performance Rates 2017—Behavioral Health1 ....................................................... 20
Table 7a: HEDIS®/QARR MCO Performance Rates 2017—Utilization1 ................................................................... 22
Table 7b: HEDIS®/QARR MCO Performance Rates 2017—Access to Care1 ............................................................ 24
Table 8: QARR Prenatal Care Rates—2016 .............................................................................................................. 25
Table 9: CAHPS®—2017 ........................................................................................................................................... 26
Table 10: Quality Incentive Points Earned—2017 ................................................................................................... 27
Table 11: Focused Review Types ............................................................................................................................. 30
Table 12: Summary of Citations—2017 ................................................................................................................... 31

All-Plan Summary Report | Reporting Year 2017 Technical Report iii
Acronyms Used in This Report ALOS: Average Length of Stay AO: Area Office CFR: Code of Federal Regulations CHP: Child Health Plus CMS: Centers for Medicare and Medicaid
Services COM: Commercial DBA: Doing Business As EQR: External Quality Review EQRO: External Quality Review Organization F/A: Failed Audit FAR: Final Audit Report FFS: Fee-For-Service FIDA: Fully Integrated Duals Advantage FTE: Full Time Equivalent HARP: Health and Recovery Plan HCS: Health Commerce System HEDIS: Healthcare Effectiveness Data and
Information Set HIE: Health Information Exchange HIT: Health Information Technology HMO: Health Maintenance Organization HPN: Health Provider Network MAP: Medicaid Advantage Plus MCD: Medicaid MCO: Managed Care Organization MLTC: Managed Long-Term Care MMC: Medicaid Managed Care MMCOR: Medicaid Managed Care Operating
Report MRT: Medicaid Redesign Team MY: Measurement Year N: Denominator N/A: Not Available NCQA: National Committee for Quality
Assurance NP: Not Provided NR: Not Reported
NV: Not Valid NYC: New York City NYCRR: New York Code of Rules and Regulations NYS: New York State NYSDOH: New York State Department of Health OB/GYN: Obstetrician/Gynecologist OHIP: Office of Health Insurance Programs OPMC: Office of Professional Medical Conduct OP: Optimal Practitioner Contact OQPS: Office of Quality and Patient Safety PCP: Primary Care Practitioner/Provider PHSP: Prepaid Health Services Plan PIP: Performance Improvement Project PIHP: Prepaid Inpatient Health Plan PNDS: Provider Network Data System POC: Plan of Corrective Action PMPY: Per Member Per Year PTMY: Per Thousand Member Years PQI: Prevention Quality Indicator Q1: First Quarter (Jan.—March) Q2: Second Quarter (Apr.—June) Q3: Third Quarter (July—Sept.) Q4: Fourth Quarter (Oct.—Dec.) QARR: Quality Assurance Reporting
Requirements ROS: Rest of State RY: Reporting Year SN: Safety Net SOD: Statement of Deficiency SS: Small Sample (less than 30) SSI: Supplemental Security Income SWA: Statewide Average TANF: Temporary Aid to Needy Families TR: Technical Report UR: Utilization Review

All-Plan Summary Report | Reporting Year 2017 Technical Report 1
I. About This Report
Purpose of This Report The Centers for Medicare and Medicaid Services (CMS) require that states oversee Medicaid managed care organizations (MCOs) to ensure they are meeting the requirements set forth in the federal regulations that govern MCOs serving Medicaid recipients. State agencies must contract with an External Quality Review Organization (EQRO) to conduct an annual external quality review (EQR) of the services provided by MCOs. The EQR must include an analysis and evaluation of aggregated information on quality, timeliness, and access to health care services that MCOs furnish to Medicaid recipients. CMS defines “quality” in Federal Regulation 42 CFR §438.320 as “the degree to which an MCO or PIHP increases the likelihood of desired health outcomes of its enrollees through its structural and operational characteristics, through the provision of services consistent with current professional knowledge, and through interventions for performance improvement.” In order to comply with federal regulations, the New York State Department of Health (NYSDOH) contracts with IPRO to conduct the annual EQR of the MCOs certified to provide Medicaid coverage in New York State (NYS). NYS is dedicated to providing and maintaining the highest quality of care for enrollees in managed care organizations. The NYSDOH’s Office of Health Insurance Programs (OHIP) and Office of Quality and Patient Safety (OQPS) collaboratively employ an ongoing strategy to improve the quality of care provided to plan enrollees, to ensure the accountability of these plans, and to maintain the continuity of care to the public. History of the New York State Medicaid Managed Care Program The NYS Medicaid managed care program began in 1997, when NYS received approval from CMS to implement a mandatory Medicaid managed care program through a Section 1115 Waiver. Section 1115 waivers allow for “demonstration projects” to be implemented in states in order to effect changes beyond routine medical care and focus on evidence-based interventions to improve the quality of care and health outcomes for members. The NYS 1115 Waiver project began with several goals, including: Increasing access to health care for the Medicaid population; Improving the quality of health care services delivered; and Expanding coverage to additional low-income New Yorkers with resources generated through managed
care efficiencies. In 2011, the Governor of NYS established the Medicaid Redesign Team (MRT) with the goal of finding ways to lower Medicaid spending in NYS while maintaining a high quality of care. The MRT provided recommendations that were enacted, and the team continues to work toward its goals. Scope of This Report This report serves as an aggregate of the detailed information included in the MCO-specific technical reports. In accordance with federal regulations, these reports summarize the results of the 2017 EQR to evaluate access to, timeliness of, and quality of care provided to NYS Medicaid beneficiaries. Mandatory EQR-related activities (as per Federal Regulation 42 CFR §438.358) reported include validation of performance improvement projects (PIPs), validation of MCO-reported and NYSDOH-calculated performance measures, and review for MCO compliance with NYSDOH structure and operation standards. Optional EQR-related activities (as per Federal Regulation 42 CFR §438.358) reported include administration of a consumer survey of quality of care (CAHPS®) by an NCQA-certified survey vendor and technical assistance by the NYS EQRO to MCOs regarding PIPs and reporting performance measures. Other data incorporated to provide additional background on the MCOs include the following: MCO

All-Plan Summary Report | Reporting Year 2017 Technical Report 2
corporate profiles, enrollment data, provider network information, encounter data summaries, PQI/compliance/satisfaction/quality points and incentive, and deficiencies and citations summaries1. Structure of This Report This report is organized into the following domains: MCO Corporate Profiles, Enrollment and Provider Network, Utilization, Performance Indicators, and Structure and Operation Standards. Although the technical reports focus primarily on Medicaid data, selected sections of the individual, MCO-specific reports also include data from the MCOs’ Child Health Plus (CHP) and Commercial product lines. The CHP product line is the NYS version of the federal Child Health Insurance Program (CHIP), which provides health coverage to eligible children in families with incomes too high to qualify for Medicaid, but who cannot afford private coverage. CHP data are part of the Medicaid managed care data sets used in this report. For some measures, including QARR 2018 (MY 2017), aggregate rates are used, which represent the combined population of the Medicaid and CHP product lines. These measures are noted as such. Additionally, when available and appropriate, the MCOs’ data are compared with statewide benchmarks. Unless otherwise noted, when benchmarks are utilized for rates other than HEDIS®/QARR or CAHPS®, comparative statements are based on differences determined by standard deviations: a difference of one standard deviation is used to determine rates that are higher or lower than the statewide average. Section VII of the individual, MCO-specific technical reports provides an assessment of the MCOs’ strengths and opportunities for improvement in the areas of accessibility, timeliness, and quality of services. For areas in which the MCOs have opportunities for improvement, recommendations for improving the quality of the MCOs’ health care services are provided. To achieve full compliance with federal regulations, this section also includes an assessment of the degree to which the MCOs effectively addressed the recommendations for quality improvement made by the NYS EQRO in the previous year’s EQR report. The MCOs were given the opportunity to describe current or proposed interventions that address areas of concern, as well as an opportunity to explain areas that the MCOs did not feel were within their ability to improve. The responses by the MCOs are appended to this section of the individual, MCO-specific reports. In an effort to provide the most consistent presentation of this varied information, the technical reports are prepared based on data for the most current calendar year available. This report includes data from Reporting Year 2017.
1 External Appeals data are reported in the Full EQR Technical Report prepared every third year.

All-Plan Summary Report | Reporting Year 2017 Technical Report 3
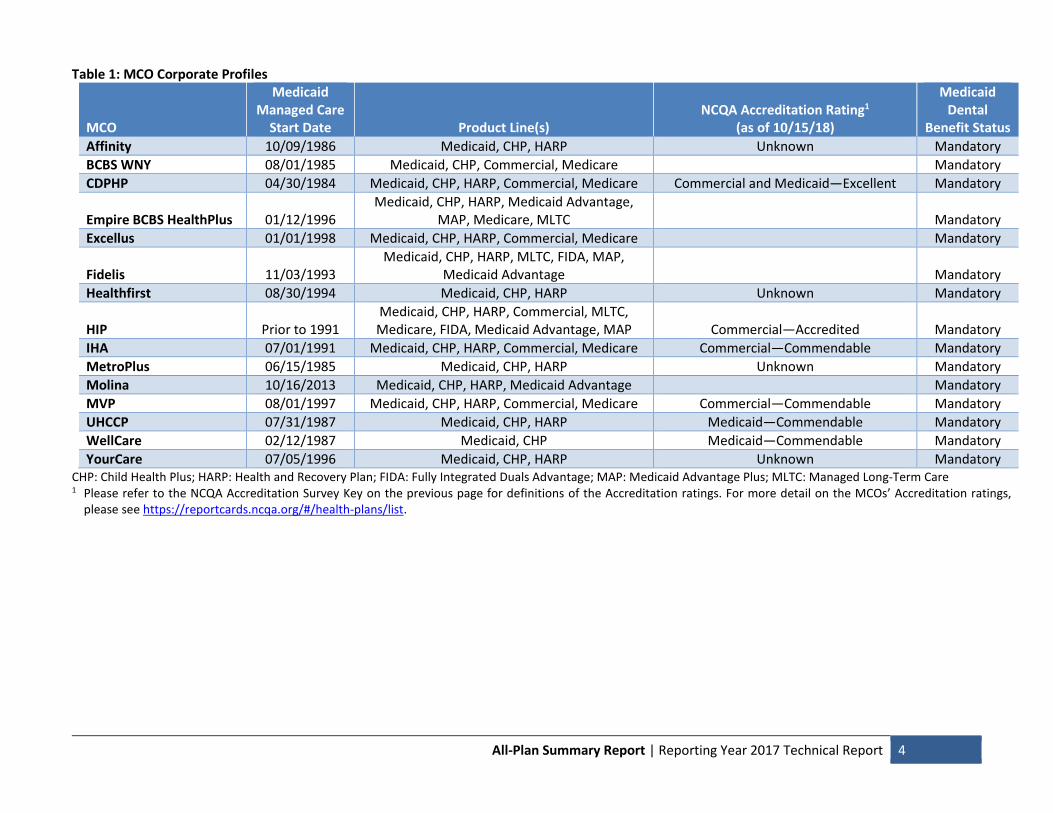
II. MCO Corporate Profiles Table 1 on the following page displays an overview of each MCO’s Corporate Profile. The table includes the dates the MCOs began their Medicaid managed care programs, the product lines each MCO carries, and the NCQA Accreditation rating each MCO received, where available. The National Committee for Quality Assurance (NCQA) surveys health plans on various systems and processes, and evaluates key dimensions of care and services provided by the MCOs. The NCQA awards health plans a rating based on the survey results. The table below provides definitions of each rating the NCQA awards to health plans.
NCQA Accreditation Survey Key:
Excellent Organizations with programs for service and clinical quality that meet or exceed rigorous requirements for consumer protection and quality improvement. HEDIS® results are in the highest range of national performance.
Commendable Organizations with well-established programs for service and clinical quality that meet rigorous requirements for consumer protection and quality improvement.
Accredited Organizations with programs for service and clinical quality that meet basic requirements for consumer protection and quality improvement. Organizations awarded this status must take further action to achieve a higher accreditation status.
Provisional
Organizations with programs for service and clinical quality that meet basic requirements for consumer protection and quality improvement. Organizations awarded this status must take significant action to achieve a higher accreditation status.
No stars Denied Organizations whose programs for service and clinical quality did not meet NCQA requirements during the Accreditation Survey.
All-Plan Summary Report | Reporting Year 2017 Technical Report 4
Table 1: MCO Corporate Profiles
MCO
Medicaid Managed Care
Start Date Product Line(s) NCQA Accreditation Rating1
(as of 10/15/18)
Medicaid Dental
Benefit Status Affinity 10/09/1986 Medicaid, CHP, HARP Unknown Mandatory BCBS WNY 08/01/1985 Medicaid, CHP, Commercial, Medicare Mandatory CDPHP 04/30/1984 Medicaid, CHP, HARP, Commercial, Medicare Commercial and Medicaid—Excellent Mandatory
Empire BCBS HealthPlus 01/12/1996 Medicaid, CHP, HARP, Medicaid Advantage,
MAP, Medicare, MLTC Mandatory Excellus 01/01/1998 Medicaid, CHP, HARP, Commercial, Medicare Mandatory
Fidelis 11/03/1993 Medicaid, CHP, HARP, MLTC, FIDA, MAP,
Medicaid Advantage Mandatory Healthfirst 08/30/1994 Medicaid, CHP, HARP Unknown Mandatory
HIP Prior to 1991 Medicaid, CHP, HARP, Commercial, MLTC, Medicare, FIDA, Medicaid Advantage, MAP Commercial—Accredited Mandatory
IHA 07/01/1991 Medicaid, CHP, HARP, Commercial, Medicare Commercial—Commendable Mandatory MetroPlus 06/15/1985 Medicaid, CHP, HARP Unknown Mandatory Molina 10/16/2013 Medicaid, CHP, HARP, Medicaid Advantage Mandatory MVP 08/01/1997 Medicaid, CHP, HARP, Commercial, Medicare Commercial—Commendable Mandatory UHCCP 07/31/1987 Medicaid, CHP, HARP Medicaid—Commendable Mandatory WellCare 02/12/1987 Medicaid, CHP Medicaid—Commendable Mandatory YourCare 07/05/1996 Medicaid, CHP, HARP Unknown Mandatory
CHP: Child Health Plus; HARP: Health and Recovery Plan; FIDA: Fully Integrated Duals Advantage; MAP: Medicaid Advantage Plus; MLTC: Managed Long-Term Care 1 Please refer to the NCQA Accreditation Survey Key on the previous page for definitions of the Accreditation ratings. For more detail on the MCOs’ Accreditation ratings,
please see https://reportcards.ncqa.org/#/health-plans/list.

All-Plan Summary Report | Reporting Year 2017 Technical Report 5
III. Enrollment and Provider Network
Enrollment Table 2 depicts the total enrollment for the MCOs’ Medicaid and CHP product lines for Calendar Years 2016 and 2017, as well as the percent change between 2016 and 2017. Table 2: Medicaid and CHP Enrollment—2016-2017
Medicaid CHP MCO 2016 2017 % Change 2016 2017 % Change Affinity 228,823 219,160 -4.2% 12,383 13,391 8.1% BCBS WNY 21,421 28,764 34.3% 1,560 2,563 64.3% CDPHP 85,544 82,147 -4.0% 12,479 12,987 4.1% Empire BCBS HealthPlus 361,963 346,593 -4.2% 42,251 42,051 -0.5% Excellus 166,408 168,074 1.0% 26,719 29,679 11.1% Fidelis 1,168,283 1,220,700 4.5% 95,403 112,613 18.0% Healthfirst 906,628 921,471 1.6% 34,750 40,650 17.0% HIP 168,855 141,780 -16.0% 10,803 10,437 -3.4% IHA 60,952 59,212 -2.9% 4,516 5,188 14.9% MetroPlus 382,190 377,045 -1.3% 14,573 16,593 13.9% Molina 32,832 30,062 -8.4% 1,328 1,104 -16.9% MVP 164,132 163,552 -0.4% 13,928 16,413 17.8% UHCCP 458,021 475,607 3.8% 41,344 47,484 14.9% WellCare 98,565 101,568 3.0% 3,900 4,509 15.6% YourCare 44,182 41,143 -6.9% 943 2,107 123.4% Statewide Total1 4,349,457 4,378,153 0.7% 316,880 357,769 12.9%
Data Source: MEDS II (Medicaid) and Managed Care Enrollment Report (CHP) 1 The statewide totals for the Medicaid product line include MCOs that were operational during the measurement year, but
did not have enough members to report sufficient data.

All-Plan Summary Report | Reporting Year 2017 Technical Report 6
Provider Network This section of the report examines the MCOs’ provider networks through HEDIS®/QARR Board Certification rates and MCO performance on the Primary Care and OB/GYN Access and Availability Survey2. This section also includes an overview of network adequacy standards. Network Adequacy Standards In accordance with Federal Regulation 42 CFR §438.68, states that contract with MCOs are required to develop and enforce network adequacy standards, which include time and distance standards for various provider types within a provider network. These network adequacy standards must be developed with consideration of the anticipated number of Medicaid enrollees, the potential level of utilization of services, and the characteristics and health care needs of the population served. In order to comply with these requirements, NYS has developed access requirements for providers in an MCO’s network within its contracts with the MCOs. In the State’s Medicaid Managed Care Model Contract, Section 15 defines access requirements for appointment availability standards, appointment wait times, and travel time and distance. Section 15.1 of the Contract states “The Contractor shall establish and implement mechanisms to ensure Participating Providers comply with timely access requirements, monitor regularly to determine compliance, and take corrective action if there is a failure to comply.” In order to determine compliance with access standards, the NYSDOH utilizes several different methodologies. Appointment Availability/Timeliness Standards Appointment availability standards are outlined in Section 15.2 of the Medicaid Managed Care Model Contract for various types of services, including, but not limited to, routine visits, urgent and emergency services, specialty care, and behavioral health. In order to monitor MCOs for compliance with appointment availability standards, the EQRO conducts the Primary Care and OB/GYN Access and Availability Survey, which is detailed in a subsequent section of this report. MCOs with rates of compliant providers below an established threshold must develop corrective action plans to address non-compliance. The Model Contract also establishes standards for appointment wait times. Section 15.4 states “Enrollees with appointments shall not routinely be made to wait longer than one hour.” Travel Time and Distance Standards In regard to travel time standards, the Contract defines time and distance standards for various provider types in Section 15.5. For primary care providers, Section 15.5(b)(i) of the Contract states “Travel time/distance to primary care sites shall not exceed thirty (30) minutes from the Enrollee’s residence in metropolitan areas or thirty (30) minutes/thirty (30) miles from the Enrollee’s residence in non-metropolitan areas.” However, the Contract also states that the time/distance may exceed the established standard if the member chooses a provider outside that standard. Section 15.5(b)(ii) states “Enrollees may, at their discretion, select participating PCPs located farther from their homes as long as they are able to arrange and pay for transportation to the PCPs themselves.” For all other services, Section 15.5(c) states “Travel time/distance to specialty care, hospitals, mental health, lab, and x-ray providers shall not exceed thirty (30) minutes/thirty (30) miles from the Enrollee’s residence.” This section continues by stating that travel time/distance to these providers in rural areas “…may be greater than thirty (30) minutes/thirty (30) miles from the Enrollee’s residence if based on the community standard for accessing care or if by Enrollee choice.”
2 Additional data on the provider networks, including panel data, enrollee-to-provider ratios, and number of providers by
specialty, are reported in the Full EQR Technical Report prepared every third year.

All-Plan Summary Report | Reporting Year 2017 Technical Report 7
Board Certification Board certification ensures physicians meet rigorous criteria. In order to maintain an “active” board certification, providers must have evidence of professional standing, commitment to lifelong learning and self-assessment, cognitive expertise, and evaluation of practice performance. The American Board of Medical Specialties (ABMS) and the American Osteopathic Association (AOA) member boards require participation in a program of ongoing maintenance of certification3. The quality of the providers participating in an organization’s network has a significant effect on the overall quality of care delivered to members. As a result, purchasers and consumers want information that helps them assess the quality of an organization’s physicians, though HEDIS® Board Certification does not directly measure the quality of every provider in an organization. The changing scope of medical information, increased public concern for the need to recredential physicians, and evidence that knowledge and skills of practicing physicians decays over time motivated specialty boards to limit the duration of certificates4. To date, all ABMS member boards have agreed to issue time-limited certificates that necessitate subsequent re-certification, usually at intervals of 10 years or less. Board certification shows what percentage of the organization’s physicians have sought and obtained board certification. While there are valid reasons why physicians may not have done this, and board certification alone is not a guarantee of quality, certification provides a baseline established by standardized, specialty-specific competency testing. HEDIS®/QARR Board Certification rates represent the percentage of physicians in the MCOs’ provider networks that are board-certified in their specialty. Table 3 displays HEDIS®/QARR Board Certification rates of providers in the MCOs’ networks for 2017, as well as the statewide averages. The table also indicates whether the MCOs’ rates were significantly above (indicated by ▲) or significantly below (indicated by ▼) the statewide average.
3 American Board of Medical Specialties (ABMS). The Meaning of Board Certification. http://www.abms.org. 4 Brennan, T.A., R.I. Horwitz, F.D. Duffy, C.K. Cassel, L.D. Goode, R.S. Lipner. 2004. “The Role of Physician Specialty Board
Certification Status in the Quality Movement.” JAMA 292 (9): 1038-43.

All-Plan Summary Report | Reporting Year 2017 Technical Report 8
Table 3: HEDIS®/QARR Board Certification Rates—2017
MCO Family
Medicine Internal
Medicine Pediatricians OB/GYN Geriatricians
Other Physician Specialists
Affinity 65 ▼ 66 ▼ 70 ▼ 64 ▼ 64 70 ▼ BCBS WNY 75 76 82 78 68 81 ▲ CDPHP 85 ▲ 80 82 74 65 79 ▲ Empire BCBS HealthPlus 35 ▼ 70 ▼ 75 ▼ 75 49 ▼ 76 Excellus 60 ▼ 69 ▼ 65 ▼ 83 ▲ 68 77 Fidelis 81 ▲ 81 ▲ 86 ▲ 81 ▲ 60 79 ▲ Healthfirst 72 80 ▲ 81 81 ▲ 73 ▲ 83 ▲ HIP 75 75 76 ▼ 74 ▼ 72 ▲ 75 IHA 82 ▲ 73 82 80 SS 84 ▲ MetroPlus 68 66 ▼ 67 ▼ 67 ▼ 55 52 ▼ Molina 89 ▲ 92 ▲ 89 ▲ 86 SS 41 ▼ MVP 81 ▲ 75 78 80 70 80 ▲ UHCCP 69 ▼ 77 ▲ 80 85 ▲ 62 80 ▲ WellCare 73 73 ▼ 76 66 ▼ 62 63 ▼ YourCare 87 ▲ 83 ▲ 85 ▲ 82 81 84 ▲ Statewide Average 72 76 79 77 63 76
SS: Sample size too small to report (less than 30 providers), but included in the statewide average.

All-Plan Summary Report | Reporting Year 2017 Technical Report 9
Primary Care and OB/GYN Access and Availability Survey—2017 On behalf of the NYSDOH’s Division of Health Plan Contracting and Oversight, the NYS EQRO conducts the Medicaid Managed Care Primary Care and OB/GYN Access and Availability Survey to assess the compliance of network providers in NYS MCOs with appointment timeframe requirements as per the NYS Medicaid Managed Care Contract. The survey evaluates the availability of routine and non-urgent “sick” office hour appointments with primary care physicians, including OB/GYNs, as well as the availability of after-hours access. Section 15.2 of the Medicaid Managed Care Contract outlines the timeliness standards for various types of services. For routine office hour appointments with PCPs and OB/GYNs, Section 15.2(a)(vi) states “Routine, non-urgent, preventive appointments… within four (4) weeks of request.” For non-urgent “sick” office hour appointments with PCPs and OB/GYNs, Section 15.2(a)(v) states that appointments must be scheduled “…within forty-eight (48) to seventy-two (72) hours of request, as clinically indicated.” Note that the timeliness standard for these types of appointments excludes weekends and holidays. The timeliness standard for prenatal appointments is stated in Section 15.2(a)(ix) as follows: “…within three (3) weeks during the first trimester, within two (2) weeks during the second trimester, and within one (1) week during the third trimester.” As noted previously, the Survey also assesses MCO compliance with standards for after-hours access. Section 15.3 of the Contract outlines requirements for providers for 24-hour access to care for members. Section 15.3(a) states “The Contractor must provide access to medical services and coverage to Enrollees, either directly or through their PCPs and OB/GYNs, on a twenty-four (24) hour, seven (7) days week basis. The Contractor must instruct Enrollees on what to do to obtain services after business hours and on weekends.” Section 15.3(b) of the Contract also states that MCOs can satisfy this requirement “…by requiring their PCPs and OB/GYNs to have primary responsibility for serving as after-hours “on-call” telephone resources to members with medical problems.” For the purposes of the Survey, after-hours access is considered compliant if a “live voice” representing the named provider is reached or if the provider’s beeper number is reached. Note: The Primary Care and OB/GYN Access and Availability Survey was not conducted for Reporting Year 2017. The results of the next survey will be published in a future report.

All-Plan Summary Report | Reporting Year 2017 Technical Report 10
IV. Utilization This section of the report explores utilization of the MCOs’ services by examining encounter data, as well as QARR Use of Services rates. Encounter Data Table 4 depicts select Medicaid encounter data for 2017. Rates for this year are also compared to the statewide averages. For this table, rates significantly above the statewide average are indicated by ▲, while rates significantly below the statewide average are indicated by ▼. Table 4: Medicaid Encounter Data—2017
Encounters (PMPY)
MCO PCPs and OB/GYNs Specialty
Emergency Room
Inpatient Admissions Dental
Affinity 3.57 2.31 0.51 0.15 0.85 BCBS WNY 2.84 2.19 0.62 0.09 0.88 CDPHP 3.98 2.29 1.04 ▲ 0.10 0.99 Empire BCBS HealthPlus 1.42 ▼ 2.74 ▲ 0.43 0.09 1.10 Excellus 3.72 1.96 0.72 ▲ 0.14 1.20 Fidelis 3.63 2.57 0.53 0.14 1.15 Healthfirst 4.55 ▲ 2.52 0.60 0.14 0.98 HIP 3.73 2.41 0.49 0.14 0.77 IHA 4.15 1.99 0.65 0.41 ▲ 1.14 MetroPlus 3.38 1.54 ▼ 0.67 0.15 0.92 Molina 3.82 2.05 0.66 0.14 1.02 MVP 1.20 ▼ 1.02 ▼ 0.60 0.16 1.12 UHCCP 3.83 2.07 0.36 ▼ 0.13 1.03 WellCare 3.22 1.89 0.57 0.13 0.00 ▼ YourCare 3.60 2.42 0.75 ▲ 0.11 1.24 Statewide Average 3.56 2.30 0.55 0.14 1.02
Data Source: MEDS II PMPY: Per Member Per Year

All-Plan Summary Report | Reporting Year 2017 Technical Report 11
QARR Use of Services Measures For this domain of measures, performance is assessed by indicating whether the MCOs’ rates reached the 90th or 10th percentile. Table 5 lists the Use of Services rates for 2017. The table displays whether the MCOs’ rates were higher than 90% of all rates for that measure (indicated by ▲) or whether the MCOs’ rates were lower than 90% of all rates for that measure (indicated by ▼). Table 5: QARR Use of Services Rates—2017
Outpatient Utilization
(PTMY) Inpatient ALOS Inpatient Utilization
(PTMY) MCO Visits ER Visits Medicine Surgery Maternity Medicine Surgery Maternity Affinity 4,904 503 4.0 7.1 3.0 32 12 33 BCBS WNY 4,251 656 4.3 7.6 2.7 37 22 ▲ 23 ▼ CDPHP 4,980 654 3.7 ▼ 6.3 2.7 33 21 ▲ 30 Empire BCBS HealthPlus 4,807 379 ▼ 4.6 7.4 3.0 24 ▼ 10 ▼ 26 Excellus 4,529 653 3.8 6.0 2.6 ▼ 31 13 29 Fidelis 5,852 ▲ 505 3.8 5.5 2.7 ▼ 33 16 33 Healthfirst 5,489 545 4.2 6.2 3.0 35 15 37 HIP 5,054 392 4.6 ▲ 4.9 ▼ 3.1 ▲ 26 20 5 ▼ IHA 4,234 ▼ 692 ▲ 3.9 7.1 2.9 41 ▲ 19 35 MetroPlus 4,580 636 6.9 ▲ 7.7 ▲ 3.1 ▲ 43 ▲ 9 ▼ 41 ▲ Molina 4,980 661 3.7 ▼ 6.2 2.9 39 18 37 MVP 4,972 587 3.9 4.9 ▼ 2.8 30 13 39 ▲ UHCCP 5,616 ▲ 369 ▼ 4.4 6.7 3.0 23 ▼ 12 36 WellCare 4,907 452 4.2 7.6 ▲ 3.1 40 12 25 YourCare 4,123 ▼ 663 ▲ 4.0 7.1 2.9 40 17 29 Statewide Average 5,302 512 4.4 6.2 2.9 32 14 33
PTMY: Per Thousand Member Years ER: Emergency Room ALOS: Average Length of Stay. These rates are measured in days.

All-Plan Summary Report | Reporting Year 2017 Technical Report 12
V. Performance Indicators To measure the quality, accessibility, and timeliness of care provided by the MCOs, the State prepares and reviews a number of reports on a variety of performance indicators. This section is a summary of findings from those reports, including HEDIS®/QARR 2018 audit findings, as well as results of quality improvement studies, enrollee surveys, and MCO Performance Improvement Projects (PIPs). Validation of Performance Measures Performance measures are reported and validated using several methodologies. MCOs submitted member- and provider-level data to the NYSDOH for several measures. The NYS EQRO audited all member- and provider-level data for internal consistency. Several performance measures are calculated by the NYSDOH, with source code validated by the NYS EQRO. Finally, MCOs report a subset of HEDIS® measures to the NYSDOH annually, along with several NYS-specific measures. MCO-reported performance measures were validated as per HEDIS® 2018 Compliance Audit™ specifications developed by the National Committee for Quality Assurance (NCQA). The results of each MCO’s HEDIS® 2018 Compliance Audit™ are summarized in its Final Audit Report (FAR). For Measurement Year (MY) 2013, the methodology for reporting performance measures was modified. Previously, Medicaid and Child Health Plus (CHP) were reported separately; however, since MY 2013, and for the most recent reporting period of QARR 2018 (MY 2017), rates for these populations were combined following HEDIS® methodology (summing numerators and denominators from each population). Trend analyses were applied over the time period, as the effect of combining the CHP and Medicaid product lines was determined to be negligible through an analysis of historical QARR data. Summary of HEDIS® 2018 Information System Audit™ As part of the HEDIS® 2018 Compliance Audit™, auditors assessed the MCOs’ compliance with NCQA standards in the six designated information system categories, as follows:
1. Sound Coding Methods for Medical Data 2. Data Capture, Transfer, and Entry—Medical Data 3. Data Capture, Transfer, and Entry—Membership Data 4. Data Capture, Transfer, and Entry—Practitioner Data 5. Data Integration Required to Meet the Demands of Accurate HEDIS® Reporting 6. Control Procedures that Support HEDIS® Reporting and Integrity
In addition, two HEDIS®-related documentation categories were assessed:
1. Documentation 2. Outsourced or Delegated HEDIS® Reporting Functions
The NYS EQRO provided technical assistance to MCOs throughout the performance measure reporting process in the following forms: 1) introductory and technical workshops prior to the audit, 2) readiness reviews for new MCOs, 3) serving as a liaison between the MCOs and NCQA to clarify questions regarding measure specifications, and 4) clarifications to MCO questions regarding the submission of member- and provider-level data, as well as general questions regarding the audit process. Note: MCO summaries of the HEDIS® 2018 Final Audit Reports are available within the individual, MCO-specific technical reports.

All-Plan Summary Report | Reporting Year 2017 Technical Report 13
HEDIS®/QARR Performance Measures For Reporting Year (RY) 2017, performance measures were organized into the following domains: Effectiveness of Care Acute and Chronic Care Behavioral Health Utilization Access to Care
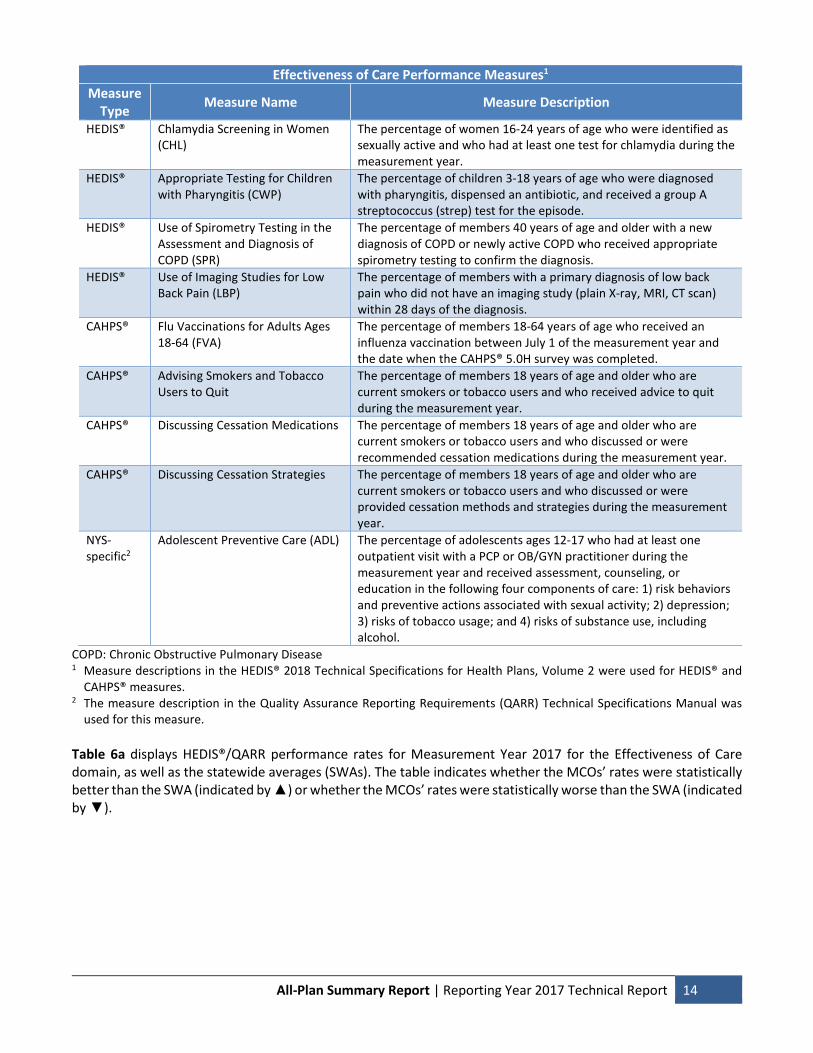
These domains were further categorized into Quality Indicators (Effectiveness of Care, Acute and Chronic Care, and Behavioral Health) and Access/Timeliness Indicators (Utilization and Access to Care). Each of these domains include a variety of HEDIS®/QARR and CAHPS® measures, as well as several NYS-specific QARR measures for areas of importance to the State and for which there were no defined HEDIS® or other national measures. Many of these measures were calculated through the MCOs’ HEDIS® data submissions, while others are based on encounter data, prenatal data, and QARR submissions reported by the MCOs to the NYSDOH. Quality Indicators This section of the report explores the quality of health care services provided by the MCOs. Performance in the domains of Effectiveness of Care, Acute and Chronic Care, and Behavioral Health is examined. Effectiveness of Care This domain of measures includes various indicators which are used to measure preventive care and screenings for several health issues. These indicators are used to evaluate how well the MCOs provided these services for their enrollees. The following table describes the measures included in the Effectiveness of Care domain.
Effectiveness of Care Performance Measures1
Measure Type Measure Name Measure Description
HEDIS® Adult BMI Assessment (ABA) The percentage of members 18-74 years of age who had an outpatient visit and whose body mass index (BMI) was documented during the measurement year or the year prior to the measurement year.
HEDIS® Weight Assessment and Counseling for Nutrition and Physical Activity for Children and Adolescents (WCC)
The percentage of members 3-17 years of age who had an outpatient visit with a PCP or OB/GYN and who had evidence of the following during the measurement year: BMI percentile documentation, counseling for nutrition, and counseling for physical activity.
HEDIS® Childhood Immunization Status—Combination 3 (CIS)
The percentage of children 2 years of age who had four DTaP, three IPV, one MMR, three HiB, three HepB, one VZV, and four PCV vaccines by their second birthday.
HEDIS® Immunizations for Adolescents—Combination 2 (IMA)
The percentage of adolescents 13 years of age who had one dose of meningococcal conjugate vaccine and one Tdap vaccine, and have completed the HPV vaccine series by their 13th birthday.
HEDIS® Lead Screening in Children (LSC) The percentage of children 2 years of age who had one or more capillary or venous blood tests for lead poisoning by their second birthday.
HEDIS® Breast Cancer Screening (BCS) The percentage of women 50-74 years of age who had a mammogram to screen for breast cancer.
HEDIS® Colorectal Cancer Screening (COL) The percentage of members 50-75 years of age who had appropriate screening for colorectal cancer.
All-Plan Summary Report | Reporting Year 2017 Technical Report 14
Effectiveness of Care Performance Measures1
Measure Type Measure Name Measure Description
HEDIS® Chlamydia Screening in Women (CHL)
The percentage of women 16-24 years of age who were identified as sexually active and who had at least one test for chlamydia during the measurement year.
HEDIS® Appropriate Testing for Children with Pharyngitis (CWP)
The percentage of children 3-18 years of age who were diagnosed with pharyngitis, dispensed an antibiotic, and received a group A streptococcus (strep) test for the episode.
HEDIS® Use of Spirometry Testing in the Assessment and Diagnosis of COPD (SPR)
The percentage of members 40 years of age and older with a new diagnosis of COPD or newly active COPD who received appropriate spirometry testing to confirm the diagnosis.
HEDIS® Use of Imaging Studies for Low Back Pain (LBP)
The percentage of members with a primary diagnosis of low back pain who did not have an imaging study (plain X-ray, MRI, CT scan) within 28 days of the diagnosis.
CAHPS® Flu Vaccinations for Adults Ages 18-64 (FVA)
The percentage of members 18-64 years of age who received an influenza vaccination between July 1 of the measurement year and the date when the CAHPS® 5.0H survey was completed.
CAHPS® Advising Smokers and Tobacco Users to Quit
The percentage of members 18 years of age and older who are current smokers or tobacco users and who received advice to quit during the measurement year.
CAHPS® Discussing Cessation Medications The percentage of members 18 years of age and older who are current smokers or tobacco users and who discussed or were recommended cessation medications during the measurement year.
CAHPS® Discussing Cessation Strategies The percentage of members 18 years of age and older who are current smokers or tobacco users and who discussed or were provided cessation methods and strategies during the measurement year.
NYS-specific2
Adolescent Preventive Care (ADL) The percentage of adolescents ages 12-17 who had at least one outpatient visit with a PCP or OB/GYN practitioner during the measurement year and received assessment, counseling, or education in the following four components of care: 1) risk behaviors and preventive actions associated with sexual activity; 2) depression; 3) risks of tobacco usage; and 4) risks of substance use, including alcohol.
COPD: Chronic Obstructive Pulmonary Disease 1 Measure descriptions in the HEDIS® 2018 Technical Specifications for Health Plans, Volume 2 were used for HEDIS® and
CAHPS® measures. 2 The measure description in the Quality Assurance Reporting Requirements (QARR) Technical Specifications Manual was
used for this measure. Table 6a displays HEDIS®/QARR performance rates for Measurement Year 2017 for the Effectiveness of Care domain, as well as the statewide averages (SWAs). The table indicates whether the MCOs’ rates were statistically better than the SWA (indicated by ▲) or whether the MCOs’ rates were statistically worse than the SWA (indicated by ▼).

All-Plan Summary Report | Reporting Year 2017 Technical Report 15
Table 6a: HEDIS®/QARR MCO Performance Rates 2017—Effectiveness of Care1
Measure
Affinity
BCBS WN
Y
CDPHP
Empire BCBS
HealthPlus
Excellus
Fidelis
Healthfirst
HIP
IHA
MetroPlus
Molina
MVP
UHCCP
WellCare
YourCare
Statewide
Average
Adult BMI Assessment 89 99 ▲ 96 ▲ 84 94 ▲ 88 84 77 ▼ 93 ▲ 92 ▲ 82 ▼ 84 78 ▼ 94 ▲ 88 86 WCC—BMI Percentile 83 84 86 81 90 ▲ 87 79 ▼ 77 ▼ 90 ▲ 93 ▲ 73 ▼ 87 ▲ 78 ▼ 84 86 84 WCC—Counseling for Nutrition 80 83 83 81 89 ▲ 84 81 75 ▼ 89 ▲ 90 ▲ 68 ▼ 84 80 81 81 83 WCC—Counseling for Physical Activity 72 76 75 67 ▼ 80 ▲ 74 69 66 ▼ 85 ▲ 78 ▲ 65 ▼ 74 74 70 76 73 Childhood Immunizations—Combo 3 77 74 79 67 ▼ 83 ▲ 74 80 ▲ 68 ▼ 81 ▲ 87 ▲ 80 ▲ 77 63 ▼ 75 74 75 Lead Screening in Children 90 87 83 ▼ 88 87 88 90 85 91 ▲ 95 ▲ 87 91 83 ▼ 85 89 88 Adolescent Immunizations—Combo 2 49 ▲ 28 ▼ 31 ▼ 42 39 37 51 ▲ 28 ▼ 38 64 ▲ 47 ▲ 42 18 ▼ 37 30 ▼ 41 Adolescents—Alcohol and Other Drug Use2 71 76 ▲ 72 61 71 67 63 68 85 ▲ 80 ▲ 54 ▼ 65 61 67 73 67 Adolescents—Depression2 65 65 66 53 77 ▲ 59 54 61 81 ▲ 82 ▲ 62 60 55 57 71 ▲ 61 Adolescents—Sexual Activity2 70 68 58 58 69 64 63 65 86 ▲ 81 ▲ 53 ▼ 59 59 62 68 65 Adolescents—Tobacco Use2 75 84 ▲ 78 62 ▼ 85 ▲ 73 64 70 89 ▲ 85 ▲ 65 72 65 73 76 71 Breast Cancer Screening 68 ▼ 59 ▼ 65 ▼ 73 ▲ 65 ▼ 71 77 ▲ 67 ▼ 69 74 ▲ 70 68 ▼ 65 ▼ 67 ▼ 69 71 Colorectal Cancer Screening 61 50 ▼ 53 ▼ 61 56 ▼ 61 69 ▲ 60 53 ▼ 67 ▲ 54 ▼ 54 ▼ 53 ▼ 57 55 ▼ 62 Chlamydia Screening (Ages 16-24) 77 ▲ 62 ▼ 67 ▼ 77 ▲ 59 ▼ 72 ▼ 81 ▲ 75 70 ▼ 78 ▲ 72 72 ▼ 68 ▼ 80 ▲ 68 ▼ 74 Testing for Children with Pharyngitis 86 ▼ 92 91 90 ▼ 93 ▲ 93 ▲ 86 ▼ 88 ▼ 95 ▲ 88 ▼ 82 ▼ 93 ▲ 95 ▲ 89 92 91 Spirometry Testing for COPD 50 30 ▼ 36 ▼ 56 43 ▼ 59 ▲ 65 ▲ 50 42 ▼ 51 38 ▼ 40 ▼ 56 54 44 ▼ 55 Use of Imaging Studies for Low Back Pain 75 75 71 ▼ 83 ▲ 74 ▼ 72 ▼ 81 ▲ 78 69 ▼ 79 ▲ 73 71 ▼ 78 80 67 ▼ 77 Flu Shots for Adults (Ages 18-64)3 44 43 42 39 48 ▲ 37 ▼ 48 44 41 46 45 39 35 ▼ 39 46 42 Advising Smokers to Quit3 85 83 81 76 81 84 77 80 78 79 77 82 69 79 81 80 Smoking Cessation Medications3 54 64 64 52 65 56 50 57 63 58 63 60 48 63 58 59 Smoking Cessation Strategies3 46 50 53 45 49 51 38 52 53 55 54 48 43 63 54 51
BMI: Body Mass Index; WCC: Weight Assessment and Counseling for Nutrition and Physical Activity for Children and Adolescents; COPD: Chronic Obstructive Pulmonary Disease 1 All measures included in this table are HEDIS® measures, unless noted otherwise. 2 NYS-specific measure. 3 CAHPS® measure.

All-Plan Summary Report | Reporting Year 2017 Technical Report 16
Acute and Chronic Care Measures included in the Acute and Chronic Care domain evaluate the health care services provided to MCO members who have acute and chronic medical conditions. These include respiratory, cardiovascular, and musculoskeletal diseases, as well as diabetes and HIV. The following table describes the measures included in the Acute and Chronic Care domain.
Acute and Chronic Care Performance Indicators1
Measure Type Measure Name Measure Description
HEDIS® Pharmacotherapy Management of COPD Exacerbation (PCE)
The percentage of COPD exacerbations for members 40 years of age and older who had an acute inpatient discharge or ED visit on or between January 1-November 30 of the measurement period and who were dispensed appropriate medications.
HEDIS® Medication Management for People with Asthma (MMA)
The percentage of members 5-64 years of age during the measurement year who were identified as having persistent asthma and were dispensed appropriate medication, and remained on an asthma controller medication for at least 50% of their treatment period.
HEDIS® Asthma Medication Ratio (AMR) The percentage of members 5-64 years of age who were identified as having persistent asthma and had a ratio of controller medications to total asthma medications of 0.50 or greater during the measurement year.
HEDIS® Persistence of Beta-Blocker Treatment After a Heart Attack (PBH)
The percentage of members 18 years of age and older during the measurement year who were hospitalized and discharged from July 1 of the year prior to the measurement year to June 30 of the measurement year with a diagnosis of AMI and who received persistent beta-blocker treatment for six months after discharge.
HEDIS® Comprehensive Diabetes Care (CDC)
The percentage of members 18-75 years of age with diabetes (type 1 and type 2) who had each of the following: HbA1c testing, HbA1c control (<8.0%); eye exam (retinal) performed; medical attention for nephropathy; and BP control (<140/90 mm Hg).
HEDIS® Disease-Modifying Anti-Rheumatic Drug Therapy for Rheumatoid Arthritis (ART)
The percentage of members 18 years of age and older who were diagnosed with rheumatoid arthritis and who were dispensed at least one ambulatory prescription for a disease-modifying anti-rheumatic drug (DMARD).
HEDIS® Annual Monitoring for Patients on Persistent Medications—Total Rate (MPM)
The percentage of members 18 years of age and older who received at least 180 treatment days of ambulatory medication therapy for a select therapeutic agent during the measurement year and at least one therapeutic monitoring event for the therapeutic agent in the measurement year.
HEDIS® Appropriate Treatment for Children with Upper Respiratory Infection (URI)
The percentage of children 3 months-18 years of age who were given a diagnosis of upper respiratory infection (URI) and were not dispensed an antibiotic prescription.
HEDIS® Avoidance of Antibiotic Treatment in Adults with Acute Bronchitis (AAB)
The percentage of adults 18-64 years of age with a diagnosis of acute bronchitis who were not dispensed an antibiotic prescription.
NYS-specific2
HIV Viral Load Suppression The percentage of Medicaid enrollees confirmed HIV-positive who had an HIV viral load less than 200 copies/mL at last HIV viral load test during the measurement year.
COPD: Chronic Obstructive Pulmonary Disease; ED: Emergency Department; AMI: Acute Myocardial Infarction; BP: Blood Pressure 1 Measure descriptions in the HEDIS® 2018 Technical Specifications for Health Plans, Volume 2 were used for HEDIS®
measures.

All-Plan Summary Report | Reporting Year 2017 Technical Report 17
2 The measure description in the Quality Assurance Reporting Requirements (QARR) Technical Specifications Manual was used for this measure.

All-Plan Summary Report | Reporting Year 2017 Technical Report 18
Table 6b displays HEDIS®/QARR performance rates for Measurement Year 2017 for the Acute and Chronic Care domain, as well as the statewide averages (SWAs). The table indicates whether the MCOs’ rates were statistically better than the SWA (indicated by ▲) or whether the MCOs’ rates were statistically worse than the SWA (indicated by ▼). Table 6b: HEDIS®/QARR MCO Performance Rates 2017—Acute and Chronic Care1
Measure
Affinity
BCBS WN
Y
CDPHP
Empire BCBS
HealthPlus
Excellus
Fidelis
Healthfirst
HIP
IHA
MetroPlus
Molina
MVP
UHCCP
WellCare
YourCare
Statewide
Average
Pharmacotherapy Management for COPD—Bronchodilators 91 88 84 85 88 89 89 87 93 90 91 86 86 85 83 88 Pharmacotherapy Management for COPD—Corticosteroids 80 79 78 71 80 79 ▲ 68 ▼ 72 85 ▲ 73 82 80 76 72 78 76 Medication Management for People with Asthma 50% (Ages 19-64) 66 70 67 69 69 72 ▲ 70 66 63 ▼ 70 61 62 ▼ 70 69 62 ▼ 69 Medication Management for People with Asthma 50% (Ages 5-18) 49 ▼ 51 59 54 ▼ 60 61 ▲ 59 ▲ 50 ▼ 42 ▼ 57 50 52 ▼ 56 44 ▼ 52 57 Asthma Medication Ratio (Ages 19-64) 50 ▼ 56 61 52 ▼ 60 63 ▲ 51 ▼ 58 62 54 ▼ 58 61 59 65 ▲ 64 ▲ 57 Asthma Medication Ratio (Ages 5-18) 53 ▼ 68 68 65 68 ▲ 73 ▲ 54 ▼ 66 69 61 ▼ 61 70 ▲ 72 ▲ 67 79 ▲ 64 Persistence of Beta-Blocker Treatment After a Heart Attack 76 SS 86 82 85 92 ▲ 84 83 97 79 SS 80 82 79 89 85 CDC—HbA1c Testing 91 88 ▼ 89 91 89 91 93 91 88 ▼ 94 ▲ 90 89 90 92 89 91 CDC—HbA1c Control (<8%) 52 ▼ 56 60 54 54 64 ▲ 59 57 60 59 36 ▼ 58 59 59 57 59 CDC—Eye Exam Performed 63 66 69 63 71 72 ▲ 70 60 ▼ 64 66 64 56 ▼ 59 ▼ 59 ▼ 67 67 CDC—Nephropathy Monitor 90 91 91 93 91 94 92 93 92 93 89 ▼ 91 91 93 92 93 CDC—BP Controlled (<140/90 mm Hg) 54 ▼ 68 ▲ 74 ▲ 54 ▼ 72 ▲ 59 61 56 ▼ 69 ▲ 70 ▲ 57 ▼ 66 60 63 65 61 Drug Therapy for Rheumatoid Arthritis 83 74 84 82 90 84 82 84 80 89 ▲ 80 80 79 81 82 83 Monitor Patients on Persistent Medications—Total Rate 92 87 ▼ 88 ▼ 93 ▲ 87 ▼ 93 ▲ 92 91 ▼ 88 ▼ 93 ▲ 90 ▼ 90 ▼ 92 93 89 ▼ 92 Appropriate Treatment for URI 96 ▲ 93 94 93 ▼ 94 ▼ 96 ▲ 95 95 95 96 ▲ 96 95 92 ▼ 95 93 ▼ 95 Avoidance of Antibiotics for Adults with Acute Bronchitis 45 ▲ 29 36 34 38 ▲ 36 ▲ 38 ▲ 27 ▼ 26 ▼ 35 30 29 ▼ 26 ▼ 46 ▲ 28 34 HIV Viral Load Suppression2 78 81 84 73 84 ▲ 76 78 72 79 76 80 85 ▲ 75 66 ▼ 76 77
SS: Sample size too small to report (less than 30 members), but included in the statewide average. COPD: Chronic Obstructive Pulmonary Disease; CDC: Comprehensive Diabetes Care; BP: Blood Pressure; URI: Upper Respiratory Infection 1 All measures included in this table are HEDIS® measures, unless noted otherwise. 2 NYS-specific measure.

All-Plan Summary Report | Reporting Year 2017 Technical Report 19
Behavioral Health This section examines the health care services MCOs provide to members with behavioral health conditions through performance on several HEDIS®/QARR Behavioral Health measures. The table below describes the measures included in this domain.
Behavioral Health Performance Indicators1
Measure Type Measure Name Measure Description
HEDIS® Antidepressant Medication Management (AMM)
The percentage of members 18 years of age and older who were treated with antidepressant medication, had a diagnosis of major depression, and who remained on an antidepressant medication treatment for at least 84 days (Effective Acute Phase Treatment) and for at least 180 days (Effective Continuation Phase Treatment).
HEDIS® Follow-Up Care for Children Prescribed ADHD Medication (ADD)
The percentage of children newly prescribed attention-deficit/ hyperactivity disorder (ADHD) medication who had at least three follow-up care visits within a 10-month period, one of which was within 30 days of when the first ADHD medication was dispensed.
HEDIS® Follow-Up After Hospitalization for Mental Illness (FUH)
The percentage of discharges for members 6 years of age and older who were hospitalized for treatment of selected mental illness diagnoses and who had a follow-up visit with a mental health practitioner within 30 days after discharge and within 7 days after discharge.
HEDIS® Diabetes Screening for People with Schizophrenia or Bipolar Disorder using Antipsychotic Medications (SSD)
The percentage of members 18-64 years of age with schizophrenia or bipolar disorder who were dispensed an antipsychotic medication and had a diabetes screening test during the measurement year.
HEDIS® Diabetes Monitoring for People with Diabetes and Schizophrenia (SMD)
The percentage of members 18-64 years of age with schizophrenia and diabetes who had both an LDL-C test and an HbA1c test during the measurement year.
HEDIS® Adherence to Antipsychotic Medications for Individuals with Schizophrenia (SAA)
The percentage of members 19-64 years of age during the measurement year with schizophrenia who were dispensed and remained on an antipsychotic medication for at least 80% of their treatment period.
1 Measure descriptions in the HEDIS® 2018 Technical Specifications for Health Plans, Volume 2 were used for HEDIS® measures.
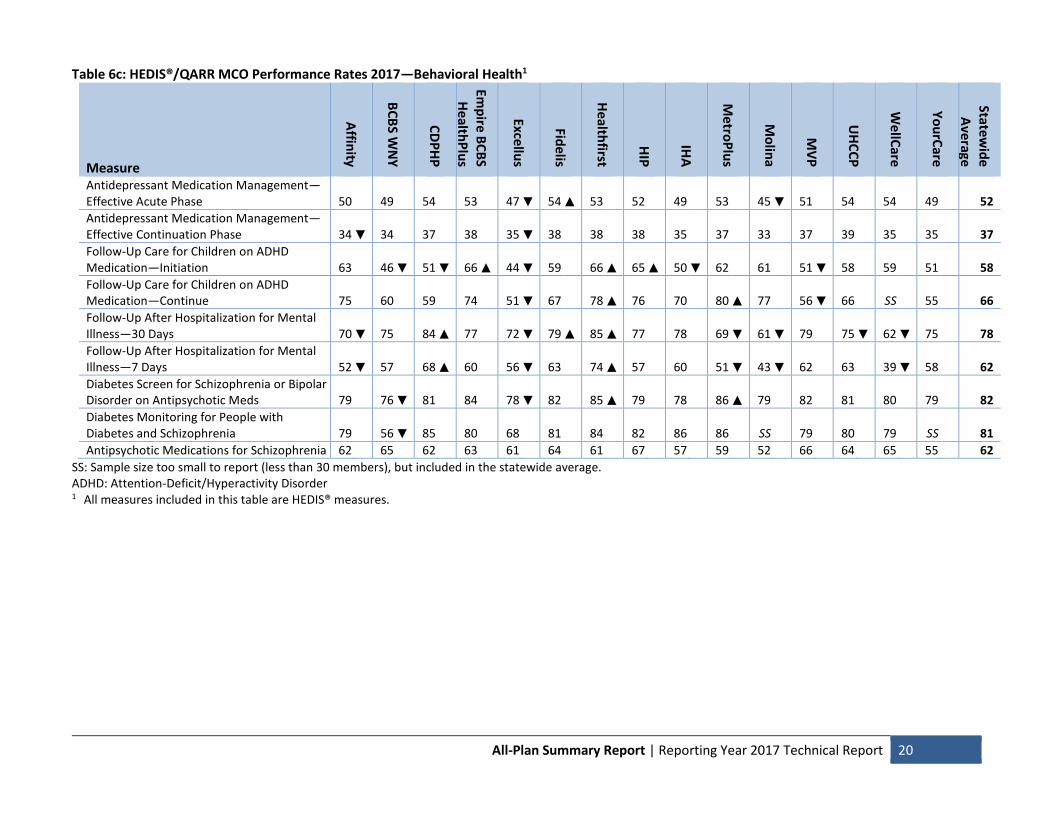
Table 6c displays HEDIS®/QARR performance rates for Measurement Year 2017 for the Behavioral Health domain, as well as the statewide averages (SWAs). The table indicates whether the MCOs’ rates were statistically better than the SWA (indicated by ▲) or whether the MCOs’ rates were statistically worse than the SWA (indicated by ▼).
All-Plan Summary Report | Reporting Year 2017 Technical Report 20
Table 6c: HEDIS®/QARR MCO Performance Rates 2017—Behavioral Health1
Measure
Affinity
BCBS WN
Y
CDPHP
Empire BCBS
HealthPlus
Excellus
Fidelis
Healthfirst
HIP
IHA
MetroPlus
Molina
MVP
UHCCP
WellCare
YourCare
Statewide
Average
Antidepressant Medication Management—Effective Acute Phase 50 49 54 53 47 ▼ 54 ▲ 53 52 49 53 45 ▼ 51 54 54 49 52 Antidepressant Medication Management—Effective Continuation Phase 34 ▼ 34 37 38 35 ▼ 38 38 38 35 37 33 37 39 35 35 37 Follow-Up Care for Children on ADHD Medication—Initiation 63 46 ▼ 51 ▼ 66 ▲ 44 ▼ 59 66 ▲ 65 ▲ 50 ▼ 62 61 51 ▼ 58 59 51 58 Follow-Up Care for Children on ADHD Medication—Continue 75 60 59 74 51 ▼ 67 78 ▲ 76 70 80 ▲ 77 56 ▼ 66 SS 55 66 Follow-Up After Hospitalization for Mental Illness—30 Days 70 ▼ 75 84 ▲ 77 72 ▼ 79 ▲ 85 ▲ 77 78 69 ▼ 61 ▼ 79 75 ▼ 62 ▼ 75 78 Follow-Up After Hospitalization for Mental Illness—7 Days 52 ▼ 57 68 ▲ 60 56 ▼ 63 74 ▲ 57 60 51 ▼ 43 ▼ 62 63 39 ▼ 58 62 Diabetes Screen for Schizophrenia or Bipolar Disorder on Antipsychotic Meds 79 76 ▼ 81 84 78 ▼ 82 85 ▲ 79 78 86 ▲ 79 82 81 80 79 82 Diabetes Monitoring for People with Diabetes and Schizophrenia 79 56 ▼ 85 80 68 81 84 82 86 86 SS 79 80 79 SS 81 Antipsychotic Medications for Schizophrenia 62 65 62 63 61 64 61 67 57 59 52 66 64 65 55 62
SS: Sample size too small to report (less than 30 members), but included in the statewide average. ADHD: Attention-Deficit/Hyperactivity Disorder 1 All measures included in this table are HEDIS® measures.

All-Plan Summary Report | Reporting Year 2017 Technical Report 21
Access/Timeliness Indicators This section of the report examines the accessibility and timeliness of health care services provided by the MCOs to Medicaid recipients. CMS defines “access” in Federal Regulation 42 CFR §438.320 as “the timely use of services to achieve optimal outcomes, as evidenced by managed care plans successfully demonstrating and reporting on outcome information for the availability and timeliness elements defined under §438.68 (network adequacy standards) and §438.206 (availability of services).” Performance indicators related to Utilization and Access to Care are included in this section. Utilization The measures included in this section evaluate member utilization of selected services. The table below provides descriptions of the HEDIS®/QARR measures selected for this domain.
Utilization Performance Indicators1
Measure Type Measure Name Measure Description
HEDIS® Well-Child Visits in the First 15 Months of Life—6+ Visits (W15)
The percentage of members who turned 15 months old during the measurement year and who had six or more well-child visits with a PCP during their first 15 months of life.
HEDIS® Well-Child Visits in the Third, Fourth, Fifth, and Sixth Years of Life (W34)
The percentage of members 3-6 years of age who had one or more well-child visits with a PCP during the measurement year.
HEDIS® Adolescent Well-Care Visits (AWC)
The percentage of members 12-21 years of age who had at least one comprehensive well-care visit with a PCP or OB/GYN practitioner during the measurement year.
1 Measure descriptions in the HEDIS® 2018 Technical Specifications for Health Plans, Volume 2 were used for HEDIS® measures.
Table 7a displays HEDIS®/QARR performance rates for Measurement Year 2017 for the Utilization domain, as well as the statewide averages (SWAs). The table indicates whether the MCOs’ rates were statistically better than the SWA (indicated by ▲) or whether the MCOs’ rates were statistically worse than the SWA (indicated by ▼).

All-Plan Summary Report | Reporting Year 2017 Technical Report 22
Table 7a: HEDIS®/QARR MCO Performance Rates 2017—Utilization1
MCO Well-Child Visits—
First 15 Months Well-Child Visits—
3 to 6 Year Olds Adolescent
Well-Care Visits Affinity 83 ▲ 82 ▼ 64 ▼ BCBS WNY 74 82 ▼ 67 CDPHP 63 ▼ 83 ▼ 66 ▼ Empire BCBS HealthPlus 66 ▼ 86 ▲ 72 ▲ Excellus 70 ▲ 82 ▼ 67 ▼ Fidelis 66 ▼ 84 ▼ 66 ▼ Healthfirst 71 ▲ 89 ▲ 73 ▲ HIP 66 87 ▲ 77 ▲ IHA 66 86 68 MetroPlus 70 ▲ 87 ▲ 67 ▼ Molina 62 ▼ 79 ▼ 62 ▼ MVP 69 84 ▼ 67 ▼ UHCCP 59 ▼ 83 ▼ 65 ▼ WellCare 61 ▼ 78 ▼ 64 ▼ YourCare 61 ▼ 84 66 ▼ Statewide Average 68 85 68
1 All measures included in this table are HEDIS® measures.

All-Plan Summary Report | Reporting Year 2017 Technical Report 23
Access to Care The HEDIS®/QARR Access to Care measures examine the percentage of children and adults who access certain services, including preventive services, prenatal and postpartum care, and dental services. The table below provides descriptions of the measures included in this domain.
Access to Care Performance Indicators1
Measure Type Measure Name Measure Description
HEDIS® Children and Adolescents’ Access to Primary Care Practitioners (CAP)
The percentage of children 12-24 months and 25 months-6 years who had a visit with a PCP during the measurement year and the percentage of children 7-11 years and adolescents 12-19 years who had a visit with a PCP during the measurement year or the year prior.
HEDIS® Adults’ Access to Ambulatory/ Preventive Health Services (AAP)
The percentage of members 20 years and older who had an ambulatory or preventive care visit during the measurement year.
HEDIS® Timeliness of Prenatal Care (PPC) The percentage of deliveries that received a prenatal care visit as a member of the organization in the first trimester, on the enrollment start date, or within 42 days of enrollment in the organization.
HEDIS® Postpartum Care (PPC) The percentage of deliveries that had a postpartum visit on or between 21 and 56 days after delivery.
HEDIS® Annual Dental Visit (ADV) The percentage of members 2-20 years of age who had at least one dental visit during the measurement year.
1 Measure descriptions in the HEDIS® 2018 Technical Specifications for Health Plans, Volume 2 were used for HEDIS® measures.
Table 7b displays HEDIS®/QARR performance rates for Measurement Year 2017 for the Access to Care domain, as well as the statewide averages (SWAs). The table indicates whether the MCOs’ rates were higher than 90% of all MCOs for that measure (indicated by ▲) or whether the MCOs’ rates were lower than 90% of all MCOs for that measure (indicated by ▼).

All-Plan Summary Report | Reporting Year 2017 Technical Report 24
Table 7b: HEDIS®/QARR MCO Performance Rates 2017—Access to Care1
Children & Adolescents’ Access to PCPs Adults’ Access to
Preventive/Ambulatory Services Access to Other Services
MCO 12-24
Months 25 Months-
6 Years 7-11
Years 12-19 Years
20-44 Years
45-64 Years
65+ Years
Timeliness of Prenatal
Care Postpartum
Care
Annual Dental Visit2
Affinity 96 91 ▼ 93 ▼ 93 ▼ 78 ▼ 88 ▼ 88 ▼ 92 ▲ 68 53 ▼ BCBS WNY 97 93 98 96 ▲ 85 ▲ 89 84 88 68 68 ▲ CDPHP 98 ▲ 94 97 96 ▲ 86 ▲ 91 ▲ 90 91 68 60 Empire BCBS HealthPlus 97 ▲ 95 ▲ 98 ▲ 96 ▲ 81 ▼ 88 ▼ 90 ▼ 87 73 59 ▼ Excellus 99 ▲ 94 97 97 ▲ 87 ▲ 91 ▲ 91 92 ▲ 63 ▼ 63 ▲ Fidelis 98 ▲ 95 ▲ 97 96 ▲ 82 90 92 ▲ 90 73 62 ▲ Healthfirst 93 ▼ 94 97 95 84 ▲ 92 ▲ 93 ▲ 90 75 58 ▼ HIP 93 ▼ 93 ▼ 96 ▼ 95 83 ▲ 89 88 ▼ 80 ▼ 61 ▼ 50 ▼ IHA 99 ▲ 94 97 95 84 ▲ 89 85 ▼ 87 66 ▼ 69 ▲ MetroPlus 94 ▼ 92 ▼ 96 ▼ 93 ▼ 77 ▼ 89 ▼ 91 92 ▲ 71 60 Molina 97 93 ▼ 96 96 85 ▲ 91 90 78 ▼ 56 ▼ 53 ▼ MVP 98 ▲ 95 ▲ 98 ▲ 97 ▲ 83 ▲ 89 89 83 ▼ 69 66 ▲ UHCCP 97 ▲ 94 97 96 ▲ 81 ▼ 88 ▼ 90 76 ▼ 71 60 WellCare 92 ▼ 87 ▼ 93 ▼ 92 ▼ 69 ▼ 83 ▼ 88 ▼ 88 71 49 ▼ YourCare 97 94 97 95 83 ▲ 90 90 86 67 67 ▲ Statewide Average 96 94 97 95 82 90 91 88 71 60
1 All measures included in this table are HEDIS® measures. 2 For the Annual Dental Visit measure, the age group is 2-20 years.

All-Plan Summary Report | Reporting Year 2017 Technical Report 25
NYSDOH-Calculated Prenatal Care Measures Certain QARR prenatal care measures are calculated by the NYSDOH using birth data submitted by the MCOs, and from NYSDOH’s Vital Statistics Birth File. Since some health events, such as low birth weight births and cesarean deliveries, do not occur randomly across all MCOs, risk adjustment is used to remove or reduce the effects of confounding factors that may influence an MCO’s rate. Vital statistics data are used in the risk adjustment. Table 8 presents prenatal care rates calculated by the NYSDOH for QARR 2016. In addition, the table indicates if the MCOs’ rates were significantly better than the regional average (indicated by ▲) or if the MCOs’ rates were significantly worse than the regional average (indicated by ▼). Table 8: QARR Prenatal Care Rates—2016
Risk-Adjusted Low Birth Weight1
Prenatal Care in the First Trimester
Risk-Adjusted Primary
Cesarean Delivery1
Vaginal Birth After
Cesarean
Risk-Adjusted Low Birth Weight1
Prenatal Care in the First Trimester
Risk-Adjusted Primary
Cesarean Delivery1
Vaginal Birth After
Cesarean MCO NYC ROS Affinity 6% 73% ▼ 15% 11% ▼ 8% 76% 14% 12% BCBS WNY 9% 69% 11% 11% CDPHP 7% 74% 13% 18% Empire BCBS HealthPlus 6% 80% ▲ 14% 15% 13% ▼ 74% 17% 13% Excellus 6% 76% 11% 16% Fidelis 7% 77% 15% 22% 7% 74% 12% 15% Healthfirst 6% 74% ▼ 14% 15% ▼ 8% 78% 11% 12% HIP 6% 79% 17% 20% 9% 75% 17% 11% IHA 7% 75% 12% 14% MetroPlus 7% 67% ▼ 14% 14% ▼ Molina 6% 66% ▼ 13% 23% MVP 6% 79% 13% 11% UHCCP 6% 81% ▲ 13% ▲ 39% ▲ 8% 76% 15% 10% WellCare 8% 73% 19% 10% 6% 69% 14% 6% YourCare 7% 74% 15% 18% Regional Average 6% 76% 14% 18% 7% 74% 13% 14%
Note: The rows shaded in gray indicate that the MCO does not operate in that region. NYC: New York City; ROS: Rest of State 1 A low rate is desirable for this measure.

All-Plan Summary Report | Reporting Year 2017 Technical Report 26
Member Satisfaction In 2017, the CAHPS® survey for Medicaid enrollees was conducted on behalf of the NYSDOH by an NCQA-certified survey vendor. Table 9 displays the question category, the MCOs’ rates, and the statewide averages (SWAs) for Measurement Year 2017. The table also indicates whether the MCOs’ rates were significantly better than the SWA (indicated by ▲) or whether the MCOs’ rates were significantly worse than the SWA (indicated by ▼). Table 9: CAHPS®—2017
MCO
Getting Care
Needed1
Getting Care
Quickly1
Satisfaction with Provider
Communication1 Customer Service1
Collaborative Decision Making
Rating of Personal Doctor
Rating of Specialist
Rating of Healthcare
Overall Rating of
Health Plan
Affinity 74 73 94 85 83 83 77 75 74 BCBS WNY 79 85 ▲ 89 83 81 75 ▼ 81 70 ▼ 66 ▼ CDPHP 86 ▲ 85 ▲ 93 91 ▲ 82 85 ▲ 84 83 ▲ 87 ▲ Empire BCBS HealthPlus 76 75 89 86 81 78 74 71 76 Excellus 82 79 92 83 79 83 79 84 ▲ 80 Fidelis 80 80 93 86 82 81 80 78 77 Healthfirst 73 ▼ 75 90 84 76 79 78 75 79 HIP 75 76 90 89 82 78 76 72 67 ▼ IHA 82 82 94 ▲ 86 82 86 ▲ 88 ▲ 79 81 ▲ MetroPlus 71 ▼ 71 ▼ 90 88 74 ▼ 78 77 74 79 Molina 83 78 88 82 83 85 86 78 72 MVP 83 ▲ 77 93 92 ▲ 80 85 ▲ 81 81 85 ▲ UHCCP 76 80 90 81 79 78 79 74 70 ▼ WellCare 78 75 91 84 81 82 76 76 72 YourCare 83 85 ▲ 90 87 77 76 ▼ 80 77 74 Statewide Average 79 78 91 86 80 81 80 77 76
1 These indicators are composite measures.

All-Plan Summary Report | Reporting Year 2017 Technical Report 27
NYSDOH Quality Incentive The percentage of the potential financial incentive that an MCO receives is based on quality of care, consumer satisfaction, and compliance. The NYSDOH Office of Health Insurance Programs (OHIP) calculated the quality incentive using an algorithm which considers the following data elements: QARR data, the most recent Medicaid CAHPS® results, PDI 90 Overall Quality Composite and PQI 90 Preventive Quality Composite, and regulatory compliance information from MY 2015 and MY 2016. The total score, based out of 150 possible points, determines what percentage of the available premium increase the MCOs qualified for. MCOs can earn 100 points for quality measures, 30 points for satisfaction measures, 20 points from the PDI/PQI measures, and up to 6 points for approved telehealth plans. A maximum of 20 points may be subtracted from the MCOs’ total points based on compliance measures, as well. The total points are normalized to a 100-point scale to determine the MCOs’ final scores. MCOs are then placed into one of five tiers to determine the incentive award. The highest performing MCOs are placed in Tier 1, while the lowest performing MCOs are placed in Tier 5. Tiers are based on the percentage of total points earned, and MCOs must meet or exceed the tier threshold to be eligible for the incentive award. Table 10 displays the points each MCO earned in 2017, as well as the tier the MCOs achieved based on the previous measurement year’s data. Table 10: Quality Incentive Points Earned—2017
MCO PQI Points
(20 Possible)
Compliance Points
(-20 Possible)
Satisfaction Points
(30 Possible) Quality Points1 (100 Possible)
Bonus Points
Total Points Earned2 Tier
Affinity 0.0 -12.0 15.0 57.3 6 66.3 Tier 4 BCBS WNY 15.0 -8.0 10.0 55.1 6 78.1 Tier 3 CDPHP 20.0 -4.0 30.0 66.3 6 118.3 Tier 2 Empire BCBS HealthPlus 12.5 -4.0 15.0 73.0 6 102.5 Tier 2 Excellus 5.0 -8.0 15.0 74.2 6 92.2 Tier 3 Fidelis 10.0 -8.0 15.0 88.8 6 111.8 Tier 2 Healthfirst 0.0 -8.0 10.0 97.8 6 105.8 Tier 2 HIP 0.0 -12.0 10.0 55.1 6 59.1 Tier 4 IHA 0.0 -4.0 20.0 67.4 6 89.4 Tier 3 MetroPlus 5.0 -4.0 10.0 100.0 6 117.0 Tier 2 Molina 7.5 -4.0 15.0 39.3 6 63.8 Tier 4 MVP 15.0 -8.0 30.0 61.8 6 104.8 Tier 2 UHCCP 15.0 -4.0 10.0 48.3 6 75.3 Tier 3 WellCare 5.0 -8.0 15.0 57.3 6 75.3 Tier 3 YourCare 0.0 -12.0 15.0 49.4 6 58.4 Tier 4 Statewide Average 7.3 -7.2 15.7 66.1 6 87.9
1 Quality points are normalized and rounded to the nearest tenth. 2 Total points are rounded to the nearest tenth.

All-Plan Summary Report | Reporting Year 2017 Technical Report 28
Performance Improvement Projects As part of the external quality review responsibilities, IPRO assists the MCOs through many steps of the Performance Improvement Project (PIP) process. The contract between the NYSDOH and the MCOs instructs the MCOs to conduct at least one PIP each year. The PIP must be designed to achieve significant improvement, sustained over time, in health outcomes and enrollee satisfaction, and must include the following elements: 1) measurement of performance using objective quality indicators, 2) implementation of interventions to achieve improvement in access to and quality of care, and 3) evaluation of the effectiveness of interventions based on the performance measures. The purpose of a PIP is to assess and improve the processes and outcomes of the health care provided by an MCO. Protocol 3 of CMS’ Federal Regulation 42 CFR §438, subpart E specifies procedures for EQROs to use in assessing the validity and reliability of a PIP. Protocol 3 describes how to conduct the following activities: assessment of study methodology, verification of study findings, and evaluation of overall reliability and validity of study results. The PIP should target improvement in either clinical or non-clinical services delivered by the MCOs. Study topics must reflect MCO enrollee characteristics, including demographics, prevalence of disease, and the potential consequences of disease. The project may focus on patterns of over- or under-utilization that present a clear threat to health or functional status, as well. The topic should address a significant portion of enrollees (or a specified sub-portion of enrollees) and have the potential to significantly impact enrollee health, functional status, or satisfaction. The topics should reflect high-volume or high-risk conditions of the population served. High-risk conditions may be categorized as infrequent conditions or services, and also exist for populations with special health care needs, such as children in foster care, adults with disabilities, and the homeless. Although these individuals may be small in number, their special needs place them at high risk. The State may select the MCOs’ study topic(s), or topics may be selected based on enrollee input. While MCOs have the option to select a study topic of their choosing, they are encouraged to participate collaboratively with other MCOs in conducting their PIPs. The common-themed PIP chosen for Reporting Years 2017-2018 was Perinatal Care and Pre-term Births. The NYS EQRO provided technical assistance to the MCOs throughout the PIP process in the following forms: 1) review of the MCOs’ Project Proposals prior to the start of the PIP; 2) quarterly teleconferences with the MCOs for progress updates and problem-solving; 3) providing feedback on methodology, data collection tools, and implementation of interventions; and 4) feedback on drafts of the MCOs’ final reports. In addition, the NYS EQRO validated the MCOs’ PIPs by reviewing the project topic, aim statement, performance indicators, study population, sampling methods (if sampling was used), data collection procedures, data analysis, and interpretation of project results, as well as assessing the MCOs’ improvement strategies, the likelihood that the reported improvement is “real” improvement, and whether the MCOs are likely to be able to sustain the documented improvement. Validation teams met quarterly to review any issues that could potentially impact the credibility of PIP results, thus ensuring consistency among validation teams. The validation process concluded with a summary of strengths and opportunities for improvement in the conduct of the PIP, including any validation findings that indicated the credibility of PIP results was at risk. Note: MCO summaries on the conduct of the PIPs are available within the individual, MCO-specific technical reports.
All-Plan Summary Report | Reporting Year 2017 Technical Report 29
VI. Structure and Operation Standards5 This section of the report examines deficiencies identified by the NYSDOH in operational and focused surveys as part of the EQRO’s evaluation of the MCOs’ compliance with State structure and operation standards. Compliance with NYS Structure and Operation Standards To assess the compliance of an MCO with Article 44 of the Public Health Law and Part 98 of the New York Code of Rules and Regulations (NYCRR), the NYSDOH conducts a full monitoring review of the MCOs’ compliance with structure and operation standards once every two years. These standards are reflected in the 14 categories listed in Table 15 of the individual, MCO-specific technical reports. “Deficiencies” represent a failure to comply with these standards. Each deficiency can result in multiple “citations” to reflect each standard with which the MCOs were not in compliance. The full monitoring review consists of an operational survey. The on-site component includes review of the following: policies and procedures, executed contracts and credentialing files of randomly selected providers, adverse determination utilization review files, complaints and grievances files, meeting minutes, and other documentation. Staff interviews are also conducted. These reviews are conducted using two standardized tools, the “Medicaid Managed Care Contract Surveillance Tool” and the “Review Tool and Protocol for MCO Operational Surveys”. The NYSDOH retains the option to deem compliance with standards for credentialing/ re-credentialing, quality assurance/improvement, and medical record review. The Monitoring Review Report documents any data obtained and deficiencies cited in the survey tools. Any statements of deficiencies (SODs) are submitted to the MCOs after the monitoring review, and the MCOs are required to respond with a plan of corrective action (POC). POCs must be submitted to the NYSDOH for acceptance. In some cases, revisions may be necessary and MCOs are required to resubmit. Ultimately, all MCOs with SODs must have a POC that is accepted by the NYSDOH. During the alternate years when the full review is not conducted, the NYSDOH reviews any modified documentation and follows up with the MCOs to ensure that all deficiencies or issues from the operational survey have been remedied. In addition to the full operational survey conducted every two years, the NYSDOH also conducts several focused reviews as part of the monitoring of structure and operation standards. The focused review types are summarized in Table 11. MCOs are also required to submit POCs in response to deficiencies identified in any of these reviews. Table 12 reflects the total number of citations received by each MCO for the most current operational survey, where applicable, as well as from the focused reviews conducted in 2017.
5 External Appeals data are reported in the Full EQR Technical Report prepared every third year.

All-Plan Summary Report | Reporting Year 2017 Technical Report 30
Table 11: Focused Review Types Review Name Review Description
Access and Availability Provider telephone survey of all MMC plans performed by the NYSDOH EQRO to examine appointment availability for routine and urgent visits; re-audits are performed when results are below 75%.
Complaints Investigations of complaints that result in an SOD being issued to the plan.
Contracts Citations reflecting non-compliance with requirements regarding the implementation, termination, or non-renewal of MCO provider and management agreements.
Disciplined/Sanctioned Providers Survey of HCS to ensure providers that have been identified as having their licenses revoked or surrendered, or otherwise sanctioned, are not listed as participating with the MCO.
MEDS Citations reflecting non-compliance with requirements to report MCO encounter data to the Department of Health.
Member Services Phone Calls Telephone calls are placed to Member Services by AO staff to determine telephone accessibility and to ensure correct information is being provided to callers.
Provider Directory Information Provider directories are reviewed to ensure that they contain the required information.
Provider Information—Web Review of MCOs’ web-based provider directory to assess accuracy and required content.
Provider Network Quarterly review of HCS network submissions for adequacy, accessibility, and correct listings of primary, specialty, and ancillary providers for the enrolled population.
Provider Participation—Directory
Telephone calls are made to a sample of providers included in the provider directory to determine if they are participating, if panels are open, and if they are taking new Medicaid patients. At times, this survey may be limited to one type of provider.
QARR Citations reflecting non-compliance with requirements to submit MCO QARR data to the Department of Health.
Ratio of PCPs to Medicaid Clients
Telephone calls are placed to PCPs with a panel size of 1,500 or more Medicaid clients. The calls are used to determine if appointment availability standards are met for routine, non-urgent “sick”, and urgent appointments.
Other Used for issues that do not correspond with the available focused review types.
AO: Area Office; HCS: Health Commerce System; MEDS: Medicaid Encounter Data Set; SOD: Statement of Deficiency; QARR: Quality Assurance Reporting Requirements

All-Plan Summary Report | Reporting Year 2017 Technical Report 31
Table 12: Summary of Citations—2017
MCO Operational
Citations Focused Review
Citations Total Citations Affinity1 — 9 9 BCBS WNY 12 9 21 CDPHP 5 6 11 Empire BCBS HealthPlus 2 10 12 Excellus1 — 14 14 Fidelis1 — 9 9 Healthfirst 2 10 12 HIP1 — 10 10 IHA 1 4 5 MetroPlus 10 12 22 Molina 3 7 10 MVP1 — 12 12 UHCCP1 — 8 8 WellCare 5 9 14 YourCare1 — 10 10 Statewide Total2 51 153 204
1 The MCO did not have an operational survey in 2017. 2 Note that the statewide totals include findings for MCOs that were operational during the measurement year, but did not
have enough members to report sufficient data. Note: MCO summaries of deficiencies and citations received are available within the individual, MCO-specific technical reports.

All-Plan Summary Report | Reporting Year 2017 Technical Report 32
VII. Strengths and Opportunities for Improvement6
This section summarizes the accessibility, timeliness, and quality of services provided by the MCOs to Medicaid and Child Health Plus recipients based on data presented in the various sections of the individual, MCO-specific technical reports. The MCOs’ strengths in each of these areas are noted, as well as opportunities for improvement. Recommendations for enhancing the quality of health care are also provided based on the opportunities for improvement noted. An assessment of the degree to which the MCOs have effectively addressed the recommendations for quality improvement made by the NYS EQRO in the previous year’s EQR report is also included in this section. The MCOs’ responses to the previous year’s recommendations, wherein the MCOs were given the opportunity to describe current and proposed interventions that address areas of concern, as well as an opportunity to explain areas the MCO did not feel were within their ability to improve, is appended to this section of the MCO-specific technical reports. Note: Complete and detailed reports on strengths, opportunities for improvement, and recommendations made by the EQRO are available within the individual, MCO-specific technical reports.
6 This section of the report emphasizes the maintenance of current good practices and the development of additional
practices resulting in improved processes and outcomes, and thus refers to “Strengths” and “Opportunities for Improvement”, rather than “Strengths” and “Weaknesses”, as indicated in federal regulations.

All-Plan Summary Report | Reporting Year 2017 Technical Report 33
VIII. Appendix
References A. MCO Corporate Profiles
Updated Corporate Profile information provided by the NYSDOH NYSDOH OMC DataLink Reports
o Managed Care Plan Directory NCQA Accreditation website, https://reportcards.ncqa.org
B. Enrollment and Provider Network Enrollment:
o NYSDOH OMC Membership Data, 2016-2017 o MEDS II o Managed Care Enrollment Report
Provider Network: o State Model Contract o QARR Measurement Year 2017
C. Utilization
Encounter Data: o MMC Encounter Data System, 2017 o MEDS II
QARR Use of Services: o QARR Measurement Year 2017
D. Performance Indicators
HEDIS®/QARR Performance Measures: o QARR Measurement Year 2017
CAHPS® 2017: o QARR Measurement Year 2017
NYSDOH Quality Incentive: o Quality/Satisfaction Points and Incentive, 2017
Performance Improvement Project: o 2017-2018 PIP Reports
E. Structure and Operations
MMC Operational Deficiencies by Plan/Category, 2017 Focused Deficiencies by Plan/Survey Type/Category, 2017