NEW YORK STATE CANAL SYSTEM - NYSDOT … YORK STATE CANAL SYSTEM MODERN FREIGHT-WAY Final Report...
73
NEW YORK STATE CANAL SYSTEM MODERN FREIGHT-WAY Final Report Prepared for NEW YORK STATE ENERGY RESEARCH AND DEVELOPMENT AUTHORITY Albany, NY Joseph D. Tario Senior Project Manager And NEW YORK STATE DEPARTMENT OF TRANSPORTATION Albany, NY David Rosenberg and Gary Frederick Project Managers Prepared by GOODBAN BELT, LLC Buffalo, NY Jeff Belt Principal Investigator NYSERDA Contract Number 11104 NYSDOT Task Assignment C-08-27 May 2010
Transcript of NEW YORK STATE CANAL SYSTEM - NYSDOT … YORK STATE CANAL SYSTEM MODERN FREIGHT-WAY Final Report...

NEW YORK STATE CANAL SYSTEM
MODERN FREIGHT-WAY
Final Report
Prepared for
NEW YORK STATE ENERGY RESEARCH AND DEVELOPMENT AUTHORITY
Albany, NY Joseph D. Tario
Senior Project Manager
And
NEW YORK STATE DEPARTMENT OF TRANSPORTATION
Albany, NY David Rosenberg and Gary Frederick
Project Managers
Prepared by GOODBAN BELT, LLC
Buffalo, NY Jeff Belt
Principal Investigator
NYSERDA Contract Number 11104 NYSDOT Task Assignment C-08-27
May 2010

2
New York Sate Canal System: Modern Freight-way – Draft Final Report April 2010 For: NYSERDA, NYSDOT and the New York Sate Canal System Corporation By: Goodban Belt LLC
NOTICE
This report was prepared by Goodban Belt, LLC (hereafter the “Contractor”) in the course of performing work contracted for and sponsored by the New York State Energy Research and Development Authority and the New York State Department of Transportation (hereafter the “Sponsors"). The opinions expressed in this report do not necessarily reflect those of the Sponsors or the State of New York, and reference to any specific product, service, process, or method does not constitute an implied or expressed recommendation or endorsement of it. Further, the Sponsors and the State of New York make no warranties or representations, expressed or implied, as to the fitness for particular purpose or merchantability of any product, apparatus, or service, or the usefulness, completeness, or accuracy of any processes, methods, or other information contained, described, disclosed, or referred to in this report. The Sponsors, the State of New York, and the Contractor make no representation that the use of any product, apparatus, process, method, or other information will not infringe privately owned rights and will assume no liability for any loss, injury, or damage resulting from, or occurring in connection with, the use of information contained, described, disclosed, or referred to in this report.
DISCLAIMER
This report was funded in part through grant(s) from the Federal Highway Administration, United States Department of Transportation, under the State Planning and Research Program, Section 505 of Title 23, U.S. Code. The contents of this report do not necessarily reflect the official views or policy of the United States Department of Transportation, the Federal Highway Administration or the New York State Department of Transportation. This report does not constitute a standard, specification, regulation, product endorsement, or an endorsement of manufacturers.
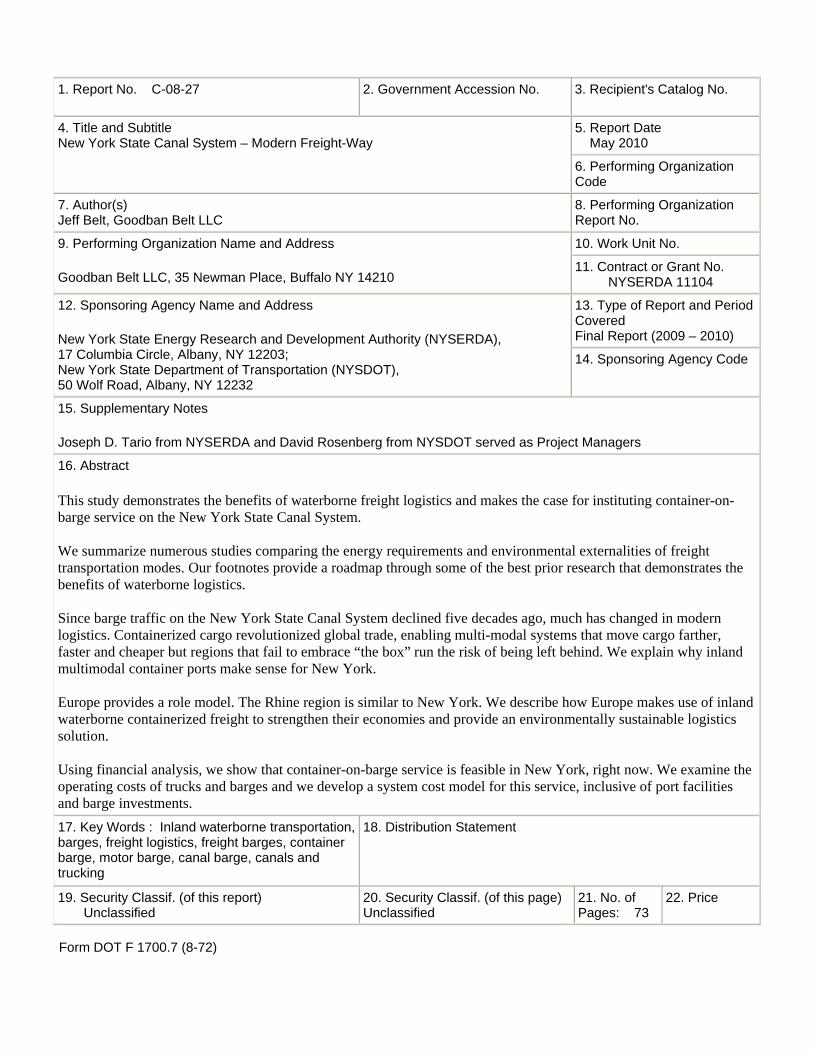
1. Report No. C-08-27 2. Government Accession No. 3. Recipient's Catalog No.
5. Report Date May 2010
4. Title and Subtitle New York State Canal System – Modern Freight-Way
6. Performing Organization Code
7. Author(s) Jeff Belt, Goodban Belt LLC
8. Performing Organization Report No.
10. Work Unit No. 9. Performing Organization Name and Address
Goodban Belt LLC, 35 Newman Place, Buffalo NY 14210 11. Contract or Grant No. NYSERDA 11104
13. Type of Report and Period Covered Final Report (2009 – 2010)
12. Sponsoring Agency Name and Address
New York State Energy Research and Development Authority (NYSERDA), 17 Columbia Circle, Albany, NY 12203; New York State Department of Transportation (NYSDOT), 50 Wolf Road, Albany, NY 12232
14. Sponsoring Agency Code
15. Supplementary Notes
Joseph D. Tario from NYSERDA and David Rosenberg from NYSDOT served as Project Managers
16. Abstract
This study demonstrates the benefits of waterborne freight logistics and makes the case for instituting container-on-barge service on the New York State Canal System. We summarize numerous studies comparing the energy requirements and environmental externalities of freight transportation modes. Our footnotes provide a roadmap through some of the best prior research that demonstrates the benefits of waterborne logistics. Since barge traffic on the New York State Canal System declined five decades ago, much has changed in modern logistics. Containerized cargo revolutionized global trade, enabling multi-modal systems that move cargo farther, faster and cheaper but regions that fail to embrace “the box” run the risk of being left behind. We explain why inland multimodal container ports make sense for New York. Europe provides a role model. The Rhine region is similar to New York. We describe how Europe makes use of inland waterborne containerized freight to strengthen their economies and provide an environmentally sustainable logistics solution. Using financial analysis, we show that container-on-barge service is feasible in New York, right now. We examine the operating costs of trucks and barges and we develop a system cost model for this service, inclusive of port facilities and barge investments. 17. Key Words : Inland waterborne transportation, barges, freight logistics, freight barges, container barge, motor barge, canal barge, canals and trucking
18. Distribution Statement
19. Security Classif. (of this report) Unclassified
20. Security Classif. (of this page) Unclassified
21. No. of Pages: 73
22. Price
Form DOT F 1700.7 (8-72)
4
New York Sate Canal System: Modern Freight-way – Draft Final Report April 2010 For: NYSERDA, NYSDOT and the New York Sate Canal System Corporation By: Goodban Belt LLC
ABSTRACT This study demonstrates the benefits of waterborne freight logistics and makes the case for instituting container-on-barge service on the New York State Canal System. We summarize numerous studies comparing the energy requirements and environmental externalities of freight transportation modes. Our footnotes provide a roadmap through some of the best prior research that demonstrates the benefits of waterborne logistics. Since barge traffic on the New York State Canal System declined five decades ago, much has changed in modern logistics. Containerized cargo revolutionized global trade, enabling multi-modal systems that move cargo farther, faster and cheaper but regions that fail to embrace “the box” run the risk of being left behind. We explain why inland multimodal container ports make sense for New York. Europe provides a role model. The Rhine region is similar to New York. We describe how Europe makes use of inland waterborne containerized freight to strengthen their economies and provide an environmentally sustainable logistics solution. Using financial analysis, we show that container-on-barge service is feasible in New York, right now. We examine the operating costs of trucks and barges and we develop a system cost model for this service, inclusive of port facilities and barge investments.
ACKNOWLEDGMENTS
We gratefully acknowledge sponsorship of this project by the New York State Energy Research and Development Authority (NYSERDA) and the New York State Department of Transportation (NYSDOT), under the direction of Joseph D. Tario of NYSERDA and David Rosenberg and Gary Frederick of NYSDOT. We also acknowledge the helpful input provided by Carmella Mantello, Lawrence Frame, Howard Goebel, Erin Agans and Richard Harris of New York State Canal Corporation. Like all New Yorkers, we admire and appreciate their effort to improve and promote the great New York State Canal System, the first defining icon of the Empire State. We wish to thank ExtraMile Transportation, Inc., Kistner Concrete, Inc., and Robinson Home Products, Inc., for their insight into the real world of global logistics.
5
New York Sate Canal System: Modern Freight-way – Draft Final Report April 2010 For: NYSERDA, NYSDOT and the New York Sate Canal System Corporation By: Goodban Belt LLC
TABLE OF CONTENTS
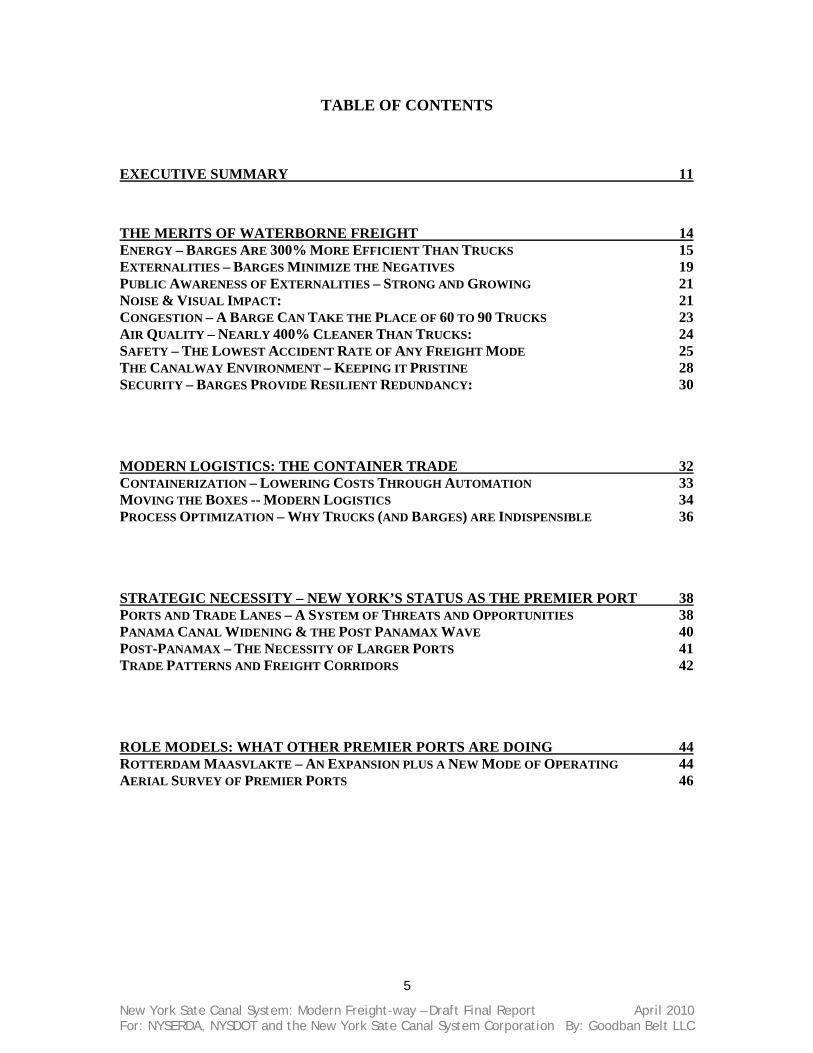
EXECUTIVE SUMMARY 11
THE MERITS OF WATERBORNE FREIGHT 14 ENERGY – BARGES ARE 300% MORE EFFICIENT THAN TRUCKS 15 EXTERNALITIES – BARGES MINIMIZE THE NEGATIVES 19 PUBLIC AWARENESS OF EXTERNALITIES – STRONG AND GROWING 21 NOISE & VISUAL IMPACT: 21 CONGESTION – A BARGE CAN TAKE THE PLACE OF 60 TO 90 TRUCKS 23 AIR QUALITY – NEARLY 400% CLEANER THAN TRUCKS: 24 SAFETY – THE LOWEST ACCIDENT RATE OF ANY FREIGHT MODE 25 THE CANALWAY ENVIRONMENT – KEEPING IT PRISTINE 28 SECURITY – BARGES PROVIDE RESILIENT REDUNDANCY: 30
MODERN LOGISTICS: THE CONTAINER TRADE 32 CONTAINERIZATION – LOWERING COSTS THROUGH AUTOMATION 33 MOVING THE BOXES -- MODERN LOGISTICS 34 PROCESS OPTIMIZATION – WHY TRUCKS (AND BARGES) ARE INDISPENSIBLE 36
STRATEGIC NECESSITY – NEW YORK’S STATUS AS THE PREMIER PORT 38 PORTS AND TRADE LANES – A SYSTEM OF THREATS AND OPPORTUNITIES 38 PANAMA CANAL WIDENING & THE POST PANAMAX WAVE 40 POST-PANAMAX – THE NECESSITY OF LARGER PORTS 41 TRADE PATTERNS AND FREIGHT CORRIDORS 42
ROLE MODELS: WHAT OTHER PREMIER PORTS ARE DOING 44 ROTTERDAM MAASVLAKTE – AN EXPANSION PLUS A NEW MODE OF OPERATING 44 AERIAL SURVEY OF PREMIER PORTS 46

6
New York Sate Canal System: Modern Freight-way – Draft Final Report April 2010 For: NYSERDA, NYSDOT and the New York Sate Canal System Corporation By: Goodban Belt LLC
ECONOMIC VIABILITY OF CONTAINER-ON-BARGE 48 “BETTER, FASTER, CHEAPER” -- THE THREE REASONS WHY FREIGHT USERS SWITCH 49 COST STRUCTURES – EXPENSIVE FUEL AND CONGESTION IS THE ENEMY OF TRUCKING 50 COST MODELING – WHAT MAKES CONTAINER-ON-BARGE CHEAPER 51 TAKING STOCK – WHAT WE HAVE AND WHAT WE NEED TO ADD 55
GETTING STARTED – LAUNCHING THE SERVICE IN NEW YORK 58 NEW YORK CITY’S BILLION-DOLLAR PROBLEM 59 THE BUSINESS CASE AND THE SOCIAL CASE 61 PUBLIC ACCEPTANCE 62 FEASIBILITY AND INVESTMENT 65 FLOATING STOCK – THE BARGES 68 CONCLUDING REMARKS AND NEXT STEPS 71

7
New York Sate Canal System: Modern Freight-way – Draft Final Report April 2010 For: NYSERDA, NYSDOT and the New York Sate Canal System Corporation By: Goodban Belt LLC
TABLE OF FIGURES
Figure 1: Mohawk River Valley, Thruway, Canal, Railway 13 Figure 2: The Rhine Valley, Germany 13 Figure 3: A Comprehensive Comparison of Energy Consumed -- by Mode 15 Figure 4: Ton-Miles per Gallon - Two Operating Use Environments 16 Figure 5: USGS Mean Oil Production Forecast 16 Figure 6: Energy Watch Oil Production Forecast 17 Figure 7: Crude Oil Prices - Actual and Forecasts 17 Figure 8: Externalities - Construction & Social Costs 18 Figure 9: Externalities – A Break-down of Environmental and Social Costs 19 Figure 10: A Hard-Working Canal in Belgium 20 Figure 11: Cost of Congestion -- Texas Transportation Institute 22 Figure 12: Exhaust Emissions: Trucks, Trains, Barges 23 Figure 13: Comparative Air Pollution Sources - St. Louis 24 Figure 14: Map of the New York State Canal System 25 Figure 15: Amsterdam Canal – Work Hard; Play Hard 26 Figure 16: The Panama Canal in Chagres National Park 28 Figure 17: Port of NY/NJ 31 Figure 18: Emma Maersk – World’s Largest Box-Boat 34 Figure 19: Fuel Consumption by Mode, in Gallons, Compared to 1965 35 Figure 20: Container Movements, Typical of a Port Like Los Angeles 36 Figure 21: Container Movements, Typical of Rotterdam 37 Figure 22: Port of Los Angeles – San Pedro Bay 38 Figure 23: Prince Rupert Port, British Columbia 39 Figure 24: "Post-Panamax" vessels carry 2-to-3 times more… 40 Figure 25: Economics of Larger Ships - Panama Canal Authority 41 Figure 26: Freeport, Bahamas -- Singapore of the Atlantic? 42 Figure 27: China's Rising Share of World Trade 43 Figure 28: Rotterdam Maasvlakte Container Port 44 Figure 29: Rotterdam Modal Split 2035 Targets 45 Figure 30: Maasvlakte from the Air 45 Figure 31: Ocean Liner-to-Barge Container Movements 46 Figure 32: Shanghai -- Container Barges Deliver to the Hinterland 47 Figure 33: Floating Cranes Unload a Container Ship at Hong Kong 47 Figure 34: A Double-Stack Container Unit Train 48
8
New York Sate Canal System: Modern Freight-way – Draft Final Report April 2010 For: NYSERDA, NYSDOT and the New York Sate Canal System Corporation By: Goodban Belt LLC
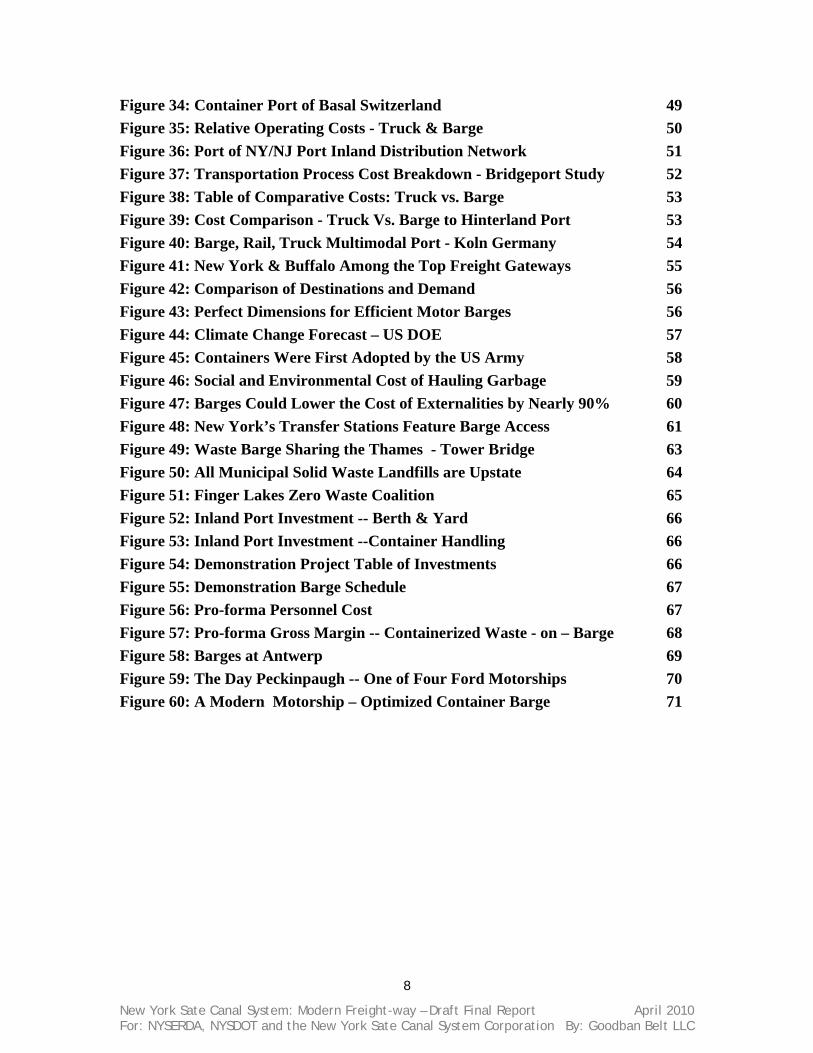
Figure 34: Container Port of Basal Switzerland 49 Figure 35: Relative Operating Costs - Truck & Barge 50 Figure 36: Port of NY/NJ Port Inland Distribution Network 51 Figure 37: Transportation Process Cost Breakdown - Bridgeport Study 52 Figure 38: Table of Comparative Costs: Truck vs. Barge 53 Figure 39: Cost Comparison - Truck Vs. Barge to Hinterland Port 53 Figure 40: Barge, Rail, Truck Multimodal Port - Koln Germany 54 Figure 41: New York & Buffalo Among the Top Freight Gateways 55 Figure 42: Comparison of Destinations and Demand 56 Figure 43: Perfect Dimensions for Efficient Motor Barges 56 Figure 44: Climate Change Forecast – US DOE 57 Figure 45: Containers Were First Adopted by the US Army 58 Figure 46: Social and Environmental Cost of Hauling Garbage 59 Figure 47: Barges Could Lower the Cost of Externalities by Nearly 90% 60 Figure 48: New York’s Transfer Stations Feature Barge Access 61 Figure 49: Waste Barge Sharing the Thames - Tower Bridge 63 Figure 50: All Municipal Solid Waste Landfills are Upstate 64 Figure 51: Finger Lakes Zero Waste Coalition 65 Figure 52: Inland Port Investment -- Berth & Yard 66 Figure 53: Inland Port Investment --Container Handling 66 Figure 54: Demonstration Project Table of Investments 66 Figure 55: Demonstration Barge Schedule 67 Figure 56: Pro-forma Personnel Cost 67 Figure 57: Pro-forma Gross Margin -- Containerized Waste - on – Barge 68 Figure 58: Barges at Antwerp 69 Figure 59: The Day Peckinpaugh -- One of Four Ford Motorships 70 Figure 60: A Modern Motorship – Optimized Container Barge 71
9
New York Sate Canal System: Modern Freight-way – Draft Final Report April 2010 For: NYSERDA, NYSDOT and the New York Sate Canal System Corporation By: Goodban Belt LLC
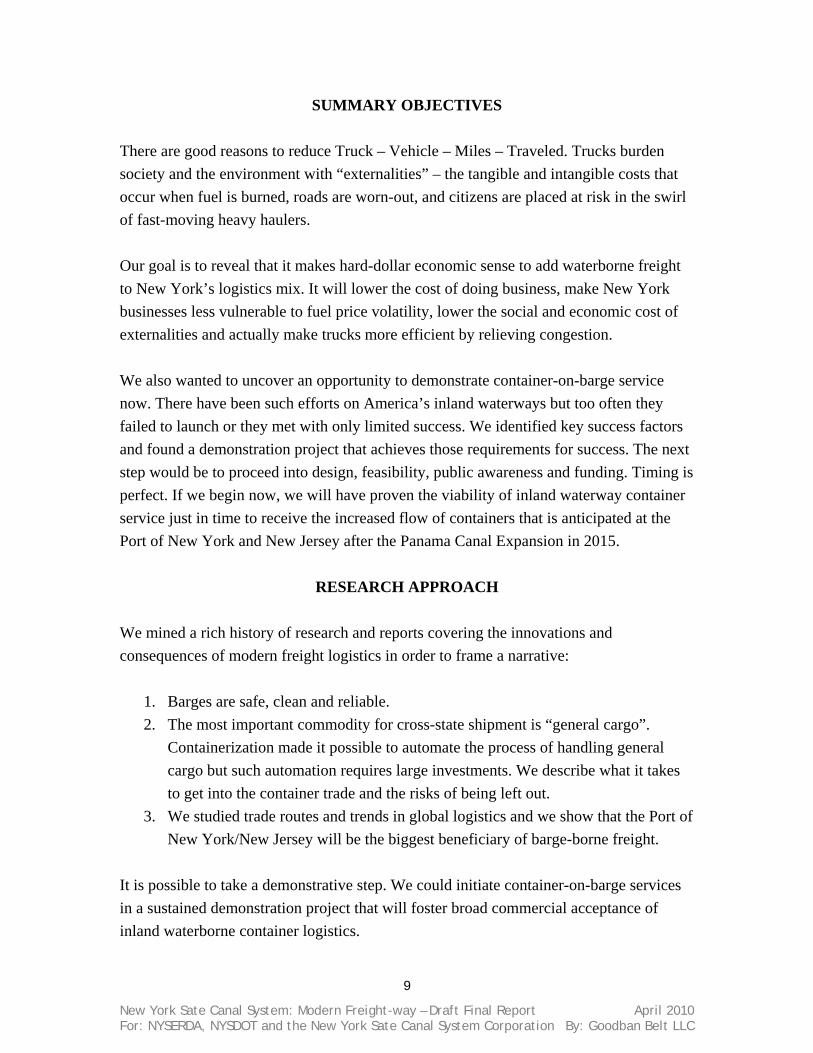
SUMMARY OBJECTIVES
There are good reasons to reduce Truck – Vehicle – Miles – Traveled. Trucks burden society and the environment with “externalities” – the tangible and intangible costs that occur when fuel is burned, roads are worn-out, and citizens are placed at risk in the swirl of fast-moving heavy haulers. Our goal is to reveal that it makes hard-dollar economic sense to add waterborne freight to New York’s logistics mix. It will lower the cost of doing business, make New York businesses less vulnerable to fuel price volatility, lower the social and economic cost of externalities and actually make trucks more efficient by relieving congestion. We also wanted to uncover an opportunity to demonstrate container-on-barge service now. There have been such efforts on America’s inland waterways but too often they failed to launch or they met with only limited success. We identified key success factors and found a demonstration project that achieves those requirements for success. The next step would be to proceed into design, feasibility, public awareness and funding. Timing is perfect. If we begin now, we will have proven the viability of inland waterway container service just in time to receive the increased flow of containers that is anticipated at the Port of New York and New Jersey after the Panama Canal Expansion in 2015.
RESEARCH APPROACH
We mined a rich history of research and reports covering the innovations and consequences of modern freight logistics in order to frame a narrative:
1. Barges are safe, clean and reliable. 2. The most important commodity for cross-state shipment is “general cargo”.
Containerization made it possible to automate the process of handling general cargo but such automation requires large investments. We describe what it takes to get into the container trade and the risks of being left out.
3. We studied trade routes and trends in global logistics and we show that the Port of New York/New Jersey will be the biggest beneficiary of barge-borne freight.
It is possible to take a demonstrative step. We could initiate container-on-barge services in a sustained demonstration project that will foster broad commercial acceptance of inland waterborne container logistics.
10
New York Sate Canal System: Modern Freight-way – Draft Final Report April 2010 For: NYSERDA, NYSDOT and the New York Sate Canal System Corporation By: Goodban Belt LLC
ANALYSIS AND RESULTS Our goal is to empower. We unpacked dozens of studies and statistics, and created numerous charts and graphical representations. We developed models and scenarios and we provide interpretations of success stories achieved elsewhere so that we may employ best practices in New York. The result is a presentation of both need and capability. We need sustainable solutions and we are fortunate that we already have sustainable infrastructure. By simply re-employing the New York State Canal System, we can make our economy more resilient and our environment and quality of life better.
CONCLUSIONS AND RECOMMENDATIONS Many container-on-barge initiatives in the United States have met with limited success but this mode is ascendant in Europe. Why? We discovered that Europe had a catalyst – a large freight user that introduced container logistics to hinterland river ports. After that, it was easy for private shippers to adopt this cost effective mode. We identify a catalyzing demand agent within New York and prove that we could launch a sustainable container-on-barge demonstration project now. An existing demand scenario will justify the initial needed investments. We also predict that after 2015 when the new, larger third-lane of the Panama Canal opens, the Port of NY/NJ will experience a flood of trade that will exacerbate congestion and necessitate capacity expansion. We show that ports like NY/NJ are able to expand capacity by simply adding container-on-barge distribution networks. No new land is needed and there is no new congestion impact on the surrounding roads. By performing a demonstration project now, we will lay the foundation for broad adoption of container-on-barge logistics in 2015, when the Port of NY/NJ begins to feel the impact of Panama Canal Expansion.
11
New York Sate Canal System: Modern Freight-way – Draft Final Report April 2010 For: NYSERDA, NYSDOT and the New York Sate Canal System Corporation By: Goodban Belt LLC
Executive Summary The New York State Canal System is plagued by misperception. Freight traffic declined when the Thruway attracted general cargo into trucks and the Saint Lawrence Seaway pulled transshipment cargo into the holds of saltwater ships. Industrial decline throughout the Great Lakes made the Canal look downright obsolete. While these trends beset the Canal, different and more remarkable trends were at work in the global economy. Free trade and currency regimes forged in the aftermath of World War II caused a boom in cross-border investment. Industrial supply lines spanned oceans. The simple idea to ship goods in pre-packed containers crushed the cost of trade and made multi-modal logistics the circulatory system for a new, “global economy”. We began this study with a sense of concern for New York State’s economic competitiveness. Since 1965 our country has so fully embraced the 18-wheeler as our primary vehicle for goods transport that if anything were to threaten the truck, our economy could tremble. Many indicators foretell such threats today. Competition for global oil will almost assuredly push-up the price of motor fuel – even if we still doubt that peak oil is upon us. The cost of polluting is also sure to rise – even if we never pay a price for carbon. Health costs and congestion are already being blamed on trucks in cities from Los Angeles to Buffalo and the South Bronx. How vulnerable is New York’s economy and what can we do about it? Measuring vulnerability is grim science and frankly, it is not our aim. We bring good news. We demonstrate that the New York State Canal System is perfect for multi-modal, container-on-barge logistics. Existing infrastructure – worth many billions of dollars to replace – is well maintained, perfectly proportioned, and ready to employ in a low-cost, low-impact freight choice that will insulate New York’s industries and consumers from the increasingly likely shock to our truck-dependent national economy. To build our case we needed to go beyond the typical. Many authors have already laid down the economic and ecological rationale for waterborne freight. Sadly, these writings have not provoked adoption. We asked freight users why?

12
New York Sate Canal System: Modern Freight-way – Draft Final Report April 2010 For: NYSERDA, NYSDOT and the New York Sate Canal System Corporation By: Goodban Belt LLC
Predictably, they believe the Canal is a “has-been”. In their view, it is a recreational waterway and they would not use it unless there were proven, scheduled freight services already up and running. Even then, canal freight should be – in their view – much cheaper than trucking simply because it is easy to hire a truck. Freight users will not switch until multi-modal barge service is equally reliable, affordable and easy. At this point we had to wonder: how is it that Europe and China succeed with inland waterborne container logistics? Thinking first of China, we know the decision to use waterways is not freight-dependent. The same goods that make their way down the Yangtze and Pearl Rivers by container barge make their way to Buffalo on a truck. And, these great Chinese barge routes are flanked by expressways and railroads, just like our Canal corridor across New York. Europe provided answers. This year the EU will begin building the 2.2 billion Euro Seine-Norde canal along with many other investments to expand inland waterborne container capacity. We uncovered a trove of justifications. Even American planners have taken note, distilling Europe as a roll-model into sets of “key success factors”. Following their lead we assert three “key enabling factors”, all of which we either have or could easily obtain:
1. Geography and Market: Container-on-barge operations do well on waterways that connect a major gateway container port with major inland markets – typically within about 500 miles.
2. Floating Stock and Infrastructure: Swift motor barges serving inland ports that have inter-modal container handling equipment can compete successfully. They provide frequent port calls, timely service and low cost.
3. An Early Adopter: American freight users need proof before they buy and the Germans were no different. The US Army introduced container logistics to Germany and we need a big, single user like that to prime the demand for container-on-barge service in New York.
Our paper is constructed in six parts beginning with the benefits of waterborne freight and ending with a recipe for a rollout in New York. Between these bookends, we provide a primer on modern logistics, trends in trade and a peak at what the competition in Europe and China is doing. Our purpose is to demonstrate why the Port of NY/NJ really needs to become a booster for barges.

13
New York Sate Canal System: Modern Freight-way – Draft Final Report April 2010 For: NYSERDA, NYSDOT and the New York Sate Canal System Corporation By: Goodban Belt LLC
We knew we had to contradict “conventional wisdom”. Even though the freight Canal fell into disuse, new circumstances will necessitate inland waterborne routes from the Port of NY/NJ. We are lucky to have the Canal, ready to serve this need. We examined the feasibility of container-on-barge service and found some attractive benefits. Predictably, barges are less sensitive to fuel cost volatility than trucks. When container-handling facilities are provided, barges are much cheaper than trucking, too. Using the marine-side of the seaport, barges are unaffected by road and port gate congestion, and they can operate 24/7, even if the port gate is closed. This last benefit is the driving force behind European ports’ decision to invest in inland barge facilities. Returning to our disbelieving freight users, we knew that white papers and spreadsheets would never compel a freight-forwarder to risk their job. That’s why we looked for a very large “early adopter” who could provide demand leadership. We focused on New York City’s solid waste stream. Large cities export waste and New York’s Mayor wishes to use sealed containers on barges. He has already invested in containerization facilities located on navigable waterways. He’s just waiting for his barge to come in. We ran the numbers and demonstrate that economically, this idea is a win-win. New York City would save money and Upstate would benefit from jobs and infrastructure. Environmentally, barges are better than trucks but disposing of New York’s waste is fraught with public affairs issues. We survey the concerns, concluding that although using barges to export containerized waste makes a lot of sense, this activity would need to be framed in a larger vision: As a first step it will reintroduce scheduled freight service to the Canal – which would be good for the economy and comparatively benign for the environment. Subsequent steps could bring holistic treatment of New York’s waste stream, including recycling and reuse. Our paper can stand alone as a rationale for container barges but we hope it will spur action. Next steps would include business planning, contracting with New York City’s Sanitation Department and launching a demonstration barge schedule. Timing is good. We anticipate a wave of container-borne trade at the Port of New York and New Jersey. Trends in trade predict this.

14
New York Sate Canal System: Modern Freight-way – Draft Final Report April 2010 For: NYSERDA, NYSDOT and the New York Sate Canal System Corporation By: Goodban Belt LLC
The Merits of Waterborne Freight Waterborne transportation provides the only mechanism for overcoming gravity: it floats! This simple fact makes it the most energy efficient way to move great loads. Studies also show that inland vessels have fewer accidents, they produce less noise and pollution, and they are less disruptive to society in general than any other freight mode. In fact, where barge traffic is common, barges are seen as benign and beneficial.1 New York State is fortunate to posses a diverse transportation mix including excellent rail, road, and seaport infrastructure. Throughout this report we will look to Europe as a roll model and assert that the Rhine watershed is like New York. We have urban density around the seaport, similar to Rotterdam, and Upstate New York has land use patterns similar to the Rhine regions. Consider population densities as a guide:
• New Jersey -1,344 persons/sq-mile and The Netherlands -1,035/sq-mile
• New York – 408 persons/sq-mile and Germany – 593/sq-mile (subtract the Adirondacks
to achieve near equivalence) It is true that our Mississippi River system supports a thriving barge trade and we will rely upon data gathered there to demonstrate that freight barges are benign. We came to difficulty, however, when we looked for successful role models in Middle America.
1 US DOT Maritime Administration, Environmental Advantages of Inland Barge Transportation, (August
1994) pp. 21 & 23.
Figure 1: Mohawk River Valley, Thruway, Canal, Railway
Figure 2: The Rhine Valley, Germany

15
New York Sate Canal System: Modern Freight-way – Draft Final Report April 2010 For: NYSERDA, NYSDOT and the New York Sate Canal System Corporation By: Goodban Belt LLC
Mississippi barges specialize in agricultural and bulk commodities. In New York, we advocate container-on-barge logistics to become part of a robust multi-modal system. Europe uses container barges and inter-modal inland ports very successfully. We thought the reason might be fuel price but this turned out to be a minor factor. Next, we anticipated large subsidies. This too was false. Although European governments invest in waterways, they are responding to market demand. The real force behind the high and rising popularity of container-on-barge logistics is congestion. Congestion afflicts New York and the Port of NY/NJ but this is simply not a problem for cities on the Mississippi system. As an example, consider that the State of Tennessee has 1/10th the population density of New Jersey and Missouri is even more sparse. Land use patterns are important. Many of the benefits of waterborne transportation appear in the “externalities” – the hidden costs of freight that are borne by environment and society. Externalities are felt more acutely in crowded places. We will also discuss the motivation that seaports feel to embrace container barges. Congestion at the port gate and on surrounding roads spurs them. Container barges have the potential to perform an important role in New York’s multi-modal logistics mix. For sure, trucks will perform last-mile deliveries and in cases where speed is paramount, they may provide the fastest service. Railroads are important too. They are regaining market share – especially where they can aggregate demand for long-haul unit trains. Europe and China employ all three of these modes in concert and redundantly. Industries and the economy benefit when there is diversity in the freight transportation system. The availability of choice lowers costs and risk, making each mode stronger in the presence of the others. Energy – Barges Are 300% More Efficient Than Trucks A barge will move more freight farther, using less fuel than a truck or a train. Common sense recognizes that it takes less energy to push freight that floats but what about the energy used to get the freight to the river port? And how do winding rivers compare? What impact do currents have when barges navigate upstream? Would these factors eliminate the waterborne advantage?
16
New York Sate Canal System: Modern Freight-way – Draft Final Report April 2010 For: NYSERDA, NYSDOT and the New York Sate Canal System Corporation By: Goodban Belt LLC
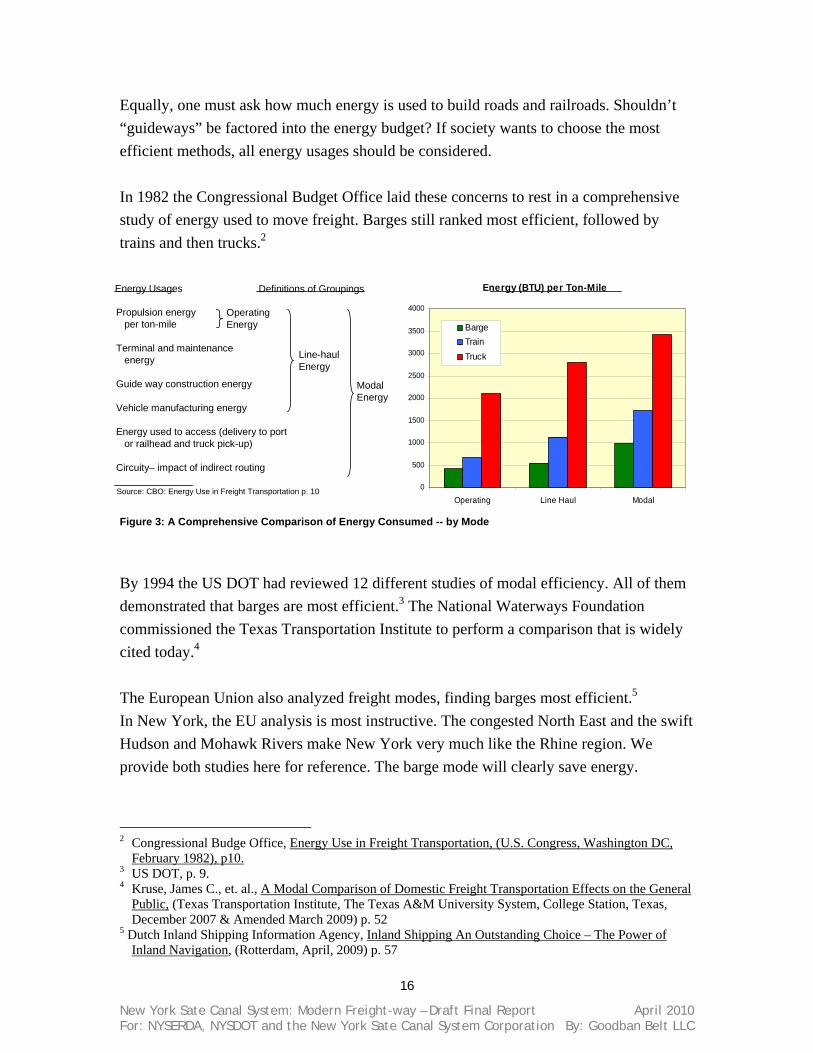
Equally, one must ask how much energy is used to build roads and railroads. Shouldn’t “guideways” be factored into the energy budget? If society wants to choose the most efficient methods, all energy usages should be considered. In 1982 the Congressional Budget Office laid these concerns to rest in a comprehensive study of energy used to move freight. Barges still ranked most efficient, followed by trains and then trucks.2
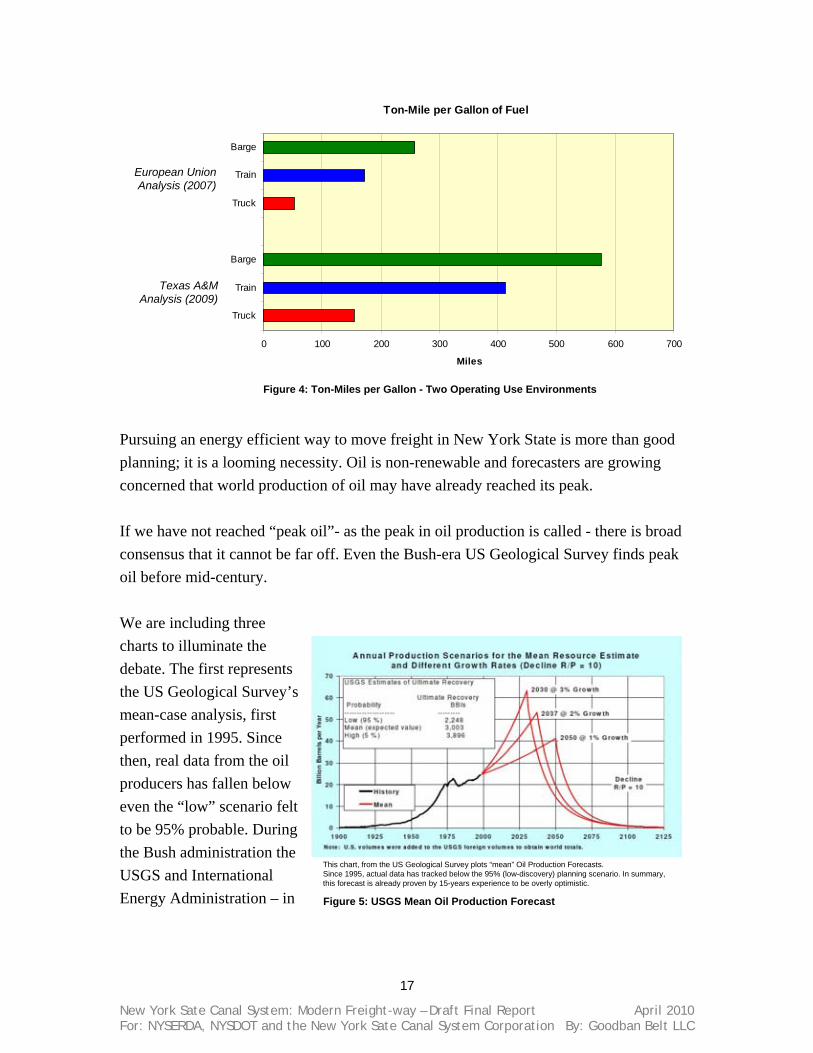
By 1994 the US DOT had reviewed 12 different studies of modal efficiency. All of them demonstrated that barges are most efficient.3 The National Waterways Foundation commissioned the Texas Transportation Institute to perform a comparison that is widely cited today.4 The European Union also analyzed freight modes, finding barges most efficient.5 In New York, the EU analysis is most instructive. The congested North East and the swift Hudson and Mohawk Rivers make New York very much like the Rhine region. We provide both studies here for reference. The barge mode will clearly save energy.
2 Congressional Budge Office, Energy Use in Freight Transportation, (U.S. Congress, Washington DC,
February 1982), p10. 3 US DOT, p. 9. 4 Kruse, James C., et. al., A Modal Comparison of Domestic Freight Transportation Effects on the General
Public, (Texas Transportation Institute, The Texas A&M University System, College Station, Texas, December 2007 & Amended March 2009) p. 52
5 Dutch Inland Shipping Information Agency, Inland Shipping An Outstanding Choice – The Power of Inland Navigation, (Rotterdam, April, 2009) p. 57
Energy (BTU) per Ton-Mile
0
500
1000
1500
2000
2500
3000
3500
4000
Operating Line Haul Modal
BargeTrainTruck
Energy Usages Definitions of Groupings
Propulsion energyper ton-mile
Terminal and maintenanceenergy
Guide way construction energy
Vehicle manufacturing energy
Energy used to access (delivery to portor railhead and truck pick-up)
Circuity– impact of indirect routing
OperatingEnergy
Line-haulEnergy
ModalEnergy
Source: CBO: Energy Use in Freight Transportation p. 10
Figure 3: A Comprehensive Comparison of Energy Consumed -- by Mode
17
New York Sate Canal System: Modern Freight-way – Draft Final Report April 2010 For: NYSERDA, NYSDOT and the New York Sate Canal System Corporation By: Goodban Belt LLC
Pursuing an energy efficient way to move freight in New York State is more than good planning; it is a looming necessity. Oil is non-renewable and forecasters are growing concerned that world production of oil may have already reached its peak. If we have not reached “peak oil”- as the peak in oil production is called - there is broad consensus that it cannot be far off. Even the Bush-era US Geological Survey finds peak oil before mid-century. We are including three charts to illuminate the debate. The first represents the US Geological Survey’s mean-case analysis, first performed in 1995. Since then, real data from the oil producers has fallen below even the “low” scenario felt to be 95% probable. During the Bush administration the USGS and International Energy Administration – in
Figure 4: Ton-Miles per Gallon - Two Operating Use Environments
Ton-Mile per Gallon of Fuel
0 100 200 300 400 500 600 700
Truck
Train
Barge
Truck
Train
Barge
Miles
European Union Analysis (2007)
Texas A&M Analysis (2009)
This chart, from the US Geological Survey plots “mean” Oil Production Forecasts.Since 1995, actual data has tracked below the 95% (low-discovery) planning scenario. In summary, this forecast is already proven by 15-years experience to be overly optimistic.
Figure 5: USGS Mean Oil Production Forecast

18
New York Sate Canal System: Modern Freight-way – Draft Final Report April 2010 For: NYSERDA, NYSDOT and the New York Sate Canal System Corporation By: Goodban Belt LLC
their “World Energy Outlook (WEO) – did not even chart the low-production scenario, neither did they adjust forecasts in-tune with results as they became available.6 Other analysts developed forecasts that conformed better to emerging real-world results. We provide the forecast of Energy Watch, located in Germany:7
Finally, it is instructive to look at the remarkable trend in oil prices since 1998. The World Energy Outlook has been consistently and dramatically wrong, failing to predict every rising trend and repeatedly predicting price plateaus that never materialized.8 Irrespective of when “peak oil” happens, the price of oil is high and likely to remain high. We will show that waterborne freight could compete with trucking right now. Higher motor fuel prices will make the water mode even more attractive.
6 Schindler, Jörg, Zittelp, Werner., Crude Oil – The Supply Outlook - Revised Edition February 2008,
Energy Watch Group, (Berlin, Germany, 2008) p. 82 7 Ibid., p. 12 8 Ibid. p. 86
Figure 6: Energy Watch Oil Production Forecast
Figure 7: Crude Oil Prices - Actual and Forecasts
19
New York Sate Canal System: Modern Freight-way – Draft Final Report April 2010 For: NYSERDA, NYSDOT and the New York Sate Canal System Corporation By: Goodban Belt LLC
Long term, New York businesses will be more competitive if they have a lower-cost, less energy-consuming logistics choice. It would be good policy to plan less energy-cost-sensitive choices because ultimately, we want to preserve the ability of our economy to function even if motor fuel becomes scarce or less affordable.
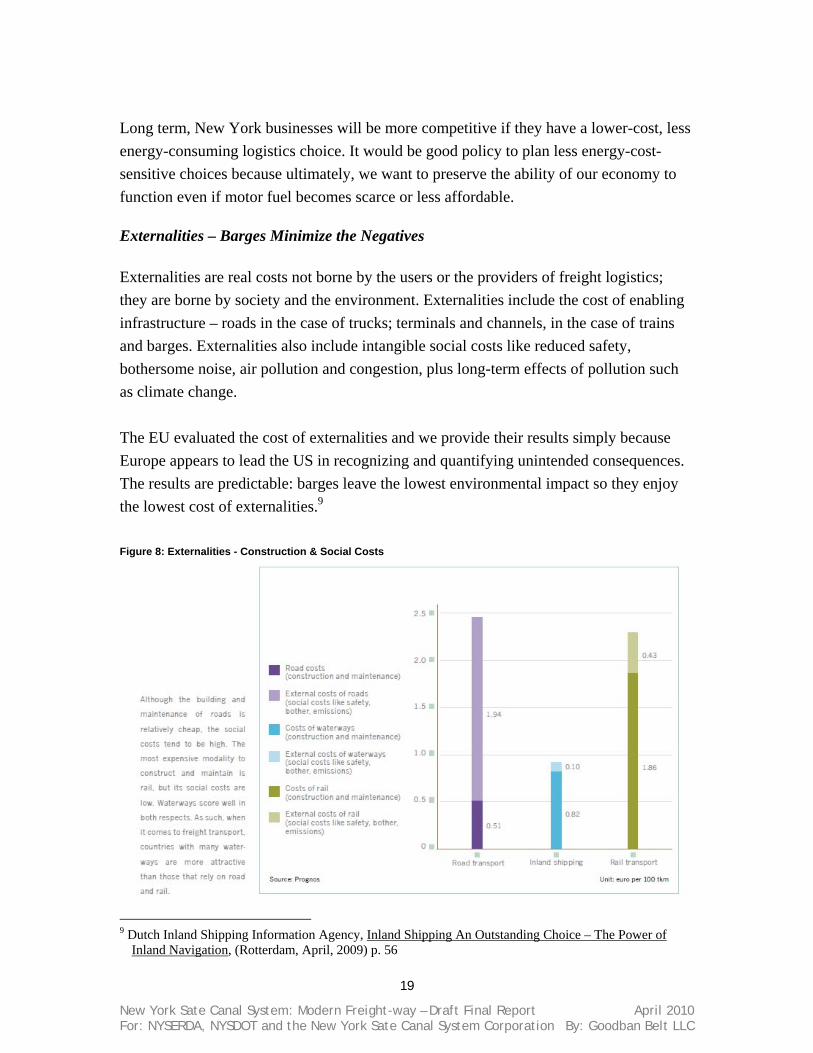
Externalities – Barges Minimize the Negatives Externalities are real costs not borne by the users or the providers of freight logistics; they are borne by society and the environment. Externalities include the cost of enabling infrastructure – roads in the case of trucks; terminals and channels, in the case of trains and barges. Externalities also include intangible social costs like reduced safety, bothersome noise, air pollution and congestion, plus long-term effects of pollution such as climate change. The EU evaluated the cost of externalities and we provide their results simply because Europe appears to lead the US in recognizing and quantifying unintended consequences. The results are predictable: barges leave the lowest environmental impact so they enjoy the lowest cost of externalities.9
9 Dutch Inland Shipping Information Agency, Inland Shipping An Outstanding Choice – The Power of
Inland Navigation, (Rotterdam, April, 2009) p. 56
Figure 8: Externalities - Construction & Social Costs

20
New York Sate Canal System: Modern Freight-way – Draft Final Report April 2010 For: NYSERDA, NYSDOT and the New York Sate Canal System Corporation By: Goodban Belt LLC
Although roads are comparatively cheap to build, the use of roads is very expensive in terms of social costs. European governments are striving to capture social costs and allocate them fairly. One method for doing this is by providing subsidies, incentives and public investment to enable choices that impose lower social costs. Inland waterways are the beneficiaries of these efforts. The EU has many initiatives underway that are aimed at increasing the amount of freight moved on water.
Europe is like New York. We have urban density around the seaport and Upstate land use patterns similar to the Rhine regions.10 Using the data in figure 8 we’ll calculate uncompensated social and environmental costs of moving a 26.5 ton (common export load) container from New York to Buffalo, as if we were Europeans:
1. By Truck: 24 metric tons x 718km x 0.0201 Euros/Ton-km $ 470 2. By Train: … x 0.0113 Euros/Ton-km $ 264 3. By Barge: … x 0.0027 Euros/Ton-km $ 63
Truck transport is 7½ times more expensive, in terms of externalities. Since externalities are paid-for by nature and people who may not benefit from freight logistics, we can conclude that barges are not only cleaner, they are more fair. 10 Ibid. p. 56
Figure 9: Externalities – A Break-down of Environmental and Social Costs

21
New York Sate Canal System: Modern Freight-way – Draft Final Report April 2010 For: NYSERDA, NYSDOT and the New York Sate Canal System Corporation By: Goodban Belt LLC
Public Awareness of Externalities – Strong and Growing New York is currently experiencing the problem of negative externalities due to short-cut trucking through Central New York. Drivers seek local roads in order to avoid tolls or extra miles on the Interstates. Since Central New York is home to historic agricultural communities that rely upon tourism to support local economies, large trucks appearing on village roads is more than bothersome; it impacts livelihoods.11 Today, the New York State Canal System provides more value as a recreational asset and heritage tourism attraction than as a freight canal. If we advocate scheduled freight traffic, how will we reassure the public? The comparative benefits to energy, economy and environment may be abstract notions for those many New Yorkers who literally see the Canal in their back yard. We recommend the use of data, visualization, and a demonstration project to help citizens arrive at the same conclusion that many Europeans have reached: working canals are sustainable canals, and canals are good for quality of life.
Noise & Visual Impact: According to the US DOT, “transportation activity is, by far, the major source of noise, with road traffic the chief offender, even more so than aircraft noise.” The DOT also admits that “…little data exists on noise levels of barge operations, mainly because they are not considered a problem.”12
11 Transportation Report – Final Environmental Assessment, Reducing Large Truck Traffic in Local
Communities in New York State, (NYSDOT, Albany, October 2008) 12 US DOT, p. 17 &20.
Figure 10: A Hard-Working Canal in Belgium
22
New York Sate Canal System: Modern Freight-way – Draft Final Report April 2010 For: NYSERDA, NYSDOT and the New York Sate Canal System Corporation By: Goodban Belt LLC
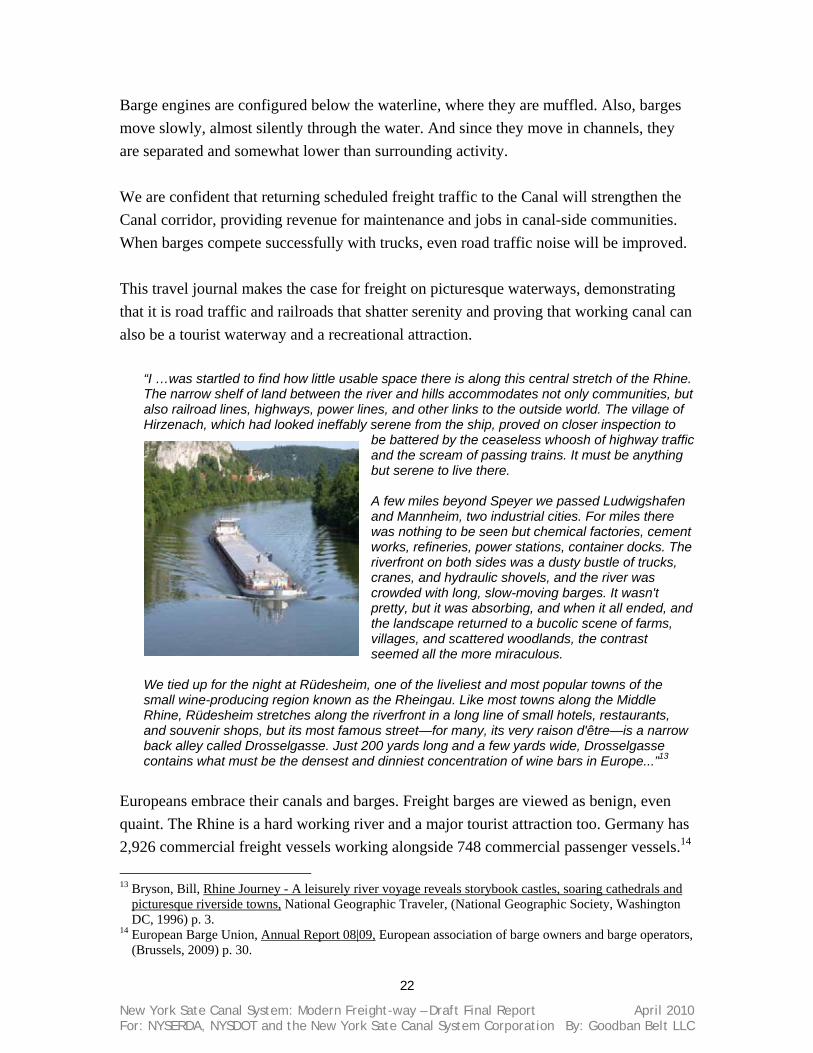
Barge engines are configured below the waterline, where they are muffled. Also, barges move slowly, almost silently through the water. And since they move in channels, they are separated and somewhat lower than surrounding activity. We are confident that returning scheduled freight traffic to the Canal will strengthen the Canal corridor, providing revenue for maintenance and jobs in canal-side communities. When barges compete successfully with trucks, even road traffic noise will be improved. This travel journal makes the case for freight on picturesque waterways, demonstrating that it is road traffic and railroads that shatter serenity and proving that working canal can also be a tourist waterway and a recreational attraction.
“I …was startled to find how little usable space there is along this central stretch of the Rhine. The narrow shelf of land between the river and hills accommodates not only communities, but also railroad lines, highways, power lines, and other links to the outside world. The village of Hirzenach, which had looked ineffably serene from the ship, proved on closer inspection to
be battered by the ceaseless whoosh of highway traffic and the scream of passing trains. It must be anything but serene to live there. A few miles beyond Speyer we passed Ludwigshafen and Mannheim, two industrial cities. For miles there was nothing to be seen but chemical factories, cement works, refineries, power stations, container docks. The riverfront on both sides was a dusty bustle of trucks, cranes, and hydraulic shovels, and the river was crowded with long, slow-moving barges. It wasn't pretty, but it was absorbing, and when it all ended, and the landscape returned to a bucolic scene of farms, villages, and scattered woodlands, the contrast seemed all the more miraculous.
We tied up for the night at Rüdesheim, one of the liveliest and most popular towns of the small wine-producing region known as the Rheingau. Like most towns along the Middle Rhine, Rüdesheim stretches along the riverfront in a long line of small hotels, restaurants, and souvenir shops, but its most famous street—for many, its very raison d'être—is a narrow back alley called Drosselgasse. Just 200 yards long and a few yards wide, Drosselgasse contains what must be the densest and dinniest concentration of wine bars in Europe...”13
Europeans embrace their canals and barges. Freight barges are viewed as benign, even quaint. The Rhine is a hard working river and a major tourist attraction too. Germany has 2,926 commercial freight vessels working alongside 748 commercial passenger vessels.14 13 Bryson, Bill, Rhine Journey - A leisurely river voyage reveals storybook castles, soaring cathedrals and
picturesque riverside towns, National Geographic Traveler, (National Geographic Society, Washington DC, 1996) p. 3.
14 European Barge Union, Annual Report 08|09, European association of barge owners and barge operators, (Brussels, 2009) p. 30.
23
New York Sate Canal System: Modern Freight-way – Draft Final Report April 2010 For: NYSERDA, NYSDOT and the New York Sate Canal System Corporation By: Goodban Belt LLC
Residents in the Canal Corridor must be brought into the discussion about using the Canal as a modern freight corridor. They will have concerns. But we can demonstrate, with data, studies and stories that a working Canal will still be a quiet, clean and pleasant Canal. In fact, by restoring the Canal to its proper place among critical economic infrastructure, we may look forward to Canal corridor improvements.
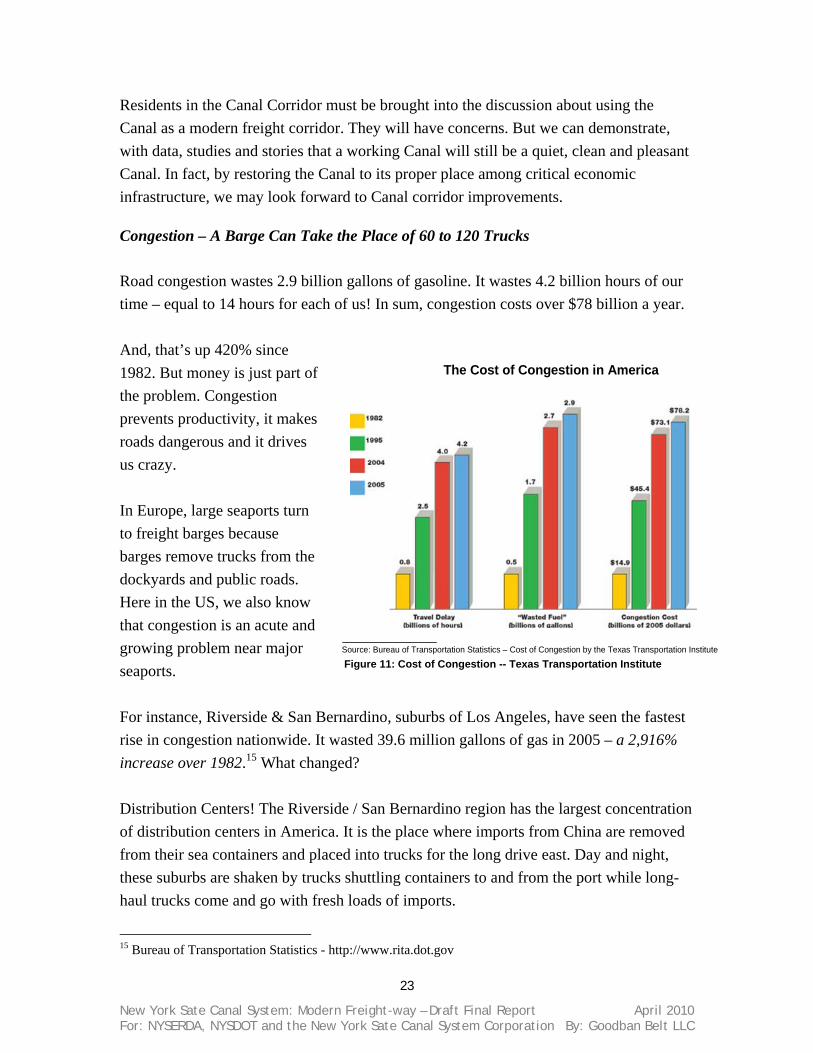
Congestion – A Barge Can Take the Place of 60 to 120 Trucks Road congestion wastes 2.9 billion gallons of gasoline. It wastes 4.2 billion hours of our time – equal to 14 hours for each of us! In sum, congestion costs over $78 billion a year. And, that’s up 420% since 1982. But money is just part of the problem. Congestion prevents productivity, it makes roads dangerous and it drives us crazy. In Europe, large seaports turn to freight barges because barges remove trucks from the dockyards and public roads. Here in the US, we also know that congestion is an acute and growing problem near major seaports. For instance, Riverside & San Bernardino, suburbs of Los Angeles, have seen the fastest rise in congestion nationwide. It wasted 39.6 million gallons of gas in 2005 – a 2,916% increase over 1982.15 What changed? Distribution Centers! The Riverside / San Bernardino region has the largest concentration of distribution centers in America. It is the place where imports from China are removed from their sea containers and placed into trucks for the long drive east. Day and night, these suburbs are shaken by trucks shuttling containers to and from the port while long-haul trucks come and go with fresh loads of imports.
15 Bureau of Transportation Statistics - http://www.rita.dot.gov
The Cost of Congestion in America
Source: Bureau of Transportation Statistics – Cost of Congestion by the Texas Transportation Institute
Figure 11: Cost of Congestion -- Texas Transportation Institute

24
New York Sate Canal System: Modern Freight-way – Draft Final Report April 2010 For: NYSERDA, NYSDOT and the New York Sate Canal System Corporation By: Goodban Belt LLC
We know that congestion is a big problem for the Port of New York and New Jersey, too. On average, truck drivers wait 45 minutes just to enter the port. Once inside, they need another two hours to get their load and go.16 Europe is different. The port of Antwerp, in Belgium, supports 65,000 barge sailings per year and barges take 30% of the port’s inland cargo. Between 1995 and 2001, barge use rose 7% while truck use declined 11%. At the port of Rotterdam, in the Netherlands, there are over 130,000 barge sailings per year. Barges handle 40% of the inland cargo and their share is rising. Between 1995 and 2001 inland navigation rose 10% while truck usage declined an equivalent 10%.17 Adding container barges to the New York State Canal System will relieve road congestion all along the Canal because each barge would have the capacity of 60 to 120 trucks. The benefit will be greatest near the Port of NY/NJ where barge service would relieve congestion at the port gate, on the port itself and on the adjoining expressways.
Air Quality – Nearly 400% Cleaner Than Trucks: The Army Corps of Engineers and the EPA found, in separate studies, that commercial marine navigation has a relatively minor effect on air quality. A study by Canadian National Railways showed that barges produce 33% less pollution than diesel trains and 373% less pollution than trucks.18 But the public is sure to ask: will barges pollute my town? The US Army Corps of Engineers analyzed the sources of pollution in St. Louis, a major hub of barge activity. The results were reassuring for anyone who lives along a working waterway:
16 Starcrest Consulting Group, LLC., The Port Authority of New York and New Jersey, Drayage Truck
Characterization Survey, December 31, 2008 p. 12 17 Inland Navigation Europe, Water is the Way to Go, Brussels, 2008 18 US DOT, pp 17 - 19
Emissions per Ton-Mile
0
2
4
6
8
10
12
Hydrocarbon Carbon Monoxide Nitrous Oxide
Pol
luta
nts
in P
ound
s BargeTrainTruck
Source: US EPA in US DOT Environmental Advantages of Inland Barge Transportation p. 19
Figure 12: Exhaust Emissions: Trucks, Trains, Barges

25
New York Sate Canal System: Modern Freight-way – Draft Final Report April 2010 For: NYSERDA, NYSDOT and the New York Sate Canal System Corporation By: Goodban Belt LLC
Even if adding freight to the New York State Canal System adds vehicles to the corridor rather than substituting a few barges for many trucks, we may point to these results and show that barges contribute very little to the total load of atmospheric pollutants.19
Safety – The Lowest Accident Rate of Any Freight Mode Water transport is the safest mode of surface transportation, exhibiting the fewest number of incidents, fatalities and injuries. It is also a gentle mode, absent the shocks and vibrations common with wheeled travel. According to US Coast Guard statistics, water vessels have fewer accidental spills and collisions than any other transportation mode.20 The New York State Canal System is a major recreational attraction and it links some of the most valuable and highly valued recreation areas in the United States. The New York State Canal Corporation recognizes that recreation and heritage tourism represents the most important function and the greatest community value provided by the Canal, today. And, the Canal is beloved by New Yorkers. Heralded in song, studied in elementary schools, visited on family vacations, it is irreplaceable and cherished. It is safe to conclude that if it was threatened, every New Yorker would rise to defend their Canal.
19 Ibid. p 18. Referencing: US Army Corps of Engineers, Institute for Water Resources, Water Resources
Support Center, National Waterways Study: Analysis of Environmental Aspects of Waterway Navigation, Review Draft, Fort Belvoir, VA, April 1980, p. 227.
20 Ibid. p. 13, 14.
Figure 13: Comparative Air Pollution Sources - St. Louis
% Due to Barges
0.76%
0.32%
0.05%
0.04%
0.06%

26
New York Sate Canal System: Modern Freight-way – Draft Final Report April 2010 For: NYSERDA, NYSDOT and the New York Sate Canal System Corporation By: Goodban Belt LLC
Its popularity only grows. In recent years, the New York State Canal Corporation has spearheaded efforts to improve water access and citizens have responded with enthusiasm.21 The Canalway Trail has become a pedal-pusher’s-paradise, providing mile upon mile of safe and scenic riding, running and walking. The Canal itself invites boaters of all vessel class. They appear in their million-dollar yachts, pontoons, houseboats, runabouts, canoes, kayaks, rubber rafts and anything that floats. Some transit the Canal; some sit and fish. Some travel alone while others join raucous regattas. All of this Canalway enjoyment is welcome and it is growing. Now we propose to add scheduled and frequent freight barges to this recreational waterway. Are we mad?
No madder than a Dutchman. Europeans love their canals and they flock to them, too. Each year the European Canals attract the uninitiated tourists, as well. House boat rentals are booming and it is not uncommon to find a retired tourist living aboard and completely at home amidst the bustle of recreational and freight traffic. To illuminate this symbiotic relationship between public and commercial waterway usage, consider these numbers: There are 13,575 vessels in the commercial industrial West-European Inland Fleet and 4,125 commercial non-industrial vessels – mostly
21 Mantello, Carmella R. and The New York Sate Canal Corporation Interagency Task Force, A Report on
the Future of the New York Sate Canals, (Albany, NY December 21, 2005)
Figure 14: The New York Sate Canal System from the New York Sate Canal Corporation Website

27
New York Sate Canal System: Modern Freight-way – Draft Final Report April 2010 For: NYSERDA, NYSDOT and the New York Sate Canal System Corporation By: Goodban Belt LLC
passenger liners and tour boats.22 But there are over 1 million private recreational vessels in use on the Northern European Canals! And where these canals course their way through the most densely populated lands of Europe, the weekend kayakers, canoeists and paddleboat peddlers take to the water en-mass. Recreation in the canals is growing 5% per year but still, freight and cruising schedules run on-time and the Canals remain the safest transportation infrastructure in Europe.23 In the Netherlands, over 150 cities and villages have an inland port and water cargo has proven so safe that barges are used for more hazardous shipments than any other mode, save pipelines. Barges carry 5-times more hazardous material than trucks and 20-times more than trains. Still, waterborne freight is by far the safest mode and the Dutch continue to use their canals for recreation, tourism and their nation’s defining image.24 The US Coast Guard concurs and our barge industry is also working to educate pleasure boaters to safely coexist with commercial vessels. In practice, pleasure boat operators respect barges and steer clear. It also helps that commercial vessels operate in defined channels at low speeds and on canals; there are few crossing junctures, as is the case with roadways. Compared to highways, where trucks are intermixed with traffic, and railroads, where a large number of massive units travel at great speed, canals are safe places. Even with congestion, pleasure boat and commercial operators maintain respectful distance. 25
22 European Barge Union, Annual Report 08|09, European association of barge owners and barge operators,
(Brussels, 2009) p. 30. 23 Classification of Recreational Waterways - Mapping of current situation and projects for recreational
waterways in Europe, (Stichting Recreatietoervaart Nederland - Dutch Recreational Waterways Foundation - Driebergen-Rijsenburg, Netherlands, September 2007) p. 5.
24 Dutch Inland Shipping Information Agency, p. 36. 25 US DOT, p. 12.
Figure 15: Amsterdam Canal – Work Hard; Play Hard
28
New York Sate Canal System: Modern Freight-way – Draft Final Report April 2010 For: NYSERDA, NYSDOT and the New York Sate Canal System Corporation By: Goodban Belt LLC
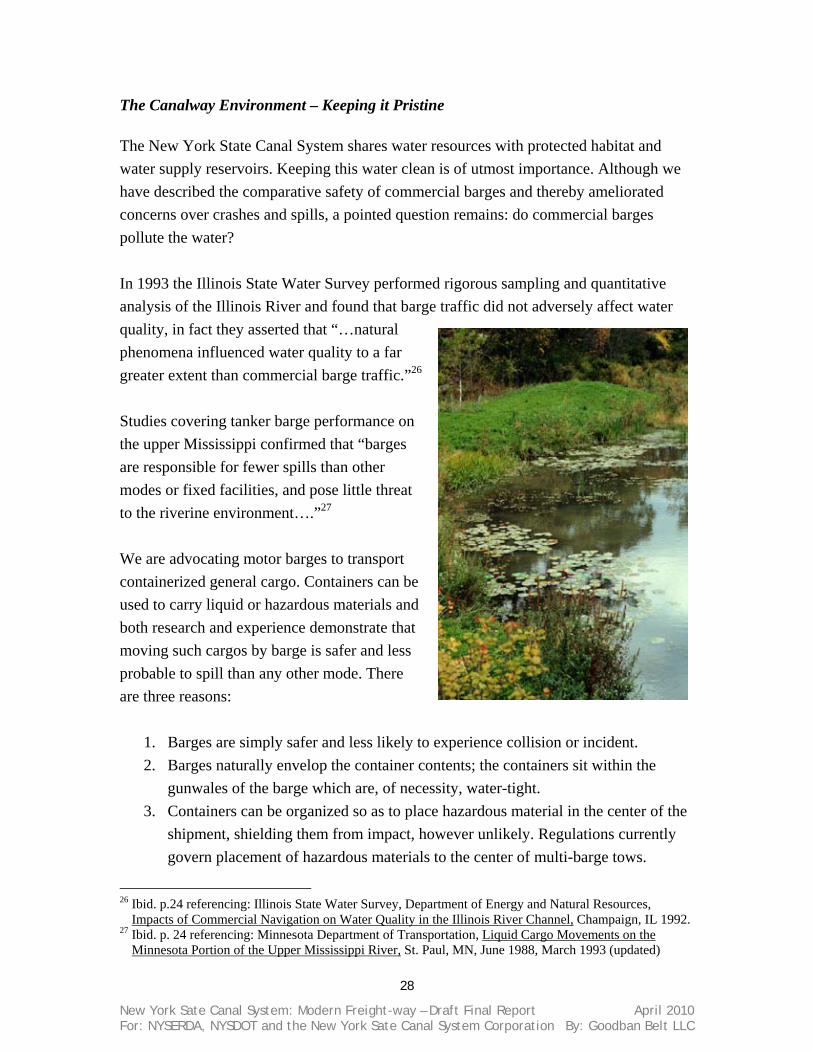
The Canalway Environment – Keeping it Pristine The New York State Canal System shares water resources with protected habitat and water supply reservoirs. Keeping this water clean is of utmost importance. Although we have described the comparative safety of commercial barges and thereby ameliorated concerns over crashes and spills, a pointed question remains: do commercial barges pollute the water? In 1993 the Illinois State Water Survey performed rigorous sampling and quantitative analysis of the Illinois River and found that barge traffic did not adversely affect water quality, in fact they asserted that “…natural phenomena influenced water quality to a far greater extent than commercial barge traffic.”26 Studies covering tanker barge performance on the upper Mississippi confirmed that “barges are responsible for fewer spills than other modes or fixed facilities, and pose little threat to the riverine environment….”27 We are advocating motor barges to transport containerized general cargo. Containers can be used to carry liquid or hazardous materials and both research and experience demonstrate that moving such cargos by barge is safer and less probable to spill than any other mode. There are three reasons:
1. Barges are simply safer and less likely to experience collision or incident. 2. Barges naturally envelop the container contents; the containers sit within the
gunwales of the barge which are, of necessity, water-tight. 3. Containers can be organized so as to place hazardous material in the center of the
shipment, shielding them from impact, however unlikely. Regulations currently govern placement of hazardous materials to the center of multi-barge tows.
26 Ibid. p.24 referencing: Illinois State Water Survey, Department of Energy and Natural Resources,
Impacts of Commercial Navigation on Water Quality in the Illinois River Channel, Champaign, IL 1992. 27 Ibid. p. 24 referencing: Minnesota Department of Transportation, Liquid Cargo Movements on the
Minnesota Portion of the Upper Mississippi River, St. Paul, MN, June 1988, March 1993 (updated)

29
New York Sate Canal System: Modern Freight-way – Draft Final Report April 2010 For: NYSERDA, NYSDOT and the New York Sate Canal System Corporation By: Goodban Belt LLC
There are many National Wildlife Refuges along working rivers and waterways. For instance, the Mississippi River system is the major migratory bird flyway in North America and there are numerous protected habitats along its length, in proximity to the freight channels. Under current environmental protection law, projects to improve waterways must include provisions to preserve, enhance and create wetland and aquatic habitat. One example is a marshland created with dredgings on the Arkansas River. It has become the winter home for the endangered whooping crane.28 Inland waterway freight transportation is not just the most energy efficient, low-pollution mode of surface transportation, it is also found to be environmentally benign and compatible with recreational uses of waterways. As a result, communities with freight waterways find them to be, on balance, beneficial. Using the New York State Canal System for container barges will improve the competiveness of the Port of NY/NJ and the entire State. It will provide an additional logistics choice and lower the cost of transport for New York freight users. It will partially restore the location advantage that made New York the “Empire State”. We also believe that by restoring the Canal’s role in trade and industry, we will bring more funding for maintenance and the riverine environment. Asserting the symbiosis of freight canals and natural spaces is not mere wishful thinking. The Rhine Main Danube Canal in Germany compelled preservation of natural areas that would provide surface water retention in order to maintain navigable depths in the dry summer. In Panama, Chagres National Park performs this function. It includes 318,000 acres of protected rain forest astride the Canal. It is home to numerous rare species and it provides recreational uses as well.
28 Ibid. p. 24.
Figure 16: The Panama Canal in Chagres National Park
30
New York Sate Canal System: Modern Freight-way – Draft Final Report April 2010 For: NYSERDA, NYSDOT and the New York Sate Canal System Corporation By: Goodban Belt LLC
Security – Barges Provide Resilient Redundancy: Post September 11, 2001 our nation made a renewed commitment to homeland security. The most visible manifestations were airport security and the disaster recovery assets deployed after hurricane Katrina. Behind the scenes, policy makers and regulators established guidelines to protect Critical Infrastructure and Key Resources, including “building increased resiliency and redundancy into business processes and systems”.29 Protection and Risk Management strategies were developed under three headings:30
1. Deter Threats 2. Mitigate Vulnerabilities 3. Minimize Consequences
The logistics process represents critical economic infrastructure and a critical business process. Post 9-11 and post-Katrina, we tend to think of attacks and disasters that strike a specific link in a chain of economic activities. We must also think of threats to the economic viability of critical business processes. One way to increase process resiliency is to add choices, that is to say, provide different ways of accomplishing the critical task without using the same potentially vulnerable resources. Freight transport is a process that employs fixed facilities, like roads and waterways, as well as variable inputs like fuel and manpower. Adding waterborne transportation is an outstanding way to improve both resiliency and redundancy because the waterborne mode offers maximum diversity relative the land-side modes and it is, in itself, very resilient. Trucks are highly sensitive to fuel cost. We demonstrate that 40% of the cost of truck operations is attributed to fuel but with barges, roughly 20% of their operating cost is fuel. As a result, the barge mode will have a dampening effect on logistics costs during 29 National Infrastructure Protection Plan - Partnering to Enhance Protection and Resiliency, (Department of Homeland Security, Washington, DC 2009), p. 7. 30 Ibid. p. 24.

31
New York Sate Canal System: Modern Freight-way – Draft Final Report April 2010 For: NYSERDA, NYSDOT and the New York Sate Canal System Corporation By: Goodban Belt LLC
periods of fuel price volatility. This will enhance the economic security of New York’s industries, its consumers, and the Port of NY/NJ, itself. Barges also offer corridor diversity. While trucks and trains serving the Port of NY/NJ rely on land routes and sophisticated built infrastructure, barges can travel 150 miles up the Hudson River before approaching their first canal lock. Corridor diversity is a key motivator for the Ports of Rotterdam, Hamburg and Antwerp when they invest in container barge service to affiliated inland hub ports. At this writing the Seine Nord Canal from Paris to Antwerp is being enlarged in order to relieve road and rail congestion and provide corridor resiliency. In this age of terror and economic risk, the dominant trends suggest that a robust freight logistics system is one that does not rely too heavily on any single mode.

32
New York Sate Canal System: Modern Freight-way – Draft Final Report April 2010 For: NYSERDA, NYSDOT and the New York Sate Canal System Corporation By: Goodban Belt LLC
Modern Logistics: The Container Trade Logistics underwent a revolution after World War II. Containerization of general cargo –the act of packaging odd lots into standardized boxes – made it possible to automate the stevedoring process. The cost of moving general cargo fell dramatically, transforming both manufacturing and retailing with global supply lines and limitless market access. Port cities boomed while inland cities faced existential risk. In the past, shipping was uniformly expensive but today, being landlocked can raise the average cost of trade by half.31 For example, when shipping freight from China to Buffalo, the last 100 miles costs more than the first 1,000 because Chinese ports are served by giant container ships.32 The risk of being left out is extraordinary. The World Bank estimated that if Peru could improve its port operations to the standard achieved by Australia; that alone would increase its foreign trade by 25%.33 Governments took note, and compete to build or expand container ports. In Europe, Antwerp vies with Rotterdam, both ports investing billions on Napoleonic visions of hinterland conquest. India, learning from China, pours money into container ports. And worldwide, inland cities have entered the race – building intermodal facilities to avoid being passed-over. Memphis, Duisburg, Chongqing and Edmonton have become inland hubs – just to keep pace in the container-age. Container trade is high and rising and New York needs to keep up. Our inland cities need container ports for their own economic development and to preserve the dominant place of the Port of NY/NJ itself. The port that spawned the container revolution could be eclipsed by new competitors and new developments. But New York is lucky. The geography that made it the world’s greatest port also provides the potential to foster the most versatile intermodal network to the North American hinterland. 31 Levinson, The Box, p 270. 32 Candice Wilcox, Logistics Manager - Interview (Robinson Home Products, May 27, 2009) 33 Levinson, p 272.
Figure 17: Port of NY/NJ Photo by Keith Meyers, The New York Times, 2004

33
New York Sate Canal System: Modern Freight-way – Draft Final Report April 2010 For: NYSERDA, NYSDOT and the New York Sate Canal System Corporation By: Goodban Belt LLC
Containerization – Lowering Costs Through Automation New York’s gritty waterfront was rimmed by tenements filled with families on the edge. Longshoremen were tough and poor. The cargo they handled was heavy and dangerous and trade was expensive and slow. In his epic tale: “The Box”, Marc Levinson traces the origins of a simple idea and reveals how the shipping container became a singular invention that changed the history of trade. Before containerization, general cargo moved as “break-bulk”. Think of steamers as great moving vans stuffed with odd lots of cargo, every piece stowed by hand. Machinery on pallets, barrels, lumber and bags crowded together for a journey that promised damage on rough seas and pilferage at rough ports. In 1959, 60% to 70% of the cost of transport by sea was accounted for by activity in port.34 Loading loose cargo onto a break-bulk ship took weeks and cost $5.86 per ton in 1956. A container could be loaded aboard in just minutes and for just 16 cents-a-ton.35 Containerization began as a simple solution to congestion at warehouses on the piers. Trucks lined up for hours waiting to be unloaded and giving some of their drivers plenty of time to think of better methods. This, we are told, is how Malcom McLean – the truck operator who pioneered the container trade – came to the idea of simply lifting his entire trailer van aboard ship – all while waiting to unload at the port of Newark. The US Army was also a driver. During the Vietnam War, they too, endured problems of delay and pilferage on the docks in Saigon. Containers, called CONEX boxes solved the problem. They could be unloaded fast on the hastily-built piers of Cam Rahn Bay. Shipping lines observed these efficiencies and began adopting the “container” because suddenly they could automate one of the most labor intensive jobs in America. A single crane did the job of gangs of men. In 1965 there were fewer than 50 container ships world-wide. Ten years later there were more than 600.36 The impact on ports is revealed from the air. Manhattan, once bristling with finger piers and warehouses now uses its waterfront for recreation and marinas. Newark Bay is the working waterfront. Port Elizabeth, Port Newark and Howland Hook provide the vast
34 Levinson, pp 8 & 21. 35 Posten, Toby, Thinking Inside the Box (BBC WorldNews, London, April 25, 2006) 36 Levinson, p. 221.
34
New York Sate Canal System: Modern Freight-way – Draft Final Report April 2010 For: NYSERDA, NYSDOT and the New York Sate Canal System Corporation By: Goodban Belt LLC
berths and overspreading cranes that characterize a modern container port. Ships move under tight schedules, spending just hours at berth. Containers are stacked on adjoining acres, providing storage until trucks and trains move them inland. The cost of freight fell precipitously. In 1960 it cost $1,744 to ship a truckload of pharmaceuticals to France.37 In 2010 the cost to ship a 40-foot sea container from Shanghai to the USA was also $1,700 – but Shanghai is twice the distance and $1,744 1960-dollars are worth over $12,800 today!
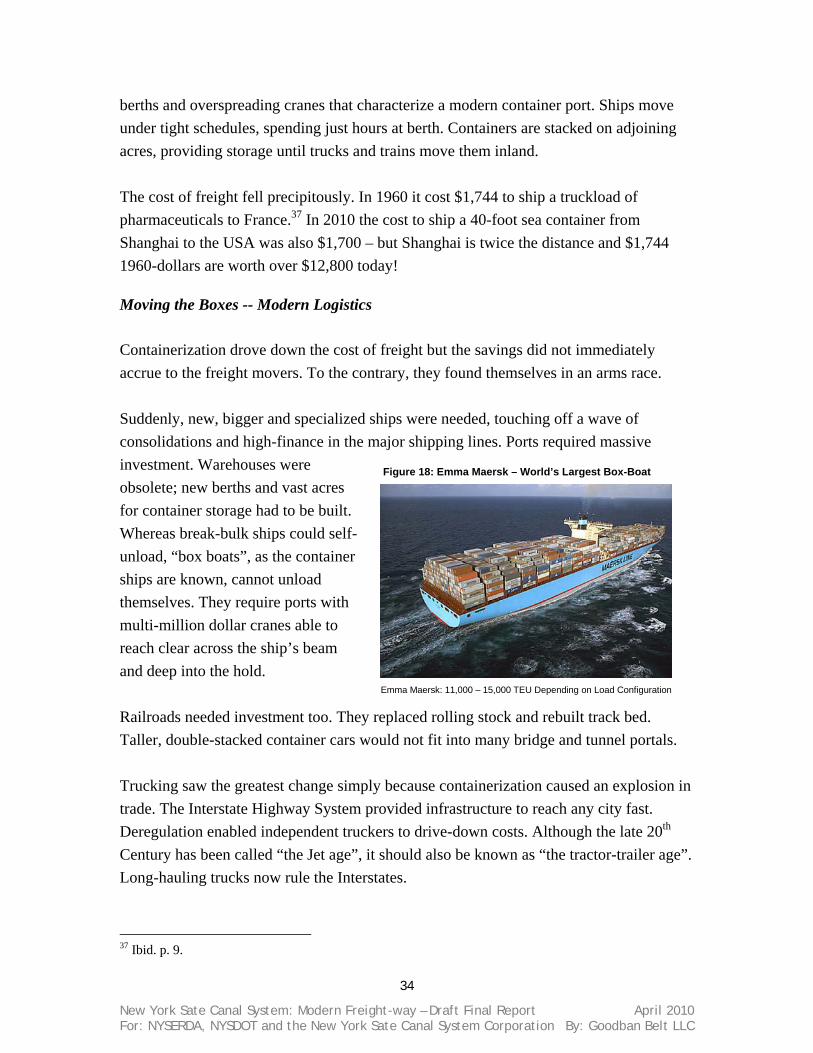
Moving the Boxes -- Modern Logistics Containerization drove down the cost of freight but the savings did not immediately accrue to the freight movers. To the contrary, they found themselves in an arms race. Suddenly, new, bigger and specialized ships were needed, touching off a wave of consolidations and high-finance in the major shipping lines. Ports required massive investment. Warehouses were obsolete; new berths and vast acres for container storage had to be built. Whereas break-bulk ships could self-unload, “box boats”, as the container ships are known, cannot unload themselves. They require ports with multi-million dollar cranes able to reach clear across the ship’s beam and deep into the hold. Railroads needed investment too. They replaced rolling stock and rebuilt track bed. Taller, double-stacked container cars would not fit into many bridge and tunnel portals. Trucking saw the greatest change simply because containerization caused an explosion in trade. The Interstate Highway System provided infrastructure to reach any city fast. Deregulation enabled independent truckers to drive-down costs. Although the late 20th Century has been called “the Jet age”, it should also be known as “the tractor-trailer age”. Long-hauling trucks now rule the Interstates.
37 Ibid. p. 9.
Figure 18: Emma Maersk – World’s Largest Box-Boat
Emma Maersk: 11,000 – 15,000 TEU Depending on Load Configuration

35
New York Sate Canal System: Modern Freight-way – Draft Final Report April 2010 For: NYSERDA, NYSDOT and the New York Sate Canal System Corporation By: Goodban Belt LLC
Figure 19: Fuel Consumption by Mode, in Gallons, Compared to 1965 An American may not associate the rise of trucking with containerization but Europeans do. Travelers to Europe will see a great number of trucks hauling sea containers – even far from the seaports, deep in the European heartland. It is much less common to see containers on trucks in the United States unless you are near a major container port. The reason for this is the distribution center. In the US, we use trucks to haul general cargo long distances. Since truck vans are longer and lighter than a 40-foot sea container, it is economical to un-stuff and re-pack their contents into 53-foot trailers prior to a cross-country run. This is called cross-docking. Major ports like Los Angeles and Newark have vast distribution centers within a few dozen miles of the port gate. Although Railroads are inherently more energy efficient than trucks, they were slow to adapt to containerization.38 Regulation, labor agreements and the sheer cost of the infrastructure needed to make the switch from boxcars to containers-on-cars took time. Like the shipping lines, railroads underwent a period of consolidation and recapitalization, largely because of demands placed on them by the logistics revolution. In 1970 there were 71 class 1 railroads in the USA. By 2000 there were just eight.39 The bigger, stronger railroads invested in “intermodal service”, pairing short-haul trucking with long-haul rail service. Unit trains are assembled at “on-dock” or “near-
38 Energy Use in Transportation, (The Congressional Budget Office, 1982) p ix - Summary 39 Bonacich, Edna and Jake B. Wilson, Getting the Goods – Ports, Labor and the Logistics Revolution,
(Cornell University Press, Ithaca, 2008) p. 100.
Big Trucks and Jet Planes Define our Age*
-1.0
-0.5
0.0
0.5
1.0
1.5
2.0
2.5
3.0
3.5
19651975
19851991
19931995
19971999
20012003
2005
- Fue
l Qua
ntity
-- R
elat
ive
Cha
nge
-
Jet Fuel
"Semi" Truck Deisel
Passenger Car, Truck,Motorcycle GasolineFreight Locomotive Deisel
Single-unit Truck Deisel
* Data is from the Bureau of Transportation Statistics - Table 4-5: Fuel Consumption by Mode of Transportation in Physical Units http://www.bts.gov/publications/national_transportation_statistics/html/table_04_05.html
36
New York Sate Canal System: Modern Freight-way – Draft Final Report April 2010 For: NYSERDA, NYSDOT and the New York Sate Canal System Corporation By: Goodban Belt LLC
dock” rail hubs, providing express service to inland multimodal hubs where local haulers carry the containers to final destinations. In the fourth quarter of 2009, intermodal rail achieved its highest market share to-date, equal to 13.3% of long haul – 550 miles or more – containerized freight.40
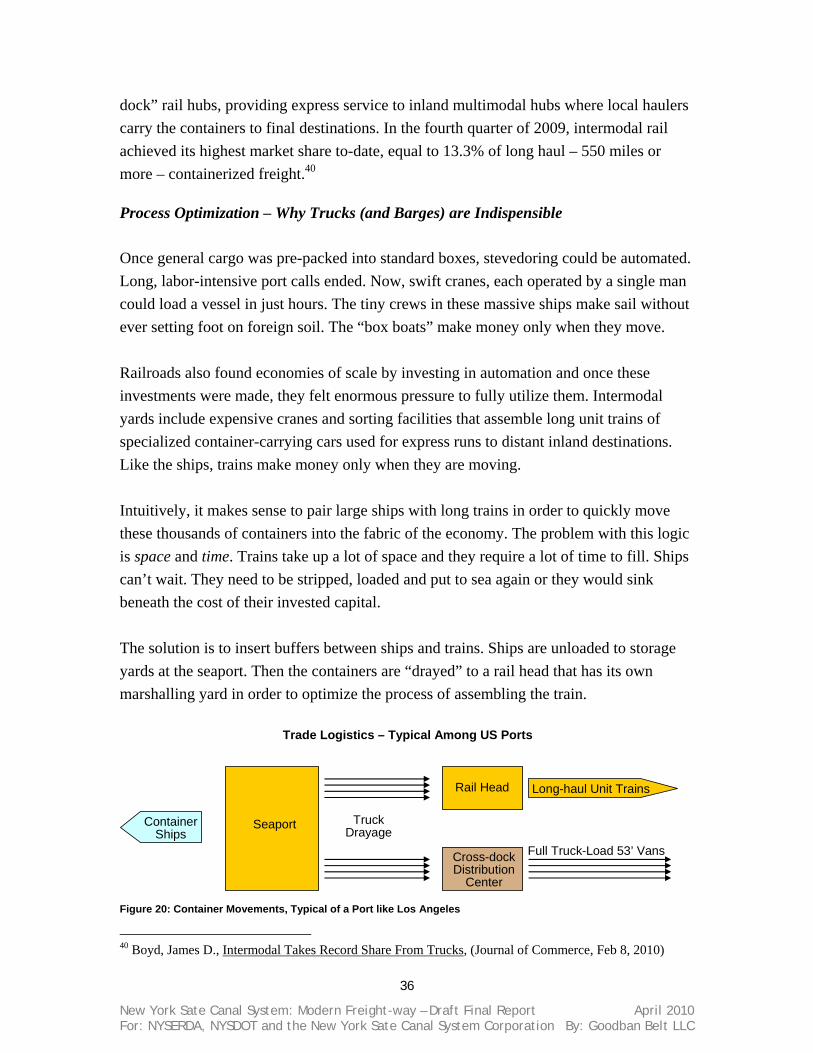
Process Optimization – Why Trucks (and Barges) are Indispensible Once general cargo was pre-packed into standard boxes, stevedoring could be automated. Long, labor-intensive port calls ended. Now, swift cranes, each operated by a single man could load a vessel in just hours. The tiny crews in these massive ships make sail without ever setting foot on foreign soil. The “box boats” make money only when they move. Railroads also found economies of scale by investing in automation and once these investments were made, they felt enormous pressure to fully utilize them. Intermodal yards include expensive cranes and sorting facilities that assemble long unit trains of specialized container-carrying cars used for express runs to distant inland destinations. Like the ships, trains make money only when they are moving. Intuitively, it makes sense to pair large ships with long trains in order to quickly move these thousands of containers into the fabric of the economy. The problem with this logic is space and time. Trains take up a lot of space and they require a lot of time to fill. Ships can’t wait. They need to be stripped, loaded and put to sea again or they would sink beneath the cost of their invested capital. The solution is to insert buffers between ships and trains. Ships are unloaded to storage yards at the seaport. Then the containers are “drayed” to a rail head that has its own marshalling yard in order to optimize the process of assembling the train.
40 Boyd, James D., Intermodal Takes Record Share From Trucks, (Journal of Commerce, Feb 8, 2010)
Container Ships
Seaport Truck Drayage
Rail Head Long-haul Unit Trains
Cross-dock Distribution
Center
Full Truck-Load 53’ Vans
Trade Logistics – Typical Among US Ports
Figure 20: Container Movements, Typical of a Port like Los Angeles

37
New York Sate Canal System: Modern Freight-way – Draft Final Report April 2010 For: NYSERDA, NYSDOT and the New York Sate Canal System Corporation By: Goodban Belt LLC
In US ports, the best way to move containers from dockside to railhead or distribution center is to use a truck drayage service. Trucking is flexible and it can be scheduled “on-demand”. Unlike a ship or train, drayage trucks can be profitable at very low utilization rates – all the way down to a single container on a single truck.41 In Europe and in China drayage is often performed by barge. Working from the marine berth, barges are able to accept cargo right alongside the giant box boats, relieving congestion at the port gate. The Port of NY/NJ could benefit from European and Chinese role-models.
New York needs to adopt strategies that will preserve and enhance its standing in global trade. It is important for our great seaport and for the strength of our State-wide economy. To be effective, we must plan in-tune-with the business models of ship, seaport and railway operators as well as freight users. Trucking firms and barge operators are the most entrepreneurial and adaptable players in container logistics but they can be thwarted by congestion. By taking advantage of the inland waterborne freight mode, New York could add capacity to its great port without confronting the land-use and infrastructure constraints that naturally arise in the world’s greatest metropolis.
41 Patrick S. McCarthy, Transportation Economics Theory and Practice: A Case Study Approach
(Blackwell Publishers, Malden Massachusetts, 2001) p. 184.
Container Ships
Seaport
Truck Drayage
Rail Head
Inland Hub Port
Container Barges
Truck Drayage
Long-haul Unit Trains
Trade Logistics – Typical of Europe & China
Figure 21: Container Movements, Typical of Rotterdam

38
New York Sate Canal System: Modern Freight-way – Draft Final Report April 2010 For: NYSERDA, NYSDOT and the New York Sate Canal System Corporation By: Goodban Belt LLC
Strategic Necessity – New York’s Status as the Premier Port New York was America’s first container port but in the 1980s it was eclipsed by the Port of Los Angeles / Long Beach where growth was powered by Pacific Rim trade. Now a growth spurt could be coming to the Port of NY/NJ. Trade patterns, trade lanes and vessels are undergoing change that will bear on New York. We examine these forces and recommend steps to ensure preeminence among East Coast ports.
Ports and Trade Lanes – A System of Threats and Opportunities The Port of Los Angeles / Long Beach (POLA/POLB) is the largest container port in the Americas, handling 15.7 million twenty-foot-equivalent-units – called TEUs, in 2007. This flood of cargo is driven by China trade and it represents 40% of our nation’s imports. Much of the cargo is bound for the Eastern US where more than half the US population still lives. In 2002 the Port locked-out workers after failing to reach a labor agreement. Ten days later President Bush invoked the Taft-Hartly Act for the first time ever against an employer. The ports were simply too important to the nation’s economy to be left idle. By the Port Management Association’s calculation, the lockout cost the economy over $2 billion per day in lost trade.42 After the POLA/POLB lockout, major shippers and their customers sought to diversify their choices. Seattle and Oakland were ready to take-up the slack but they too had difficult labor histories and congested urban locations. Shippers wanted a place to unload fast and then transship to mid-continent multi-modal distribution centers. Mexico and British Columbia came into focus. 42 Bonacich, p. 194, 195 & 245.
Port of Los Angeles – San Pedro Bay (source: Port of LA)
Figure 22: Port of Los Angeles – San Pedro Bay
39
New York Sate Canal System: Modern Freight-way – Draft Final Report April 2010 For: NYSERDA, NYSDOT and the New York Sate Canal System Corporation By: Goodban Belt LLC
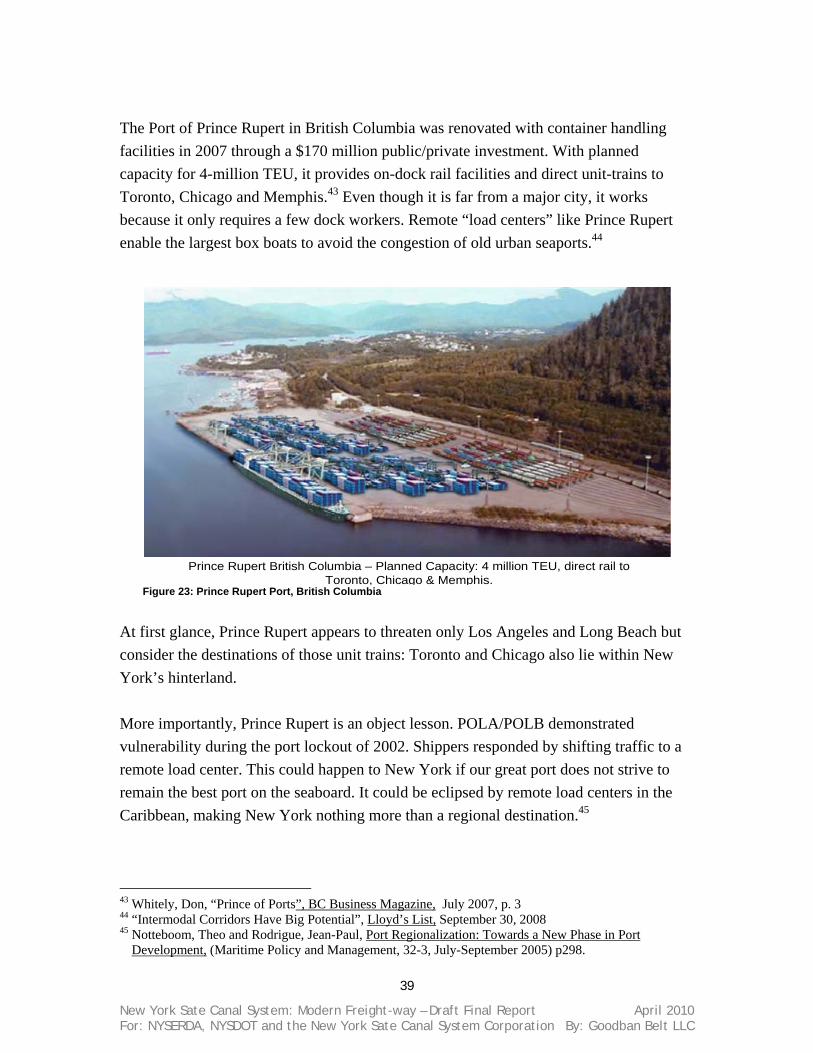
The Port of Prince Rupert in British Columbia was renovated with container handling facilities in 2007 through a $170 million public/private investment. With planned capacity for 4-million TEU, it provides on-dock rail facilities and direct unit-trains to Toronto, Chicago and Memphis.43 Even though it is far from a major city, it works because it only requires a few dock workers. Remote “load centers” like Prince Rupert enable the largest box boats to avoid the congestion of old urban seaports.44
At first glance, Prince Rupert appears to threaten only Los Angeles and Long Beach but consider the destinations of those unit trains: Toronto and Chicago also lie within New York’s hinterland. More importantly, Prince Rupert is an object lesson. POLA/POLB demonstrated vulnerability during the port lockout of 2002. Shippers responded by shifting traffic to a remote load center. This could happen to New York if our great port does not strive to remain the best port on the seaboard. It could be eclipsed by remote load centers in the Caribbean, making New York nothing more than a regional destination.45
43 Whitely, Don, “Prince of Ports”, BC Business Magazine, July 2007, p. 3 44 “Intermodal Corridors Have Big Potential”, Lloyd’s List, September 30, 2008 45 Notteboom, Theo and Rodrigue, Jean-Paul, Port Regionalization: Towards a New Phase in Port
Development, (Maritime Policy and Management, 32-3, July-September 2005) p298.
Prince Rupert British Columbia – Planned Capacity: 4 million TEU, direct rail to Toronto, Chicago & Memphis.
Figure 23: Prince Rupert Port, British Columbia

40
New York Sate Canal System: Modern Freight-way – Draft Final Report April 2010 For: NYSERDA, NYSDOT and the New York Sate Canal System Corporation By: Goodban Belt LLC
Panama Canal Widening & the Post Panamax Wave Not all Pacific trade flows through west coast ports. In 2006 38% went directly to East Coast ports via the Panama Canal.46 And now, Panama is expanding the Canal because the current set of locks is nearing capacity and the largest box boats do not fit through. These are the “Post-Panamax” ships – capable of carrying 8,000 TEU and more.
After expansion in 2015 the Panama Canal will attract more China trade directly to the East Coast. It’s because the super ships make it so cheap to move containers. One alternative to Canal widening was to simply use the Panama Canal Railway, parallel to the Canal itself:
• Cost – per container to transit the Canal: $ 49 • Cost – per container to transit by rail: $ 335
46 Panama Canal Authority, Proposal for the Expansion of the Panama Canal – Third Set of Locks Project,
April 24, 2006. p. 19
Figure 24: "Post-Panamax" vessels carry 2-to-3 times more containers direct to East Coast ports – source: The Panama Canal Authority

41
New York Sate Canal System: Modern Freight-way – Draft Final Report April 2010 For: NYSERDA, NYSDOT and the New York Sate Canal System Corporation By: Goodban Belt LLC
The multi-modal rail crossing is much more expensive due to handling costs, including unloading the ship – at least $80 on each side, and loading and unloading the train plus its short journey -- $175. Add to that a considerable delay. Moving containers from a 12,000 TEU Post-Panamax ship by rail would necessitate up to 60 train trips.47 The Panama Canal Authority is mindful of competition from new, remote load centers like Prince Rupert, that have direct rail connections to Chicago and points east. They point out, however, that larger vessels change the economics of sea freight, lowering the cost of the Asia – East Coast service by 16% or more, depending on how big the vessel.48 These savings, the Authority believes, will compel freight users to route more cargo directly to the East Coast on ships, rather than employing cross-continent multimodal services. On balance, the Panama Canal Authority projects 5.6% annual compounded growth in container volume transiting the Canal. That could very likely translate into a larger growth rate at the Port of NY/NJ. Here is why:
Post-Panamax – The Necessity of Larger Ports
“The jumbo vessels -- many longer than three football fields -- carry everything from strawberries and tea to iPods and motorcycles, for thousands of customers at once. The economies of scale can be great if shippers can fill their holds.”49 -- John W. Miller, The Wallstreet Journal
This passage sums-up how containerization fostered an arms race among ship owners and why they are so intent on pursuing it. By 2013 there will be over 200 Post-Panamax container ships in world service.50 In 2015 they will be able to transit the new third lane of the Panama Canal. But on the East Coast, there are really only three ports able to berth the largest Post-Panamax vessels.∗ They are Norfolk, New York and Halifax.
47 Ibid. p. 24 48 Ibid. p. 31 49 Miller, John W., “The Mega Containers Invade - As Freight Rates Plunge, Gargantuan Carriers Hope to
Muscle Aside Smaller Rivals”, The Wallstreet Journal, Dow Jones, Inc., NY, January 26, 2009 50 Panama Canal Authority, p. 29 ∗ Although Savannah, Charleston and the Florida ports are installing Post-Panamax cranes, they do not
have sufficient channel depth to accommodate these ships at full draft.
Figure 25: Economics of Larger Ships - Panama Canal Authority

42
New York Sate Canal System: Modern Freight-way – Draft Final Report April 2010 For: NYSERDA, NYSDOT and the New York Sate Canal System Corporation By: Goodban Belt LLC
New York should worry about Norfolk. Although all three ports have hinterland initiatives and Halifax is aggressive, promoting both short sea shipping up the St. Lawrence as well as express rail to Toronto, Norfolk is the most dangerous competitor. Norfolk is undertaking more and deeper harbor dredging, they are buying more and larger “super-post-Panamax” cranes and they are experimenting with better inland distribution systems. For instance, they have augmented their excellent rail connections with a container-on-barge service up the James River to Richmond. Norfolk is also undertaking the Craney Island Marine Terminal Expansion which will double container capacity and bring expanded use of on-terminal rail-intermodal service.51 Norfolk has potential to displace New York/New Jersey as the top container port on the East Coast but there are other threats. In the Bahamas, Hutchinson Ports operates the Freeport container port as a transshipment hub. They added Post-Panamax cranes and plan additional improvements to expand throughput from 1.7 to 2.2 million TEU. If Freeport becomes “the Singapore” of the Atlantic, it could draw the largest ships away from New York. Smaller vessels could then make direct deliveries to regional ports along the seaboard, potentially shrinking New York’s hinterland to the metro area itself.52
Trade Patterns and Freight Corridors China’s spectacular growth propelled America’s west coast ports to prominence. Los Angeles/Long Beach became our continent’s most important container port. By 2007, seven of the world’s 20 largest container ports were in China itself, and five more of these mega-ports lie in neighboring Asian nations.
51 Love, Jodie, Craney Island Eastward Expansion and Marine Terminal, Craney Island Study Commission,
Virginia Port Authority, January 28, 2010. 52 Notteboom, p. 299.
Freeport, Bahamas, Singapore of the Atlantic?Figure 26: Freeport, Bahamas -- Singapore of the Atlantic?

43
New York Sate Canal System: Modern Freight-way – Draft Final Report April 2010 For: NYSERDA, NYSDOT and the New York Sate Canal System Corporation By: Goodban Belt LLC
Despite this Pacific preponderance, trade patterns show signs of becoming more evenly distributed. Post Panamax ships will bring China trade directly to East Coast ports and emerging economies from India to Africa and South America all find the shortest route to American markets on our Eastern Seaboard.
For example, trade with sub-Saharan Africa grew 28% in 2008, including large jumps in American exports. Exports to South Africa rose by 17.6%, to Nigeria by 47.7%, and to Angola by 65.4%.53 India, with the world’s largest middle class is rapidly building seaport infrastructure and trade is rising fast. Since 2000, US exports to India have grown 350% while imports grew 98%54 As India and Africa develop and purchase US manufactured goods, many of those exports will pass through the Port of New York/New Jersey. Better connections to New York’s manufacturing hinterland will strengthen our State’s economy.
Based on new developments in both the pattern of trade and the ships that carry global cargo, we assert that the Port of NY/NJ will experience pressure to grow. Barges have the power to add capacity on the marine-side, without necessitating additional real estate or land-side infrastructure.
We also observe that the world’s two largest exporters, China and Germany, have excellent inland waterborne connections between hinterland manufacturers and seaports. Adding container-on-barge service at the Port of NY/NJ may become a competitive necessity. It would also provide New York’s export manufacturers the most competitive logistics choices, enabling them to better access growing markets in emerging economies.
53 Charles W. Corey, “U.S.- Africa Trade Increased 28 Percent in 2008”, US State Department
America.gov, (http://www.america.gov/africa), July 14, 2009 54 US Census Bureau, Foreign Trade Statistics, 2000, 2009
China’s Share of World Trade: from 2% to 20% in just 40 years
Source: Kai Guo & Papa N’Diaye, “Is China’s Export-Oriented Growth Sustainable?”, IMF working Paper, International Monetary Fund, August 2009Figure 27: China's Rising Share of World Trade
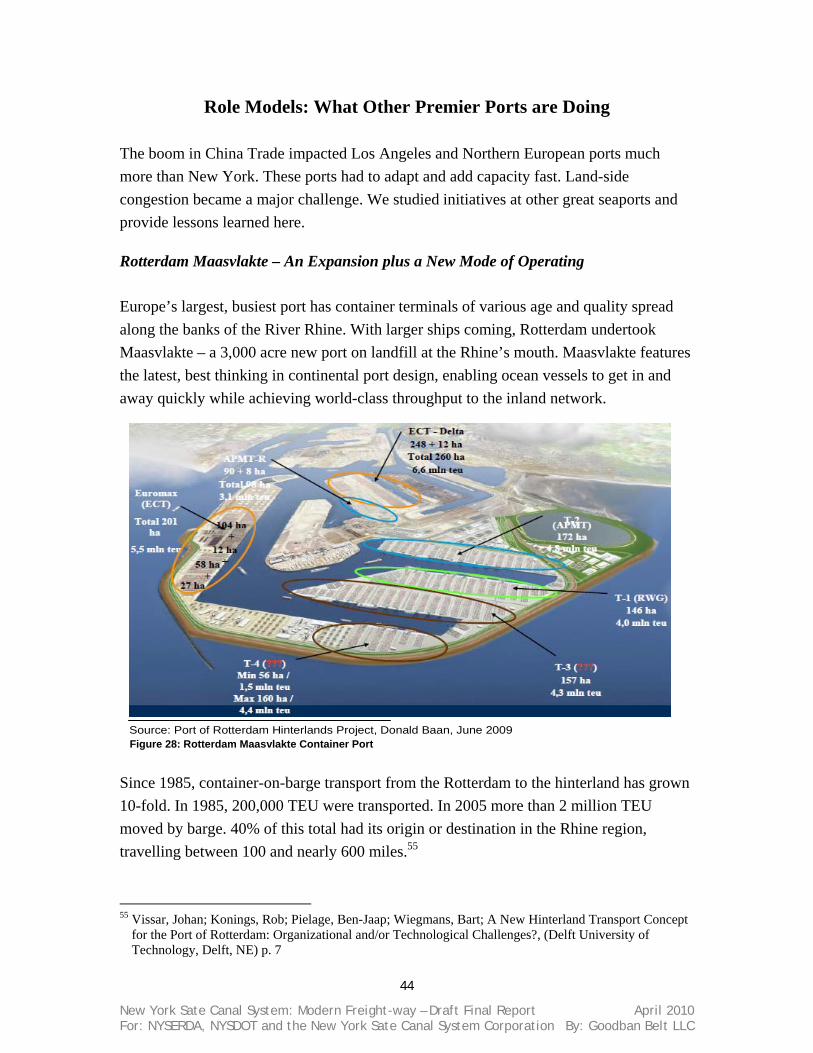
44
New York Sate Canal System: Modern Freight-way – Draft Final Report April 2010 For: NYSERDA, NYSDOT and the New York Sate Canal System Corporation By: Goodban Belt LLC
Role Models: What Other Premier Ports are Doing The boom in China Trade impacted Los Angeles and Northern European ports much more than New York. These ports had to adapt and add capacity fast. Land-side congestion became a major challenge. We studied initiatives at other great seaports and provide lessons learned here.
Rotterdam Maasvlakte – An Expansion plus a New Mode of Operating Europe’s largest, busiest port has container terminals of various age and quality spread along the banks of the River Rhine. With larger ships coming, Rotterdam undertook Maasvlakte – a 3,000 acre new port on landfill at the Rhine’s mouth. Maasvlakte features the latest, best thinking in continental port design, enabling ocean vessels to get in and away quickly while achieving world-class throughput to the inland network.
Since 1985, container-on-barge transport from the Rotterdam to the hinterland has grown 10-fold. In 1985, 200,000 TEU were transported. In 2005 more than 2 million TEU moved by barge. 40% of this total had its origin or destination in the Rhine region, travelling between 100 and nearly 600 miles.55
55 Vissar, Johan; Konings, Rob; Pielage, Ben-Jaap; Wiegmans, Bart; A New Hinterland Transport Concept
for the Port of Rotterdam: Organizational and/or Technological Challenges?, (Delft University of Technology, Delft, NE) p. 7
Source: Port of Rotterdam Hinterlands Project, Donald Baan, June 2009Figure 28: Rotterdam Maasvlakte Container Port

45
New York Sate Canal System: Modern Freight-way – Draft Final Report April 2010 For: NYSERDA, NYSDOT and the New York Sate Canal System Corporation By: Goodban Belt LLC
Today, while congestion is challenging Rotterdam’s ability to grow, the experienced and proven barge service provides solutions. Rotterdam has adopted a strategy called “Extended Gate” the purpose of which is to separate the transshipment function at the seaport, from the sorting and storing functions. Sorting, stuffing and warehousing as well as customs clearance can occur at inland multimodal ports, enabling better use of the valuable dockland real estate. Extended Gate will also yield better, faster customer service and yield port jobs in the hinterland, which is attractive to inland cities. Currently Rotterdam relies heavily on trucks to haul containers from the port but with Extended Gate, barge and rail modes will gain share. By 2035, the goal is to move 8.2 million TEU between port and hinterland by barge. Maasvlakte employs a high degree of automation, including automated guided vehicles and automated stacking cranes. Automated barge handling systems are also envisioned
where, using currently available technology, containers would be placed directly aboard barges rather than in storage yards. The barges would provide floating stock and when full, they would be pushed to an Extended Gate inland port for sorting and clearance.56 56 Ibid. p. 14.
Mode 2008 2035 Truck 57% 35% Train 13% 20% Barge 30% 45%
Figure 29: Rotterdam Modal Split 2035 Targets Source: Port of Rotterdam Hinterlands Project, Donald Baan June 2009
Motor barges delivering containers for export
Container ship at berth
Container shuttle beneath the legs of the cranes Direct – to – Barge
container movements
Rotterdam Maasvlakte in ActionFigure 30: Maasvlakte from the Air
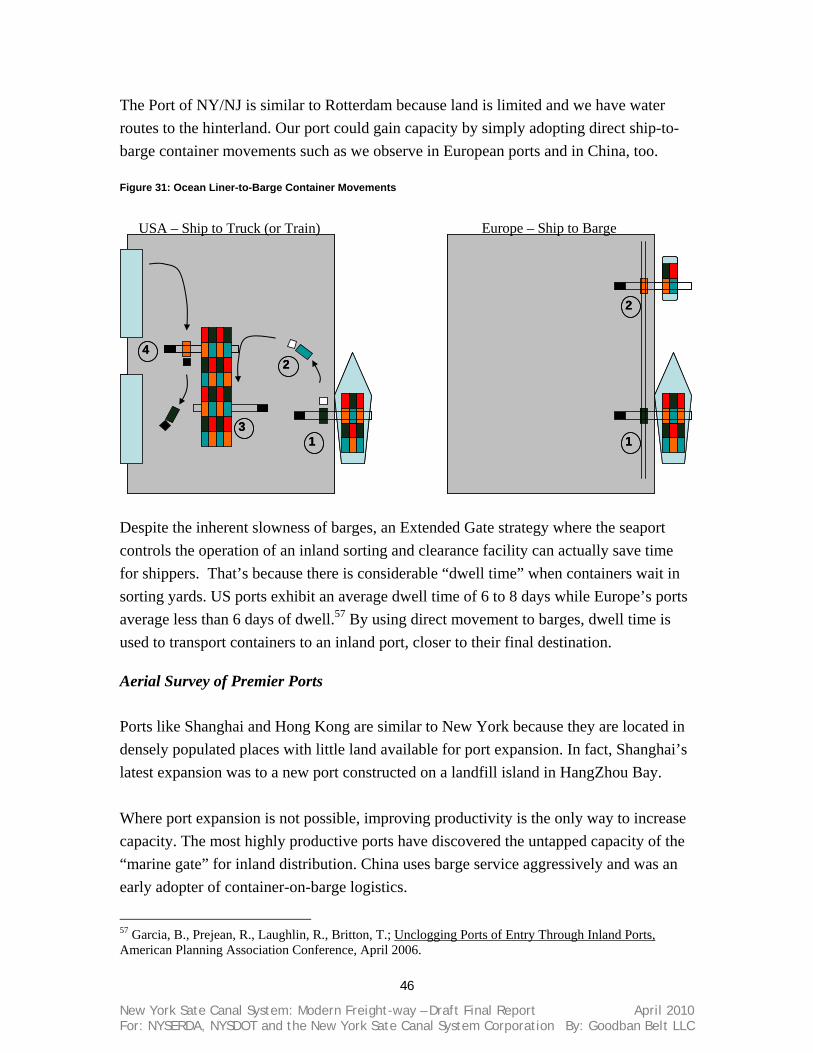
46
New York Sate Canal System: Modern Freight-way – Draft Final Report April 2010 For: NYSERDA, NYSDOT and the New York Sate Canal System Corporation By: Goodban Belt LLC
The Port of NY/NJ is similar to Rotterdam because land is limited and we have water routes to the hinterland. Our port could gain capacity by simply adopting direct ship-to-barge container movements such as we observe in European ports and in China, too.
Despite the inherent slowness of barges, an Extended Gate strategy where the seaport controls the operation of an inland sorting and clearance facility can actually save time for shippers. That’s because there is considerable “dwell time” when containers wait in sorting yards. US ports exhibit an average dwell time of 6 to 8 days while Europe’s ports average less than 6 days of dwell.57 By using direct movement to barges, dwell time is used to transport containers to an inland port, closer to their final destination.
Aerial Survey of Premier Ports Ports like Shanghai and Hong Kong are similar to New York because they are located in densely populated places with little land available for port expansion. In fact, Shanghai’s latest expansion was to a new port constructed on a landfill island in HangZhou Bay. Where port expansion is not possible, improving productivity is the only way to increase capacity. The most highly productive ports have discovered the untapped capacity of the “marine gate” for inland distribution. China uses barge service aggressively and was an early adopter of container-on-barge logistics.
57 Garcia, B., Prejean, R., Laughlin, R., Britton, T.; Unclogging Ports of Entry Through Inland Ports, American Planning Association Conference, April 2006.
1
2
3
4
11
22
33
44
1
2
11
22
USA – Ship to Truck (or Train) Europe – Ship to Barge
Figure 31: Ocean Liner-to-Barge Container Movements
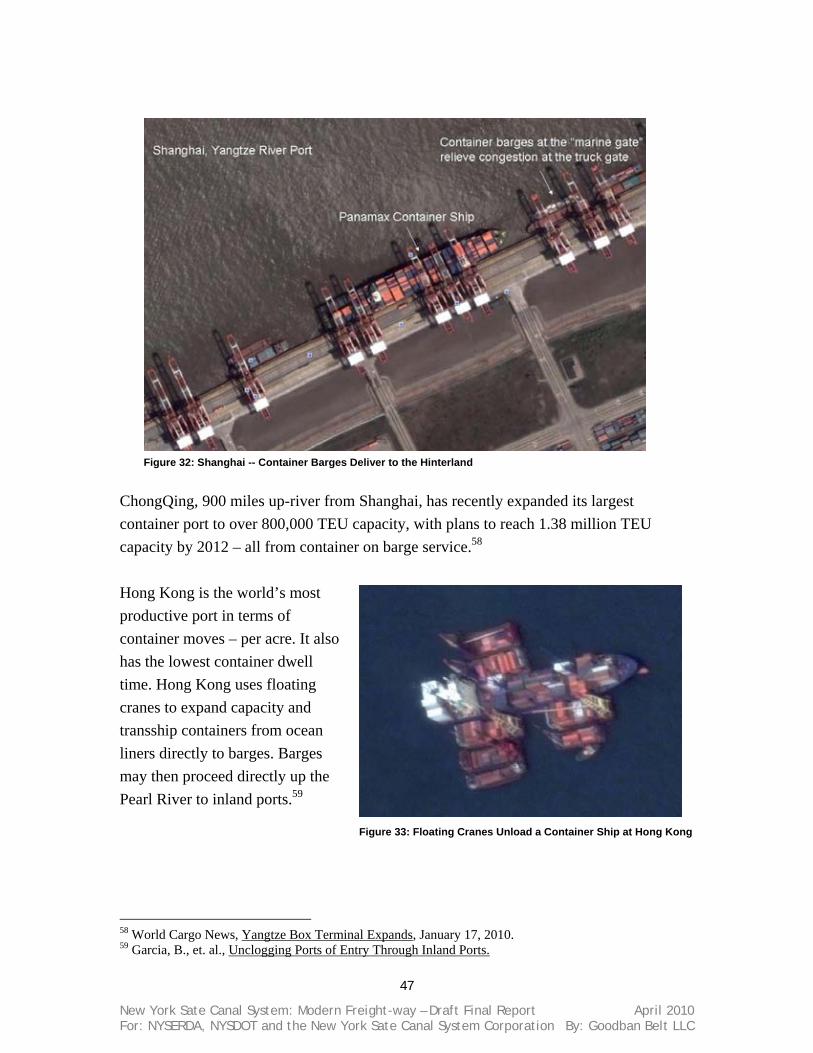
47
New York Sate Canal System: Modern Freight-way – Draft Final Report April 2010 For: NYSERDA, NYSDOT and the New York Sate Canal System Corporation By: Goodban Belt LLC
Figure 32: Shanghai -- Container Barges Deliver to the Hinterland
ChongQing, 900 miles up-river from Shanghai, has recently expanded its largest container port to over 800,000 TEU capacity, with plans to reach 1.38 million TEU capacity by 2012 – all from container on barge service.58 Hong Kong is the world’s most productive port in terms of container moves – per acre. It also has the lowest container dwell time. Hong Kong uses floating cranes to expand capacity and transship containers from ocean liners directly to barges. Barges may then proceed directly up the Pearl River to inland ports.59
58 World Cargo News, Yangtze Box Terminal Expands, January 17, 2010. 59 Garcia, B., et. al., Unclogging Ports of Entry Through Inland Ports.
Figure 33: Floating Cranes Unload a Container Ship at Hong Kong
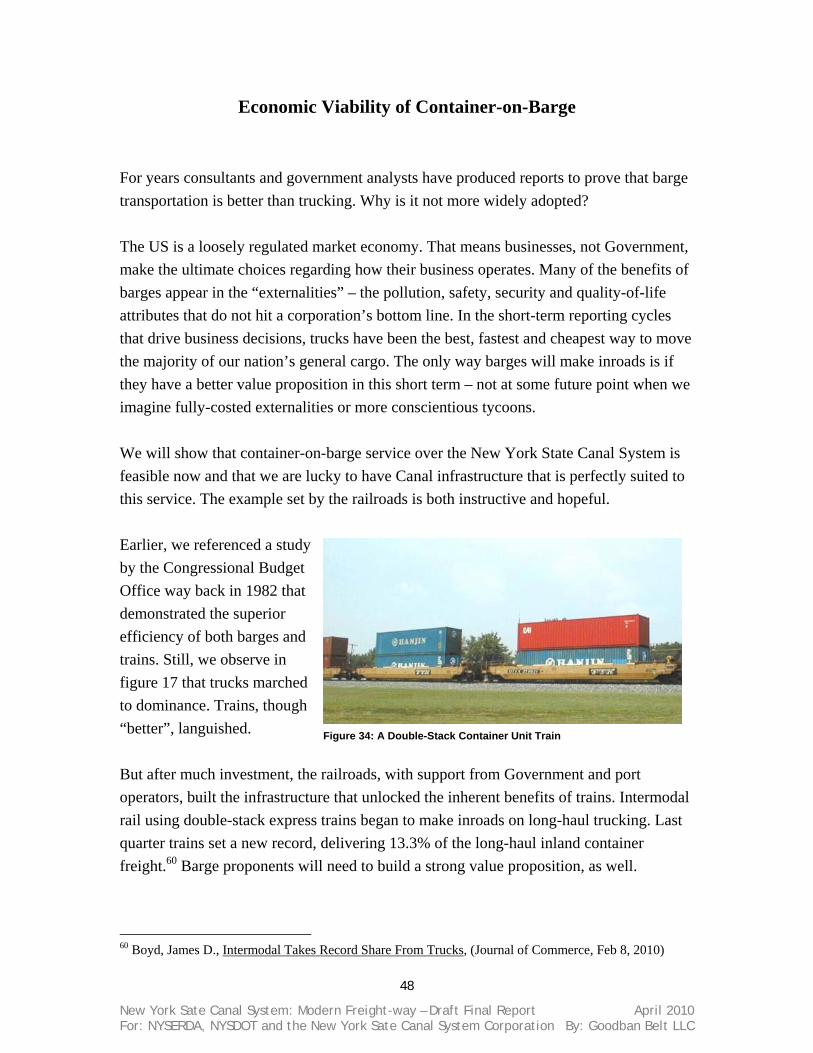
48
New York Sate Canal System: Modern Freight-way – Draft Final Report April 2010 For: NYSERDA, NYSDOT and the New York Sate Canal System Corporation By: Goodban Belt LLC
Economic Viability of Container-on-Barge
For years consultants and government analysts have produced reports to prove that barge transportation is better than trucking. Why is it not more widely adopted? The US is a loosely regulated market economy. That means businesses, not Government, make the ultimate choices regarding how their business operates. Many of the benefits of barges appear in the “externalities” – the pollution, safety, security and quality-of-life attributes that do not hit a corporation’s bottom line. In the short-term reporting cycles that drive business decisions, trucks have been the best, fastest and cheapest way to move the majority of our nation’s general cargo. The only way barges will make inroads is if they have a better value proposition in this short term – not at some future point when we imagine fully-costed externalities or more conscientious tycoons. We will show that container-on-barge service over the New York State Canal System is feasible now and that we are lucky to have Canal infrastructure that is perfectly suited to this service. The example set by the railroads is both instructive and hopeful. Earlier, we referenced a study by the Congressional Budget Office way back in 1982 that demonstrated the superior efficiency of both barges and trains. Still, we observe in figure 17 that trucks marched to dominance. Trains, though “better”, languished. But after much investment, the railroads, with support from Government and port operators, built the infrastructure that unlocked the inherent benefits of trains. Intermodal rail using double-stack express trains began to make inroads on long-haul trucking. Last quarter trains set a new record, delivering 13.3% of the long-haul inland container freight.60 Barge proponents will need to build a strong value proposition, as well.
60 Boyd, James D., Intermodal Takes Record Share From Trucks, (Journal of Commerce, Feb 8, 2010)
Figure 34: A Double-Stack Container Unit Train

49
New York Sate Canal System: Modern Freight-way – Draft Final Report April 2010 For: NYSERDA, NYSDOT and the New York Sate Canal System Corporation By: Goodban Belt LLC
“Better, Faster, Cheaper” -- The Three Reasons Why Freight Users Switch We interviewed freight users in Buffalo and asked them if they would use the New York State Canal System to ship containers to and from the Port of NY/NJ. They said they would if the service was reliable and the savings were 30% to 50% relative to their trucking cost. 30% to 50% is a big hurdle so we pressed. They said the savings were needed to compensate for undoubtedly slower service but they also admitted that they really do not need speed as much as they need reliability. If the barge service was regularly scheduled, if they could check status-of-shipment anytime, and if it had a proven track record, they would switch to barge service for a lower amount of savings.61 Here is how container-on-barge service should be marketed:
1. Better: Barge service will foster container-load deliveries which could disintermediate the distribution center, saving the time, money and hassle of cross-docking (unstuffing the container and loading a 53’ truck van).
2. Faster: It’s not going to be faster but it might not be as “slow” as some fear. That’s because barges can use the port at night – when the truck gates are closed. Deliveries to Albany will be nearly as fast as trucking. Deliveries Upstate will be slower but reliable. They’ll avoid congestion variability and by employing information technology, users can check status-of-delivery and plan around precise schedules.
3. Cheaper: Barges will run about 30% cheaper than trucks (without Government incentive) if fuel prices remain above $3 per gallon.
61 Extramile Transportation LLC – Interview July 23, 2009 and Robinson Home Products, Inc. – Interview
May 27, 2009.
Figure 34: Container Port of Basal Switzerland -- 100,000 TEU per annum, 600 miles, 885 feet above Rotterdam

50
New York Sate Canal System: Modern Freight-way – Draft Final Report April 2010 For: NYSERDA, NYSDOT and the New York Sate Canal System Corporation By: Goodban Belt LLC
Cost Structures – Expensive Fuel and Congestion is the Enemy of Trucking Barges are less sensitive to fuel costs than are trucks. We analyzed the costs to operate trucks and motor barges using data gleaned from online resources and through conversations with asset owners. Here is how they compare:
For truckers, fuel and driver-time are the major cost factors. When fuel prices spike, truckers lose money. When congestion is acute, truckers lose money twice: it wastes fuel at idle and it consumes driver time. Barges are most sensitive to “equipment cost” which is financed over many years. During periods of high interest rates barge operators would see costs rise. They might also see revenue decline. Interest rates impact inventory carrying costs. In the past when interest rates spiked, freight users switched to trucking to save time. This was a major driving force behind the turn to “Just-in-Time” logistics during the 1980’s. Adding barges to the logistics mix is not necessarily bad news for truckers. By relieving port congestion, barges make port calls more profitable for trucks. And, although barges would reduce overall truck-miles-travelled by aggregating containers for inland destinations, trucks would still provide last-mile delivery.
Figure 35: Relative Operating Costs - Truck & Barge
Comparative Cost Sensitivity
0.0% 10.0% 20.0% 30.0% 40.0% 50.0% 60.0%
Equipment Ownership
Vehicle & CargoInsurance
License/Permits & G&A
Fuel
Maint & Repair & Wash
Toll, Tax & Charges
DriverTruck
Barge
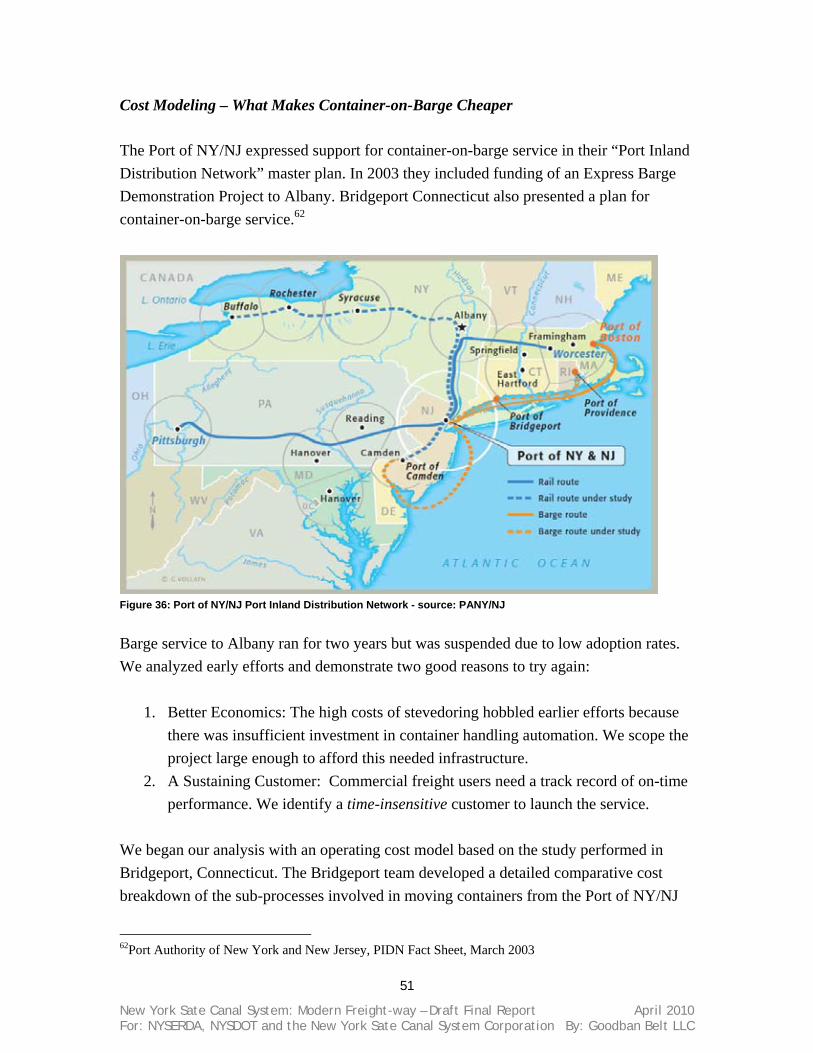
51
New York Sate Canal System: Modern Freight-way – Draft Final Report April 2010 For: NYSERDA, NYSDOT and the New York Sate Canal System Corporation By: Goodban Belt LLC
Cost Modeling – What Makes Container-on-Barge Cheaper The Port of NY/NJ expressed support for container-on-barge service in their “Port Inland Distribution Network” master plan. In 2003 they included funding of an Express Barge Demonstration Project to Albany. Bridgeport Connecticut also presented a plan for container-on-barge service.62
Figure 36: Port of NY/NJ Port Inland Distribution Network - source: PANY/NJ Barge service to Albany ran for two years but was suspended due to low adoption rates. We analyzed early efforts and demonstrate two good reasons to try again:
1. Better Economics: The high costs of stevedoring hobbled earlier efforts because there was insufficient investment in container handling automation. We scope the project large enough to afford this needed infrastructure.
2. A Sustaining Customer: Commercial freight users need a track record of on-time performance. We identify a time-insensitive customer to launch the service.
We began our analysis with an operating cost model based on the study performed in Bridgeport, Connecticut. The Bridgeport team developed a detailed comparative cost breakdown of the sub-processes involved in moving containers from the Port of NY/NJ
62Port Authority of New York and New Jersey, PIDN Fact Sheet, March 2003
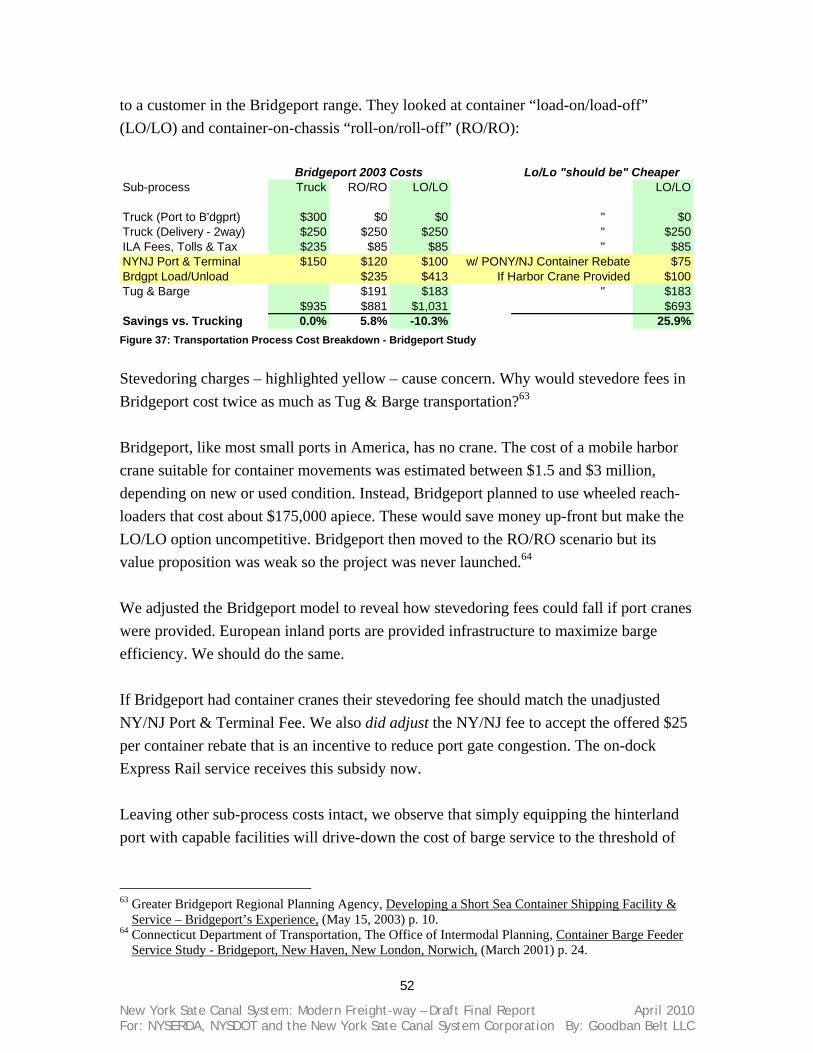
52
New York Sate Canal System: Modern Freight-way – Draft Final Report April 2010 For: NYSERDA, NYSDOT and the New York Sate Canal System Corporation By: Goodban Belt LLC
to a customer in the Bridgeport range. They looked at container “load-on/load-off” (LO/LO) and container-on-chassis “roll-on/roll-off” (RO/RO):
Sub-process Truck RO/RO LO/LO LO/LO
Truck (Port to B'dgprt) $300 $0 $0 " $0Truck (Delivery - 2way) $250 $250 $250 " $250ILA Fees, Tolls & Tax $235 $85 $85 " $85NYNJ Port & Terminal $150 $120 $100 w/ PONY/NJ Container Rebate $75Brdgpt Load/Unload $235 $413 If Harbor Crane Provided $100Tug & Barge $191 $183 " $183
$935 $881 $1,031 $693Savings vs. Trucking 0.0% 5.8% -10.3% 25.9%
Bridgeport 2003 Costs Lo/Lo "should be" Cheaper
Figure 37: Transportation Process Cost Breakdown - Bridgeport Study Stevedoring charges – highlighted yellow – cause concern. Why would stevedore fees in Bridgeport cost twice as much as Tug & Barge transportation?63 Bridgeport, like most small ports in America, has no crane. The cost of a mobile harbor crane suitable for container movements was estimated between $1.5 and $3 million, depending on new or used condition. Instead, Bridgeport planned to use wheeled reach-loaders that cost about $175,000 apiece. These would save money up-front but make the LO/LO option uncompetitive. Bridgeport then moved to the RO/RO scenario but its value proposition was weak so the project was never launched.64 We adjusted the Bridgeport model to reveal how stevedoring fees could fall if port cranes were provided. European inland ports are provided infrastructure to maximize barge efficiency. We should do the same. If Bridgeport had container cranes their stevedoring fee should match the unadjusted NY/NJ Port & Terminal Fee. We also did adjust the NY/NJ fee to accept the offered $25 per container rebate that is an incentive to reduce port gate congestion. The on-dock Express Rail service receives this subsidy now. Leaving other sub-process costs intact, we observe that simply equipping the hinterland port with capable facilities will drive-down the cost of barge service to the threshold of
63 Greater Bridgeport Regional Planning Agency, Developing a Short Sea Container Shipping Facility &
Service – Bridgeport’s Experience, (May 15, 2003) p. 10. 64 Connecticut Department of Transportation, The Office of Intermodal Planning, Container Barge Feeder
Service Study - Bridgeport, New Haven, New London, Norwich, (March 2001) p. 24.
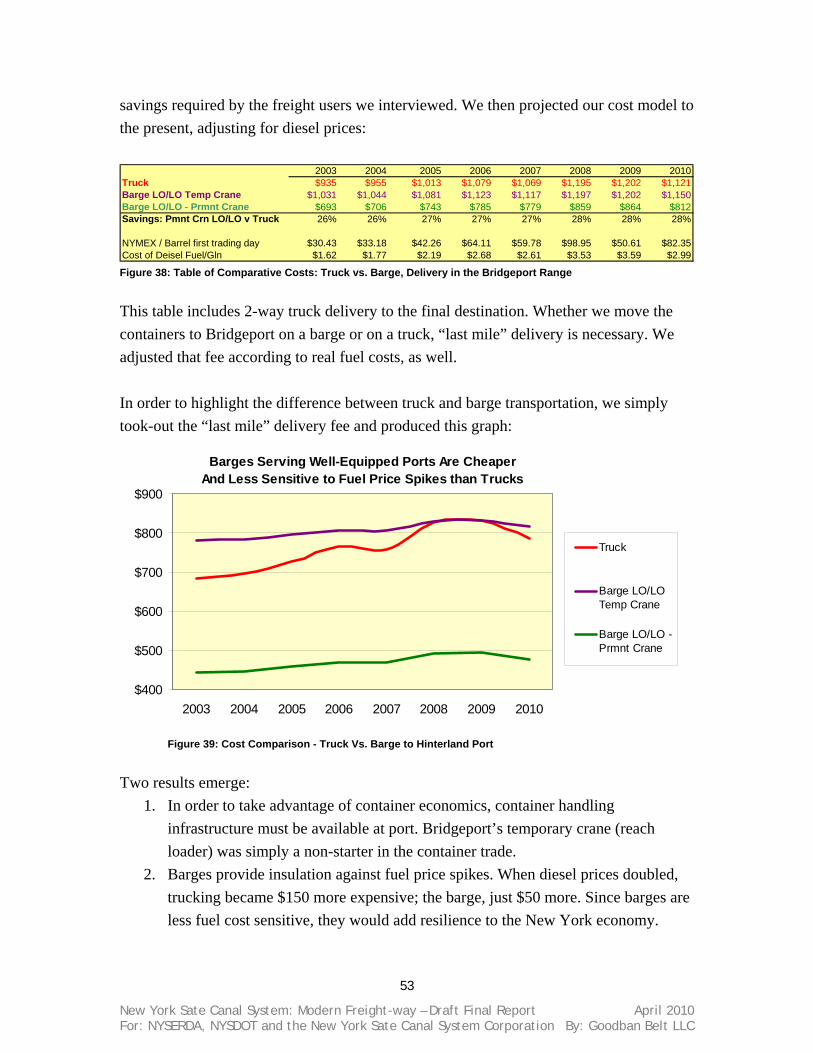
53
New York Sate Canal System: Modern Freight-way – Draft Final Report April 2010 For: NYSERDA, NYSDOT and the New York Sate Canal System Corporation By: Goodban Belt LLC
savings required by the freight users we interviewed. We then projected our cost model to the present, adjusting for diesel prices:
2003 2004 2005 2006 2007 2008 2009 2010Truck $935 $955 $1,013 $1,079 $1,069 $1,195 $1,202 $1,121Barge LO/LO Temp Crane $1,031 $1,044 $1,081 $1,123 $1,117 $1,197 $1,202 $1,150Barge LO/LO - Prmnt Crane $693 $706 $743 $785 $779 $859 $864 $812Savings: Pmnt Crn LO/LO v Truck 26% 26% 27% 27% 27% 28% 28% 28%
NYMEX / Barrel first trading day $30.43 $33.18 $42.26 $64.11 $59.78 $98.95 $50.61 $82.35Cost of Deisel Fuel/Gln $1.62 $1.77 $2.19 $2.68 $2.61 $3.53 $3.59 $2.99 Figure 38: Table of Comparative Costs: Truck vs. Barge, Delivery in the Bridgeport Range This table includes 2-way truck delivery to the final destination. Whether we move the containers to Bridgeport on a barge or on a truck, “last mile” delivery is necessary. We adjusted that fee according to real fuel costs, as well. In order to highlight the difference between truck and barge transportation, we simply took-out the “last mile” delivery fee and produced this graph:
Barges Serving Well-Equipped Ports Are Cheaper And Less Sensitive to Fuel Price Spikes than Trucks
$400
$500
$600
$700
$800
$900
2003 2004 2005 2006 2007 2008 2009 2010
Truck
Barge LO/LOTemp Crane
Barge LO/LO -Prmnt Crane
Figure 39: Cost Comparison - Truck Vs. Barge to Hinterland Port
Two results emerge:
1. In order to take advantage of container economics, container handling infrastructure must be available at port. Bridgeport’s temporary crane (reach loader) was simply a non-starter in the container trade.
2. Barges provide insulation against fuel price spikes. When diesel prices doubled, trucking became $150 more expensive; the barge, just $50 more. Since barges are less fuel cost sensitive, they would add resilience to the New York economy.

54
New York Sate Canal System: Modern Freight-way – Draft Final Report April 2010 For: NYSERDA, NYSDOT and the New York Sate Canal System Corporation By: Goodban Belt LLC
Containerization made it possible to leverage automation in the multimodal logistics process, providing cost savings per unit, with the caveat that a much larger upfront investment in port facilities and specialized vessels is now required. It is no different than any other automated process. Consider automobile manufacturing. Henry Ford’s assembly line drove down the cost of cars to the point where every family could afford one. At the same time, Ford forced consolidation in the automobile industry. Hundreds of small manufacturers either folded or combined in order to pool their capital and invest in automated plants and processes. Container port infrastructure is expensive. That is why it is so difficult for marginal ports to keep up in the “containerization arms race”. Formerly vibrant ports and cities have been left behind as a result of containerization. Whole countries could be in jeopardy of permanent economic disadvantage because they are unable to afford and operate world-class container shipping facilities.65 New York needs to consider this new paradigm of the global economy just as carefully as do World Bank Governors and Developing Country Presidents. If New York does not embrace container trade and develop multimodal facilities in Upstate cities, Upstate New York will look more and more like an undeveloped country, not the Empire State. But New York is lucky. We have a great seaport and we already have a perfectly proportioned canal through the Appalachian water gap. All we need are the incremental investments in floating stock and port facilities. New York’s businesses will thereby benefit from a permanent competitive advantage relative to other States because they will have access to a lower-cost, less fuel price-sensitive logistics choice.
65 Levinson, p 236 - 238
Figure 40: Barge, Rail, Truck Multimodal Port - Koln Germany

55
New York Sate Canal System: Modern Freight-way – Draft Final Report April 2010 For: NYSERDA, NYSDOT and the New York Sate Canal System Corporation By: Goodban Belt LLC
Taking Stock – What We Have and What We Need to Add Europe and China – two of America’s biggest trading partners are growing their inland waterborne sectors. The US will have no choice but to emulate the most energy efficient strategies employed – if for no other reason than to maintain economic competitiveness. Equally, the Port of NY/NJ is in a competitive race where seaport competitiveness is highly dependent upon hinterland connectivity. 66 In order to remain the most important general cargo port on the east coast, New York should have the best and cheapest connections to the hinterland. Barges will achieve this. The barge route through New York has outstanding commercial potential. New York City and Buffalo are two of the Nation’s top gateways. Toronto is the fastest growing metropolis in North America. The New York State Canal System provides access to consumers and industry in New York, Southern Ontario, and the entire Great Lakes basin. In their paper: “Inland Waterways and the Global Supply Chain”, RNO Group provides key success factors achieved in Europe that foster the virtuous cycle of stronger seaports supported by multimodal hinterland connections:67
1. Geography and Market Dynamics: The most successful container on barge operations are on waterways connecting gateway ports with large inland markets.
2. Adaptable, Entrepreneurial Operators: Motor barges, optimized for container trade, enable container-on-barge operators to remain competitive.
3. Supportive Policies, Incentives and Investments: European governments want parity between waterborne and highway freight modes, justifying significant investments into currently underutilized waterways.
66 Notteboom, Theo and Rodrigue, Jean-Paul, Port Regionalization: Towards a New Phase in Port
Development, (Maritime Policy and Management, 32-3, July-September 2005) p298. 67 RNO Group, Inland Waterways and the Global Supply Chain, (Smart Rivers 2006 Conference Report,
March 2007) p. 19.
Top Gateways for International Freight
Exports
Imports
Exports
ImportsSource: Federal Highway Administration
Office of Freight Management and Operations
Figure 41: New York & Buffalo Among the Top Freight Gateways
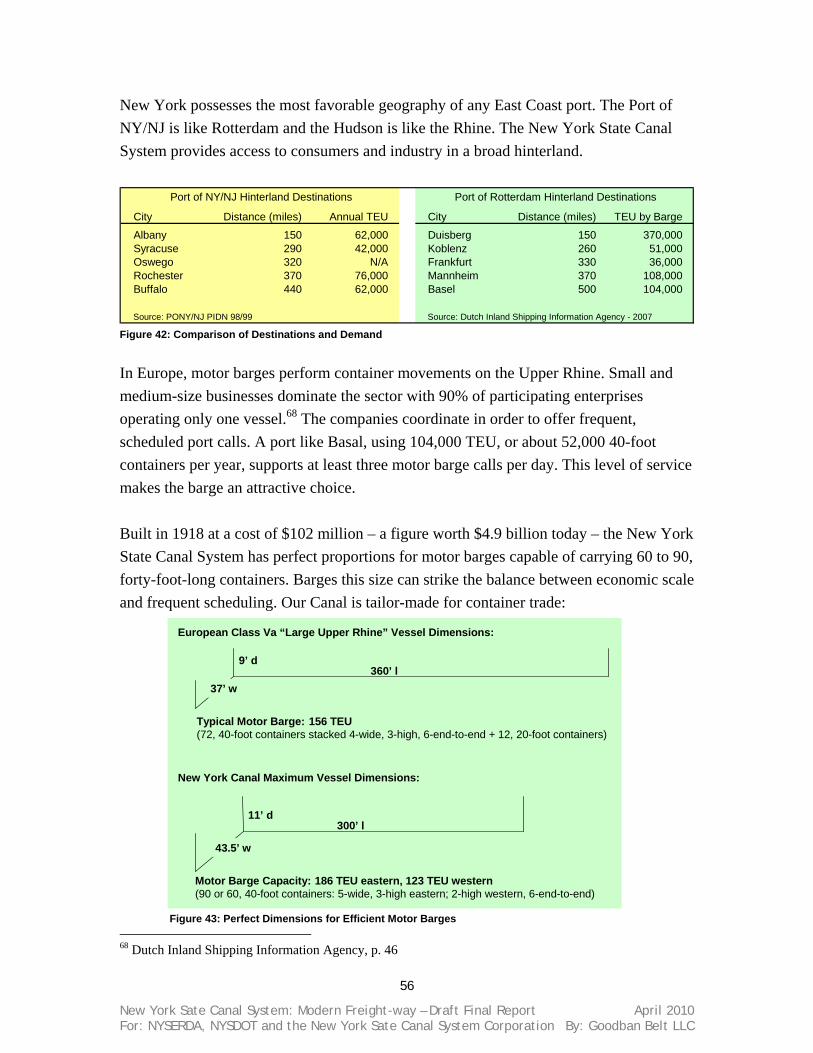
56
New York Sate Canal System: Modern Freight-way – Draft Final Report April 2010 For: NYSERDA, NYSDOT and the New York Sate Canal System Corporation By: Goodban Belt LLC
New York possesses the most favorable geography of any East Coast port. The Port of NY/NJ is like Rotterdam and the Hudson is like the Rhine. The New York State Canal System provides access to consumers and industry in a broad hinterland.
City Distance (miles) Annual TEU City Distance (miles) TEU by Barge
Albany 150 62,000 Duisberg 150 370,000Syracuse 290 42,000 Koblenz 260 51,000Oswego 320 N/A Frankfurt 330 36,000Rochester 370 76,000 Mannheim 370 108,000Buffalo 440 62,000 Basel 500 104,000
Source: PONY/NJ PIDN 98/99 Source: Dutch Inland Shipping Information Agency - 2007
Port of NY/NJ Hinterland Destinations Port of Rotterdam Hinterland Destinations
Figure 42: Comparison of Destinations and Demand In Europe, motor barges perform container movements on the Upper Rhine. Small and medium-size businesses dominate the sector with 90% of participating enterprises operating only one vessel.68 The companies coordinate in order to offer frequent, scheduled port calls. A port like Basal, using 104,000 TEU, or about 52,000 40-foot containers per year, supports at least three motor barge calls per day. This level of service makes the barge an attractive choice. Built in 1918 at a cost of $102 million – a figure worth $4.9 billion today – the New York State Canal System has perfect proportions for motor barges capable of carrying 60 to 90, forty-foot-long containers. Barges this size can strike the balance between economic scale and frequent scheduling. Our Canal is tailor-made for container trade:
68 Dutch Inland Shipping Information Agency, p. 46
Figure 43: Perfect Dimensions for Efficient Motor Barges
9’ d360’ l
Typical Motor Barge: 156 TEU (72, 40-foot containers stacked 4-wide, 3-high, 6-end-to-end + 12, 20-foot containers)
37’ w
European Class Va “Large Upper Rhine” Vessel Dimensions:
11’ d300’ l
Motor Barge Capacity: 186 TEU eastern, 123 TEU western(90 or 60, 40-foot containers: 5-wide, 3-high eastern; 2-high western, 6-end-to-end)
43.5’ w
New York Canal Maximum Vessel Dimensions:
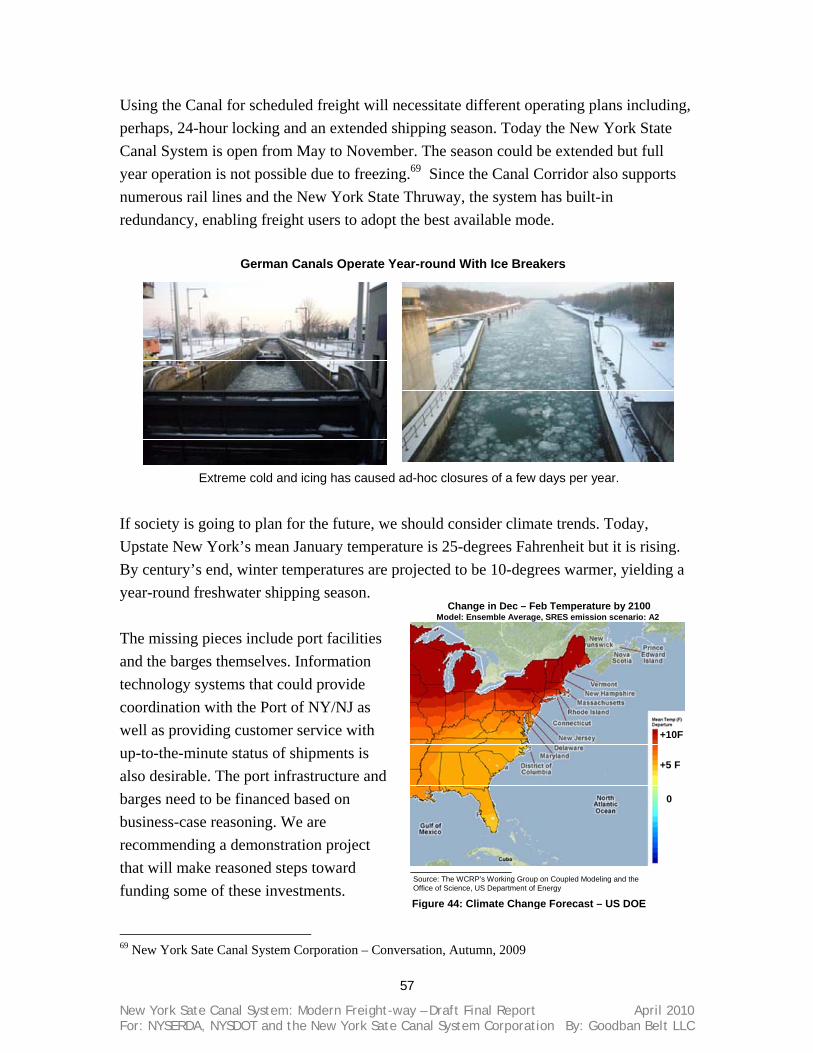
57
New York Sate Canal System: Modern Freight-way – Draft Final Report April 2010 For: NYSERDA, NYSDOT and the New York Sate Canal System Corporation By: Goodban Belt LLC
Using the Canal for scheduled freight will necessitate different operating plans including, perhaps, 24-hour locking and an extended shipping season. Today the New York State Canal System is open from May to November. The season could be extended but full year operation is not possible due to freezing.69 Since the Canal Corridor also supports numerous rail lines and the New York State Thruway, the system has built-in redundancy, enabling freight users to adopt the best available mode.
If society is going to plan for the future, we should consider climate trends. Today, Upstate New York’s mean January temperature is 25-degrees Fahrenheit but it is rising. By century’s end, winter temperatures are projected to be 10-degrees warmer, yielding a year-round freshwater shipping season. The missing pieces include port facilities and the barges themselves. Information technology systems that could provide coordination with the Port of NY/NJ as well as providing customer service with up-to-the-minute status of shipments is also desirable. The port infrastructure and barges need to be financed based on business-case reasoning. We are recommending a demonstration project that will make reasoned steps toward funding some of these investments.
69 New York Sate Canal System Corporation – Conversation, Autumn, 2009
+10F
+5 F
0
Change in Dec – Feb Temperature by 2100Model: Ensemble Average, SRES emission scenario: A2
Source: The WCRP’s Working Group on Coupled Modeling and the Office of Science, US Department of Energy
Extreme cold and icing has caused ad-hoc closures of a few days per year.
German Canals Operate Year-round With Ice Breakers
Figure 44: Climate Change Forecast – US DOE
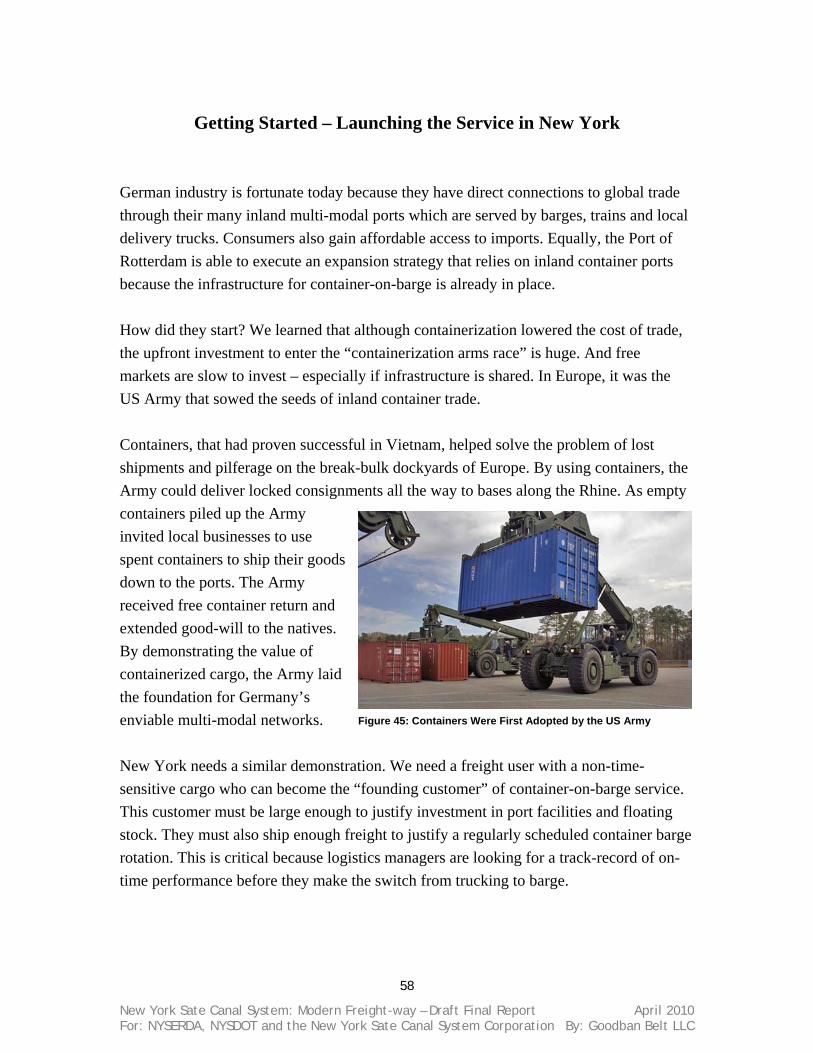
58
New York Sate Canal System: Modern Freight-way – Draft Final Report April 2010 For: NYSERDA, NYSDOT and the New York Sate Canal System Corporation By: Goodban Belt LLC
Getting Started – Launching the Service in New York German industry is fortunate today because they have direct connections to global trade through their many inland multi-modal ports which are served by barges, trains and local delivery trucks. Consumers also gain affordable access to imports. Equally, the Port of Rotterdam is able to execute an expansion strategy that relies on inland container ports because the infrastructure for container-on-barge is already in place. How did they start? We learned that although containerization lowered the cost of trade, the upfront investment to enter the “containerization arms race” is huge. And free markets are slow to invest – especially if infrastructure is shared. In Europe, it was the US Army that sowed the seeds of inland container trade. Containers, that had proven successful in Vietnam, helped solve the problem of lost shipments and pilferage on the break-bulk dockyards of Europe. By using containers, the Army could deliver locked consignments all the way to bases along the Rhine. As empty containers piled up the Army invited local businesses to use spent containers to ship their goods down to the ports. The Army received free container return and extended good-will to the natives. By demonstrating the value of containerized cargo, the Army laid the foundation for Germany’s enviable multi-modal networks. New York needs a similar demonstration. We need a freight user with a non-time-sensitive cargo who can become the “founding customer” of container-on-barge service. This customer must be large enough to justify investment in port facilities and floating stock. They must also ship enough freight to justify a regularly scheduled container barge rotation. This is critical because logistics managers are looking for a track-record of on-time performance before they make the switch from trucking to barge.
Figure 45: Containers Were First Adopted by the US Army

59
New York Sate Canal System: Modern Freight-way – Draft Final Report April 2010 For: NYSERDA, NYSDOT and the New York Sate Canal System Corporation By: Goodban Belt LLC
New York City’s Billion-Dollar Problem Each day, 50,000 tons of waste and recyclables are collected in New York City and shipped far away, mostly by truck, in an “export” program that clogs bridges and roads. At a cost of roughly $75-a-ton, taking out the trash costs a billion dollars a year! 25% of the waste stream is “residential” and therefore it falls under the management of the City’s Department of Sanitation (DSNY). In September 2006 the DSNY published a Solid Waste Management Plan whose purpose was to provide for “dramatically reducing the number of truck trips and miles associated with disposal of New York City’s waste”, and establishing a “…cost-effective, reliable, and environmentally sound system for managing the City’s waste over the next 20 years.”70 New York City’s problem is an opportunity and a responsibility to seize and to solve. The status quo is not sustainable. It is both expensive and unfair. Landfills appear increasingly far away as those nearby fill-up. This increases the cost of transportation and the negative impacts to the environment and communities along truck routes. We illuminate the scope of the problem by applying the “cost of environmental and social externalities” shown in Figure 8 to just the top 10 DSNY landfills:
Tons/Day MilesDaily Cost of Externalities
GROWS Landfill Morrisville PA 2,622 63 $4,514Tullytown Landfill Tullytown PA 2,122 67 $3,885Atlantic Waste Disposal Inc Landfill Waverly VA 1,436 390 $15,304American Ref-Fuel/Essex County (Newark) NJ 1,388 10 $379Conestoga/New Morgan Landfill NewMorgan PA 1,270 130 $4,512Superior Greentree Landfill Kersey PA 1,225 293 $9,808Alliance Landfill Taylor PA 1,186 354 $11,473Modern Landfill & Recycling York PA 1,057 186 $5,372Greenridge Reclamation Scottdale PA 642 335 $5,877Shade Landfill, Cairnbrook PA 640 310 $5,421
Total un-accounted, un-billed cost $61,123to environment and society for trucking -- annualized: x 365 = $22,309,989
source: New York City Department of Sanitation, 2002
Top 10 Export Destinationsfor New York City Waste
Figure 46: Social and Environmental Cost of Hauling Garbage
The total cost: over $22 million each year – charged to our personal health and safety and to the health of our environment!
70 Doherty, John J., Commissioner, Comprehensive Solid Waste Management Plan, Department of
Sanitation, the City of New York, (New York, NY September 2006) p. ES-1

60
New York Sate Canal System: Modern Freight-way – Draft Final Report April 2010 For: NYSERDA, NYSDOT and the New York Sate Canal System Corporation By: Goodban Belt LLC
What would happen if DSNY could reach the top ten landfills by barge? How much could they reduce the cost of externalities by simply switching to the waterborne mode?
Tons/Day MilesExternalities
by TruckExternalities
by Barge
Savings to Environment &
SocietyGROWS Landfill Morrisville PA 2,622 63 $4,514 $606 $3,908Tullytown Landfill Tullytown PA 2,122 67 $3,885 $522 $3,363Atlantic Waste Disposal Inc Landfill Waverly VA 1,436 390 $15,304 $2,056 $13,248American Ref-Fuel/Essex County (Newark) NJ 1,388 10 $379 $51 $328Conestoga/New Morgan Landfill NewMorgan PA 1,270 130 $4,512 $606 $3,905Superior Greentree Landfill Kersey PA 1,225 293 $9,808 $1,317 $8,490Alliance Landfill Taylor PA 1,186 354 $11,473 $1,541 $9,932Modern Landfill & Recycling York PA 1,057 186 $5,372 $722 $4,651Greenridge Reclamation Scottdale PA 642 335 $5,877 $789 $5,088Shade Landfill, Cairnbrook PA 640 310 $5,421 $728 $4,693
$61,123 $8,211 $52,913Totals, annualized: $22,309,989 $2,996,864 $19,313,125
source: New York City Department of Sanitation, 2002
Top 10 Export Destinationsfor New York City Waste - Mode Comparison Daily cost of Externalities
Figure 47: Barges Could Lower the Cost of Externalities by Nearly 90% Barges would save $19 million in externalities – a reduction of nearly 90%. Of course one cannot float a barge to Scottdale Pennsylvania or any of these locations, save Newark. But if it were possible, shouldn’t we? Accepting that the garbage crisis warrants greater effort toward conservation, recycling, re-use and waste prevention, shouldn’t we at least seek not to compound the problem with pollution-causing trucks? Mayor Bloomberg thinks so. All of the DSNY transfer stations are on waterways – a legacy of New York’s past practice of dumping garbage at sea. Four of the transfer stations have been modernized with equipment to compact and containerize non-recyclable waste into sealed shipping containers. Mayor Bloomberg has instructed DSNY to seek ways to move these containers by barge to landfills or to rail heads where they can be exported to landfills in unit trains. The converted transfer stations are also equipped with seawalls and cranes for LO/LO container handling. A demonstration project could leverage this port infrastructure to begin providing scheduled container-on-barge service. All that is needed is port infrastructure near the landfills and floating stock – barges. To quantify and justify these investments, we need a business case.

61
New York Sate Canal System: Modern Freight-way – Draft Final Report April 2010 For: NYSERDA, NYSDOT and the New York Sate Canal System Corporation By: Goodban Belt LLC
Figure 48: New York’s Transfer Stations Feature Barge Access
The Business Case and the Social Case Reducing externalities could justify investment in container-on-barge infrastructure but even without bringing the societal and environmental benefits to bear, barges will provide a better, cheaper export mode. Consider these facts:
1. The overall demand is huge. DSNY will need to stuff and export nearly 600 containers per day.
2. The commodity is not “time-sensitive”. Moving it cheaply, safely and in an environmentally conscientious manner is the top priority.
62
New York Sate Canal System: Modern Freight-way – Draft Final Report April 2010 For: NYSERDA, NYSDOT and the New York Sate Canal System Corporation By: Goodban Belt LLC
3. There is available landfill space within 1 mile of the Canal at both Seneca Meadows and High Acres. The entire journey could be made by barge.
The economic impact could be attractive for Upstate New York. In their application to expand capacity, Seneca Meadows enumerated benefits that they provide to their host community of Seneca Falls:
• Over 160 jobs and annual payroll in excess of $6.5 million • Annual payments of $2.5 million to Seneca Falls • Over $4 million per year in purchases from local vendors • Investments greater than $6 million for village infrastructure and amenities plus
free garbage collection for village residents.71 Tullytown, Pennsylvania receives over 2,000 tons of New York garbage each day. Nearly 740 of Tullytown’s residents received checks for $5,000 from Waste Management last year as part of a revenue sharing “gift” agreed with the landfiller.72 Equally, the economic impact on DSNY could be positive, as well. New York and its suburbs spend about $75 per ton to export waste, roughly divided between “tipping fees” charged by the landfill and “transportation fees” charged by the hauler. This works out to about $800 to export a 22-ton container and the fees are rising. It is increasingly difficult to incinerate trash or find landfills close to the metropolis.73 DSNY’s residential waste problem costs close to $1 million per day!
Public Acceptance Just say “garbage barges” and people recall the Mobro 4000, laden with Islip’s trash and bobbing along the coast in search of a friendly landfill. Helicopters, dripping with newsmen competed with seagulls in the fetid air above the rotting waste. Our pursuit of public acceptance needs to begin with changing this imagery. Cory Environmental disposes of waste in Greater London, hauling away 700,000 tons by barge and thereby eliminating 100,000 truck trips over London’s congested roads each year. They share the River Thames with houseboats, sightseeing craft, mega-yachts and
71 Seneca Meadows, Inc., “Response to the Substantive Written Comments on the DGEIS”, FGEIS
Appendix C, (May 24, 2006) p. 6. 72 Fernandez, Manny, “Philadelphians Reap Rewards from New York’s Trash”, The New York Times,
November 1, 2009. 73 Rather, John, “A Long, Long Haul From the Curb”, The New York Times, December 4, 2005.
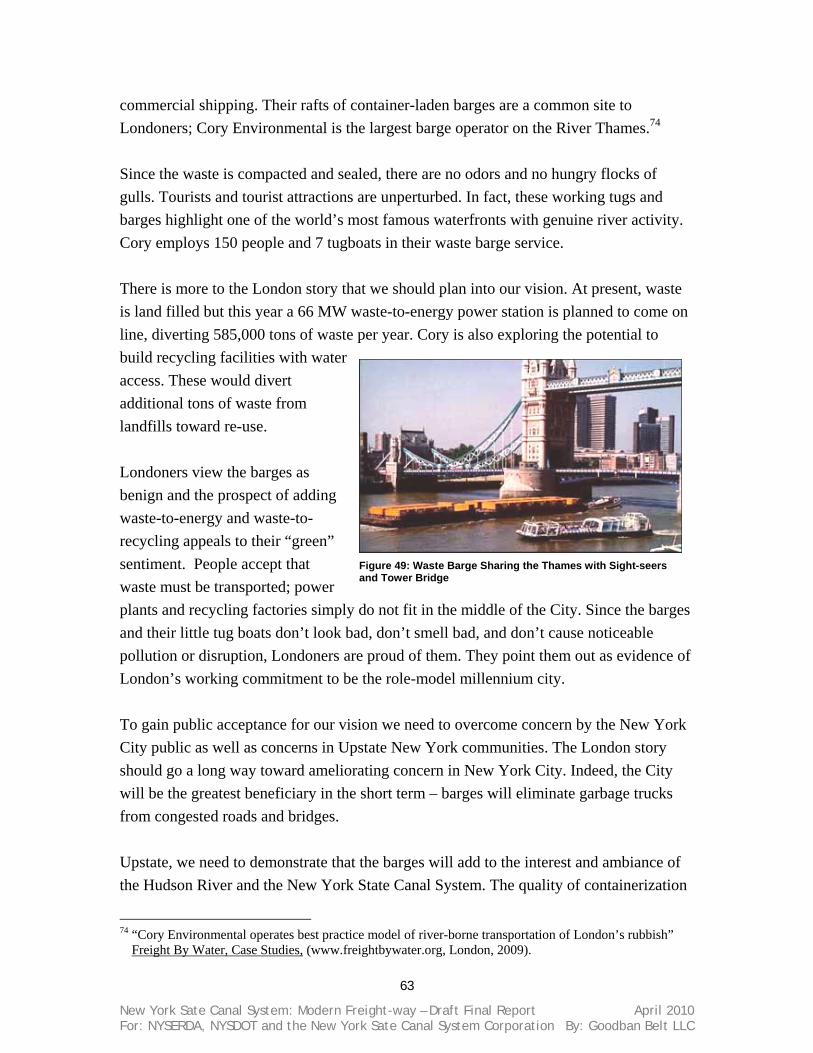
63
New York Sate Canal System: Modern Freight-way – Draft Final Report April 2010 For: NYSERDA, NYSDOT and the New York Sate Canal System Corporation By: Goodban Belt LLC
commercial shipping. Their rafts of container-laden barges are a common site to Londoners; Cory Environmental is the largest barge operator on the River Thames.74 Since the waste is compacted and sealed, there are no odors and no hungry flocks of gulls. Tourists and tourist attractions are unperturbed. In fact, these working tugs and barges highlight one of the world’s most famous waterfronts with genuine river activity. Cory employs 150 people and 7 tugboats in their waste barge service. There is more to the London story that we should plan into our vision. At present, waste is land filled but this year a 66 MW waste-to-energy power station is planned to come on line, diverting 585,000 tons of waste per year. Cory is also exploring the potential to build recycling facilities with water access. These would divert additional tons of waste from landfills toward re-use. Londoners view the barges as benign and the prospect of adding waste-to-energy and waste-to-recycling appeals to their “green” sentiment. People accept that waste must be transported; power plants and recycling factories simply do not fit in the middle of the City. Since the barges and their little tug boats don’t look bad, don’t smell bad, and don’t cause noticeable pollution or disruption, Londoners are proud of them. They point them out as evidence of London’s working commitment to be the role-model millennium city. To gain public acceptance for our vision we need to overcome concern by the New York City public as well as concerns in Upstate New York communities. The London story should go a long way toward ameliorating concern in New York City. Indeed, the City will be the greatest beneficiary in the short term – barges will eliminate garbage trucks from congested roads and bridges. Upstate, we need to demonstrate that the barges will add to the interest and ambiance of the Hudson River and the New York State Canal System. The quality of containerization
74 “Cory Environmental operates best practice model of river-borne transportation of London’s rubbish”
Freight By Water, Case Studies, (www.freightbywater.org, London, 2009).
Figure 49: Waste Barge Sharing the Thames with Sight-seers and Tower Bridge
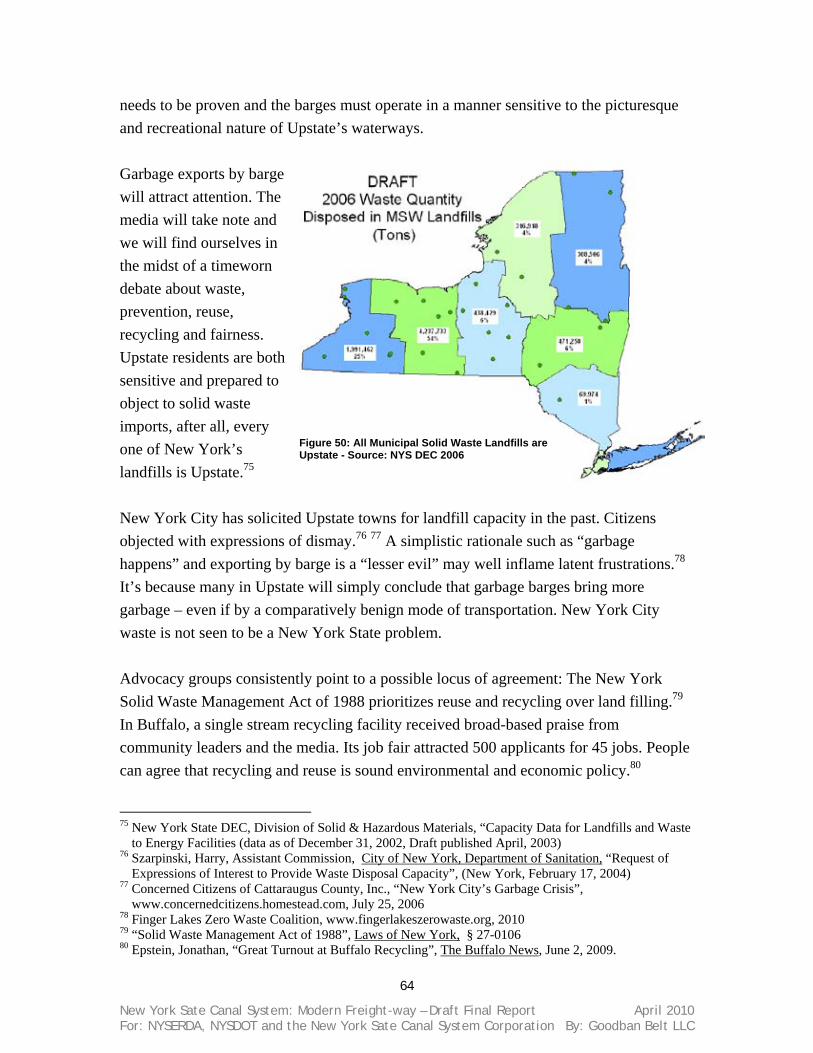
64
New York Sate Canal System: Modern Freight-way – Draft Final Report April 2010 For: NYSERDA, NYSDOT and the New York Sate Canal System Corporation By: Goodban Belt LLC
needs to be proven and the barges must operate in a manner sensitive to the picturesque and recreational nature of Upstate’s waterways. Garbage exports by barge will attract attention. The media will take note and we will find ourselves in the midst of a timeworn debate about waste, prevention, reuse, recycling and fairness. Upstate residents are both sensitive and prepared to object to solid waste imports, after all, every one of New York’s landfills is Upstate.75 New York City has solicited Upstate towns for landfill capacity in the past. Citizens objected with expressions of dismay.76 77 A simplistic rationale such as “garbage happens” and exporting by barge is a “lesser evil” may well inflame latent frustrations.78 It’s because many in Upstate will simply conclude that garbage barges bring more garbage – even if by a comparatively benign mode of transportation. New York City waste is not seen to be a New York State problem. Advocacy groups consistently point to a possible locus of agreement: The New York Solid Waste Management Act of 1988 prioritizes reuse and recycling over land filling.79 In Buffalo, a single stream recycling facility received broad-based praise from community leaders and the media. Its job fair attracted 500 applicants for 45 jobs. People can agree that recycling and reuse is sound environmental and economic policy.80
75 New York State DEC, Division of Solid & Hazardous Materials, “Capacity Data for Landfills and Waste
to Energy Facilities (data as of December 31, 2002, Draft published April, 2003) 76 Szarpinski, Harry, Assistant Commission, City of New York, Department of Sanitation, “Request of
Expressions of Interest to Provide Waste Disposal Capacity”, (New York, February 17, 2004) 77 Concerned Citizens of Cattaraugus County, Inc., “New York City’s Garbage Crisis”,
www.concernedcitizens.homestead.com, July 25, 2006 78 Finger Lakes Zero Waste Coalition, www.fingerlakeszerowaste.org, 2010 79 “Solid Waste Management Act of 1988”, Laws of New York, § 27-0106 80 Epstein, Jonathan, “Great Turnout at Buffalo Recycling”, The Buffalo News, June 2, 2009.
Figure 50: All Municipal Solid Waste Landfills are Upstate - Source: NYS DEC 2006
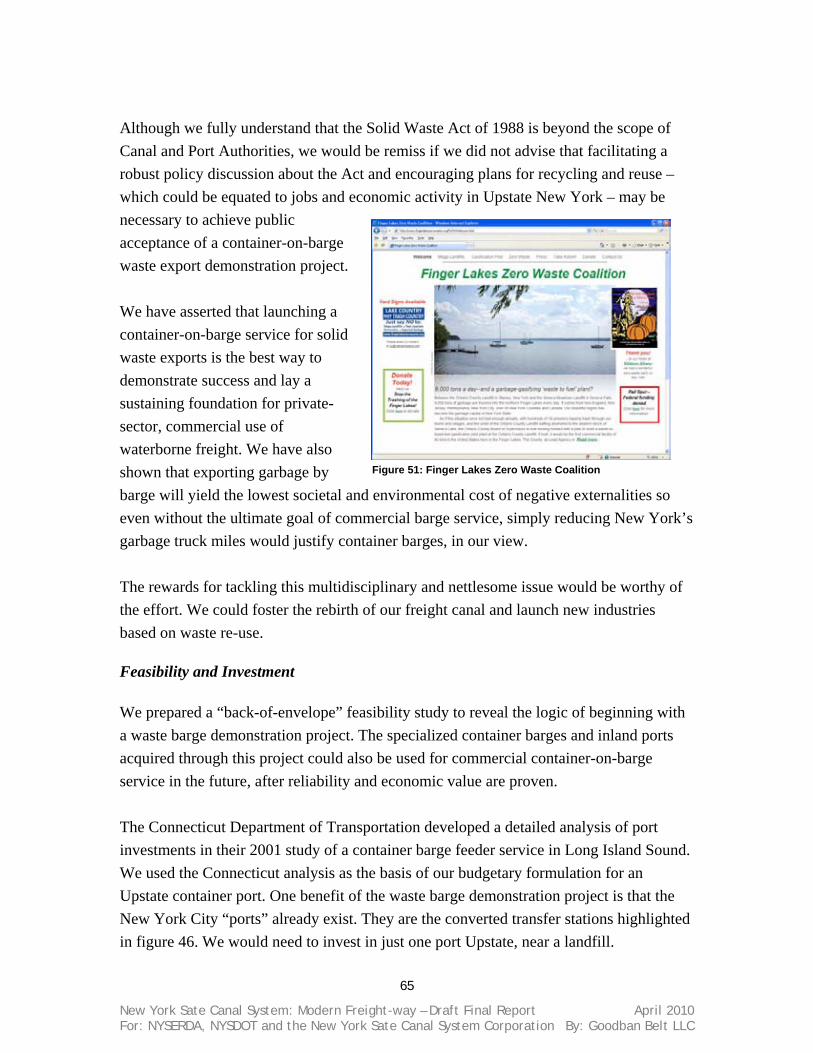
65
New York Sate Canal System: Modern Freight-way – Draft Final Report April 2010 For: NYSERDA, NYSDOT and the New York Sate Canal System Corporation By: Goodban Belt LLC
Although we fully understand that the Solid Waste Act of 1988 is beyond the scope of Canal and Port Authorities, we would be remiss if we did not advise that facilitating a robust policy discussion about the Act and encouraging plans for recycling and reuse – which could be equated to jobs and economic activity in Upstate New York – may be necessary to achieve public acceptance of a container-on-barge waste export demonstration project. We have asserted that launching a container-on-barge service for solid waste exports is the best way to demonstrate success and lay a sustaining foundation for private-sector, commercial use of waterborne freight. We have also shown that exporting garbage by barge will yield the lowest societal and environmental cost of negative externalities so even without the ultimate goal of commercial barge service, simply reducing New York’s garbage truck miles would justify container barges, in our view. The rewards for tackling this multidisciplinary and nettlesome issue would be worthy of the effort. We could foster the rebirth of our freight canal and launch new industries based on waste re-use.
Feasibility and Investment We prepared a “back-of-envelope” feasibility study to reveal the logic of beginning with a waste barge demonstration project. The specialized container barges and inland ports acquired through this project could also be used for commercial container-on-barge service in the future, after reliability and economic value are proven. The Connecticut Department of Transportation developed a detailed analysis of port investments in their 2001 study of a container barge feeder service in Long Island Sound. We used the Connecticut analysis as the basis of our budgetary formulation for an Upstate container port. One benefit of the waste barge demonstration project is that the New York City “ports” already exist. They are the converted transfer stations highlighted in figure 46. We would need to invest in just one port Upstate, near a landfill.
Figure 51: Finger Lakes Zero Waste Coalition

66
New York Sate Canal System: Modern Freight-way – Draft Final Report April 2010 For: NYSERDA, NYSDOT and the New York Sate Canal System Corporation By: Goodban Belt LLC
The port needs a bulkhead and a yard for stacking and storing containers until drayed by truck to a nearby fill site. The inland port also requires container handling equipment and skilled operators. We advocate procurement of two specialized motor barges to deliver the containers. Motor barges will provide better & faster container service in the Canal. They are maneuverable and quick through the locks. They also maximize carrying capacity by utilizing water and air draft and the full overall length of the locks. We also asserted that a primary reason for the waste-barge demonstration project is to lay the foundation for broad use of the canal which will remove trucks from Upstate roads and provide a resilient logistics choice that will strengthen our New York economy. The waste exports will provide sufficient economic value to pay for purpose-built floating stock that will demonstrate the efficacy of the waterborne freight mode and provide the compelling evidence that freight users need in order to switch modes. In our next chapter “Floating Stock” we present a motor barge recommendation. We have not developed a cost estimate and detailed design but we feel the estimate of $8.2 million per barge provided by the Connecticut DOT is sufficiently conservative. All together, we have included investments in port construction, container handling equipment and barges in our cost model. These assets would probably be financed so we applied a conservative set of amortization periods (Term) and interest rate of 6.0%. Bear in mind that fresh water barges can easily exhibit a useful life of 40 years and more.
Asset Group Term Capital Investment Down Payment Annual Payment10% 6.0%
Port - Berth & Yard 10 $1,900,000 $190,000 $243,537Container Handling 5 $2,660,000 $266,000 $595,731Two Motor Barges 10 $16,400,000 $1,640,000 $2,102,108
$20,960,000 $2,096,000 $2,941,376 Figure 54: Demonstration Project Table of Investments
Berth and Container YardBulkhead (350' long, 15' high) $700,000Fendering $30,000Bollards (2 @ 200ton) $15,000Paving (8 Acres) $950,000Lights $160,000Fence w/ Security Gate $50,000Fuel Tanks $15,000Maintenance Shed $80,000
Total Port Investment $2,000,000
EquipmentDray Tractors 2 $140,000Tip-Chassis 2 $50,000Loaded Container Handler 1 $350,000Overhead Mobile Out-span Crane (used) $1,500,000Maintenance Tools & Equipment $30,000
Total Port Equipment $2,070,000
Figure 52: Inland Port Investment -- Berth & Yard
Figure 53: Inland Port Investment -- Container Handling

67
New York Sate Canal System: Modern Freight-way – Draft Final Report April 2010 For: NYSERDA, NYSDOT and the New York Sate Canal System Corporation By: Goodban Belt LLC
We based our estimate of barge operating costs on the comparative cost model we presented in figure 33 and employed $3.00 diesel fuel. We subtracted the cost of the drivers, moving them into our overall personnel cost estimate. Our cost model shows that one barge operating 4½ days per week (round-the-clock), for nine months will cost about $400,000 to fuel, maintain and insure, with tolls and taxes. Two barges cost double. Our personnel cost model is based on two barge drivers relieving each other around the clock during a 4½ day week as follows:
Crews would work two weeks per month so each barge would have two, 2-man crews giving us a total of eight barge drivers. Although we did not select a landfill, we assumed one within 2-miles of the Canal so container drayage would be a very short-haul enabling a truck driver with a tipping chassis to make three round-trips per hour. The barges would carry 120 containers so a single driver would be able to dray the entire consignment in 40 hours – a workweek. Since there will be two barges calling
each week, we need two drayage truck drivers. The port itself would employ two more people to operate container handling equipment. We applied a G&A figure equal to 20% of personnel costs.
Figure 53: Barge Schedule
8 hrs 350 miles, average 8 mph Approximately 45 hours
Return 45 hours 8 hrs
Total Round-trip: 106 hours 4½ days
NYC: 30 containers/hour1. Unload Empties2. Load Full Containers
Upstate: 30 container/hour1. Unload Full Containers2. Load Empties
Personnel Headcount Cost - 9-months
Crane & Hyster Operator 2 $120,000
Truck Drivers 2 $100,000Barge Drivers 8 $600,000
Sub Total 12 $820,000G & A
As Percent of Salary* 0.2 $164,000
Figure 56: Pro-forma Personnel Cost
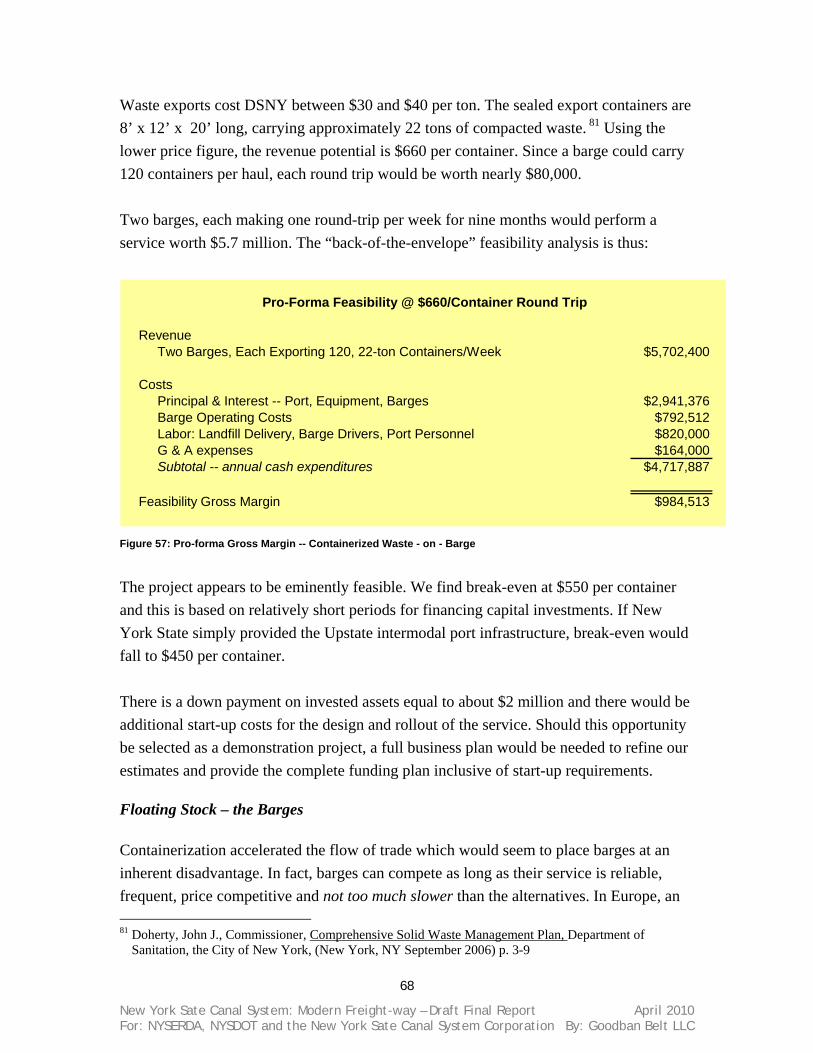
68
New York Sate Canal System: Modern Freight-way – Draft Final Report April 2010 For: NYSERDA, NYSDOT and the New York Sate Canal System Corporation By: Goodban Belt LLC
Waste exports cost DSNY between $30 and $40 per ton. The sealed export containers are 8’ x 12’ x 20’ long, carrying approximately 22 tons of compacted waste. 81 Using the lower price figure, the revenue potential is $660 per container. Since a barge could carry 120 containers per haul, each round trip would be worth nearly $80,000. Two barges, each making one round-trip per week for nine months would perform a service worth $5.7 million. The “back-of-the-envelope” feasibility analysis is thus:
RevenueTwo Barges, Each Exporting 120, 22-ton Containers/Week $5,702,400
CostsPrincipal & Interest -- Port, Equipment, Barges $2,941,376Barge Operating Costs $792,512Labor: Landfill Delivery, Barge Drivers, Port Personnel $820,000G & A expenses $164,000Subtotal -- annual cash expenditures $4,717,887
Feasibility Gross Margin $984,513
Pro-Forma Feasibility @ $660/Container Round Trip
The project appears to be eminently feasible. We find break-even at $550 per container and this is based on relatively short periods for financing capital investments. If New York State simply provided the Upstate intermodal port infrastructure, break-even would fall to $450 per container. There is a down payment on invested assets equal to about $2 million and there would be additional start-up costs for the design and rollout of the service. Should this opportunity be selected as a demonstration project, a full business plan would be needed to refine our estimates and provide the complete funding plan inclusive of start-up requirements.
Floating Stock – the Barges Containerization accelerated the flow of trade which would seem to place barges at an inherent disadvantage. In fact, barges can compete as long as their service is reliable, frequent, price competitive and not too much slower than the alternatives. In Europe, an 81 Doherty, John J., Commissioner, Comprehensive Solid Waste Management Plan, Department of
Sanitation, the City of New York, (New York, NY September 2006) p. 3-9
Figure 57: Pro-forma Gross Margin -- Containerized Waste - on - Barge

69
New York Sate Canal System: Modern Freight-way – Draft Final Report April 2010 For: NYSERDA, NYSDOT and the New York Sate Canal System Corporation By: Goodban Belt LLC
express barge from Basel can reach Rotterdam with a load of containers in just 48 hours. It’s a 550 mile trip with an 800-foot descent through locks to sea level. The barge needs to average 12 miles per hour and in fact, will reach 20 miles per hour in open channels! Only a motor barge can perform like this. They are fast, agile, energy efficient and economical. In Upstate New York, we want to sow the seeds of regularly scheduled container barge service to the half-dozen, or so multimodal ports that could serve the metropolitan regions along the Canal. In order to provide frequent port calls, several barges should work in rotation. Once again, motor barges provide the best combination of economic scale and frequency. Operating like a liner service, they can arrive at berth, unload a few containers and take on board a few more. Inland ports that can offer same-day export service can compete very well with other transportation modes. As long as the containers are moving, speed becomes less important. There is a noteworthy exception to this view which we have discussed. When the seaport establishes an “extended gateway” sorting yard some miles inland from the ocean terminal it makes sense to use large dumb barges as floating storage that may then be pushed inland to the extended gateway. These are not “delivery vessels”, per sey. Their purpose is to provide floating real estate that can be shuttled between two separated stages of the seaport process. After the containers have been sorted, trucks, trains and motor barges will deliver them from the extended gate facilities to their destinations. In Europe most motor barges in container service feature a cabin, bridge and engine room aft. The Captain’s bridge sits atop a hydraulic ram so it can be elevated above the top tier of containers. This provides a view of the entire barge but the bridge must be lowered to clear obstacles, whereupon the crew is made momentarily blind, behind a wall of boxes. The New York State Canal System differs from the Rhine Channel in depth and air draft. The Rhine is more shallow but with high bridges. The New York State Canal System is
Figure 58: Barges at Antwerp - source: Google Earth Panramio
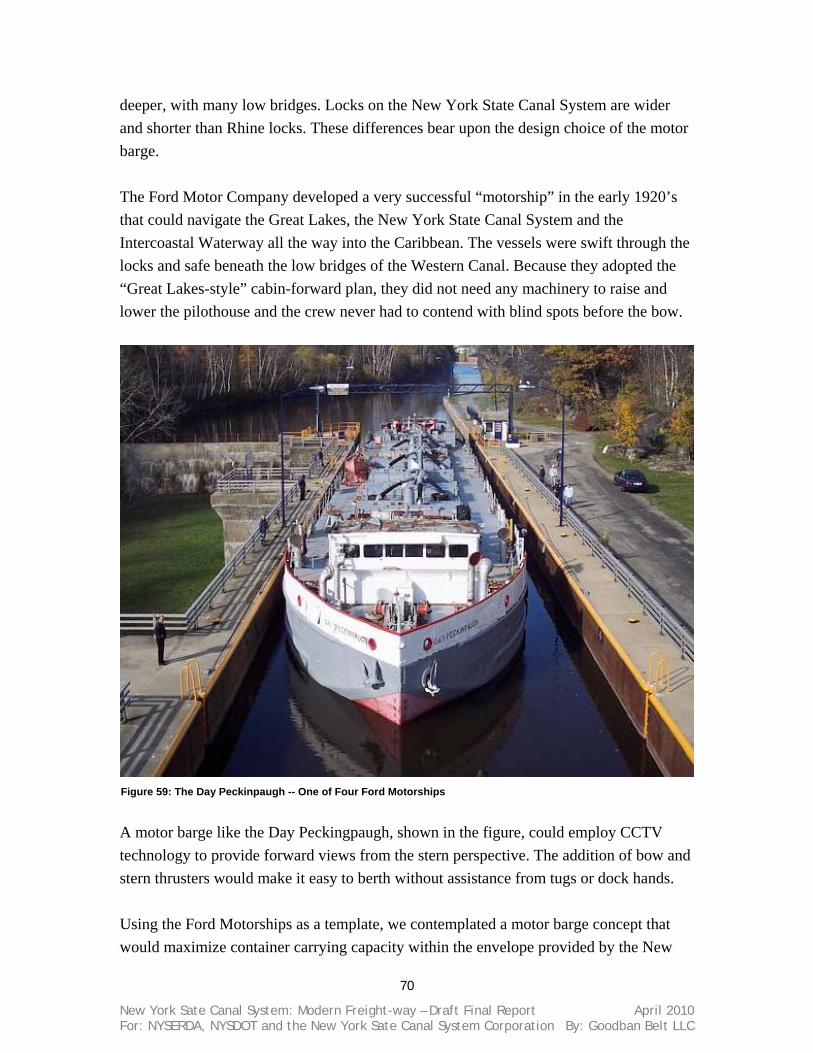
70
New York Sate Canal System: Modern Freight-way – Draft Final Report April 2010 For: NYSERDA, NYSDOT and the New York Sate Canal System Corporation By: Goodban Belt LLC
deeper, with many low bridges. Locks on the New York State Canal System are wider and shorter than Rhine locks. These differences bear upon the design choice of the motor barge. The Ford Motor Company developed a very successful “motorship” in the early 1920’s that could navigate the Great Lakes, the New York State Canal System and the Intercoastal Waterway all the way into the Caribbean. The vessels were swift through the locks and safe beneath the low bridges of the Western Canal. Because they adopted the “Great Lakes-style” cabin-forward plan, they did not need any machinery to raise and lower the pilothouse and the crew never had to contend with blind spots before the bow.
A motor barge like the Day Peckingpaugh, shown in the figure, could employ CCTV technology to provide forward views from the stern perspective. The addition of bow and stern thrusters would make it easy to berth without assistance from tugs or dock hands. Using the Ford Motorships as a template, we contemplated a motor barge concept that would maximize container carrying capacity within the envelope provided by the New
Figure 59: The Day Peckinpaugh -- One of Four Ford Motorships

71
New York Sate Canal System: Modern Freight-way – Draft Final Report April 2010 For: NYSERDA, NYSDOT and the New York Sate Canal System Corporation By: Goodban Belt LLC
York State Canal System locks, available depth and air draft. Should we proceed to a demonstration project feasibility phase, we will develop an engineering analysis and cost estimation. By eliminating features like the elevating Captain’s Bridge and the large rear cabin, we feel that this motor barge will be comparatively inexpensive to build.
Concluding Remarks and Next Steps “It is not enough to provide a waterway, even though it may be an excellent one, and overlook entirely the equally important elements which must be integrated before the waterway may become a trafficway.” -- General Frank T. Hines, Chief of the Inland and Coastwise Waterways Service of the War Department… in 192182
82 Hines, Frank, T. General, “What Barge Canal Needs – Great Future is Forecast if Transportation on Large Scale Supports Small Operations”, editorial published in The New York Times, February 27, 1921
Figure 60: A Modern Motorship – Optimized Container Barge

72
New York Sate Canal System: Modern Freight-way – Draft Final Report April 2010 For: NYSERDA, NYSDOT and the New York Sate Canal System Corporation By: Goodban Belt LLC
100 years ago General Hines recognized that the new Canal required new floating stock, port facilities and operators in order to realize its potential. The same is true today. Our Canal is an outstanding asset. Built for a present dollar cost of $4.9 billion, it is well maintained and ready to perform in our modern economy. But we have learned that modern logistics is driven by the container, which enabled standardization, automation and speed. To succeed with inland waterborne container logistics we came to learn these three key necessary conditions:
1. Leverage the demand of a large “early adopter”. In Germany, the US Army introduced container logistics. In New York, the City’s Department of Sanitation could provide sufficient demand to launch a scheduled container-on-barge service. After the price, performance and reliability is demonstrated, private sector freight users will begin to switch from trucks to barges.
2. Invest in container handling automation at the inland ports. The reason that containerization lowered the cost of freight is because it enabled automation of the stevedoring process. If we do not have this automation, we will not reap the efficiencies of container logistics. These upfront investments are necessary.
3. Use motor barges for hinterland container service. Frequent port calls and relatively swift service is needed to compel shippers to switch from trucks to barges. Motor barges are uniquely capable of achieving this level of service.
We demonstrated the benefits of waterborne transportation. It is better for society and the environment. In a future fraught by volatile oil prices, it is a more resilient transportation mode that will make New York’s economy more resilient, too. We also introduced New York City’s garbage problem and asserted that it is both a responsibility and an opportunity for all New Yorkers to solve. Exporting waste from New York is necessary whether that waste is land filled, burned for power or processed for recycling and reuse. Barges provide the best way to export waste and it is incumbent upon Upstate New York to press for “green” industries based on recycling and re-use. We outlined a demonstration project to begin with waste exports that will be large enough to justify the needed investments in port infrastructure and specialized motor barges. Although the cost of these assets is significant, success is virtually assured. New York City has a $1 million per day waste problem. Our demonstration project could solve

73
New York Sate Canal System: Modern Freight-way – Draft Final Report April 2010 For: NYSERDA, NYSDOT and the New York Sate Canal System Corporation By: Goodban Belt LLC
this problem and foster constructive action toward achieving the full intent of the New York Solid Waste Act of 1988. The purpose of this document is to inform and empower policymakers, elected leaders, and New York’s Corporations and Authorities who would be sponsors of a container-on-barge service. Our goal is to proceed directly to a demonstration project. The next step is to complete a comprehensive feasibility study of transporting sealed, containerized waste by barge to Upstate New York landfills. This study would include:
1. An operating plan and financial analysis 2. A multi-year contract for waste exports with DSNY, and… 3. A public affairs strategy to inform and engage the Upstate New York public,
embracing their ideas and ameliorating their concerns. In order to perform an accurate financial forecast, we must include engineering and estimating for an Upstate Container Port. The Connecticut DOT’s analysis provides a template. We must also complete a preliminary design of a container-optimized motor barge along with a cost estimate. This demonstration project is eminently feasible right now. Rising trends in fuel prices and New York’s ever growing garbage crisis only strengthen the justification. And, there appears to be no better substitute for barge-borne waste exports. If we begin now, we can demonstrate the benefits of container barges before 2015 when the Port of NY/NJ will begin to feel acute pressure to expand. Other top ports reveal that when land is dear and congestion fierce, the best way to expand is toward the water. They use the marine berths to relieve port gate congestion. They use barges to provide floating storage and they employ extended gateways to separate transshipment at the seaport from storing, sorting and container clearance. Extended gateways, connected to the seaport by barge, provide the most affordable, most secure and most environmentally-friendly mechanism for capacity expansion. Inland waterborne container logistics is resurgent in Europe and China because it strengthens their economies. New York should take steps today to leverage existing assets and adopt this freight mode. It will strengthen our economy and sustain the New York State Canal System.