New York City’s Asian Population: One Million and · PDF fileNew York City’s Asian...
20
New York City’s Asian Population: One Million and Counting TM Joseph Salvo Population Division AAARI Conference on Rethinking NYC's Asian American Communities City University of New York Graduate Center May 5, 2014
Transcript of New York City’s Asian Population: One Million and · PDF fileNew York City’s Asian...

New York City’s Asian Population: One Million and Counting
TM
Joseph Salvo Population Division
AAARI Conference on Rethinking NYC's Asian American Communities City University of New York Graduate Center May 5, 2014

Population Growth by Race/Hispanic Origin New York City, 2000 to 2008-2012
0
500,000
1,000,000
1,500,000
2,000,000
2,500,000
3,000,000
Black nonhispanic White nonhispanic Asian nonhispanic Hispanic
2000 2012
Percent Change = -2.7 8.5 -4.3 34.1
Sources: U.S. Census Bureau: 2000 Census-Summary File 1; 2008-2012 American Community Survey-FactFinder Population Division-New York City Department of City Planning
2
0
100,000
200,000
300,000
400,000
500,000
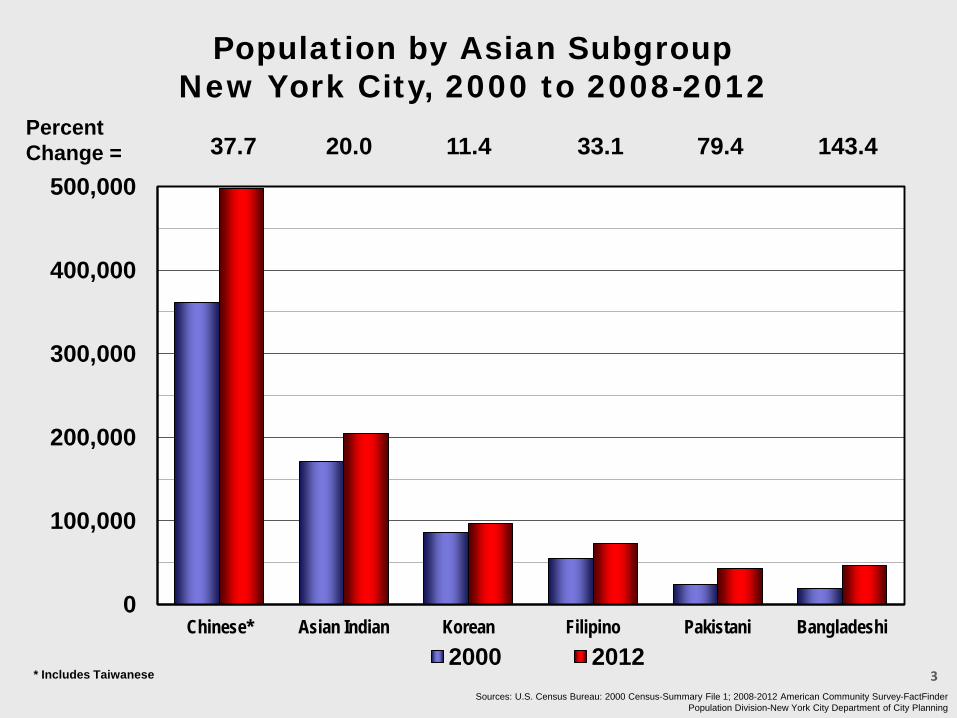
Chinese* Asian Indian Korean Filipino Pakistani Bangladeshi 2000 2012
Population by Asian Subgroup New York City, 2000 to 2008-2012
37.7 Percent Change = 143.4 79.4 33.1 11.4 20.0
* Includes Taiwanese
Sources: U.S. Census Bureau: 2000 Census-Summary File 1; 2008-2012 American Community Survey-FactFinder Population Division-New York City Department of City Planning
3

0%
25%
50%
75%
100%
Total Asian*
Chinese** Asian Indian
Korean Filipino Bangladeshi Pakistani
Staten Island Queens Manhattan Brooklyn Bronx
Borough Distribution of Top Asian Subgroups New York City, 2008-2012
*Includes a small number of Asians who are of Hispanic origin. ** Includes Taiwanese
Total = 73,173 43,241 497,788 46,598 205,098 96,335 1,053,649
Source: U.S. Census Bureau, 2008-2012 American Community Survey-FactFinder Population Division- New York City Department of City Planning
4
E New York
Canarsie
Great Kills
St Albans
Bay Rdg
S Ozone Pk
Rosedale
Steinway
Flatlands
Queens Vlg Forest Hls
Bellerose
Jamaica
Whitestone
Hunts Pt
Astoria
Middle Vlg
Westerleigh
Flatbush
Murray Hl
College Pt
Arden Hts
Borough Pk
Flushing
Baisley Pk
Ridgewood Hollis
Jackson Hts
Laurelton
S Jamaica
Crown Hts N
W Vlg
Bedford Richmond Hl
Maspeth
Elmhurst
Midwood
Co-Op City
Glendale
Dyker Hts
Greenpoint
Madison
Bensonhurst W
E Flushing
Woodhaven
Gravesend
Auburndale
Brownsville
Kew Gdns Hls
E Hrlm N
Woodside
Cambria Hts
Ozone Pk
Clinton
Rego Pk
Corona
E Vlg
Ocean Hl
Clinton Hl Stuyvesant Hts
Kew Gdns
E Hrlm S
N Corona
E Elmhurst
Pelham Pkwy
Springfield Gdns N Crown Hts S
Bayside Bayside Hls
Rossville Woodrow
Far Rckwy Bayswater
Lindenwood Howard Bch
Stapleton Rosebank
Seagate Coney Is
N Side S Side
New Dorp Midland Bch
Pk Slope Gowanus
Oakwood Oakwood Bch
E Flatbush Farragut
Woodlawn Wakefield
Jamaica Ests Holliswood
New Brighton Silver Lake
Mott Haven Prt Morris
Rugby Remsen Vlg
Briarwood Jamaica Hls
Springfield Gdns S Brookville
Allerton Pelham Gdns
Fresh Mdws Utopia
Prospect Lffrts Gdns Wingate
Charleston Richmond Vly
Tottenville
Hunters Pt Sunnyside
W Maspeth
Schuylerville Throgs Nck
Edgewater Pk
Old Town Dongan Hls
S Bch
Douglas Mnr Douglaston Little Nck
Ft Totten Bay Ter Clearvw
N Riverdale Fieldston Riverdale
Sheepshead Bay Gerritsen Bch
MN Bch
Pomonok Flushing Hts
Hillcrest
New Springville Bloomfield
Travis
Todt Hl Emerson Hl Heartlnd Vlg Lghthouse Hl
Annadale Huguenot
Prince's Bay Eltingvl
Mariner's Hbr Arlington Prt Ivory
Graniteville
Sunset Pk W
Oakland Gdns
Homecrest
E Williamsburg
Bensonhurst E
Upper W Side
Sunset Pk E
Bath Bch
Wash Hts S
Wash Hts N
E Tremont
Lower E Side
Queensboro Hl
Erasmus
Ft Greene
Yorkville
Mt Hope
Norwood
Lincoln Sq
Belmont
V Cortlandt Vlg
Bronxdale
Rikers Island
Old Astoria
Brighton Bch
Chinatown
Ocean Pkwy S
Hamilton Hts
Morningside Hts
Windsor Ter
Central Hrlm S
Longwood
Parkchstr
Williamsburg
Kingsbridge Hts
Prospect Hts
W Brighton
Gramercy
Manhattanville
Fordhm S
DUMBO Vinegar Hl
Dwntwn BK Boerum Hl
Starrett City
E New York (PA Ave)
Willmsbridge Olinville
Midtown Midtown S
Cypress Hls City Line
Westchstr Unionprt
Elmhurst Maspeth
E Conc Conc Vlg
Clarmnt Bathgate
W Farms Bronx Riv
Upper E Side Carnegie Hl
Turtle Bay E Midtown
University Hts Morris Hts
Spuyten Duyvil Kingsbridge
Morrisania Melrose
Bedfrd Pk Fordhm N
Marble Hl Inwood
Soundview Bruckner
Murray Hl Kips Bay
Lenox Hl Roosevelt Is
Kensington Ocean Pkwy
Battery Pk City Lower MN
Melrose S Mott Haven N
BK Hts Cobble Hl
Stuy Town Cooper Vlg
Eastchstr Ednwld Baychstr
Carroll Gdns Columbia St
Red Hook
Grymes Hl Clifton Fox Hls
Glen Oaks Floral Pk
New Hyde Pk
W New Brighton New Brighton
St George
Van Nest Morris Pk
Westchtr Sq
Grasmere Arrochar
Ft Wadsworth
Pelham Bay Country Club
City Island
Queensbridge Ravenswood
LIC
Hammels Arverne
Edgemere
Soundview Castle Hl Clason Pt
Harding Pk
Breezy Pt Belle Hbr Rckwy Pk
Broad Channel
Hudson Yrds Chelsea Flat Iron Union Sq
SoHo TriBeCa Civic Ctr
Little Italy
Grgtwn Marine Pk Bergen Bch Mill Basin
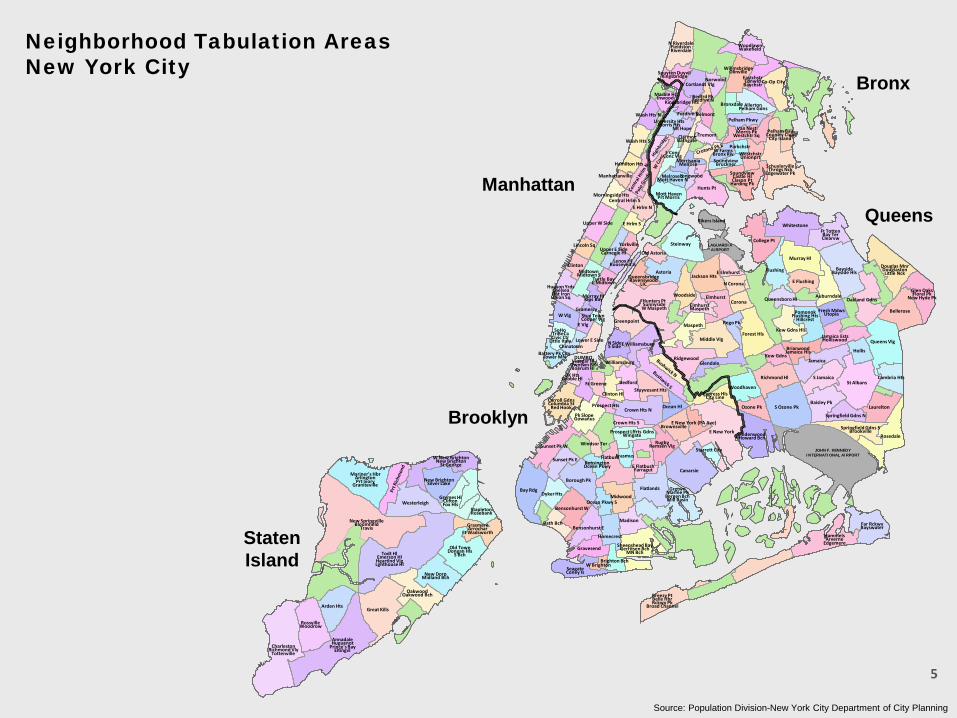
Neighborhood Tabulation Areas New York City
Bronx
Queens
Staten Island
Source: Population Division-New York City Department of City Planning
LAGUARDIA AIRPORT
JOHN F. KENNEDY INTERNATIONAL AIRPORT
Manhattan
Brooklyn
5
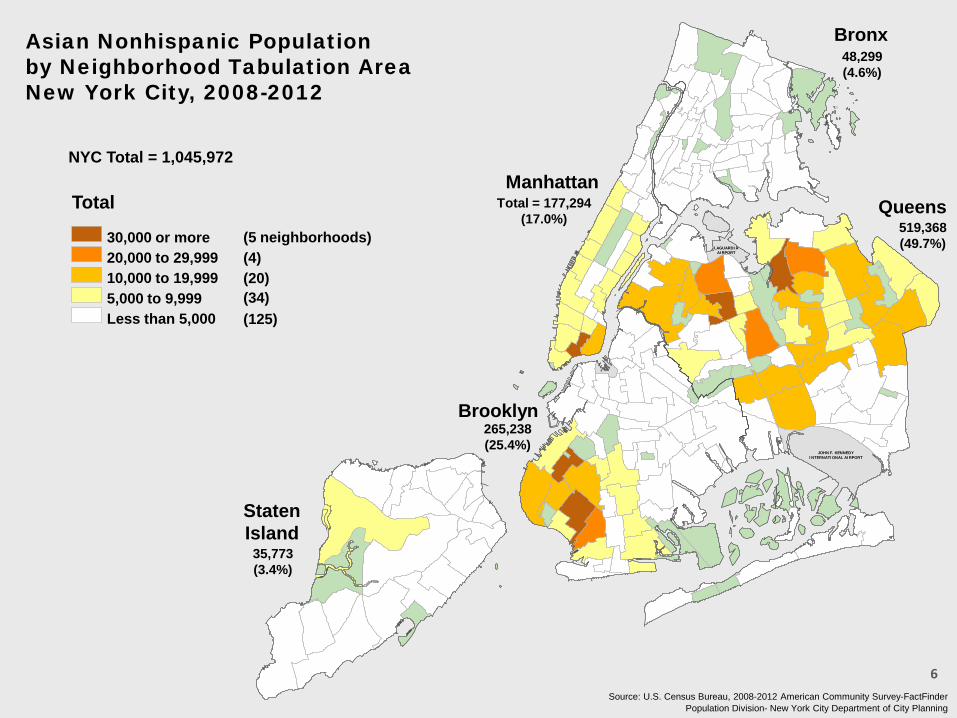
Asian Nonhispanic Population by Neighborhood Tabulation Area New York City, 2008-2012
Total
30,000 or more 20,000 to 29,999 10,000 to 19,999 5,000 to 9,999 Less than 5,000
(5 neighborhoods) (4) (20) (34) (125)
LAGUARDIA AIRPORT
JOHN F. KENNEDY INTERNATIONAL AIRPORT
Bronx
Queens
Staten Island
Manhattan
Brooklyn
Total = 177,294 (17.0%)
35,773 (3.4%)
48,299 (4.6%)
519,368 (49.7%)
265,238 (25.4%)
NYC Total = 1,045,972
Source: U.S. Census Bureau, 2008-2012 American Community Survey-FactFinder Population Division- New York City Department of City Planning
6

LAGUARDIA AIRPORT
JOHN F. KENNEDY INTERNATIONAL AIRPORT
Bronx
Queens
Staten Island
Manhattan
Brooklyn
Change = 23.7%
44.3%
25.3%
33.4%
43.9% Less than 5,000 Asian NH in 2000 and 2010
Percent Change
Gain of 40.0% or more 20.0% to 39.9% 10.0% to 19.9% 5.0% to 9.9% -4.9% to 4.9% -5.0% to -9.9% Loss of 10% or more
Percent Change in the Asian Nonhispanic Population by Neighborhood Tabulation Area New York City, 2000 to 2008-2012
NYC
2010 = 1,045,972 2000 = 780,229
Change = 34.1%
(30 neighborhoods) (19) (8) (1) (2) (1) (3)
Sources: U.S. Census Bureau: 2000 Census-Summary File 1; 2008-2012 American Community Survey-FactFinder Population Division-New York City Department of City Planning
7
Total
20,000 or more 10,000 to 19,999 5,000 to 9,999 2,500 to 4,999 Less than 2,500
(5 neighborhoods) (6) (14) (23) (140)
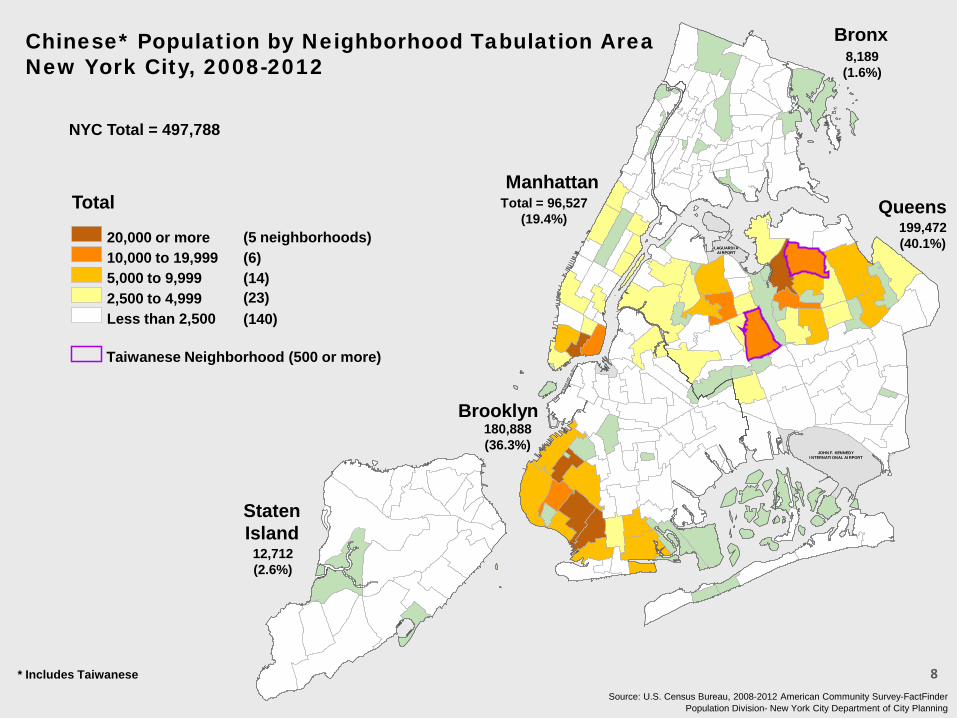
Chinese* Population by Neighborhood Tabulation Area New York City, 2008-2012
* Includes Taiwanese
Source: U.S. Census Bureau, 2008-2012 American Community Survey-FactFinder Population Division- New York City Department of City Planning
Bronx
Queens
Staten Island
Manhattan
Brooklyn
Total = 96,527 (19.4%)
12,712 (2.6%)
8,189 (1.6%)
199,472 (40.1%)
180,888 (36.3%)
Taiwanese Neighborhood (500 or more)
NYC Total = 497,788
LAGUARDIA AIRPORT
JOHN F. KENNEDY INTERNATIONAL AIRPORT
8

LAGUARDIA AIRPORT
JOHN F. KENNEDY INTERNATIONAL AIRPORT
Total
10,000 to 19,999 5,000 to 9,999 2,500 to 4,999 Less than 2,500
(2 neighborhoods) (7) (8) (171)
Asian Indian Population by Neighborhood Tabulation Area New York City, 2008-2012
Bronx
Queens
Staten Island
Manhattan
Brooklyn
Total = 24,364 (11.9%)
8,047 (3.9%)
13,741 (6.7%)
134,656 (65.7%)
24,290 (11.8%)
NYC Total = 205,098
Source: U.S. Census Bureau, 2008-2012 American Community Survey-FactFinder Population Division- New York City Department of City Planning
9

Korean Population by Neighborhood Tabulation Area New York City, 2008-2012
LAGUARDIA AIRPORT
JOHN F. KENNEDY INTERNATIONAL AIRPORT
Total
10,000 to 19,999 5,000 to 9,999 2,500 to 4,999 Less than 2,500
(1 neighborhood) (2) (7) (178)
Bronx
Queens
Staten Island
Manhattan
Brooklyn
Total = 18,860 (19.6%)
3,487 (3.6%)
2,829 (2.9%)
63,219 (65.6%)
7,940 (8.2%)
NYC Total = 96,335
Source: U.S. Census Bureau, 2008-2012 American Community Survey-FactFinder Population Division- New York City Department of City Planning
10

Filipino Population by Neighborhood Tabulation Area New York City, 2008-2012
LAGUARDIA AIRPORT
JOHN F. KENNEDY INTERNATIONAL AIRPORT
Total
5,000 to 9,999 2,500 to 4,999 Less than 2,500
(1 neighborhood) (1) (186)
Bronx
Queens
Staten Island
Manhattan
Brooklyn
Total = 11,081 (15.1%)
5,841 (8.0%)
5,614 (7.7%)
41,248 (56.4%)
9,389 (12.8%)
NYC Total = 73,173
Source: U.S. Census Bureau, 2008-2012 American Community Survey-FactFinder Population Division- New York City Department of City Planning
11
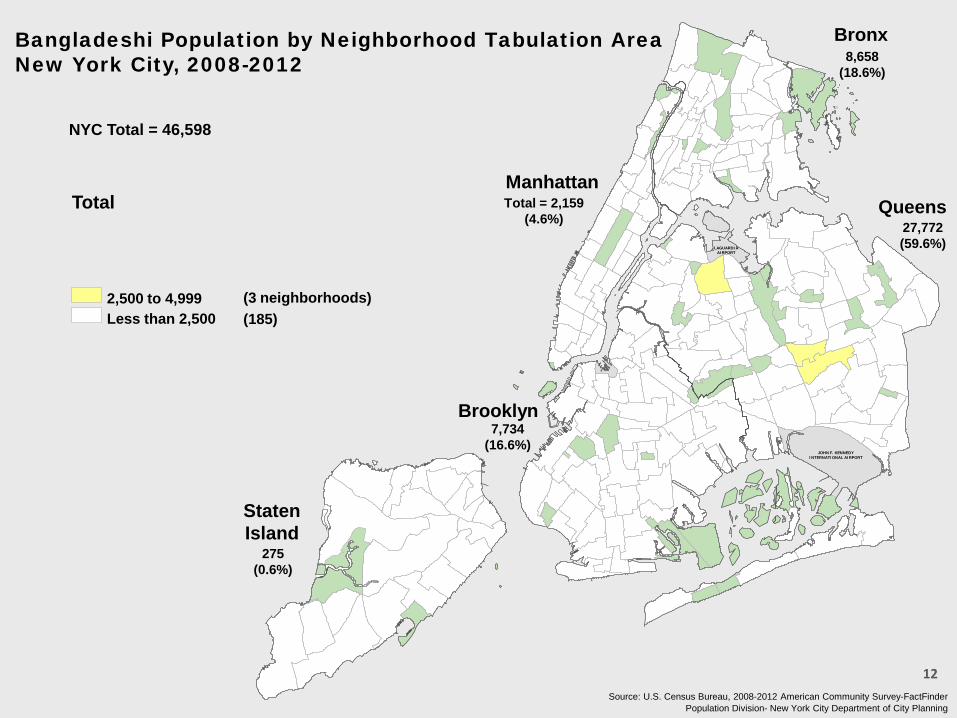
Bangladeshi Population by Neighborhood Tabulation Area New York City, 2008-2012
LAGUARDIA AIRPORT
JOHN F. KENNEDY INTERNATIONAL AIRPORT
Total
2,500 to 4,999 Less than 2,500
(3 neighborhoods) (185)
Bronx
Queens
Staten Island
Manhattan
Brooklyn
Total = 2,159 (4.6%)
275 (0.6%)
8,658 (18.6%)
27,772 (59.6%)
7,734 (16.6%)
NYC Total = 46,598
Source: U.S. Census Bureau, 2008-2012 American Community Survey-FactFinder Population Division- New York City Department of City Planning
12
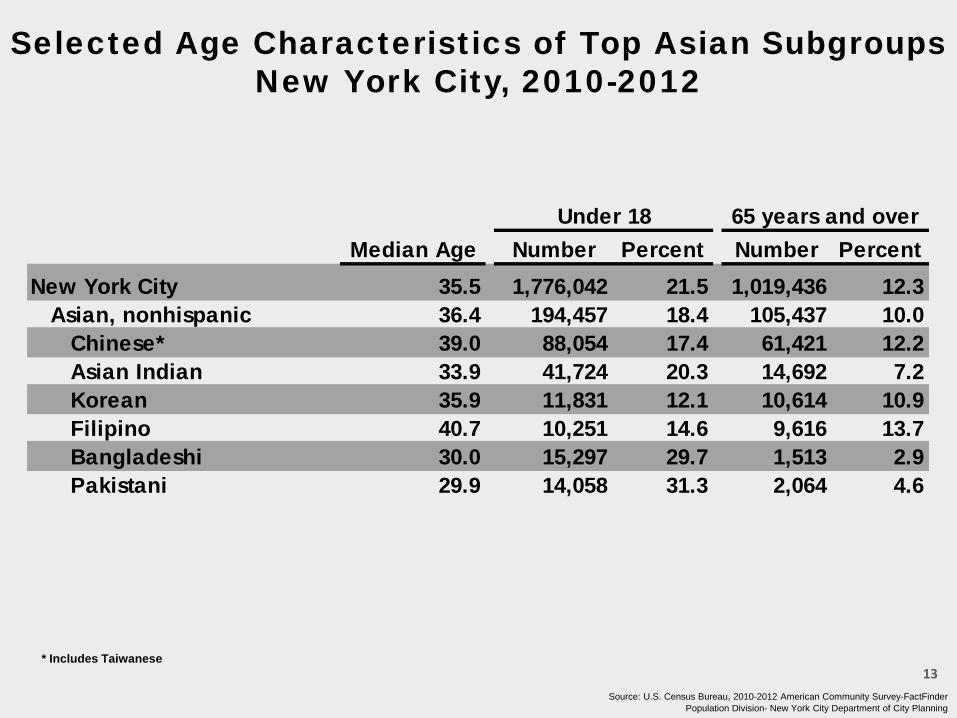
Selected Age Characteristics of Top Asian Subgroups New York City, 2010-2012
Number Percent Number PercentNew York City 35.5 1,776,042 21.5 1,019,436 12.3
Asian, nonhispanic 36.4 194,457 18.4 105,437 10.0Chinese* 39.0 88,054 17.4 61,421 12.2Asian Indian 33.9 41,724 20.3 14,692 7.2Korean 35.9 11,831 12.1 10,614 10.9Filipino 40.7 10,251 14.6 9,616 13.7Bangladeshi 30.0 15,297 29.7 1,513 2.9Pakistani 29.9 14,058 31.3 2,064 4.6
Median AgeUnder 18 65 years and over
* Includes Taiwanese
Source: U.S. Census Bureau, 2010-2012 American Community Survey-FactFinder Population Division- New York City Department of City Planning
13

Limited English Proficient Population by Language Spoken at Home
New York City, 2012
* Languages with at least 10,000 LEP persons 5 years and over ** Includes Chinese, Cantonese, Mandarin, and Formosan Source: U.S. Census Bureau, 2012 American Community Survey-Public Use Microdata Sample
Population Division-New York City Department of City Planning
Number Percent
Total Limited English Proficient 1,789,858 100.0
Top LEP Languages*Spanish 882,606 49.3Chinese** 305,734 17.1Russian 115,371 6.4French Creole 54,237 3.0Bengali 44,568 2.5Korean 43,992 2.5Italian 26,953 1.5Polish 24,270 1.4Arabic 23,799 1.3Yiddish 23,333 1.3French 22,424 1.3Urdu 21,622 1.2Albanian 17,294 1.0Tagalog 15,297 0.9Greek 14,135 0.8Panjabi 13,572 0.8Japanese 11,355 0.6Kru, Ibo, Yoruba 10,553 0.6
14

Median Household Income of Top Asian Subgroups New York City, 2010-2012
$50,711 $53,525
$47,582
$63,440
$54,301
$82,533
$33,909
$44,542
$0
$10,000
$20,000
$30,000
$40,000
$50,000
$60,000
$70,000
$80,000
NYC Asian, nonhispanic
Chinese* Asian Indian Korean Filipino Bangladeshi Pakistani
* Includes Taiwanese Source: U.S. Census Bureau, 2010-2012 American Community Survey-FactFinder Population Division- New York City Department of City Planning
15

Median Income and Poverty Rate of Top Asian Subgroups New York City, 2010-2012
20.8 20.4 21.1
18.4 19.3
8.9
35.1
27.3
0.0
5.0
10.0
15.0
20.0
25.0
30.0
35.0
40.0
$0
$10,000
$20,000
$30,000
$40,000
$50,000
$60,000
$70,000
$80,000
NYC Asian, nonhispanic
Chinese* Asian Indian Korean Filipino Bangladeshi Pakistani
Median Household Income Poverty Rate* Includes Taiwanese Source: U.S. Census Bureau, 2010-2012 American Community Survey-FactFinder
Population Division- New York City Department of City Planning
16

Total and Percent Foreign-born Race/Hispanic Groups
New York City, 2010-2012
Source: U.S. Census Bureau, 2010-2012 American Community Survey-FactFinder Population Division- New York City Department of City Planning
Total Percent Population Foreign-born
New York City 8,265,445 37.3 White, nonhispanic 2,727,555 22.8 Black, nonhispanic 1,883,891 32.8 Hispanic 2,377,486 41.3
17

Total and Percent Foreign-born Race/Hispanic and Top Asian Groups
New York City, 2010-2012
* Includes Taiwanese
Total Percent Population Foreign-born
New York City 8,265,445 37.3 White, nonhispanic 2,727,555 22.8 Black, nonhispanic 1,883,891 32.8 Hispanic 2,377,486 41.3 Asian, nonhispanic 1,057,594 72.9
Chinese* 505,053 73.0 Asian Indian 205,075 71.8 Korean 97,474 74.4 Filipino 70,263 73.1 Bangladeshi 51,448 74.6 Pakistani 44,902 70.6
Source: U.S. Census Bureau, 2010-2012 American Community Survey-FactFinder Population Division- New York City Department of City Planning
18

% Limited % High School % CollegeTotal English Graduate Graduate
Foreign-born Proficient1 or Higher or Higher
New York City 3,083,715 23.2 79.6 34.0 Total Asian, nonhispanic 770,701 48.0 74.1 40.6
Chinese* 368,883 62.0 63.0 31.4 Asian Indian 147,227 23.4 81.1 45.3 Korean 72,489 49.2 91.3 53.8 Filipino 55,567 27.8 94.1 66.8 Bangladeshi 38,357 53.4 78.4 35.7 Pakistani 31,689 42.8 75.7 36.2
Educational Attainment2
Selected Social Characteristics of Foreign-born Asian Subgroups New York City, 2010-2012
2 Persons 25 years and over
1 Persons 5 years and over * Includes Taiwanese
Source: U.S. Census Bureau, 2010-2012 American Community Survey-FactFinder Population Division- New York City Department of City Planning
19

Data Links
• DCP Population Division Web site: www.nyc.gov/population
• New York City Census FactFinder: http://gis.nyc.gov/dcp/pa/address.jsp
• Census Bureau Web site: www.census.gov
20