New User Quick Start Tutorial - Web Security, Email Security, Data
48
v7.7 New User Quick Start Tutorial Websense ® Web Security Solutions
Transcript of New User Quick Start Tutorial - Web Security, Email Security, Data
v7.7
New User Quick Start TutorialWebsense® Web Security Solut ions
©1996–2012, Websense Inc.All rights reserved.10240 Sorrento Valley Rd., San Diego, CA 92121, USAPublished 2012Printed in the United States and Ireland
The products and/or methods of use described in this document are covered by U.S. Patent Numbers 5,983,270; 6,606,659; 6,947,985; 7,185,015; 7,194,464 and RE40,187 and other patents pending.
This document may not, in whole or in part, be copied, photocopied, reproduced, translated, or reduced to any electronic medium or machine-readable form without prior consent in writing from Websense Inc.Every effort has been made to ensure the accuracy of this manual. However, Websense Inc., makes no warranties with respect to this documentation and disclaims any implied warranties of merchantability and fitness for a particular purpose. Websense Inc., shall not be liable for any error or for incidental or consequential damages in connection with the furnishing, performance, or use of this manual or the examples herein. The information in this documentation is subject to change without notice.
TrademarksWebsense is a registered trademark of Websense, Inc., in the United States and certain international markets. Websense has numerous other unregistered trademarks in the United States and internationally. All other trademarks are the property of their respective owners.Microsoft, Windows, Windows NT, Windows Server, and Active Directory are either registered trademarks or trademarks of Microsoft Corporation in the United States and/or other countries.Sun, Solaris, UltraSPARC, Sun Java System, and all Sun Java System based trademarks and logos are trademarks or registered trademarks of Sun Microsystems, Inc., in the United States and other countries.Netscape is a registered trademark of Netscape Communications Corporation in the U.S. and other countries. Netscape Navigator and Netscape Communicator are also trademarks of Netscape Communications Corporation and may be registered outside the U.S.eDirectory and Novell Directory Services are a registered trademarks of Novell, Inc., in the U.S and other countries.Adobe, Acrobat, and Acrobat Reader are either registered trademarks or trademarks of Adobe Systems Incorporated in the United States and/or other countries.Pentium is a registered trademark of Intel Corporation.Red Hat is a registered trademark of Red Hat, Inc., in the United States and other countries. Linux is a trademark of Linus Torvalds, in the United States and other countries.This product includes software distributed by the Apache Software Foundation (http://www.apache.org).Copyright (c) 2000. The Apache Software Foundation. All rights reserved.Other product names mentioned in this manual may be trademarks or registered trademarks of their respective companies and are the sole property of their respective manufacturers.
Contents
Topic 1 Contents. . . . . . . . . . . . . . . . . . . . . . . . . . . . . . . . . . . . . . . . . . . . . . . . . . 3
Topic 2 Welcome. . . . . . . . . . . . . . . . . . . . . . . . . . . . . . . . . . . . . . . . . . . . . . . . . . 5
Super Administrator . . . . . . . . . . . . . . . . . . . . . . . . . . . . . . . . . . . . . . . . . 5
Delegated Administrator . . . . . . . . . . . . . . . . . . . . . . . . . . . . . . . . . . . . . 6
Reporting Administrator. . . . . . . . . . . . . . . . . . . . . . . . . . . . . . . . . . . . . . 7
Topic 3 Navigation Tips . . . . . . . . . . . . . . . . . . . . . . . . . . . . . . . . . . . . . . . . . . . . 9
Lesson 1: Using TRITON - Web Security . . . . . . . . . . . . . . . . . . . . . . . . 9
Topic 4 Initial Setup. . . . . . . . . . . . . . . . . . . . . . . . . . . . . . . . . . . . . . . . . . . . . . 15
Lesson 3: Downloading the Websense Master Database . . . . . . . . . . . . 15
Topic 5 Policy Management . . . . . . . . . . . . . . . . . . . . . . . . . . . . . . . . . . . . . . . 19
Lesson 4: The Default policy . . . . . . . . . . . . . . . . . . . . . . . . . . . . . . . . . 19
Lesson 5: Working with clients . . . . . . . . . . . . . . . . . . . . . . . . . . . . . . . 21
Lesson 6: Using the sample policies . . . . . . . . . . . . . . . . . . . . . . . . . . . 22
Lesson 7: Filtering Web sites by category . . . . . . . . . . . . . . . . . . . . . . . 25
Lesson 8: Creating custom policies . . . . . . . . . . . . . . . . . . . . . . . . . . . . 26
Topic 6 Reporting. . . . . . . . . . . . . . . . . . . . . . . . . . . . . . . . . . . . . . . . . . . . . . . . 29
Lesson 10: Presentation Reports . . . . . . . . . . . . . . . . . . . . . . . . . . . . . . 34
Lesson 11: Investigative Reports . . . . . . . . . . . . . . . . . . . . . . . . . . . . . . 37
Investigative reports reference . . . . . . . . . . . . . . . . . . . . . . . . . . . . . 39
Lesson 12: Real-Time Monitor . . . . . . . . . . . . . . . . . . . . . . . . . . . . . . . 41
Lesson 13: Improving Websense software. . . . . . . . . . . . . . . . . . . . . . . 43
Topic 7 Where Do I Go Next? . . . . . . . . . . . . . . . . . . . . . . . . . . . . . . . . . . . . . . 47
New User Quick Start 3

4 Websense Web Security Solutions

1
Welcome
Welcome to Websense® Web Security solutions.
Use this Quick Start tutorial to learn the basics of Internet policy management and reporting. The tutorial is made up of a series of short lessons, divided into 4 sections:
Each lesson requires between 5 and 10 minutes to complete.
To get started, first click on your role below.
If your organization does not use or has not yet configured delegated administration roles, click Super Administrator.
If you manage policies for a specific set of clients, click Delegated Administrator.
If you have permission to run reports on managed clients, but the clients’ policies are managed in another role, click Reporting Administrator.
Super Administrator
If you are a Super Administrator (or logging on as admin), all of the tutorial’s lessons apply:
Use the Navigation Tips section to become familiar with the TRITON - Web Security interface. This section shows you how to configure Internet filtering and reporting, and identify methods of obtaining assistance, when needed.
Lesson 1: Using TRITON - Web Security, page 9
Initial Setup Policy Management
Navigation Tips Reporting
Super Administrator (including admin)
Delegated Administrator
Reporting Administrator
New User Quick Start 5
Welcome
Lesson 2: Accessing Help, page 14
Use the Initial Setup section to verify that the Master Database is downloaded.
If another Super Administrator has already configured your Websense software, skip to the next section.
Use the Policy Management section to learn to create and modify filters and policies, and to apply policies to clients.
Lesson 4: The Default policy, page 19
Lesson 5: Working with clients, page 21
Lesson 6: Using the sample policies, page 22
Lesson 7: Filtering Web sites by category, page 25
Lesson 8: Creating custom policies, page 26
Use the Reporting section to understand the available reporting options, and to enable a reporting option used to continually improve the Websense Master Database.
Lesson 9: Dashboard reports, page 30
Lesson 10: Presentation Reports, page 34
Lesson 11: Investigative Reports, page 37
Lesson 12: Real-Time Monitor, page 41
Lesson 13: Improving Websense software, page 43
At the end of the tutorial, Where Do I Go Next?, page 47, provides pointers to additional topics and resources, including the Websense Knowledge Base and online video tutorials.
To find this tutorial again later, click the Help button from any page in TRITON - Web Security and expand the Getting Started option.
Delegated Administrator
If you are a delegated administrator and can both create policies for clients and report on client activities, all of the following lessons apply.
If you are a delegated administrator with policy permissions only, lessons 1-2 and 4-8 apply.
If you are a delegated administrator with permission to report on some or all clients in your organization, lessons 1-2 and 9-12 apply.
Use the Navigation Tips section to become familiar with the TRITON - Web Security interface. This section shows you how to configure Websense filtering and reporting, and identify methods of obtaining assistance, when needed.
Lesson 1: Using TRITON - Web Security, page 9
Lesson 2: Accessing Help, page 14
6 Websense Web Security Solutions

Welcome
Use the Policy Management section to learn to create and modify filters and policies, and to apply filtering policies to clients.
Lesson 4: The Default policy, page 19
Lesson 5: Working with clients, page 21
Lesson 6: Using the sample policies, page 22
Lesson 7: Filtering Web sites by category, page 25
Lesson 8: Creating custom policies, page 26
Use the Reporting section to understand the available Websense reporting options. (The final lesson in this section, Lesson 13, applies only to Super Administrators.)
Lesson 9: Dashboard reports, page 30
Lesson 10: Presentation Reports, page 34
Lesson 11: Investigative Reports, page 37
Lesson 12: Real-Time Monitor, page 41
At the end of the tutorial, Where Do I Go Next?, page 47, provides pointers to additional topics and resources, including the Websense Knowledge Base and online video tutorials.
To find this tutorial again later, click the Help button from any page in TRITON - Web Security and expand the Getting Started option.
Reporting Administrator
If you are an administrator in one or more investigative reporting roles, with permission to report on managed clients whose policies are managed in other roles, the following lessons apply:
Lesson 1: Using TRITON - Web Security, page 9
Lesson 2: Accessing Help, page 14
Lesson 11: Investigative Reports, page 37
To find this tutorial again later, click the Help button from any page in TRITON - Web Security and expand the Getting Started option.
New User Quick Start 7

Welcome
8 Websense Web Security Solutions

2
Navigation TipsThe TRITON™ Unified Security Center is the administrative interface to Websense software. It provides access to configuration settings, filtering tools, and reporting features.
This section includes 2 lessons to help you get around within Websense software:
Lesson 1: Using TRITON - Web Security introduces the Web Security module of the TRITON Unified Security Center, emphasizing useful tools and shortcuts.
Lesson 2: Accessing Help provides an overview of the Help resources available from within TRITON - Web Security.
Lesson 1: Using TRITON - Web Security
The TRITON Unified Security Center (TRITON console) is the interface to the configuration, administration, and reporting functions of your Websense software. An administrator can be granted access to one or more TRITON console modules (Web Security, Data Security, and Email Security), and given specific permissions within each module.
The default administrative account for the TRITON console is admin. The initial password for this account is set during installation. The admin account has full access to all TRITON modules. In the Web Security module, full access is equivalent to unconditional Super Administrator permissions.
If you are logged on as a delegated administrator with more limited permissions, some features (indicated below) may not be visible.
Discover how to access the Web Security features and functions of your Websense software through the TRITON Unified Security Center.
New User Quick Start 9

Navigation Tips
The Web Security module of the TRITON console (TRITON - Web Security) is divided into 4 main areas:
Section 1: The banner, TRITON toolbar, and Web Security toolbar:
The TRITON - Web Security features that you see when you log on are dependent on your administrative role. The banner displays the user name for the account used to log on. If your organization does not use delegated administration, the account name is always admin, and has full access to all TRITON - Web Security functions.
The banner also includes a Log Off button, for when you’re ready to end the session.
Just below the banner, the TRITON toolbar contains a tab for each TRITON console module. The current module is highlighted in yellow, and other available modules are shown in blue. Unavailable modules appear in gray. The TRITON toolbar also includes the following buttons:
Appliances, used to launch Appliance Manager for any V-Series appliances associated with the current Policy Server.
TRITON Settings, used to perform configuration tasks that affect all of the installed TRITON modules, like creating administrator accounts.
Help, used to access context-sensitive instructions and troubleshooting materials, tutorials, and online Support tools. More information is available in Lesson 2: Accessing Help, page 14.
Across the top of the screen:
The TRITON banner shows information about your logon session.
The TRITON toolbar makes it easy to switch between modules, access TRITON settings, launch Appliance Manager for any registered V-Series appliances, and get Help.
The Web Security toolbar lets you switch between Policy Servers, change administrative roles, and review and save changes.
The left navigation pane is used to access status, reporting, and policy management features (Main tab), as well as system administration tasks (Settings tab).
The right shortcut pane is used to jump to common administrative tasks and access quick lookup tools.
The content pane appears in the center of the TRITON console. The selections that you make in the left navigation pane or right shortcut pane determine what appears in the content pane.
10 Websense Web Security Solutions
Navigation Tips
Under the module tray, the Web Security toolbar provides information and access to features that apply to all pages in TRITON - Web Security:
The current Policy Server IP address.
When you log on to TRITON - Web Security, you connect to a Websense software component called Policy Server. By connecting to a specific Policy Server, you determine which segment of your Websense software deployment to manage.
Your current delegated administration Role.
When delegated administration roles are defined, administrators who manage multiple roles can use this list to change between roles. Super Administrators can use the list to switch to any role that has been defined.
A View Pending Changes button that is enabled when changes have been cached, but not changed.
Use this button to review a summary of cached changes before saving them, or to discard all pending changes.
A Save and Deploy button, whose color indicates whether there are cached changes waiting to be saved
Each time you perform a task in TRITON - Web Security, and then click OK, your changes are cached. You must click Save and Deploy to save and implement the changes.
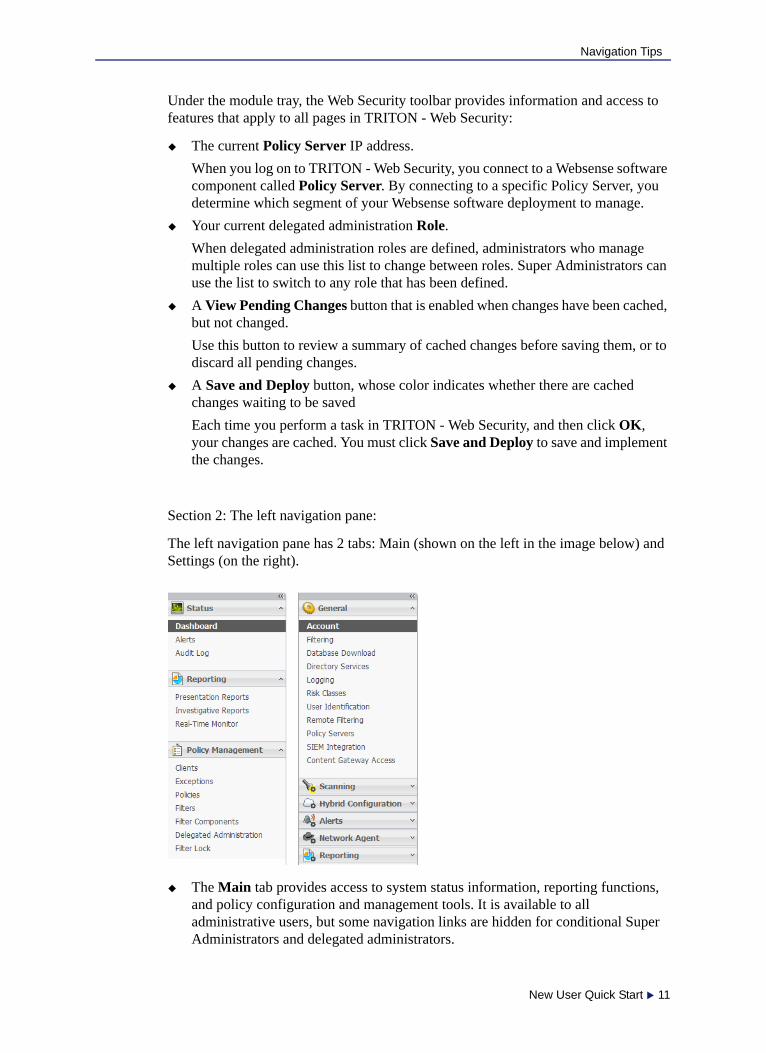
Section 2: The left navigation pane:
The left navigation pane has 2 tabs: Main (shown on the left in the image below) and Settings (on the right).
The Main tab provides access to system status information, reporting functions, and policy configuration and management tools. It is available to all administrative users, but some navigation links are hidden for conditional Super Administrators and delegated administrators.
New User Quick Start 11

Navigation Tips
The Settings tab provides access to Websense account management functions, as well as global and local system administration tasks. It is hidden from some administrators, and shows different options based on the current administrator’s permissions.
To minimize the left navigation pane, expanding the amount of space available for the content pane, click the double left arrow icon (<<) above the Status group. When the left navigation pane is minimized, it displays a small icon for each section of the current tab. Hover the mouse over an icon to display a menu of features in that group.
Section 3: The right shortcut pane:
For the default admin account and unconditional Super Administrators, the right shortcut pane includes all options in the sections described below. Some options are hidden for other administrators.
Common Tasks provides shortcuts to frequently-performed administrative tasks.
Click Run Report to jump to the Presentation Reports page, and then browse the report catalog to start creating a report.
Click Create Policy to jump to the Policies page, and then click Add to create a policy.
Click Create Exception to jump to the Exceptions > Add Exception page to permit or block one or more URLs for all clients (global exception), all clients in a delegated administration role, or one or more individual clients.
Click Recategorize URL to jump to the Filter Components > Edit Categories page, and then select a new category for the URL that you want to recategorize.
Click Suggest New Category to open the MyWebsense portal. When you log on to MyWebsense, you are taken to the Site Lookup tool. First identify the site’s current category, and then suggest a new category.
The Toolbox contains quick lookup tools that you can use to verify your filtering setup.
Click URL Category to quickly determine how a URL is categorized.
12 Websense Web Security Solutions

Navigation Tips
Click Check Policy to find out which policy is currently being applied to a user.
Click Test Filtering to see how a specific URL is currently being filtered (permitted, blocked, etc.) for a user.
Click URL Access to create an investigative report showing whether a site has been accessed from your network within the past 14 days.
Click Investigate User to create an investigative report showing which sites a user has visited in the past 14 days.
Section 4: The content pane:
The content pane appears in the middle of the TRITON Unified Security Center. When you first open TRITON - Web Security, the Web Security Dashboard appears in the content pane, showing information about advanced malware threat activity detected in your network.
When you click a link in the left navigation pane or the right shortcut pane, the content pane changes to display options appropriate to your selection. Most pages on which you can make changes include an OK and a Cancel button. Click OK to cache all changes on the page, or click Cancel to abandon all changes on the page. To save cached changes, click Save and Deploy in the Web Security toolbar.
Most of the remaining lessons in this Quick Start demonstrate how to use options in the content pane.
Continue with Lesson 2: Accessing Help, page 14.
ImportantAvoid double- or triple-clicking the OK and Save and Deploy buttons. Multiple, rapid clicks to the same button can cause browser display problems that can be solved only by exiting and reopening the browser.
New User Quick Start 13

Navigation Tips
Lesson 2: Accessing Help
To help you get the most from your Websense software, TRITON - Web Security includes 5 types of user assistance:
You have completed the Navigation Tips section of this Quick Start. Continue with Initial Setup.
Learn how to get information and assistance when you have questions about Websense software.
1 An icon accompanies many important product features. Position your mouse over this icon for a brief explanation of the feature.
2 For many tasks, help text appears directly on the page, providing usage guidelines or other pointers for using a tool or field.
3 The button provides access to detailed information about each page in TRITON - Web Security, often including step-by-step usage instructions. Click Help, then select Explain This Page.
4 To browse the TRITON - Web Security Help system, click Help, and then select Contents. The Help system is displayed in a separate tab or browser window.
For a printer-friendly version of the Help system in PDF format, click the icon in the Help toolbar.
5 If you are unable to find the information you need within TRITON - Web Security, the Help menu provides a link to the Websense Support Portal. The Support Portal provides access to all product, technical, and customer support resources, including documentation, knowledge base articles, and forums.
14 Websense Web Security Solutions
3
Initial SetupThis section includes 1 lesson:
Lesson 3: Downloading the Websense Master Database explains the role of the Master Database in Websense filtering, and provides instructions for configuring and initiating database downloads.
If you have already downloaded the Master Database, and set up a download schedule, you can skip this lesson.
When you are finished with this section, continue with Policy Management.
Lesson 3: Downloading the Websense Master Database
Before this tutorial can be completed, an administrator must enter the subscription key used to activate your Web security solution. Entering a subscription key:
1. Activates a partial version of the Master Database installed with all Websense Web Security solutions.
2. Activates your Websense software.
3. Initiates the download of the Websense Master Database, which contains up-to-date category and protocol definitions, used to classify Web sites and Internet applications.
Exercise 1: Enter your subscription key and configure database download settings:
1. Log on to the TRITON Unified Security Center
2. If the subscription key has not been entered, a dialog box prompts you to enter the key. Enter the key and click OK. You are taken to the Status > Dashboard page.
Otherwise, skip to step 3.
3. Click the Settings tab at the top of the left navigation pane, and then go to the Account page (selected by default when you switch to the Settings tab). Information about your Websense subscription appears near the top of the page.
Use this lesson to learn about subscriptions and the Websense Master Database. The lesson includes instructions for entering a subscription key and creating a database download schedule.
New User Quick Start 15

Initial Setup
Complete subscription information is not displayed until the first database download is complete.
4. Click Database Download in the left navigation pane. Master Database configuration information appears in the content pane.
5. Use the Download days check boxes and Download timeframe drop-down lists to establish a schedule for downloading the Master Database.
By default, Websense software is configured to attempt a download every day, some time between 9:00 p.m. and 6:00 a.m. Daily downloads ensure that you are always filtering with the most current information. Database downloads should occur at least once a week.
6. If your network requires authentication to a proxy server or firewall, do the following. Otherwise, skip to step 7.
a. In the Authentication area at the bottom of the screen, check Use Authentication.
b. Enter the User name and Password required by the proxy server or firewall.
You may also need to configure the proxy server or firewall to accept clear text or basic authentication.
7. If your network requires that browsers use an upstream proxy server to reach the Internet, do the following. Otherwise, skip to step 8.
a. In the Proxy Server area, check Use proxy server or firewall.
b. Enter the name or IP address of the proxy server or firewall machine in the Server IP or name field.
c. Use the Port field to enter the port used by the proxy server or firewall (the default is 8080).
8. Click OK to cache your settings, and then click Save and Deploy in the toolbar to implement them.
After you enter a subscription key, the Master Database begins to download in the background.
Exercise 2: Verify Master Database download status
To view database download status, or to manually initiate a download at any time:
1. Select the Main tab of the left navigation pane, and then go to Status > Dashboard and select the System tab.
The Health Alert Summary (displayed by default at the top of the System dashboard) provides general download status information.
NoteIf you do not download the Master Database for 14 days, filtering stops.
If no download days are selected on the Database Download page, Websense software attempts to download the database every 7 days.
16 Websense Web Security Solutions
Initial Setup
2. Click Database Download (in the toolbar at the top of the page) for detailed download information.
By default, the Database Download page displays a summary of all Filtering Service machines, listing the Master Database version currently in use on each, as well as the status of the last download.
You can manually initiate a database download from this page by clicking the Update button for a Filtering Service instance. If a download attempt is in progress, the button is disabled.
3. Click a Filtering Service IP address in the list on the left to see detailed download information, including progress information for ongoing downloads.
4. Click Close to return to the Dashboard page. Closing the Database Download page does not interfere with any updates that may be in progress.
When a database update adds or removes Websense-defined categories and protocols, you must log off of TRITON - Web Security and log on again to see the updated category and protocol lists. This protective measure ensures that database updates do not interfere with any policy updates that administrators may be making.
A database update that adds or removes categories and protocols is likely to occur:
When you first enter your subscription key and download the Master Database.
After you have purchased optional categories or protocols, or moved from Websense Web Filter to Websense Web Security or Web Security Gateway (Anywhere).
Typically, category and protocol additions or removals are rare, and generally publicized several weeks before the update takes place. If you have configured Websense software to notify administrators of systems alerts, you will also receive notification when new categories and protocols have been added or removed.
You have completed the Initial Setup section of this Quick Start tutorial. Continue with Policy Management.
ImportantIf you have Websense Web Security Gateway Anywhere, after your first successful Master Database download is complete, log off of TRITON - Web Security and log back on. This allows several Settings pages available only with Websense Web Security Gateway Anywhere to be displayed.
New User Quick Start 17

Initial Setup
18 Websense Web Security Solutions

4
Policy ManagementThis section includes 5 lessons:
Lesson 4: The Default policy introduces the policy that acts as a safety net, governing Internet access for any client not explicitly assigned another policy.
Lesson 5: Working with clients describes how to add users, groups, and computers as filtering clients in TRITON - Web Security.
Lesson 6: Using the sample policies reviews the predefined policies included with your Websense software, and takes you through the process of editing policies.
Lesson 7: Filtering Web sites by category introduces the concept of category filters and guides you through the process of creating your own, custom filters.
Lesson 8: Creating custom policies shows how you can build your own policies and apply them to clients.
Lesson 4: The Default policy
Websense Web security solutions use policies to determine how and when Internet requests are filtered for users, groups, computers, and networks. Each policy includes information about which Web sites and Internet communication protocols are blocked or permitted, and the days and times to enforce those rules.
Your Websense software includes a Default policy, in effect 24 hours a day, 7 days a week. Initially, this policy monitors Internet traffic without blocking. When you first install your Websense software, the Default policy applies to everyone on the network.
Learn about the policy that serves as a filtering safety net, governing Internet access for any user to whom no other policy applies.
NoteIf your organization uses delegated administration, each role has its own Default policy. A role’s Default policy is enforced for any clients in the role who do not have another policy assigned to them.
New User Quick Start 19

Policy Management
Exercise: Become familiar with the Default policy:
1. In TRITON - Web Security, select the Main tab of the left navigation pane, then select Policies, under Policy Management.
A list of existing policies appears.
2. Click Default to view policy details on the Edit Policy page.
3. Examine the area at the top of the content pane.
The policy name appears, followed by a short description of what the policy is intended to do.
A summary of the clients specifically governed by this policy is shown. Note that even if no clients are listed here, the Default policy applies to any client not currently governed by another policy.
4. Examine the Schedule box.
After a new installation, the Start, End, and Days columns show that the Default policy is in effect 24 hours a day, 7 days a week.
The Category / Limited Access Filter column shows that Monitor Only category filtering is in effect.
A category filter is a list of categories and the actions (such as Permit or Block) assigned to them. The category filter enforced by a policy determines how user requests for Web sites are treated.
The alternative to a category filter is a limited access filter, a list of specific URLs that users can access. When a limited access filter is enforced by a policy, users governed by the policy can access only sites on the list.
The Protocol Filter column shows that Monitor Only protocol filtering is in effect.
A protocol filter is a list of protocols (usually non-HTTP protocols) and the actions (such as Permit or Block) assigned to them. When Network Agent is installed, the protocol filter enforced by a policy determines how user attempts to access specific protocols (such as those used for instant messaging or peer-to-peer file sharing) are treated.
5. Two columns appear beneath the policy schedule. Examine the Category Filter column.
The name of the current category filter appears next to the column description.
You can scroll through the list to see which categories are permitted and blocked. A legend at the bottom of the page explains the icons that appear next to each category.
You will learn how to create and edit category filters in a later lesson.
In the lessons that follow, you will learn how to work with policies and their building blocks. You can then use what you learn to edit the Default policy to best suit the needs of your organization.
Continue with Lesson 5: Working with clients, page 21.
20 Websense Web Security Solutions

Policy Management
Lesson 5: Working with clients
Filtering policies are applied to clients: users, groups, and domains in your directory service, or computers and network ranges in your network.
A computer is the most basic type of client. A computer is a machine on the network, identified by an IP address.
A network is a group of computers, identified by a contiguous IP address range.
A directory client can be a user, group, or OU (organizational unit) defined in your directory service. More information about directory services can be found in the “Clients” section of the TRITON - Web Security Help.
Exercise 1: Add a computer client:
1. In TRITON - Web Security, select Clients (under Policy Management) in the left navigation pane.
2. Under the Clients tree, click Add. The Add Clients page appears.
3. Enter the IP address of a computer that you want to add as a client, and then click the right arrow (>) button to add the client to the Selected list.
If you are a delegated administrator, you can only add IP addresses that are assigned to your role as a managed client. Go to Policy Management > Delegated Administration, and then click your role name to see a list of managed clients for your role.
4. Click OK to cache your change and return to the Clients page.
5. Expand the Computers node in the Clients tree. The IP address that you just added appears in the list.
Information about the settings that apply to the new client appear to the right of the IP address. The Policy column shows that this client is currently governed by the Default policy.
6. Click Save and Deploy to implement your changes.
Exercise 2: Add a directory client:
If your Websense software has been configured to retrieve information from a supported directory service, you can apply filtering policies to users, groups, and OUs.
Information about configuring Websense software to communicate with a directory service can be found in the “Clients” section of the TRITON - Web Security Help.
Once configuration is complete, you can add directory clients through the same page used to add computer and network clients:
Learn about user, computer, and network clients, and then practice adding clients to TRITON - Web Security.
New User Quick Start 21
Policy Management
1. In TRITON - Web Security, select Clients (under Policy Management) in the left navigation pane.
2. Under the Clients tree, click Add. The Add Clients page appears.
3. To locate an entry in your directory service, do either of the following:
Browse the Directory tree.
Enter all or part of a user, group, or domain name in the search field, if available, and then click Go.
4. Select a user, group, or domain to add as a client, and then click the right arrow (>) to add the client to the Selected list.
If you are a delegated administrator, you can only add users that are assigned to your role as a managed client. Go to Policy Management > Delegated Administration, and then click your role name to see a list of managed clients for your role.
5. When you are finished adding users, click OK to cache your changes and return to the Clients page.
6. Click Save and Deploy to implement your changes.
Expand the Directory node of the client tree to see a list of current user, group, domain, and organizational unit clients.
In the next lesson, you will work with a sample policy to change the way that clients’ Internet activity is filtered.
Continue with Lesson 6: Using the sample policies, page 22.
Lesson 6: Using the sample policies
In addition to the Default policy, your Websense software includes two sample policies that you can use to learn more about filtering Internet activity.
The Unrestricted policy enforces the Permit All category and protocol filters, 24 hours a day and 7 days a week. Apply this policy to any members of your organization whose Internet activity should never be restricted.
The Example - Standard User policy provides an example of how one policy can apply different filters at different times.
Use a sample policy to learn more about how to apply different filters to users at different times of day and on different days of the week.
NoteIf you are a delegated administrator and do not see the Example - Standard User policy, ask a Super Administrator to copy the sample policy to your role.
22 Websense Web Security Solutions
Policy Management
Exercise 1: Apply the sample policy to clients:
1. In TRITON - Web Security, select Policies in the Policy Management section of the left navigation pane.
A list of policies and descriptions appears in the content pane.
2. Click Example - Standard User to view the sample policy.
3. Under the policy name and description at the top of the page, check to see if the policy is applied to any Clients.
When you make changes to a policy, any clients governed by the policy are affected.
4. Examine the Schedule portion of the policy.
This policy includes multiple lines. Each line corresponds with a block of time. Add multiple time blocks to a policy to enforce different filters and different times. In the sample policy:
The Default category and protocol filters are enforced from 8:00 a.m. to 5:00 p.m., Monday through Friday.
The Basic category filter and Basic Security protocol filter are enforced from 5:00 p.m. to 8:00 a.m. Monday through Friday. Note that when a filtering period spans midnight, you must create 2 time blocks: one ending at 24:00 (midnight) and another starting at 00:00 (midnight).
The Monitor Only category and protocol filters are enforced on Saturday and Sunday, permitting access to all sites.
5. Select each time block in turn. The category and protocol filter enforced during that period are displayed in the bottom portion of the screen.
When a time block is selected, you can edit the filters enforced during that period on the Edit Policies page.
6. To assign the sample policy to a client, click Apply to Clients in the toolbar at the top of the screen.
7. Browse the Clients tree to identify a client to be governed by the sample policy. Pick a client added in Lesson 6 that you can use to test the effects of this change.
8. Mark the check box next to the client name or IP address, and then click OK to cache your change and return to the Edit Policy page.
9. Click Save and Deploy to implement your change.
The selected client is now filtered by the Example - Standard User policy.
New User Quick Start 23
Policy Management
Exercise 2: Verify filtering behavior manually:
One way to judge the effects of applying a policy to a client is to access the client machine or log on using the client’s network credentials and use a browser to see which sites are permitted and blocked.
1. If you applied the sample policy to a computer client in the previous exercise, log on to the machine filtered by the sample policy.
If you applied the sample policy to a user or group client, log on as the affected user.
2. Open a browser window and navigate to www.ucsd.edu.
This site is part of the Educational Institutions category, which is permitted by the Default, Basic, and Monitor Only category filters.
3. Browse to www.calottery.com.
This site belongs to the Gambling category. Both the Basic and Default category filters block this category. If you are performing this exercise on any day from Monday through Friday, a Websense block page appears.
4. Browse to www.amazon.com.
This site belongs to the Shopping category. If the Default category filter is in effect, you are prompted to use quota time to access the site. (More information about quota time appears in the next lesson.) If the Basic category filter is in effect, the site is permitted.
When you are finished exploring which sites are blocked and permitted by the sample policy, return to TRITON - Web Security.
Exercise 3: Use the Test Filtering tool to verify filtering behavior:
TRITON - Web Security includes tools to help you see how a client is being filtered without logging on as the user or accessing the Internet from a specific machine.
Make sure that the right policy is being applied.
Verify that the active policy is blocking and permitting sites as expected.
To see whether a client requesting a specific site would be permitted access:
1. Click Test Filtering in the right navigation pane.
ImportantBefore performing this lesson, make sure that the Websense Master Database has finished downloading. In TRITON - Web Security, go to Status > Dashboard, then click Database Download in the toolbar at the top of the content pane. Verify that the download status is Successfully updated.
You may need to log off of TRITON - Web Security and log on again to allow the new database to finish loading.
24 Websense Web Security Solutions

Policy Management
2. To identify the client to whom you have applied the Example - Standard User policy, do one of the following:
Enter the IP address of a computer client.
Enter the full distinguished name of a directory client in the User field, or click Find User to browse or search the directory. The search feature is available only if you are using an LDAP-based directory service.
3. Enter the URL of a site that you want to check.
4. Click Go.
A pop-up window shows the name and description of the site’s category, the action applied to the site, and the reason for that action.
In the sections that follow, you will learn how to create custom category filters and then to create custom policies to filter clients.
Continue with Lesson 7: Filtering Web sites by category, page 25.
Lesson 7: Filtering Web sites by category
Category filters determine how user requests for HTTP, HTTPS, FTP, and Gopher sites are treated.
Each Web site is identified by a unique IP address or URL. The Websense Master Database assigns these addresses to categories, such as Adult Material, Education, or Shopping.
Within a category filter, an action, such as Permit or Block, is assigned to each category. Every site within the category is filtered according to the action that you assign.
Websense provides several category filters and filtering templates to help you get started. You can edit the filters to suit the needs of your organization, but the templates cannot be changed. When you create a new filter, you can base it on either a template or an existing category filter.
To understand how category filters work, imagine that certain users in your organization should only have access to Web sites affiliated with educational institutions. Complete the following exercises to create a filter for these users.
Exercise 1: Create an Education-Only category filter:
1. In TRITON - Web Security, go to Policy Management > Filters in the left navigation pane.
2. In the Category Filters box, click Add. The Add Category Filter page appears.
Learn how category filters are used in Internet filtering, and then create and edit a custom category filter.
New User Quick Start 25
Policy Management
3. Enter Education-Only as the name of the new category filter.
4. Create a description for the filter (for example, “For student research assistants, permits access only to sites in the Education category”).
5. Select the Block All template to use as the foundation for the new filter.
6. Click OK to cache changes and return to the Filters page. The new filter name appears in the Category Filters list.
You will customize the filter in Exercise 2.
Exercise 2: Modify the Education-Only category filter:
1. Click Education-Only in the Category Filters box. The Edit Category Filter page appears.
2. Select Education in the Categories tree, and then click Permit. The Permit button appears below the Categories tree.
3. Expand the Education node. Note that the Education subcategories are still blocked.
4. With the Education parent category still selected, click Apply to Subcategories. All of the Education subcategories (Cultural Institutions, Educational Institutions, and so on) are permitted.
5. Click OK to cache your changes and return to the Filters page.
6. Click Save and Deploy to implement your changes.
Once you have created custom category filters, you can add them to policies and apply them to clients.
Continue with Lesson 8: Creating custom policies, page 26.
Lesson 8: Creating custom policies
Create new policies to add flexibility in managing employee Internet access. Rather than trying to make the Default policy apply to everyone, create custom policies for different groups of clients.
Exercise 1: Start from an existing policy to create a new policy:
1. In TRITON - Web Security, go to Policy Management > Policies.
2. Under the list of existing policies, click Add. The Add Policy page appears.
3. Give the new policy the name Research Assistants.
4. Provide a brief description for the new policy (for example, “For student research assistants, enforces the Education-Only category filter”).
Learn to create different policies to customize filtering for different groups of clients.
26 Websense Web Security Solutions
Policy Management
5. Mark the Base on existing policy check box, and then select the Default policy from the drop-down list.
6. Click OK to cache your changes and go to the Edit Policy page.
You will customize the policy in Exercise 2.
Exercise 2: Edit the Research Assistants policy:
1. On the Edit Policy page, under Schedule, expand the Days drop-down list, and then deselect Sat and Sun.
This policy will only apply Monday through Friday. You can add multiple rows to the schedule to have a policy apply different filters on different days or at different times.
2. Expand the Category / Limited Access Filter drop-down list, and then select the Education-Only category filter.
3. Expand the Protocol Filters drop-down list, and then select the Default protocol filter.
Protocol filters are used to filter non-HTTP Internet protocols, such as those used for instant messaging or streaming media. More information about protocol filtering can be found in the TRITON - Web Security Help system.
4. At the bottom of the Schedule box, click Add to add another row to the schedule.
A default time period appears in the Start and End columns.
5. Expand the Days drop-down list, and select only Sat and Sun.
6. In both the Category / Limited Access Filter column and the Protocol Filter column, apply the Monitor Only filter.
Monitor Only permits and logs all Internet requests.
7. Click OK to cache changes and return to the Policies page.
8. Click Save and Deploy to implement your changes.
Exercise 3: Apply the new policy to a client:
In Lesson 7, you learned how to apply policies to clients from the Edit Policies page. You can also apply policies to clients from the Clients page.
1. In TRITON - Web Security, click Clients (under Policy Management) in the left navigation pane.
2. Expand the appropriate node in the client tree, and then do one of the following:
Mark the check box next to the client name or IP address, and then click Edit.
Click the client name or IP address.
The Edit Client page appears.
3. Under Policy, expand the Name drop-down list and select Research Assistants.
4. Click OK to cache changes and return to the Clients page.
5. Click Save and Deploy to implement your changes.
New User Quick Start 27

Policy Management
Exercise 4: Verify that the new policy is being applied to the client:
1. Go to the machine to which you applied the Research Assistants policy.
2. Open a browser and go to www.ucsd.edu.
The site is permitted, because it is assigned to the Education > Educational Institutions category.
3. Next, browse to en.wikipedia.org.
This site is also permitted, because it is assigned to the Education > Reference Materials category.
4. Next, browse to a search engine site, like www.google.com or www.yahoo.com.
The site is blocked, because it is in the Information Technology > Search Engines and Portals category.
You can also use the Test Filtering tool (as explained in Lesson 7, Exercise 3) to verify that the policy is being applied correctly.
If you have reporting permissions, continue with Reporting.
If you do not have reporting permissions, you have completed this tutorial. See Where Do I Go Next? for additional resources.
28 Websense Web Security Solutions
5
ReportingBefore you can view charts on the Web Security Dashboard, or generate investigative or presentation reports, an essential, Windows-only reporting component—Log Server—must be installed. If Log Server is not installed, skip to Lesson 12: Real-Time Monitor, page 41.
Real-Time Monitor gathers its information from another component, Usage Monitor, that is typically installed with Policy Server. If you have administrative access to Real-Time Monitor, Lesson 12 applies even when other reporting components are not installed.
This section includes 5 lessons:
Lesson 9: Dashboard reports introduces the Web Security Dashboard, used to monitor threat activity, security risks, general usage, and system status for your deployment.
Lesson 10: Presentation Reports shows you how to generate predefined reports and copy those reports to apply customized data selection filters, as well as how to set up a scheduled report job.
Lesson 11: Investigative Reports shows you how to view log data interactively, identifying a topic of interest and drilling down to find greater detail. You will also learn how to generate and schedule reports.
Lesson 12: Real-Time Monitor describes how to monitor current Internet filtering activity in your network. This includes information about customizing your view of current traffic to show only specific clients, sites, and so on.
Lesson 13: Improving Websense software explains how to implement the features that enable you to help improve filtering by allowing Websense software to submit relevant information to Websense, Inc.
In networks that use delegated administration, Super Administrators control who can access these features.
New User Quick Start 29

Reporting
Lesson 9: Dashboard reports
The charts and information areas on the tabs of Status > Dashboard page offer a quick, graphical overview of current and recent system status and Internet activity.
Each dashboard tab displays a set of default charts, counters, and informational summaries.
Elements can be added to or removed from the Risks, Usage, and System dashboards.
Up to 12 elements can be displayed on each of these dashboards.
When you click most charts and counters on these dashboards, an investigative report with more details is displayed.
On all dashboards, many of the charts can be configured to include different time periods, show different sets of information (top 5, top 6-10, and so on), display in different formats (stacked area chart, bar chart, multi-series line chart, and so on).
Other configuration options may be available, depending on the dashboard and element selected.
Dashboard information is updated every 2 minutes.
In organizations that use delegated administration, the Super Administrator controls who can view charts on the Web Security Dashboard. Access to the Threats dashboard is configured separately from access to the Risks, Usage, and System dashboards.
By default, TRITON - Web Security times out after 30 minutes of inactivity. You must log on again to view dashboard updates, or to work in other pages.
Section 1: The Threats dashboard
Use the Threats dashboard to review information about suspicious activity in your network. This type of activity is often associated with advanced malware threats.
The type of information and level of detail shown depends on your subscription level. Web Security Gateway or Web Security Gateway Anywhere is required to display information about outbound threats and to provide detailed forensic data about the threats.
You cannot add elements to, nor remove elements from, the Threats tab.
Clicking a chart on the Threats dashboard modifies the information shown in the summary table at the bottom of the page. It does not open an investigative report.
Get a quick, graphical overview of current and recent system status. Learn to customize the information displayed.
30 Websense Web Security Solutions

Reporting
The Threats dashboard includes the following:
Filters at the top of the Threats dashboard can be used to limit the data shown on the page to a specific time period, severity level, or action (permitted or blocked).
The Suspicious Event Summary includes a Search box that can be used to further filter the data shown in the table.
Section 2: The Risks dashboard
Use the Risks dashboard to monitor permitted and blocked requests for URLs in the Security Risk class. By default, the following elements are displayed:
Dashboard Element Description
Top Security Destinations
Maps the countries associated with suspicious activity in your network. These may be countries hosting sites in threat-related categories, or countries to which malicious software in your network is attempting to send data.
By default, the top 5 countries are shown.
Click a highlighted country to show only traffic to that destination in the Suspicious Event Summary.
Severity Events by Type
Charts the number of blocked requests for URLs in threat-related categories.
By default, the top 5 most-requested categories are shown.
Click a category in the chart to show only requests for that category in the Suspicious Event Summary.
Suspicious Event Summary
Provides severity, user, machine, category, time, and direction information for Internet activity that may be related to an advanced malware threat.
Click a severity, user name, IP address, or device name (if available; requires Web Security Gateway or Gateway Anywhere) to open an Event Details page with more information about activity of the selected type.
Dashboard Element Description
30-Day Risk Trends Shows blocked request trends for specific security and legal liability categories. Click a spark line to open the Threats dashboard or an investigative report (depending on category) with more information.
Clients with Security Risks
Shows which computers have been used to access Security Risk sites. You may want to check these machines to make sure they are not infected with any viruses or spyware.
Top Security Risk Categories
Shows which Security Risk categories have received the most requests.
Security Risk is a risk class: a grouping of categories with similar characteristics. Security Risk categories including Phishing, Spyware, and Hacking, among others.
Risk Classes Shows how many requests to each risk class (Security Risk, Legal Liability, Productivity, Business Usage) have been permitted and blocked.
New User Quick Start 31

Reporting
Section 3: The Usage dashboard
The Usage dashboard shows general Internet activity trends for your organization. By default, the following elements are displayed:
Section 4: The System dashboard
Top Uncategorized Shows which URLs not categorized by the Websense Master Database have been accessed most. Go to Common Tasks > Recategorize URL to assign a URL to a category for filtering.
Analytics: Security Risks
Websense Web Security Gateway or Gateway Anywhere only.
Shows how many requests were assigned to new categories by Content Gateway analysis because the content had been changed or the site was compromised.
Dashboard Element Description
Top Blocked Users Shows which users have requested the most blocked URLs.
Top Requested Categories
Shows the categories that are being accessed most to provide a high-level overview of potential security, bandwidth, or productivity concerns.
Enforcement Summary P an overview of recently permitted requests, blocked requests for sites in the Security Risk class, and other blocked requests.
Web 2.0 Categories Websense Web Security Gateway or Gateway Anywhere only.
Shows the top categories assigned to requested Web 2.0 URLs, measured by requests.
Web 2.0 URL Bandwidth
Websense Web Security Gateway or Gateway Anywhere only.
Shows the Web 2.0 URLs using the most bandwidth.
Analytics: Top Categories
Websense Web Security Gateway or Gateway Anywhere only.
Shows the top categories to which requested URLs were assigned after Content Gateway analysis determined that they no longer fit their original category
Dashboard Element Description
32 Websense Web Security Solutions

Reporting
The System dashboard displays general health and status information about your Web security software. By default, the following elements are displayed:
Exercise: Customize the Risks, Usage, and System tabs
Administrators with permission to view charts on the Web Security Dashboard can customize which charts appear or the Risks, Usage, and System tabs.
1. Navigate to the Risks, Usage, or System tab of the Web Security Dashboard, then click Add Chart in the toolbar at the top of the page.
The customize page lists the available dashboard elements. A blue circle marks the charts and other elements (counters, summaries) that currently appear on the selected tab.
There are 2 charts listed that do not appear by default on any tab:
30-Day Value Estimates gives estimates of time and bandwidth savings afforded by Websense software over a 30-day period that includes today.
Activity Today provides examples of how Websense filtering has protected your network, the total number of requests handled so far today, the number of requests blocked, and the number of real-time database updates processed.
2. Select a tab from the Add elements to tab drop down list.
3. Select an element (chart, counter, summary) from the Dashboard Elements list.
Each tab can show a maximum of 12 elements.
Elements currently displayed on the selected tab are marked by a blue circle icon.
Dashboard Element Description
Health Alert Summary Provides brief status or error messages for system components. Click a message to view a more detailed alert and find solutions.
User Activity: Zoom Trend
Shows the number of filtered Internet requests processed into the Log Database. The unit of measurement depends on the period shown in the chart. By default, activity is shown in 3 hour and 30 minute intervals.
Protocol Bandwidth Use
Shows which protocols (like HTTP, SMTP, BitTorrent, or Spotify) are using the most bandwidth.
Filtering Service Status Lists the status of each Filtering Service associated with the current Policy Server
Hybrid Bandwidth Summary
Websense Web Security Gateway Anywhere only.
Shows the bandwidth consumed by Internet requests from users filtered by the hybrid service
Hybrid Requests Processed
Websense Web Security Gateway Anywhere only.
Shows how many Internet requests made by users from your organization were permitted and blocked by the hybrid service.
New User Quick Start 33
Reporting
You can add multiple copies of the same element to a tab (for example, each might show a different time period).
4. The selected element appears in the Preview pane. Optionally update the chart Name, then update any of the following that are available:
Chart type: Many charts can be displayed as a multi-series bar, column, or line chart, or as a stacked area or column chart. Some can be displayed as bar, line, or pie charts. Which types are available depends on the data being displayed.
Time period: Most charts can display a variable time period from Today (the 24-hour period beginning at midnight of the current day) to 30 days or longer (as configured by a Super Administrator on the Settings > Reporting > Dashboard page).
Top: Charts displaying information about the top users, categories, URLs, and so on can typically display up to 5 values. Select whether to show the top 5 values, 6-10 values, 11-15 values, or 16-20 values.
For some elements, only the name can be customized.
5. Click OK to implement the changes and return to the Dashboard page.
Continue with Lesson 10: Presentation Reports, page 34.
Lesson 10: Presentation Reports
Presentation reports offer a view into the Internet filtering information stored in the Websense Log Database. Predefined charts and tabular reports, called templates, make it easy to generate a consistent presentation of data on a particular topic, such as the categories that have been blocked the most during a particular time frame.
In networks that use delegated administration, Super Administrators control who has access to these features.
Exercise 1: Generate a report from a template
1. In TRITON - Web Security, go to Reporting > Presentation Reports.
2. In the Report Catalog tree, expand the Internet Activity heading, and select the Top Sites Visited report.
Immediately after installation, only report templates appear in the tree. If the software has been in use for some time, the tree may also include:
Favorite reports (marked with a star)
Custom reports
3. Click Run at the top or bottom of the list.
Learn what presentation reports are, and how to generate reports from report templates, and how to create custom reports.
34 Websense Web Security Solutions
Reporting
4. Fill out the Run Report page as follows:
5. Deselect Schedule the report to run in the background. The report will be generated in a pop-up window in the foreground.
6. Click Run.
Websense software displays a progress window while it gathers the appropriate records from the Log Database, and then prompts you to display the report in a new window.
Exercise 2: Create a custom report and edit its filter
1. Select Presentation Reports in the left navigation pane, and then select the Top Sites Visited report under Internet Activity.
2. Click the Save As button.
3. In the Save As New Report page, change the Report catalog name to New Top 5 Sites Visited. This name appears on the Presentation Reports page.
4. Click Save and Edit to display the Edit Report page, where you can customize the elements of the report.
5. Accept the default (all items reported), and click Next to move through the Clients, Categories, Protocols, and Actions tabs.
When generating future reports you can use these tabs to fine-tune the content of the report.
6. In the Options tab, change the Show only top setting to 5 to have the report show only the top 5 sites visited. Then, click Next.
7. In the Confirm tab, select Save and run, and then click Finish.
8. On the Run Report page, set the Output format to HTML, deselect Run the report in the background, and then click Run.
Websense software gathers the appropriate records from the Log Database, and displays the report in a new window.
Field Description
Start date
End date
Leave the default dates, which define a report covering the current day’s activities.
Output format Select HTML to display the finished report in the browser window.
Top N Leave the default setting of 10. (This reports on the top 10 sites.)
TipIt is usually most efficient to run reports in the background. You can opt to receive email notification when the report is complete, and use the Presentation Reports > Review Reports page to access the report.
New User Quick Start 35
Reporting
The changes you made in the report filter are saved with the new report. The new name appears on the Presentation Reports page. Any time you choose this report to run, it uses the filter you defined.
Exercise 3: Configure distribution for scheduled reports
A few basic settings must be configured before you can schedule presentation reports for distribution. If these settings have already been configured, skip to Exercise 4.
If they have not been configured and you are a Super Administrator, you can perform the configuration. Otherwise, ask a Super Administrator to perform the configuration before you continue with Exercise 4.
1. In TRITON - Web Security, go to Settings and click Reporting in the left navigation pane.
2. Click Preferences.
3. Enter the Email address from which reports should be sent.
4. Enter the IP address or name of the email server that will distribute scheduled reports to their email recipients in the SMTP server IP or name field.
5. Click Save Now to implement the changes.
Exercise 4: Schedule reports to run periodically
1. Click the Main tab, and then go to Reporting > Presentation Reports.
2. Click Scheduler in the toolbar at the top of the page.
3. Use the Schedule Report tab to set the following options. Then, click Next.
Job name: Test
Recurrence Pattern: Daily
Schedule time: 10 minutes from your current system time
Schedule Period: End after 2 occurrences
4. In the Select Reports tab, select the New Top 5 Sites Visited report and click the right arrow (>) to move it to the Selected list. Click Next.
5. In the Date Range tab, select Relative Dates from the drop-down list, and then select Last 2 and Day(s). Click Next.
6. In the Output tab, set the following:
File format: PDF
Recipient email addresses (Cc): enter your own email address
7. Click Save Job to save and implement the schedule.
Starting in 10 minutes, Websense software gathers the appropriate records from the Log Database, and creates the report as a PDF file. It then sends you the PDF file via email. The report will be generated twice: today and tomorrow.
Continue with Lesson 11: Investigative Reports, page 37.
36 Websense Web Security Solutions
Reporting
Lesson 11: Investigative Reports
Investigative reports let you interact directly with the filtering information stored in the Websense Log Database. Initially, a bar chart showing today’s activity by risk class is displayed. Investigate areas of concern by clicking appropriate chart elements to drill down for greater detail.
Make a few selections to view multiple levels of information, such as the top 5 users in the top 5 categories.
A separate detail view gives you a tabular report of related information. You can customize the columns displayed, and create a summary view of this table.
See Investigative reports reference, page 39, for more information about what can be displayed in investigative reports.
In networks that use delegated administration, Super Administrators control who has access to these features.
Exercise 1: Drilling down to find specific data
You can drill down into the initial data displayed on the Investigative Reports page (today’s activity by risk class) to uncover the details that matter most to your organization.
1. On the Reporting > Investigative Reports page, click Productivity Loss to display a list of drill-down options.
If there is no Productivity Loss entry, clients in your network have not requested any sites in that risk class. In that case, select another risk class.
2. Click by Category in the list of options.
The chart changes to show today’s activity in the categories assigned to the selected risk class.
3. Click the first category name in the chart (for example, News and Media) to display a new list of drill-down options.
4. Click User to have the chart show a list of users who have requested sites in the selected category.
You can continue selecting drill-down options to see more detail about any item of interest.
Additionally, you can view a different timeframe by choosing the desired period or entering a specific date range in the View options above the chart, or change the measurement used to quantify activity by selecting a new option from the Measure drop-down list in the View toolbar near the top of the content pane.
Learn what investigative reports are and how to drill down to specific information. Generate and modify a detail view report, and create Favorite reports that can be scheduled on a repeating cycle.
New User Quick Start 37

Reporting
Exercise 2: Creating a multi-level report
Starting with a report on the main Investigative Reports page, you can define a second level of information to display. This allows you, for example, to compare the most active users in one category with the most active users in another category.
1. In the breadcrumbs beside the Internet Use by list, click Category.
The chart displays the categories in the risk class selected in the previous exercise.
2. In the bar above the chart, enter the following:
Select top 5
by User
and Display 10 Results
3. Click the Display Results button.
The chart updates to show bars for only the top 5 categories. Below each bar is a list of the 10 users who requested the most sites in that category during the timeframe.
You can create a multi-level report with different combinations of data. Simply modify the bar chart to show the high-level data of interest, then define the second level as described above.
Exercise 3: Using flexible detail reports
Flexible detail reports give a tabular view of data related to a specific item on the bar chart. You can change to a summary view of the same data, and change the information columns displayed.
1. On the main Investigative Reports page, select Category from the Internet Use by list.
2. Click the bar or number for any category that shows a significant number of hits.
A detail view appears, showing a tabular report of today’s traffic for the selected category. The default report includes columns for User, Date, Time, URL Hostname, and Hits.
3. Click Modify Report in the toolbar at the top of the content pane. A dialog box opens.
4. Use the controls in this dialog box to remove the Time column, and add Disposition as a column, between Date and URL Hostname.
You can choose up to 7 columns in this dialog box. Be sure to choose columns that are appropriate for the data being reported, or the column will be blank.
Notice that although the report shows hits, Hits does not appear as an entry in the list. Reports based on hits must include Hits as the rightmost column.
5. Click Submit to close the dialog box and update the report.
Notice that the new columns are now displayed, in the order you specified.
6. Click Summary, in the upper right corner of the content pane.
Notice that the updated report combines all hits with the same URL host name and date into a single entry showing the total number of hits.
38 Websense Web Security Solutions

Reporting
The Summary report option is available only when the Time column is not displayed. It combines rows that share a common element. The combined element varies according to the information in the report. In this example, it combines those with the same URL host name.
Exercise 4: Saving and scheduling Favorites
Favorites are report definitions that you want to reproduce easily, and may want to schedule on a repeating cycle. You can save reports shown on the main Investigative Reports page, or the flexible detail view.
1. Generate a report that shows information you want to reproduce easily.
2. Click Favorite Reports at the top of the content pane.
3. On the Favorite Reports page, a file name is suggested for the report. Accept that name or enter a different file name, if desired.
Only letters, numbers, and underscore characters (_) are permitted in the file name.
4. Click Add to save the report as a Favorite.
5. Select the added report in the list, and then click Schedule to run the report on a repeating cycle.
6. Fill in the information requested.
To create a recipient list, enter an address in the Additional Email Addresses field, and then click Add. Be sure to highlight one or more email addresses to be recipients.
7. Click Next after all entries are complete to display a confirmation screen showing your selections.
8. Click Save to save the scheduled report job and display a list of all scheduled reports.
The job will run according to the schedule you set, and email the report to the selected recipients. At any time, you can review the list of scheduled jobs, edit a job definition, or delete an obsolete job by clicking Job Queue on the main Investigative Reports page.
If you are a reporting administrator in an investigative reporting role, you have completed the tutorial. See Where Do I Go Next?, page 47, for additional resources.
If you have Real-Time Monitor permissions, continue with Lesson 12: Real-Time Monitor.
Investigative reports reference
The information that can be displayed in an investigative report depends on what elements are already selected. If you are looking at requests by user, for example, you cannot add group information. Likewise, if you are looking at a report by category, you cannot simultaneously view risk class data.
New User Quick Start 39

Reporting
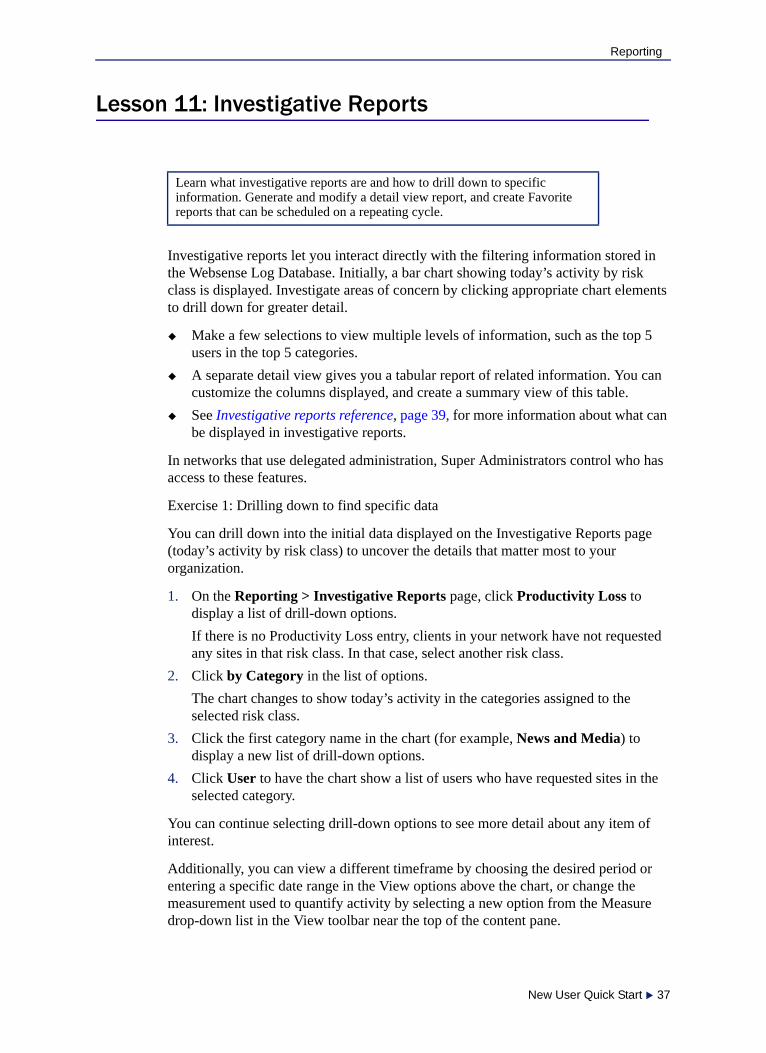
The table below lists the types of data that can be displayed in an investigative report. If you have drilled down into the data to create a detail report, these are the columns that you can add to the report to create a custom view of the data.
Column Name Description
User Name of the user who made the request. User information must be available in the Log Database to include it on reports. Group information is not available in user-based reports.
Day Date the Internet request was made.
URL Hostname Domain (host) name of the requested site.
Domain Directory service domain for the directory-based client (user or group, domain, or organizational unit) that made the request.
Group Name of the group to which the requestor belongs. Individual user names are not given on group-based reports. If the user who requested the site belongs to more than one group in the directory service, the report lists multiple groups in this column.
Risk Class Risk class associated with the category to which the requested site belongs. If the category is in multiple risk classes, all relevant risk classes are listed.
Directory Object Directory path for the user who made the request, excluding the user name. Typically, this results in multiple rows for the same traffic, because each user belongs in multiple paths.
If you are using a non-LDAP directory service, this column is not available.
Disposition Action Websense software took as a result of the request (for example, category permitted or category blocked).
Source Server IP address of the machine sending requests to Filtering Service. In standalone deployments, this is the Network Agent IP address. In integrated deployments, this is the gateway, firewall, or cache IP address.
With Websense Web Security Gateway Anywhere, use this option to identify requests filtered by the hybrid service from both on-site (filtered location) and off-site users.
Protocol Protocol of the request (for example, HTTP or FTP).
Protocol Group Master Database group in which the requested protocol falls (for example, Remote Access or Streaming Media).
Source IP IP address of the machine from which the request was made.
With Websense Web Security Gateway Anywhere, you can use this option to review requests coming from a specific hybrid filtered location.
Destination IP IP address of the requested site.
Full URL Domain name and path for the requested site (example: http://www.mydomain.com/products/ref=abc123?string/). If you are not logging full URLs, this column is blank.
40 Websense Web Security Solutions
Reporting
Lesson 12: Real-Time Monitor
Real-Time Monitor provides a simple view into current Internet filtering activity in your network. You control how often the data is refreshed and how much data is available at a time, and you can apply filters to focus on specific clients, sites, or types of requests (blocked or permitted).
Month Calendar month the request was made.
Port TCP/IP port over which the user communicated with the site.
Bandwidth The amount of data, in kilobytes, contained in both the initial request from the user and the response from the Web site. This is the combined total of the Sent and Received values.
Keep in mind that some integration products do not send this information to Websense software. Two examples are Check Point FireWall-1 and Cisco PIX Firewall. If your integration does not send this information, and Websense Network Agent is installed, activate the Log HTTP requests option for the appropriate NIC to enable reporting on bandwidth information.
Bytes Sent Number of bytes sent as the Internet request. This represents the amount of data transmitted, which may be a simple request for a URL, or may be a more significant submission if the user is registering for a Web site, for example.
Bytes Received Number of bytes received from the Internet in response to the request. This includes all text, graphics, and scripts that make up the site.
For sites that are blocked, the number of bytes varies according to the software creating the log record. When Websense Network Agent logs the records, the number of bytes received for a blocked site represents the size of the block page.
If the log record is created by Websense Security Gateway, as a result of scanning, the bytes received represents the size of the page scanned.
If another integration product creates the log records, the bytes received for a blocked site may be zero (0), may represent the size of the block page, or may be a value obtained from the requested site.
Time Time of day the site was requested, shown in the HH:MM:SS format, using a 24-hour clock.
Category Category to which the request was assigned. This may be a category from the Master Database or a custom category.
Column Name Description
Learn how to use Real-Time Monitor to track current Internet filtering activity in your network. Apply filters to focus on traffic with specific characteristics.
New User Quick Start 41

Reporting
Unlike other reporting tools, Real-Time Monitor shows only current data.
The data come directly from Usage Monitor, which tracks client access to sites and protocols for use in alerting.
Each record is captured by the Real-Time Monitor database for display. The database contains a limited (configurable) number of records.
When the Real-Time Monitor database is full, each new record overwrites an older record. Older information is no longer available in the monitor. (Because this information is also captured by Log Server and stored in the Log Database, it can be accessed via other reporting tools, like investigative reports.)
Real-Time Monitor shows activity for one Policy Server at a time. Policy Server is a component responsible for coordinating multiple other Websense Web Security components.If your organization is large or distributed, multiple Policy Server instances may be deployed to help balance filtering load.
TRITON - Web Security also connects to one Policy Server at a time, and Real-Time Monitor connects to that same Policy Server at launch. As long as Real-Time Monitor is displayed in the TRITON content pane, it changes its Policy Server connection each time TRITON - Web Security changes its connection.
When Real-Time Monitor is open in full screen mode, it remains connected to a single Policy Server, regardless of whether TRITON - Web Security connects to a different Policy Server.
As a result, multiple Real-Time Monitor instances can be run in full screen mode on the same machine, with each connected to a different Policy Server. The Policy Server IP address is displayed in the Real-Time Monitor title bar. So if you are a network security administrator, you can monitor your entire Websense Web Security installation by opening a Real-Time Monitor instance for each Policy Server deployed in your network.
Exercise 1: Real-Time Monitor basics
1. To launch Real-Time Monitor, go to the Reporting > Real-Time Monitor page in TRITON - Web Security.
2. Click Start to populate the page with data. The page shows recent Internet requests, including:
The IP address or name of the user who made the request. If user-based filtering is used in your network, and the IP address is shown, mouse over an entry to see the user name.
The URL requested. If the URL is truncated, mouse over an entry to see the full URL.
Whether or not the requested site was recategorized as a result of Content Gateway scanning.
An icon indicates that scanning resulted in dynamic recategorization of the site; no icon indicates that the Master Database or administrator-defined custom category was used. Mouse over the icon to see the original category.
42 Websense Web Security Solutions
Reporting
The Category assigned to the site. The actual category used to filter the request is shown, whether that is the Master Database category, the custom URL category, or the category dynamically assigned as a result of scanning.
The Action (permitted or blocked) applied to the request.
The Time the request was passed to Real-Time Monitor. Because Real-Time Monitor receives request information from Usage Monitor in real time, rather than reading the request from the Log Database, the request time shown here may not match the request time that appears in investigative and presentation reports.
3. To review current data, click Pause to prevent the page from continuing to refresh. When you are ready to start monitoring new information, click Start again.
Depending on your current settings, Real-Time Monitor holds a set number of records (250, 500, or 1000), and will always display the latest set of available records. When you pause display of new records to review current data, this can mean that the hundreds or thousands of requests that occur while the display is paused will never be displayed in the monitor. (The requests are, however, stored in the Log Database, and will appear in investigative and presentation reports.)
If you are a delegated administrator or reporting administrator, you have completed this tutorial. See Where Do I Go Next? for pointers to possible next steps.
If you are a Super Administrator, continue with Lesson 13: Improving Websense software.
Lesson 13: Improving Websense software
Websense software includes two options that you can use to help Websense, Inc., improve filtering:
Enable WebCatcher to send unrecognized and security-related URLs to be analyzed for liability and security risks and categorized, if appropriate.
After they are categorized, these sites are added to the Master Database for use in filtering and reporting.
To help Websense, Inc., continue to enhance filtering capabilities, allow Websense software to gather category and protocol usage data.
Enable WebCatcher to send uncategorized and security URLs to Websense, Inc., for analysis. You can also elect to send category and protocol usage data to help Websense software continue to improve filtering capabilities.
New User Quick Start 43

Reporting
WebCatcher
When WebCatcher sends unrecognized and security-related URLs to Websense, Inc., subsequent downloads of the Websense Master Database include improvements and category revisions resulting from WebCatcher data. Only Super Administrators can modify these settings.
The following type of information is sent to Websense, Inc., when you activate WebCatcher. The IP address belongs to the machine hosting the URL, not the requestor.
<URL HREF="http://www.ack.com/uncategorized/" CATEGORY="153" IP_ADDR="200.102.53.105" NUM_HITS="1" />
To enable WebCatcher:
1. Navigate to the Settings > General > Account page in TRITON - Web Security.
2. Under WebCatcher, mark Send URL information to Websense.
To submit uncategorized URLs to be evaluated for categorization, mark Send uncategorized URLs to improve URL categorization.
To send in security-related URLs to help track malicious Web site activity, mark Send security URLs to improve security effectiveness.
To keep a local copy of the information sent to Websense, Inc., for your review, mark Save a copy of the data being sent to Websense.
When this option is enabled, WebCatcher saves the data as unencrypted XML files in the Websense\Web Security\bin\ directory on the Log Server machine. These files are date and time stamped.
Select the Country of origin for your organization. This should be the country where the majority of Internet activity is being logged.
Specify a Maximum upload file size. When the maximum size is reached, collected WebCatcher data is sent automatically and a new file is started.
Use the Daily start time field to indicate a time each day when WebCatcher should send the data it has collected if the maximum file size has not been reached.
3. Click OK to cache your changes, and then click Save and Deploy to implement them.
Category and protocol usage data
When you choose to send category and protocol usage data to Websense, Inc., the data is gathered only for Websense-defined categories and protocols. Any custom categories or protocols you have defined are not included.
ImportantThe information sent to Websense, Inc., contains only URLs. It does not include individual user information.
44 Websense Web Security Solutions
Reporting
Websense, Inc., does not collect usage data from your network unless you allow it. You are given the option to disable usage data gathering during installation (it is enabled by default).
Category and protocol usage data helps Websense, Inc., to enhance the filtering capabilities of Websense software.
To configure collection of category and protocol usage data:
1. In TRITON - Web Security, navigate to the Settings > General > Account page.
2. Mark or clear the Send category and protocol data to Websense, Inc. check box.
3. Click OK to cache your change, and then click Save and Deploy to implement it.
You have completed this tutorial. See Where Do I Go Next? for pointers to possible next steps.
New User Quick Start 45

Reporting
46 Websense Web Security Solutions

6
Where Do I Go Next?You have completed the New User Quick Start tutorial. You have the basic tools you need to start working with your Websense software.
Websense Web Security solutions have a number of additional features that can be used to add even more precision and flexibility to your filtering setup. These features are described in detail in the TRITON - Web Security Help (accessible via the Help button in the TRITON toolbar).
For administrators with policy management permissions:
Create custom categories or recategorize individual sites (recategorized URLs).
Go to Policy Management > Filter Components and click Edit Categories.
Define exceptions to permit or block one or more URLs for one or more clients without recategorizing the sites.
Go to Policy Management > Exceptions and click Add.
Configure protocol filters for increased control over Internet protocols, like those used for instant messaging and peer-to-peer file sharing.
Go to Policy Management > Filters and click a filter name, or click Add.
Create limited access filters to restrict some users to a specific list of Web sites.
Go to Policy Management > Filters and click Add.
Define keywords to gain a higher level of control over which sites filtering clients can access.
Go to Policy Management > Filter Components and click Edit Categories, then select a category.
For reporting administrators, the Investigative Reporting Quick Start provides a step-by-step guide to finding the information most useful to your organization.
Super Administrators may want to configure alerting to ensure that administrators receive notification about potential problems with your Websense software, or with users’ Internet activity. Go to Settings > Alerts > Enable Alerts to configure alerting methods.
As you explore TRITON - Web Security, if you have questions about what a feature does or how to use a function, go to Help > Explain This Page.
In addition, visit the Websense Support Portal any time to find tips, video tutorials, an extensive Knowledge Base, and product documentation.
New User Quick Start 47

Where Do I Go Next?
48 Websense Web Security Solutions