
New POLYUNSATURATED FATTY ACIDS AND INFLAMMATORY …gala.gre.ac.uk/id/eprint/23495/1/Efosa Kenneth...
252
POLYUNSATURATED FATTY ACIDS AND INFLAMMATORY BIOMARKERS IN THE PATHOGENESIS OF TYPE II DIABETES By Efosa Kenneth Oghagbon [MBBS, FMCPath. (Nigeria)] A thesis submitted in partial fulfilment of the requirements of the University of Greenwich for the Degree of Doctor of Philosophy June, 2017 Department of Life and Sports Sciences Faculty of Engineering & Science, University of Greenwich (Medway Campus), Chatham Maritime, Kent ME4 4TB, UK
Transcript of New POLYUNSATURATED FATTY ACIDS AND INFLAMMATORY …gala.gre.ac.uk/id/eprint/23495/1/Efosa Kenneth...
POLYUNSATURATED FATTY ACIDS AND INFLAMMATORY
BIOMARKERS IN THE PATHOGENESIS OF TYPE II DIABETES
By
Efosa Kenneth Oghagbon [MBBS, FMCPath. (Nigeria)]
A thesis submitted in partial fulfilment of the requirements of the
University of Greenwich for the Degree of Doctor of Philosophy
June, 2017
Department of Life and Sports Sciences
Faculty of Engineering & Science,
University of Greenwich (Medway Campus),
Chatham Maritime, Kent ME4 4TB, UK

iii
ACKNOWLEDGMENTS
I would like to thank my doctoral thesis supervisors, Dr Laurence S. Harbige and Prof. Babur
Z. Chowdhry, for their immeasurable support, encouragement and guidance throughout this
work. I am also very grateful to Prof. Kebreab Ghebremeskel (London Metropolitan
University) for allowing me to use his facility for fatty acid analyses and for providing very
useful technical assistance, materials and guidance while working in his laboratory. My
gratitude also goes to Drs’ Xiang Mingyan, Eva Pinto and Eva Sedlak, for their moral and
technical support. I also wish to express my gratitude to a dear friend; Major General Johnson
Bamidele Olawumi of the Nigerian Army who at various key times assisted me morally and
financially. Most importantly, I wish to thank God Almighty for His grace and favour during
the long years of this work and to Him is the glory of this project.

iv
ABSTRACT
Various studies have reported elevated levels of pro-inflammatory cytokines (IL-6, TNF-α,
MCP-1, IL-1β) and different fatty acid (FA) patterns are associated with type 2 diabetes
mellitus (DM2). In addition, an association of hypovitaminoses D with DM2 has been
observed in some populations. No study has simultaneously evaluated multiple cytokines, FA
profiles and vitamin D in DM2 patients in Nigeria. Neither has any study compared the FA
profiles and inflammatory biomarkers in DM2 population of an African country with one
outside the African continent. This study measured cytokines and FAs in DM2 patients and
healthy controls from Nigeria and Mexico. The plasma phosphatidylcholine (PC) FA
composition was measured by gas liquid chromatography (GLC) using appropriate FA
standards. This was preceded by the preparation of FA methyl esters following thin layer
chromatography (TLC) and identification of the PC band using an authentic standard.
Cytokines (adiponectin, resistin, leptin, IL-1β, IL-6, IL-4, IL-8, IL-10, IL-12, TNF-α, IFN-γ,
TGF-β and MCP-1) were measured by a multiplex assay that utilises Luminex software
technology and vitamin D by chemiluminescence microparticle immunoassay methodology.
The FA profiles are reported as mean % weight ± SD and the data obtained compared
between DM2 and healthy controls in both Nigeria and Mexico. The DM2 and controls of
each country were compared within and between their respective groups. A recent literature
report of the levels of cytokines in DM2 sufferers from Mexico and control subjects were
compared with the Nigerian DM2 cytokines values. Results are reported as mean ± SD except
for the cytokines which are reported as mean ± s.e.m. Only the cytokine, insulin and HOMA
indices (HOMA-B and HOMA-IR) data were logarithmically transformed before statistical
analyses.
Palmitic acid (C16:0) was found to be significantly higher in DM2 subjects in both
populations (Nigerian DM2: 30.83 ± 3.86, controls: 29.04 ± 4.22; Mexico DM2: 30.96 ± 2.45,
controls: 29.48 ± 2.20). This is in keeping with other studies, and elevated palmitate is known
to increase inflammation mainly by activating TLR4 in macrophages, hence linked with the
IR and DM2. Stearic acid (C18:0) was lower in DM2 subjects compared to controls in both
countries (Nigerian DM2: 15.88 ± 2.21, controls: 17.57 ± 2.43; Mexico DM2: 13.76 ± 1.88,
v
controls: 14.99 ± 1.20). This pattern has only been shown in a few studies, as others have
found higher levels of stearic acid in DM2. Vaccenic acid (C18:1n-7) levels were only higher
in Nigerian controls (1.26 ± 0.32) compared to the DM2 subjects (1.05 ± 0.39). Arachidonic
acid (C20:4n-6) was significantly lower in DM2 subjects relative to the controls in both
countries (Nigerian DM2: 9.17 ± 2.12, controls: 10.31 ± 2.12; Mexico DM2: 6.14 ± 1.52,
controls: 6.73 ± 1.54). This suggests either alteration of metabolism of the parent n-6 FAs to
their longer chain metabolites, or increased consumption of C20:4n-6 in the patients. The
mean level of C18:2n-6 was significantly higher in Mexican DM2 subjects than in Nigerians’
(Mexico: 26.17 ± 2.43; Nigeria; 18.41 ± 4.31) and the level of C20:4n-6 was higher in the
Nigerian diabetics (9.17 ± 2.12) than in Mexican DM2 samples (6.14 ± 1.52). Similarly, the
level of C18:3n-3 was higher in Mexican DM2 (0.34 ± 0.12) than in Nigerian diabetics (0.17
± 0.10), but the levels of EPA (C20:5n-3) and DHA (C22:6n-3) were higher in Nigerian DM2
(EPA: 0.82 ± 0.78, DHA: 3.79 ± 1.87) than in diabetics from Mexico (EPA: 0.29 ± 0.15,
DHA: 1.47 ± 0.53). Compared to the Nigerian subjects, there maybe a more disordered
metabolism of parent FAs (C18:2n-6 and C18:3n-3) to longer chain PUFAs in the Mexican
DM2 and healthy control populations.
Plasma IL-6 levels in Nigerian DM2 patients was significantly higher (DM2: mean 215.86
pg/ml ± 43.91) compared to controls (81.02 pg/ml ± 33.97). The level of IL-6 in a Mexican
diabetic study was (18.30 pg/ml ± 11.7). The elevation of proinflammatory IL-6 in DM2 has
been widely reported in various studies and it is said to impair insulin signalling by activation
of NF-κβ and JNK pathways thus leading to impaired exocytosis of GLUT4 molecules. The
logarithmic value of HOMA-B was lower in Nigerian DM2 (1.22 ± 0.08) than in the controls
(1.44 ± 0.08) and the transformed values of HOMA-IR showed a higher value in the Nigerian
DM2 subjects (0.45 ± 0.07) compared to their controls (0.09 ± 0.08). These are consistent
with the glycaemic status of the group. The negative correlation between FPG and HOMA-B
(r = -0.407, p = 0.002) only among the DM2 subjects is in keeping with the impact of the
disease on pancreatic β-cell reserve. There were multiple weak to moderate correlations
between plasma PC fatty acids, cytokines and adipokines (adiponectin, resistin, leptin, IL-1β,
IL-6, IL-4, IL-8, IL-10, IL-12, TNF-α, IFN-γ, TGF-β, MCP-1) both in Nigerian controls and
DM2. Vitamin D showed no significant differences in mean plasma vitamin D levels between

vi
Nigerian diabetics (61.00 nmol/L ± 17.31) and controls (56.28 nmol/L ± 18.41). Results of
this study therefore show some important FAs profile similarities in both the Nigerian and
Mexican DM subjects and a possible role for IL-6 in DM2 disease mechanisms in both
populations. In relation to the fatty acid and inflammatory biomarker findings of this study the
role of diet in DM2 in both countries clearly needs further investigation.

vii
OVERVIEW OF THESIS
Chapter one provides the background and introduction to the subject areas of this study, namely
plasma cytokines, plasma phospholipid phosphatidylcholine fatty acids and vitamin D in
Nigerian and Mexican DM2 subjects.
In Chapter two, levels of plasma cytokines in Nigerian DM2 subjects compared to controls are
reported. The section is divided into 4 parts: introduction, methodology, results and discussion
of the findings.
Chapter three reports the evaluation of the fatty acid composition of the plasma phospholipid
phosphatidylcholine fraction in Nigerian DM2 subjects. The chapter is also divided into 4 parts:
introduction, methodology, results and discussions.
Chapter four report on the plasma phospholipid fatty acid composition in Nigerian and Mexican
DM2 subjects. The results are compared across and within populations, and the findings
discussed accordingly.
Chapter five evaluates the relationships between fatty acids and cytokines in Nigerian DM2
subjects. The chapter is divided into 4 parts of introduction, methodology, results and
discussions.
Chapter six report on the findings of measurements of plasma vitamin D3 levels in Nigerian
DM2 and healthy control subjects.
Chapter seven consists of a general discussion of the overall study. It examines the possible
interactions of the inflammatory markers and fatty acids in the subjects affected by DM2. The
clinical implications of the findings in this study are discussed.
Chapter eight highlights areas of possible future research studies arising from the results of the
experimental work reported in this thesis.

viii
DEDICATION
I wish dedicate this award to my family: my dear wife Adaobi Ifeyinwa Oghagbon for her
understanding and support during this long studentship with my many absences from home,
and to our two boys Etinosa Newton Oghagbon and Eseosa Andrew Oghagbon who have
endured so much with mature understanding that belies their present ages of 12 and 10,
respectively. And, of course, to my late mother who ensured I made it through medical school
in Nigeria.

ix
CONTENTS
TITLE PAGE…………………………………………………………………… I
DECLARATION………………………………………………………………. II
ACKNOWLEDGEMENTS …………………………………………………… III
ABSTRACT……………………………………………………………………. IV
OVERVIEW OF THESIS……………………………………………………... VII
DEDICATION………………………………………………………………….. VIII
CONTENTS……………………………………………………………………. IX
FIGURES………………………………………………………………………. XIV
TABLES……………………………………………………………………….. XVI
LIST OF ABBREVIATIONS………………………………………………….. XVIII
PUBLICATIONS AND CONFERENCE PRESENTATIONS……………....... XXII
Chapter 1: General introduction....,………………………………………….. 1
1.1 History of diabetes mellitus……………………………………………… 1
1.2 Types of diabetes mellitus……………………………………………….. 2
1.2.1 Type 1 diabetes mellitus………………………………………. 2
1.2.2 Latent autoimmune diabetes in adult (LADA)………………... 2
1.2.3 Type 2 diabetes mellitus……………………………………….. 3
1.2.4 Gestational diabetes mellitus…………………………………… 4
1.3 Obesity and type 2 diabetes mellitus……………………………………. 4
1.4 Epidemiology of diabetes mellitus……………………………………… 6
1.5 Prediabetes and development of diabetes mellitus 2……………………. 7
1.6 Metabolic processes in the progression of prediabetes to frank DM2 …... 8
1.7 Natural history of DM2…………………………………………………. 9
x
1.8 Insulin receptor signaling................................................................................ 12
1.9 Insulin resistance.............................................................................................. 15
1.10 Metabolic and clinical significance of diabetes mellitus................................. 16
1.10.1 Electrolyte disorders......................................................................... 18
1.10.2 Lipid disorders................................................................................... 19
1.10.3 Hypertension...................................................................................... 20
1.10.4 Body sodium handling....................................................................... 20
1.10.5 Altered sympathetic nervous system................................................. 21
1.10.6 Disorders of fertility.......................................................................... 22
1.10.7 Bone disorders..................................................................................... 22
1.10.8 Diabetic neuropathy............................................................................. 23
1.11 Cytokines........................................................................................................ 24
1.11.1 Monocyte chemotactic protein-1 (MCP-1)..................................... 25
1.11.2 Interleukin-1 beta (IL-1β)................................................................ 25
1.11.3 Tumour necrosis factor -α (TNF-α)................................................... 26
1.11.4 Transforming growth factor – beta (TGF-1β)................................... 26
1.11.5 Interleukin-6 (IL-6)........................................................................... 27
1.11.6 Interferon-gamma (IFN-γ)................................................................ 29
1.11.7 Interleukin-4 (IL-4)........................................................................... 30
1.11.8 Interleukin-8 IL-8)............................................................................. 30
1.11.9 Interleukin-12 (IL-12)........................................................................ 31
1.11.10 Adiponectin........................................................................................ 31
1.11.11 Interleukin-10 (IL-10)........................................................................ 32
1.12 Cytokines in diabetes mellitus type 2............................................................... 34
1.13 Lipids and fatty acids....................................................................................... 35
1.13.1 Structure and nomenclature of fatty acids............................................ 37

xi
1.13.2 Biosynthesis of fatty acids................................................................... 38
1.13.3 Essential fatty acids in health and disease........................................... 38
1.13.4 Essential fatty acids and cellular membrane functions........................ 42
1.13.5 Dietary sources and occurrence of long chain fatty acids................... 43
1.13.6 Membrane fatty acid saturation and insulin signaling.......................... 44
1.13.7 Fatty acids, inflammation and diabetes mellitus 2................................ 45
1.14 Saturated versus unsaturated fatty acids in diabetes mellitus type 2................ 46
1.15 Vitamin D metabolism and functions................................................................ 47
1.15.1 Obesity, vitamin D and diabetes mellitus 2............................................ 49
1.15.2 Vitamin D and diabetes mellitus type 2.................................................. 50
1.15.3 Vitamin D in Africans........................................................................... 50
Chapter 2.0 Plasma cytokines in Nigerian diabetes mellitus type 2 subjects............ 51
2.1 Introduction........................................................................................................... 51
2.1.1 Aim of the study................................................................................................... 52
2.2 Materials and methods ........................................................................................ 52
2.2.1 Luminex multiplex analyte profiling........................................................ 54
2.2.1.1 Multiplex assay specificity....................................................... 56
2.2.1.2 Detection limits and calibration ranges of the cytokines measured. 56
2.2.1.3 Assay precision….................................................................... 57
2.2.1.4 Statistical analysis…………………………………………… 57
2.3 Results................................................................................................................ 58
2.3.1 Correlational analyses between plasma cytokines, adipokines and clinical
biochemistry markers.......................................................................... 69
2.3.2 Correlations between the different plasma cytokines............................ 69
2.4 Discussion.............................................................................................................. 79

xii
Chapter 3: Plasma phospholipid fatty acid composition in Nigerian diabetes mellitus
type 2.............................................................................................................................. 88
3.1 Introduction............................................................................................................ 88
3.2 Materials and methods........................................................................................... 89
3.2.1 Fatty acid analysis......................................................................... 90
3.2.1.1 Extraction of total fatty acids.................................................... 90
3.2.1.2 Partitioning................................................................................ 90
3.2.1.3 Rotary evaporation.................................................................... 90
3.2.1.4 Thin layer chromatography........................................................ 91
3.2.1.5 Methylation................................................................................ 91
3.2.1.6 Extraction of methyl esters........................................................ 91
3.2.1.7 Analysis of fatty acids............................................................... 92
3.2.1.8 Collection and integration analysis of data................................ 92
3.2.1.9 Statistical analysis....................................................................... 92
3.3 Results..................................................................................................................... 93
3.3.1 Correlational analyses in DM2................................................. 100
3.3.2 Correlation analyses in healthy control.................................... 105
3.4 Discussion............................................................................................................... 107
Chapter 4: Comparison of fatty acid profiles in Nigerian and Mexican DM2 subjects 112
4.1 Introduction............................................................................................................ 112
4.2 Materials and methods........................................................................................... 114
4.2.1 Statistical analysis............................................................................. 115
4.3 Results.................................................................................................................... 115
4.3.1 Correlation analyses in Mexican and Nigerian DM2 subjects......... 122
4.3.2 Correlation analyses in Mexican and Nigerian control subjects..... 129

xiii
4.4 Discussion............................................................................................................... 130
Chapter 5: Fatty acid and cytokines relationships in Nigeria type 2 diabetes mellitus
(DM2) subjects............................................................................................................... 136
5.1 Introduction.......................................................................................................... 136
5.2 Methodology........................................................................................................ 138
5.3 Results.................................................................................................................. 139
5.3.1 Correlation analyses between fatty acids and cytokines in DM2 subjects.......... 139
5.4 Discussion............................................................................................................ 148
Chapter 6: Plasma vitamin D levels in Nigerian diabetes mellitus type 2 patients.. 152
6.1 Introduction........................................................................................................ 152
6.2 Materials and methods....................................................................................... 153
6.2.1 Statistics............................................................................................................. 154
6.3 Results................................................................................................................ 154
6.4 Discussion........................................................................................................... 158
Chapter 7: General discussion..................................................................................... 160
Chapter 8: Future work.............................................................................................. 170
References...................................................................................................................... 172

xiv
FIGURES
Legend
Page
Figure 1.0 Progression of impaired glucose tolerance to frank diabetes and
associated biochemical changes.
10
Figure1.1 The triumvirate of DM2 pathophysiology. 11
Figure1.2 The omnious octet. 11
Figure 1.3a Insulin signalling and recruitment of glut-4 transporters to the plasma
membrane.
12
Figure 1.3b Signal transduction in insulin action. 15
Figure 1.4 Metabolic actions of insulin on metabolism of carbohydrate and fats in
the liver, adipose and muscle tissues.
17
Figure 1.5 Actions of insulin on carbohydrate, fat and proteins in normal and
pathophysiological states.
18
Figure 1.6 Triacylglycerols: three fatty acids attached to a glycerol molecule. 36
Figure 1.7 Structure of choline phosphoglyceride. 36
Figure 1.8 Structure of cis, cis –6, 9-octadecadienoic acid. 37
Figure 1.9 Structural relationship of stearic acid and varied unsaturated fatty acids. 39
Figure 1.10 Metabolism of n-6 and n-3 fatty acids metabolism. 40
Figure 1.11 Structure of linoleic acid, 18:2n-6. 42
Figure 1.12 Structure of α-linolenic acid, 18:3n-6. 42
Figure 2.0 Multiplex assay principle. 55
Figure 2.1 Logarithm of mean levels of IL-6, HOMA-B, TNF-α and IL-10 in
Nigeria DM2 and controls.
60
Figure 2.2 Comparism of plasma leptin level by disease status and gender. 67
Figure 2.2a. Plasma leptin level spread in Nigerian DM2 and healthy controls 68
Figure 2.3. Plasma IL-4 versus IL-12 in Nigerian DM2 subjects 70
Figure 2.4 Plasma IL-4 versus IFN-γ in Nigerian DM2 subjects. 71
Figure 2.5 IL-10 versus IL-12 in Nigerian DM2 subjects 72
Figure 2.6. Resistin versus TGF-1β in Nigerian control subjects. 74
Figure 2.7 Logarithm of mean plasma insulin level versus mean logarithm of mean
leptin level in Nigerian healthy control subjects.
75
Figure 2.8 Percent increase in mean IL-6 levels in Europe, Korea and Mexico
diabetics relative to the values in Nigerian DM2 subjects.
87
Figure 3.0 Comparison of mean % weight of palmitic acid, stearic acid and vaccenic
acid in Nigeria DM2 and control subjects.
95
Figure 3.1 Comparison of AA, adrenic acid and osbond acid in Nigerian DM2 and
control subjects.
96
Figure 3.2. Comparison of ratios of osbond/arachidonic acids, arachidonic/linoleic 99

xv
acids and oleic/stearic acids in Nigerian DM2 and control subjects.
Figure 3.3 Plasma Fasting plasma glucose (FPG) versus C18:0 in Nigerian DM2
subjects.
100
Figure 3.4 C18:0 versus C16:0 in Nigerian DM2 subjects. 101
Figure 3.5 C20:4n-6 versus C16:0 in Nigeria DM2 subjects. 101
Figure 3.6 C22:6n-3 versus C16:0 in Nigerian DM2 subjects. 102
Figure 3.7 C20:4n-6 versus C18:0 in Nigeria DM2 subjects. 103
Figure 3.8 Palmitoleic/palmitic acid ratio versus stearic acid in Nigerian DM2
subjects.
103
Figure 3.9 Oleic/stearic acid ratio versus stearic acid in Nigerian DM2 subjects. 104
Figure 3.10 C18:1n-9/C18:0 versus C20:4n-6 in Nigerian DM2 subjects. 104
Figure 3.11. The logarithm of HOMA-B versus C20:3n-6 in Nigerian healthy
control subjects.
105
Figure 3.12. De novo lipogenesis pathway. 111
Figure 4.0. Stearic acid versus myristic acid in Nigerian DM2 subjects. 125
Figure 4.1 Vaccenic acid versus palmitoleic acid in Nigerian DM2 subjects. 126
Figure 4.2. Vaccenic acid versus palmitoleic acid in Mexican MD2 subjects 127
Figure 4.3. Vaccenic versus total SFAs in Mexico DM2 subjects. 128
Figure 5.0. Palmitoleic acid versus TGF-1β in Nigerian control subjects. 142
Figure 5.1. Linoleic acid versus TGF-1β in Nigerian DM2 subjects. 144
Figure 5.2. Linoleic (C18:2n-6) acid versus MCP-1 in Nigerian DM2 subjects. 144
Figure 5.3. Adrenic acid versus TGF-1β in Nigerian control subjects. 145
Figure 5.4. EPA versus TGF-1β in Nigeria DM2 subjects. 146
Figure 5.5. DHA versus TGF-1β in Nigerian DM2 subjects. 146
Figure 5.6. Omega-3 index versus IL-12 in Nigerian DM2 subjects 147
Figure 6.0. Comparison of mean levels of vitamin D in Nigerian DM2 and healthy
control subjects.
155
Figure 6.1. Comparison of mean levels of vitamin D in Nigerian males and females
subjects. 156
Figure 6.2 The percentage of Nigerian subjects with different vitamin D levels
indicative of vitamin D status.
157

xvi
TABLES
Legend Page
Table 2.0. Mean values of biodata and routine clinical biochemistry tests in Nigerian
DM2 patients and healthy controls.
59
Table 2.1. Nonparametric Mann Whitney U test comparison of mean ± s.e.m values
of cytokines between Nigeria DM2 subjects and healthy control subjects.
61
Table 2.2. Comparison of mean logarithmic transformed values of the cytokines,
insulin and HOMA indices between Nigeria DM2 subjects and healthy control
subjects.
62
Table 2.3. Nonparametric Mann Whitney U test comparison of gender differences
in plasma cytokines, insulin and HOMA values in Nigeria DM2 subjects.
63
Table 2.3a. Student T-test comparison of gender differences in plasma cytokines,
insulin and HOMA in Nigerian DM2 subjects after logarithmic transformation of
cytokines data.
64
Table 2.4. Nonparametric Mann Whitney U test comparison of gender differences
in mean plasma cytokines, insulin and HOMA values in Nigerian healthy control
subjects.
65
Table 2.4a. Student T-test comparison of gender differences in plasma cytokines,
insulin and HOMA in Nigerian healthy control subjects after logarithmic
transformation of cytokine data.
66
Table 2.5. Cytokines to cytokine and insulin correlations in Nigerian DM2 subjects. 73
Table 2.6. Cytokines to cytokine and insulin correlations in Nigerian control
subjects.
77
Table 2.7. Cytokine to cytokine, and insulin, correlations in the total (DM2 and
controls) Nigerian study population.
78
Table 3.0. Comparison of some clinical parameters in Nigerian DM2 and healthy
control subjects.
93
Table 3.0.a. Comparison of insulin and HOMA indices in Nigerian DM2 and
healthy control subjects using Student T-test after logarithmic transformation of the
variables.
94
Table 3.1. Mean ± SD plasma phosphatidylcholine FAs in Nigerian DM2 and
healthy control subjects.
97
Table 3.2. Comparison of fatty acid ratios in Nigerian DM2 and healthy control
subjects.
98
Table 3.3. Correlations between FPG, HOMA indices (HOMA-B and HOMA-IR) in
Nigerian DM2 versus healthy control subjects.
106
Table 4.0. Comparison of biodata of Mexican DM2 and healthy control subjects, 116

xvii
and between Mexican males and females subjects.
Table 4.1. Plasma PC FA percent weight (mean ± SD) in Nigerian and Mexican
subjects compared by glycaemic status.
118
Table 4.2. Plasma PC FA ratios in Nigerian and Mexican subjects compared by
glycaemic status.
120
Table 4.3. Plasma PC FA percent weight (mean ± SD) in Nigerian and Mexican
subjects compared by country and glycaemic status.
123
Table 4.4. Plasma PC FA ratios in Nigerian and Mexican subjects compared by
country and glycaemic status.
124
Table 4.5. Mean weight percent of FAs in healthy non-diabetic subjects in different
nationalities and races.
135
Table 4.6. Mean weight percent of fatty acids in diabetes mellitus subjects in different
nationalities and races.
135
Table 5.0. Spearman correlation of FAs and cytokines in Nigerian DM2 versus
control subjects.
140
Table 6.0. Comparison of mean ± SD of age, FPG and vitamin D in Nigerian DM2
and healthy control subjects.
155
Table 6.1 Comparison of mean ± SD of age, FPG and 25-OH vitamin D between
Nigerian males and females subjects.
156

xviii
LIST OF ABBREVIATIONS
Abbreviation Meaning
1,25-(OH)2 D3…………………………………….. 1,25-Dihydroxyvitamin D3
AA ………………………………………..……….. Arachidonic acid
ALA ……………………………………..………… Alpha (α)-linolenic acid
ALT ……………………………………..………… Alanine transaminases
AST ……………………………………..………… Aspartate transaminases
COX …………………………………..…………… Cyclooxygenase
DAG ………………………………..……………… Diacylglycerol
DBP ………………………………..……………… Diastolic blood pressure
DGLA ……………………………..……………… Dihomo-γ-linolenic acid
DHA ……………………………..……………….. Docosahexaenoic acid
DN ……………………………..…………………, Diabetic peripheral neuropathy
DM1 …………………………..………………….. Type 1 Diabetes Mellitus
DM2 ………………………..…………………….. Type 2 Diabetes Mellitus
EDA …………………………..………………… Eicosadienoic acid
EFA ………………………..…………………… Essential fatty acids
Elovl ……………………...…………………… Elongase of very long chain fatty
acids
EPA ……………………..……………………… Eicosapentaenoic acid
EPO……………………..……………………… Evening primrose oil
FAs …………………...………………………… Fatty acids
FADS……………….…………………………… Fatty acid desaturases
FFAs ……………………………………………. Free fatty acids

xix
GAD65 ………………………………..………… Glutamic acid decarboxylase
type-65
GDM ………………………………...………….. Gestational diabetes mellitus
GC ……………………………..………………… Gas chromatography
GLA …………………………..………………… Gamma ()-linolenic acid
HDL-C ………………………..………………… High density lipoprotein-
cholesterol
HOMA ……………………......………………… Homoestasis model assessment
hsCRP ……………………………..……………. Highly sensitive C-reactive-
protein
IA-2/IA-2b ……………………………..………. Islet autoantibody -2/2-b
IFG ………………………………..…………… Impaired fasting glycaemia
IGT ……………………………..……………… Impaired glucose tolerance
IL ………………………..……………………… Interleukin
IR ………………………………………………. Insulin receptor
IRS …………………..…………………………. Insulin receptor substrates
JKN …………………..…………………………. Janus kinases
LA ………………………………………………. Linoleic acid
LC PUFAs ……………………………...……… Long chain polyunsaturated fatty-
acids
LDL-C …………………………………………... Low density lipoprotein-
cholesterol
LOX …………………………………..………… Lipoxygenase
LXR …………………………………..………… Liver X receptor
MCP-1 …………………………………..……… Monocyte chemotactic proteins-1

xx
MIP ……………………………………..……… Macrophage inflammatory-
proteins
mTOR ………………………………………..… Molecular targets of rapamycin
NFκβ …………………………………………… Nuclear factor kappa beta
OGTT …………………………………………… Oral glucose tolerance testing
PC …………………………………..…………… Phosphatidylcholine
PE …………...…………………………………… Phosphatidylethanolamine
PS …..……………………………………………. Phosphatidylserine
PI3K …..…………………………………………. Phosphatidylinositol 3-kinase
PKC ………..……………………………………. Protein kinase C
PRRs ………..…………………………………… Pattern-recognition receptors
PS ……...………………………………………… Serine phosphoglyceride
ROS …...………………………………………… Reactive oxygen species
RTKs …..………………………………………… Receptor tyrosine kinases
SBP …..…………………………………………. Systolic blood pressure
SCD …………..…………………………………. Stearoyl CoA decarboxylase
SD …………..…………………………………… Standard deviation
SREBP …………………………………………. Sterol regulatory binding protein
STAT …………………………...……………..... Signal transducer and activator of
transcription
TG …………………...…………………………. Triglyceride
TGF-β ……………………..…………………… Transforming growth factor-beta
TNF …………………………..………………… Tumour necrosis factor
TP …………………………….………………… Total protein
TLR ……………………………………………. Toll-like receptor
xxi
UVB ………………………..…………………… Ultra-violet B radiation
VDR ………………………..…………………… Vitamin D receptor
Vitamin D …………………..…………………… 25-OH hydroxyvitamin D
VLDL ………………………..…………………. Very low density lipoproteins
WC …………………………..…………………… Waist circumference
WHR ……………………………..……………… Waist-to-hip ratio

xxii
PUBLICATIONS AND CONFERENCE PRESENTATIONS
Publications
1. Oghagbon EK, Jimoh KA, Olaosebikan O, Harbige L. Increased central adiposity may not
underlie the marked elevation of IL-6 in diabetes mellitus patients in South-West, Nigeria.
West Afr J Med. 2014; 33(2): 130-135.
Publications in preparation
1. Oghagbon EK, Sobcynska-Malefora A, Chowdhry BZ and Harbige LS (2017) Plasma 25-
OH vitamin D3 is not associated with type 2 diabetes mellitus in Nigeria patients Submitted: J
Clin Biochem and Nutr
2. Harbige LS, Oghagbon EK, Chowdhry BZ, M Crook, Grebremeskel B, Eva Sedlak, R L.
Guadarrama-López, Valdés-Ramos R (2017) Plasma Phospholipid Fatty Acids
and Circulating Cytokines in African Nigerian type II Diabetics Compared to Healthy
Controls: A role for Omega-6 and Omega-3 Fatty acids and Further implications for the
Innate and Adaptive Immunity Hypothesis. For: Clinical Science.
3. Oghagbon EK, Chowdhry BZ, Guadarrama-López L, Grebremeskel K, Valdés-Ramos
R and Harbige LS (2017) provisional title: Comparison of Plasma Phospholipid Fatty
Acids, Circulating Cytokines, Adipokines and Inflammation in African Nigerian and Mexican
Type II Diabetes (DM2): Further Implications for the Pathogenesis of DM2. For:
Lancet/American Journal Clinical Nutrition
Conference poster presentations & abstracts
1. M Chaidas, E Oghagbon, M Xiang, LS Harbige. Circulating leptin in relation to the
inflammatory cytokine TNF-α in obese and non-obese human subjects in the UK. Presented at
the Regional conference of the Clinical Research Network, UK (Kent & Medway NIHR
Comprehensive Local Research Network) on 18th
April, 2012, University of Greenwich at
Medway, Kent, UK
xxiii
2. Oghagbon E, Jimoh AK, Harbige L. Increased central adiposity may not underlie marked
elevation of IL-6 in Nigerian diabetes mellitus patients. Presented at the International
conference organised by European Federation of Laboratory Medicine, Union Europeenne
Des Medecins Specialistes and Association for Clinical Biochemistry & Laboratory Medicine
- under the auspices of the IFCC, on 7 – 10th
Oct. 2014, in Liverpool, UK
3. Oghagbon E, Sedlak E, Ghebremeskel K, Harbige L. Plasma fatty acids in Nigerian
diabetes type 2 and non-diabetic subjects. ISSFAL South Africa September 2016 poster
presentation (submission Number 0723-000245), 5 – 9th
Sept. 2016.
4. Efosa Oghagbon, Laurence S. Harbige, Roxana Valdes-Ramos, Ana Laura Guadarrama-
López. Plasma Phosphatidylcholine Saturated and Monounsaturated Fatty Acids in Nigerian
and Mexico Type 2 Diabetes Mellitus Patients. Ann Nutr Metab. 2017; 71: 31-79. 259/64.
5. Efosa Oghagbon, Laurence S. Harbige, Roxana Valdes-Ramos, Ana Laura Guadarrama-
López.Circulating Cytokines and Phospholipid Fatty Acids in African Nigerian Type 2
Diabetes. Ann Nutr Metab. 2017, 71: 31-79. 259/65.

1
Chapter 1: General introduction
1.1 History of diabetes
A diabetes-like disease was first described in an Egyptian papyrus in 550 B.C., as “a rare
disease that caused patients to lose weight rapidly and urinate frequently” (Leopold, 1989).
Later, in the first century, the Greek physician Aretaeus recorded a disease with symptoms of
polydipsia, polyuria and loss of weight; calling it a destructive affliction. He named the
disease “diabetes” from the Greek word “siphon” or a “flowing through”. Leopold (1989)
described Aretaeus’s idea of diabetes thus: “For fluids do not remain in the body, but use the
body only as a channel through which they may flow out. Life lasts only for a time. For they
urinate with pain and painful is the emaciation. For no essential part of the drink is absorbed
by the body while great masses of the flesh are liquefied into urine".
On noting the sweetness of urine and blood of diabetics, Thomas Willis (in 1675) added the
word mellitus (honey sweet) to diabetes in describing the diagnosis of the disease. It was not
until 1776 that Matthew Dobson confirmed the presence of excess sugar in urine and blood as
the cause of the sweetness in the urine and blood of diabetics (Ahmed, 2002). Claude Bernard
later commenced scientific evaluation and understanding of diabetes by showing that the liver
produces glucose via enzymatic action on glycogen, and via an alternative pathway
independent of glycogen (Lefèbvre et al, 1996).
The experimental production of diabetes in pancreatectomised dogs (which was later reversed
by subcutaneous pancreatic transplantation in 1889 by Joseph Von Mering and Oskar
Minkowski) created the ground-work for the ultimate isolation of insulin by Banting and Best
in 1922 (Ahmed, 2002; Eknoyan et al, 2005). Prior to the work of Mering and Minkowski,
observations of patients who died of diabetes in the 19th
century often showed that the
pancreas was damaged. In 1869 Paul Langerhans, while working on his doctoral thesis,
described the 'abdominal salivary gland' now known as the pancreas; he found clusters of
“small homogenous cells lying in pairs of little groups together” within the pancreatic tissue
which were eventually shown to be the insulin-producing -cells i.e., islets of Langerhans
(www.diapedia.org).

2
1.2 Types of diabetes mellitus
1.2.1 Type 1 diabetes mellitus (DM1)
About 5-10% of diabetics have DM1 which is usually due to cell mediated autoimmune
destruction of the pancreatic -cells. Such destruction is responsible for the observation of
absolute insulin deficiency in affected patients. The disease has been variously referred to as
insulin-dependent diabetes or juvenile onset diabetes. Biochemical diagnosis of DM1 involves
demonstration of markers of immune destruction of the β-cells. Such markers include
autoantibodies to islet cells, insulin, glutamic acid decarboxylase type 65 (GAD65), and
tyrosine phosphatases IA-2 and IA-2b (American Diabetes Association, 2014). The
demonstration of autoantibody IA-2 is more predictive for development of type I diabetes;
however, it is less frequently found in such patients compared to GAD65 antibody (Towns et
al, 2011). DM1 has a strong HLA association, with linkage to the DQA and DQB genes, with
influence by the DRB genes. These HLA-DR/DQ alleles can be either predisposing or
protective. Though DM1 is known to be more common in children and adolescence, it has
also been reported to occur at any age (American Diabetes Association, 2014). A high
percentage of patients with DM1 are prone to other autoimmune diseases including Graves’
disease, Hashimoto’s thyroiditis, Addison’s disease, vitiligo, celiac sprue, autoimmune
hepatitis, myasthenia gravis and pernicious anaemia (ADA, 2014, deGraff et al, 2007).
1.2.2 Latent Autoimmune Diabetes in Adults (LADA)
Some non-obese adult DM2 subjects are known to have circulating anti-islet autoantibodies.
These patients are classified as having latent autoimmune diabetes in adults (LADA); a
disease occasionally referred to as type 1.5 diabetes (Towns et al, 2011). Over the past
decade, this group of adult non-insulin dependent diabetics have been shown to have
pancreatic antibodies similar to those found in DM1 patients (Tuomi et al, 2014). In these
autoantibody positive patients, diagnoses of diabetes are commonly made at younger ages.
Similarly, the patients progresses to insulin dependency more frequently and are less likely to
have evidence of metabolic syndrome than those without antibodies (Tuomi et al, 2014). The

3
finding of autoimmunity in this group of diabetic patients has caused LADA to be considered
an intermediate form of diabetes which shares features of both DM1 and DM2 (Chng et al,
2015). Different studies in Nigerian have shown LADA prevalence of 10.5% to 14% in the
South West and Northern regions of the country (Muazu & Okpe, 2016; Adeleye et al, 2012;
Ipadeola et al, 2015). These studies highlight the need to evaluate diabetic patients in the
country for possible presence of the GAD auto-antibody and therefore tailor their treatments
appropriately.
1.2.3 Type 2 diabetes mellitus (DM2)
Diabetes mellitus type 2 (DM2) is the commonest form of diabetes mellitus, accounting for
about 90–95% of cases in the hospital and community. It is also referred to as non–insulin
dependent diabetes or adult-onset diabetes. Unlike DM1 patients (with absolute lack of
insulin), these patients have insulin resistance and relative insulin deficiency. Most patients,
especially in the initial period of the disease, have normal or elevated insulin levels. The high
concentration of plasma glucose despite raised plasma insulin levels in insulin resistance,
suggests a need for more secretion of insulin by affected individuals in order to suppress
elevated endogenous production of glucose, for the establishment of euglycaemia. DM2
patients do not display autoimmune destruction of β-cells; a phenomenon which is
pathognomonic of DM1 patients. Hence these patients may live for long periods of time
without needing insulin treatment according to the American Diabetes Association (ADA)
(American Diabetes Association, 2014). The contribution of obesity to DM2 is significant and
it is a major cause of insulin resistance. The distribution of body fat, even in those not
traditionally described as obese, may be responsible for insulin resistance. This is the case in
those with large visceral adiposity. Due to a delay in diagnosis of DM2 and accompanying
gradual development of hyperglycaemia, the patients are at a high risk of vascular
(microvascular and macrovasular) complications. The risk of developing DM2 increases with
age, obesity, lack of physical activity, women with prior gestational diabetes mellitus (GDM),
hypertension and dyslipidaemia, with its frequency varying in different racial and ethnic
groups (American Diabetes Association, 2014).
4
1.2.4 Gestational diabetes mellitus (GDM)
GDM was earlier defined as any degree of glucose intolerance with onset or first recognition
during pregnancy. This definition did not exclude the possibility that unrecognized glucose
intolerance may have ante-dated or commenced concomitantly with the pregnancy. The
definition, however, facilitated a uniform strategy for detection and classification of GDM,
even though its limitations were known for many years. Although most cases resolve with
delivery of the child, the present definition of this condition implies that GDM persists
whether or not it ceases after the index pregnancy. In 2008–2009, the International
Association of Diabetes and Pregnancy Study Groups (IADPSG) recommended that high-risk
women found to have diabetes at their initial prenatal visit, using standard criteria, should
receive a diagnosis of overt and not gestational diabetes mellitus. Based on a recent National
Institutes of Health (NIH) consensus report, the ADA has slightly modified the
recommendations for diagnosing GDM. Approximately 7% of all pregnancies (ranging from
1 to 14%, depending on the population studied and the diagnostic tests employed) are
complicated by GDM. This translates to more than 200,000 cases of GDM being diagnosed in
the US annually (American Diabetes Association, 2014). The ongoing global epidemic of
obesity has led to a higher prevalence of DM2 in women of childbearing age, thus increasing
the number of pregnant women with undiagnosed DM2 (American Diabetes Association,
2014).
1.3 Obesity and type 2 diabetes mellitus
The increasing prevalence of obesity worldwide, including developing countries, has drawn
attention to the significance of this pandemic. In the US approximately two-thirds of the adult
population is considered to be overweight or obese, and similar trends are being recorded
globally (Tsai et al, 2011). Obesity is linked to many medical conditions including type 2
diabetes mellitus (DM2). This is because an obese subject is more likely to have insulin
resistance, glucose intolerance and DM2 compared to a lean person. An increase in body
weight is associated with increased caloric intake, sedentary lifestyle and elevated levels of
some cytokines (IL-6, TNF-α, resistin, visfatin, leptin, adiponectin) and proinflammatory

5
signals which have been reported to lead to IR and DM (Spranger et al, 2003, Hotasmiligil et
al, 2010).
Obesity is an important cause of increased plasma levels of non-esterified fatty acids (NEFAs)
and resultant lipotoxic environment in body tissues. Such toxicity around the pancreatic -
cells is known to lead to loss of the cell functions including insulin secretory ability. It is
known that significantly elevated circulating NEFAs reduces adipocyte and muscle glucose
uptake, in addition to promoting hepatic glucose output. Furthermore, the occurrence of
insulin resistance in vivo and a failure of the compensatory mechanism of β-cells in humans
contribute to increase amounts of NEFA levels via enhanced lipolysis (Al-Goblan et al, 2014).
Long term exposure to NEFAs is associated with significant malfunction in glucose-
stimulated insulin secretion pathways and reduced insulin biosynthesis. These are factors
consistent with insulin resistance, glucose intolerance, DM2 and dyslipidaemia.
The importance of hypercaloric diet and obesity in the pathophysiology of DM2 is supported
by the findings of a significant impact of a very-low calorie diet in the reversal of the disease.
Investigators in the UK showed that very-low calorie diet in DM2 patients is associated with
achieving non-diabetic fasting blood glucose levels and reduced intra-organ fat content
(Steven & Taylor R, 2015; Lim et al, 2011). The reversal of DM2, which has been
demonstrated in various bariatric surgeries irrespective of the type of surgery, has been more
related to the induction of sudden negative calorie balance in the treated patients (Knop &
Taylor, 2013). Though other mechanisms, including an increase in the activity of some gut
hormones such as GLP-1, has been indicated to play a role in bariatric surgery reversal of
DM2 (Knop & Taylor, 2013), the induction of negative energy balance was also supported by
the studies of Lim et al in 2011. It is suggested that significant negative energy balance
generates a signal that induces a series of metabolic events driving glucose and organ fat
normalization beyond those expected for the amount of weight loss. Therefore, efforts that
address weight gain and encourage its loss maybe the agenda of significance in the battle to
curtail the scourge of DM2.

6
1.4 Epidemiology of diabetes mellitus
Diabetes mellitus is the commonest endocrine disorder affecting almost 6% of the world's
population. In 2001, the International Diabetes Federation (IDF, 2001) predicted that the
number of diabetic patients would reach 300 million in 2025 with more than 97% of them
having type II diabetes (Adeghate et al, 2006). Over the years, various predictions of DM
prevalence and projections (Zimmet et al, 1995; King et al, 1998; Wild et al, 2004), have
underestimated the global burden of this disease. Wild et al, 2004 predicted that the global
burden of DM will increase from 171 million in year 2000 to 366 million by 2030, but this
has been shown by IDF (IDF, 2013) to be surpassed at 382 million people affected in 2013. A
report by IDF in 2013 projects that the number of those affected by DM will be up to 600
million by 2035 (IDF, 2013). Increasing prevalence of diabetes is now warned to continue to
rise for the next 4 decades (Mattei et al, 2015) and will have significant impact on life
expectancy (Oghagbon et al, 2014; Nicholson et al, 2011) via an increase in disease mortality
(Nicholson et al, 2011).
Available evidence shows that the global prevalence of DM has been rising since 1980 till
2014 when it was globally assessed in a study involving over 4 million people (NCD-Ris C,
2016). During this study period, the number of global deaths secondary to diabetes increased
by almost 400%. Consequent upon this huge impact of diabetes on mortality, morbidity and
health systems cost, especially in developing countries, there is an urgent need for population-
based interventions in the fight against the disease (NCD-Ris C, 2016). Such a population-
based approach in the evaluation and treatment options for DM will enhance early disease
detection and possibly identify pharmacological interventions suitable for prevention or delay
disease progress in affected populations (NCD-Ris C, 2016)
The increase in DM prevalence is due to rising number of new cases of the disease which is
driven by, amongst other factors, a high prevalence of obesity, an ageing population and lack
of exercise (Nicholson et al, 2011). Obesity is a major factor responsible for the increasing
prevalence of DM2 in different populations including those in developing countries (WHO,
2009). Recently, it has been shown via epigenome-wide association study that adiposity is
linked to widespread changes in DNA methylation. Alteration in the DNA methylation is now
thought to predict future development of DM2, thus making obesity a major contributor to the
7
rising global prevalence of DM2 (Wahl et al, 2017). The public health burden of DM in
developing countries is worrisome as about 80% of the global disease burden is borne by
those living in these countries (Zimmet et al, 2014). According to the report by IDF (IDF,
2013), the total number of persons affected by DM in Africa will increase by 109%; 19.8
million in 2013 to 41.4 million in 2035. This projected increase in Africa is the highest for all
the regions compared, and is about 5 times the 22% increase anticipated for Europe over the
same period (IDF, 2013). Nigeria, with a disease prevalence of 4.6 % (IDF, 2013), has 3.8
million people affected by DM; the highest on the Africa continent. These facts are of concern
to health care workers in Nigeria as the country could witness a proportionate burden of DM2
complications in the coming decades unless an integrated approach (suggested by Zimmet et
al, 2014) is applied. The integrated approach involves understanding all factors related to the
pathogenic mechanisms of DM in different populations. Otherwise, astronomic increases in
diabetic populations will strain the capabilities of the already strained healthcare institutions
in developing countries like Nigeria (Oghagbon et al, 2014), thus worsening non-
communicable disease death rates (Mattei et al, 2015).
1.5 Prediabetes and development of DM2
Various studies have shown differences in the progress of patients from prediabetes (impaired
fasting glycaemia [IFG] and impaired glucose tolerance [IGT]) to frank diabetes mellitus type
2 (DM2). A combination IFG and IGT, more than IFG alone, increases the progression of
glucose intolerance to DM2 (Nichols et al, 2007). This progression from prediabetes (IFG and
IGT) to DM2, occurs irrespective of socioeconomic development, arises in both developed
and developing economies (Nichols et al, 2007). According to Rewers et al (1995), depending
on the duration of follow-up and the ethnic group studied, approximately one-third of
individuals with IGT will progress to DM2. The development of prediabetes is said to
commence at earlier ages with the proportion of affected young people on the increase. Data
from the US shows that IFG prevalence in adolescents increased from 7% (Williams et al,
2005) to 13.1% in 2005-2006 (Li et al, 2008). Similarly, the incidence of DM2 varies in
different populations; usually in association with the prevailing degree of obesity (D’Adamo
et al, 2011). Other factors associated with the progression of prediabetes to diabetes include

8
increasing age, hypertension, dyslipidaemia (Nicolas et al, 2007, Henninger et al, 2015),
family history of diabetes, serum bilirubin, alkaline phosphatase, creatinine, adipose tissue
dysfunction (Henninger et al, 2015), male gender and hyperinsulinaemia (Henninger et al,
2015; Li et al, 2009).
Hyperinsulinaemia, due to insulin resistance, is a major factor underlying the pathophysiology
of DM2 (Henninger et al, 2015). Among non-diabetic adults aged ≥ 20 years in the US, mean
fasting insulin level increased by over 35% in less than a decade; 1998 – 1994 (Li et al, 2006).
Over the same period (1988-1994) and (1999-2002), US adults aged 20-74 years witnessed a
30.5% increase in obesity (Flegal et al, 2002; Hedley et al, 2004). The association of degree
of adiposity and obesity to development of insulin resistance, prediabetes and DM2 is well
documented among young people (Li et al, 2006). An increase in prevalence of
hyperinsulinaemia among young people could accelerate the projected increase in the number
of diabetics, in the future. Beyond progressing to DM2, the prediabetes state especially IGT is
linked to cardiovascular risk (Nathan et al, 2007); thus suggesting an overlap in the
pathogenic mechanisms between diabetes and macrovascular diseases.
1.6 Metabolic processes in progression of pre-diabetes to frank DM2
All DM2 patients go from a pre-diabetes [impaired fasting glycaemia (IFG) and/or impaired
glucose tolerance (IGT)] stage to frank DM2 characterised by hyperglycaemia that requires
medication for effective control (Figure 1.0). The rate of progress of IFG and/or IGT to DM2
varies with the population studied or whether prediabetes occurs singly or as a combination of
IFG and IGT (Nichols et al, 2007). Metabolic sequences underlying progression of
prediabetes to DM2 are: insulin resistance, -cell dysfunction, and increased hepatic glucose
production. The primary derangement in prediabetics is insulin resistance which is associated
with hyperinsulinaemia and alteration of the sub-cellular localisation of glucose transporter 4
i.e., GLUT-4 (Sadler et al, 2013). Early intervention in patients with
prediabetes/hyperinsulinaemia can delay the progression to DM2, and may allow early
treatment of macrovascular complications. Therefore, the pre-diabetes stage represents the
best time to commence treatment strategies that will reduce the burden of DM2 and its

9
complications. It is thought that diet, exercise or medication interventions are most effective
during the period (Ramlo-Halsted et al, 2000). The window of time to do this is about 6-10
years which is the length of time it may take a prediabetic to progress to DM2 (Nichols et al,
2007; Magalhães et al, 2010). The average age of type 2 diabetic patients in Nigeria is usually
in the fifth decade, as reported in different studies in the country (Adebisi et al, 2009;
Ebenezer et al, 2003; Unadike et al, 2011). Since insulin resistance and glucose intolerance
are present for up to a decade before frank DM2 develops, it is important to commence efforts
aimed at preventing or slowing diabetes by the fourth decade and possibly earlier in highly
susceptible individuals (Tuomi et al, 2014). This possibility has been demonstrated by Steven
& Taylor (2015) in a study where DM2 subjects put on very low calorie diet showed a 50%
chance of reversal to normoglycaemia. The patients who responded to this treatment were
said to be younger, had shorter duration of the disease and lower baseline fasting glucose
(Steven & Taylor, 2015). Return to normoglycaemia and improved pancreatic β-cell function
in responders to low calorie treatment was, earlier, shown by the same group to be associated
with reduced intra-organ fat levels in the liver and pancreas (Lim et al, 2011). Treatment
outcome may also be dependent on the degree of -cell damage prior to institution of
reversibility treatment. These studies and others are now seriously challenging the
inevitability of the progression of prediabetics to frank diabetes mellitus.
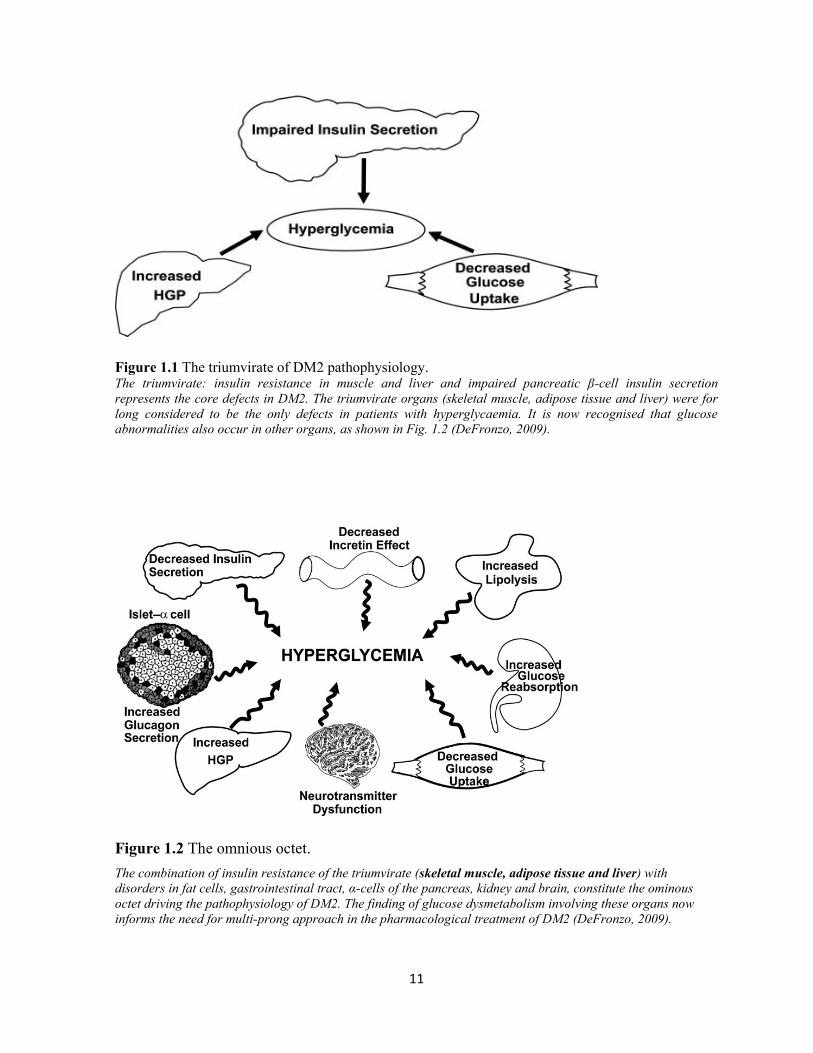
1.7 Natural history of DM2
According to DeFronzo (2009), the core pathophysiological defects in DM2 involve insulin
resistance in the muscle and liver as well as failure of the β-cells of the pancreas (Figure 1.1).
These are collectively referred to as the triumvirate of DM2 pathophysiology. In the liver,
insulin resistance is associated with overproduction of basal glucose in the presence of
hyperinsulinaemia and reduced suppression of hepatic glucose production.
Insulin resistance in the muscle is characterised by impaired glucose uptake thus leading to
hyperglycaemia. In the early stages of impaired glucose tolerance, pancreatic β-cells respond
to insulin resistance/reduced insulin sensitivity by secreting increased amounts of insulin.

10
Figure 1.0 Progression of impaired glucose tolerance to frank diabetes and associated biochemical
changes.
The data in the Figure above shows the transition spectrum from prediabetes (IGT) to diabetes mellitus type 2.
This phase is characterised by insulin resistance and increasing postprandial glucose, and it may last for upto 7
years (Ramlo-Halsted et al, 2000).
This compensation in insulin secretion initially prevents diabetic range blood glucose levels
(Oh et al, 2016). The onset of DM2 is associated with worsening β-cell function which is
characterised by reduced insulin secretion and β-cell mass (Oh et al, 2016). In addition to the
organs of the triumvirate mentioned above, dysmetabolism affecting fat cells (increased
lipolysis), the gastrointestinal tract (incretin deficiency/resistance), α-cells of the pancreas
(hyperglucagonaemia) as well as kidney (increased glucose reabsorption) and brain (insulin
resistance) cells play important roles in the pathophysiology of DM2.
Collectively, these eight players, shown in Figure 1.2, are referred to as the “ominous octet”
(DeFronzo, 2009). Worsening levels of glycaemia in the presence of reduced functioning of
the β-cells results, ultimately, in diabetic range hyperglycaemia.
11
Figure 1.1 The triumvirate of DM2 pathophysiology. The triumvirate: insulin resistance in muscle and liver and impaired pancreatic β-cell insulin secretion
represents the core defects in DM2. The triumvirate organs (skeletal muscle, adipose tissue and liver) were for
long considered to be the only defects in patients with hyperglycaemia. It is now recognised that glucose
abnormalities also occur in other organs, as shown in Fig. 1.2 (DeFronzo, 2009).
Figure 1.2 The omnious octet.
The combination of insulin resistance of the triumvirate (skeletal muscle, adipose tissue and liver) with
disorders in fat cells, gastrointestinal tract, α-cells of the pancreas, kidney and brain, constitute the ominous
octet driving the pathophysiology of DM2. The finding of glucose dysmetabolism involving these organs now
informs the need for multi-prong approach in the pharmacological treatment of DM2 (DeFronzo, 2009).
12
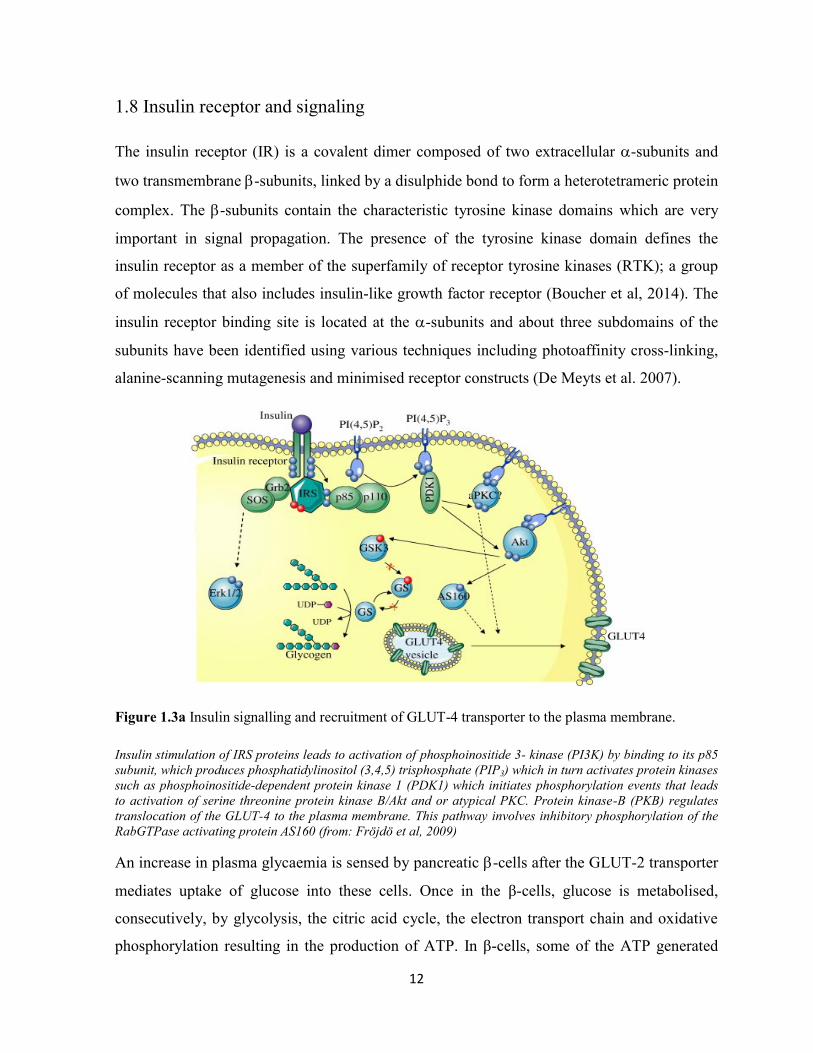
1.8 Insulin receptor and signaling
The insulin receptor (IR) is a covalent dimer composed of two extracellular -subunits and
two transmembrane -subunits, linked by a disulphide bond to form a heterotetrameric protein
complex. The -subunits contain the characteristic tyrosine kinase domains which are very
important in signal propagation. The presence of the tyrosine kinase domain defines the
insulin receptor as a member of the superfamily of receptor tyrosine kinases (RTK); a group
of molecules that also includes insulin-like growth factor receptor (Boucher et al, 2014). The
insulin receptor binding site is located at the -subunits and about three subdomains of the
subunits have been identified using various techniques including photoaffinity cross-linking,
alanine-scanning mutagenesis and minimised receptor constructs (De Meyts et al. 2007).
Figure 1.3a Insulin signalling and recruitment of GLUT-4 transporter to the plasma membrane.
Insulin stimulation of IRS proteins leads to activation of phosphoinositide 3- kinase (PI3K) by binding to its p85
subunit, which produces phosphatidylinositol (3,4,5) trisphosphate (PIP3) which in turn activates protein kinases
such as phosphoinositide-dependent protein kinase 1 (PDK1) which initiates phosphorylation events that leads
to activation of serine threonine protein kinase B/Akt and or atypical PKC. Protein kinase-B (PKB) regulates
translocation of the GLUT-4 to the plasma membrane. This pathway involves inhibitory phosphorylation of the
RabGTPase activating protein AS160 (from: Fröjdö et al, 2009)
An increase in plasma glycaemia is sensed by pancreatic -cells after the GLUT-2 transporter
mediates uptake of glucose into these cells. Once in the β-cells, glucose is metabolised,
consecutively, by glycolysis, the citric acid cycle, the electron transport chain and oxidative
phosphorylation resulting in the production of ATP. In β-cells, some of the ATP generated

13
inhibits the ATP-sensitive K+ channels thus leading to depolarisation of the plasma membrane
and subsequently cause the opening of voltage gated Ca2+
channels. The opening of the
channels leads to an increase in intracellular calcium thereby resulting in exocytosis of insulin
secretory vesicles and release of their contents (insulin) into the plasma circulation (Luo et al,
2011).
On binding to the IR, insulin cause the receptor to undergo a conformational change targeted
at inducing activation of the kinase activity in the receptor transmembrane β-subunits. This
leads to transphosphorylation of the β-subunits which allows its intracellular portion to recruit
insulin receptor substrates (IRS). IRS-1 through to IRS-6 are the best characterised group of
IRS, and they mediate the various actions of insulin (Boucher et al, 2014). Activation of
receptor kinase activities lead to recruitment of IRS to the plasma membrane, via the
pleckstrin homology (PH) and phosphotryrosine binding (PTB) domains on the receptor
amino terminus (Boucher et al, 2014). In muscle cells, insulin IRS-1 is the major docking
protein for glucose metabolism and subsequent glycogen synthesis. IRS-2 mediates insulin
action in the liver; including modulation of hepatic glucose production, gluconeogenesis and
glycogen formation (DeFronzo, 2004). After recruitment, IRS are phosphorylated by activated
receptors on multiple tyrosine sites which in turn become binding points for other intracellular
molecules that possess Src-homolgy 2 (SH2) domains (Sun et al, 1991). The
phosphoinositide-3 kinase (PI3-K) and Akt pathways are needed to link activated IRS to the
metabolic actions of insulin. PI3-kinases are heterdomimers made up of regulatory (P85α,
P85β, P55α, P50α; the P85α being the prominent unit) and catalytic (P110α, P110β, P110δ;
the P110α is more prominent) units (Vadas et al, 2011). Binding of the regulatory unit to a
catalytic subunit in the PI3K increases the catalytic subunit stability, hence keeping it in an
inhibited state. It is the binding of the regulatory unit of PI3K to IRS that results in its
activation (Boucher et al, 2014). Recruitment and activation of PI3K by tyrosine-
phosphorylated IRS requires the binding of the two SH2 domains in the regulatory subunits of
the kinases (Boucher et al, 2014). Once activated, the inhibited regulatory unit in turn
activates the catalytic unit and this phosphorylates phosphatidylinositol 4, 5-bisphosphate
(PIP2) to generate the second messenger phosphatidylinositol 3,4,5-triphosphate (PIP3).
Further effects of PIP3 are mediated by AGC (protein kinase A, protein kinase G, protein
kinase C) protein kinases and isoforms of protein kinase C (PKC) especially atypical PKCs

14
(Boucher et al, 2014). Activation of AGC kinases is achieved by phosphorylation of serine
and threonine residues on the kinases. This is achieved after the activation of 3-
phosphoinositide-dependent protein kinase (PDK-1) by membrane bound PIP3 through the
kinase PH domain. PDK-1 is the upstream kinase that cause phosphorylation of Akt at a
threonine residue (Thr-308). Full activation of Akt is achieved after serine (Ser-473)
phosphyrylation via the action of mammalian target of rapamycin complex 2 (mTORC2). The
isoform Akt2 is more abundant in insulin sensitive tissue thus mediating insulin action of
metabolisms (Boucher et al, 2014). The activation of Akt by PDK-1 and mTORC2 sets the
stage for further phosphorylation and activation of downstream targets that culminates in the
relocation of GLUT-4 to the membrane surface. Similarly, PDK-1 also stimulates activation
of the atypical protein kinases C (aPKC), PKC-δ and PKC-λ. PKC isoforms can function as
mediators or modifiers of insulin metabolic actions, but only the three mentioned above are
activated by PDK-1 and are found to play important roles in insulin-stimulated glucose
transport and regulation of lipid synthesis (Farese et al, 2010).
The above actions results in insulin stimulation of glucose transport into the cells, via GLUT-
4 transporters. Figures 1.3a & 1.3b show diagrammatic representations of the insulin signaling
process which ultimately leads to translocation of GLUT-4 molecules from the cytoplasm to
the plasma membrane. In addition to increasing the rate of GLUT-4 vesicle exocytosis, insulin
decreases the rate of internalisation of the transporter molecules thus improving its turnover
(Saltiel, 2001). The rate of glucose transport into fat and muscle cells is dependent on the
concentration and residence time of GLUT-4 at the cell surface. Ordinarily, in the absence of
insulin, GLUT-4 proteins slowly cycle between the intracellular compartment and cell
surface, but with a preference for intracellular location (Watson et al, 2004, Sadler et al,
2013). In addition to glucose metabolism, insulin actions also mediate gene expression, cell
growth differentiation and lipid synthesis. Elevation of plasma insulin in the insulin resistance
state does not influence glucose metabolism, but is still able to mediate the other pathways of
insulin action (Fig. 1.3b).
15
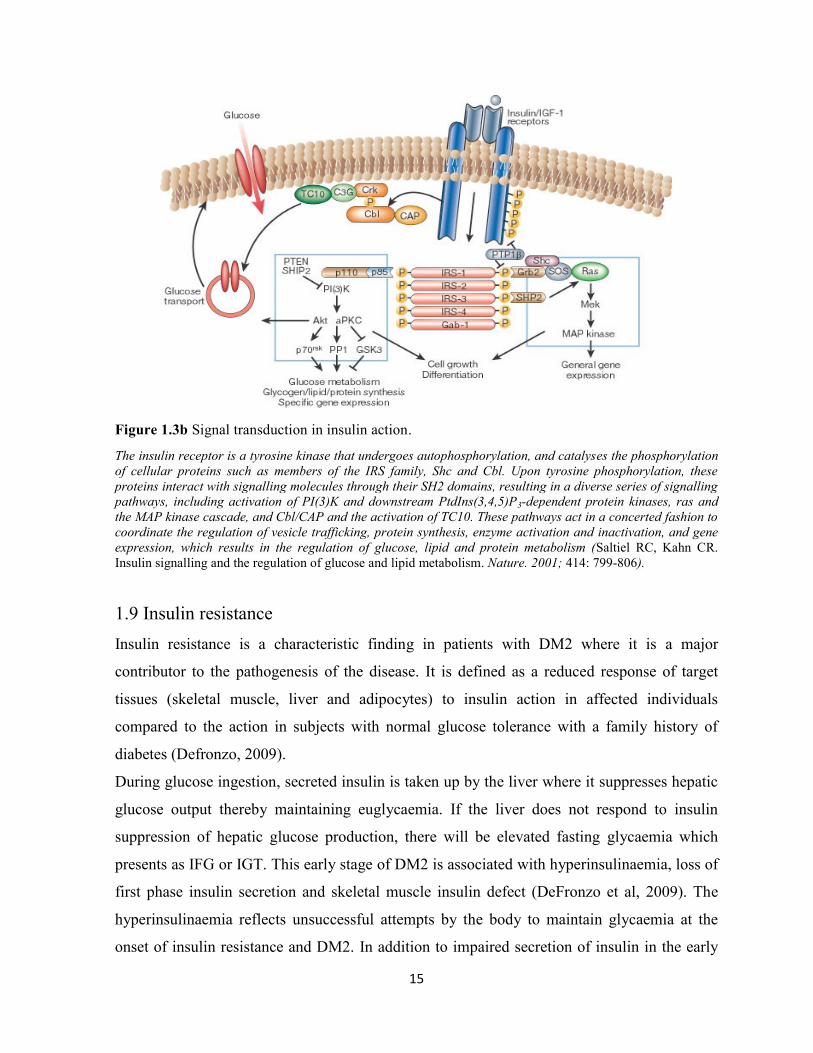
Figure 1.3b Signal transduction in insulin action.
The insulin receptor is a tyrosine kinase that undergoes autophosphorylation, and catalyses the phosphorylation
of cellular proteins such as members of the IRS family, Shc and Cbl. Upon tyrosine phosphorylation, these
proteins interact with signalling molecules through their SH2 domains, resulting in a diverse series of signalling
pathways, including activation of PI(3)K and downstream PtdIns(3,4,5)P3-dependent protein kinases, ras and
the MAP kinase cascade, and Cbl/CAP and the activation of TC10. These pathways act in a concerted fashion to
coordinate the regulation of vesicle trafficking, protein synthesis, enzyme activation and inactivation, and gene
expression, which results in the regulation of glucose, lipid and protein metabolism (Saltiel RC, Kahn CR.
Insulin signalling and the regulation of glucose and lipid metabolism. Nature. 2001; 414: 799-806).
1.9 Insulin resistance
Insulin resistance is a characteristic finding in patients with DM2 where it is a major
contributor to the pathogenesis of the disease. It is defined as a reduced response of target
tissues (skeletal muscle, liver and adipocytes) to insulin action in affected individuals
compared to the action in subjects with normal glucose tolerance with a family history of
diabetes (Defronzo, 2009).
During glucose ingestion, secreted insulin is taken up by the liver where it suppresses hepatic
glucose output thereby maintaining euglycaemia. If the liver does not respond to insulin
suppression of hepatic glucose production, there will be elevated fasting glycaemia which
presents as IFG or IGT. This early stage of DM2 is associated with hyperinsulinaemia, loss of
first phase insulin secretion and skeletal muscle insulin defect (DeFronzo et al, 2009). The
hyperinsulinaemia reflects unsuccessful attempts by the body to maintain glycaemia at the
onset of insulin resistance and DM2. In addition to impaired secretion of insulin in the early

16
stages of DM2, there is a reduction in -cell numbers and -cell neogenesis from the exocrine
ducts (Jansen et al, 2002). The largest proportion of insulin mediated impairment occurs in
muscle; muscle cells normally metabolise upto 80% of available glucose. Type 2 diabetes
mellitus is characterised by β-cell failure, but skeletal muscle IR is the initiating or primary
defect in such patients and this is known to be present for a long time before cell failure and
overt hyperglycaemia occur (Defronzo, 2009). Acquired abnormality of insulin metabolism is
associated with, among other factors, obesity, high saturated fat diet and hypertension. These
are thought to cause insulin resistance via increased inflammation, oxidative stress,
mitochondrial dysfunction, endoplasmic reticulum dysfunction, and lipid products such as
diacylglycerol, ceramide and vitamin D (Mokdad et al, 2000).
1.10 Metabolic and clinical significance of DM2
DM2 is commonly associated with clinical manifestation of hyperglycaemia and disordered
metabolism of fats and proteins (Hovens et al, 2005). The following factors: β-cell
dysfunction, hyperinsulinaemia, reduced peripheral utilisation of glucose, increased hepatic
and renal glucose production and elevated plasma levels of non-esterified fatty acids, are said
to underpin the clinico-metabolic parameters pathognomomic of the disease. Sadler et al
(2013) noted that the primary derangement (insulin resistance) found in the early stages of
DM2 is associated with ineffective localisation of GLUT-4. This is in addition to concomitant
elevation of counter-regulatory hormones (glucagon, catecholamines, cortisol, and growth
hormone). These hormonal alterations are responsible for the increase in hepatic and renal
glucose production, and impaired glucose utilization in peripheral tissues (DeFronzo et al,
2009).
Figure 1.2 shows the various actions of insulin which include lipogenesis (antilipolysis) and
increased glucose utilisation. The combination of insulin insufficiency/deficiency and
increased counter-regulatory hormones in diabetes, leads to increased lipolysis and release of
free fatty acids from adipose tissue to the plasma circulation. The increased plasma NEFAs is
associated with pancreatic lipotoxicity and the characteristic β-cell defect found in some cases
of IGT and early stages of DM2 (Ennis et al, 1994, Steven &Taylor, 2015). Some of these
effects of the IR are shown in Figures 1.4 and 1.5. Metabolic events associated with IGT and

17
DM2 have varied clinical manifestations; electrolyte disorders, lipid and vascular diseases,
hypertension, muscle disorders, bone disorders and infertility, amongst others. The elevated
level of insulin detected in subjects with IR may not be effective in driving peripheral glucose
metabolism, but is able to enhance other insulin mediated pathways. This is observed in the
sequential activation of Shc, Ras, Raf, and extracellular signal-regulated kinase mitogen-
activated protein kinase (MAPK) by hyperinsulinaemia in the mitogenic pathway (Cecilia et
al, 2003). Enhanced mitogenesis under the influence of elevated insulin levels leads to growth
of the cells, of vascular smooth muscle, endothelial, and skeletal muscle (Cecilia et al, 2003).
These actions of insulin on vascular smooth muscle cells and endothelium may have an
impact on the progression of cardiovascular diseases in affected patients (Lago et al, 2007).
Figure 1.4. Metabolic actions of insulin on the metabolism of carbohydrates and fats in the liver,
adipose and muscle tissues.
Key: I, liver; insulin causes increased glycogenesis (+), reduce glycogenolysis (-), reduced endogenous glucose production
and decreased ketogenesis (-) (these are defective in DM). II, adipose tissue; insulin mediated increase in lipogenesis (+) and
reduced lipolysis thus reducing plasma NEFAs (-). III, muscle; Similar to its effect in the liver, insulin causes increased
glucose uptake glycogenesis and reduced glycogenolysis (-). It can also be interpreted that in the absence of insulin or
dysfunctional insulin such as in IR, the actions marked (-) occur.
18
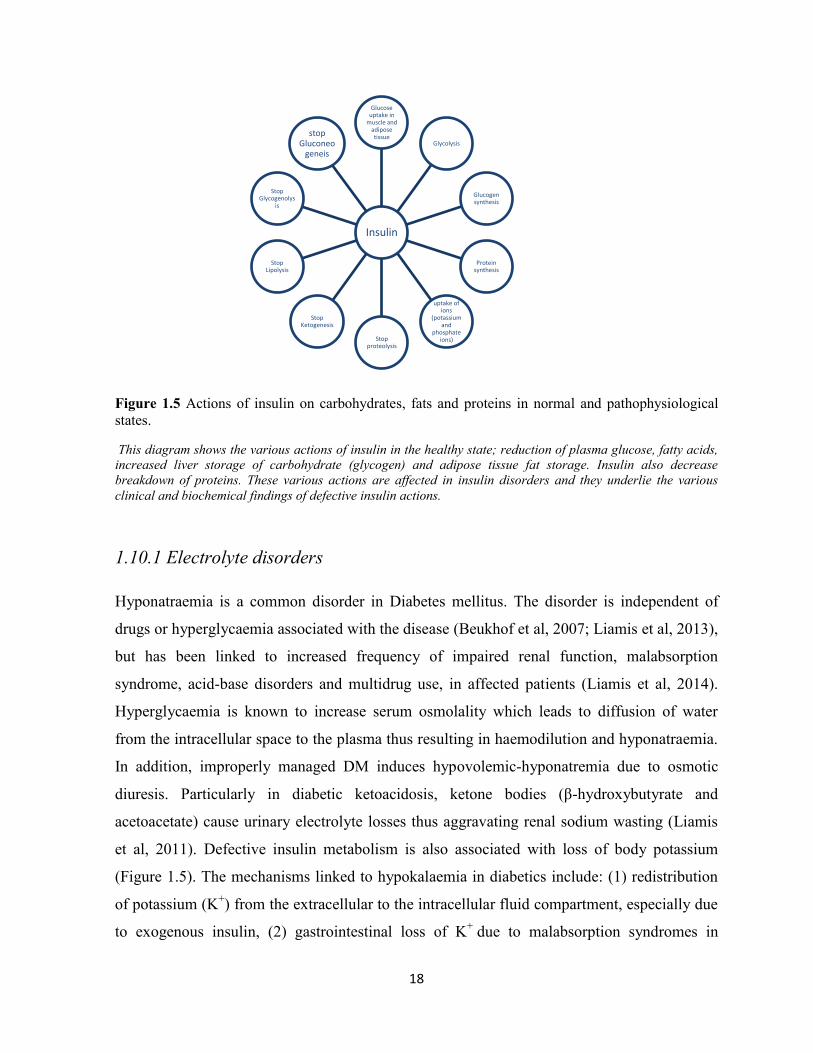
Figure 1.5 Actions of insulin on carbohydrates, fats and proteins in normal and pathophysiological
states.
This diagram shows the various actions of insulin in the healthy state; reduction of plasma glucose, fatty acids,
increased liver storage of carbohydrate (glycogen) and adipose tissue fat storage. Insulin also decrease
breakdown of proteins. These various actions are affected in insulin disorders and they underlie the various
clinical and biochemical findings of defective insulin actions.
1.10.1 Electrolyte disorders
Hyponatraemia is a common disorder in Diabetes mellitus. The disorder is independent of
drugs or hyperglycaemia associated with the disease (Beukhof et al, 2007; Liamis et al, 2013),
but has been linked to increased frequency of impaired renal function, malabsorption
syndrome, acid-base disorders and multidrug use, in affected patients (Liamis et al, 2014).
Hyperglycaemia is known to increase serum osmolality which leads to diffusion of water
from the intracellular space to the plasma thus resulting in haemodilution and hyponatraemia.
In addition, improperly managed DM induces hypovolemic-hyponatremia due to osmotic
diuresis. Particularly in diabetic ketoacidosis, ketone bodies (β-hydroxybutyrate and
acetoacetate) cause urinary electrolyte losses thus aggravating renal sodium wasting (Liamis
et al, 2011). Defective insulin metabolism is also associated with loss of body potassium
(Figure 1.5). The mechanisms linked to hypokalaemia in diabetics include: (1) redistribution
of potassium (K+) from the extracellular to the intracellular fluid compartment, especially due
to exogenous insulin, (2) gastrointestinal loss of K+ due to malabsorption syndromes in
Insulin
Glucose uptake in
muscle and adipose tissue
Glycolysis
Glucogen synthesis
Protein synthesis
uptake of ions
(potassium and
phosphate ions) Stop
proteolysis
Stop Ketogenesis
Stop Lipolysis
Stop Glycogenolys
is
stop Gluconeo
geneis

19
diabetes-induced motility disorders, and (3) renal loss of K+ (due to osmotic diuresis and/or
coexistent hypomagnesemia). Hypomagnesaemia induced hypokalaemia occurs as a result of
intracellular hypomagnesaemia (Mg2+
) induced activation of the renal outer medullary
K+ channel loss of K
+ (Yang et al, 2010). On the other hand, the occurrence of chronic
hyperkalemia, in some diabetics, is due to hyporeninemic hypoaldosteronism syndrome. The
condition is associated with reduced renal loss of potassium (Liamis et al, 2014).
1.10.2 Lipid disorders
In 1927 Joslin stated: "I believe the chief cause of premature development of atherosclerosis
in diabetes, save for advancing age, is an excess of fat, an excesss of fat in the body, an excess
of fat in the diet, and an excess of fat in the blood" (Joslin, 1927). By 1958, Albrink pointed
out that: "Hypertriglyceridaemia is the hyperlipidaemia par excellence of the
diabetic"(Allbrink, 1958). Diabetic dyslipidaemia is a cluster of plasma lipid and lipoprotein
abnormalities that are metabolically interrelated. Dyslipidaemia associated with insulin
resistance in those with visceral obesity and fatty liver, is linked with excessive flux of
substrates for VLDL assembly and upregulation of the metabolic machinery for VLDL
particles synthesis in the liver (Taskinen, 2005). In clinical practice, DM2 patients commonly
present with reduced plasma high-density lipoprotein cholesterol (HDL-C), elevated small
dense low density lipoprotein (sLDL-C) and raised triglyceride i.e Tg (Aslan et al, 2013). The
triad of low HDL-C, high sLDL-C and Tg constitute a significant atherogenic lipid profile
(Van et al, 2007). Increased atherosclerosis risk in DM patient is enhanced by the presence of
small dense LDL particles in such patients. These particles are able to transverse the
endothelium of blood vessels into the subendothelial space where they are retained by
proteoglycans and oxidised, thus setting the stage for the development of diabetic
cardiovascular complications (Aslan et al, 2013).
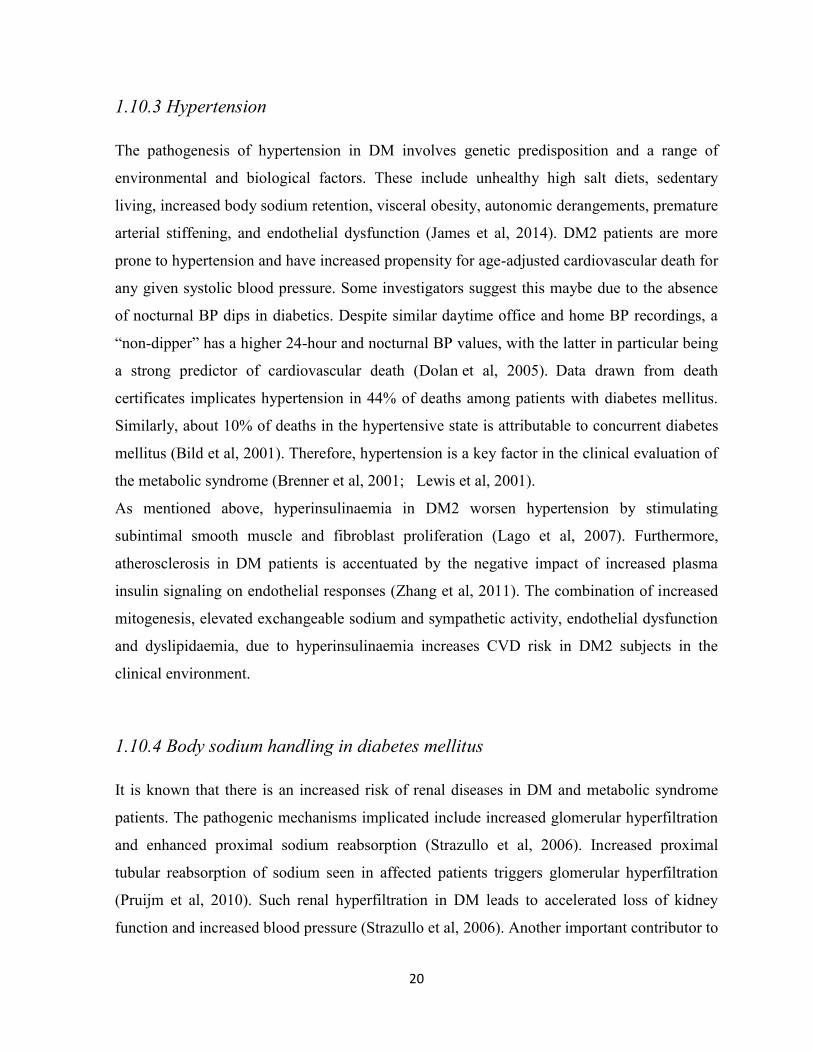
20
1.10.3 Hypertension
The pathogenesis of hypertension in DM involves genetic predisposition and a range of
environmental and biological factors. These include unhealthy high salt diets, sedentary
living, increased body sodium retention, visceral obesity, autonomic derangements, premature
arterial stiffening, and endothelial dysfunction (James et al, 2014). DM2 patients are more
prone to hypertension and have increased propensity for age-adjusted cardiovascular death for
any given systolic blood pressure. Some investigators suggest this maybe due to the absence
of nocturnal BP dips in diabetics. Despite similar daytime office and home BP recordings, a
“non-dipper” has a higher 24-hour and nocturnal BP values, with the latter in particular being
a strong predictor of cardiovascular death (Dolan et al, 2005). Data drawn from death
certificates implicates hypertension in 44% of deaths among patients with diabetes mellitus.
Similarly, about 10% of deaths in the hypertensive state is attributable to concurrent diabetes
mellitus (Bild et al, 2001). Therefore, hypertension is a key factor in the clinical evaluation of
the metabolic syndrome (Brenner et al, 2001; Lewis et al, 2001).
As mentioned above, hyperinsulinaemia in DM2 worsen hypertension by stimulating
subintimal smooth muscle and fibroblast proliferation (Lago et al, 2007). Furthermore,
atherosclerosis in DM patients is accentuated by the negative impact of increased plasma
insulin signaling on endothelial responses (Zhang et al, 2011). The combination of increased
mitogenesis, elevated exchangeable sodium and sympathetic activity, endothelial dysfunction
and dyslipidaemia, due to hyperinsulinaemia increases CVD risk in DM2 subjects in the
clinical environment.
1.10.4 Body sodium handling in diabetes mellitus
It is known that there is an increased risk of renal diseases in DM and metabolic syndrome
patients. The pathogenic mechanisms implicated include increased glomerular hyperfiltration
and enhanced proximal sodium reabsorption (Strazullo et al, 2006). Increased proximal
tubular reabsorption of sodium seen in affected patients triggers glomerular hyperfiltration
(Pruijm et al, 2010). Such renal hyperfiltration in DM leads to accelerated loss of kidney
function and increased blood pressure (Strazullo et al, 2006). Another important contributor to

21
renal dysfunction in IR and diabetics is stimulation of the renin-angiotensine-aldosterone
system (RAAS), especially in obesity (Stump et al, 2006; Kamide et al, 2004; Matayoshi et al,
2007). Hsueh et al (2011) believe that activation of the RAAS is a primary event in the
development of hypertension in DM2. They found that modulation of the RAAS slows the
progression of microvascular and macrovascular complications in patients with DM; hence
this is a target of interest in clinical management of such patients. Of significant interest is the
high prevalence of glomerular hyperfiltration and enhanced proximal tubular reabsorption of
sodium in people of African descent who have IFG or DM2 (Pruijm et al, 2010). These
predispose African diabetics to hypertension and kidney dysfunction. Another significant
finding in persons of African ancestry is higher prevalence of impaired renal autoregulation
(Burke et al, 2014). Such impairment increases the chance of developing progressive
glomerulosclerosis, even with modest blood pressure elevation. Therefore, it is important that
there should be strict clinical monitoring and management of blood pressure in diabetics,
especially in African diabetics (Burke et al, 2014).
1.10.5 Altered sympathetic nervous system
Increased activity of the sympathetic nervous system (SNS) is a mediator of hypertension in
the IR/hyperinsulinemia state. Such activiation stimulates increased renal sodium reabsorption
which leads to increase in blood volume and cardiac output (Sowers et al, 2001; Castro et al,
2003). In the Normative Ageing Study, SNS activity and insulin levels were found to be
increased in obesity (Ward et al, 1993; Hall et al, 2002), and these factors have been reported
to be responsible for the onset and development of hypertension (Masuo et al, 2005). Early
interventions targeted at disordered renal autoregulation, activation of RAAS in obese African
patients with impaired glucose tolerance/DM2 (Burke et al, 2014, Hsueh et al, 2011) and
increased SNS activity can be beneficial in the clinical management of patients. Such
pathophysiological targeted approaches will help to manage macrovascular complications
(coronary artery disease, stroke, and peripheral arterial disease) and microvascular
complications (diabetic neuropathy, nephropathy, and retinopathy) in DM2 subjects.
22
1.10.6 Disorders of infertility
The observed decrease in fecundity in modern societies has been related to DM2 (Hamilton &
Ventura, 2006) and its associated metabolic dysfunctions including insulin resistance and
inflammation (Tobias et al, 2013). The impact of DM on fertility affects both males and
females but more so among women with DM2 in later life (Tobias et al, 2013). One study
found that compared with non-diabetics, couples in which the men were diabetic were three
times more likely to seek treatment for infertility. Another study noted that despite similar
fertilization rates and embryo quality among diabetic and non-diabetic unions, pregnancy
rates were lower in couples with a diabetic male (Mulholland et al, 2011). Factors that have
been associated with diabetic male infertility are erectile dysfunction, retrograde ejaculation,
decreased libido and impotence (De Young et al, 2004; Fedele, 2005). Furthermore, DM
severely affects spermatogenesis with impact on both spermatozoa production and sperm
quality (Ballester et al, 2004). Molecular perturbations by DM on spermatogenesis include
subtle but vital changes such as increased sperm DNA damage. The foregoing has been
implicated in poor embryo quality and implantation in assisted reproductive therapy, thus
leading to an increase in the number of miscarriages (Mulholland et al, 2011). Other
significant biochemical changes in male DM patients include higher concentrations of
spermatozoa with disrupted transmembrane mitochondrial potential, activated caspase 3,
reactive oxygen species as well as fragmented nuclear and mitochondrial sperm DNA (Alves
et al, 2013; Roessner et al, 2012).
1.10.7 Bone disorders
The relationship between diabetes and bone disease is non-linear, as the effect of DM1 and
DM2 on bones are different. While the bone mineral density (BMD) is consistently low in
DM1, it is similar in non-diabetic and DM2 subjects. Nevertheless, both forms of diabetes are
associated with an increased risk of bone fracture (Isidro & Ruano, 2010). Studies have found
that the risk of hip fracture in DM2 patients is increased by 1.7-fold, compared with non-DM
controls, despite non- diminished bone mineral density (BMD) in the patients. In addition,
vertebral fracture risk of DM2 patients is increased compared to healthy non-diabetics. Some
researchers have interpreted this to mean that bone fragility in DM patients depends on bone
quality deterioration rather than bone mass reduction (Yamaguchi et al, 2012; Okazaki, 2011;
23
Carnevale et al, 2004). Various mechanisms thought to be responsible for the impact of DM2
on bone integrity include increased urinary excretion coupled with lower intestinal absorption
of calcium. Other factors are inappropriate homeostatic response to parathyroid hormone
secretion, alteration of vitamin D regulation, decreased or increased insulin and IGF-1
concentrations, and the effects of the accumulation of end products of glycation on bone
tissue (Carnevale et al, 2004; Isidro & Ruano, 2010).
1.10.8 Diabetic neuropathy
Diabetic neuropathy (DN) is the commonest complication of diabetes mellitus and it is a
source of significant morbidity and mortality in affected patients. It is a microvascular
complication of diabetes defined by the presence of symptoms and/or clinical signs of altered
nerve conduction after exclusion of other causes of neuropathy. Global prevalence of DN is
thought to be up to 65% (Arora & Niraj, 2013), but in the UK in 1993 it was estimated to be
28.5% (Young et al, 1993), 59.2% in Nigeria (Chinenye et al, 2012) and 69% in Mexico
(Ibarra et al, 2013). The microvascular complications underlying DN make diabetic patients
present 15 times more amputation risk of the lower limbs than the general population (Coste
et al, 2004). Clinical significance of DN is captured in the statistic that DN is implicated in
50-75% of non-traumatic amputations (Vinik et al, 2000). Peripheral diabetic neuropathy is
associated with changes in peripheral nerves, such as myelin damage and decrease in nerve
conduction velocity (Coste et al, 2004). The myelin sheath is a multilayered membrane
produced in the peripheral nervous system by differentiation of the plasmatic membrane of
Schwann cells (Garbay et al, 2000). The function of the myelin membrane is to allow efficient
transmission of nerve impulses along the axons. A major biochemical difference between
myelin and other biological membranes is its high lipid-to-protein ratio. An isolated myelin
sheath is made up of 70-80% lipids and 20-30% proteins (Garbay et al, 2000). The syndromes
affecting peripheral nerves can be separated into quickly reversible manifestations and
chronic progressive syndromes. The chronic progressive syndromes of DN manifest as
symmetric polyneuropathies and focal or multifocal neuropathies (Coste et al, 2004; Sima et
al, 1997). DN is an insidious disease which in clinical practice presents as apparition of pains
in the lower limbs and plantar ulcers. The complication of DN is initiated by hyperglycaemia
and associated metabolic abnormalities, especially in long standing disease (Coste et al,
http://www.ncbi.nlm.nih.gov/pubmed/?term=Carnevale%20V%5BAuthor%5D&cauthor=true&cauthor_uid=15133750
http://www.ncbi.nlm.nih.gov/pubmed/?term=Carnevale%20V%5BAuthor%5D&cauthor=true&cauthor_uid=15133750

24
2004). The Diabetes Control and Complications Trial studies confirmed this when it showed
that intensive insulin treatment reduced the development and progression of diabetic
neuropathy (DCCT, 1995). It is known that reduced or abnormal fatty acid synthesis plays an
important role in altered myelin lipid and protein composition. This alteration in myelin
affects membrane fluidity and function, ultimately contributing to the pathogenesis of DN
(Verheijen et al, 2009). In support of this notion, it has been shown that GLA
supplementations have shown promise in reducing the symptoms of DN (Keen et al, 1993).
This early observation by Keen and co-workers in 1993 is very significant because despite the
control of risk factors of macrovascular and microvascular diseases (blood pressure, lipids and
blood glucose levels) complications such as DN still occur (Kles & Vinik, 2006). The relevant
clinical advice is that targeted therapies to the underlying mechanisms of DN should be
investigated and instituted in the management of affected patients, in order to ameliorate this
debilitating complication of diabetes mellitus.
1.11 Cytokines
The immune system consists of sentinel trouble-shooting cells such as macrophages,
endothelial, mast, dendritic, neutrophils, eosinophils and innate lymphoid cells (Chng et al,
2015). The main functions of the system are to recognize and neutralize environmental
threats. This it does through the action of pattern-recognition receptors (PRRs) and release of
appropriate proinflammatory cytokines (Fernández-Real et al, 2008). Effective action of
immune cells depends heavily on appropriate communication of the cells via a complex
network that involves the secretion of small molecular weight proteins called cytokines.
Cytokines encompass a large and diverse family of proteins produced and secreted by
immunologically active cells. They have autocrine and paracrine actions, by which they
mediate their inflammatory (proinflammatory and anti-inflammatory) and immunoregulatory
effects (Alexandraki et al, 2006). Some of the cytokines of interest in this study are discussed
below.
25
1.11.1 Monocyte chemotactic protein-1 (MCP-1)
MCP-1 is secreted by a variety of cells including macrophages, endothelial cells, fibroblasts,
epithelial cells and adipocytes (McArdle et al, 2013). The secretion of MCP-1 in the presence
of IL-6, TNF-α and IL-1β, attracts dendritic cells, T-cells and more macrophages to adipose
tissues in obese patients (McArdle et al, 2013). This occurs by the binding of MCP-1 to G-
protein coupled receptors (GPCRs) on the surface of recruited leukocytes which are then
activated. Activated cells migrate to inflamed sites in white adipose tissue to perpetrate
further inflammation (McArdle et al, 2013). MCP-1 exhibits its most potent chemotactic
activity towards recruitment of monocytes and T-cells (Shu et al, 2012). In DM patients the
degree of hyperglycaemia, duration of disease, percentage body fat, BMI and WHR are
associated with elevated MCP-1 levels (Harsiman et al, 2009; Catalan et al, 2008). Therefore,
these factors should be considered in the management of inflammation affected patients.
1.11.2 Interleukin-1 beta (IL-1β)
A key factor in the pathogenesis of DM2 is the inability of pancreatic β-cells to compensate
for worsening IR activity by increasing the production of insulin to cope with the increase in
endogenous glucose production. This inability is associated with poor regeneration and
increased apoptosis of β-cells. Some studies, in animals and humans, have linked IL-1β to the
loss of -cell mass in DM2 (Dinarello et al, 2010); hypthosized to be induced by IL-1β
mediated autoinflammation, a process associated with high plasma glucose, lipoproteins,
oxidised free fatty acids and decreased level of IL-1Ra i.e IL-1 receptor antagonist (Dinarello
et al, 2010). The relevance of IL-1Ra was demonstrated in a clinical trial involving the use
anakinra (recombinant form of IL-1Ra), or the use of neutralizing anti-IL-1β antibodies in
diabetic subjects. These studies showed that reduction of IL-1β activity leads to reduced auto-
inflammation, elevated pancreatic cell regeneration and correction of dysfunctional β-cell
production of insulin in DM2 (Dinarello et al, 2010).
26
1.11.3 Tumour necrosis factor –α (TNF-α)
This cytokine is a member of the TNF superfamily. On the basis of amino acid sequence as
well as functional and structural similarities, the superfamily is divided into 19 distinct
cytokines/ligands. Family members include lymphotoxin-α, lymphotoxin-β and TRAIL (TNF
related apoptosis inducing ligand). Increased levels of MCP-1, in obese subjects, is associated
with a increase in TNF-α secretion by adipocytes (Schmidt et al, 2015). Apart from
adipocytes, TNF-α is also secreted by macrophages, monocytes, neutrophils and T-cells. The
association of TNF-α with inflammation, IR and DM2 was recognised by Hotamisligil in
1994. Some of the proinflammatory actions of TNF-α include down regulation of genes
required for insulin action, negative regulation of peroxisome proliferator activated receptor-γ
(PPARγ), poor insulin signaling and induction of elevated free fatty acids via enhanced
lipolysis (Amato et al, 2014; Schmidt et al, 2015). Due to its ability to induce the expression
of other cytokines, TNF-α has been referred to as a “master inflammatory cytokine” (Autieri,
2012). This cytokine is able to induce a cascade of proinflammatory cytokines such as IL-1β,
IL-8, MCP-1, intercellular adhesion molecules as well as vascular adhesion molecules
(Autieri, 2012). The levels of TNF-α, IL-6, MCP-1 correlates with the degree of glucose
intolerance and IR in obese patients (Titos et al, 2013). Therefore, its impact on inflammation,
insulin signaling and ability to induce other proinflammatory cytokines makes it a key factor
in the development of DM2.
1.11.4 Transforming growth factor-beta (TGF-β)
This is a prototypical member of the TGF superfamily which is made up of about 50 different
proteins. TGF-β is produced by macrophages, T lymphocytes, endothelial cells and vascular
smooth muscle cells (Autieri, 2012). Members of this superfamily are stable, multifunctional
polypeptide growth factors that help in development and maintainance of adult tissue
homeostasis. Their immune functions are mostly anti-inflammatory and Th2 polarising
(Autieri, 2012; Bottner et al, 2000). But in the presence of IL6, TGF-β1 promotes the
differentiation of naive T lymphocytes to proinflammatory Th1 cells that produce IL17. This
process of TGF-β mediated production of IL-17 is amplified by IL-1β and TNF-α (Gomes et
al, 2014). The stimuli for TGF-β production are hyperglycaemia, hyperinsulinaemia and
advanced glycation end-products (Gomes et al, 2014). In a study in India, TGF-beta and IL-17
27
showed a positive and negative correlation with fasting and postprandial glucose levels,
respectively (Vasanthakumar et al, 2015).
Elevated plasma and urinary levels of TGF-β have been found in the early stages of
prediabetes (Huan et al, 2010), and this is thought to be related to inflammation and
worsening metabolic abnormalities in patients with IR or DM (Genc et al, 2010). Such
elevation is beneficial for its anti-inflammatory, anti-atherogenic and Th2 polarising roles
(Autieri, 2012). The immune anti-inflammatory effect of TGF-𝛽 involves inhibition of
macrophages by interfering with toll-like receptor dependent signaling pathways (Gomes et
al, 2014) and suppression of other cells of the innate immune system (Sanjabi et al, 2009).
These actions are beneficial to inflammation mediated IR and insulin signal defects in DM2
subjects.
1.11.5 Interleukin-6 (IL-6)
IL-6 is a cytokine with a pleiotropic effect on inflammation, immune response, and
hematopoiesis. The protein is produced by immune-mediated cells, mesenchymal cells,
endothelial cells, fibroblasts and many other cells (Tanaka et al, 2014). In the past IL-6 was
recognised as a B-cell stimulatory factor 2 (BSF-2), hepatocyte-stimulating factor (HSF),
hybridoma growth factor (HGF) and interferon (IFN)-b2; based on recognised actions of the
protein at different times. When the BSF-2 cDNA was successfully cloned in 1986, it was
discovered that the molecules given different names by various groups were in fact identical,
resulting in the present name of IL-6 (Tanaka et al, 2014). Human IL-6 is made up of 212
amino acids, including a 28-amino-acid signal peptide, and its gene has been mapped to
chromosome 7p21 (Tanaka et al, 2014). The biological activity of IL-6 is mediated via IL-6R
(IL-6 receptor) and GP130 molecules. Binding of IL-6 to membrane-bound IL-6R (mIL-6R)
leads to homodimerisation of GP130 and subsequently to the formation of a high affinity
functional receptor complex referred to as IL-6/IL-6R/GP130. The homodimerisation of this
complex activates JAKs (Janus kinases) which then phosphorylate tyrosine residues in the
cytoplasmic domain of GP130. The GP130-mediated JAK activation by IL-6 in turn triggers
MAPK (mitogen activated protein kinase) and JAK/STAT (signal transducer and activator of
transcription) pathways, which are associated with the IR (Mihara et al, 2012).
28
The ability of IL-6 to promote specific differentiation of naıve CD4+ T cells makes it a link
between the innate and acquired immune response. IL-6 activation of pattern recognition
receptors (PRRs), toll-like receptors (TLRs), retinoic acid-inducible gene-1-like receptors,
nucleotide-binding oligomerization domain-like receptors, and DNA receptors, cause the
stimulation of a range of signaling pathways including NF-kB. In addition, activated PRRs
enhance the transcription of mRNAs for inflammatory cytokines such as IL-6, tumor necrosis
factor (TNF)-a, and IL-1b (Tanaka et al, 2014). Elevated IL-6 levels (in the presence of other
cytokines such as IL-1β, TNF-α and IFN-γ) have been associated with IR, increased free fatty
acids (FFAs) and a high risk of DM2. This is because the combination of increased levels of
the aforementioned pro-inflammatory cytokines causes a substantial loss of pancreatic islet
cells (Cieslak et al, 2015, Spranger et al, 2003). The increase in FFAs in IR/DM2 leads to
pancreatic β-cell dysfunction and apoptosis via induction of endoplasmic reticulum stress,
glucotoxicity, lipotoxicity and proinflammatory adipokines (Lee, 2013). The exact role of IL-
6 in the inflammatory process in diabetic populations is presently debated. Kimura et al
(2010) showed that IL-6 plays a vital role in the balance of the activity of proinflammatory
Th17 cells by regulatory T-cells (Tregs). In the same vein IL-6 can inhibit TGF-1β-induced
Treg differentiation (Korn et al, 2009; Tanaka et al, 2014). This balance produced by Tregs is
crucial for limiting proliferation of effector lymphocytes and thereby reduce the release of
proinflammatory cytokines. Furthermore, chronic elevation of IL-6 has been associated with a
permanent increase in expression of suppressor of cytokine signaling 3 and cytokine signaling
1 (SOCS3 and SOCS1) proteins. Sarvas et al (2013) reported that SOCS3 proteins inhibit
production of proinflammatory cytokines which utilises the NF-κβ pathway and also blocks
STAT3 (signal transducer and activator of transcription) which are activated by IL-6R
receptors. Hence SOCS proteins have been considered the most important endogenous
regulators of pro-inflammation especially those initiated via Toll-like receptors (Cieslak et al,
2015). One of the common polymorphisms in the IL-6 gene promoter (C-174G) is known to
regulate transcription in response to inflammatory stimuli such as lipopolysaccharides or IL-1
(Fishman et al, 1998). The IL-6 promoter SNP is considered as a risk factor for DM2
development (Illig et al, 2004). Circulating IL-6 levels have been reported to be elevated in
DM2 (Pickup et al, 1997; Joachim et al, 2003; Muller et al, 2003, Spranger et al, 2003;
Cardellini et al, 2007, Guadarama-Lopez et al, 2015). The concentration of this cytokine

29
independently predicts the risk of DM2 in affected subjects (Joachim et al, 2003). Elevation
of IL-6 in patients with impaired glucose tolerance (IGT) suggests it is an early marker of
glucose dysregulation (Muller et al, 2002). However, not all studies have found such IL-6
elevation in prediabetic subjects (Choi et al, 2004). The pattern of IL-6 in prediabetics and
diabetics vary from population to population and is related to the degree of dysglycaemia.
Studies of Italian Caucasians found that elevation of IL-6 to be higher in those with IGT and
type 2 DM, than in normal glucose tolerance and IFG individuals (Cardellini et al, 2007). IL-6
variability in different populations has been ascribed to variations in racial,
environmental/geographical conditions or nutritional status (Walston et al, 2007; Koster et al,
2006; Gimeno et al, 2007; de Britto et al, 2011).
1.11.6 Interferon-gamma (IFN-γ)
IFN-γ is produced by various cells including T-cells, macrophages, vascular smooth muscle
cells and mast cells. This is a signature cytokine used by Th1 and CD8+ T cells in their cell
mediated immune actions. It is not clear what triggers a switch in adipose tissue macrophage
phenotypes, but the process is associated with IFN-γ secreting Th1 cells and effector CD8+ T
cells. Emerging reports note that loss of regulatory T-cells and increased adipose expression
of T-cell chemokines such IFN-γ, play a dominant role in adipose Th1 cytokines prominence
and M1 phenotype switching (McGillicuddy et al, 2009). The IFN receptor consists of two
subunits (α and β) that dimerize upon ligand binding. Ligand binding leads to trans-activation
of Janus family kinases 1 and 2 (JAK1 and 2), tyrosine phosphorylation of signal transducers
and activator of transcription (STAT) molecules, before translocation to the nucleus where
they regulate gene transcription (McGullicuddy et al, 2009). Activation of JAK-STAT
pathways strongly induces suppressors of cytokine signaling molecules 1 and 3 (SOCS1 and
3) and this has been implicated in TNF-α induced insulin resistance in adipocyte and hepatic
insulin resistance (McGullicuddy et al, 2009). SOCS-1 and SOCS-3 inhibit signaling induced
by IFN-γ by inhibiting the JAK kinase-mediated phosphorylation and homodimerization of
STAT, necessary for signal translocation to the nucleus. This action is helpful in countering
the impact of IFN-γ in IR and DM2 (Karlsen et al, 2001). The importance of IFN-γ in the
pathogenesis of DM2 is supported by its impact on T-cell proliferation and adipose infiltration

30
of such cells; a phenomenon that is shown to precede macrophage recruitment to adipose
tissue (McGillicuddy et al 2009). IFN-γ affects glucose metabolism by inducing sustained loss
of insulin-stimulated glucose uptake in human adipocytes, coincident with reduced Akt
phosphorylation and down-regulation of the insulin receptor, insulin receptor substrate-1, and
GLUT4 (McGillicuddy et, 2009). These effects are in addition to its ability to desensitise
adipocytes to insulin and block the maturation of pre-adipocyte to mature adipocytes
(McGillicuddy et al, 2009).
1.11.7 Interleukin-4 (IL-4)
IL-4 plays a vital role in shaping the nature of immune responses to antigenic stimulation.
Upon activation, naive peripheral CD4+ T cells synthesise and secrete cytokines which can
serve as autocrine growth and differentiation factors. The binding of IL-4 to such naive T
cells (Th0) cause them to proliferate and differentiate into effector cells of the Th2 cell line
(Brown, 2008). Such action by IL-4 that results in skewing T-cells to Th2 cells and cytokines
has an immunodampening impact on macrophages and T-lymphocytes (Autieri, 2012).
Furthermore, IL-4 through STAT5, STAT6 and JAK proteins, suppresses IL-1β and TNF-α
synthesis (Autieri, 2012); hence, they are able to affect the impact of proinflammatory
cytokines on insulin signaling. IL-4 also regulates other immune functions including Ig
isotype switching and class II MHC expression by B cells, in addition to the differentiation of
T cell subsets described above (Brown, 2008). These actions of IL-4 are in keeping with anti-
inflammatory role of the cytokine and maybe beneficial in ameliorating the inflammation
underlying IR/DM2.
1.11.8 Interleukin-8 (IL-8)
Interleukin 8 (IL8) is a chemokine produced by macrophages, adipocytes and other cell types
including epithelial cells, airway smooth muscle cells and endothelial cells. It is a monomeric
polypeptide and a member of the CXC chemokine family which plays a crucial role in the
recruitment of neutrophils, monocytes and lymphocytes into tissues (Kobashi et al, 2009). IL-
8 production in human adipocytes is enhanced by other inflammatory mediators such TNF-α,
IL-1β, and CRP (Kobashi et al, 2006). In addition, IL-8 per se also enhances IL-8 mRNA
expression in human adipocytes thus propagating itself during inflammation (Kobashi et al,

31
2009). The net effect of increased IL-8 levels results in defective phosphorylation of the
PKB/Akt stage of insulin signaling thus inhibiting insulin-stimulated GLUT-4 translocation in
adipocytes (Kobashi et al, 2009). Hence this inflammatory cytokine has been associated with
diabetes mellitus.
1.11.9 Interleukin-12 (IL-12)
Antigen-presenting cells, such as monocytes and macrophages, are the primary sources of IL-
12. The cytokine (IL-12) induces the polarization of CD4+ T cells to their Th1 phenotype
(Wu et al, 2010), unlike the action of IL-4 described earlier, and this is a feature of
proinflammatory immune activity. IL-12, like IL-4 and IL-6, produces signals via the
JAK/STAT complex to induce formation of Th1 skewed cytokines such as IL-2, IL-18, and
IFN-γ (Autieri, 2012). The level of IL-12 has been reported to be higher in diabetics than in
healthy controls (Wegner et al, 2008), but the relative contribution of hyperglycaemia or
infections to IL-12 gene expression is the subject of current investigations. One study found
that the PBMCs of LPS-treated DM patients produced more IL-12 than that of LPS-treated
healthy controls, thus supporting the role of hyperglycaemia in IL-12 gene expression (Wu et
al, 2010; Chu et al, 2014).
1.11.10 Adiponectin
Adiponectin is an adipocyte-derived cytokine that plays crucial roles in metabolic disorders
such as obesity and diabetes mellitus. The opinion is that the link between obesity and
development of type 2 diabetes is partly mediated by altered secretion of adipokines such as
adiponectin, resistin and leptin by hypertrophied adipocytes. Adiponectin is considered an
anti-inflammatory cytokine with insulin sensitising properties, hence a reduction in its
conecentration may have a negative impact on glucose metabolism (Li et al, 2009). Whilst the
secretion of most adipokines increases with adipose tissue enlargement, the level of
adiponectin is inversely related to such an increase. The negative impact of enlarged adipose
tissue on adiponectin is attributable to inhibition of adiponectin gene transcription by
inflammatory and angiogenic factors secreted by hypertrophic adipocytes (Li et al, 2009;
Hajer et al, 2008). Metabolic studies in humans suggest several mechanisms by which
32
adiponectin decrease the risk of type 2 diabetes. These include suppression of hepatic
gluconeogenesis, stimulation of fatty acid oxidation in the liver, stimulation of fatty acid
oxidation and glucose uptake in skeletal muscle, as well as stimulation of insulin secretion (Li
et al, 2009). Adiponectin level differs between different ethnic groups, with its level reported
to be lower among African-Americans (Morimoto et al, 2014) and Asians (Conroy et al,
2011), but no such ethnic related report of adipokines has been reported for sub-Saharan
Africans. Some investigators are of the opinion that that adiponectin, in addition to its
established role as an anti-inflammatory cytokine, have some proinflammatory properties.
This was reported in a cell culture study in which adiponectin infusion led to an increase in
the levels of IL-8 and MCP-1 (Rovin et al, 2006) and in another study on subjects with
chronic obstructive disease who had increased levels of the adipokine (Oraby et al, 2014 ).
1.11.11. Interleukin 10 (IL-10)
The IL-10 family of cytokines consists of nine members: IL-10, IL-19, IL-20, IL-22, IL-24,
IL-26, and the more distantly related IL-28A, IL-28B, and IL-29 (Ouyang et al, 2011). As a
family, these cytokines are essential for maintaining the integrity and homeostasis of tissue
epithelial layers, in addition to protecting tissue epithelial through promotion of innate
immune responses against viral and bacterial infections (Ouyang et al, 2011). Specifically,
interleukin 10 (IL-10) is an anti-inflammatory cytokine produced by a wide range of immune
cells such as monocytes/ macrophages. It is a multifunctional regulatory cytokine involved in
the inflammatory response that functions as a general inhibitor of the proliferative and
cytokine response of both type 1 and type 2 helper T cells (Hong et al, 2009). Initially shown
to regulate T cell responses, many of the effects of IL-10 on T cell and NK cell function are
now known to be indirect, being mediated via a direct effect of IL-10 on monocyte-
macrophages. Hence, IL-10 is able to limit the production of proinflammatory cytokines
including IL-1, IL-6, IL-12, IL-18, and TNF-α and chemokines such as MCP1, MCP5,
RANTES, IL-8, IP-10, and MIP-2 (Couper et al, 2008). Furthermore, IL-10 acts directly on
CD4T cells, thereby inhibiting proliferation and production of IL-2, IFN-, IL-4, IL-5 and
TNF-α (Hong et al, 2009). Thus, IL-10 can directly regulate innate and adaptive Th1 and Th2
responses by limiting T cell activation and differentiation. In addition to inhibiting the
production of pro-inflammatory cytokines, the anti-inflammatory effects of IL-10 involves

33
inhibition of the biological activities of the cytokines on target cells (Hong et al, 2009). The
intracellular signaling event affected by IL-10 involves nuclear translocation of the signal
transducer and activator of transcription 3 (STAT3) and transcription of STAT3-responsive
genes including SOCS3 (Hong et al, 2009). The gene encoding IL-10 is located on
chromosome 1 (1q31-1q32) and three functional promoter single nucleotide polymorphisms
(SNPs) in the IL10 locus at –1082G/A (rs1800896), 819 T/C (rs1800871) and 592 A/C
(rs1800872) are said to be associated with increased risk of DM2 (Tsiavou et al, 2004). A
meta-analysis that evaluated the association of IL-10 gene polymorphisms: rs1800872 (- 592
C > A), rs1800896 (- 1082 A > G) and rs1800871 (- 819 C > T) with the risk of T2DM, found
that IL-10: rs1800872 (- 592 C > A) and rs1800871 (- 819 C > T) polymorphisms were
associated with DM risk only among African subjects. The IL-10 rs1800896 (-1082 A > G)
polymorphism was also associated with DM2 risk in Europeans and Asians, but not in
Africans (Tarabay et al, 2016). However, not all meta-analyses have found similar results but
they are in agreement that there is ethnic variation in the association of IL-10 polymorphisms
with the risk of DM2. It has recently been reported that in the DM2 state there is
hyporesponsiveness of immune to IL-10 or what has been referred to as “IL10 resistance”. In
vitro studies have shown that immune cells such as macrophages from humans with T2D do
not respond to IL-10 when they are cultured in physiologically-relevant hyperglycemia. In
such immune cells, IL-10 was less effective at inhibiting TNF-α secretion and activating
STAT3 downstream signaling protein, in the presence of hyperglycaemia (Barry et al, 2016).
This may be a key factor in the progression to DM2 in the presence of hyperglycaemia
associated with IR.

34
1.12 Cytokines in diabetes mellitus type 2
The association of cytokines, subclinical inflammation and the pathogenesis of DM2 was
made about two decades ago (Pickup et al, 1998), and since then the subject area has attracted
the attention of varied researchers. The human body’s initial response to assault whether by
microbial, chemical, physical or dietary agents, is activation of the innate immune response in
an effort to restore tissue homoeostasis via energy dependent processes (Benter, 2004; Takeda
et al, 2004). In obesity induced glucose intolerance, enlarged adipocytes due to calorie excess
and fat accumulation, cause release of tissue chemokines. The released chemokines further
cause additional recruitment of monocytes into adipose or muscle tissue, where the signal is
elaborated (Shoelson et al, 2006; King, 2008). In the tissues, monocytes differentiate into
macrophages and cause more release of inflammatory chemokines which propagates the
inflammatory milieu locally and systematically (Hotamisligil, 2006; Alexandraki et al, 2006).
The signal for attraction of monocytes to enlarged adipose tissue is generated by cellular
stress and apoptotic adipocyte cells. The resident macrophages in such expanding adipose
tissues are activated to an inflammatory phenotype; M1 phenotype which produce more
inflammatory cytokines (Bilan et al, 2009; Lumeng et al, 2007). Obesity mediated
macrophage activation results in the secretion of inflammatory cytokines including CRP, IL-
1β, IL-6, TNF-α (Giannoukakis et al, 1999; Dandona et al, 2003), and MCP-1 (Xu et al,
2003). The IL-1 family of cytokines made up of two proinflammatory cytokines (IL-1α and
IL-1β) and an anti-inflammatory protein [IL-1 receptor antagonist (IL-Ra)] (Banerjee et al,
2012) are very important in pancreatic -cell biology. The inductions of cell apoptosis by
IL-1β depletes e insulin producing cells and provokes immune responses, especially in the
presence of large numbers of apoptotic cells (Trudeau et al, 2000; Alexandraki et al, 2006).
The cellular metabolic stress/inflammation associated with obesity activates caspase-1 to
cause cleavage of pro-IL-1β to IL-1β, thereby propagating the inflammatory processes
(Donath et al, 2011). IL-1β is a major -cell cytotoxic cytokine, and its continous secretion
can cause significant reduction in pancreatic -cell mass and function (Donath et al,
2003).The pro-apoptotic effect of IL-1 β is aided by TNFα and IFN-γ (Donath et al, 2003).
The EPIC-Potsdam Study reported that a combination of cytokines rather than individual
cytokines is more related to the incident DM2 (Spranger et al, 2003). But they noted that

35
elevation of IL-6 can be independently used to predict the risk of DM2 (Spranger et al, 2003).
The net effect of cytokinopathy on glucose metabolism is disruption of whole body insulin
sensitivity, impairment of glucose homoeostasis and development of DM2. Elevated
proinflammatory cytokines are known to increase the transcription of inflammatory genes via
activated NF-κβ (Alexandraki et al, 2006) and reduced formation of the inhibitor of κβ (Iκβ)
which normally inhibits activation of NF-κβ (Dandona et al, 2005). Anti-inflammatory agents
can ameliorate the impact of inflammation on IR and glucose intolerance. Several lipid
mediators derived from PUFAs of both n-6 and n-3 molecules have been shown to facilitate
resolution of inflammation. Lipoxins generated from n-6 PUFA arachidonic acid, resolvins
and protectins derived from n-3 PUFAs (EPA and DHA), are good examples of endogenous
anti-inflammatory agents with significant proresolving actions (Titos et al, 2013). It has also
been reported that 1, 25 (OH)2 D3 (the active form of vitamin D3) and cyclooxygenase -2
(COX-2) inhibitors, can suppress the expression of MCP-1 (Hsieh et al, 2010; Lorente-
Cebrián et al, 2012) and thereby reduce inflammation due to the chemokine.
1.13 Lipids and fatty acids
Lipids are a diverse group of organic compounds which consist of -amongst other types-
simple lipids, triglycerides, complex lipids (phospholipids, glycolipids and lipoproteins) and
lipid derivatives (eicosanoids). A molecule formed by three different fatty acids attached to a
backbone of glycerol is called a triglyceride or triacylglycerol (Figure 1.6) and this is the
major storage lipid form in the body. Hence, triglycerides are esters of fatty acids and glycerol.
Lipids are made up of carbon and hydrogen atoms, but in addition they have a non-lipid
component in their molecular stucture. Fatty acids are hydrocarbon chains which
characteristically have an acid group (COOH) at one end and a methyl group (CH3) at the
other. Fatty acids are a major source of energy; either as stored energy in adipose tissue or
generated energy when fed into metabolic pathways in the mitochondria of the cells. Two fatty
acids and one phosphoric acid residue mixed with an acid ester of glycerol are called
phosphoglycerides. Phosphatidylcholine (PC) (Figure 1.7) and phosphatidylethanolamine (PE)
are major phospholipids in human and animal cell membranes. These phospholipids are
arranged to form a bimolecular layer in cell membrane, with the fatty acids chains directed to

36
the interior of such a membrane. The fatty acid composition of phospholipids modulates the
physical properties and function of cell membranes.
C
CH2.O.C.R
R.C.O
CH2.O.C.R
H
O
O
O
Figure 1.6 Structure of triacyglycerols.
Triacylglycerol: three fatty acids attached to a glycerol molecule. R represents the hydrocarbon chain of
the fatty acid.
Figure 1.7 Structure of phosphatidylcholines phosphatidate
Choline phosphoglycerides contains two fatty acids (R), a phosphatidate group (POO-) and a choline
molecule (HO.CH2.CH2.N+(CH3). They are all attached to a glycerol backbone.
C
CH2.O
R.C.O
CH2.O.C.R
H
O
O
P O
O
O
CH2CH2N(CH3)3

37
1.13.1 Structure and nomenclature of fatty acids
Fatty acids comprise of straight chain aliphatic monocarboxylic acids of an even number of
carbon atoms. These carbon atoms range from 4 to 30 in number, in any particular fatty acid.
Fatty acids are either saturated or unsaturated, depending on the absence or presence of a
double bond in the aliphatic chain. Saturated fatty acids have all carbon atoms joined by single
bonds and all bonding capacity saturated with hydrogen, with the exception of a terminal
carboxyl group that has a double bond.
Unsaturated fatty acids are further classified according to the number and position of double
bonds in their structures. In monounsaturated fatty acids, there is one double bond between a
pair of carbon atoms, but this is more than one such bond in polyunsaturated fatty acids. The
polyunsaturated fatty acids (PUFAs) differ in the position of the first double bond counting
from the methyl end (CH3) of the chain and this has been utilised in the common names
applied to these PUFAs, eg., n-3, n-6, and n-9. Another fatty acid identification method is by
the systematic chemical nomenclature conventions of the International Union of Pure and
Applied Chemistry (IUPAC), where the carboxyl carbon is numbered one and the positions of
the double bonds are denoted with reference to carbon 1. The abbreviation system (the omega
()-reference system) indicates the number of carbons and the number and position of the
double bonds closest to the methyl () carbon (Gurr et al, 2002); Figure 1.8.
9 6
CH3(CH2)7CH=CH.CH2.CH=CH(CH2)4COOH
Figure 1.8. Structure of cis, cis-6, 9-octadecadienoic acid.
This structure shows the omega-reference system for identifying fatty acids. The identification method indicates
the number of carbon atoms in the structure and the number and position of the double bonds closest to the
methyl (omega) carbon.

38
1.13.2 Biosynthesis of fatty acids
The synthesis of fatty acids (FAs) in animals begins with acetyl coenzyme-A which is
converted by fatty acid synthetase (FAS) to form palmitic acid (C16:0). Palmitic is then
elongated to stearic acid (18:0). Desaturation of stearic acid result in the formation of oleic
acid (18:1n-9). Only plants can synthesise linoleic (LA, 18:2n-6) and α-linolenic (ALA, 18:3n-
3) fatty acids from oleic acid by the introduction of double bonds between the existing double
bond and the terminal methyl group by the action of Δ12 and Δ15 desaturase, respectively
(Calder, 2012). Figure 1.9 shows the points of desaturation in LA and ALA. Further elongation
and desaturation of LA and ALA lead to the formation of 24:4n-6 and 24:5n-6, and 24:5n-3
and 24:6n-3, respectively. In the final step, retro-conversion of 24:5n-6 and 24:6n-3 to 22:5n-6
and 22:6n-3, takes place in the peroxisomes of cells (Calder, 2012). All other stages of the
conversion of LA and ALA into n-6 and n-3 polyunsaturated fatty acids, respectively, take
place in the endoplasmic reticulum of cells (Innis et al, 1999).
1.13.3 Essential fatty acids in health and diseases
Linoleic acid (LA) and and α-linolenic (ALA) are termed essential fatty acids (EFA) because
they cannot be synthesised by animals, hence they must be consumed in the diet to prevent
complications arising from their deficiencies. The chemical structures of the EFAs (LA and
ALA) are shown in Figures 1.11 & 1.12 below. Linoleic aicd and ALA are required for the
synthesis of n-6 and n-3 long chain polyunsaturated fatty acids (PUFA), respectively. Burr and
Burr first recognized the necessity of dietary linoleic and α-linolenic fatty acids in rats in 1929,
when they found that feeding rats a fat-free diet caused the development of various symptoms.
The symptoms range from dermatitis, growth retardation, reproductive failure, kidney damage,
to early death. However, these symptoms were alleviated when linoleic acid was fed to
affected animals. In 1963, Hansen et al., described linoleic acid deficiency in children with
dermatoses. The skin disorders (dermatitis, dry and thickened skin, desquamation and oozing
in intertiginous folds) noticed on feeding infants on a fat-free diet were later demonstrated to
be cured by the administration of 2% linoleic acid in diets.

39
Figure 1.9 Structural relationship of stearic acid and varied unsaturated fatty acids.
Stearic acid from diet or de novo lipogenesis, can be converted to oleic acid via the action of ∆-9 desaturase.
Linoleic acid (LA) and α-Linolenic acid (ALA) are similar with 18 carbon atoms in their structures just like
stearic acid and oleic acid, but LA and ALA cannot be formed by humans. The desaturation of oleic acids by ∆-
12 and ∆-15 desaturase leads to the formation of LA and ALA.
It is known that a significant dietary deficiency of LA is associated with accumulation of
meads acid (20:3n-9) with the triene/tetrane (20:3n-9/20:4n-6) ratio in fatty acids of tissue
lipids rising above 0.1 (Holman et al., 1982). Holman et al., in 1982 demonstrated the clinical
utility of ALA when the fatty acid was found to alleviate nutrition-induced-neuropathy caused
by dietary fatty acid deficiency. Similarly, arachidonic acid (AA, 20:4n-6) has been shown to
be a quantitatively important component of the phospholipid fraction of the brain in addition to
docosahexaenoic acid i.e DHA; C22:6n-3 (Crawford, 2000). Furthermore, these long chain
fatty acids have important functions in immune development and function. Harbige et al.,
(2003) noted that arachidonic acid is a major requirement for the metabolism of lymphoid and
other immune cells of the body.
FATTY ACID Stearic Oleic Linoleic α˗Linolenic
DEGREE OF
UNSATURATION
18:0 18:1 18:2 18:3
Structure (all double
bonds are cis)
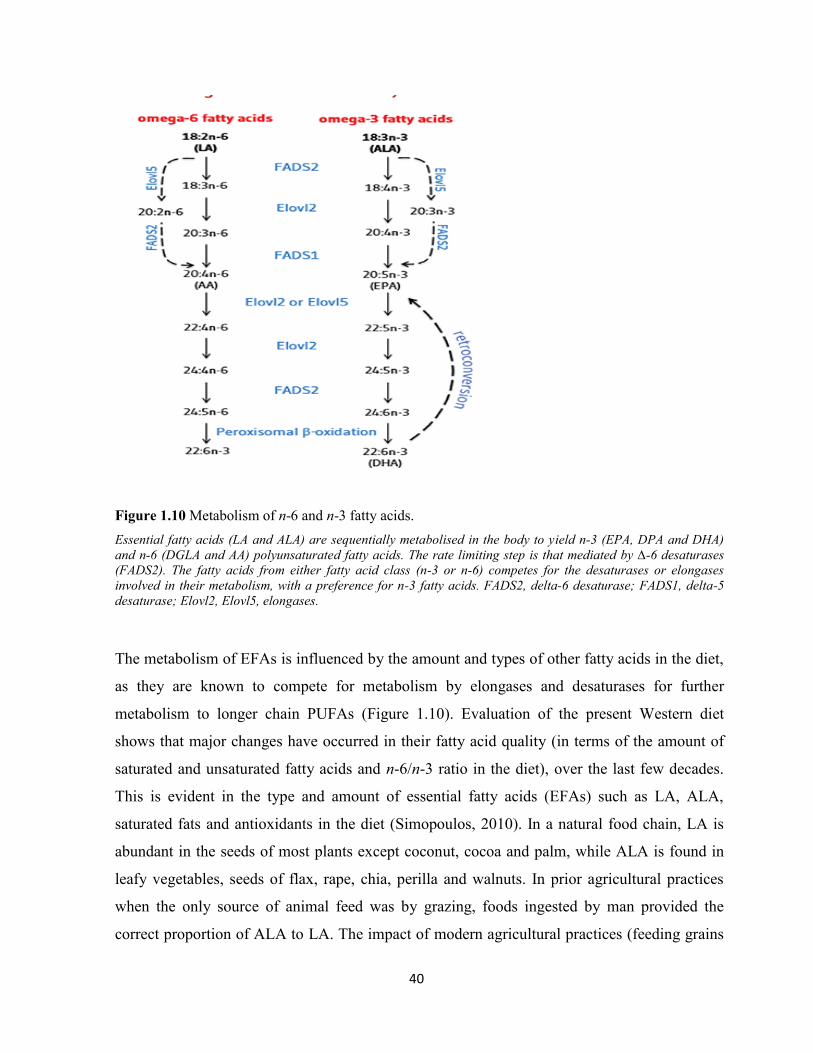
40
Figure 1.10 Metabolism of n-6 and n-3 fatty acids.
Essential fatty acids (LA and ALA) are sequentially metabolised in the body to yield n-3 (EPA, DPA and DHA)
and n-6 (DGLA and AA) polyunsaturated fatty acids. The rate limiting step is that mediated by ∆-6 desaturases
(FADS2). The fatty acids from either fatty acid class (n-3 or n-6) competes for the desaturases or elongases
involved in their metabolism, with a preference for n-3 fatty acids. FADS2, delta-6 desaturase; FADS1, delta-5
desaturase; Elovl2, Elovl5, elongases.
The metabolism of EFAs is influenced by the amount and types of other fatty acids in the diet,
as they are known to compete for metabolism by elongases and desaturases for further
metabolism to longer chain PUFAs (Figure 1.10). Evaluation of the present Western diet
shows that major changes have occurred in their fatty acid quality (in terms of the amount of
saturated and unsaturated fatty acids and n-6/n-3 ratio in the diet), over the last few decades.
This is evident in the type and amount of essential fatty acids (EFAs) such as LA, ALA,
saturated fats and antioxidants in the diet (Simopoulos, 2010). In a natural food chain, LA is
abundant in the seeds of most plants except coconut, cocoa and palm, while ALA is found in
leafy vegetables, seeds of flax, rape, chia, perilla and walnuts. In prior agricultural practices
when the only source of animal feed was by grazing, foods ingested by man provided the
correct proportion of ALA to LA. The impact of modern agricultural practices (feeding grains

41
to farm animals rather than grazing), easy production of large volume of vegetable oils from
seeds of corn, sunflower, safflower, cotton seed and soybean, have changed the quality and
quantity of oils consumed by man. This is because the presently farmed grains and vegetable
oils are richer in n-6 fatty acids (n-6 FAs) than n-3 fatty acids (n-3 FAs), in relation to
naturally occurring planst and animals (Simopoulos, 2010). The advent of feeding such grains
rich in LA oils to farm animals is a significant source of arachidonic acid (AA, 20:4n-6),
eicosapentaenoic acid (EPA, 20:5n-3) and docosahexaenoic acid (DHA, 22:6n-3), due to the
animals ability to convert LA and ALA to their respective longer chain metabolites; AA, EPA
and DHA (Eaton et al, 1996). It should be noted that the conversion of LA is much slower than
that of ALA, because desaturases (delta-5-desaturases; D5D, and delta-6-desaturases; D6D)
have more affinity for n-3 FAs (Emken et al, 1989). The implication is that a high intake of LA
can increase its tissue level; this occurs in a competitive manner and interferes with
desaturation of ALA to EPA and DHA (Emken et al, 1989).
During the hunter-gatherer era, the dietary LA to ALA ratio was thought to range from
approximately 1:1 (Simopoulos, 2010) to 2:1 (Eaton et al, 1998; Cordain et al, 2003). This is
much lower than a ratio of 15-20:1 estimated for present Western diets; hence, the diet is
significantly low in n-3 LC-PUFAs (Eaton et al, 1998). The increase in dietary AA is thought
to cause amplified generation of proinflammatory eicosanoids and may contribute to the high
rate of chronic diseases such as DM, cardiovascular diseases and asthma in different societies
(Stulnig, 2003). Some investigators suspect that a reduction in n-6/n-3 ratio of the present
Western diets, by increasing n-3 FAs or reduction of n-6 FAs, could lead to a reduction in the
prevalence of chronic diseases such as DM2 (Schuchardt et al, 2010). This decrease may be
due to the ability of ALA to reduce AA precursors in phospholipids and displace n-6 fatty
acids from the cyclooxygenase (COX) system (Schuchardt et al, 2010).

42
Figure 1.11. Chemical structures of EFA’s; linoleic acid, 18:2n-6 (cis,cis-Δ9,Δ
12).
Figure 1.12. Chemical structures of EFA’s; α–linolenic acid, 18:3n-3 (cis,cis,cis-Δ9,Δ
12,Δ
15).
1.13.4 Essential fatty acids and cellular membrane activities
The long chain fatty acid derivatives of LA and ALA constitute important components of cell
membranes (Eaton, 2006). The impact of unsaturated fatty acids in cell membranes includes
their ability to increase membrane fluidity. An increase in membrane fluidity improves the
functionality of membrane proteins such as the insulin receptor, and this helps to improve
insulin action (Corcoran et al, 2007). It is also known that incorporation of PUFAs in cell
membranes alters the organisation of membrane microdomains for specific membrane
functions (Edidin, 2003).
Membranes typically exist in a fluid state characterized by unconfined diffusion of its loosely
packed lipids. This state is therefore also called the liquid-disordered (ld) phase. Insertion of
PUFA (n-3 and n-6) acyl chains into membrane phospholipids creates disorder due to poor
domain cohesion between PUFAs and cholesterol molecules, thus forming a liquid disordered
phase (Edidin, 2003) and high conformational flexibility (Feller et al, 2002). The result of the
high conformation flexibility leads to an alteration of the physical properties of the plasma
membrane and endomembranes. These properties include lateral segregation or re-
organisation of the membrane bilayer, hydrophobic match, curvature stress and lateral
pressure density profile, which can modify protein functions, trafficking of molecules, vesicle
budding and fusion (Stillwell et al, 2003; Rajamoorthi et al, 2005; Carillo-Tripp et al, 2005).
The aforementioned changes in membrane structure and conformation are accompanied by
H3CCOOH
H3C COOH

43
changes in signaling proteins as they move between different domains. The domains are
created by the segregation of PUFA-containing phosphatidylethanolamine from lipid raft
molecules of sphingomyelin and cholesterol (Shaikh et al, 2002). Dietary PUFAs are usually
esterified in the sn-2 position of phosphatidylcholine and phosphatidylethanolamine of
cellular phospholipids, except in neuronal tissues where they are esterified in
phosphatidylserine phospholipids (Shaikh et al, 2006). Pertubations in cell membrane
composition and components by PUFAs are known to influence cellular responses and
disease development (Ma et al, 2004; Parveen et al, 2010).
The benefits of PUFAs in the body include activation of genes expressed in fatty acid
metabolism. This occurs via two mechanisms; binding to peroxismal proliferator activator
receptors (PPARs) and an increase in the expression of lipid related genes (acyl-CoA oxidase,
fatty acyl-CoA synthase and hydroxymethylglutaryl-CoA synthase). These actions promote -
oxidation of fatty acids in the mitochondria. It has been reported that n-3 and n-6 FAs affect
transcription of lipogenic genes (fatty acid synthase, stearoyl-CoA desaturase-1, L-pyruvate
kinase) by decreasing sterol regulatory binding protein-1c (SREBP-1c) activation; an action
that causes reduction in fat deposition in tissues (Schmitz et al, 2008; Coleman et al, 2004)
.
1.13.5 Dietary sources and occurrences of long chain fatty acids
Linoleic acid is abundant in plant oils. Corn, sunflower and soybean oils contain over 50% and
safflower oil up to 75%, of LA. In mammalian tissues, LA occurs at levels of 15% to 25% of
the total fatty acids. In heart cardiolipin, the amount of linoleic acid is up to 75% of the total
fatty acids (Christie, 2004). The richest known source of -linolenic acid (18:3n-6, GLA) is
borage seed oil or starflower oil which is derived from the borage plant (Borago officinalis).
The amount of GLA in borage oil, as a fraction of the total fatty acid content ranges from 18%
to 26% (Harbige et al, 2000). Other seed oils, such as blackcurrant and evening primrose oil
(EPO) also contain some GLA. Due to rapid conversion of GLA to longer chain metabolites;
dihomo-γ-linolenic acid (DGLA), its tissue level is usually less than 1% of the total fatty acids
(Christie, 2004). Dihomo-γ-linolenic acid (20:3n-6, DGLA), does not significantly accumulate
in animal tissues and is usually less than 1% of the fatty acids of phospholipids (Christie,
2004). Arachidonic acid (20:4n-6, AA), a derivative of DGLA, is the most abundant PUFA in
44
animal phospholipids. About 40% of the fatty acids in inositol phosphoglycerides is AA and
this fatty acid is mainly found in animal cells, because most plants lack the enzymes for
desaturation and elongation of GLA or DGLA to form AA. However, AA has been reported to
be found in some higher plants such as Agathis robusta (Christie, 2004).
Alpha-Linolenic (ALA) is mainly found in plant leaves and chloroplasts of algae and higher
plants. It constitutes about 65% of the total fatty acids in linseed oils. -Linolenic acid is low
in animal tissue where it constitutes less than 1% of the total fatty acids. Eicosatrienoic acid
(20:3n-3), occurs in small amounts (about 1%) in animals, with higher concentration found in
fish oils. Stearidonic acid (18:4n-3), is found in limited quantities in most plants, fish oils and
blackcurrant seed oil. Eicosatetraenoic acid (20:4n-3) is commonly found in algae and mosses,
although it is found in most fish oils, and is a minor component of phospholipids (Christie,
2004). Eicosapentaenoic acid (20:5n-3, EPA) is an important constituent of brain
phospholipids. EPA is synthesised from ALA via a series of chain elongations and desaturation
in the cells of marine plants, phytoplankton and unicellular algae. Hence, it is found in
significant amounts in fish oils as result of its transfer through the food chain to the fish.
Animal cells are known to be able to convert ALA to EPA (Calder, 1996). Docosahexaenoic
acid (22:6n-3, DHA), like EPA, is formed by elongation and desaturation of ALA in marine
algae and phytoplankton. Docosapentaenoic acid (22:5n-3, DPA) is an important constituent of
fish oils. Reports have shown that animal cells can slowly convert ALA to DHA (Calder,
1996). This slow conversion of ALA to DHA in animals is further compromised in the
presence of large dietary amount of LA.
1.13.6 Membrane fatty acid saturation and insulin signaling
The impact of a change or replacement of a single double bond in membrane fatty acids on
membrane fluidity and function was recognised a long time ago (Youdim, 2000). These
functions include-for example-protein transport, Ca/Mg ATPase activity in the sarcoplasmic
reticulum, generation of adenyl cyclase and 5-nucleotidase as well as other enzymes involved
in metabolic cycles including the phoshpoinositide cycle which controls cells division, growth
and development, including those of immune cells (Youdim, 2000). When activated,
45
membrane bound phospholipases split membrane phospholipids into two important second
messengers; inositol 1, 4, 5-triphosphate (IP3) and diacylglycerol (DAG) (Youdim, 2000). IP3
causes the release of cytosolic calcium ions while DAG, in conjunction with calcium ions and
serine phosphoglyceride, leads to the activation of a protein kinase C (PKC) which in turn
phosphorylates a number of intracellular proteins. The level of saturation or unsaturation of
choline phosphoglyceride (PC) influences the activity of PKC-alpha (PKC-α). Similarly, an
increase in the level of unsaturation of serine phosphoglyceride (PS) decreases PKC-alpha
activity. This suggests that the effect of PC and PS are related to specific lipid-protein
interactions, and demonstrates how the dietary content of PUFAs or saturated FAs manipulate
the PKC mediated signal transduction pathway by altering membrane phospholipid fatty acid
content. The PKC pathway aids in insulin binding, recruitment and activation of IRS-1 and
down-stream molecules and its impairment is associated with IR and diabetes mellitus
(Draznin, 2006).
1.13.7 Fatty acids, inflammation and diabetes mellitus 2
Excess calorie intake, especially of a high saturated fat diet, is an important source of
systemic inflammation and is related to DM2 and obesity. The importance of such a diet in
inflammation is shown by the reduction in TNF-α and ROS levels, when affected subjects
undertake dietary restriction (Duncan et al, 2000), even for a brief period (Dandona et al,
2001). A primary event in hyperalimentation is sequestration of excess energy in adipocytes
in the form of fat (Spiegelman et al, 2001). This is tolerable because adipocyte cells act as a
natural storage depot for fats in the body. The storage function of adipocytes is limited; hence,
when overloaded by fat beyond a critical level they begin to show signs of cellular stress.
These signs are cellular hypertrophy, mechanical stress, changes in lipid composition,
hypoxia, mitochondria dysfunction, production of ROS, apoptotic signalling, increased FAs
release, altered adipokine signalling and endoplasmic reticulum stress (Gregor et al, 2007;
Hotamisligil, 2010). Insulin resistance is associated with decreased mitochondrial numbers,
lower levels of mitochondrial enzymes and reduced ATP synthesis (Harith et al, 2013).
Several lipid mediators derived from PUFAs of both n-6 and n-3 molecules have been shown
to facilitate resolution of inflammation. Lipoxins generated from n-6 PUFA arachidonic acid,

46
resolvins and protectins derived from n-3 PUFAs (EPA and DHA), are good examples of
endogenous anti-inflammatory agents with significant pro-resolvin actions (Titos et al, 2013).
1.14 Saturated versus unsaturated fatty acids in diabetes mellitus type 2
Elevated fatty acids (FAs), whether due to high dietary fat or aberrant lipolysis in
overburdened adipocytes, leads to altered metabolic and immune signaling in obesity
(Olefsky et al, 2010). Some effects of high intake of dietary SFAs are increased cellular
intramyocellular lipid deposition, changes in diacylglycerol content, accumulation of
ceramide, mitochondrial dysfunction and impairment of insulin signaling (Shimabukuro et al,
1998). Chronic free FA toxicity on pancreatic beta-cells manifest as increased beta cell
apoptosis and reduced cell number; this tilts susceptible IGT subjects to frank DM2 (Stein et
al, 1997). Saturated FAs can also directly influence immune signaling via activation of pattern
recognition molecule such as Toll-like Receptors (TLRs) and these subsequently activate c-
Jun NH2-terminal kinase (JNK) to further trigger the inflammatory cascade (Lee et al, 2001;
Song et al; 2006). It is not certain whether free fatty acids (FFAs) are directly recognized by
TLRs or if activation involves other factors (Hummasti et al, 2010). It is thought that dietary
FAs act directly on TLRs, especially TLR2 and TLR4, to cause induction of NF-kβ (Lee et al,
2001; Lee et al, 2003, Shi et al, 2006), although other alternative mechanisms may link FAs to
TLR-associated pathologies (Erridge et al, 2009). Notwithstanding which mechanism is
operational, saturated fatty acids (SFAs) enhance inflammation and insulin resistance
compared to PUFAs. Han et al (2010), showed that SFAs increase inflammatory markers
(serum amyloid A, MCP-1), reactive oxygen species (ROS) and NF-kβ. They also reported
that polyunsaturated fatty acids (PUFAs) such as arachidonic acid (AA), eicosapentaenoic
acid (EPA) and docosahexaenoic acid (DHA) decreased the same inflammatory markers
elevated by SFAs (Han et al, 2010).
The impacts of SFA on inflammatory markers are not the same. For example, palmitate and
myristate increases inflammatory processes (Shi et al, 2006; Han et al, 2010), but stearate
(Han et al, 2010) and laurate (Shi et al, 2006) do not. Similar differential action has been
recorded for PUFAs in relation to inflammation. Arachidonic acid (AA), EPA and DHA have
been shown to strongly suppress gene expression for inflammatory cytokines i.e. MCP-1, IL-
47
6, TNF-α (Han et al, 2010; Joffe et al, 2013). Additional anti-inflammatory benefits, due to an
increase in plasma levels of adiponectin, have been reported for EPA and DHA (Erridge et al,
2009; Schwartz et al, 2010), and AA (Han et al, 2010). This pattern of enhanced
antinflammatory processes was not seen with oleate and linoleic acid (Han et al, 2010).
The fatty acid type that predominates in cells is a reflection of personal and population dietary
habits. This is important as the dietary fat intake is directly related to that in cellular
membranes. The nature of dietary fatty acids is said to possibly explain why not all obese
subjects develop insulin resistance or DM2. Experiments in which mice were fed a diet
enriched in fish oil led them to become obese with hypertrophic adipocytes, but it was found
that the adipose tissue did not develop macrophage accumulation or insulin resistance
(Saraswathi et al, 2007). Therefore, dietary composition (SFAs/PUFAs) may explain the
dissociation between obesity and adipose tissue inflammation that has been noted by other
workers (Han et al, 2010).
1.15 Vitamin D metabolism and functions
The primary dietary sources of vitamin D are mainly dairy products (Horlick, 2004). Other
foods that contain vitamin D are oily fish and egg yolks. Availability of vitamin D3
(cholecalciferol), in humans, is heavily dependent on skin exposure to sunlight for vitamin
photosynthesis. Vitamin D3 is produced in humans by ultra-violet B radiation (UVB), from
sunlight, with a wavelength of 290-315 nm. The amount of the vitamin formed is dependent
on the number of photons absorbed by 7-dehydrocholesterol in the skin. This source of
vitamin D3 (skin photosynthesis) outweighs that obtained from food sources. The ability of
the skin to produce vitamin D is affected by skin colour, use of sunscreen, time of day,
weather season, the angle of light reaching the earths surface and latitude location of the
individual (Holick et al, 2004; Webb, 2006; Chen et al, 2007). When the sun fails to rise past
35° above the horizon, ultraviolet radiation needed for vitamin D3 synthesis become
compromised by the atmosphere. This is worse in countries at higher altitudes particularly
during winter months, and in the morning and evening hours (Danescu et al, 2009; Kimlin et
al, 2007). These factors are implicated in the fluctuations of vitamin D3 concentration in
humans due to variable UV exposure (Ishii et al, 2001). The distance over which sunlight
travels to get to the earth’s atmosphere is least in regions nearest the equator. At these
48
locations close to the equator, the UVB rays are very intense due to the short distance
travelled by the rays to reach human skin. Individuals in such places are guaranteed cutaneous
vitamin D3 synthesis all year long provided that their skin is exposed to sunlight. Countries
that are exposed to intense sunshine in this regard are those in the global zones extending
between latitudes 23.5°N and 23.5°S to the equator i.e the tropics (Arabi et al, 2010, Jablonski
& Chaplin, 2012). This zone contains Nigeria and about half the geographical space of
Mexico, hence cutaneous vitamin D synthesis maybe comparable in both countries and
populations. Some researchers have reported that despite ample sunshine throughout the year,
30-50% of individuals living in Sub-Saharan Africa and the Middle East have serum 25-
hydroxyvitamin D3 levels ˂ 25 nmol/l (Arabi et al, 2010). Similarly, hypovitaminoses D has
been reported to be prevalent in children and the elderly living in Latin America (Arabi et al,
2010). The risk factors for hypovitaminoses D3 in the developing countries are extremes of
age, female sex, winter season, dark skin pigmentation, malnutrition, lack of sun exposure,
heavily clad clothing, obesity, genetic and diet (Arabi et al, 2010; Alfawaz et al. 2014). The
impact of winter, geographical location and skin colour on vitamin D status was demonstrated
in a comparative study of Nigerian women in Southwest Nigeria and African-American
women in Chicago, USA. In this study Durazo-Arvizu et al, 2013, found the mean levels of
25(OH) D3 to be 64 nmol/L and 29 nmol/L, among the Nigerians and African-Americans
respectively. About 76% of the Nigerian women had vitamin D3 levels above 20 ng/ml (50
nmol/L) compared to 5% in African-American women (Durazo-Arvizu et al, 2013). This is
similar to what was reported for Mexico in 2013 where only 10% of the adult population had
plasma vitamin D level less than 50 nmol/L (Brito et al, 2013; Mokhtar et al, 2013). It is
thought that the cut-off of vitamin D3 deficiency at level less than 75 nmol/L for Africans be
reappraised, as this cut-off may only be applicable to Caucasians. This is because persons of
African ancestry do not have a corresponding increase in plasma parathyroid hormone (PTH)
levels until the vitamin D3 level is below 20 ng/ml (50 nmol/L). In Caucasians PTH level
rises when plasma vitamin D is less 30 ng/ml i.e. 75 nmol/L (Wright et al, 2012). The serum
vitamin D3 level is known to be the best marker of whole-body vitamin D status, but calcitriol
(1, 25 [OH]2 D3) is the active form for use by cells (Holick, 2007; DeLuca, 2004). However,
it is preferable to measure vitamin 25(OH) D3 in the nutritional assessment of vitamin D
status in the laboratory. The reason for this is the slower rate of plasma clearance (half-life of

49
3 weeks) of 25(OH) D3, compared to diet or cutaneously derived vitamin D3 (half-life of 24
hr) and 1,25 (OH)2 D3 with a half-life of 4-6 hr (Danescu et al, 2009).
1.15.1 Obesity, vitamin D and diabetes mellitus type 2
Obesity is associated with diabetes mellitus in different populations (Hu et al, 2001; Adebisi
et al, 2003; McGill et al, 2008), and low levels of vitamin D in affected individuals
(Wortsman et al, 2000; Alfawaz et al, 2014; Pereira-Santos et al, 2015). Hypovitaminoses D
in obesity is due to inadequate exposure to solar UVB radiation, enhanced production of 1,25
(OH)2 D3 in obese subjects exerting a negative feedback on vitamin D3 production (Bell et
al, 1985) and increased vitamin D clearance due to voluptuous uptake by adipose tissue
(Wortsman et al, 2000). Investigations have shown that cutaneously synthesised vitamin D,
which is normally stored in subcutaneous fat, is not readily released to the plasma
compartment in obese individuals compared to non-obese individuals (Wortsman et al, 2000).
In patients with hypovitaminosis D, there is an associated decrease or absent
immunomodulatory and anti-inflammatory benefit of the vitamin on insulin resistance
(McGill et al, 2008; Palomer et al, 2008). This increases their susceptibility to develop DM2.
The immunomodulatory functions of vitamin D is mediated via the presence of VDRs on
macrophages, dendritic cells and lymphocytes. These immune cells possess 25-hydroxylase
and 1α-hydroxylase, hence they can synthesise vitamin D3 and 1,25-(OH)2 D3 (Fritsche et al.
2003; Sigmundsdottir et al, 2007).
Some anti-inflammatory effects of vitamin D which may be lacking in obese hypovitaminoses
D subjects include ability of 1,25-(OH)2 D3 to inhibit the release of proinflammatory
cytokines (TNFα, IL-6, IL-8), cyclooxygenase-2, intercellular adhesion molecule-2 and B7-1
(Zhang et al, 2007; Cohen-Lahav et al, 2007; Giulietti et al, 2007). In addition, vitamin D has
the ability to suppress the expression of TLR2 and TLR4 protein; hence, it may be beneficial
in combating saturated fat mediated chronic inflammation in obesity and DM2 (Sadeghi et al,
2006), and reduction of FFA levels in susceptible individuals (Pittas et al, 2007).

50
1.15.2 Vitamin D and diabetes mellitus type II
Vitamin D has demonstrable roles in immune functions including enhanced macrophage
actions, decreased natural killer cell function, inhibition of T-cell proliferation,
immunosuppression and antiproliferative effects (Griffin et al, 2001; Bouillon et al, 2003; Liu
et al, 2006; Sigmundsdottir et al, 2007), and in insulin secretion, action and resistance
(Palomer et al, 2008). The vitamin has been reported to influence insulin sensitivity and
insulin receptor metabolism; hence, its deficiency is associated with the development of
insulin resistance and DM2 (Teegarden et al, 2009; Kostoglou-Athanassiou et al, 2013). The
association between the risk of DM2 and hypovitaminoses D, increases with age, low physical
activity and diet in addition to obesity (Zitterman, 2006; Mattila et al, 2007; Alvarez et al,
2010). In the USA, low vitamin D levels in African-Americans is linked to poverty, lactose
intolerance and obesity (Davis, 2011) and maybe associated with the high prevalence of
diabetes in this population. Importantly, different studies undertaken in humans and animals
have shown that vitamin D can be a putative modifier of diabetes risk (Gregori et al, 2002;
Zeller et al, 2003).
1.15.3 Vitamin D in Africans
The high prevalence and risk of diabetes mellitus in African-Americans (CDC, 2011) in
addition to their prevalence of hypovitaminoses D (Danescu et al, 2009), makes it important
to evaluate the vitamin D levels in blacks and coloured people. This is more so for Africans as
they adopt westernized lifestyle. The use of heavy clothing and reduced outdoor activity is
said to compromise the cutaneous synthesis of vitamin D in blacks, especially in the presence
of obesity (Wortsman et al, 2000). This has been demonstrated in a study that found
compromised levels of plasma vitamin D in urban living South Africans (George et al, 2014).
Africans who live in a traditional manner (moderate degree of clothing, increased outdoor
activities and occasional avoidance of direct sun exposure) display high levels of the vitamin
(Luxwolda et al, 2012). Therefore, the impact of low levels of vitamin D to the unsustainable
increase in the prevalence of non-communicable diseases in Africa (Oghagbon & Giménez-
Llort, 2014) should be investigated and quantified.

51
Chapter 2: Plasma cytokines in Nigerian diabetes mellitus type 2 subjects
2.1 Introduction
In 1993 Hotamisligil et al reported the association between inflammation and metabolic
disorders (obesity, insulin resistance and DM2). The relevant inflammatory responses were
shown in 1997 to involve the body's innate immune system (Pickup et al, 1997) which
consists of sentinel trouble-shooting cells such as macrophages, endothelial, mast, dendritic,
neutrophils, eosinophils and innate lymphoid cells (Chng et al, 2015). These cells help in
recognising and neutralising environmental threats by the action of pattern-recognition
receptors (PRRs) and release of proinflammatory cytokines (Fernández-Real et al, 2008).
Some of the innate cells (macrophages, dendritic cells, mast cells and neutrophils) are thought
to promote inflammation and insulin resistance, but others (eosinophils and innate lymphoid
cells) maybe protective (Chng et al, 2015). Circulating proinflammatory cytokines and
adipokines such as IL-6, TNF-α, IL-1β, MCP-1, leptin, resistin and the liver derived acute
phase protein CRP are associated with obesity, insulin resistance and diabetes mellitus
(Surendar et al, 2011, Titos et al, 2013, Chng et al, 2015). These biomarkers are found to be
commonly elevated in diabetic subjects (Liu et al, 2007; Baba et al, 2010, Surendar et al,
2011). Furthermore, the onset of inflammation in obese individuals is linked to monocytes
infiltration of adipose tissue and generation of the chemokine; MCP-1(Sartipy et al, 2003).
Adipose monocyte infiltration and subsequent maturation to macrophages with activation of
M1 (pro-inflammatory) macrophage phenotype, is an early event in the pathobiology of
insulin resistance and obesity induced DM2 (Huber et al, 2008, Chng et al, 2015). Various
studies have consistently shown elevated IL-6, IL-1β, CRP and TNF-α in patients with
metabolic syndrome and DM2 patients (Spranger et al, 2003; Liu et al, 2007; Surendar et al,
2011, Titos et al, 2013), with ethnic variations (Liu et al, 2007). Elevation of multiple
cytokines rather than a single cytokine is thought to be more predictive of DM2 in affected
individuals. This was reported by Spranger et al (2003) in the Epic-Potsdam Study which
found that a combined elevation of IL-6 and IL-1β was more predictive for DM2. The balance
between proinflammatory and anti-inflammatory signals with a preponderance of
proinflammatory mediators may therefore be a major factor in the pathogenesis of DM2
(Chng et al, 2015). Since the 1960s, the prevalence of DM in different populations in Nigeria

52
has increased from < 1% (Olatunbosun et al, 1998) to 4.3% reported by WHO in 2016 and
4.6% by IDF in 2014. Nigeria presently has the highest number of DM2 patients in Africa
with 2% of total deaths in the country attributable to the disease (WHO, 2016) and, to the
author’s knowlwdge, no study has been undertaken to evaluate the pattern of proinflammatory
and anti-inflammatory biomarkers in diabetics in Nigeria.
2.1.1 Aim of the study
The aim of this study was to evaluate the levels and pattern of circulating plasma cytokines
and adipokines in Nigerian type 2 diabetics compared to health non-diabetic controls. The
objectives were:
1) To compare the absolute mean concentrations of circulating pro-inflammatory and anti-
inflammatory cytokines and, Th1 and Th2 cytokines in Nigerian DM2 and controls.
2) Investigate the inter-relationships between the cytokines and adipokines in Nigerian DM2
and control subjects. It was anticipated that the results of such an investigation would provide
a better understanding of inflammation and associated regulatory molecules involved in the
pathogenesis of DM2 in Nigerians.
2.2 Materials and methods
One hundred and twenty four aged matched subjects were recruited for the study of which 98
(56 DM2 subjects and 42 healthy controls) had their cytokines measured. The mean ages of
DM2 and control groups were 52.67 years ± 8.72 and 50.71 years ± 7.96, respectively. The
difference in ages was not significant at p ˂ 0.05, as shown in Table 2.0. The study population
comprised of 45 males and 57 females. These diabetic subjects were recruited from diabetic
clinics of three different tertiary hospitals in different states in Nigeria; Plateau State (Jos
University Teaching Hospital, Jos), Benue State (Benue State University Teaching Hospital,
Makurdi) from the Middle-belt region of Nigeria, and Ekiti State (Federal Medical Centre,
Ido-Ekiti) from the South-western region of the country. The control subjects were non-
diabetic patients who were mainly members of staff of the hospitals, persons engaged in blood
53
donation at the hospitals, those having medical examination for routine purposes and people
having blood tests prior to job employment. The inclusion criteria for the diabetic subjects
were attendance at the diabetic clinic and, for new subjects it was fasting plasma glucose > 7
mmol/L, on more than two different occasions. Patients with chronic liver and renal diseases
(after measuring liver enzymes, plasma urea and creatinine), and those on fish oil supplements
were excluded. On inclusion in the study, the subjects had their blood pressure, body mass
index (BMI) and waist-hip-ratio (WHR) measured. BMI was determined by dividing the body
weight (kg) by the square of the height in meters. WHR was determined from the ratio of the
waist circumference (WC) to hip circumference (HC). Waist circumference was measured at
the mid point between the lower costal margin of the rib cage and the greater trochanter in
centimetres. The HC was measured around the hips and over the maximum protuberance of
the gluteus maximus.
Twenty millitres (20 ml) of venous blood was taken from the cubital vein after cleansing of
the puncture site, in the morning after an overnight fast of 10-16 hr. Five ml (5 ml) of blood
was collected into fluoride oxalate bottles and EDTA for measurement of fasting plasma
glucose (FPG) and high density lipoprotein cholesterol (HDL-C), respectively. The remaining
15 mL of blood was collected into lithium-heparin bottles for measurement of plasma levels
of fasting plasma glucose, total cholesterol (TC), triglyceride (Tg), urea, creatinine, aspartate
transaminases (AST), alanine transferases (ALT), total protein (TP) albumin and cytokines
(adiponectin, resistin, leptin, IL-1β, IL-6, IL-4, IL-8, IL-10, IL-12, TNF-α, IFN-γ, TGF-β,
MCP-1 and plasma insulin). Only DM2 subjects who were solely on oral hypoglycaemics
(metformin, or metformin in combination with glipizide), had samples analysed for cytokines
in addition to the analysis of healtly control subjects.
The collected samples were spun at 3000 rpm for 10 min and the plasma collected in
cryovials for storage at -80 °C until assays for the analytes of interest were determined.
Except for the cytokines, the other general biochemistry analytes were measured using an
Ortho Clincal Vitros 350 chemistry system analyser which uses micro-slide dry chemistry
technology (Ortho Clincal Diagnostics, US). Low density lipoprotein cholesterol (LDL-C)
was determined by the Freldwald formula provided the level of plasma Tg was not more than
400 mg/dl. The homeostasis model assessment for estimating pancreatic β-cell functioning

54
(HOMA-B), was calculated for each subject using the following formula: 20 × fasting insulin
(μIU/ml)/fasting glucose (mmol/ml) − 3.5 (Song et al, 2007).
2.2.1 Luminex multiplex analyte profiling
Using Luminex software technology, which is based on a multiple analyte profiling model,
the cytokines (adiponectin, resistin, leptin, IL-1β, IL-6, IL-4, IL-8, IL-10, IL-12, TNF-α, IFN-
γ, TGF-β, MCP-1) and plasma insulin, were measured according to the manufacturer’s
instructions. This technology has the advantages of saving time, reproducibility, cost and
small sample volume samples, as well the ability to measure a pre-determined number of
cytokines in a single run. The method has been previously validated as an alternative to the
ELISA methods (Codorean et al, 2010). Luminex technology is based on polystyrene or
paramagnetic microspheres or beads that are internally dyed with red and infrared
fluorophores of different concentrations. Each dyed bead is given a unique number or bead
region, and this allows for distinct bead sets for specific cytokine profiles. The distinct bead
sets with unique identification allows the differentiation of one bead from another, hence they
can be measured separately. Each bead set is coated with capture antibody specific for one
analyte. The captured analyte is detected using a biotinylated detection antibody and
streptavidin-phycoerythrin (S-PE). The Luminex 200 analyzer is a dual laser, flow-based,
sorting and detection platform. One laser is bead-specific and determines which cytokine is
being detected. The other laser is used to determine the magnitude of the PE-derived signal,
which is in direct proportion to the amount of analyte bound. Figure 2.0 shows the principles
of the assay and the sensitivity ranges for cytokines measured in this study. Samples with
concentrations greater than the upper limit of the assay range were diluted in the ratio 1:5 and
the result multiplied by a factor of 5.

55
The sample is added to a mixture of color-coded
beads, pre-coated with analyte-specific capture
antibodies. The antibodies bind to the analytes of
interest.
Biotinylated detection antibodies specific to the analytes of interest are added
and form an antibody-antigen sandwich. Phycoerythrin (PE)-conjugated
streptavidin is added. It binds to the biotinylated detection antibodies.
Polystyrene beads are read on a dual-laser
flow-based detection instrument, such as the
Luminex® 100™, Luminex 200™ or Bio-Rad®
Bio-Plex® analyzer. One laser classifies the
bead and determines the analyte that is being
detected. The second laser determines the
magnitude of the PE-derived signal, which is in
direct proportion to the amount of analyte
bound.
Figure 2.0 Multiplex assay principle. (https://www.rndsystems.com/resources/technical/luminex-assay-principle)

56
2.2.1.1 Multiplex assay specificity: Assay responses from like-target proteins were
measured by the manufacturer to ensure that the antibodies selected for use are highly specific
for their desired targets. None of the assays showed a significant signal from similar, non-
target proteins.
2.2.1.2. Detection limits and calibration ranges of the cytokines measured
Analyte Minimum detectable
concentration (pg/ml)
Calibration range
(pg/ml)
Leptin 19.0 38.0 – 600,000
Adiponectin 11.0 26.0 – 400,000
Resistin 2.2 6.4 – 100,000
Insulin 3.8 9.6 – 150,000
IL-1β 0.8 3.2 – 2,000
IL-6 0.9 3.2 – 2,000
IL-8 0.4 3.2 – 2,000
IL-10 1.1 3.2 – 2,000
IL-12 1.3 3.2 – 2,000
TNF-α 0.7 3.2 – 2,000
IFN-γ 0.8 3.2 – 2,000
TGF-1β 6.0 9.8 – 2,500
MCP-1 1.2 1.3 – 20,000
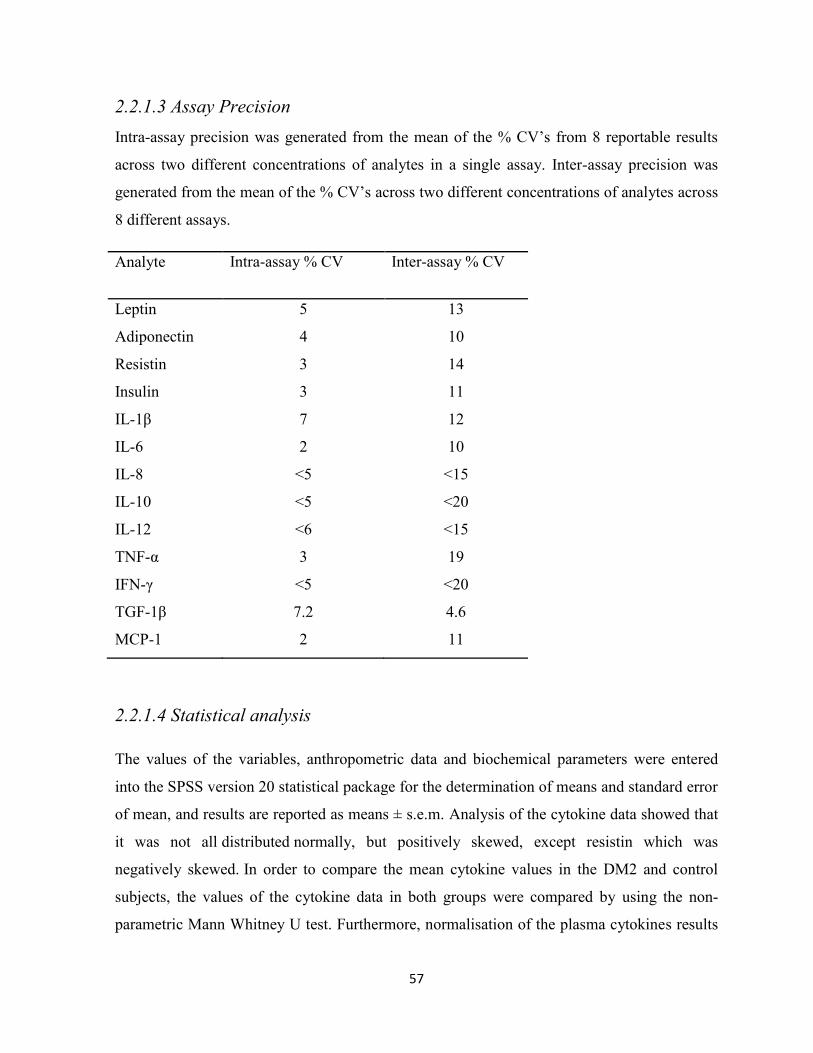
57
2.2.1.3 Assay Precision
Intra-assay precision was generated from the mean of the % CV’s from 8 reportable results
across two different concentrations of analytes in a single assay. Inter-assay precision was
generated from the mean of the % CV’s across two different concentrations of analytes across
8 different assays.
Analyte Intra-assay % CV
Inter-assay % CV
Leptin 5 13
Adiponectin 4 10
Resistin 3 14
Insulin 3 11
IL-1β 7 12
IL-6 2 10
IL-8 ˂5 ˂15
IL-10 ˂5 ˂20
IL-12 ˂6 ˂15
TNF-α 3 19
IFN-γ ˂5 ˂20
TGF-1β 7.2 4.6
MCP-1 2 11
2.2.1.4 Statistical analysis
The values of the variables, anthropometric data and biochemical parameters were entered
into the SPSS version 20 statistical package for the determination of means and standard error
of mean, and results are reported as means ± s.e.m. Analysis of the cytokine data showed that
it was not all distributed normally, but positively skewed, except resistin which was
negatively skewed. In order to compare the mean cytokine values in the DM2 and control
subjects, the values of the cytokine data in both groups were compared by using the non-
parametric Mann Whitney U test. Furthermore, normalisation of the plasma cytokines results

58
via logarithmic transformation of the cytokine values obtained in DM2 and control groups
was undertaken. The T-test statistics was conducted on the logarithmic transformed values.
Cytokine results are reported as mean ± s.e.m of the original data and their logarithmic values,
with the T-test performed on the latter values for the comparison of DM2 and healthy control
subjects. The significance level was set at p ˂ 0.05 for the two methods used to compare the
obtained cytokine data. The mean values of the other variables were compared to their
original values using independent T-test with significance level also set at p < 0.05.
Correlational analyses were determined using Spearman rho correlation analysis for the non-
transformed data and Pearson’s correlation done on the transformed data (Harris et al, 2004).
2.3 Results
As shown in Table 2.0, mean FPG and AST were significantly higher in DM2 subjects
compared to controls; DM2: FPG; 9.23 mmol/L ± 4.34, AST; 20.66 mmol/L ± 18.70,
controls: FPG; 4.68 mmol/L ± 0.91, AST; 14.44 mmol/L ± 9.81, at p ˂ 0.05. When the
clinical biochemical parameters were compared by gender, only plasma creatinine showed a
significant difference. The mean creatinine value was expectedly higher in males (107.96
µmol/L ± 26.00) compared to females (91.20 µmol/L ± 38.34), at p < 0.05 (See Table 2.0).
Mean duration of diabetes mellitus in those affected was 8.64 years ± 4.81 with a minimum
duration of 1 year and maximum duration of 22 years. The diabetic patients selected for
cytokine analyses were those on metformin alone or in combination with glibenclamide. The
DM2 patients on insulin were not included in the cytokine analyses group.

59
Table 2.0 Mean values of biodata and routine clinical biochemistry tests in Nigerian DM2
patients and healthy controls.
Variables DM2 ± SD (n) Controls ± SD(n) pValue
Age
Waist-Hip-Ratio (WHR)
52.67 ± 8.72 (76)
0.96 ± 0.13 (60)
50.71 ± 7.96 (46)
0.95 ± 0.19 (28)
0.234
0.745
BMI (Kg/m2) 24.28 ± 10.32 (59) 24.94 ± 9.87 (26) 0.784
Systolic blood pressure
(mmHg)
130.36 ± 22.91 (42) 137.14 ± 24.94
(14)
0.352
Diastolic blood pressure
(mmHg)
83.33 ± 12.03 (42) 86.43 ± 17.37 (14) 0.544
FPG (mmol/L) 9.23 ± 4.34 (78) 4.68 ± 0.91 (41) 0.001
AST (mIU/ml) 20.66 ± 18.70 (70) 14.44 ± 9.81 (32) 0.030
ALT (mIU/ml) 15.30 ± 15.35 (70) 10.22 ± 9.61 (32) 0.089
AST/ALT RATIO 2.34 ± 3.15 (69) 2.76 ± 3.31 (32) 0.546
ALP 165.99 ± 132.43 (70) 160.27 ± 74.88
(31)
0.823
Total cholesterol (mmol/L) 4.94 ± 3.61 (71) 4.31 ± 1.35 (29) 0.363
HDL-C (mmol/L) 0.90 ± 0.40 (46) 0.91 ± 0.46 (27) 0.952
Triglyceride (mmol/L) 1.51 ± 0.97 (72) 1.34 ± 0.37 (31) 0.219
LDL-C 2.82 ± 1.36 (43) 2.38 ± 1.00 (26) 0.153
non HDL-C 3.52 ± 1.36 (44) 3.08 ± 0.96 (25) 0.087
Total cholesterol/HDL-C 5.32 ± 3.68 (46) 4.73 ± 2.82 (27) 0.470
Triglyceride /HDL-C 2.56 ± 3.48 (45) 2.21 ± 2.37 (27) 0.649
Urea 4.05 ± 1.86 (69) 3.92 ± 1.52 (31) 0.351
Creatinine 98.67 ± 37.33 (66) 97.73 ± 25.76 (31) 0.179
The data in the Table above shows significant differences in FPG (mmol/L) and AST (mmol/L) in diabetic
subjects compared to non-diabetic controls, p < 0.05.
The nonparametric Mann Whitney U test comparison of the mean plasma values of cytokines,
insulin and HOMA indices in DM2 and control subjects showed significant differences in the
levels of IL-6, TNF-α, HOMA-β and HOMA-IR (Table 2.1). The mean plasma level of IL-6
was significantly higher in DM2 subjects (215.86 pg/ml ± 43.91) compared to controls (81.02
pg/ml ± 33.97). This difference is equivalent to 166% higher plasma IL-6 in DM2 subjects
compared to controls. Among the DM2 subjects, FPG versus HOMA-B showed a significant
negative correlation (r = -0.407, p = 0.002) but such a relationship was absent in the control
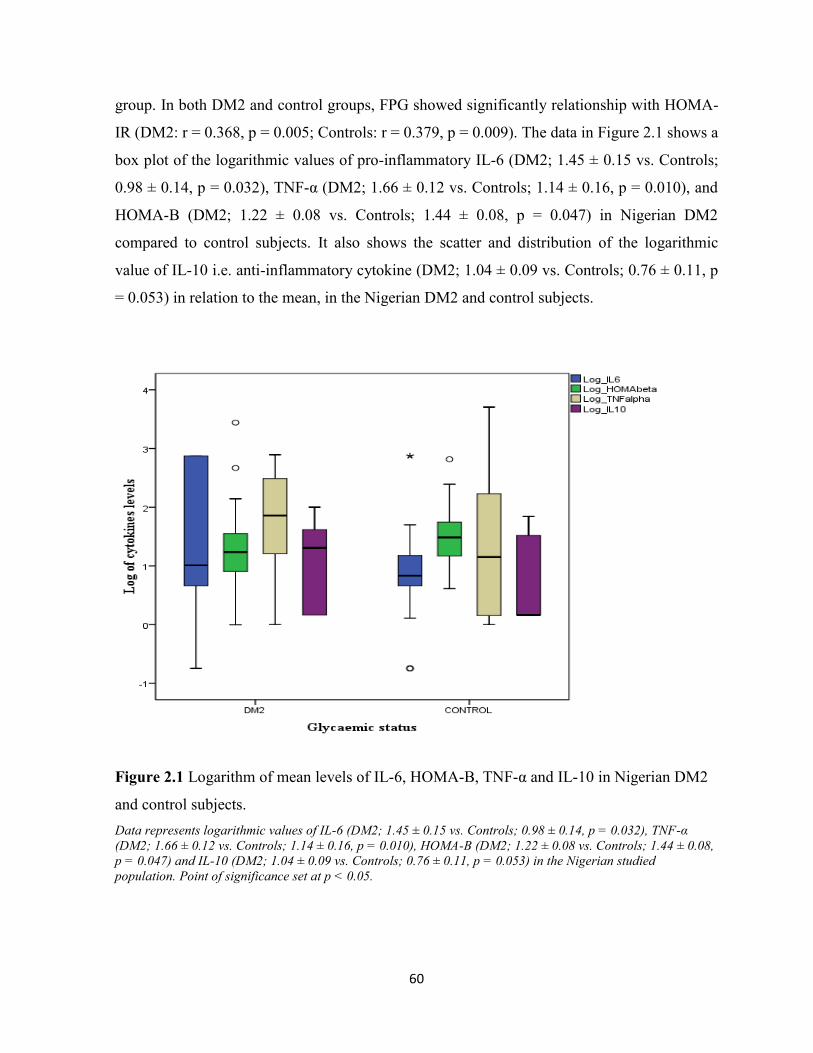
60
group. In both DM2 and control groups, FPG showed significantly relationship with HOMA-
IR (DM2: r = 0.368, p = 0.005; Controls: r = 0.379, p = 0.009). The data in Figure 2.1 shows a
box plot of the logarithmic values of pro-inflammatory IL-6 (DM2; 1.45 ± 0.15 vs. Controls;
0.98 ± 0.14, p = 0.032), TNF-α (DM2; 1.66 ± 0.12 vs. Controls; 1.14 ± 0.16, p = 0.010), and
HOMA-B (DM2; 1.22 ± 0.08 vs. Controls; 1.44 ± 0.08, p = 0.047) in Nigerian DM2
compared to control subjects. It also shows the scatter and distribution of the logarithmic
value of IL-10 i.e. anti-inflammatory cytokine (DM2; 1.04 ± 0.09 vs. Controls; 0.76 ± 0.11, p
= 0.053) in relation to the mean, in the Nigerian DM2 and control subjects.
Figure 2.1 Logarithm of mean levels of IL-6, HOMA-B, TNF-α and IL-10 in Nigerian DM2
and control subjects.
Data represents logarithmic values of IL-6 (DM2; 1.45 ± 0.15 vs. Controls; 0.98 ± 0.14, p = 0.032), TNF-α
(DM2; 1.66 ± 0.12 vs. Controls; 1.14 ± 0.16, p = 0.010), HOMA-B (DM2; 1.22 ± 0.08 vs. Controls; 1.44 ± 0.08,
p = 0.047) and IL-10 (DM2; 1.04 ± 0.09 vs. Controls; 0.76 ± 0.11, p = 0.053) in the Nigerian studied
population. Point of significance set at p < 0.05.

61
The levels of the cytokines in the Nigerian DM2 and control populations compared by the
nonparametric Mann Whitney U test and by independent T-test after logarithmic
transformation are shown in Tables 2.1 – 2.2.
Table 2.1 Nonparametric Mann Whitney U test comparison of mean ± s.e.m values of
cytokines between Nigeria DM2 subjects and healthy control subjects.
Variables DM2
Mean ± s.e.m
(n=56)
Controls (n=42)
Mean ± s.e.m
(n=42)
p Value
Adiponectin
(ng/ml)
17686.00 ± 1288.72 16232.88 ± 1169.71 0.963
Resistin (ng/ml) 83.30 ± 12.02 60.48 ± 6.09 0.087
Leptin (ng/ml) 172.64 ± 53.68 449.76 ± 163.87 0.084
1L-12 (pg/ml) 9.38 ± 1.10 10.09 ± 2.23 0.562
IFN-γ (pg/ml) 36.46 ± 5.71 29.69 ± 5.71 0.546
IL-4 (pg/ml) 19.61 ± 3.49 16.61 ± 4.12 0.372
1L-10 (pg/ml) 23.57 ± 3.35 15.50 ± 3.23 0.054
TGF-1β (ng/ml) 14.04 ± 0.99 14.06 ± 1.15 0.804
IL-1β (pg/ml) 39.45 ± 15.02 24.96 ± 13.07 0.248
1L-6 (pg/ml) 215.86 ± 43.91 81.02 ± 33.97 0.044
IL-8 (pg/ml) 811.35 ± 79.36 809.56 ± 92.29 0.737
TNF-α (pg/ml) 201.82 ± 51.79 215.95 ± 121.80 0.008
MCP-1 (pg/ml)
Insulin (pg/ml)
HOMA-B
HOMA-IR
2113.34 ± 221.98
1042.81 ± 673.76
75.52 ± 49.46
11.56 ± 6.82
2266.56 ± 290.22
395.73 ± 125.45
52.49 ± 16.29
2.61 ± 0.74
0.824
0.336
0.023
0.002
S.E.M; Standard error of mean. n = number of subjects; 56 in DM2 and 42 in healthy controls. The data
represents nonparametric comparison of mean ± s.e.m plasma cytokines in Nigerian DM2 and control groups, p
< 0.05.

62
Table 2.2 Comparison of mean logarithmic transformed values of the cytokines, insulin and
HOMA indices between Nigeria DM2 subjects and healthy control subjects.
Variables DM2
Mean ± s.e.m
(n = 56)
Controls (n = 42)
Mean ± s.e.m
(n = 42)
p Value
Adiponectin (ng/ml) 7.18 ± 0.03 7.13 ± 0.05 0.398
Resistin (ng/ml) 4.80 ± 0.04 4.69 ± 0.05 0.070
Leptin (ng/ml) 4.60 ± 0.11 4.89 ± 0.14 0.103
1L-12 (pg/ml) 0.80 ± 0.07 0.77 ± 0.08 0.819
IFN-γ (pg/ml) 1.04 ± 0.11 0.98 ± 0.12 0.713
IL-4 (pg/ml) 0.86 ± 0.10 0.79 ± 0.11 0.603
1L-10 (pg/ml) 1.04 ± 0.09 0.76 ± 0.11 0.053
TGF-1β (ng/ml) 4.09 ± 0.04 4.09 ± 0.04 0.996
IL-1β (pg/ml) 0.99 ± 0.09 0.84 ± 0.10 0.251
1L-6 (pg/ml) 1.45 ± 0.15 0.98 ± 0.14 0.032
IL-8 (pg/ml) 2.40 ± 0.13 2.35 ± 0.17 0.795
TNF-α (pg/ml) 1.66 ± 0.12 1.14 ± 0.16 0.010
MCP-1 (pg/ml)
Insulin (pg/ml)
HOMA-B
HOMA-IR
3.20 ± 0.05
2.39 ± 0.07
1.22 ± 0.08
0.45 ± 0.08
3.19 ± 0.07
2.29 ± 0.07
1.44 ± 0.08
0.09 ± 0.08
0.917
0.325
0.047
0.001
S.E.M; Standard error of mean. n = number of subjects; 56 in DM2 and 42 in healthy controls. The data
represents nonparametric comparison of mean ± s.e.m plasma cytokines in Nigerian DM2 and control groups, p
< 0.05.
Comparisons of plasma cytokines by gender in the Nigerian DM2 and control populations
was computed, and are shown in Tables 2.3, 2.3a and 2.4. Among the DM2 group, the
nonparametric testing showed that mean leptin was significantly higher in females (241.08
ng/ml ± 85.34) compared to males (95.72 ng/ml ± 42.16) at p = ˂ 0.05. The same general
pattern was shown by logarithmic transformation of the measured cytokine data among male
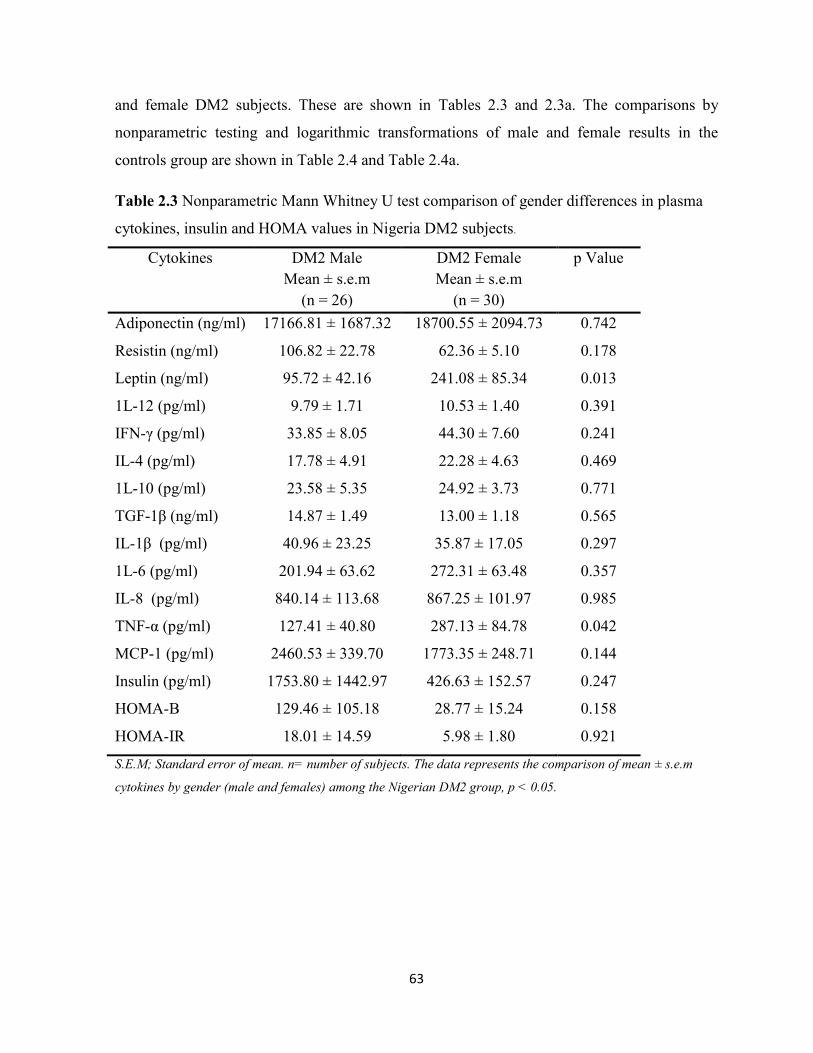
63
and female DM2 subjects. These are shown in Tables 2.3 and 2.3a. The comparisons by
nonparametric testing and logarithmic transformations of male and female results in the
controls group are shown in Table 2.4 and Table 2.4a.
Table 2.3 Nonparametric Mann Whitney U test comparison of gender differences in plasma
cytokines, insulin and HOMA values in Nigeria DM2 subjects.
Cytokines DM2 Male
Mean ± s.e.m
(n = 26)
DM2 Female
Mean ± s.e.m
(n = 30)
p Value
Adiponectin (ng/ml) 17166.81 ± 1687.32 18700.55 ± 2094.73 0.742
Resistin (ng/ml) 106.82 ± 22.78 62.36 ± 5.10 0.178
Leptin (ng/ml) 95.72 ± 42.16 241.08 ± 85.34 0.013
1L-12 (pg/ml) 9.79 ± 1.71 10.53 ± 1.40 0.391
IFN-γ (pg/ml) 33.85 ± 8.05 44.30 ± 7.60 0.241
IL-4 (pg/ml) 17.78 ± 4.91 22.28 ± 4.63 0.469
1L-10 (pg/ml) 23.58 ± 5.35 24.92 ± 3.73 0.771
TGF-1β (ng/ml) 14.87 ± 1.49 13.00 ± 1.18 0.565
IL-1β (pg/ml) 40.96 ± 23.25 35.87 ± 17.05 0.297
1L-6 (pg/ml) 201.94 ± 63.62 272.31 ± 63.48 0.357
IL-8 (pg/ml) 840.14 ± 113.68 867.25 ± 101.97 0.985
TNF-α (pg/ml) 127.41 ± 40.80 287.13 ± 84.78 0.042
MCP-1 (pg/ml)
Insulin (pg/ml)
HOMA-B
HOMA-IR
2460.53 ± 339.70
1753.80 ± 1442.97
129.46 ± 105.18
18.01 ± 14.59
1773.35 ± 248.71
426.63 ± 152.57
28.77 ± 15.24
5.98 ± 1.80
0.144
0.247
0.158
0.921
S.E.M; Standard error of mean. n= number of subjects. The data represents the comparison of mean ± s.e.m
cytokines by gender (male and females) among the Nigerian DM2 group, p < 0.05.

64
Table 2.3a Student T-test comparison of gender differences in plasma cytokines, insulin and
HOMA in Nigerian DM2 subjects after logarithmic transformation of cytokine data.
Cytokines DM2 Male
Log Mean ± s.e.m
(n = 26)
DM2 Female
Log Mean ± s.e.m
(n = 30)
p Value
Adiponectin (ng/ml) 7.18 ±0.04 7.19 ± 0.05 0.984
Resistin (ng/ml) 4.86 ± 0.07 4.75 ± 0.05 0.177
Leptin (ng/ml) 4.33 ± 0.15 4.84 ± 0.13 0.015
1L-12 (pg/ml) 0.81 ± 0.11 0.89 ± 0.09 0.559
IFN-γ (pg/ml) 0.92 ± 0.16 1.14 ± 0.15 0.313
IL-4 (pg/ml) 0.84 ± 0.13 0.93 ± 0.12 0.599
1L-10 (pg/ml) 1.04 ± 0.13 1.09 ± 0.11 0.774
TGF-1β (ng/ml) 4.13 ± 0.04 3.92 ± 0.15 0.192
IL-1β (pg/ml) 0.93 ± 0.14 1.08 ± 0.12 0.400
1L-6 (pg/ml) 1.30 ± 0.19 1.53 ± 0.20 0.388
IL-8 (pg/ml) 2.66 ± 0.16 2.52 ± 0.15 0.515
TNF-α (pg/ml) 1.40 ± 0.18 1.89 ± 0.16 0.046
MCP-1 (pg/ml)
Insulin (pg/ml)
HOMA-B
HOMA-IR
3.27 ± 0.07
2.46 ± 0.11
1.18 ± 0.17
0.47 ± 0.11
3.13 ± 0.06
2.33 ± 0.09
1.04 ± 0.11
0.43 ± 0.10
0.136
0.321
0.503
0.823
S.E.M; Standard error of mean. n= number of subjects. The data represents the comparison of mean ± s.e.m
cytokines by gender (male and females) among the Nigerian DM2 group, p < 0.05.
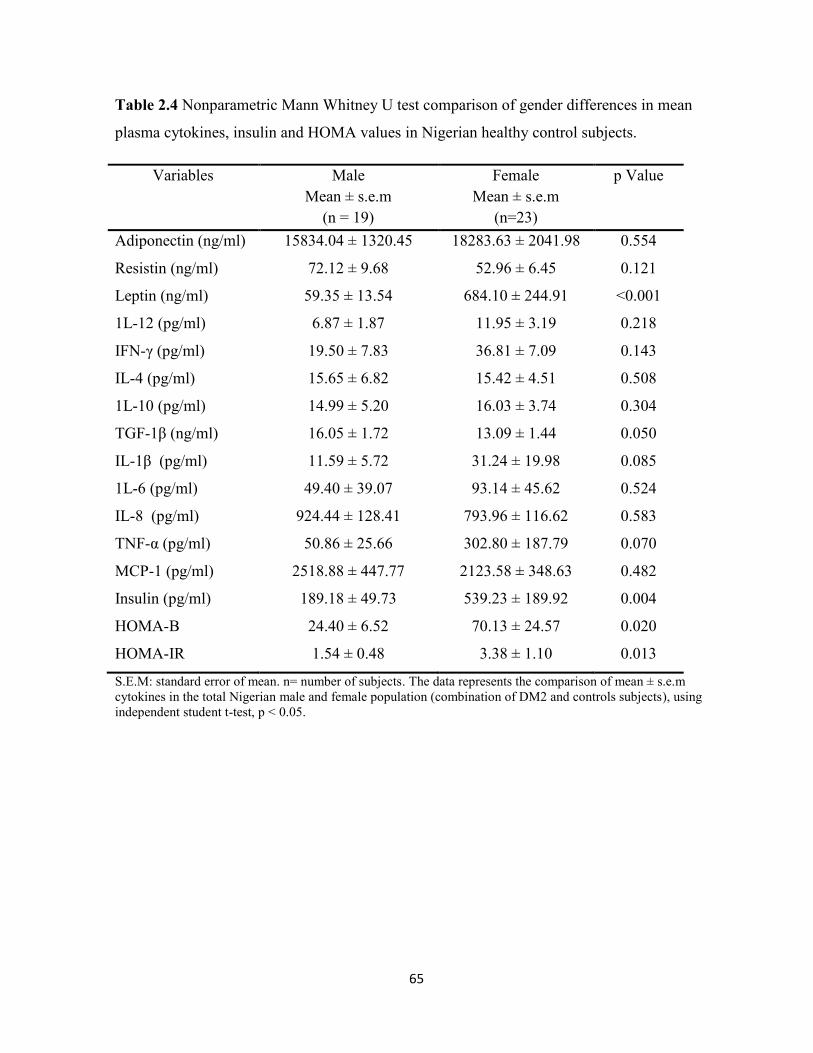
65
Table 2.4 Nonparametric Mann Whitney U test comparison of gender differences in mean
plasma cytokines, insulin and HOMA values in Nigerian healthy control subjects.
Variables Male
Mean ± s.e.m
(n = 19)
Female
Mean ± s.e.m
(n=23)
p Value
Adiponectin (ng/ml) 15834.04 ± 1320.45 18283.63 ± 2041.98 0.554
Resistin (ng/ml) 72.12 ± 9.68 52.96 ± 6.45 0.121
Leptin (ng/ml) 59.35 ± 13.54 684.10 ± 244.91 ˂0.001
1L-12 (pg/ml) 6.87 ± 1.87 11.95 ± 3.19 0.218
IFN-γ (pg/ml) 19.50 ± 7.83 36.81 ± 7.09 0.143
IL-4 (pg/ml) 15.65 ± 6.82 15.42 ± 4.51 0.508
1L-10 (pg/ml) 14.99 ± 5.20 16.03 ± 3.74 0.304
TGF-1β (ng/ml) 16.05 ± 1.72 13.09 ± 1.44 0.050
IL-1β (pg/ml) 11.59 ± 5.72 31.24 ± 19.98 0.085
1L-6 (pg/ml) 49.40 ± 39.07 93.14 ± 45.62 0.524
IL-8 (pg/ml) 924.44 ± 128.41 793.96 ± 116.62 0.583
TNF-α (pg/ml) 50.86 ± 25.66 302.80 ± 187.79 0.070
MCP-1 (pg/ml)
Insulin (pg/ml)
HOMA-B
HOMA-IR
2518.88 ± 447.77
189.18 ± 49.73
24.40 ± 6.52
1.54 ± 0.48
2123.58 ± 348.63
539.23 ± 189.92
70.13 ± 24.57
3.38 ± 1.10
0.482
0.004
0.020
0.013
S.E.M: standard error of mean. n= number of subjects. The data represents the comparison of mean ± s.e.m
cytokines in the total Nigerian male and female population (combination of DM2 and controls subjects), using
independent student t-test, p < 0.05.

66
Table 2.4a Student T-test comparison of gender differences in plasma cytokines, insulin and
HOMA in Nigerian healthy control subjects after logarithmic transformation of the cytokine
data.
Variables Male
Mean ± s.e.m
(n = 19)
Female
Mean ± s.e.m
(n=23)
p Value
Adiponectin (ng/ml) 7.17 ± 0.04 7.15 ± 0.08 0.872
Resistin (ng/ml) 4.80 ± 0.06 4.63 ± 0.06 0.055
Leptin (ng/ml) 4.47 ± 0.15 5.23 ± 0.18 0.003
1L-12 (pg/ml) 0.63 ± 0.12 0.88 ± 0.09 0.112
IFN-γ (pg/ml) 0.77 ± 0.16 1.13 ± 0.15 0.129
IL-4 (pg/ml) 0.71 ± 0.15 0.79 ± 0.12 0.663
1L-10 (pg/ml) 0.72 ± 0.15 0.89 ± 0.11 0.370
TGF-1β (ng/ml) 4.15 ± 0.06 4.06 ± 0.04 0.224
IL-1β (pg/ml) 0.64 ± 0.14 0.93 ± 0.12 0.116
1L-6 (pg/ml) 0.91 ± 0.16 1.05 ± 0.16 0.530
IL-8 (pg/ml) 2.49 ± 0.25 2.36 ± 0.20 0.676
TNF-α (pg/ml) 0.82 ± 0.21 1.35 ± 0.20 0.083
MCP-1 (pg/ml)
Insulin (pg/ml)
HOMA-B
HOMA-IR
3.28 ± 0.08
2.11 ± 0.08
1.16 ± 0.10
0.32 ± 0.06
3.15 ± 0.09
2.43 ± 0.10
1.52 ± 0.11
0.49 ± 0.31
0.323
0.024
0.026
0.046
S.E.M: standard error of mean. n= number of subjects. The data represents the comparison of mean ± s.e.m
cytokines in the total Nigerian male and female population (combination of DM2 and controls subjects), using
independent student t-test, p < 0.05.
Similarly, the males in the controls group had a lower mean leptin level (59.35 ng/ml ± 13.54)
compared to the female group (684.10 ± 244.91), as shown in Table 2.4 and Figure 2.2.
Figure 2.2a is a box plot graph showing the spread of the leptin levels in the DM2 and control
subjects.
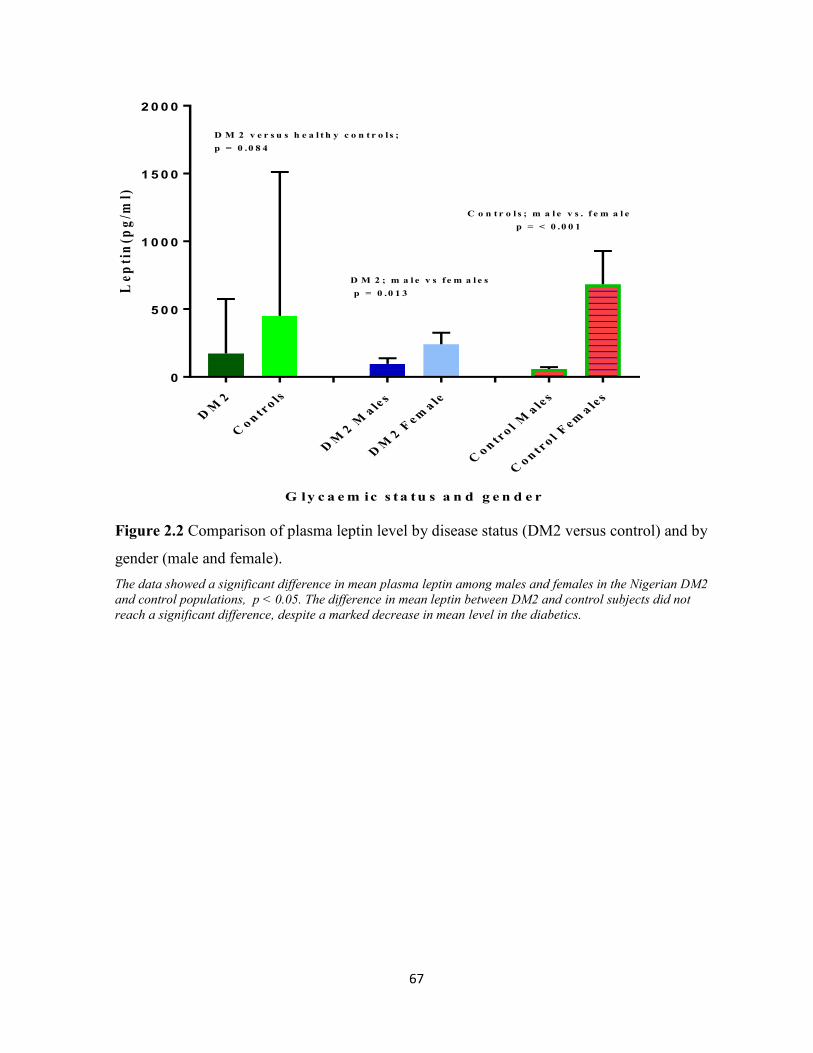
67
DM
2
Co n
tro ls
DM
2 Ma le
s
DM
2 Fem
a le
Co n
tro l
Ma le
s
Co n
tro l
Fem
a les
0
5 0 0
1 0 0 0
1 5 0 0
2 0 0 0
G ly c a e m ic s ta tu s a n d g e n d e r
Le
pti
n(p
g/m
l)D M 2 v e r s u s h e a l t h y c o n t r o l s ;
p = 0 .0 8 4
C o n t r o l s ; m a l e v s . f e m a l e
p = < 0 .0 0 1
D M 2 ; m a l e v s f e m a l e s
p = 0 .0 1 3
Figure 2.2 Comparison of plasma leptin level by disease status (DM2 versus control) and by
gender (male and female).
The data showed a significant difference in mean plasma leptin among males and females in the Nigerian DM2
and control populations, p < 0.05. The difference in mean leptin between DM2 and control subjects did not
reach a significant difference, despite a marked decrease in mean level in the diabetics.
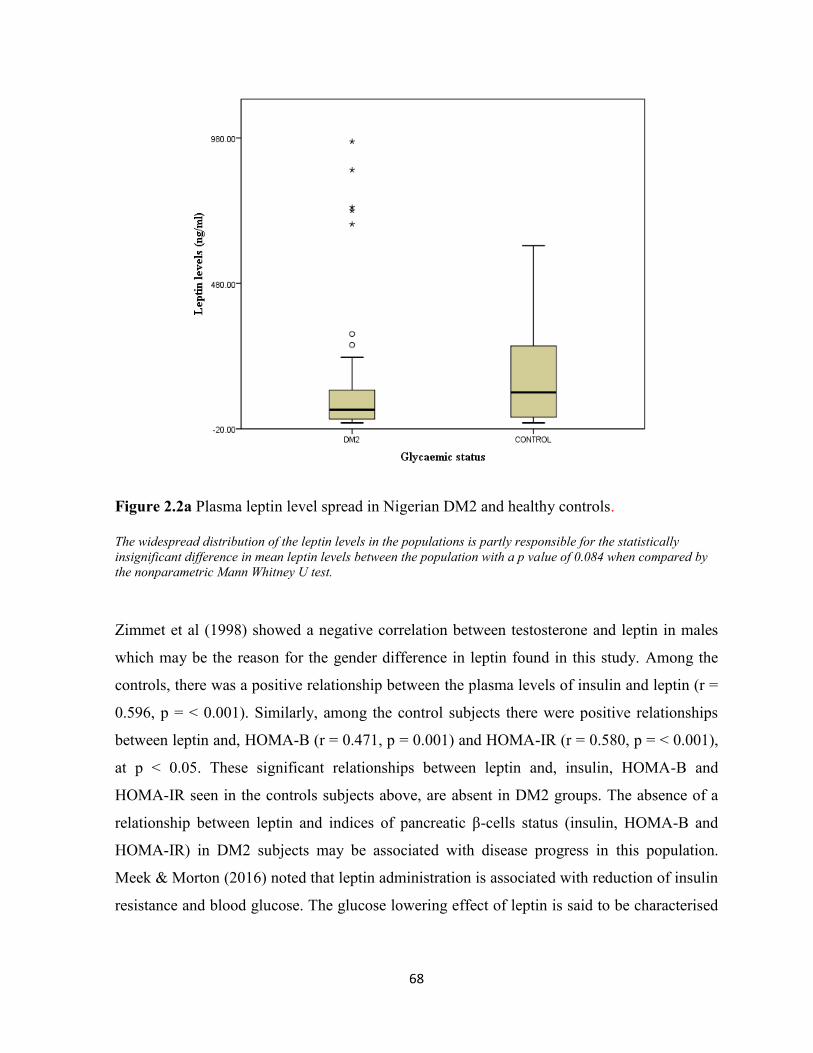
68
Figure 2.2a Plasma leptin level spread in Nigerian DM2 and healthy controls.
The widespread distribution of the leptin levels in the populations is partly responsible for the statistically
insignificant difference in mean leptin levels between the population with a p value of 0.084 when compared by
the nonparametric Mann Whitney U test.
Zimmet et al (1998) showed a negative correlation between testosterone and leptin in males
which may be the reason for the gender difference in leptin found in this study. Among the
controls, there was a positive relationship between the plasma levels of insulin and leptin (r =
0.596, p = ˂ 0.001). Similarly, among the control subjects there were positive relationships
between leptin and, HOMA-B (r = 0.471, p = 0.001) and HOMA-IR (r = 0.580, p = ˂ 0.001),
at p ˂ 0.05. These significant relationships between leptin and, insulin, HOMA-B and
HOMA-IR seen in the controls subjects above, are absent in DM2 groups. The absence of a
relationship between leptin and indices of pancreatic β-cells status (insulin, HOMA-B and
HOMA-IR) in DM2 subjects may be associated with disease progress in this population.
Meek & Morton (2016) noted that leptin administration is associated with reduction of insulin
resistance and blood glucose. The glucose lowering effect of leptin is said to be characterised

69
by normalisation of hepatic glucose production and increased rate of peripheral glucose
uptake.
2.3.1 Correlational analyses between plasma cytokines, adipokines and clinical
biochemistry markers
Among the Nigerian diabetics, FPG and TGF-1β correlation showed a weak positive
coefficient (r = 0.266, p = 0.040). In the same group, there were weak positive relationships
between IL-6 vs AST (r = 0.333, p = 0.017) and, TNF-α vs AST (r = 0.283, p = 0.043) which
were significant at p < 0.05. The relationships between IL-6 and nonHDL-C (r = -0.423, p =
0.025), IL-6 and Tg/HDL-C (r = -0.417, p = 0.024) showed negative correlations. Similarly,
IL-1β and Tg also showed significant negative relationship (r = -0.350, p = 0.008), IL-1β and
Tg/HDL-C (r = -0.514, p = 0.003), and between TNF-α and HDL-C (r = -0.446, p = 0.014).
IFN-γ showed a weak but significant negative correlation with Tg (r = -0.272, p = 0.045).
These were significant at p < 0.05. The cytokine relationships mentioned above were not
significant in the Nigerian control subjects. Importantly among the DM2 subjects, FPG versus
HOMA-B showed a significant negative correlation (r = - 0.407, p = 0.002) and FPG versus
HOMA-IR was positively related; r = 0.368, p = 0.005. In the control population, FPG was
significantly related to HOMA-IR (r = 0.379, p = 0.009). The FPG did not have a significant
correlation with HOMA-B, unlike the DM2 group.
2.3.2 Correlations between the different plasma cytokines
Type 2 Diabetics. As shown in Table 2.5 the Spearman correlation coefficients between IL-1β
and IL-6 (r = 0.622, p = 0.000), IL-1β and TNF-α; (r = 0.540, p = 0.000) and IL-6 and TNF-α;
(r = 0.622, p = 0.000), were significant (P < 0.05). The correlation between IL-8 and TNF-α
also showed a significant positive relationship (r = 0.472, p = 0.000) at p < 0.05. The
relationships between IL-6 and IL-8 (r = 0.306, p = 0.020) and, IL-6 and IL-12 (r = 0.281, p =
0.036), showed positive significant relationships at p < 0.05. The classical or M1
(proinflammatory) macrophage activation is characterised by expression and secretion of IL-
1β, TNF-α, IL-6 and IL-12 (Autieri et al. 2012) and this pattern is consistent with the above

70
findings in DM2. The impact of the proinflammatory cytokine IL-8 is shown by its negative
correlations with HOMA-B (r = - 0.320, p = 0.016) only in the DM2 group. This same group
had a significant positive correlation between HOMA-IR and MCP-1 (r = 0.337, p = 0.011).
The latter relationship (HOMA-IR vs MCP-1) may explain the observed positive relationship
between insulin and MCP-1 shown in Table 2.5. The correlation analyses also showed
significant positive relationship between IL-4 and IL-10 (r = 0.329, p= 0.010), IL-4 and IL-12
(r = 0.558, p = 0.000) and IL-4 and IFN-γ (r = 0.571, p= 0.000) at p < 0.05. The correlation
between IL-12 and IFN-γ (r = 0.409, p = 0.001), IL-4 and IL-12 (r = 0.558, p = 0.000) and,
IL-4 and IFN-γ (r = 0.571, p = 0.000) were significant at p < 0.05. See Figures 2.3 and 2.4.
Figure 2.3 Plasma IL-4 versus IL-12 in Nigerian DM2 subjects. Data shows a positive relationship between a pro-inflammatory (IL-12) and anti-inflammatory cytokine
(IL-4) in Nigerian diabetic subjects. (n = 56).
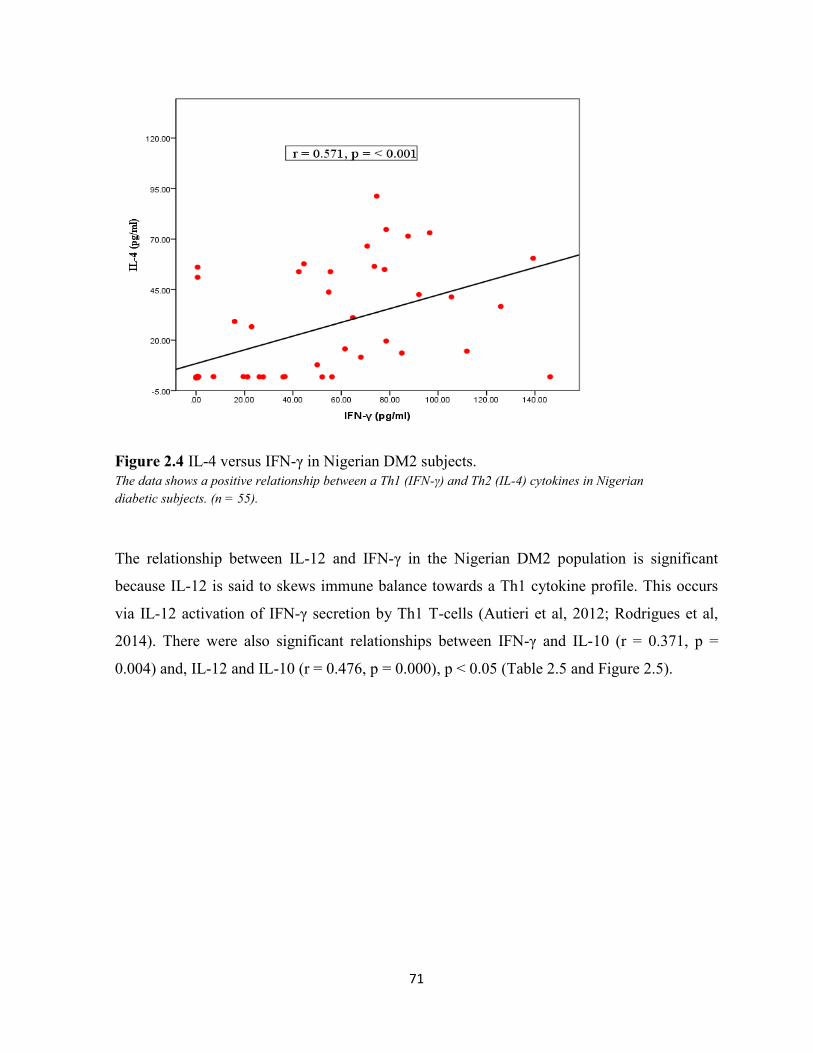
71
Figure 2.4 IL-4 versus IFN-γ in Nigerian DM2 subjects.
The data shows a positive relationship between a Th1 (IFN-γ) and Th2 (IL-4) cytokines in Nigerian
diabetic subjects. (n = 55).
The relationship between IL-12 and IFN-γ in the Nigerian DM2 population is significant
because IL-12 is said to skews immune balance towards a Th1 cytokine profile. This occurs
via IL-12 activation of IFN-γ secretion by Th1 T-cells (Autieri et al, 2012; Rodrigues et al,
2014). There were also significant relationships between IFN-γ and IL-10 (r = 0.371, p =
0.004) and, IL-12 and IL-10 (r = 0.476, p = 0.000), p < 0.05 (Table 2.5 and Figure 2.5).

72
Figure 2.5 IL-10 versus IL-12 in Nigerian DM2 subjects. Data shows a positive relationship between anti-inflammatory IL10 and proinflammatory IL-12 (n = 56).

73
Table 2.5 Cytokines to cytokine and insulin correlations in Nigerian DM2 subjects.
Spearman rho correlation coefficients between the various cytokines measured in Nigerian DM2 subjects. The negative correlations are represented by a
minus (-) preceding the coefficient value. The biologic relationships suggest a combination of proinflammatory and anti-inflammatory cytokine interactions
in the diabetics. The superscripts refers to the degree of correlation significance; ap < 0.05,
bp < 0.01 and
cp < 0.001. NS: not significant at p < 0.05.
Adiponectin Resistin Leptin IL-1β IL-4 IL-6 IL-8 IL-10 IL-12 TNF-α IFN-γ TGF-1β
MCP-1
Resistin NS
Leptin NS NS
IL-1β NS NS NS
IL-4 NS NS NS 0.276a
IL-6 NS NS NS 0.622c NS
IL-8 NS NS NS NS NS 0.306a
IL-10 NS NS NS 0.375b 0.329
a 0.420
b NS
IL-12 NS NS NS 0.336a 0.558
c 0.281
a NS 0.476
c
TNF-α NS -0.316a NS 0.540
c NS 0.622
c 0.472
c 0.373
b NS
IFN-γ NS NS NS NS 0.571c 0.304
a NS 0.371
b 0.409
b 0.295
a
TGF-1β NS NS NS NS NS NS -0.317a NS NS NS NS
MCP-1 NS NS NS NS NS NS NS NS NS -0.258a NS NS
Insulin NS NS NS NS NS NS -0.342b NS NS NS NS NS 0.354
b

74
Controls: unlike DM2 subjects which had no relationship, non-diabetic healthy controls
showed significant negative correlations between plasma adiponectin and IL-1β (r = -0.365, p
= 0.031), adiponectin and IL-6 (r = -0.516, p = 0.002) and, adiponectin and TNF-α (r = -
0.347, p = 0.041). The Nigerian controls showed a significant positive correlation between
resistin and TGF-1β (r = 0.502, p = 0.002), as shown in Figure 2.6.
Figure 2.6 Resistin versus TGF-1β in Nigerian control subjects.
Resistin and TGF-1β shows a positive relationship in Nigerian control subjects, (n = 35).
Leptin in the controls showed a positive relationship with plasma insulin levels (r = 0.596,
p = < 0.001), and this was not observed among the diabetics. The correlation between the
logarithm of insulin and logarithm of leptin (r = 0.542, p = ˂ 0.001) is shown in Figure 2.7
below.

75
Figure 2.7 Logarithm of mean plasma insulin level versus mean logarithm of mean leptin
level in Nigerian healthy control subjects. (n = 42).
As shown in Table 2.5 and 2.6, the control subjects displayed non-significant relationships
between IL-1β and IL-4 and Il-12, but these were significant in DM2 subjects. IL-8 had
significant correlations with IL-4 (r = 0.469, p = 0.005) and IL-10 (r = 0.518, p = 0.001) in the
control group, but these were not significant in DM2 subjects. Similarly, IL-1β and IL-8 did
not have significant correlations with IFN-γ in DM2, but showed positive relationships in the
control subjects; IL-1β vs IFNγ: r = 0.517, p = 0.001; IL-8 vs IFN-γ: r = 0.542, p = 0.001. The
relationship between IL-8 and TGF-β were diametric in the Nigeria DM2 and control
populations.
Among the controls, the relationship between IL-8 and TGF-1β was positive; r = 0.400, p =
0.017, and negative among DM2 subjects: IL-8 vs TGF-1β, r = -0.342, p = 0.015, Tables 2.6
and 2.7. The control subjects had non-significant relationships between IL-12 and IFN-γ,
unlike in DM2 subjects (Table 2.6).
76
Whole study population (DM2 and Controls): the correlations showed significant
relationships between FPG and TNF-α (r = 0.207, p = 0.040), FPG and IL-10 (r = 0.246, p =
0.013), FPG and IL-4 (r = 0.233, p = 0.019) and, FPG and resistin (r = 0.241, p = 0.015) at p <
0.05. There were significant negative correlations between adiponectin and IL-6 (r = -0.233, p
= 0.023), adiponectin and TNF-α (r = -0.269, p = 0.007), p < 0.05, Table 2.7. Other
significant negative relationships were those of resistin and TNF-α (r = -0.207, p = 0.040) and
IL-6 and TGF-1β (r = -0.271, p = 0.008), at p < 0.05. Nigerian subjects showed significant
positive correlations between IFN-γ and IL-4 (r = 0.517, p = 0.000) and IFN-γ and IL-10 (r =
0.470, p = 0.000), Table 2.7.
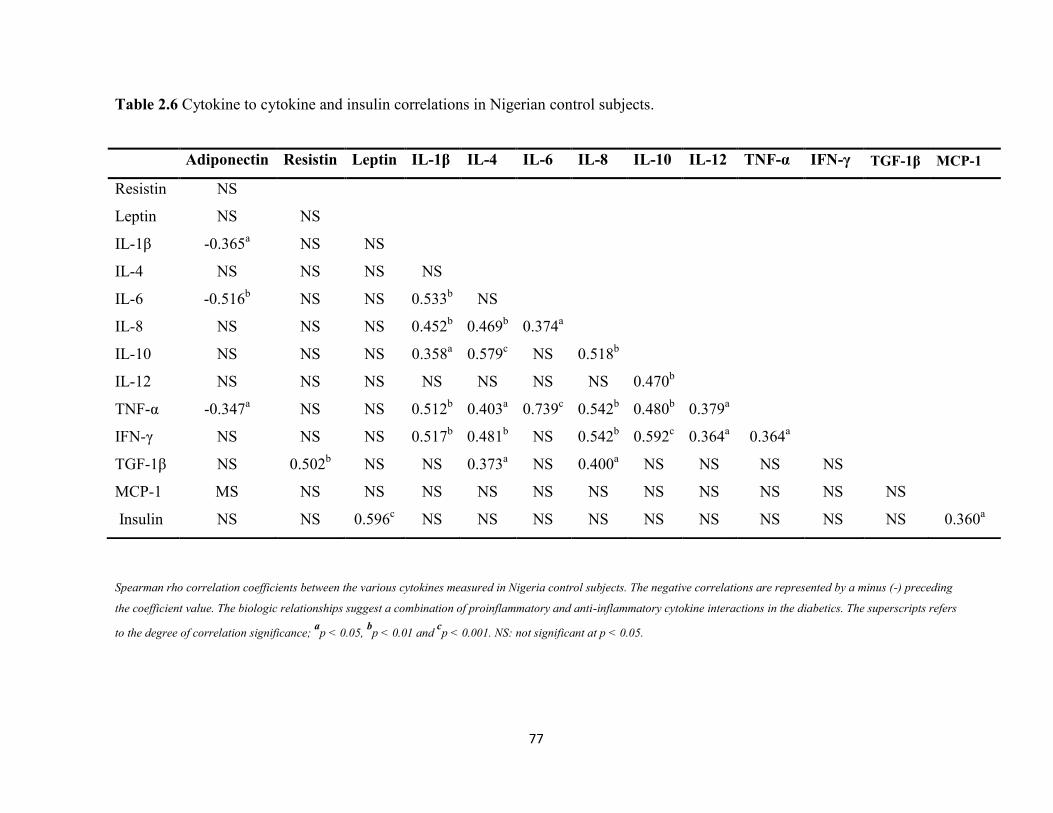
77
Table 2.6 Cytokine to cytokine and insulin correlations in Nigerian control subjects.
Spearman rho correlation coefficients between the various cytokines measured in Nigeria control subjects. The negative correlations are represented by a minus (-) preceding
the coefficient value. The biologic relationships suggest a combination of proinflammatory and anti-inflammatory cytokine interactions in the diabetics. The superscripts refers
to the degree of correlation significance; ap < 0.05,
bp < 0.01 and
cp < 0.001. NS: not significant at p < 0.05.
Adiponectin Resistin Leptin IL-1β IL-4 IL-6 IL-8 IL-10 IL-12 TNF-α IFN-γ TGF-1β MCP-1
Resistin NS
Leptin NS NS
IL-1β -0.365a NS NS
IL-4 NS NS NS NS
IL-6 -0.516b NS NS 0.533
b NS
IL-8 NS NS NS 0.452b 0.469
b 0.374
a
IL-10 NS NS NS 0.358a 0.579
c NS 0.518
b
IL-12 NS NS NS NS NS NS NS 0.470b
TNF-α -0.347a NS NS 0.512
b 0.403
a 0.739
c 0.542
b 0.480
b 0.379
a
IFN-γ NS NS NS 0.517b 0.481
b NS 0.542
b 0.592
c 0.364
a 0.364
a
TGF-1β NS 0.502b NS NS 0.373
a NS 0.400
a NS NS NS NS
MCP-1 MS NS NS NS NS NS NS NS NS NS NS NS
Insulin NS NS 0.596c NS NS NS NS NS NS NS NS NS 0.360
a

78
Table 2.7 Cytokine to cytokine, and insulin, correlations in the total (DM2 and controls) Nigerian study population.
Spearman rho correlation coefficients between the various cytokines measured in the whole Nigerian population which comprised of DM2 and control
subjects. The negative correlations are represented by a minus (-) preceding the coefficient value. The nature of cytokine-cytokine relationships are
suggestive of a combination of proinflammatory and anti-inflammatory cytokine interactions in the diabetics. The superscripts refers to the degree of
correlation significance; ap < 0.05,
bp < 0.01 and
cp < 0.001. NS: not significant at p < 0.05.
Adiponectin Resistin Leptin IL-1β IL-4 IL-6 IL-8 IL-10 IL-12 TNF-α IFN-γ TGF-1β
MCP-1
Resistin 0.203a
Leptin NS NS
IL-1β NS NS NS
IL-4 NS NS NS 0.299b
IL-6 -0.233a NS NS 0.564
c 0.212
a
IL-8 NS NS NS 0.238a 0.271
b 0.293
b
IL-10 NS NS NS 0.408c 0.380
c 0.387
c 0.328
b
IL-12 NS NS NS 0.379c 0.476
c 0.249
a NS 0.435
c
TNF-α -0.269b -0.207
a NS 0.538
c 0.299
b 0.693
c 0.422
c 0.428
c 0.262
b
IFN-γ NS NS NS 0.365c 0.517
c 0.299
b 0.319
b 0.470
c 0.400
c 0.346
c
TGF-1β NS 0.205a NS NS NS -0.271
b NS NS NS NS NS
MCP-1 NS NS NS NS NS NS NS NS NS NS NS NS
Insulin NS NS 0.306 b NS NS NS NS NS NS NS NS NS 0.334
b
79
2.4 DISCUSSION
The mean levels of BMI and WHR did not show any significant difference when compared in
Nigerian DM2 and control groups, and hence may not have significant bearing on the
differences observed in the study population. However, it is known that obesity and central
adiposity have an influence on the pattern of cytokines (IL-6, CRP IL-5, IL-10, IL-12, IL-13
and IFN-γ-levels) seen in patients (Hermsdorff et al, 2011; Schmidt et al, 2015). The
preponderance of cytokine functions (pro- or anti-inflammatory type) found in some obese
and IR patients is determined by the degree of adiposity, types of stimuli and macrophage
activation status (Autieri, 2012, Schmidt et al, 2015).
The significant finding in this study include the increase in mean plasma IL-6 and TNF-α in
Nigerian DM2 subjects compared to controls. IL-6 is secreted by adipose cells, macrophages
and other mononuclear cells, in response to inflammatory stimuli. The source of IL-6 increase
in the Nigeria diabetics is unlikely to be the adipocytes as there was no significant correlation
of the cytokine with BMI and WHR. Increase in the levels of IL-6 and TNFα in the Nigerian
DM2 subjects has been noted in other DM2 populations. Elevation of proinflammatory
cytokines such as IL-6, IL-1β, TNF-α and CRP even at the the early stages of diabetes
mellitus was reported in various other studies (Spranger et al, 2003; Thorand et al, 2003; Liu
et al, 2007). In the EPIC-Potsdam study by Spranger et al, 2003, raised IL-6 was
independently associated with the incidence of DM2. With respect to the increase in mean
plasma IL-6 level in diabetics compared to controls, the EPIC-Potsdam study reported less
than 100% compared to the 166% in the current Nigerian populations studied. Elevated
plasma IL-6 and TNFα in DM2 are associated with increasing trend in other proinflammatory
cytokines (IL-1β, IFN-γ, resistin), as observed in the Nigerian study population. These
cytokines cause impairment of insulin signaling pathways by activation of NF-κB and Janus
kinase (JNK) pathways, thereby reducing GLUT-4 translocation to the membrane
(Alexandraki et al, 2006). Though Spranger et al, 2003, reported that IL-6 was an independent
risk factor for incident diabetes, it was also noted that the combination of IL-6 and IL-1β was
more predictive of the disease. Among the Nigerian population, the mean IL-1β in DM2
subjects compared to controls was increased by approximately 50%, however this observation

80
was not statistically significant. Elevated plasma IL-1 β has been associated with DM2
(Donath et al, 2003, Donath, 2011), but not in others (Spranger et al, 2003).
The mean levels of the various cytokines evaluated in the current Nigeria population, except
IFN-γ, are relatively high when compared to other populations. In a group of Mexicans living
in America, Mirza et al (2012) reported significantly higher levels of IL-6, IL-8 and TNF-α in
DM2 subjects compared to controls. A similar study by Guadarrama-Lopez et al, 2015 found
higher mean plasma cytokines levels (IL-1β, IL-2, IL-6, IL-8, IL-13, TNF-α and IFN-γ) in
Mexican DM2 subjects than in those reported for Mexican-Americans, Germans, Americans
and Iraqi diabetic populations (Guadarrama-Lopez et al, 2015). In Nigeria, while IL-6 and
TNF-α were significantly higher in DM2 subjects, the study by Guadarrama-Lopez et al
(2015) found significantly higher IL-6, IL-1β and IFN-γ levels in DM2 subjects compared to
controls. Among Mexican-American, Mirza et al (2012) reported higher IL-8 and TNF-α
levels in DM2 subjects. The levels of cytokines in Nigerians, except for IFN-γ, were higher
than those of the Mexican DM2 subjects (Guadarrama-Lopez et al, 2015) and Mexican-
Americans diabetics (Mirza et al, 2012). The percentage increase in mean levels of cytokines
in Nigerian diabetics compared to those found by Guadarrama-Lopez et al (2015), ranged
from about 100% (IL-1β: Nigeria, 39.5 pg/ml ± 112.4; Mexico, 19.1 pg/ml ± 1.3) to over
1000% (IL-6: Nigeria, 215.9 pg/ml ± 328.6; Mexico, 18.3 pg/ml ± 11.7). Figure 2.8 shows
multiple folds increase in plasma IL-6 levels in Nigerian DM2 subjects compared to similar
others in Europe, Korea and Mexico. These comparisons are based on the values of measured
cytokines before logarithmic transformation was carried out on the data.
The mean plasma level of IFN-γ in the Mexican DM2 population was twice that in the
Nigerian study group (Mexico, 73.0 pg/ml ± 38.9, Nigeria, 36.5 pg/ml ± 42.7). The reasons
for the higher IFN-γ in Mexican diabetics are not clear but may be related to nutritional,
genetic, adiposity and/or immune activation differences. A study by Chng et al, 2015,
reported that most clinical studies of DM2 show a positive correlation between peripheral
blood Th1 cell frequency and obesity, and metabolic dysfunction. Moreover, a higher
prevalence of TB (a condition associated with Th1 immunity (IFN-γ)) has recently been
reported in Mexican DM2 patients (Rodriguez-Rodriguez et al, 2015).

81
The elevation of both proinflammatory and anti-inflammatory biomarkers in both the
Nigerian DM2 and control subjects, compared to other populations, maybe related to
environmental, nutritional, socioeconomics and genetic factors. The environmental impact of
infestation/infection on immune status in Africans may play a significant role in the findings
in Nigerians. In comparing immune status of healthy blood donors in Ghana and Denmark,
the authors found a significantly higher expression of Th2 type cytokines (IL-4) in Ghanaians
compared to the Danes, but not in IFN-γ (kemp et al, 2001). Another study (Wilfing et al,
2001) which examined the differences in the capacity of T-cells to produce cytokines in
children and adults from Africa (Gabon) and Europe (Austria), found similar results to the
Ghana-Denmark study. In the study by Wilfing et al, 2001, the authors found a striking
increase in the frequency of both Type 1 and Type 2 cytokine producing T-cells in African
adults compared to their European counterparts. Furthermore, they reported an age-dependent
increase in the overall capacity of cytokine production within the African population. The
conclusions from these studies is that there is an increase in T-cell cytokine production among
Africans over time, with the cytokine profile in adults being a reflection of the cumulative
experiences of antigenic contacts/stimulation rather than ethnic differences (Wilfing et al,
2001). The recognised higher immune activation status in Africans goes back to early infancy
due to antigenic contacts even during foetal life. Kohler et al (2008) compared the
immunological status of African and European cord blood mononuclear cells and found that
in infancy there was a general enhanced maturation of the neonatal immune system in
Africans. Therefore, the immune status of Africans appears to be activated from early infancy
as a result of exposure to antigenic stimulation or during intrauterine foetal life. Other studies
have shown that in areas endemic for malaria, tuberculosis, helminthic infections and other
tropical disease, elevation of multiple cytokines occurs including Th1 and Th2 cytokines e.g.,
IFN-γ, TNF-, IL-4, IL-5, IL-10, and IL-12, in the plasma of resident populations (Kemp et
al, 2001; Noone et al, 2013, Mbengue et al, 2016). In adaptive immunity T cell cytokines
work in positive feedback loops and there is plasticity of T cells to produce e.g., both IL-4 and
IFN-γ (Figure 2.5). Classically, T helper cells have been described by their cytokine profiles
and transcription factors as either Th0 (mixed cytokines), Th1 (producing IL-2, IFN-γ, TNF-
α), Th2 (producing IL-4, IL-5, IL-10, IL-13) and others such as Th17 and Tregs producing IL-
10, TGF-β (Mosman and Sad, 1996; Zhu and Paul 2010). Traditionally, IFN-γ and IL-4 have
82
a reciprocal relationship although not in all systems. Also, IFN-γ can synergise and potentiate
IL-6 and TNF-α during the innate immune response (Mosman and Sad 1996). In chronic
inflammatory disease states and in certain infections the normal homeostatic regulatory
mechanisms can be insufficient and there is multiple raised pro- and anti-inflammatory
cytokines (Feldman, 2002). This mixed cytokine interactions in Nigerian diabetics and
controls could be due to long standing immune activation and this may have an impact on the
occurrence of non-communicable diseases in Nigerians. The presence of proinflammatory and
anti-inflammatory cytokines in Nigerian DM2 and the control groups, suggest that the risk of
diabetes maybe a combination of background inflammation, with secondary environmental
assault on the immune responses. It is known that chronic subacute inflammation, which
underpins obesity and DM2, is responsible for the pro-inflammatory (IL-6, TNF-α, IL-1β, IL-
12, IFNγ) and subsequent anti-inflammatory (IL-4, IL-5, IL-10, IL-13, TGF-1β) milieu seen
in the patients. The overall cytokine picture in the Nigerian population suggests a mix of
activation of innate immunity (adipokines, IL-6, IL-1β, IL-8, TNF-α and MCP-1) and
adaptive immunity (Th1; IFN-γ, IL-12, and Th2; IL-4, IL-10, TGF-1β), a feature
demonstrated in the data in Figures 2.4-2.7. The immune system is usually tightly regulated
such that pro-inflammatory stimuli induce an anti-inflammatory response in a negative
feedback loop in other to resolve or attenuate ongoing inflammation (Herder et al, 2013). It
could be that this regulation works in the presence of strong and more acute stimulation, as
occurs in infection or injuries. When there is weak stimulation, as found in the chronic
subclinical inflammation of obesity and IR, it induces anti-inflammatory responses that are
insufficient to counter-regulate the long standing low grade inflammation of the innate and
adaptive immune responses. Hence such anti-inflammatory processes are unable to prevent
metabolic disorders that contribute to insulin resistance and β-cell dysfunction (Herder et al,
2013). This insufficient counter-regulation of inflammation may be responsible for the
elevated plasma levels of cytokines in Nigerians as reflected in the high levels in DM2 and
non DM2 control populations observed in this study. The elevated mean level of adiponectin,
TGF-1β and low levels of leptin in DM2 in relation to the study controls support the
possibility of chronic inflammation in the Nigerian subjects. The antigenic drive behind such
widespread immune activation in Nigerian DM2 and controls is, however, not clear and
requires further serological and microbiological investigations. The shift in the balance

83
between pro-inflammatory and anti-inflammatory signals, but with excess deviation to pro-
inflammation could be driving the observed cytokine profile found in the disease.
A review by Herder et al, (2013) noted that various studies have demonstrated high levels of
circulating adiponectin in those with a low risk for DM2. Furthermore it was also stated that
the strength of this inverse relationship was independent of age, sex, BMI, ethnicity, methods
of diagnosis of diabetes and length of follow up of the patients (Herder et al, 2013). It is
thought that high levels of adiponectin may reflect severe underlying proinflammatory
processes (Herder et al, 2013). Some studies including this index study found no significant
difference in the levels of adiponectin in diabetics and controls. The studies by Mirza et al
(2012) among Mexican-Americans and Aleidi et al, (2015) in Jordan found no difference in
the levels of adiponectin in diabetics and controls. This inverse relationship between
adiponectin and DM2 may not hold in all populations. The significant negative correlations
found between adiponectin and IL-1β, IL-6 and TNF-α in Nigerian controls were not found in
the diabetic subjects. Therefore, the attenuation of DM risk by adiponectin may be more
related to its ability to function as an anti-inflammatory biomarker in the individuals
concerned. The underlying pro-inflammatory processes in Nigerians, which could be due to
diabetes or to other environmental factors, may be responsible for the marked reduction in
leptin in DM2 compared to controls. Although the difference is not statistically significant,
there is a 160% increase in the mean leptin levels in controls compared with DM2 subjects.
Leptin is regulated by the immune status in response to inflammation i.e., acute or chronic
inflammation. The acute innate immune response and the release of TNF-α and IL-1β leads to
short term release of plasma leptin for its role in the inflammatory-immune response of the
host (Mantzoros et al, 1997). Leptin is able to activate monocyte secretion of TNF-α and IL-
1β which in turn sustain leptin secretion. But in the chronic inflammation state the response of
leptin to inflammation changes. The increase in the levels of proinflammatory cytokines in
chronic inflammation is associated with suppression of leptin secretion (Mantzoros et al,
1997). In addition, Meek & Morton in 2016 reported that the administration of leptin leads to
reduction in IR and decrease in blood glucose. This is said to be due normalisation of hepatic
glucose production and increased rate of peripheral glucose uptake (Meek & Morton, 2016).
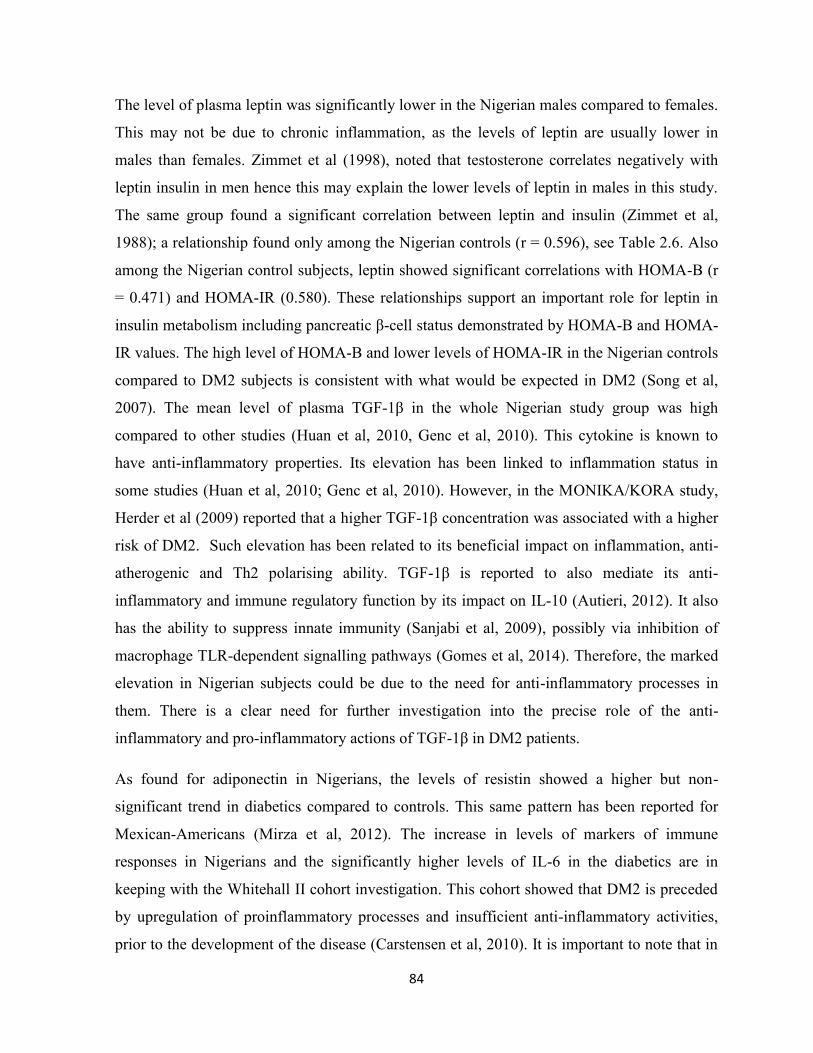
84
The level of plasma leptin was significantly lower in the Nigerian males compared to females.
This may not be due to chronic inflammation, as the levels of leptin are usually lower in
males than females. Zimmet et al (1998), noted that testosterone correlates negatively with
leptin insulin in men hence this may explain the lower levels of leptin in males in this study.
The same group found a significant correlation between leptin and insulin (Zimmet et al,
1988); a relationship found only among the Nigerian controls (r = 0.596), see Table 2.6. Also
among the Nigerian control subjects, leptin showed significant correlations with HOMA-B (r
= 0.471) and HOMA-IR (0.580). These relationships support an important role for leptin in
insulin metabolism including pancreatic β-cell status demonstrated by HOMA-B and HOMA-
IR values. The high level of HOMA-B and lower levels of HOMA-IR in the Nigerian controls
compared to DM2 subjects is consistent with what would be expected in DM2 (Song et al,
2007). The mean level of plasma TGF-1β in the whole Nigerian study group was high
compared to other studies (Huan et al, 2010, Genc et al, 2010). This cytokine is known to
have anti-inflammatory properties. Its elevation has been linked to inflammation status in
some studies (Huan et al, 2010; Genc et al, 2010). However, in the MONIKA/KORA study,
Herder et al (2009) reported that a higher TGF-1β concentration was associated with a higher
risk of DM2. Such elevation has been related to its beneficial impact on inflammation, anti-
atherogenic and Th2 polarising ability. TGF-1β is reported to also mediate its anti-
inflammatory and immune regulatory function by its impact on IL-10 (Autieri, 2012). It also
has the ability to suppress innate immunity (Sanjabi et al, 2009), possibly via inhibition of
macrophage TLR-dependent signalling pathways (Gomes et al, 2014). Therefore, the marked
elevation in Nigerian subjects could be due to the need for anti-inflammatory processes in
them. There is a clear need for further investigation into the precise role of the anti-
inflammatory and pro-inflammatory actions of TGF-1β in DM2 patients.
As found for adiponectin in Nigerians, the levels of resistin showed a higher but non-
significant trend in diabetics compared to controls. This same pattern has been reported for
Mexican-Americans (Mirza et al, 2012). The increase in levels of markers of immune
responses in Nigerians and the significantly higher levels of IL-6 in the diabetics are in
keeping with the Whitehall II cohort investigation. This cohort showed that DM2 is preceded
by upregulation of proinflammatory processes and insufficient anti-inflammatory activities,
prior to the development of the disease (Carstensen et al, 2010). It is important to note that in
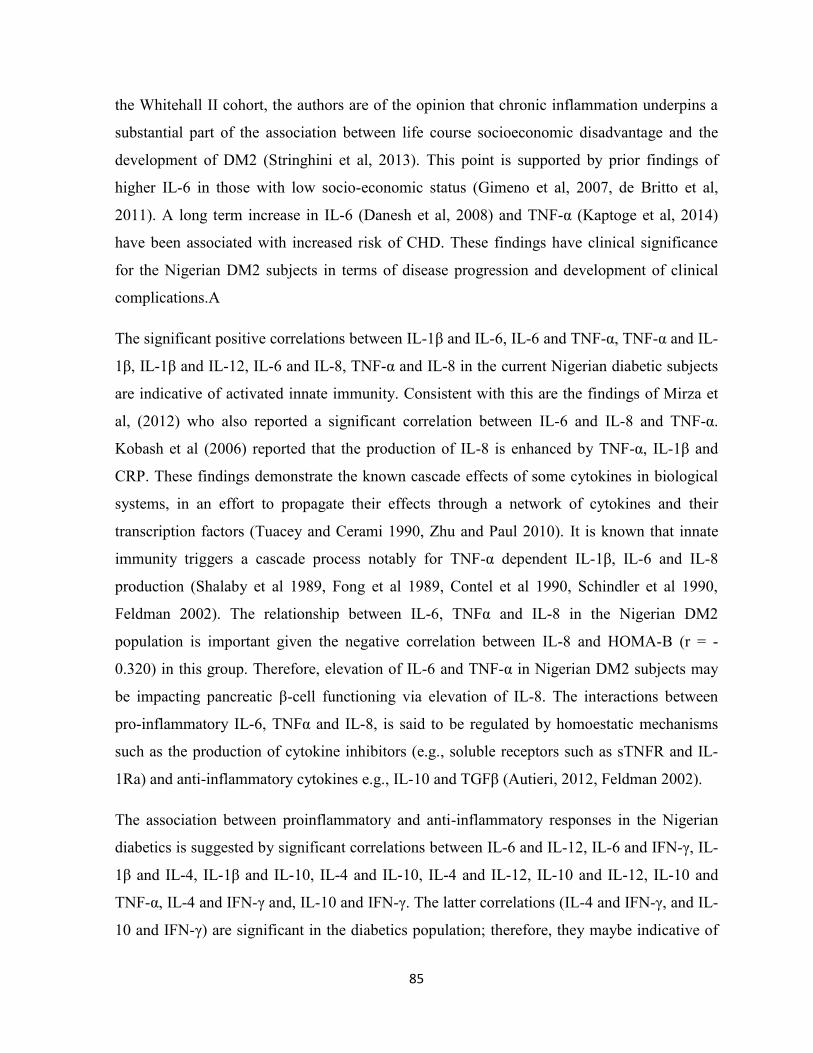
85
the Whitehall II cohort, the authors are of the opinion that chronic inflammation underpins a
substantial part of the association between life course socioeconomic disadvantage and the
development of DM2 (Stringhini et al, 2013). This point is supported by prior findings of
higher IL-6 in those with low socio-economic status (Gimeno et al, 2007, de Britto et al,
2011). A long term increase in IL-6 (Danesh et al, 2008) and TNF-α (Kaptoge et al, 2014)
have been associated with increased risk of CHD. These findings have clinical significance
for the Nigerian DM2 subjects in terms of disease progression and development of clinical
complications.A
The significant positive correlations between IL-1β and IL-6, IL-6 and TNF-α, TNF-α and IL-
1β, IL-1β and IL-12, IL-6 and IL-8, TNF-α and IL-8 in the current Nigerian diabetic subjects
are indicative of activated innate immunity. Consistent with this are the findings of Mirza et
al, (2012) who also reported a significant correlation between IL-6 and IL-8 and TNF-α.
Kobash et al (2006) reported that the production of IL-8 is enhanced by TNF-α, IL-1β and
CRP. These findings demonstrate the known cascade effects of some cytokines in biological
systems, in an effort to propagate their effects through a network of cytokines and their
transcription factors (Tuacey and Cerami 1990, Zhu and Paul 2010). It is known that innate
immunity triggers a cascade process notably for TNF-α dependent IL-1β, IL-6 and IL-8
production (Shalaby et al 1989, Fong et al 1989, Contel et al 1990, Schindler et al 1990,
Feldman 2002). The relationship between IL-6, TNFα and IL-8 in the Nigerian DM2
population is important given the negative correlation between IL-8 and HOMA-B (r = -
0.320) in this group. Therefore, elevation of IL-6 and TNF-α in Nigerian DM2 subjects may
be impacting pancreatic β-cell functioning via elevation of IL-8. The interactions between
pro-inflammatory IL-6, TNFα and IL-8, is said to be regulated by homoestatic mechanisms
such as the production of cytokine inhibitors (e.g., soluble receptors such as sTNFR and IL-
1Ra) and anti-inflammatory cytokines e.g., IL-10 and TGFβ (Autieri, 2012, Feldman 2002).
The association between proinflammatory and anti-inflammatory responses in the Nigerian
diabetics is suggested by significant correlations between IL-6 and IL-12, IL-6 and IFN-γ, IL-
1β and IL-4, IL-1β and IL-10, IL-4 and IL-10, IL-4 and IL-12, IL-10 and IL-12, IL-10 and
TNF-α, IL-4 and IFN-γ and, IL-10 and IFN-γ. The latter correlations (IL-4 and IFN-γ, and IL-
10 and IFN-γ) are significant in the diabetics population; therefore, they maybe indicative of
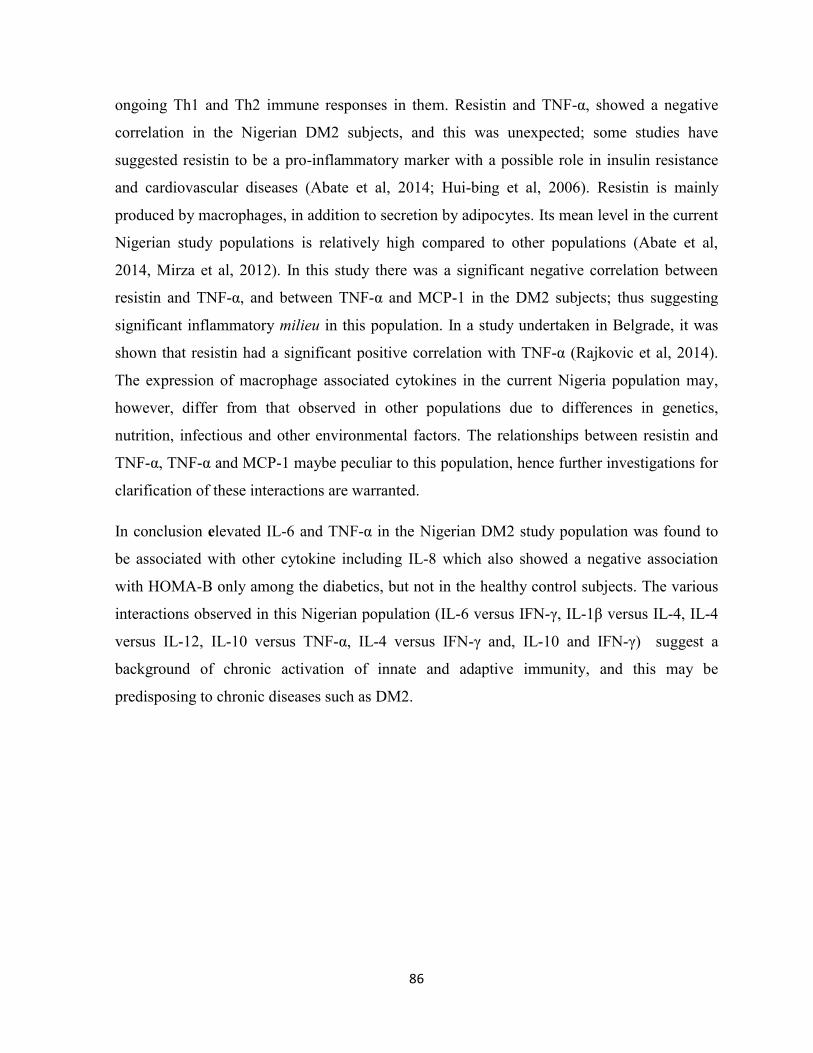
86
ongoing Th1 and Th2 immune responses in them. Resistin and TNF-α, showed a negative
correlation in the Nigerian DM2 subjects, and this was unexpected; some studies have
suggested resistin to be a pro-inflammatory marker with a possible role in insulin resistance
and cardiovascular diseases (Abate et al, 2014; Hui-bing et al, 2006). Resistin is mainly
produced by macrophages, in addition to secretion by adipocytes. Its mean level in the current
Nigerian study populations is relatively high compared to other populations (Abate et al,
2014, Mirza et al, 2012). In this study there was a significant negative correlation between
resistin and TNF-α, and between TNF-α and MCP-1 in the DM2 subjects; thus suggesting
significant inflammatory milieu in this population. In a study undertaken in Belgrade, it was
shown that resistin had a significant positive correlation with TNF-α (Rajkovic et al, 2014).
The expression of macrophage associated cytokines in the current Nigeria population may,
however, differ from that observed in other populations due to differences in genetics,
nutrition, infectious and other environmental factors. The relationships between resistin and
TNF-α, TNF-α and MCP-1 maybe peculiar to this population, hence further investigations for
clarification of these interactions are warranted.
In conclusion elevated IL-6 and TNF-α in the Nigerian DM2 study population was found to
be associated with other cytokine including IL-8 which also showed a negative association
with HOMA-B only among the diabetics, but not in the healthy control subjects. The various
interactions observed in this Nigerian population (IL-6 versus IFN-γ, IL-1β versus IL-4, IL-4
versus IL-12, IL-10 versus TNF-α, IL-4 versus IFN-γ and, IL-10 and IFN-γ) suggest a
background of chronic activation of innate and adaptive immunity, and this may be
predisposing to chronic diseases such as DM2.

87
Eu
rop
e
Ko
rea
Mexic
o
0
5 0 0 0
1 0 0 0 0
1 5 0 0 0
8 ,7 1 2 .3 %
1 3 ,4 7 6 %
1 0 8 0 %
C o u n tr y
% i
nc
re
as
e i
n I
L-6
re
lativ
e
to
Nig
er
ian
DM
2
Figure 2.8 Percent increase in mean IL-6 levels in Europe, Korea and Mexico diabetics
relative to the value in Nigerian DM2 subjects.
Data shows the percent increase in mean IL-6 pg/ml ± standard deviation for DM2 subjects in the UK (1.67
pg/ml ± 1.59; 8,700%), South Korea (1.59 pg/ml ± 1.73; 13,476%) and Mexico (18.3 pg/ml ± 11.7; 1079.8%)
compared to the level in Nigerian diabetics (215.86 pg/ml ± 328.58). Europe IL-6 value as shown in Spranger et
al, 2003, Korea in Lee et al, 2008 and Guadarrama-Lopez et al, 2015 reported the value for Mexico diabetics.
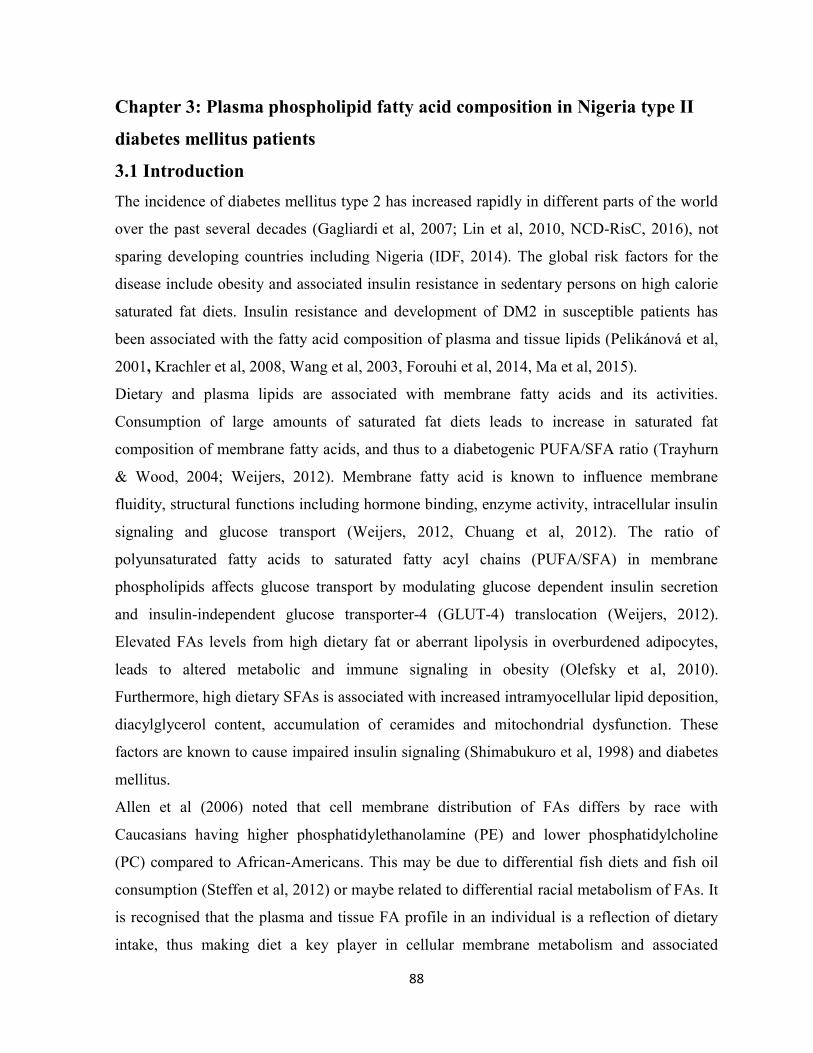
88
Chapter 3: Plasma phospholipid fatty acid composition in Nigeria type II
diabetes mellitus patients
3.1 Introduction
The incidence of diabetes mellitus type 2 has increased rapidly in different parts of the world
over the past several decades (Gagliardi et al, 2007; Lin et al, 2010, NCD-RisC, 2016), not
sparing developing countries including Nigeria (IDF, 2014). The global risk factors for the
disease include obesity and associated insulin resistance in sedentary persons on high calorie
saturated fat diets. Insulin resistance and development of DM2 in susceptible patients has
been associated with the fatty acid composition of plasma and tissue lipids (Pelikánová et al,
2001, Krachler et al, 2008, Wang et al, 2003, Forouhi et al, 2014, Ma et al, 2015).
Dietary and plasma lipids are associated with membrane fatty acids and its activities.
Consumption of large amounts of saturated fat diets leads to increase in saturated fat
composition of membrane fatty acids, and thus to a diabetogenic PUFA/SFA ratio (Trayhurn
& Wood, 2004; Weijers, 2012). Membrane fatty acid is known to influence membrane
fluidity, structural functions including hormone binding, enzyme activity, intracellular insulin
signaling and glucose transport (Weijers, 2012, Chuang et al, 2012). The ratio of
polyunsaturated fatty acids to saturated fatty acyl chains (PUFA/SFA) in membrane
phospholipids affects glucose transport by modulating glucose dependent insulin secretion
and insulin-independent glucose transporter-4 (GLUT-4) translocation (Weijers, 2012).
Elevated FAs levels from high dietary fat or aberrant lipolysis in overburdened adipocytes,
leads to altered metabolic and immune signaling in obesity (Olefsky et al, 2010).
Furthermore, high dietary SFAs is associated with increased intramyocellular lipid deposition,
diacylglycerol content, accumulation of ceramides and mitochondrial dysfunction. These
factors are known to cause impaired insulin signaling (Shimabukuro et al, 1998) and diabetes
mellitus.
Allen et al (2006) noted that cell membrane distribution of FAs differs by race with
Caucasians having higher phosphatidylethanolamine (PE) and lower phosphatidylcholine
(PC) compared to African-Americans. This may be due to differential fish diets and fish oil
consumption (Steffen et al, 2012) or maybe related to differential racial metabolism of FAs. It
is recognised that the plasma and tissue FA profile in an individual is a reflection of dietary
intake, thus making diet a key player in cellular membrane metabolism and associated
89
receptor functioning. Various studies have evaluated the plasma fatty acid profile in diabetes
mellitus subjects in relation to healthy controls (Ma et al, 2015, Krachler et al, 2008, Wang et
al, 2003, Chuang et al, 2012), but this has not been undertaken in Nigerian DM2 subjects
despite the huge burden of diabetes mellitus in the country (IDF, 2014). The choice of
measuring plasma PC phospholipid FAs in this study was informed by the findings of Hodge
et al (2007) and Patel et al (2010) that dietary fat intake was related to plasma and tissue fatty
acid content. Patel and co-workers went further to report that the plasma phospholipid fraction
FA profile was a better biomarker for assessing diabetes risk (Patel et al, 2010). Therefore,
comparison of the findings of this study with other published investigations that have
measured plasma phospholipids will help in understanding the findings in Nigerian subjects.
The aim of this study was to compare the FA profile of the plasma PC fraction of Nigerian
DM2 subjects and healthy non-DM2 controls.
3.2 Materials and methods
One hundred and eight age matched subjects were recruited for the study, but only 101 of
them had complete records. These were made up of DM2 (n = 68) and healthy control (n =
33) subjects who were analysed for this study. The diabetic subjects were recruited from
diabetic clinics of three different tertiary hospitals in different states of Nigeria; Plateau State
(Jos University Teaching Hospital, Jos) and Benue State (Benue State University Teaching
Hospital, Makurdi) from the Middle-belt region of Nigeria, and Ekiti State (Federal Medical
Centre, Ido-Ekiti) from the South-western region of the country. The control subjects were
non-diabetic patients who were hospital staff members, persons visiting the hospitals for
blood donation and those attending for medical examination prior to employment. The
inclusion criteria for the diabetic subjects were attendance at the diabetic clinic and
confirmation of newly diagnosed diabetes. The new diabetic subjects must have fasting
plasma glucose > 7.0 mmol/L on two different occasions of blood glucose assay. Patients with
chronic liver and renal diseases (after measuring liver enzymes, plasma urea and creatinine),
and those on fish oil supplements, were excluded from the study. On inclusion in the study, all
the subjects had their blood pressure measured (mmHg) and body mass index (BMI) and
waist-hip-ratio (WHR) determined. BMI was determined by dividing the body weight (kg) by
the square of the height in meters. WHR was determined from the ratio of the waist
90
circumference (WC) to hip circumference (HC). Waist circumference was measured at the
mid point between the lower costal margin of the rib cage and the greater trochanter in
centimetres. The HC was measured around the hips and over the maximum protuberance of
the gluteus maximus. About 20 ml of venous blood samples was taken into heparinised tubes
on the morning after an overnight fast of 10-16 hr. From the harvested 10-12 ml of plasma
from each subject’s blood sample, 2 ml was placed into cryovials. Such samples were frozen
at -80°C until the FAs in the PC fraction of total plasma phospholipid were analysed by gas
chromatography. The plasma FAs are reported as percentage weight (wt %) ± standard
deviation (SD) of total plasma PC phospholipids.
3.2.1 Fatty acid analysis
3.2.1.1 Extraction of total fatty acids
Plasma samples of the study subjects stored at -80oC were thawed to room temperature, after
which 500 µl of each subject samples was transferred into 100 ml extraction tubes already
containing 45 ml of chloroform : methanol, 2:1 v/v (HPLC grade, Sigma, Aldrich,
Gillingham) and butylated hydroxytoluene (BHT, 100 mg/l, Sigma, Aldrich Chemie Gmbh,
Steinheim, Germany). The samples were vortexed and flushed with oxygen-free nitrogen
(OFN) and then stored at 4oC for 24 hr. This process was used for the extraction of the total
lipids in the samples.
3.2.1.2 Partitioning
The extracted total lipids were filtered into a measuring cylinder by running each sample
through a separation funnel lined with filter paper. The extract was topped with 25% v/v of
0.85% saline and the filtrate then flushed with oxygen-free nitrogen (OFN) for 1 min, before
storage at 4°C for 24 hr.
3.2.1.3 Rotary evaporation
The lower, organic layers of the samples in the measuring cylinders were carefully transferred
into 50 ml round-bottomed flasks. The solvent was removed under reduced pressure in a
water bath at 37°C using a rotary evaporator (Buchi, Laboratorium Technik AG,
91
Switzerland). Thereafter, the dried, whole lipid was extracted to a 5 ml vial using 1.0 ml
washes of chloroform/BHT (x3). The final volume was reduced to about 1 ml under a stream
of OFN and stored at 4°C.
3.2.1.4 Thin layer chromatography (TLC)
TLC plates coated with silica gel G (soft layer adsorbosil-plus 1, precoated 250 m; 20x20
cm; Alltech associates Applied Science, USA) were used to separate the PC phospholipid
fraction. The plates were dried (100oC, 1 hr) before use and the TLC tank was lined with filter
paper, filled with a phospholipid solvent system, covered and left to equilibrate for 30 min.
Plain capillary tubes (75 l, Plastics Sealing, BS 4316, Hawksley & sons Ltd., Lancing,
England) were used to apply the samples and a PC standard to the TLC plate. The TLC plate
was placed in a phospholipid solvent system (chloroform, methanol, methylamine, 65:35:15 +
BHT @ 100 mg/1) until the solvent front reached the top of the scored line on the TLC plate.
The plate was removed, dried and sprayed with a 0.1% solution of 2, 7-dichlorofluorescin in
methanol. The TLC plate was visualized under UV light and the sample PC fraction band,
identified by comparison with the PC standards, was marked with pencil and scraped into
methylating tubes using a plastic filter funnel.
3.2.1.5 Methylation
Four millilitres (4 ml) of the methylating reagent i.e., 15% acetyl chloride (Sigma-Aldrich
Chemie Gbmh, Steinheim, Germany) in dried methanol (BDH Laboratory supplies, Poole,
England) was added to the scraped PC fractions, flushed with OFN, covered with teflon lined
tops which were checked to ensure tightly capped tubes. The samples were vortexed and
placed in an oven (70oC) for 3 hr to methylate.
3.2.1.6 Extraction of methyl esters
After 3 hr the tubes were removed from the oven, cooled to room temperature and an equal
volume (4 ml) of 5% saline (distilled water and NaCl, BDH Laboratory supplies, Poole,
England) was added to extract the methyl esters; 2 ml of petrol spirit with BHT (100mg/l)
were added and the sample vortexed. This step was repeated 2 times (2 ml + 2 x 1 ml of petrol
spirit/BHT), after each step the upper petrol layer was removed to a test tube containing 2 ml

92
of 2% potassium bicarbonate (Sigma-Aldrich Chemie Gmbh, Steinham, Germany). The
extract, with potassium bicarbonate, was mixed and the upper layer was transferred to a test
tube containing 200 mg dried granular sodium sulphate (BDH Laboratory supplies, Poole,
England) to absorb any water left in the mixture. Afterwards, the solution of FA methyl esters
in petrol spirit was transferred into a 3 ml vial. Petrol spirit was removed by a stream of OFN
and 1 ml of HPLC grade heptane (Sigma-Aldrich, Gillingham, England)/BHT (100 mg/l) was
added to dissolve the sample. The sample was flushed with OFN and stored at 4oC for gas
chromatography.
3.2.1.7 Analysis of fatty acids
Samples were dried down under OFN and 15 drops of heptane/BHT were added. Total PC
fatty acid methyl esters were detected using a HRGC Mega series 2-FISONS detector, fitted
with a capillary column G: Carbowax 20M-BP20 (SGE), 30 m x 0.25 mm. Fatty acid methyl
esters were identified by comparison with authenthic standards (Sigma, UK) and quantified as
% total peak areas for fatty acid methyl esters between myristic (C14:0) and docosahexaenoic
acid (C22:6n-3).
3.2.1.8 Collection and integration of data
EZChrom software was used to collect the data from the GC into data files before a final
report for each sample was prepared. The final report showed integrated peaks of fatty acid
methyl esters, retention time and a percentage area for each detected PC phospholipid FA in
the sample. This report was used for identification of FAs in the total PC fraction in each
sample and was calculated usin the software as a percentage (%) of the total PC FAs in the
plasma.
3.2.1.9 Statistical analysis
The values for the different FAs (weight % of total plasma PC phospholipids) in each subject
were entered into the SPSS 20 Statistical package. Statistical exploration of the data showed
that the fatty acids were not remarkably skewed and the histograms were acceptable for a
normal distribution. The mean ± SD values of the FAs and standard deviation were
determined and compared between DM2 and control subjects using independent T-test. The

93
level of significance was set at p < 0.05. Correlation analyses were undertaken using
Spearman rank correlation analysis (Harris et al, 2004).
3.3 Results
Of the 108 samples, sixty-nine (69) subjects with DM2 and 33 non-diabetic controls were
fully analysed. The mean age for the DM2 group and controls were 52.67 years ± 8.53 and
52.09 years ± 7.27, respectively. This difference was not significant; p < 0.05. The other
clinical data measured are shown in Table 3.0.
Table 3.0 Comparison of some clinical parameters in Nigerian DM2 and healthy control
subjects.
VARIABLES DM2
Mean ± SD
(n)
CONTROLS
Mean ± SD
(n)
pValue
Age 52.67 ± 8.53 (73) 52.09 ± 7.27 (34) 0.234
Waist-hip-ratio (WHR) 0.96 ± 0.13 (60) 0.95 ± 0.19 (28) 0.745
BMI (Kg/m2) 24.28 ± 10.32 (59) 24.94 ± 9.87 (26) 0.784
Systolic blood pressure (mmHg) 130.36 ± 22.91(42) 137.14 ± 24.94 (14) 0.352
Diastolic blood pressure (mmHg) 83.33 ± 12.03 (42) 86.43 ± 17.37 (14) 0.544
FPG (mmol/L) 9.18 ± 4.37 (73) 4.80 ± 0.87 (34) 0.001
Data is mean ± SD of clinical parameters in DM2 and control subjects. Only fasting plasma glucose (FPG)
showed a significant difference when compared in DM2 and control subjects, at p < 0.05.
Table 3.0a shows significant difference in HOMA indices between DM2 and control subjects
after logarithmic transformation. The result shows poorer pancreatic β-cells function indicated
by lower HOMA-B value and increased IR indicated by higher HOMA-IR, in the diabetics
compared to control subjects.

94
Table 3.0.a Comparison of insulin and HOMA indices in Nigerian DM2 and healthy control
subjects using student T-test after logarithmic transformation of the measured variables.
VARIABLES DM2
Mean ± s.em
(n = 56)
DM2
Mean log ±
s.e.m
Controls
Mean ± s.e.m
(n = 42)
Controls
Mean log ±
s.e.m
pValue
Insulin 1042.82 ± 673.76 2.39±0.07 395.73 ± 125.45 2.29±0.07 0.325
HOMA-B 75.52 ± 49.46 1.22 ±0.08 52.49 ± 16.29 1.44±0.08 0.047
HOMA-IR 11.56 ± 6.82 0.45±0.08 2.61 ± 0.74 0.09±0.08 0.001
HOMA-B; homoestasis model assessment-B represents pancreatic β-cells function. HOMA-IR; homoestasis
model assessment-IR indicates level of insulin resistance. Mean log; logarithmic transformation of measured
cytokine values. p value is after T-test comparison of log mean values.
There was a significant difference in the mean value of palmitic acid; C16:0, (DM2; 30.83 ±
1.88, controls; 29.04 ± 0.97), C18:0 stearic (DM2; 15.88 ± 2.21, control 17.57 ± 2.43) and
C18:1n-7, vaccenic (1.05 ± 0.39, control; 1.26 ± 0.32) in Nigerian DM2 and controls, p <
0.05, see Table 3.1 and Figure 3.0.
The levels of arachidonic acid (C20:4n-6; 9.17 ± 2.12), adrenic acid (C22:4n-6; 0.24 ± 0.12)
and osbond acid (C22:5n-6; 0.19 ± 0.12) were significantly lower in DM2 subjects compared
to the controls (C20:4n-6; 10.31 ± 2.12, C22:4n-6; 0.30 ± 0.16, C22:5n-6; 0.27 ± 0.16), p <
0.05, Table 3.2 and Figure 3.1. The mean levels of linoleic acids (LA; C18:2n-6, γ-linolenic
acid C18:3n-6) and the n-3 PUFAs (α-linolenic acid, C18:3n-3; eicosapentaenoic acid,
C20:5n-3 and docosahexaenoic acid, C22:6n-3) were not significantly different between the
Nigerian DM2 and control groups (p < 0.05).

95
P al m i ti c ac i d (% wt) S te ar i c ac i d (% ) V ac c e n i c ac i d (% )
0
1 0
2 0
3 0
4 0
T y p e s o f fa t ty a c id
We
igh
t o
f fa
tty
ac
ids
(%
)
co
ntr
ol
DM
2
p = 0 .0 3 6
Co
ntr
ol
DM
2
p = 0 .0 0 1
D M 2 C o n tro l
p = 0 .0 0 8
Figure 3.0 Comparison of mean % weight of palmitic acid, stearic acid and vaccenic acid in
Nigeria DM2 and control subjects.
Data shows that vaccenic acid (C18:1n-7) and stearic acid (C18:0) were significantly higher in the Nigerian
controls, while palmitic acid (C16:0) was significantly higher in DM2.
Similarly, the amount of total SFA, total monounsaturated fatty acids (MUFAs) and total n-3
PUFAs were not significantly different in the DM2 and control groups (p <0.05).

96
A r ac h i don i c ac i d (% wt) A dr e n i c ac i d (% ) O s bon d ac i d (% )
0
5
1 0
1 5
T y p e s o f fa t ty a c id
We
igh
t o
f fa
tty
ac
ids
(%
)
co
ntr
ol
DM
2
p = 0 .0 1 3
Co
ntr
ol
DM
2p = 0 .0 4 6
D M 2 C o n tro l
p = 0 .0 1 2
Figure 3.1 Comparison of arachidonic acid, adrenic acid and osbond acid in Nigerian DM2
and control subjects.
The data shows that in the Nigeria population, arachidonic acid (C20:4n-6), adrenic acid (C22:4n-6)and
osbond acid (C22:5n-6) were significantly higher in the controls than DM2.
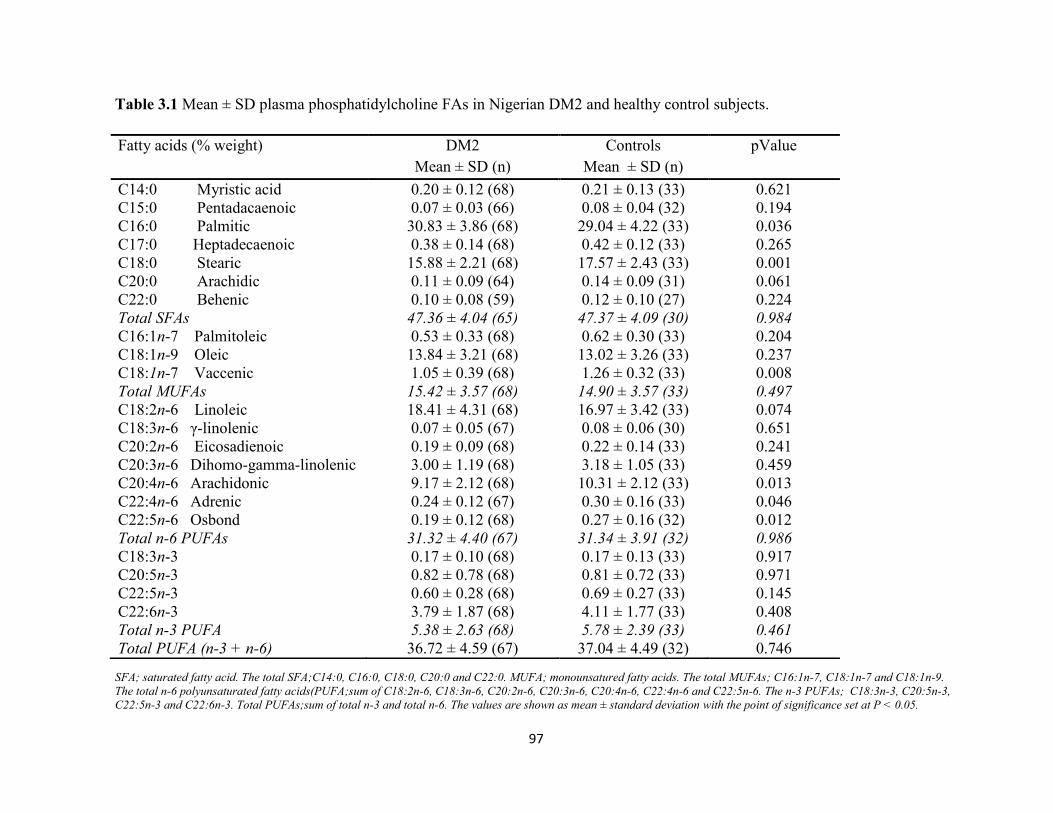
97
Table 3.1 Mean ± SD plasma phosphatidylcholine FAs in Nigerian DM2 and healthy control subjects.
SFA; saturated fatty acid. The total SFA;C14:0, C16:0, C18:0, C20:0 and C22:0. MUFA; monounsatured fatty acids. The total MUFAs; C16:1n-7, C18:1n-7 and C18:1n-9.
The total n-6 polyunsaturated fatty acids(PUFA;sum of C18:2n-6, C18:3n-6, C20:2n-6, C20:3n-6, C20:4n-6, C22:4n-6 and C22:5n-6. The n-3 PUFAs; C18:3n-3, C20:5n-3,
C22:5n-3 and C22:6n-3. Total PUFAs;sum of total n-3 and total n-6. The values are shown as mean ± standard deviation with the point of significance set at P < 0.05.
Fatty acids (% weight) DM2
Mean ± SD (n)
Controls
Mean ± SD (n)
pValue
C14:0 Myristic acid 0.20 ± 0.12 (68) 0.21 ± 0.13 (33) 0.621
C15:0 Pentadacaenoic 0.07 ± 0.03 (66) 0.08 ± 0.04 (32) 0.194
C16:0 Palmitic 30.83 ± 3.86 (68) 29.04 ± 4.22 (33) 0.036
C17:0 Heptadecaenoic 0.38 ± 0.14 (68) 0.42 ± 0.12 (33) 0.265
C18:0 Stearic 15.88 ± 2.21 (68) 17.57 ± 2.43 (33) 0.001
C20:0 Arachidic 0.11 ± 0.09 (64) 0.14 ± 0.09 (31) 0.061
C22:0 Behenic 0.10 ± 0.08 (59) 0.12 ± 0.10 (27) 0.224
Total SFAs 47.36 ± 4.04 (65) 47.37 ± 4.09 (30) 0.984
C16:1n-7 Palmitoleic 0.53 ± 0.33 (68) 0.62 ± 0.30 (33) 0.204
C18:1n-9 Oleic 13.84 ± 3.21 (68) 13.02 ± 3.26 (33) 0.237
C18:1n-7 Vaccenic 1.05 ± 0.39 (68) 1.26 ± 0.32 (33) 0.008
Total MUFAs 15.42 ± 3.57 (68) 14.90 ± 3.57 (33) 0.497
C18:2n-6 Linoleic 18.41 ± 4.31 (68) 16.97 ± 3.42 (33) 0.074
C18:3n-6 γ-linolenic 0.07 ± 0.05 (67) 0.08 ± 0.06 (30) 0.651
C20:2n-6 Eicosadienoic 0.19 ± 0.09 (68) 0.22 ± 0.14 (33) 0.241
C20:3n-6 Dihomo-gamma-linolenic 3.00 ± 1.19 (68) 3.18 ± 1.05 (33) 0.459
C20:4n-6 Arachidonic 9.17 ± 2.12 (68) 10.31 ± 2.12 (33) 0.013
C22:4n-6 Adrenic 0.24 ± 0.12 (67) 0.30 ± 0.16 (33) 0.046
C22:5n-6 Osbond 0.19 ± 0.12 (68) 0.27 ± 0.16 (32) 0.012
Total n-6 PUFAs 31.32 ± 4.40 (67) 31.34 ± 3.91 (32) 0.986
C18:3n-3 0.17 ± 0.10 (68) 0.17 ± 0.13 (33) 0.917
C20:5n-3 0.82 ± 0.78 (68) 0.81 ± 0.72 (33) 0.971
C22:5n-3 0.60 ± 0.28 (68) 0.69 ± 0.27 (33) 0.145
C22:6n-3 3.79 ± 1.87 (68) 4.11 ± 1.77 (33) 0.408
Total n-3 PUFA 5.38 ± 2.63 (68) 5.78 ± 2.39 (33) 0.461
Total PUFA (n-3 + n-6) 36.72 ± 4.59 (67) 37.04 ± 4.49 (32) 0.746

98
Table 3.2. Comparison of fatty acid ratios in Nigerian DM2 and healthy control subjects.
Fatty acid ratio DM2
Mean ± SD
(n)
Controls
Mean ± SD
(n)
pValue
C16:1n-7/C16:0 Palmitoleic/Palmitic 0.02 ± 0.01 (68) 0.02 ± 0.01 (33) 0.055
C18:1n-9/C18:0 Oleic/Stearic 0.90 ± 0.28 (68) 0.76 ± 0.27 (33) 0.014
C20:4n-6/ C18:2n-6 Arachidonic/Linoleic 0.54 ± 0.22 (68) 0.64 ± 0.22 (33) 0.028
C20:4n-6/C20:3n-6 Arachidonic/dihomo-gamma linolenic 3.53 ± 1.80 (68) 3.52 ± 1.12 (33) 0.976
C22:5n-6/C20:4n-6 Osbond/Arachidonic 0.02 ± 0.01 (68) 0.03 ± 0.01 (32) 0.030
C22:5n-6/C22:4n-6 Osbond/Adrenic 0.77 ± 0.34 (67) 0.90 ± 0.32 (32) 0.085
C20:5n-3/C18:3n-3 Eicosapentaenoic/α-linolenic 7.76 ± 15.99 (68) 7.43 ± 9.36 (33) 0.914
C22:6n-3/C22:5n-3 Docosahexaenoic/Docosapentaenoic 6.82 ± 3.01 (68) 6.29 ± 2.08 (33) 0.362
C22:6n-3/C20:5n-3 Docosahexaenoic/Eicosapentaenoic 6.57 ± 4.11 (68) 7.00 ± 3.19 (33) 0.602
C20:4n-6/C22:6n-3 Arachidonic/Docosahexaenoic 2.84 ± 1.19 (68) 2.95 ± 1.33 (33) 0.685
C20:4n-6/C20:5n-3 Arachidonic/Eicosapentaenoic 18.74 ± 14.14 (68) 21.48 ± 17.94 (33) 0.406
The above data shows that formation of oleic acid is lower in DM2 subjects compared to healthy controls. A lower level of C22:5n-6/C20:4n-6 in
DM2 subjects is indicative of reduced conversion of parent n-6 to longer chain metabolites.
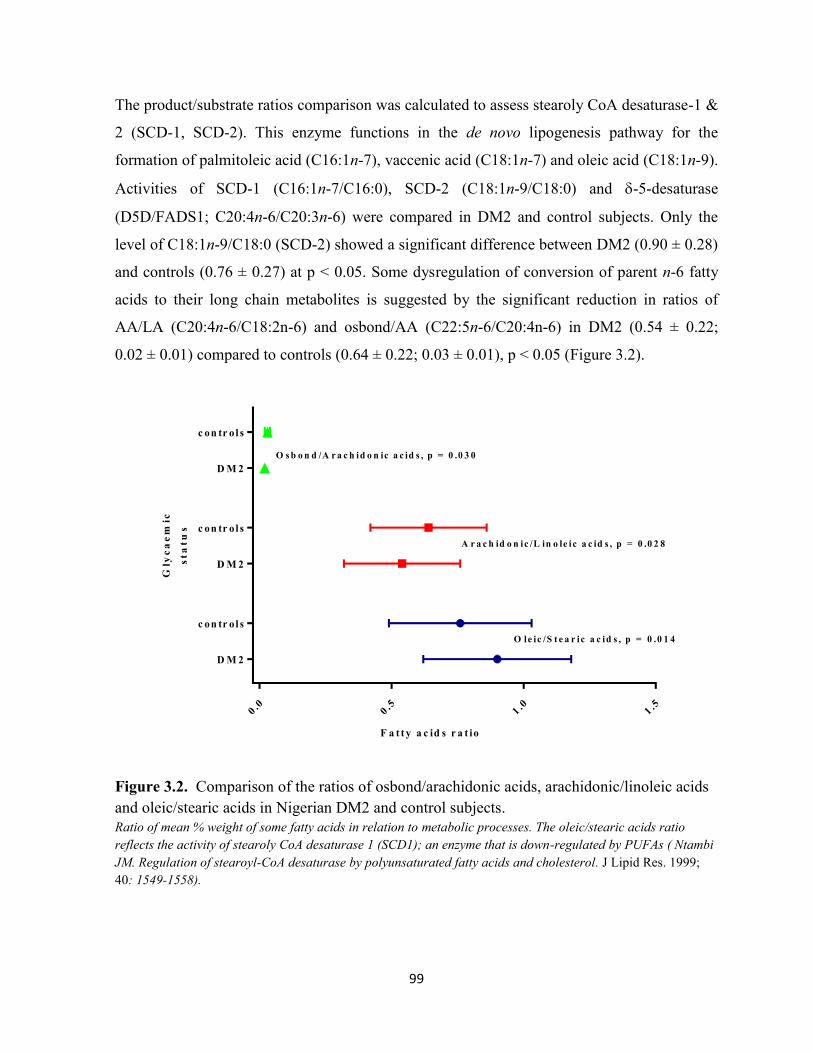
99
The product/substrate ratios comparison was calculated to assess stearoly CoA desaturase-1 &
2 (SCD-1, SCD-2). This enzyme functions in the de novo lipogenesis pathway for the
formation of palmitoleic acid (C16:1n-7), vaccenic acid (C18:1n-7) and oleic acid (C18:1n-9).
Activities of SCD-1 (C16:1n-7/C16:0), SCD-2 (C18:1n-9/C18:0) and -5-desaturase
(D5D/FADS1; C20:4n-6/C20:3n-6) were compared in DM2 and control subjects. Only the
level of C18:1n-9/C18:0 (SCD-2) showed a significant difference between DM2 (0.90 ± 0.28)
and controls (0.76 ± 0.27) at p < 0.05. Some dysregulation of conversion of parent n-6 fatty
acids to their long chain metabolites is suggested by the significant reduction in ratios of
AA/LA (C20:4n-6/C18:2n-6) and osbond/AA (C22:5n-6/C20:4n-6) in DM2 (0.54 ± 0.22;
0.02 ± 0.01) compared to controls (0.64 ± 0.22; 0.03 ± 0.01), p < 0.05 (Figure 3.2).
0.0
0.5
1.0
1.5
D M 2
c on tr o l s
D M 2
c on tr o l s
D M 2
c on tr o l s
Gly
ca
em
ic
sta
tu
s
A r a c h id o n ic /L in o le ic a c id s , p = 0 .0 2 8
O s b o n d /A r a c h id o n ic a c id s , p = 0 .0 3 0
O le ic /S t e a r ic a c id s , p = 0 .0 1 4
F a t t y a c id s r a t io
Figure 3.2. Comparison of the ratios of osbond/arachidonic acids, arachidonic/linoleic acids
and oleic/stearic acids in Nigerian DM2 and control subjects.
Ratio of mean % weight of some fatty acids in relation to metabolic processes. The oleic/stearic acids ratio
reflects the activity of stearoly CoA desaturase 1 (SCD1); an enzyme that is down-regulated by PUFAs ( Ntambi
JM. Regulation of stearoyl-CoA desaturase by polyunsaturated fatty acids and cholesterol. J Lipid Res. 1999;
40: 1549-1558).

100
3.3.1 Correlation analyses in DM2:
In the diabetics, FPG showed significant negative correlations with C18:0 (r = - 0.329, p =
0.005) and C20:4n-6 (r = - 0.242, p = 0.039), p ˂ 0.05. Similarly, C22:4n-6 also showed a
significant negative relationship with HOMA-IR (r = - 0.327, p = 0.012). These suggest a
likely beneficial role for some n-6 PUFAs in relation to blood glucose levels (Figure 3.3).
Figure 3.3 Plasma fasting plasma glucose (FPG) versus C18:0 in Nigerian DM2 subjects.
Stearic acid is associated negatively with FPG suggesting a positive role for the FA in this Nigerian DM2
population. (n = 73).
Among this group also, palmitic acid showed a negative correlation with stearic acid (r = -
0.429, p = < 0.001), arachidonic acid (r = -0.370, p = 0.002), docosahexaenoic acid (r = -
0.336, p = 0.005) and total PUFA i.e total of n-3 and n-6 PUFA (r = -0.602, p = < 0.001),
Figures 3.4, 3.5 and 3.6.

101
Figure 3.4 C18:0 versus C16:0 in Nigerian DM2 subjects. Data shows inverse relationship between stearic (C18:0) acid and palmitic acid (C16:0) in Nigerian DM2 subjects (n = 68).
Figure 3.5 C20:4n-6 versus C16:0 in Nigeria DM2 subjects.
Data shows an inverse relationship between arachidonic acid (C20:4n-6) acid and palmitic acid (C16:0)(n = 68).

102
Figure 3.6. C22:6n-3 versus C16:0 in Nigerian DM2 subjects. Data shows a negative relationship between DHA (C22:6n-3) and palmitic acid (C16:0). This suggests a
beneficial effect of DHA on the inflammatory palmitic acid in the DM2 subjects. (n = 68)
Stearic acid (C18:0) showed negative correlations with oleic acid C18:1n-9 (r = -0.373, p =
0.002), total MUFAs ( r = -0.377, p = 0.002), palmitoleic/palmitic acid; C16:1n-7/C16:0 (r = -
0.246, p = 0.044), and AA/DGLA (r = -0.280, p = 0.021). C18:0 also showed positive
relationships to longer chain n-6 PUFAs such as GLA (r = 0.482, p = < 0.001), AA (r = 0.328,
p = 0.006), adrenic acid (r = 0.448, p = <0.001), osbond acid (r = 0.449, p < 0.001) and
DGLA (r = 0.425, p = < 0.001), at p < 0.05. Palmitoleic acid (C16:1n-7) had a significant
negative relationships with stearic acid (r = -0.319, p = 0.008) and linoleic acid (r = -0.467, p
= < 0.001), Figures 3.7 and 3.8.
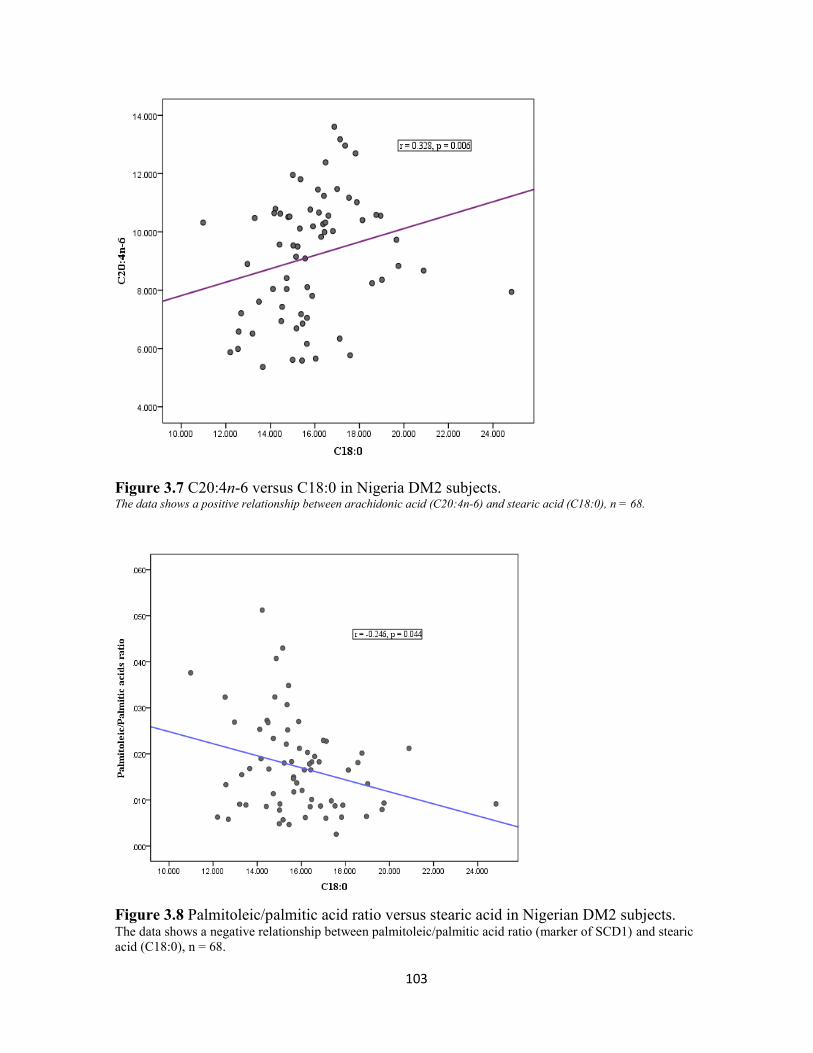
103
Figure 3.7 C20:4n-6 versus C18:0 in Nigeria DM2 subjects. The data shows a positive relationship between arachidonic acid (C20:4n-6) and stearic acid (C18:0), n = 68.
Figure 3.8 Palmitoleic/palmitic acid ratio versus stearic acid in Nigerian DM2 subjects. The data shows a negative relationship between palmitoleic/palmitic acid ratio (marker of SCD1) and stearic
acid (C18:0), n = 68.

104
Vaccenic acid showed a positive relationships with AA (r = 0.267, p = 0.028),
palmitoleic/palmitic acid (r = 0.631, p = < 0.001), oleic/stearic acid ratio (r = 0.364, p =
0.002), AA/DGLA (r = 0.473, p = < 0.001), AA/EPA (r = 0.342, p = 0.004), Tables 3.9 and
3.10.
Figure 3.9. Oleic/stearic acid ratio versus stearic acid in Nigerian DM2 subjects. The data shows a negative relationship between marker of stearoyl CoA desaturase-2 (oleic/stearic acid ratio)
and stearic acid (C18:0). ( n = 68)
Figure 3.10 C18:1n-9/C18:0 versus C20:4n-6 in Nigerian DM2 subjects. (n =68) The data demonstrates a negative relationship between a marker of stearoyl CoA desaturase-2 (oleic/stearic
acid ratio) and arachidonic acid (C20:4n-6).

105
Vaccenic acid (C18:1n-7) showed a negative correlation with EPA (r = -0.284, p = 0.019) and
docosapentaenoic acid, C22:5n-3 (r = -0.301, p = 0.013). Only DHA and LA showed negative
correlations to total SFA (DHA; r = -0.306, p = 0.013) and (LA; r = -0.434, p = <0.001),
respectively.
3.3.2 Correlation analyses in healthy controls
Fasting plasma glucose and HOMA indices showed more significant correlations with FAs in
the control subjects. The correlations between FPG and, C16:0 (r = 0.447, p = 0.007) and
C18:0 (r = - 0.420, p = 0.012) were significant at p ˂ 0.05. Similar to observation in the DM2
group, there was a significant negative relationship between n-6 PUFA; C22:5n-6 (osbondic
acid) and C18:0 (r = - 0.420, p = 0.012) p ˂ 0.05. HOMA-IR showed significant relationships
with C18:1n-9 (oleic acid); r = - 0.412, p = 0.026, C18:1n-9/C18:0 (r = - 0.420, p = 0.023)
and total MUFAs (r = - 0.373, p = 0.046), p ˂ 0.05. The HOMA-B index showed significant
relationships with DGLA; C20:3n-6 (r = 0.407, p = 0.028) and DGLA/LA (r = 0.369, p =
0.049), p ˂ 0.05. (See Figure 3.11 and Table 3.3).
Figure 3.11 The logarithm of HOMA-B versus C20:3n-6 in Nigerian healthy control subjects.
(n=30).

106
In the controls, palmitic acid (C16:0) had no significant relationship with stearic acid (C18:0),
arachidonic acid (C20:4n-6) and adrenic acid (C22:4n-6), unlike DM2 subjects. There was a
significant negative correlation between palmitic acid (C16:0) and DHA (r = -0.394, p =
0.023) in the control group, similar to what was found in the DM2 subjects.
Table 3.3 Correlations between FPG, HOMA indices (HOMA-B and HOMA-IR) in Nigerian
DM2 versus healthy control subjects.
DM2 Subjects Healthy control subjects
FPG vesus C18:0; r = - 0.329, p = 0.005 FPG versus C16:0; r = 0.447, p = 0.007
FPG versus C20:4n-6; r = - 0.242, p =
0.039
FPG versus C18:0; r = - 0.420, p = 0.012
FPG versus C22:5n-6; r = - 0.499, p = 0.003
HOMA-IR versus C17:0; r = - 0.259, p =
0.048
HOMA-B versus C20:3n-6; r = 0.407, p = 0.028
HOMA-IR versus C22:4n-6; r = - 0.327, p
= 0.012
HOMA-B versus C18:1n-9/C18:0; r = - 0.420, p
= 0.023
HOMA-B versus DGLA/LA; r = 0.369, p =
0.049
HOMA-IR versus C18:1n-9; r = - 0.412, p =
0.026
HOMA-IR versus C18:1n-9/C18:0; r = - 0.420,
p = 0.023
HOMA-IR versus Total MUFAs; r = - 0.373, p =
0.046
FPG; fasting plasma glucose. HOMA-IR: homoestasis model assessment-insulin resistance. HOMA-B:
homoestasis model assessment-beta cell function. p ˂ 0.05.
Unlike the DM2 subjects, there were no correlations between stearic acid (C18:0) and oleic
acid (C18:1n-9), arachidonic acid (C20:4n-6) and palmitoleic/palmitic acid ratio (C16:1n-
7/C16:0) in the control subjects. Among the controls, there was a negative correlation
between stearic acid; C18:0 and linoleic acid; C18:2n-6 (r = -0.509, p = 0.002), a relationship
that was not detected in the DM2 subjects. Similarly, palmitoleic acid (C16:1n-7) showed no
significant relationship with stearic acid (C18:0) and linoleic acid (C18:2n-6) in the controls;
however, in the DM2 subjects there were negative relationships.

107
Only linoleic acid (C18:2n-6) showed a negative relationship with total saturated fatty acids
(total SFAs) in the controls (r = -0.468, p = 0.009), in contrast to DHA and LA in the DM2
subjects noted above.
3.4 Discussion
The significantly higher palmitic acid (C16:0) in the plasma phospholipid PC fraction of
Nigerian diabetics is consistent with the findings of other studies (Saloma et al, 1990; Bohov
et al, 1993; Vessby et al, 1994, Wang et al, 2003, Bakan et al, 2006, Krachler et al, 2008,
Mozaffarian et al, 2010, Patel et al, 2010). Elevation of palmitic acid in diabetics is not a
universal finding as it has been reported to be reduced (Chuang et al, 2012), and in another
study there was no difference in the level between diabetics and controls (Hodge et al, 2007).
Exposure of cells to SFAs such as palmitate leads to increased DAG levels and increased IL-6
secretion; actions that are associated with impaired insulin functions (Coll et al, 2008).
Furthermore, SFAs are known to promote pancreatic β-cell apoptosis due to the impact of FA
lipotoxic effects on these cells (Sommerweis et al, 2013). The impact of palmitic acid in the
Nigerian population is reflected by the positive correlation between the FA and FPG, though
among the control subjects only. In addition to increased levels of palmitic acid, Patel and
coworkers (2010) in the UK reported higher levels of myristic acid (C14:0) in diabetes
mellitus patients. These investigators did not find any significant difference in the levels of
stearic acid in DM2 and healthy controls, unlike the higher level of stearic acid in the
Nigerian control population. Hodge et al (2007), in Australia, found a higher level of stearic
acid in diabetics, in contrast to the higher level of stearic acid (C18:0) in the Nigerian control
population compared to the DM2 subjects. The lower level of stearic acid in Nigeria DM2
subjects could be due to increased activity of SCD-2 in the DNL pathway. The activity of this
pathway has been reported to be enhanced in the presence of high carbohydrate, low fat diets
(Ma et al, 2015). In the studies by Ma et al (2015) and Hodge et al (2007), stearic acid was
associated with diabetes mellitus. The study by Ma and co-workers, reported that stearic acid
had a positive relationship with HOMA-β; an index of pancreatic -cell functioning (Ma et al,
2015). The authors noted that the positive association between stearic acid and -cells was
unexpected. Similarly, the Nigerian DM2 and control subjects’ negative relationship between
stearic acid and FPG is in keeping with beneficial impact of the FA on glucose metabolism.

108
The reduced level of stearic acid in the Nigerian DM2 subjects and its association with a
higher activity of SCD-2 (oleic/stearic acid ratio), possibly indicates increased disease risk in
this population. Increased DNL pathway activity suggested by the significantly higher
oleic/stearic acid ratio in Nigeria DM2 subjects indicates enhanced SCD-2 activity. A similar
trend was also observed with palmitoleic/palmitic acid ratio (SCD-1) though not statistically
significant, in the present Nigerian population. The typical Nigerian diet has been described as
a high carbohydrate-low fat diet (Oboh et al, 2007; Akarolo-Anthony et al, 2013). Such a diet
has been associated with increased activities of the DNL pathway and SCD (Ma et al, 2015),
hence it could be one reason for the increased activity of SCD in the Nigerian population. As
possible in Figure 3.11 below, enhanced activation of SCD is associated with higher levels of
palmitic, stearic, MUFAs (palmitoleic, vaccenic and oleic acids) in affected subjects
(Mozaffarian et al, 2010). The observed selective increase in the level of stearic and vaccenic
acids in Nigerian controls, is significant. A similar increase in the level of vaccenic acid in
controls was reported in the EPIC-Norfolk cohort (Patel S et al, 2010). In the US, some
investigators found that elevated vaccenic acid was negatively associated with DM (Chuang
et al, 2012). A benefit of MUFAs was recognised in the KANWU Study which found that the
replacement of SFAs with a monounsaturated fatty acid leads to improved insulin sensitivity
in humans (Vessby et al, 1999; Vessby et al, 2001). The study by Sommerweis et al, 2013
showed that oleic acid protects insulinoma -cells from palmitate-induced apoptosis, via its
suppression of endoplasmic reticulum stress. This protective action was suggested as a reason
to consider MUFAs in the management of diabetes mellitus (Sommerweis et al, 2013). The
observed negative association between HOMA-IR and oleic acid in the Nigerian control
subjects indicates that this FA could be beneficial in IR subjects in this population. The
elongase-5 (Elovl-5) enzyme, which is responsible for the conversion of palmitoleic acid to
vaccenic acid, is thought to play a key role in regulating hepatic fat and carbohydrate
metabolism (Wang et al, 2006). The reduction in the level of vaccenic acid in Nigerian
diabetics may be due to a defect in the process of elongation of palmitoleic acid. Wang et al
(2006) have reported impairment of Elovl-5 when there is a reduced AA/LA ratio, as found in
the present diabetic population. In the same vein, lower levels of AA found in diabetics in
Nigerian subjects has been reported in some other studies (Bohov et al, 1993; van
Woudenbergh et al, 2012) but not in all (Wang et al, 2003; Krachler et al, 2008). However,

109
some studies found a higher level of AA in diabetics compared to controls (Saloma et al,
1990; Hodge et al, 2007).
Examination of the product/precursor ratio of the FADS2 (D6D) enzyme i.e., DGLA/LA did
not show any significant difference in the DM2 and control subjects, neither was that of
FADS2 (D5D); AA/DGLA. But there was a significant difference in the AA/LA ratio in the
Nigerian diabetic and control populations. The lower values of AA/LA in DM2 subjects
Nigeria could be due to a slower conversion of parent n-6 fatty acids to their longer chain
metabolites. The importance of low AA in Nigeria diabetics was suggested in a study by
Borkman et al (1993). This group reported very strong positive relationship between
arachidonic acid and skeletal muscle insulin sensitivity. Therefore, the finding of reduced
levels of AA in Nigerian diabetics may be clinically significant as it could be indicative of a
slower conversion of n-6 FAs. Apart from AA, Borkman et al (1993) also noted a positive
correlation of stearic acid and DHA with muscle insulin sensitivity. In another study
measuring insulin resistance in muscle cell lines, AA in addition to EPA and DHA, were
reported to counter the negative impact of palmitic acid on glucose uptake (Sawada et al,
2012).
Some investigators have linked single nucleotide polymorphisms in the FA desaturase (FAD)
genes to diabetes mellitus. It is thought that the rate of conversion of DGLA to AA by FADS1
(D5D) gene is influenced by ethnicity and genetic variants. When such variations affect a
single nucleotide (rs174537) it causes differential ability to convert DGLA to AA in varied
populations. A study by Sergeant et al (2012) found that individuals or populations that are
homozygous for the major allele (G/G), convert DGLA to AA more efficiently. Such
individuals, who are classified as high converters, usually have high plasma levels of AA.
According to Sergeant et al (2012) high converters are at increased risk of diabetes mellitus.
This group of investigators (Sergeant et al, 2012) is of the opinion that most African-
Americans belong to this category (homozygous G/G) and are more likely to have elevated
AA. Slow converters or those homozygous for the minor allele (T/T), convert DGLA to AA
slowly. Europeans are considered to be low converters of DGLA and therefore will have low
levels of AA which makes them less prone to developing diabetes (Sergeant et al, 2012).
Irrespective of the population, there is a highly significant genotypic difference in circulating
AA and DGLA (Sergeant et al, 2012). Though the present study has not ascertained the FAD

110
genotype of the diabetics, their levels of AA does not support high conversion of DGLA to
AA to be a risk factor for DM. Harbige et al (1998) reported that there is usually a slow
conversion of LA to AA, but whether this more severe in Nigerian diabetics remains is yet to
be determined. Seargent et al (2012), however, noted that the efficiency of conversion of LA
to AA is population-dependent. Another possible explanation for the lower AA in Nigeria
diabetics is the rapid conversion of FAs to metabolites which take part in inflammatory
pathways. Arachidonic acid is a known precursor for eicosanoids which are involved in
inflammation by the production of prostanglandins (PGE2) and leukotrienes (LTB4).
However, AA metabolism is also known to produce anti-inflammatory lipoxin (lipoxin A4).
Some studies have shown that PGE2 from AA have dual pro-inflammatory and anti-
inflammatory actions. The anti-inflammatory property of PGE2 is in-part in its ability to
inhibit 5-lipooxygenase and by so doing decrease production of LTB4 or increase the
formation of anti-inflammatory lipoxins and resolvins (Calder, 2006). A recognised limitation
of the current study is the lack of data on the dietary intake of the participants.
Such data would have given information on the influence of dietary FAs on the plasma
phospholipid FAs. For example, differences in the intake of dietary linoleic acids between
DM2 and controls could account for observed differences in the plasma PC FAs (LA, stearic,
AA, DPA, etc) in the Nigerian population investigated. The point to be made is that, though
there are likely to be metabolic changes behind differences in plasma PC FAs such AA,
stearic acid etc, dietary influences cannot be ruled.
In summary, DM2 in Nigerians is associated with elevated palmitic acid and reduced levels of
stearic, vaccenic, arachidonic, adrenic and osbond acids, compared to the levels in their
healthy control subjects. These findings in addition to the interactions among the fatty acids
suggest that there maybe need to explore the benefit of supplementing affected patients with
longer chain n-6 and n-3 PUFAs.

111
Dietary sugars
Figure 3.12 De novo lipogenesis pathway (DNL).
The data shows the pathways in the DNL. The process starts with dietary sugars which are first coverted to
C14:0. It is mainly responsible for the endogenous production of SFAs and MUFAs especially in situations of
low dietary fat (Jacobs et al, 2015). The two pathways beyond palmitic acid are mediated mainly by steroyl CoA
decarboxylase (SCD) which desaturase palmitic and stearic acids. C14:0; myristic acid, C16:0; palmitic acid,
C18:0; stearic acid, C16:1n-7; palmitoleic acid, C18:1n-7; vaccenic acid, C16:1n-9; Cis-Hexadecenoic acid
and C18:1n-9; oleic acid.

112
CHAPTER 4: Comparison of fatty acid profile in Nigerian and Mexican
DM2 subjects
4.1 Introduction
Diabetes mellitus (DM) is a global emergency that requires innovative public health and
clinical management strategies in order to mitigate the projected increase in disease
prevalence, morbidity and mortality (IDF, 2015; NCD-RisC, 2016). The World Health
Organisation estimates that hyperglycaemia is the third highest risk factor for premature
mortality, after hypertension and tobacco use (WHO, 2009). Over the past few decades, there
has been a significant increase in the prevalence of DM in some regions of the world, hitherto
with low levels. This has contributed significantly to the negative impact of the disease on the
quality of health services in countries such as Nigeria (Oghagbon & Gimenez-Llort, 2014)
and Mexico (Escobedo-d la Pena et al, 2011).
In 2000, the IDF report quoted a gross prevalence for adult DM in Nigeria to be 0.4%, but by
2014 the figure increased to a prevalence of 4.6% (Olatunbosun et al, 1998; IDF, 2014).
Similarly, DM2 prevalence in Mexico rose from 6.7% in the year 1993 to 14.4% by 2006
(Villapando et al, 2010). According to the IDF report in 2000, the prevalence of DM in
Mexico was 14.2% but this increased marginally to 14.7% in the recent IDF report (IDF,
2015; www.idf.org/membership/nac/mexico). The burden of the disease in Mexico outweighs
that of Nigeria given the prevalence of the disease in the two populations. Mexico has a
diabetic population of 11.5 million; the 6th
largest in the world, while Nigeria has
approximately 1.6 million diabetics (IDF, 2015; www.idf.org/membership/afr/nigeria). The
factors responsible for the increase in DM prevalence in the two countries include obesity,
Western type diets, sedentary living, etc. The contribution of diet to the disease prevalence in
these populations is significant. Based on data from several national surveys in Mexico,
changes in food consumption pattern is strongly associated with the disease in the country.
Such changes are high consumption of refined sugars, soft drinks, white bread, fast foods,
sweet and candies, and reduction in fruits and vegetables consumption (Flores et al, 2010;
Parra-Cabrera et al, 2011). The foregoing factors are in addition to a decline in recreational
and non-recreational physical activity, coupled with consumption of energy-dense, low

113
micronutrient, low cost foods among Mexicans and low consumption of dietary DHA from
fish (Flores et al, 2010; Parra-Cabrera et al, 2011, Ramirez-Silva et al, 2011). It is reported
that the typical Nigerian diet is of a high carbohydrate-low fat type (Mattei et al, 2015;
Akardo-Anthony et al, 2013; Oboh et al, 2007), and a similar diet is noted in Mexico (Flores
et al, 2010) though with, possibly, higher consumption of fat by the Mexicans. The
consumption of high carbohydrate-low fat (HCLF) diet is known to cause increased activation
of the de novo lipogenesis (DNL) pathway. This pathway functions to increase endogenous
synthesis of saturated fatty acids (SFAs) and mono-unsaturated fatty acids (MUFAs), in an
attempt to increase unsaturated fatty acids level in the body (Ma et al, 2015). Under the
influence of acetyl-coenzyme A carboxylase (ACC), fatty acid synthase (FAS), stearoly-coA
desaturase-1 (SCD1) and elongase-6 (Elovl6), the DNL pathway produces myristic acid
(C14:0), palmitic acid (C16:0), palmitoleic acid (C16:1n-7), vaccenic acid (C18:1n-7), stearic
acid (C18:0), oleic acid (C18:1n-9) and 7-hexadecenoic acid i.e. C16:1n-9 (Wenjie et al,
2015). In addition, a HCLF diet induces the accumulation of carbohydrate response element
binding protein (ChREBP) in the nucleus of liver cells. ChREBP and its heterodimer partner,
max-like factor-X (MLX), control the expression of genes (Glut2, ACC, FAS, SCD1 and
Elovl6) which are vital to the DNL pathway and synthesis of MUFA (Jump, 2011). The DNL
pathway plays an important role in the pathogenesis of DM2 by increasing triglyceride and
hepatic steatosis, SFA and MUFA products. These factors are associated with insulin
resistance, inflammation, endoplasmic reticulum stress and development of DM (Wenjie et al,
2015). The products of the DNL pathway (myristic acid C14:0, palmitic acid C16:0,
palmitoleic acid C16:1n-7, vaccenic acid C18:1n-7, stearic acid C18:0 and oleic acid C18:1n-
9) have been linked with diabetes mellitus in different studies (Wang et al, 2003, Krachler et
al, 2008, Patel et al, 2010). The pattern of FAs in diabetic patients reported by these studies
varies from one population to the other. This FA variation may be due to population
characteristics, such as the type of foods consumed and/or the when the study under
consideration was undertaken (Taylor et al 1987, Krachler et al 2008, Patel et al 2010, Ma et
al 2015). It is important to note that most of the aforementioned studies were undertaken in
predominantly Caucasian populations in which the dominant diet can hardly be described as
high carbohydrate-low fat.

114
Given the rate of increase in DM in Mexico and Nigeria and their similar diet type and
proximity to the equator, an evaluation of the FA profile in relation to DM in these
populations is warranted. This study aims to analyse and compare the FA profiles in Nigerian
and Mexican DM2 and control subjects. The results of the study could provide information to
guide the better management and prevention of DM in these countries and possibly other
similar diet consuming nations. The results from this investigation could, therefore, reveal
findings that are important in understanding some aspects of the pathophysiology of diabetes
mellitus in relation to specific communities and therefore aid in providing innovative
guidelines in the management of DM2.
4.2 Materials and methods
The selection of Nigerian subjects was described in Chapter 3. Using the same criteria as
undertaken for the Nigerian study population, 105 subjects comprising of 55 DM2 subjects
and 50 healthy controls were recruited in Mexico by colleagues at the Obesity and Eating
Disorders Clinic, Department of Endocrinology and Metabolism, Instituto Nacional de
Ciencias Medicas y Nutricion Salvador Zubiran, Mexico. The DM2 subjects were recruited
freshly usually in the towns adjacent to the institute as part of a campaign/research effort;
hence were drug naïve subjects. This is a key difference from the Nigerian DM2 subjects who
were on drug treatment. The DM2 subjects and controls were aged-matched, and fasting
blood samples were taken after a 12-16 hr overnight fast. The blood samples were spun at
3000 rpm for ten minutes and the plasma recovered and stored in brown vials at -80oC in
Mexico, until they were transported to the UK for FA analyses.
The FAs in the PC fraction of total plasma phospholipids for Nigerian and Mexican subjects
were prepared, methylated to their fatty acid methyl esters (FAMEs), before analyses by gas
chromatography (GC). GC flame ionization detection was used and the plasma FAs were
reported as percentage weight (wt %) ± standard deviation (SD) of total plasma PC
phospholipids. The details of the fatty acid extraction, methylation and measurement using
GC were performed as earlier described in Chapter 3. The subjects (Nigerian and Mexican)
were divided according to their glycaemic status (diabetic or control) and their mean fatty

115
acid levels were compared by glycaemic status in the individual country and across the
countries.
4.2.1 Statistical analysis
The values of the different FAs (weight % of total plasma PC phospholipids) in each subject
group (DM2 and controls) from Nigeria and Mexico were entered into the SPSS 20 statistical
package. The mean values of the FAs and standard deviation were determined. The mean ±
standard deviation (SD) of percent (%) weight of each FA as a total of plasma PC FAs for
each country (Nigeria and Mexico) were compared based on glycaemic status; Nigerian DM2
versus Nigerian controls, and Mexican DM2 and Mexican controls. Furthermore, the mean
FAs in Nigerian DM2 subjects and Mexican DM2 subjects were compared to check for
significant differences in the FA profiles. A similar comparison was undertaken for Nigerian
and Mexican control subjects. The point of significance for any observed difference in mean
weight % ± standard deviation (SD) was set at p < 0.05. The results are reported as means
weight % ± SD. Correlation analyses were undertaken using Spearman rho correlation
analysis (Harris et al, 2004).
4.3 Results
Table 4.0 shows the biodata for the Mexican subjects whose FA profiles were compared with
Nigerian subjects. The biodata for the Nigerian subjects was reported earlier in Chapter 3.
Table 4.1 shows the mean plasma FA values in DM2 versus control subjects from Nigeria and
Mexico. In both populations, plasma C16:0 levels and the ratio of C18:1n-9/C18:0 were
higher in DM2 subjects compared to their counterpart controls. Amongst the Mexicans the
levels of C16:0 and C18:1n-9/C18:0 were significantly higher in diabetics (C16:0; 30.88 ±
3.29, C18:1n-9/C18:0; 1.01 ± 0.26) compared to controls (C16:0; 29.30 ± 3.14, C18:1n-
9/C18:0; 0.89 ± 0.18), respectively. A similar pattern of elevated C16:0 and C18:1n-9/C18:0
was noted in the Nigerian DM2 subjects compared to controls (see Chapter 3).

116
Table 4.0 Comparison of biodata of Mexican DM2 and healthy control subjects, and between
Mexican males and females subjects.
The Mexican controls, like the Nigerians, had significantly higher levels of C18:0 (14.99 ±
1.20), C20:4n-6 (6.73 ± 1.54), C22:4n-6 (0.28 ± 0.09) and C22:5n-6 (0.23 ± 0.09) than DM2
subjects (C18:0; 13.76 ± 1.19, C20:4n-6; 6.14 ± 1.52, C22:4n-6; 0.23 ± 0.07, C22:5n-6; 0.19
± 0.06), respectively (Tables 4.1 and 4.2). The ratios of AA/LA; C20:4n-6/C18:2n-6 and
osbond/adrenic; C22:5n-6/C20:4n-6 were not significantly different in DM2 versus healthy
controls in Mexican subjects. But AA/LA was significantly different in Nigerian control
subjects (0.64 ± 0.22) and Nigerian diabetics (0.54 ± 0.22), at p < 0.05.
On comparing Nigerian DM2 and Mexican DM2 FA profiles, there were significant
differences in the levels of some FAs, as shown Tables 4.3 and 4.4. Myristic acid (C14:0) and
pentadecanoic acids (C15:0) were significantly higher in Mexican diabetics (0.26 ± 0.10; 0.14
± 0.05) than in Nigerians’ (0.20 ± 0.12; 0.07 ± 0.03). The level of C17:0 (heptadecaenoic
acid) was significantly higher in Nigerian DM2 (0.38 ± 0.14) than in Mexican DM2 subjects
(0.32 ± 0.07), and also similarly for the controls. The levels of stearic acid (C18:0) was higher
in Nigerian DM2 subjects (15.88 ± 2.21) compared to Mexican diabetics (13.76 ± 1.88), p <
0.05.
The levels of MUFAs, palmitoleic acid (C16:1n-7) and vaccenic acid (C18:1n-7), were
significantly higher in Mexican DM2 subjects (0.79 ± 0.30; 1.32 ± 0.23) than in Nigerian
diabetics (0.53 ± 0.33; 1.05 ± 0.39). Mexican DM2 subjects had a significantly higher level of
Variables DM2
Mean± SD
(n = 55)
Controls
Mean ± SD
(n = 50)
pValue Male
(n = 47)
Female
(n = 58)
pValue
Age; years 50.11± 5.22
48.20 ± 6.67
0.108 48.60 ± 6.77 49.69 ± 5.32 0.368
FPG; mmol/l
BMI; Kg/m2
11.53 ± 4.68
26.30 ± 3.50
5.38 ± 2.15
26.60 ± 2.60
< 0.001
0.846
8.74 ± 5.18
25.14 ±3.79
8.49 ± 4.52
27.56 ±4.12
0.796
0.673

117
linoleic acid (C18:2n-6; 26.17 ± 2.43) than in the Nigerian subjects (18.41 ± 4.31). This is
possibly due to high consumption of dietary linoleic acid in traditional maize-based diets of
the Mexicans (Parra-Cabrera et al, 2011).

118
Table 4.1 Plasma PC FA percent weight (mean ± SD) in Nigerian and Mexican subjects compared by glycaemic status.
Nigerian Subjects Mexican Subjects
Fatty acids % wt ± SD (n)
DM2
% wt ± SD (n)
Controls
% wt ± SD (n)
DM2
% wt ± SD (n)
Controls
C14:0 Myristic 0.20 ± 0.12a (68) 0.21 ± .013
a (33) 0.26 ± 0.10
a (55) 0.25 ± 0.10
a (50)
C15:0 Pentadecaenoic 0.07 ± 0.03a (66) 0.08 ± 0.04
a (32) 0.14 ± 0.05
a (55) 0.14 ± 0.05
a (50)
C16:0 Palmitic 30.83 ± 3.86a (68) 29.04 ± 4.22
b (33) 30.96 ± 2.45
a (55) 29.48 ± 2.20
c (50)
C17:0 Heptadecaenoic 0.38 ± 0.14a (68) 0.42 ± 0.12a (33) 0.32 ± 0.07a (54) 0.34 ± 0.06
a (48)
C18:0 Stearic 15.88 ± 2.21a (68) 17.57 ± 2.43
c (33) 13.76 ± 1.88
a (55) 14.99 ± 1.20
d (50)
C20:0 Arachidic 0.10 ± 0.09a (67) 0.14 ± 0.08
a (30) 0.05 ± 0.05
a (46) 0.08 ± 0.06
c (44)
C22:0 Behenic 0.10 ± 0.08a (59) 0.12 ± 0.10
a (27) 0.08 ± 0.04
a (9) 0.07 ± 0.03
a (7)
Total SFAs 47.36 ± 4.04a (65) 47.37 ± 4.09
a (30) 45.48 ± 2.57
a (55) 45.25 ± 2.32
a (50)
MUFAs
C16:1n-7 Palmitoleic 0.53 ± 0.33a (68) 0.62 ± 0.30
a (33) 0.79 ± 0.30
a (55) 0.72 ± 0.21
a (50)
C18:1n-9 Oleic 13.84 ± 3.21a (68) 13.02 ± 3.26
a (33) 13.72 ± 2.87
a (55) 13.09 ± 1.83
a (50)
C18:1n-7 Vaccenic 1.05 ± 0.39a (68) 1.26 ± 0.32
c (33) 1.32 ± 0.23
a (55) 1.29 ± 0.22
a (50)
Total MUFAs 15.42 ± 3.57a (68) 14.90 ± 3.57
a (33) 15.83 ± 3.09
a (55) 15.10 ± 1.98
a (50)
n-6 PUFAs
C18:2n-6 Linoleic 18.41 ± 4.31a (68) 16.97 ± 3.42
a (33) 26.17 ± 2.43
a (55) 26.11 ± 2.35
a (50)
C18:3n-6 γ-linoleic 0.08 ± 0.13a (67) 0.07 ± 0.07
a (33) 0.07 ± 0.03
a (27) 0.07 ± 0.07
a (31)
C20:2n-6 Eicosadienoic 0.19 ± 0.09a (67) 0.22 ± 0.14
a (33) 0.31 ± 0.07
a (55) 0.31 ± 0.07
a (50)
C20:3n-6 Dihomogammalinoleic 3.00 ± 1.19a (68) 3.18 ± 1.05
a (33) 2.71a ± 0.61
a (55) 2.94 ± 0.82
a (50)
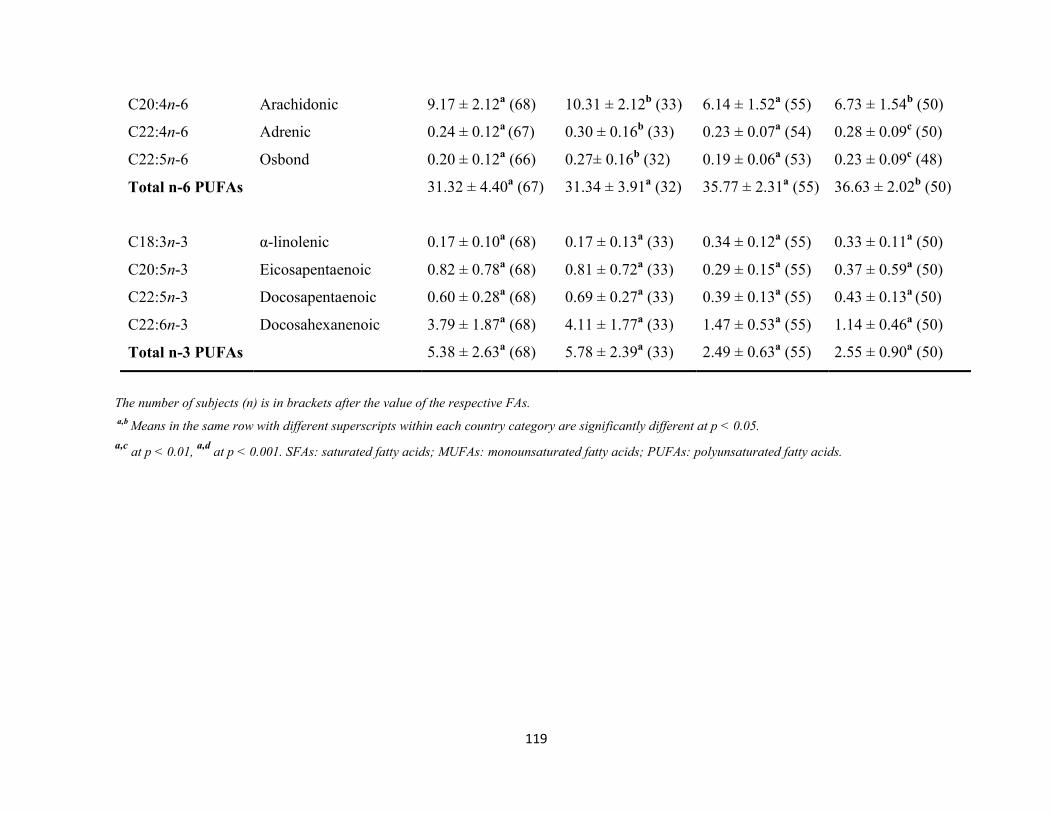
119
C20:4n-6 Arachidonic 9.17 ± 2.12a (68) 10.31 ± 2.12
b (33) 6.14 ± 1.52
a (55) 6.73 ± 1.54
b (50)
C22:4n-6 Adrenic 0.24 ± 0.12a
(67) 0.30 ± 0.16b (33) 0.23 ± 0.07
a (54) 0.28 ± 0.09
c (50)
C22:5n-6 Osbond 0.20 ± 0.12a (66) 0.27± 0.16
b (32) 0.19 ± 0.06
a (53) 0.23 ± 0.09
c (48)
Total n-6 PUFAs 31.32 ± 4.40a (67) 31.34 ± 3.91
a (32) 35.77 ± 2.31
a (55) 36.63 ± 2.02
b (50)
C18:3n-3 α-linolenic 0.17 ± 0.10a (68) 0.17 ± 0.13
a (33) 0.34 ± 0.12
a (55) 0.33 ± 0.11
a (50)
C20:5n-3 Eicosapentaenoic 0.82 ± 0.78a (68) 0.81 ± 0.72
a (33) 0.29 ± 0.15
a (55) 0.37 ± 0.59
a (50)
C22:5n-3 Docosapentaenoic 0.60 ± 0.28a (68) 0.69 ± 0.27
a (33) 0.39 ± 0.13
a (55) 0.43 ± 0.13
a (50)
C22:6n-3 Docosahexanenoic 3.79 ± 1.87a (68) 4.11 ± 1.77
a (33) 1.47 ± 0.53
a (55) 1.14 ± 0.46
a (50)
Total n-3 PUFAs 5.38 ± 2.63a (68) 5.78 ± 2.39
a (33) 2.49 ± 0.63
a (55) 2.55 ± 0.90
a (50)
The number of subjects (n) is in brackets after the value of the respective FAs.
a,b Means in the same row with different superscripts within each country category are significantly different at p < 0.05.
a,c at p < 0.01,
a,d at p < 0.001. SFAs: saturated fatty acids; MUFAs: monounsaturated fatty acids; PUFAs: polyunsaturated fatty acids.
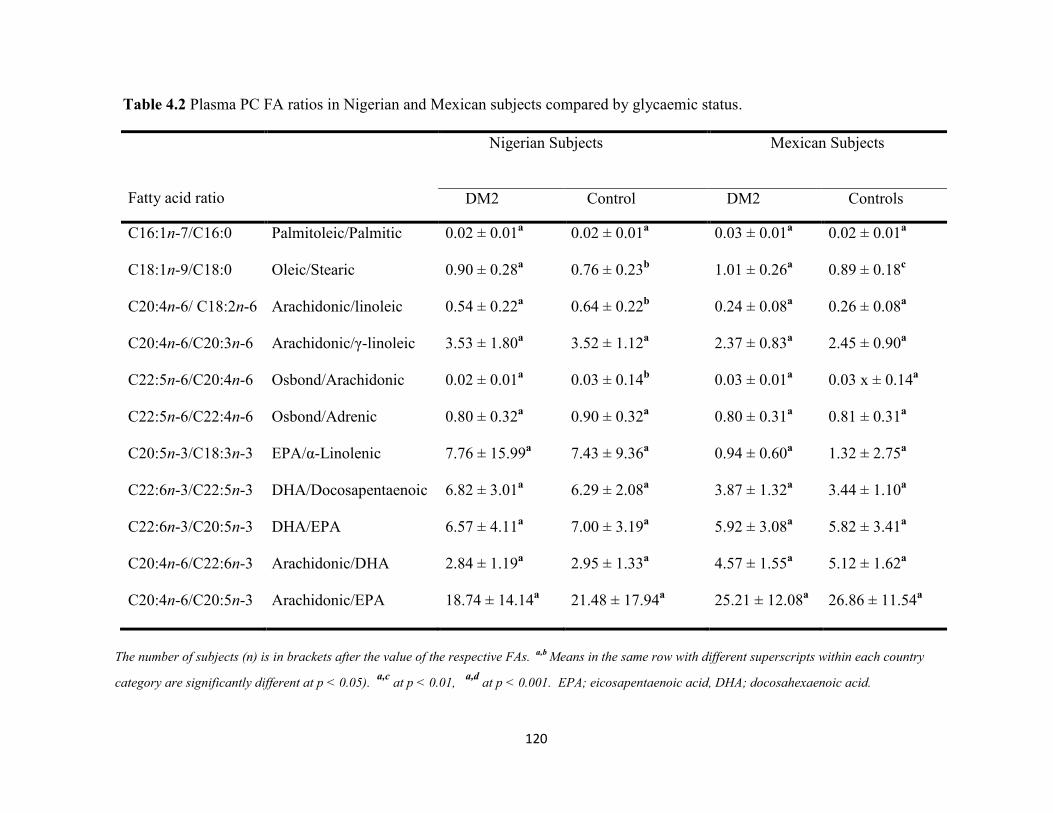
120
Table 4.2 Plasma PC FA ratios in Nigerian and Mexican subjects compared by glycaemic status.
Fatty acid ratio
Nigerian Subjects
Mexican Subjects
DM2 Control DM2 Controls
C16:1n-7/C16:0 Palmitoleic/Palmitic 0.02 ± 0.01a 0.02 ± 0.01
a 0.03 ± 0.01
a 0.02 ± 0.01
a
C18:1n-9/C18:0 Oleic/Stearic 0.90 ± 0.28a 0.76 ± 0.23
b 1.01 ± 0.26
a 0.89 ± 0.18
c
C20:4n-6/ C18:2n-6 Arachidonic/linoleic 0.54 ± 0.22a 0.64 ± 0.22
b 0.24 ± 0.08
a 0.26 ± 0.08
a
C20:4n-6/C20:3n-6 Arachidonic/γ-linoleic 3.53 ± 1.80a 3.52 ± 1.12
a 2.37 ± 0.83
a 2.45 ± 0.90
a
C22:5n-6/C20:4n-6 Osbond/Arachidonic 0.02 ± 0.01a 0.03 ± 0.14
b 0.03 ± 0.01
a 0.03 x ± 0.14
a
C22:5n-6/C22:4n-6 Osbond/Adrenic 0.80 ± 0.32a 0.90 ± 0.32
a 0.80 ± 0.31
a 0.81 ± 0.31
a
C20:5n-3/C18:3n-3 EPA/α-Linolenic 7.76 ± 15.99a 7.43 ± 9.36
a 0.94 ± 0.60
a 1.32 ± 2.75
a
C22:6n-3/C22:5n-3 DHA/Docosapentaenoic 6.82 ± 3.01a 6.29 ± 2.08
a 3.87 ± 1.32
a 3.44 ± 1.10
a
C22:6n-3/C20:5n-3 DHA/EPA 6.57 ± 4.11a 7.00 ± 3.19
a 5.92 ± 3.08
a 5.82 ± 3.41
a
C20:4n-6/C22:6n-3 Arachidonic/DHA 2.84 ± 1.19a 2.95 ± 1.33
a 4.57 ± 1.55
a 5.12 ± 1.62
a
C20:4n-6/C20:5n-3 Arachidonic/EPA 18.74 ± 14.14a 21.48 ± 17.94
a 25.21 ± 12.08
a 26.86 ± 11.54
a
The number of subjects (n) is in brackets after the value of the respective FAs. a,b
Means in the same row with different superscripts within each country
category are significantly different at p < 0.05). a,c
at p < 0.01, a,d
at p < 0.001. EPA; eicosapentaenoic acid, DHA; docosahexaenoic acid.

121
The level of eicosadienoic acid (C20:2n-6) was also higher in Mexican DM2 (0.31 ± 0.07)
compared to Nigerian DM2 (0.19 ± 0.09) samples, but the level of arachidonic acid was
higher in Nigerian DM2 (9.17 ± 2.12) than in Mexican DM2 subjects (6.14 ± 1.52). The level
of α-linolenic acid (C18:3n-3) was significantly higher in Mexican DM2 (0.34 ± 0.12) than in
Nigerian DM2 subjects (0.17 ± 0.10), Table 4.3. But the levels of longer chain n-3 (C20-22);
EPA (C20:5n-3), DPA (C22:5n-3) and DHA (C22:6n-3) were all higher in the Nigerian DM2
subjects (0.82 ± 0.78; 0.60 ± 0.28; 3.79 ± 1.87) than in Mexico diabetics (0.29 ± 0.15; 0.39 ±
0.13; 1.47 ± 0.53), respectively (Table 4.3). This is reflected in the significantly higher total n-
3 PUFAs in Nigerian subjects (DM2 and controls) compared to the corresponding Mexican
DM2 and control subjects (Tables 4.3, 4.5 and 4.6). The difference may be due to the higher
conversion of dietary α-linolenic acid (ALA) to its longer chain metabolites in Nigerians or
possibly there is higher consumption of fish in Nigeria (Gomna & Rana, 2007; Parra-Cabrera
et al, 2011). It could also be due to greater inhibition of n-3 metabolism due to the increased
LA (C18:2n-6) levels in the Mexicans as suggested by comparison of the ratio of C20:5n-
3/C18:3n-3 in Nigerian DM2 (7.76 ± 15.99) and Mexican DM2 (0.94 ± 0.60) samples.
Evidence of poor metabolic conversion of n-6 PUFAs is suggested by the significantly higher
ratio of C20:4n-6/C22:6n-3 in Mexican DM2 (4.57 ± 1.55) compared to Nigeria DM2
subjects (2.84 ± 1.19), as shown in Table 4.4. Further evidence of impaired n-6 metabolism in
Mexican diabetics is suggested by higher ratios of C20:4n-6/C18:2n-6, C20:4n-6/C20:3n-6 in
Nigerian DM2 subjects (0.54 ± 0.22; 3.53 ± 1.80; 7.76 ± 15.99) compared to Mexican
diabetics (0.24 ± 0.08; 2.37 ± 0.83; 0.94 ± 0.60). Similarly, this is evident when comparing
Mexican versus Nigerian controls (Table 4.4).
The level of total SFA was higher in Nigerian DM2 (47.36 ± 4.04) than in Mexican diabetics
(45.48 ± 2.57), and the difference was mainly due to higher level of stearic acid in the
Nigerians. Total n-6 PUFAs level was higher in Mexican diabetics (35.77 ± 2.31) compared
to Nigerian DM2 subjects (31.32 ± 4.40). The high level of LA (C18:2n-6) in the Mexican
diabetics accounted for this difference in total n-6 PUFA between the two populations. The
total n-3 PUFAs level in Nigeria DM2 subjects (5.38 ± 2.63) was more than twice the level in
Mexican diabetics (2.49 ± 0.63). Similar differences in the pattern of FA profiles in Nigerian
and Mexican DM2 subjects were also observed between the control subjects of the two
populations (Tables 4.3 and 4.4).

122
4.3.1 Correlation Analyses in Mexico and Nigeria DM2 subjects:
In the Mexican DM2 subjects, FPG had significant negative relationships with C18:0 (r = -
0.480, p = < 0.001), C20:3n-6 (r = -0.298, p = 0.024), and significant positive relationship
with C18:1n-9/C18:0 (r = 0.272, p = 0.041). Among Nigerian diabetics, FPG also had
significant negative relationships with C18:0 (r = -0.282, p = 0.020) and DGLA; C20:3n-6 (r
= -0.259, p = 0.033), but not with C18:1n-9/C18:0 at p < 0.05.
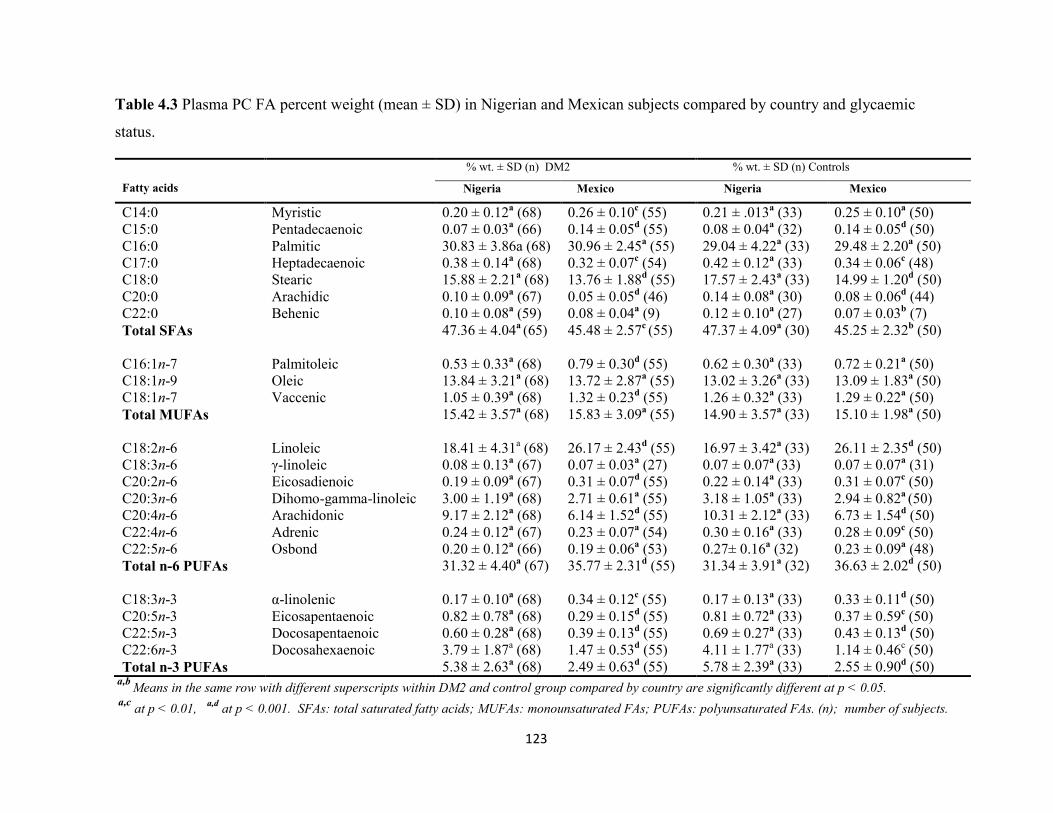
123
Table 4.3 Plasma PC FA percent weight (mean ± SD) in Nigerian and Mexican subjects compared by country and glycaemic
status.
Fatty acids
% wt. ± SD (n) DM2 % wt. ± SD (n) Controls
Nigeria Mexico Nigeria Mexico
C14:0 Myristic 0.20 ± 0.12a (68) 0.26 ± 0.10
c (55) 0.21 ± .013
a (33) 0.25 ± 0.10
a (50)
C15:0 Pentadecaenoic 0.07 ± 0.03a (66) 0.14 ± 0.05
d (55) 0.08 ± 0.04
a (32) 0.14 ± 0.05
d (50)
C16:0 Palmitic 30.83 ± 3.86a (68) 30.96 ± 2.45a (55) 29.04 ± 4.22
a (33) 29.48 ± 2.20
a (50)
C17:0 Heptadecaenoic 0.38 ± 0.14a (68) 0.32 ± 0.07
c (54) 0.42 ± 0.12
a (33) 0.34 ± 0.06
c (48)
C18:0 Stearic 15.88 ± 2.21a (68) 13.76 ± 1.88
d (55) 17.57 ± 2.43
a (33) 14.99 ± 1.20
d (50)
C20:0 Arachidic 0.10 ± 0.09a (67) 0.05 ± 0.05
d (46) 0.14 ± 0.08
a (30) 0.08 ± 0.06
d (44)
C22:0 Behenic 0.10 ± 0.08a (59) 0.08 ± 0.04
a (9) 0.12 ± 0.10
a (27) 0.07 ± 0.03
b (7)
Total SFAs 47.36 ± 4.04a (65) 45.48 ± 2.57
c (55) 47.37 ± 4.09
a (30) 45.25 ± 2.32
b (50)
C16:1n-7 Palmitoleic 0.53 ± 0.33a (68) 0.79 ± 0.30
d (55) 0.62 ± 0.30
a (33) 0.72 ± 0.21
a (50)
C18:1n-9 Oleic 13.84 ± 3.21a (68) 13.72 ± 2.87
a (55) 13.02 ± 3.26
a (33) 13.09 ± 1.83
a (50)
C18:1n-7 Vaccenic 1.05 ± 0.39a (68) 1.32 ± 0.23
d (55) 1.26 ± 0.32
a (33) 1.29 ± 0.22
a (50)
Total MUFAs 15.42 ± 3.57a (68) 15.83 ± 3.09
a (55) 14.90 ± 3.57
a (33) 15.10 ± 1.98
a (50)
C18:2n-6 Linoleic 18.41 ± 4.31a (68) 26.17 ± 2.43
d (55) 16.97 ± 3.42
a (33) 26.11 ± 2.35
d (50)
C18:3n-6 γ-linoleic 0.08 ± 0.13a (67) 0.07 ± 0.03
a (27) 0.07 ± 0.07
a (33) 0.07 ± 0.07
a (31)
C20:2n-6 Eicosadienoic 0.19 ± 0.09a (67) 0.31 ± 0.07
d (55) 0.22 ± 0.14
a (33) 0.31 ± 0.07
c (50)
C20:3n-6 Dihomo-gamma-linoleic 3.00 ± 1.19a (68) 2.71 ± 0.61
a (55) 3.18 ± 1.05
a (33) 2.94 ± 0.82
a (50)
C20:4n-6 Arachidonic 9.17 ± 2.12a (68) 6.14 ± 1.52
d (55) 10.31 ± 2.12
a (33) 6.73 ± 1.54
d (50)
C22:4n-6 Adrenic 0.24 ± 0.12a (67) 0.23 ± 0.07
a (54) 0.30 ± 0.16
a (33) 0.28 ± 0.09
c (50)
C22:5n-6 Osbond 0.20 ± 0.12a (66) 0.19 ± 0.06
a (53) 0.27± 0.16
a (32) 0.23 ± 0.09
a (48)
Total n-6 PUFAs 31.32 ± 4.40a (67) 35.77 ± 2.31
d (55) 31.34 ± 3.91
a (32) 36.63 ± 2.02
d (50)
C18:3n-3 α-linolenic 0.17 ± 0.10a (68) 0.34 ± 0.12
c (55) 0.17 ± 0.13
a (33) 0.33 ± 0.11
d (50)
C20:5n-3 Eicosapentaenoic 0.82 ± 0.78a (68) 0.29 ± 0.15
d (55) 0.81 ± 0.72
a (33) 0.37 ± 0.59
c (50)
C22:5n-3 Docosapentaenoic 0.60 ± 0.28a (68) 0.39 ± 0.13
d (55) 0.69 ± 0.27
a (33) 0.43 ± 0.13
d (50)
C22:6n-3 Docosahexaenoic 3.79 ± 1.87a (68) 1.47 ± 0.53
d (55) 4.11 ± 1.77
a (33) 1.14 ± 0.46
c (50)
Total n-3 PUFAs 5.38 ± 2.63a (68) 2.49 ± 0.63
d (55) 5.78 ± 2.39
a (33) 2.55 ± 0.90
d (50)
a,b Means in the same row with different superscripts within DM2 and control group compared by country are significantly different at p < 0.05.
a,c
at p < 0.01, a,d
at p < 0.001. SFAs: total saturated fatty acids; MUFAs: monounsaturated FAs; PUFAs: polyunsaturated FAs. (n); number of subjects.

124
Table 4.4 Plasma PC FA ratios in Nigerian and Mexican subjects compared by country and glycaemic status.
Fatty acid ratio
Mean ± SD DM2 Mean ± SD Control
Nigeria Mexico Nigeria Mexico
C16:1n-7/C16:0 Palmitoleic/Palmitic 0.02 ± 0.01a 0.03 ± 0.01
d 0.02 ± 0.01
a 0.02 ± 0.01
a
C18:1n-9/C18:0 Oleic/Stearic 0.90 ± 0.28a 1.01 ± 0.26
b 0.76 ± 0.23
a 0.89 ± 0.18
c
C20:4n-6/ C18:2n-6 Arachidonic/linoleic 0.54 ± 0.22a 0.24 ± 0.08
d 0.64 ± 0.22
a 0.26 ± 0.08
d
C20:4n-6/C20:3n-6 Arachidonic/γ-linoleic 3.53 ± 1.80a 2.37 ± 0.83
d 3.52 ± 1.12
a 2.45 ± 0.90
d
C22:5n-6/C20:4n-6 Osbond/Arachidonic 0.02 ± 0.01a 0.03 ± 0.01
d 0.026 ± 0.14
a 0.033 ± 0.14
b
C22:5n-6/C22:4n-6 Osbond/Adrenic 0.80 ± 0.32a 0.80 ± 0.31
a 0.90 ± 0.32
a 0.81 ± 0.31
a
C20:5n-3/C18:3n-3 EPA/α-linolenic 7.76 ± 15.99a 0.94 ± 0.60
c 7.43 ± 9.36
a 1.32 ± 2.75
c
C22:6n-3/C22:5n-3 DHA/docosapentaenoic 6.82 ± 3.01a 3.87 ± 1.32
d 6.29 ± 2.08
a 3.44 ± 1.10
d
C22:6n-3/C20:5n-3 DHA/EPA 6.57 ± 4.11a 5.92 ± 3.08
a 7.00 ± 3.19
a 5.82 ± 3.41
a
C20:4n-6/C22:6n-3 Arachidonic/DHA 2.84 ± 1.19a
4.57 ± 1.55d 2.95 ± 1.33
a 5.12 ± 1.62
d
C20:4n-6/C20:5n-3 Arachidonic/EPA 18.74 ± 14.14a
25.21 ± 12.08c 21.48 ± 17.94
a 26.86 ± 11.54
a
a,bMeans in the same row with different superscripts within DM2 and control groups compared by country differ significantly (p < 0.05). The FA ratios were
compared in Nigerian and Mexican subjects according to country DM2 and control status, p < 0.05. C16:1n-7/C16:0; marker of stearoyl coA desaturase-1
(SCD-1). C18:1n-9/C18:0; marker of stearoyl coA desaturase-2 (SCD-2). C20:4n-6/C20:3n-6; marker of delta-5-desaturase or FADS1 gene.

125
In Mexican DM2 subjects, myristic acid (C14:0) positively correlated with palmitic acid;
C16:0 (r = 0.600, p = <0.001) and negatively with linoleic acid; C18:2n-6 (r = -0.372, p =
0.045) but not with stearic acid (C18:0). In Nigerian diabetics, C14:0 had a positive
relationship with C16:0 (r = 0.421, p = <0.001), negative relationship with C18:0 (r = -0.356,
p = 0.003, Figure 4.0) and no significant relationship with C18:2n-6). There was no
significant relationship between C15:0 and C18:2n-6 in Mexican DM2 subjects, but did show
a negative relationship in Nigerian diabetics (r = -0.563, p = <0.001), at p <0.05.
Figure 4.0 Stearic acid versus myristic acid in Nigerian DM2 subjects. (n = 68).
In the Nigerian DM2 subjects, palmitic acid (C16:0) had no statistically significant
relationship with C18:1n-9 and C18:1n-7, but were significant with C18:0 (r = -0.429, p =
<0.001), C18:2n-6 (r = -0.261, p = 0.032) and C20:4n-6 (r = -0.370, p = 0.002). In the
Nigerian DM2 subjects, there was no significant relationship between C16:1n-7 and C17:0.
However, C16:1n-7 had a significant positive correlation with C18:1n-7 (r = 0.597, p =
<0.001) in the Nigerians, Figure 4.1.

126
Among the Mexican diabetics, palmitic acid (C16:0) had a negative correlations with oleic
acid; C18:1n-9 (r = -340, p = 0.009), vaccenic acid; C18:1n-7 (r = -0.367, p = 0.005),
eicosadienoic acid; C20:2n-6 (r = -0.399, p = 0.002) and Total n-6 PUFAs (r = -0.456, p =
<0.001), but had no statistically significant relationship with C18:0, C18:2n-6 and C20:4n-6.
Mexico DM2 subjects had a negative correlation between C16:1n-7 and C17:0 (r = -0.505, p
= <0.001) but not for vaccenic acid (C18:1n-7). The Mexican DM2 subjects also had a
significant relationship between palmitoleic acid and vaccenic acid (r = 0.281, p = 0.033)
(Figure 4.2).
Heptadecaenoic acid (C17:0) did not show any significant correlation with C18:0 and C18:2n-
6 in Mexican DM2 subjects, but there were significant relationships between C17:0, and
C18:0 (r = 0.527, p = < 0.001), and C18:2n-6 (r = - 0.519, p = < 0.001) in the Nigeria
diabetics. The relationships between C18:0 and, C18:1n-9 (r = -0.398, p = 0.002), C20:3n-6 (r
= 0.261, p = 0.048) and C20:4n-6 (r = 0.325, p = 0.013) were significant in Mexican
diabetics. Similar correlations were found in Nigerian diabetics (C18:0 vs C18:1n-9; r = -
0.373, p = 0.002, C18:0 vs C20:3n-6; r = 0.482, p = <0.001, C18:0 vs C20:4n-6; r = 0.328, p
= 0.006).
Figure 4.1. Vaccenic acid versus palmitoleic acid in Nigerian DM2 subjects, (n = 68).

127
Figure 4.2 Vaccenic acid versus palmitoleic acid in Mexican MD2 subjects, (n = 58).
The total saturated fatty acids (SFAs) correlated negatively with vaccenic (C18:1n-7) and
oleic (C18:1n-9) acids in the Mexican DM2 subjects (r = -0.518, p = <0.001; r = -0.558, p = <
0.001), respectively. Figure 4.3 shows the relationship between SFAs and vaccenic acid. The
negative correlation between MUFAs and SFAs in Mexican DM2 subjects may be due to the
ability of MUFAs to compete with SFA for incorporation into plasma PC phospholipid. The
benefit of replacing plasma/tissue SFAs by MUFA was demonstrated by the KANWU Study
(Vessby et al, 2001).
There was no significant correlation between SFAs and the MUFAs among the Nigerian
diabetic subjects. Oleic acid (C18:1n-9) and C20:4n-6 did not show significant correlation in
Nigeria DM2, but among Mexican diabetics there was a weak negative correlation (r = -
0.264, p = 0.045). The low level of MUFAs (C16:1n-7 and C18:1n-7) and higher SFA in
Nigerian diabetics compared to Mexican DM2 subjects, is significant. The absence of a
relationship between MUFAs and SFAs in Nigerians (Figure 4.4) warrants further evaluation,
so as to know whether the Nigerian subjects could benefit from MUFA supplementation.

128
Importantly, the aforementioned difference in Nigerian and Mexican DM2 subjects was not
observed between Nigerian and Mexican control subjects.
Figure 4.3 Vaccenic versus total SFAs in Mexico DM2 subjects.
The negative relationship between vaccenic acid and total saturated fatty acids (SFAs) suggest
beneficial effect of the monounsaturated fatty acids in relation to SFAs. (n = 58).
In Mexican DM2 subjects, C18:2n-6 had negative correlations with C20:4n-6 (r = - 0.398, p =
0.001) and total n-3 PUFAs (r = -0.317, p = 0.015). These correlations were not significant in
the Nigerian diabetics. Linoleic acid (C18:2n-6) showed a significant negative relationship
with EPA/ALA (r = -0.457, p = <0.001), EPA i.e C20:5n-3 (r = -0.369, p = 0.004) in Mexican
diabetics, but not in the Nigerians. These relationships suggest that LA (C18:2n-6) is
inhibiting the conversion of ALA (C18:3n-3) in Mexican but not in the Nigerian DM2
population. The relationship between C20:3n-6 and C20:4n-6 was not significant in Mexican
DM2 subjects, but was in Nigerian diabetics (r = 0.479, p = < 0.001), again suggesting a poor
metabolism of n-6 in the Mexican DM2 subjects. DHA (C22:6n-3) did not have a significant
relationship with SFA in Mexican DM2 subjects, unlike in the Nigerian diabetics which had a
significant negative relationship (r = -0.306, p = 0.013). The correlation between C20:4n-6
and total n-3 PUFAs in Mexico diabetics was positive (r = 0.453, p = < 0.001), but this was
not significant in Nigerian diabetics.

129
4.3.2 Correlation Analyses in Mexican and Nigerian Control Subjects
Among Mexican healthy control subjects, C14:0 had significant negative correlations with
C18:1n-7 (r = -0.314, p = 0.026) and total n-3 PUFAs (r = -0.300, p = 0.034). These
relationships were absent in Nigerian controls. The relationship between C15:0 and C18:2n-6
in Mexican control was not significant, but the relationship between C15:0 and total SFA (r =
0.451, p = 0.001) was significant. Among the healthy Nigerian controls, C15:0 versus
C18:2n-6 had a negative correlation (r = -0.451, p = 0.010). Palmitic acid had negative
correlation with MUFAs; C18:1n-9 (r = -0.319, p = 0.024), C18:1n-7 (r = -0.407, p = 0.003)
in Mexican control subjects. There were no such relationships in Nigerian control subjects.
The correlation between oleic C18:1n-9 and C20:4n-6 was more significant in Mexican
controls (r = -0.488, p = < 0.001) than in Mexican DM2 (r = -0.264, p = 0.045) samples.
Similarly, there was no relationship between C18:1n-9 and C20:4n-6 in Nigerian DM2
subjects, unlike Nigerian controls (r = -0.390, p = 0.025).
The correlation between C16:0 and FPG was positive in Nigerian controls (r = 0.400, p =
0.021) but this was absent in Mexican controls. The C17:0 fatty acid had significant
correlation with C18:0 (r = 0.601, p = < 0.001) in Nigerian control subjects, but not in
Mexican controls. It should be noted that the mean plasma C18:0 level was higher in Nigerian
controls. Among Nigerian healthy controls, C17:0 had a negative relationship with C18:2n-6
(r = -0.451, p = 0.008), but not in the Mexican controls. In addition, C17:0 had negative
correlation with FPG in Nigerian controls (r = -0.369, p = 0.035), but not in Mexican controls.
Among Mexican controls, stearic acid (C18:0) had negative relationships with, C18:1n-9 (r =
-0.487, p = < 0.001) and C18:3n-3 (r = -0.341, p = 0.015), but these relationships were not
detected in Nigerian controls. In Nigerian controls there was a negative correlation between
C18:0 and, C18:2n-6 (r = -0.509, p = 0.002), FPG (r = -0.467, p = 0.006), but not in Mexican
controls. The elevated C18:2n-6 in Mexican controls showed negative correlations with
longer chain n-6 metabolites; C20:3n-6 (r = -0.402, p = 0.004), C20:4n-6 (r = -0.536, p =
<0.001) and C22:5n-6 (r = -0.378, p = 0.007), and these were not observed in the Nigerian
control subjects. Among Nigerian and Mexican control populations, C18:2n-6 had negative
correlations with SFAs (Mexico: r = -0.311, p = 0.028; Nigeria; r = -0.468, p = 0.009).
130
4.4 Discussion
The findings from this study suggest that the SAFs palmitic (C16:0) and stearic acids (C18:0),
vaccenic (C18:1n-7), arachidonic (C20:4n-6), adrenic (C22:4n-6) and osbond (C22:5n-6)
acids are associated with DM2 in Nigerian and Mexican subjects. The higher level of palmitic
acid in diabetics of both populations is similar to earlier studies that found a link between this
FA and diabetes mellitus (Saloma et al, 1990; Bohov et al, 1993; Vessby et al, 1994, Wang et
al, 2003, Bakan et al, 2006, Krachler et al, 2008, Mozaffarian et al, 2010, Patel et al, 2010).
Palmitate is known to cause inflammation, increased levels of cellular ceramide and DAG
levels, and insulin resistance. These factors are associated with diabetes mellitus. In
individuals who have high plasma levels SFAs such as palmitic acid, activation of innate
immunity occurs via stimulation of macrophage TLR-4 signaling by the FA. The activation
leads to further increased expression of proinflammatory IL-8 (Rivera et al, 2010) and IL-2
(Wallace et al, 2001). Myristic acid (C14:0) which was significantly elevated in Mexican
DM2 subjects, has a similar impact on inflammation as has been reported for palmitic acid.
The fatty acid (C14:0) was recently linked to an increased risk of incident diabetes mellitus in
a large European study by Forouhi et al (2014). A combined increase in the levels of palmitic
and myristic acid in Mexican diabetics is in keeping with the recognised high consumption of
some SAFs in this population (Ramirez-Silva et al, 2011). The consumption of large amounts
of carbohydrates, especially the refined type, by the Mexicans maybe an additional source of
SFA for the endogenous synthesis of saturated and monounsaturated fatty acids (MUFAs) in
the de novo lipogenesis (DNL), a process known to be associated with increased FA synthesis
(Ma et al, 2015, Ramirez-Silva et al, 2011). A similar HCLF diet is consumed by Nigerians
(Arokolo-Anthony et al, 2013) and this may relate to the similar patterns of FAs found in
these two diabetic populations with respect to C16:0, C18:0, C20:4n-6, C22:4n-6 and C22:5n-
6, as indicated above in Tables 4.2 - 4.4.
The observed decrease in stearic acid in DM2 subjects in both populations (Mexicans and
Nigerians) compared to controls is not consistent with what has been reported (Wang et al,
2003, Hodge et al, 2007, Krachler et al, 2008 and Forouhi et al, 2014). These other studies
found higher levels of stearic acid in DM2 subjects compared to controls. The difference
between present study populations and others in relation to C18:0 could be due to the type of

131
diets consumed by the other populations in Europe and Australia (Wang et al, 2003; Hodge et
al, 2007; Krachler et al 2008 and Forouhi et al, 2014). Patel et al (2010) reported an inverse
relationship between stearic acid and risk of DM, and this tends to agree with present
findings. However, Ma and coworkers (2015) noted that consumption of a HCLF diet was
associated with increased palmitic acid and low stearic acid (Ma et al, 2015). The reason for
the higher levels of stearic acid in the Mexican and Nigerian controls compared to DM2
subjects, inspite of reported consumption of similar HCLF, is not clear at this time. It is
possible that the different findings in the above studies may be due to dietary habits or
genetics. In this study, the observed increased activity of SCD-2 activity (higher C18:1n-
9/C18:0 in DM2 subjects in Nigeria and Mexico) may account for the lower levels of stearic
acid in the diabetics. A study undertaken in 1987 by Taylor et al, in Birmingham, UK, found
similar pattern of fatty acids in diabetics (higher C16:0, lower levels of C18:0 and C20:4n-6)
as reported here in the Nigerian and Mexican DM2 subjects. The similar FA pattern in
Birmingham DM2 subjects in 1987 and the diabetic populations in Nigeria and Mexico
evaluated in this study may be diet related.
The observation of a higher level of stearic acid in Nigerian DM2 subjects compared to
Mexican diabetics may indicate increased activity of SCD-2, as suggested by the higher
values of C16:1n-7/C16:0 and C18:1n-9/C18:0 in Mexican DM2 subjects. The DNL pathway
is stimulated by carbohydrate, low fat and alcohol; resulting in higher levels of SFA and
MUFA (Ma et al, 2015). The increased consumption of carbohydrate has a greater impact on
SCD-2 activity in Mexican DM2 subjects, and this may be responsible for the higher level of
vaccenic acid (C18:1n-7) in Mexican DM2 subjects compared to Nigerian diabetics. The
increased level of vaccenic acid (C18:1n-7) in Mexican DM2 was no different from their
corresponding controls, unlike in Nigerians whose DM2 subjects had a significantly lower
level than corresponding controls. Vaccenic acid has been previously reported (Patel S et al,
2010, Chuang et al, 2012) to be associated with a lower risk of DM. This is similar to the
findings of the KANWU study (Vessby et al, 2008) which found improved insulin sensitivity
when dietary SFAs were replaced by MUFAs such as oleic acid. Furthermore, oleic acid has
been reported to rescue cells from palmitate induced apoptosis (Sommerweiss et al, 2013),
and is inversely related to AA in serum phospholipids (Høstmark et al, 2013). Furthermore,
oleic acid reverses the action of TNF-α on insulin production (Vassiliou et al, 2009).
132
In both Nigerian and Mexican populations, the levels of arachidonic acid, adrenic acid and
osbond acid, were lower in DM2 subjects compared to their corresponding controls. This
suggests a specific defect in n-6 metabolism in these populations of DM2 subjects. As
inferred in Chapter 3, the defect may be due to impairment of the metabolism of linoleic acid
(C18:2n-6) to its longer chain metabolites. When n-6 PUFAs were compared between
Nigerian and Mexican DM2 subjects, only arachidonic acid (C20:4n-6) was significantly
higher in the Nigerians. This is despite a 42% increase in mean value for C18:2n-6 in
Mexican DM2 subjects compared to the Nigerian diabetics. A similar pattern was found
between Mexican and Nigerian control subjects; hence, there is a greater reduction in the
conversion of parent n-6 PUFA to their longer chain metabolites in Mexicans compared to
Nigerians. Available scientific evidence points to an inverse relationship between D5D
(FADS1) and the risk of diabetes and a direct relationship of the disease to D6D (FADS2).
This has been corroborated by a Mendelian randomisation thus suggesting a strong role of
D5D and D6D activities in the development of DM2 (Kroger and Schulze, 2012). The ratio of
AA/DGLA which is a surrogate marker for D5D (FADS1) was found to be similar in DM2
and controls in Nigerians and Mexicans. Therefore, this study cannot support the contribution
of genetic variation in the FADS1 gene to diabetes risk in the two populations. But, there was
a significantly higher AA/LA ratio in Nigerian controls versus Nigerian diabetics (Table 4.2);
a difference that was not observed among Mexican DM2 and controls. There is a possibility
of a defect in FADS2 gene mediated metabolism of the parent n-6 PUFAs in the Nigerian
population. This will need to be confirmed in further studies.
The stimulation of enzymes of the DNL pathway (acetyl-coenzyme A carboxylase, fatty acid
synthase, SCD), by a HCLF diet is associated with induction of elongases including elongase-
5 (Elovl-5) and elongase-6 (Elovl-6). In the metabolism of FAs, Elovl-6 and Elovl-1 are
known to elongate SFA and MUFA while Elovl-5 and Elovl-2 elongates linoleic acid
(C18:2n-6) and α-linolenic acid (C18:3n-3) to arachidonic acid (C20:4n-6) and DHA i.e
C22:6n-3 (Wang et al, 2006). In particular, Elovl-5 elongates palmitoleic acid (C16:1n-7) to
vaccenic acid (C18:1n-7) as well as -linoleic acid (C18:3n-6) to DGLA during the synthesis
of longer chain n-6 metabolites (Wang et al, 2006). It is has been reported that high levels of
SFAs in the diet suppresses Elovl-5, thus affecting its main function of elongating C16-C22
PUFAs (Wang et al, 2006). The high levels of linoleic acid in Mexican diabetics may affect
133
the metabolism of dietary α-linolenic acid, as they both compete for the same desaturases and
elongases for chain elongation and desaturation (Koletzko et al, 2007). There is some
evidence of a poor metabolic balance, which is suggested by the significantly higher value of
C20:4n-6/C22:6n-3 in Mexican DM2 compared to Nigerian DM2 subjects (Table 4.4). The
high level of linoleic acid in Mexican DM2 compared with Nigerian DM2 subjects could be
responsible for the observed significant reduction in C20:4n-6/C18:2n-6. This point could be
linked to impaired conversion of linoleic acid and α-linolenic acid to their longer chain
metabolites (arachidonic acids, EPA and DHA) in Mexican diabetics, compared to Nigerian
DM2 subjects. The probable impact of high levels of linoleic acid on the lower levels of
arachidonic, adrenic and osbond acids found in Mexican DM2 subjects could be due to
several factors. Decreased AA/LA ratio is associated with reduced activity of Elovl-5 (Wang
et al, 2006), and this could be responsible for the reduced levels of arachidonic, adrenic or
osbonds FAs in Mexican and Nigerian diabetics compared to their corresponding controls.
Another reason is the inverse relationship between arachidonic acid and C18:2n-6 in Mexican
diabetics in the present study. The level of C18:2n-6 in Mexican subjects relative to other
populations (Table 4.5) indicates that the Mexicans have a very high level of C18:2n-6. The
high level of C18:2n-6 in the present Mexico population is also associated with the lowest
level of arachidonic among the compared countries.
The significant reduction in the level of n-3 PUFAs in Mexico DM2 subjects in this study has
been previously linked to a major nutritional insufficiency in their diet (Ramirez-Silva et al,
2011, Parra-Cabrera et al, 2010, Flores et al, 2010). The level of consumption of n-3 PUFAs
such as DHA in the diet has been found to be very low in a large proportion of the Mexican
population (Ramirez-Silva et al, 2011). In spite of the higher level of α-linolenic acid
(C18:3n-3) in Mexican diabetics compared to Nigerians, there was a higher level of EPA in
the Nigerians. In the data in Tables 4.5 and 4.6, the levels of long chain n-3 fatty acids are
clearly reduced in Mexican DM2 and corresponding control subjects, compared to other
nationalities. The low level of the long chain n-3 fatty acids in Mexicans may be related to
poor conversion or low exogenous intake of these longer chain n-3 fatty acids in the relevant
foods. The consumption of fish is widespread in Nigerians (Gomna & Rana, 2007) and may
account for the higher level of longer chain n-3 PUFAs (EPA and DHA) in Nigerians. The
higher levels of EPA and DHA in the Nigerians could be due to a relatively larger conversion

134
of dietary FAs precursors to the longer chain n-3 metabolites. This hypothesized higher rate of
conversion in Nigerians could be due to a lower level of competing LA (C18:2n-6 acid). The
relatively lower LA in Nigerians reduces the metabolic competition between n-3 and n-6 fatty
acids for desaturases and elongases during the metabolism of these FAs.
In summary, there is a similar pattern of FA profiles in diabetic populations in Nigeria and
Mexico. Importantly, in relation to specific changes in Mexican and Nigerian DM2
populations, diabetics from both countries showed increased palmitic acid (C16:0) and SCD-2
activity (C18:1n-9/C18:0), decreased stearic acid (C18:0), and reduced n-6 arachidonic acid
(C20:4n-6), adrenic acid (C22:4n-6) and osbond acid (C22:5n-6) in the plasma PC
phospholipid fraction. Specific to the Nigerian population, DM2 subjects had a lower level of
vaccenic acid (C18:1n-7) compared to their controls, while Mexican DM2 subjects had a
lower total level of n-6 PUFAs than controls. The level of longer chain n-3 PUFAs in
Mexican subjects is very low compared to Nigerians and other populations, but its impact on
DM2 pathophysioelogy cannot be explained in this study.
The similar FA profile in Nigerian and Mexican DM2 subjects relative to their respective
controls could be due to a similar dietary pattern, which may be inherent in both countries.

135
Table 4.5 Mean weight percent of FAs in healthy non-diabetic subjects in different
nationalities and races.
Fatty
acids
Nigeria Mexico Australia
(Hodge et al,
2007)
USA
blacks
(Steffen et –
al, 2012)
USA
Hispanic
(Steffen et
al, 2012)
USA
Caucasian
(Steffen et
al, 2012)
USA
Chinese
(Steffen et
al, 2012)
China
(Huang et al,
2013)
C18:2n-6 16.97±3.42 26.11 ±11 20.29 ±2.92 19.95 21.97 20.93 22.95 23.07 ± 3.94
C18:3n-3 0.17 ± 0.13 0.33±0.11 0.17 ± 0.08 0.17 0.18 0.18 0.17 0.65 ± 3.21
C20:3n-6 3.18 ± 1.05 2.94±0.82 3.54 ± 0.79 3.05 3.48 3.39 2.92 2.45 ± 0.96
C20:4n-6 10.31±2.12 6.73±1.54 10.34 ±1.76 13.53 11.56 12.04 10.84 11.63 ± 2.78
C20:5n-3 0.81 ± 0.72 0.37±0.59 1.05 ± 0.47 1.06 1.12 1.68 1.81 2.98 ± 2.50
C22:6n-3 4.11 ± 1.77 1.42±0.46 4.02 ± 1.07 5.35 4.37 4.97 5.56 5.61 ± 1.36
The above data compares long chain polyunsaturated fatty acids in non-diabetic subjects in different countries.
Compared with other populations, Mexican subjects have the highest level of linoleic (C18:2n-6) acid and the
lowest levels of eicosapentaenoic acid (EPA; C20:5n-3) and docosahexaenoic (DHA; C22:4n-6). Though the
level of α-linolenic acid (C18:3n-3) is higher in Mexico than in other countries except in China. Mexico had the
lowest levels of EPA and DHA. The higher levels of EPA and DHA in China may indicate higher consumption of
fish and marine products, or a better conversion of C18:3n-3 than in Mexico.
Table 4.6 Mean weight percent of fatty acids in diabetes mellitus subjects in different nationalities
and races.
Fatty acid Nigeria
(present study)
Mexico
(present study)
Australia
(Hodge et al,
2007)
USA blacks
(Wang et al, 2003)
C18:2n-6 18.41 ± 4.31 26.17 ± 2.43 18.59 ± 2.70 21.40 ± 2.40
C18:3n-3 0.17 ± 0.10 0.34 ± 0.12 0.17 ± 0.08 0.13 ± 0.05
C20:3n-6 3.00 ± 1.19 2.71 ± 0.61 4.24 ± 0.88 3.62 ± 0.79
C20:4n-6 9.17 ± 2.12 6.14 ± 1.52 10.68 ± 1.78 11.6 ± 2.00
C20:5n-3 0.82 ± 0.78 0.29 ± 0.15 1.15 ± 0.50 0.58 ± 0.33
C22:6n-3 3.79 ± 1.87 1.47 ± 0.53 4.15 ± 0.99 2.71 ± 0.83
The data is used to compare LCPUFAs in diabetic subjects from different countries. Compared with other
populations, Mexican subjects have the highest level of linoleic (C18:2n-6) acid and the lowest levels of
eicosapentaenoic acid (EPA; C20:5n-3) and docosahexaenoic (DHA; C22:4n-6). Though the level of α-linolenic
acid (C18:3n-3) is higher in Mexico, the subjects has the lowest levels of EPA and DHA. The higher levels of
EPA and DHA in other countries maybe due to their higher consumption of fish and marine products, or a better
conversion of C18:3n-3 than in Mexico.
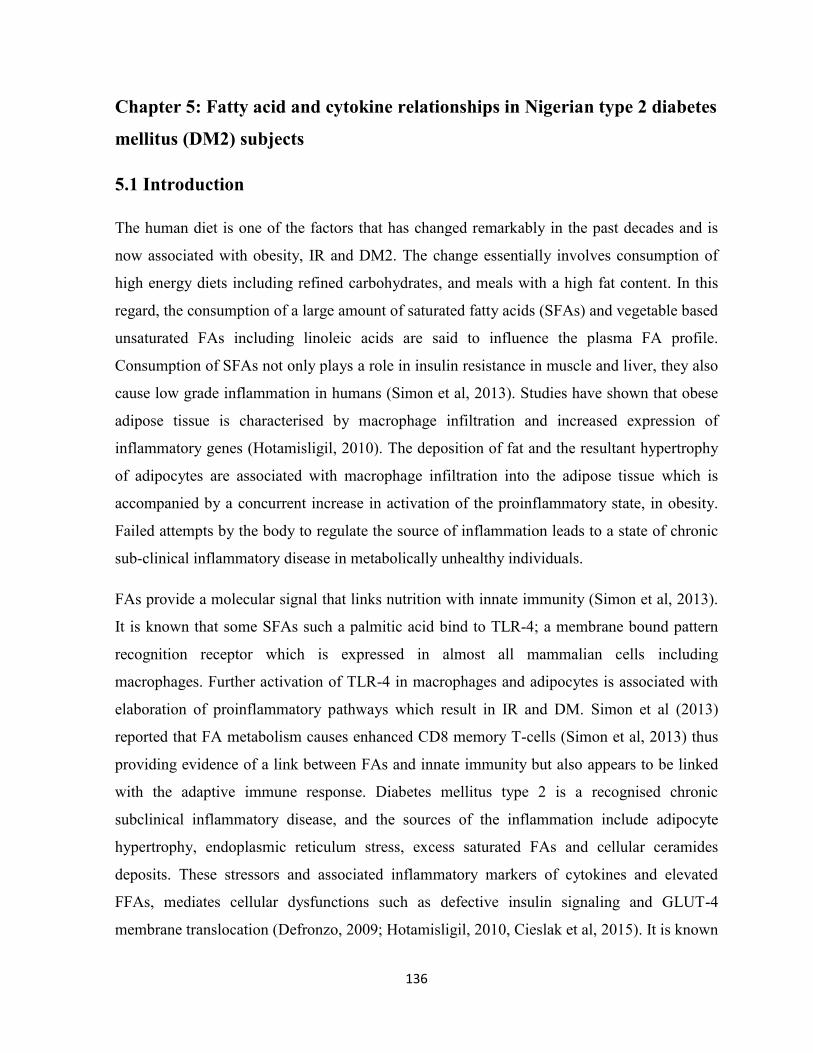
136
Chapter 5: Fatty acid and cytokine relationships in Nigerian type 2 diabetes
mellitus (DM2) subjects
5.1 Introduction
The human diet is one of the factors that has changed remarkably in the past decades and is
now associated with obesity, IR and DM2. The change essentially involves consumption of
high energy diets including refined carbohydrates, and meals with a high fat content. In this
regard, the consumption of a large amount of saturated fatty acids (SFAs) and vegetable based
unsaturated FAs including linoleic acids are said to influence the plasma FA profile.
Consumption of SFAs not only plays a role in insulin resistance in muscle and liver, they also
cause low grade inflammation in humans (Simon et al, 2013). Studies have shown that obese
adipose tissue is characterised by macrophage infiltration and increased expression of
inflammatory genes (Hotamisligil, 2010). The deposition of fat and the resultant hypertrophy
of adipocytes are associated with macrophage infiltration into the adipose tissue which is
accompanied by a concurrent increase in activation of the proinflammatory state, in obesity.
Failed attempts by the body to regulate the source of inflammation leads to a state of chronic
sub-clinical inflammatory disease in metabolically unhealthy individuals.
FAs provide a molecular signal that links nutrition with innate immunity (Simon et al, 2013).
It is known that some SFAs such a palmitic acid bind to TLR-4; a membrane bound pattern
recognition receptor which is expressed in almost all mammalian cells including
macrophages. Further activation of TLR-4 in macrophages and adipocytes is associated with
elaboration of proinflammatory pathways which result in IR and DM. Simon et al (2013)
reported that FA metabolism causes enhanced CD8 memory T-cells (Simon et al, 2013) thus
providing evidence of a link between FAs and innate immunity but also appears to be linked
with the adaptive immune response. Diabetes mellitus type 2 is a recognised chronic
subclinical inflammatory disease, and the sources of the inflammation include adipocyte
hypertrophy, endoplasmic reticulum stress, excess saturated FAs and cellular ceramides
deposits. These stressors and associated inflammatory markers of cytokines and elevated
FFAs, mediates cellular dysfunctions such as defective insulin signaling and GLUT-4
membrane translocation (Defronzo, 2009; Hotamisligil, 2010, Cieslak et al, 2015). It is known

137
that long term exposure of pancreatic β-cells to glucose and FFAs leads to β-cell dysfunction
and induction of apoptosis of the β-cells (Cieslak et al, 2015), thus encapsulating the gluco-
lipotoxicity concept of DM2. Besides the accompanying oxidative stresses, perturbation of the
endoplasmic reticulum leads to increased production of proinflammatory cytokines which
propagates the underlying inflammation (Hotamisligil, 2010; Cieslak et al, 2015).
Obesity is a recognised independent risk factor in the production of proinflammatory
cytokines and adipokines such as IL-6, TNF-α, IL-1β, MCP-1, leptin and resistin. These
inflammatory markers have been linked to obesity, insulin resistance and DM2 (Spranger et
al, 2003; Liu et al, 2007; Baba et al, 2010; Surendar et al, 2011; Titos et al, 2013).
Furthermore, some investigators suggest there maybe ethnic variations in the pattern of
cytokines associated with DM (Liu et al, 2007).
Some FAs such as PUFAs are known to mitigate inflammation and thus are beneficial to
health. One of the ways PUFAs modulate inflammation is by the activation of peroxisomes
proliferator activated receptors (PPARs). PPARs are well-characterized type II nuclear
receptors and this family of proteins consists of 3 members: PPAR-α, PPAR-β (also called
PPAR-δ), and PPAR-γ. These receptors have regulatory roles in lipid and glucose metabolism
in addition to their ability, when activated, to decrease inflammation. The ability to activate
PPAR by FAs increases with chain length and degree of fatty acid unsaturation (Wang et al,
2015). Dietary LA (C18:2n-6), ALA (C18:3n-3), GLA C18:3n-6 and AA (C20:4n-6) are
known to bind to PPAR-α at physiological concentrations; hence, they are able to activate the
receptors (Contreras et al, 2013). The functions of activated PPAR-α includes transcriptions
of genes involved in the inflammatory responses. The anti-inflammatory role of these PUFAs
is mediated via down regulation of activator protein-1 (AP-1) and nuclear factor-κβ (NFκβ)
signaling pathways (Contreras et al, 2013). In addition, PPAR-α activation inhibits several
mediators of vascular damage such as lipotoxicity, inflammation, reactive oxygen species,
endothelial dysfunction, angiogenesis and thrombosis. Hence the benefits of PUFA activation
go beyond anti-inflammatory roles, glucose and lipid metabolism, to include cardiovascular
protection (Contreras et al, 2013). While SFAs has been associated with proinflammatory
cytokines, the level of unsaturated FAs in plasma and cellular membranes has been found to
mitigate proinflammatory processes. The evidence suggests that the type of FAs in relation to
the cytokine responses, maybe the most critical dietary consideration in the quest for

138
influences on the development of DM2 (Spranger et al, 2003, Hodge et al, 2007, Krachler et
al, 2008, Forouhi et al, 2014, Ma et al, 2015).
Therefore, in this study the levels of FAs and cytokines in Nigerian DM2 subjects have been
measured and their relationships were ascertained. This will, hopefully, reveal the relationship
between the various FAs and cytokines. It may also show whether the FAs are related to pro-
inflammatory and/or anti-inflammatory cytokines.
5.2 Methodology
The results from analyses of cytokines in Nigerian DM2 subjects and their corresponding FAs
were earlier reported in Chapters 2 and 3. The plasma levels of cytokines and FAs entered in
the SPSS version 20 were used for correlation analyses using the Spearman rho coefficient.
The total n-6 PUFA refers to sum of linoleic acid (LA; C18:2n-6), -linolenic acid (GLA;
C18:3n-6), eicosadienoic acid (EDA; C20:2n-6), dihomo-gamma linolenic acid (DGLA;
C20:3n-6), arachidonic acid (AA; C20:4n-6), adrenic acid (C22:4n-6) and osbond acid
C22:5n-6). Total n-3 PUFA is the sum of α-linolenic acid (C18:3n-3), eicosapentanoic acid
(EPA; C20:5n-3), docosapentanoic acid (DPA; C22:5n-3) and docosahexaenoic acid (DHA;
C22:6n-3). Total SFA comprises the sum of myristic acid (C14:0), pentadecanoic acid
(C15:0), palmitic acid (C16:0), heptadecanoic acid (C17:0), stearic acid (C18:0) and arachidic
acid (C20:0). Spearman rho correlations were calculated for the relationships between
individual FAs and cytokines. This was undertaken for the Nigerian DM2 and controls
subjects. The relationshipsbetween the FAs and cytokines were determined in the DM2 and
control subjects.

139
5.3 Results
5.3.1 Correlation between fatty acids and cytokines in DM2 subjects
Saturated fatty acids
As shown in Table 5.0, below, the level of palmitic acid (C16:0) in the DM2 group showed a
significant positive relationship with resistin (r = 0.302, p = 0.026) and a negative relationship
with IL-4 (r = -0.294, p = 0.031). The relationship between palmitic acid and resistin is
consistent with the inflammatory role of the SFA. Resistin has been noted as an inflammatory
cytokine that may arise from activated adipocytes or macrophages. The negative relationship
between palmitic acid and IL-4, suggests a suppression of the Th2 T-lymphocyte response. In
contrast, the control group did not display a significant relationship between palmitic acid and
any of the cytokines measured.
Stearic acid (C18:0) had a significant positive correlation with TNF-α (r = 0.322, p = 0.021)
and IL-6 (r = 0.286, p = 0.047). The positive relationship with the pro-inflammatory cytokine
(TNF-α and IL-6) suggests stearic acid may have an inflammatory role in Nigerian DM2
subjects. The relationship between stearic acid and IL-6 and TNF-α, were absent in the
Nigerian control subjects.

140
Table 5.0 Spearman correlation of FAs and cytokines in Nigerian DM2 versus control subjects.
DM2 subjects
FA versus cytokines correlation
Control subjects
FA versus cytokines correlation
Saturated fatty acids:
Total SFA vs resistin r = 0.276, p= 0.050
Total SFA vs IL-4 r = -0.352, p= 0.017
C16:0 vs resistin r = 0.302, p= 0.026
C16:0 vs IL-4 r = -0.291, p= 0.043
C18:0 vs IL-6 r = 0.286, p= 0.047
C18:0 vs TNF-α r = -0.332, p= 0.021
Saturated fatty acids:
Total SFA vs cytokines (not significant)
C16:0 vs cytokines (not significant)
C18:0 vs cytokines (not significant)
Monounsaturated fatty acids: Monounsaturated fatty acids:
C16:1n-7 vs cytokines (non significant)
C18:1n-7 vs IL-6 r = -0.332, p= 0.020
C18:1n-7 vs TNF-α r = -0.376, p= 0.007
C16:1n-7/C16:0 vs cytokines (non significant)
C18:1n-9/C18:0 vs cytokines (non significant)
C16:1n-7 vs TGF-1β; r = -0.477, p= 0.012
C18:1n-7 vs cytokines (not significant)
C16:1n-7/C16:0 vs TGF-1β; r = -0.439, p= 0.022
C18:1n-9/C18:0 vs cytokines (not significant)
n-6 Polyunsaturated fatty acids: n-6 Polyunsaturated fatty acids:
Total n-6 PUFA vs TGF-1β r = -0.312, p= 0.023
Total n-6 PUFA vs MCP-1 r = -0.359, p= 0.008
C18:2n-6 vs TGF-β r = -0.299, p = 0.028
C18:2n-6 vs MCP-1 r = -0.321, p = 0.018
C20:3n-6 vs cytokines (non significant)
Total n-6 PUFA vs leptin r = 0.422, p= 0.032
Total n-6 PUFA vs IL-4 r = 0.425, p= 0.034
Total n-6 PUFA vs IL-6 r = -0.359, p= 0.046
C20:4n-6 vs leptin r = 0.477, p = 0.012
C22:4n-6 vs TGF-1β r = 0.568, p = 0.002
C22:4n-6 vs IFN-γ r = 0.424, p = 0.027
C18:2n-6 vs IL-4; r = 0.484, 0.012
C20-3n-6 vs IFN-γ, r =0.406, p= 0.036

141
n-3 Polyunsaturated fatty acids:
Total n3-PUFAs vs IL-4 (not significant)
Total n3-PUFAs vs IL-12 r = 0.354, p = 0.012
Total n3-PUFAs vs TGF-1β r = 0.300, p = 0.028
EPA vs TGF-1β r = 0.293, p = 0.031
DHA vs TGF-1 β r = 0.285, p = 0.037
Omega-3 index vs IL-10 (not significant)
Omega-3 index vs IL-12 r = 0.396, p = 0.003
Omega-3 index vs TGF-1β r = 0.310, p = 0.019
n-3 Polyunsaturated fatty acids:
Total n3-PUFAs vs cytokines (not significant)
EPA versus TGF-1β (not significant)
Omega-3 index vs cytokines (not significant)
Total PUFA (n-3 + n-6 PUFAs) vs leptin r = 0.447, p= 0.022
Total PUFA (n-3 + n-6 PUFAs) vs IL-4 r = 0.521, p= 0.008
Total PUFA(n-3 + n-6 PUFAs) vs MCP-1 r = -0.280, p = 0.042
Ratios of fatty acids:
AA/DGLA vs IL-8 (not significant)
AA/DGLA vs TNF-α r = - 0.365, p = 0.008
AA/LA versus IL-8 (not significant)
HOMA Indices
HOMA-IR vs C22:4n-6 r = - 0.309, p = 0.031
HOMA-B vs insulin r = 0.892, p = ˂0.001
HOMA-B vs HOMA-IR r = 0.638, p = ˂0.001
HOMA-B vs FPG r = - 0.407, p = 0.002
HOMA-IR vs FPG r = 0.368, p = 0.005
Ratios of fatty acids:
AA/DGLA vs cytokines (not significant)
AA/LA vs IL-8 (not significant)
HOMA-B vs C20:3n-6 r = 0.407, p = 0.028
HOMA-B vs C18:1n-9/C18:0 r = - 0.420, p = 0.023
HOMA-B vs C20:3n-6/C18:2n-6 r = 0.369, p = 0.049
HOMA-IR vs C18:1n-9/C18:0 r = - 0.420, p = 0.023
HOMA-IR vs Total MUFAs r = - 0.373, p = 0.046
HOMA-B vs insulin r = 0.876, p = ˂0.001
HOMA-B vs HOMA-IR r = 0.918, p = ˂0.001
HOMA-B vs FPG (not significant)
HOMA-IR vs FPG r = 0.379, = 0.009
HOMA-B; homoestasis model assessment-beta. HOMA-IR; homoestasis model assessment-insulin resistance. vs = versus. Omega-3 index = DHA + EPA.
Statistical significance was set at p < 0.05.
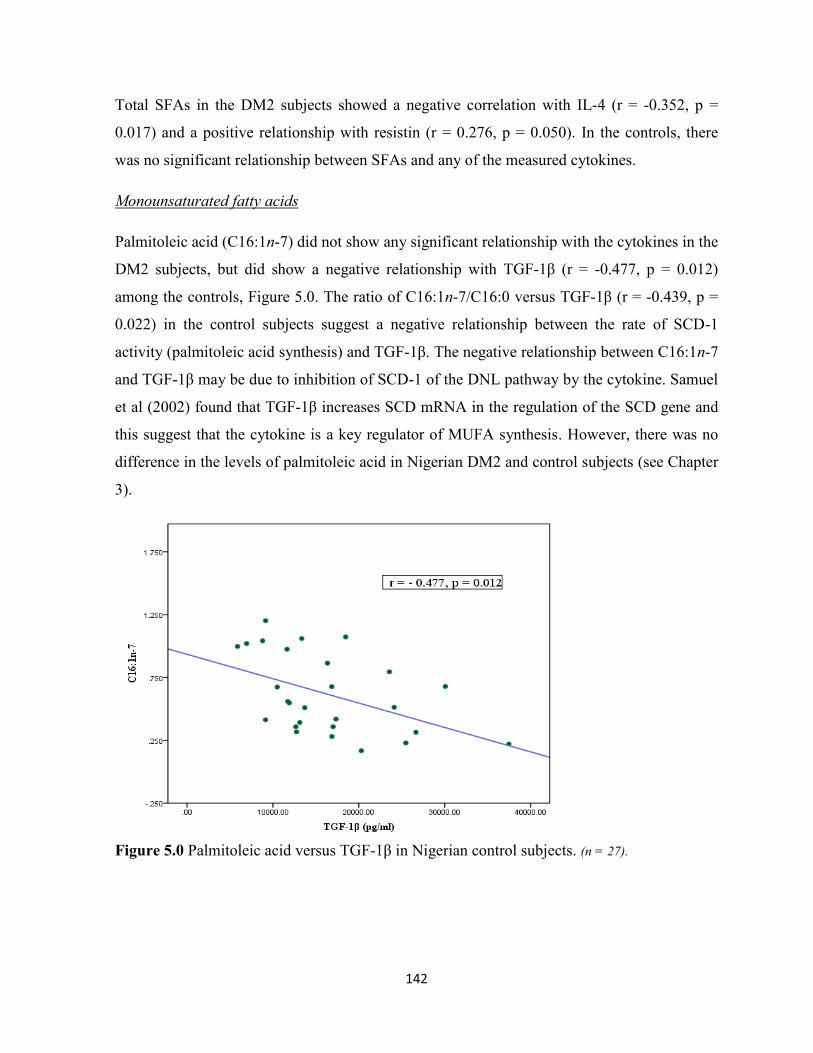
142
Total SFAs in the DM2 subjects showed a negative correlation with IL-4 (r = -0.352, p =
0.017) and a positive relationship with resistin (r = 0.276, p = 0.050). In the controls, there
was no significant relationship between SFAs and any of the measured cytokines.
Monounsaturated fatty acids
Palmitoleic acid (C16:1n-7) did not show any significant relationship with the cytokines in the
DM2 subjects, but did show a negative relationship with TGF-1β (r = -0.477, p = 0.012)
among the controls, Figure 5.0. The ratio of C16:1n-7/C16:0 versus TGF-1β (r = -0.439, p =
0.022) in the control subjects suggest a negative relationship between the rate of SCD-1
activity (palmitoleic acid synthesis) and TGF-1β. The negative relationship between C16:1n-7
and TGF-1β may be due to inhibition of SCD-1 of the DNL pathway by the cytokine. Samuel
et al (2002) found that TGF-1β increases SCD mRNA in the regulation of the SCD gene and
this suggest that the cytokine is a key regulator of MUFA synthesis. However, there was no
difference in the levels of palmitoleic acid in Nigerian DM2 and control subjects (see Chapter
3).
Figure 5.0 Palmitoleic acid versus TGF-1β in Nigerian control subjects. (n = 27).

143
In both DM2 and control subjects, there were no significant relationships between oleic acid
(C18:1n-9) and the measured cytokines, Table 5.0. The DM2 subjects displayed a significant
negative relationships between vaccenic acid (C18:1n-7), and IL-6 (r = -0.332, p = 0.020) and
TNF-α (r = -0.376, p = 0.007), Table 5.0. The vaccenic acid and measured pro-inflammatory
cytokine did not show any significant relationship in the Nigerian control subjects. The
positive role of MUFAs in inflammation and insulin resistance has been demonstrated by the
KANWU study which showed that substitution of oleic acid for SFAs is associated with
improved insulin sensitivity (Vessby et al, 2001).
n-6 Polyunsaturated fatty acids (n-6 PUFAs)
Among the diabetics, linoleic acid; LA (C18:2n-6) showed significant negative relationships
with TGF-1β (r = -0.299, p = 0.028) and MCP-1 (r = -0.321, p = 0.018), Figures 5.1 and 5.2.
This relationship was not found between LA and the cytokines (TGF-1β, MCP-1) in the
controls. Simon et al (2013) found LA to be associated with decreased MCP-1, IL-10, and
increased IL-12. The Nigerian DM2 and control subjects showed no significant relationship
between LA and, IL10, IL-12 and IL-4, although in the control group there was a positive
relationship between LA and IL-4 (r = 0.484, p = 0.012), Table 5.0. Dihomo-gamma linoleic
acid (C20:3n-6) had no significant relationship with the cytokines in the DM2 subjects, but in
controls it showed a positive relationship with IFN-γ (r = 0.406, p = 0.036). Arachidonic acid
(C20:4n-6) did not show any significant relationship with the measured cytokines in the DM2
subjects. Among the controls, there was a positive correlation between C20:4n-6 and leptin (r
= 0.477, p = 0.012), total n-6 PUFAs and leptin (r = 0.422, p = 0.032). In control subjects total
n-6 PUFAs also showed a significant negative correlation with, IL-6 (r = -0.395, p = 0.046),
Table 5.0.

144
Figure 5.1 Linoleic acid versus TGF-1β in Nigerian DM2 subjects.
Data shows a negative correlation between LA (C18:2n-6) and TGF-1β in Nigerian diabetics (n = 54).
Figure 5.2 Linoleic (C18:2n-6) acid versus MCP-1 in Nigerian DM2 subjects. Data shows a negative relationship between LA (C18:2n-6) and MCP-1, but this relationship is not observed
in the Nigerian control subjects (n = 54).
145
Adrenic acid (C22:4n-6) and osbond acid (C22:5n-6) did not show any significant
relationship with TGF-1β, IFN-γ, IL-10 in DM2 subjects. Among control subjects, adrenic
acid had significant positive correlations with IFN-γ (r = 0.424, p = 0.027) and TGF-1β (r =
0.568, p = 0.002), Figure 5.3. Similarly, osbond acid had a significant correlation with TGF-
1β (r = 0.459, p = 0.018) but not with IFN-γ in the controls.
Figure 5.3 Adrenic acid versus TGF-1β in Nigerian control subjects. (n = 27).
n-3 Polyunsaturated fatty acids (n-3 PUFAs)
The diabetics had a positive correlation between EPA (C20:5n-3) and TGF-1β (r = 0.293, p =
0.031) as shown in Figure 5.4. Similarly, DHA (C22:6n-3) had positive correlations with
TGF-1β (r = 0.285, p = 0.037), and IL-12 (r = 0.302, p = 0.030), Figures 5.4 and 5.5.

146
Figure 5.4 EPA versus TGF-1β in Nigeria DM2 subjects. (n = 54).
Figure 5.5 DHA versus TGF-1β in Nigerian DM2 subjects. (n = 54).
There were no significant relationships between n-3 PUFAs (EPA and DHA) and measured
cytokines in the control subjects. But combined n-3 and n-6 PUFAs (total PUFAs) in the
control subjects showed positive correlations with, leptin (r = 0.477, p = 0.022) and IL-4 (r =

147
0.521, p = 0.008). Among the DM2 subjects, the only significant relationship of any measured
cytokine with total PUFAs was a negative correlation with MCP-1 (r = -0.280, p = 0.042).
Total n-3 PUFAs and omega-3 index only showed significant correlations with some
measured cytokines in Nigerian DM2: total n-3 PUFAs vs IL-12; r = 0.354, p = 0.012; total
n-3 PUFAs vs TGF-1β r = 0.300, p = 0.028; EPA vs TGF-1β r = 0.293, p = 0.031; omega-3
index vs IL-12 r = 0.396, p = 0.003; omega-3 index vs TGF-1β r = 0.310, p = 0.019, Figure
5.6. There was no significant correlation of the n-3 PUFAs and omega-3 index, and measured
cytokines among the Nigerian control subjects. But a combination of n-3 PUFAs and n-6
PUFAs (total PUFAs) showed significant positive relationships with, leptin (r = 0.447, p =
0.022) and IL-4 (r = 0.521, p = 0.008) only among Nigerian control subjects, Table 5.0.
Figure 5.6 Omega-3 index versus IL-12 in Nigerian DM2 subjects. (n = 53).

148
FA ratios
Among the Nigeria DM2 subjects, AA/DGLA and TNF-α (r = -0.365, p = 0.008) showed
negative correlations, Table 5.0. There were no significant correlations between AA/DGLA,
AA/LA and the measured cytokines in the Nigerian control subjects. The interaction between
AA/DGLA and TNF-α suggests that increased activity of D5D enzyme, a product of the
FADS1 gene, is associated with anti-inflammatory function in this Nigerian DM2 population.
5.4 Discussion
The relationships between FAs and cytokines in Nigerian DM2 and healthy controls suggest a
mix of proinflammatory and anti-inflammatory interactions between the plasma PC FAs and
the measured cytokines. The positive relationship of palmitic acid with resistin is consistent
with pro-inflammatory response to some FAs such as palmitic acid. Furthermore, it is
becoming clear that resistin is important in the progression of atherosclerosis and
inflammatory diseases (Tanaka et al, 2016). SFAs, such as palmitic acid, activate the innate
immune system by binding to macrophages and adipocytes (TLR-4), thereby leading to
increased secretion of proinflammatory cytokines (Simon et al, 2013). The production of
circulating pro-inflammatory cytokines in DM2 subjects appears to be associated with a
decrease in the anti-inflammatory cytokine response, given the negative relationship between
palmitic acid and IL-4. A positive association between SFA and the pro-inflammatory marker
TNF-α was found in the diabetic subjects. Stearic acid in Nigerian controls and diabetics
behaves differently as the FA did not show a positive association with TNF-α in the controls,
unlike the DM2 subjects. The different effects of stearic in DM2 and controls could be due to
the metabolic source of stearic acid. The negative correlation between stearic acid and
palmitic acid found only among the diabetics may be due to increased conversion of palmitic
to stearic via the DNL pathway. Stearic acid has been associated with DM2 in other studies
(Hodge et al, 2008; Krachler et al, 2008 and Ma et al, 2015), and one of them (Ma et al, 2015)
noted a positive relationship between stearic acid and HOMA-β (good pancreatic β-cells
function).

149
The negative correlations of vaccenic acid (C18:1n-7) with TNF-α in the Nigerian DM2
subjects is significant given the association between this FA and a reduced risk of diabetes
(Patel et al, 2010; Chuang et al, 2012; Ma et al, 2015). Some evidence shows that vaccenic
acid suppresses hepatic gluconeogenic gene expression thereby improving glucose
metabolism. An in vitro study reported the ability of some MUFAs, such vaccenic acid, to
increase membrane fluidity and stimulate glucose transport into adipocytes, to a degree
similar to that induced by insulin (Pilch et al, 1980). Therefore, the reduced levels of vaccenic
acid in Nigerian DM2 subjects could negatively impact on cellular membrane function and
glucose metabolism. But this cannot be confirmed in the present study. Among the control
subjects in this study, there was a significant positive relationship between n-6-PUFA and the
anti-inflammatory IL-4 cytokines, and a negative one with IL-6 (Fig. 5.0). This group also
showed a significant relationship between n-6-PUFA and leptin, thus suggesting that the
activity of n-6 PUFAs differs in DM2 and their corresponding control subjects in this
population. Among the diabetics, n-3 PUFAs and n-6 PUFAs showed positive relationships
with TGF-1β. This regulatory cytokine (TGF-1β) may thus have positive roles in DM2
subjects, given its established anti-inflammatory effects (Ferrucci et al, 2006, Autieri, 2012).
Intake of high proportions of PUFAs has been linked with reduced pro-inflammatory markers
such as TNF-α and IL-6 (Fernandez-Real et al, 2003), leading to improved insulin sensitivity
(Hu et al, 2001). The positive relationship between n-3 PUFAs, IL-12, and TGF-1β in DM2
subjects, but not in the control subjects could be due to an attempt to regulate the impact of
inflammation associated with DM2. Pro-inflammatory IL-12 mobilises n-3 PUFAs for the
generation of anti-inflammatory mediators such as resolvins, protectins (Wang et al, 2015)
and TGF-1β a well known anti-inflammatory cytokine (Autieri, 2012; Ferrucci et al, 2006).
Hence Nigerian DM2 subjects may benefit from intake of n-3 PUFAs which can be
metabolised to generate anti-inflammatory mediators. In the control subjects, n-6 PUFAs are
positively related to IL-4 and leptin but negatively related to IL-6. However, in DM2, n-6
PUFAs are only related to MCP-1 and TGF-1β. It is significant that the ratio of AA/DGLA
only showed significant relations with TNF-α in DM2 subjects. The AA/DGLA ratio, a
surrogate marker of D5D activity, has been shown to be inversely related to the risk of DM2.
Though this increased risk cannot be ruled out in the Nigerian DM2 population, the
significant negative relationship between AA/DGLA and pro-inflammatory TNF-α, infer that
150
increased formation of AA will have anti-inflammatory effects in Nigerian diabetics. It has
been shown that TNF-α up-regulates epithelial tissue-derived IL-8 in an inflammatory
cascade manner (Alexandraki et al, 2006). Increased interaction between IL-8 and TNF-α was
reported among DM2 subjects by Mirza et al (2012) among Mexican-Americans. The same
pattern was found in this Nigerian DM2 population, as discussed in Chapter 2. Therefore, the
negative correlation between AA/DGLA versus TNF-α in Nigerian DM2 subjects, may
indicate that increased conversion of DGLA to AA has an anti-inflammatory effect. Wang et
al (2006) noted that supplementation with PUFAs such as AA and EPA, reduces enzymes of
the DNL pathway, decreases inflammation and improve elongase-5 activity (Wang et al,
2006). The impact of LA in the Nigerian DM2 subjects appears to be both pro-inflammatory
and anti-inflammatory, given its negative relationship with TGF-1β and MCP-1 (Table 5.0).
The exact role of TGF-1β in diabetes mellitus is not clear, but the MONICA/KORA study
found that a higher serum TGF-1β concentration is associated with a higher risk of DM2.
High serum TGF-1β may reflect poor body regulation of inflammatory assaults that precede
DM2 (Herder et al, 2013). Another view is that TGF-β1 interacts with IL-6 to support the
differentiation of T-helper 17 (Th17) cells and this has pro-inflammatory consequences. In the
MONICA/KORA study cohort, serum IL-6 levels were up-regulated in those who later
developed type 2 diabetes (Herder et al, 2009). Spranger et al in 2003 also reported that IL-6
is an independent risk marker of DM2. Matagrano et al (2003) reported that TGF-1β induces
the secretion of high levels of MCP-1, independently of IL-6. This suggests that the negative
relationship between C18:2n-6 with TGF-1β and MCP-1 in the diabetics and the positive one
between n-3 PUFAs (EPA and) DHA with TGF-1β and IL-12 in the same group is significant.
The possible explanation is that administration of n-3 PUFAs could be beneficial in the
diabetics in terms of influencing the anti-inflammatory TGF-1β. There appears to be varying
interactions of LA (C18:2n-6) and n-3 PUFAs (EPA and DHA) with TGF-1β in Nigerian
diabetic subjects. This is because of the positive relationships between EPA and DHA, with
TGF-1β in the DM2 subjects. The interaction of LA with TGF-1β appears to be pro-
inflammatory in DM2 subjects; its relationship with IL-4 in the control subjects demonstrates
anti-inflammatory effect. This differential interaction of LA in relation to glycaemic status of
the population may be influenced by on going pro-inflammatory milieu. On the other hand, n-
3 PUFAs such EPA and DHA positively correlated with TGF-1β in the Nigerian DM2
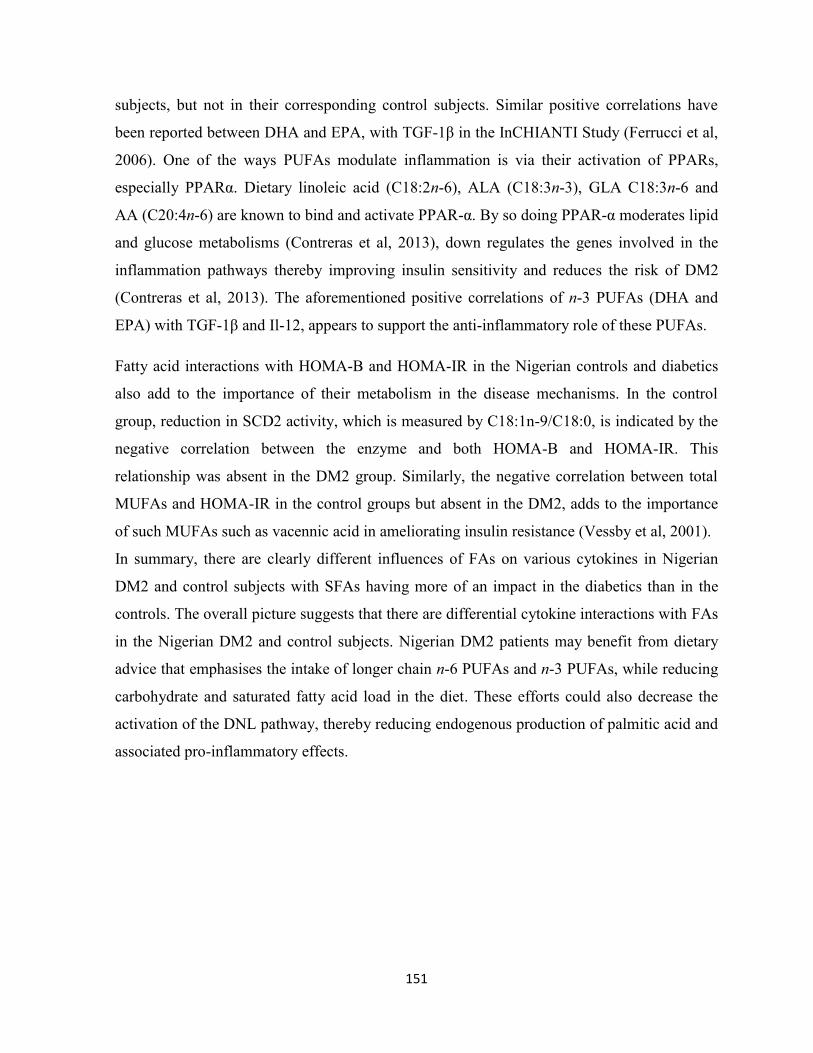
151
subjects, but not in their corresponding control subjects. Similar positive correlations have
been reported between DHA and EPA, with TGF-1β in the InCHIANTI Study (Ferrucci et al,
2006). One of the ways PUFAs modulate inflammation is via their activation of PPARs,
especially PPARα. Dietary linoleic acid (C18:2n-6), ALA (C18:3n-3), GLA C18:3n-6 and
AA (C20:4n-6) are known to bind and activate PPAR-α. By so doing PPAR-α moderates lipid
and glucose metabolisms (Contreras et al, 2013), down regulates the genes involved in the
inflammation pathways thereby improving insulin sensitivity and reduces the risk of DM2
(Contreras et al, 2013). The aforementioned positive correlations of n-3 PUFAs (DHA and
EPA) with TGF-1β and Il-12, appears to support the anti-inflammatory role of these PUFAs.
Fatty acid interactions with HOMA-B and HOMA-IR in the Nigerian controls and diabetics
also add to the importance of their metabolism in the disease mechanisms. In the control
group, reduction in SCD2 activity, which is measured by C18:1n-9/C18:0, is indicated by the
negative correlation between the enzyme and both HOMA-B and HOMA-IR. This
relationship was absent in the DM2 group. Similarly, the negative correlation between total
MUFAs and HOMA-IR in the control groups but absent in the DM2, adds to the importance
of such MUFAs such as vacennic acid in ameliorating insulin resistance (Vessby et al, 2001).
In summary, there are clearly different influences of FAs on various cytokines in Nigerian
DM2 and control subjects with SFAs having more of an impact in the diabetics than in the
controls. The overall picture suggests that there are differential cytokine interactions with FAs
in the Nigerian DM2 and control subjects. Nigerian DM2 patients may benefit from dietary
advice that emphasises the intake of longer chain n-6 PUFAs and n-3 PUFAs, while reducing
carbohydrate and saturated fatty acid load in the diet. These efforts could also decrease the
activation of the DNL pathway, thereby reducing endogenous production of palmitic acid and
associated pro-inflammatory effects.

152
Chapter 6: Plasma vitamin D levels in Nigerian diabetes mellitus type 2
patients
6.1 Introduction
A growing number of studies have associated DM2 with hypovitaminosis D, especially in
obese patients (Wortsman et al, 2000; Pereira-Santos et al, 2015). The benefits associated with
vitamin D, which maybe absent in deficient states, are its immunomodulatory and anti-
inflammatory actions on insulin resistance (McGill et al, 2008; Palomer et al, 2008). Some of
the anti-inflammatory actions of vitamin D are inhibition of release of pro-inflammatory
cytokines and other molecules such as TNF-α, IL-6, IL-8, cyclooxygenase-2, intercellular
adhesion molecule-2 and B7-1 (Cohen-Lahav et al, 2007; Giulietti et al, 2007; Zhang et al,
2007). Furthermore, vitamin D suppresses the expression of Toll-like Receptors 2 and 4
(TLR2 and TLR4) on macrophages and reduces plasma FFAs due to its anti-lipolytic action.
By so doing, vitamin D helps in reducing saturated fat mediated chronic inflammation in
obesity and DM2 (Sadeghi et al, 2006; Pittas et al, 2007).
Obesity, aging, low physical activity and African-American race, are some of the factors
associated with vitamin D deficiency (Talaei et al, 2013; Christensen et al, 2015). In the USA,
low vitamin D in African-Americans is linked to poverty, lactose intolerance and obesity
(Davis, 2011). Some authors have suggested that the presently high prevalence of DM in
African-Americans (CDC, 2011) could be due to their high prevalence of hypovitaminoses D
(Danescu et al, 2009). The level of sunshine in Africa appears not to be associated with
sufficient vitamin D status, but is related to limited sun exposure due to cultural practices and
prolonged wearing of heavy clothing (Meddeb et al, 2005; Luxwolda et al, 2012). Among a
group of immigrants from African and Asia who relocated to Europe, there was significant
prevalence of vitamin D deficiency with diagnostic cut off of < 50 nmol/L (Eggemoen et al,
2013).
Varied levels of vitamin D have been reported in African populations (Meddeb et al, 2005;
Mehta et al, 2009; Wejse et al, 2009) but none of these studies have examined the plasma
level of the vitamin in relation to diabetes mellitus. The aim of this study was to investigate
the level of vitamin D in DM2 subjects and in healthy controls, and determine if there is an
association between vitamin D and Nigerian DM2.

153
6.2 Materials and methods
Fifty-five subjects out of which 37 DM2 and 18 control subjects were recruited for this study.
The diabetic subjects were recruited from persons attending the Diabetic Clinics of Jos
University Teaching Hospital (JUTH; Plateau State), Nigeria and Benue State University
Teaching Hospital, Makurdi, Nigeria. The eighteen control subjects were non-diabetic
patients recruited during blood donation campaigns and pre-employment medical
examinations at the General Out-patient Clinics of the hospitals. The inclusion criteria for the
diabetic subjects were attendance at the diabetic clinic and fasting plasma glucose levels of >
7 mmol/L on more than two occasions following the two weeks of initial testing. About 10 ml
of venous blood was taken in the morning after an overnight fast of 10-16 hr. Five ml of
collected blood was placed in fluoride oxalate tubes and EDTA for determination of fasting
plasma glucose (FPG) and the remaining sample was placed in lithium heparin bottles for the
measurement of plasma levels of vitamin D.
Plasma vitamin D was measured using the Abbotts ARCHITECT i System for 25-OH
Vitamin D assay. This method is a based on a chemiluminescent microparticle immunoassay
(CMIA) for quantitative determination of 25-hydroxyvitamin D (25-OH vitamin D). The
CMIA technology in the Architect system uses flexible assay protocols referred to as
Chemiflex. The method is a delayed one-step immunoassay which combines sample and
automated on-line pre-treatment system. An aliquot of the pre-treated sample is combined
with assay diluent and paramagnetic anti-vitamin D coated microparticles to create a reaction
mixture. Vitamin D present in the sample binds to the anti-vitamin D coated microparticles.
This is incubated after which a biotinylated vitamin D anti-biotin acridinium-labeled
conjugate complex is added to the reaction mixture. The complex binds to unoccupied
binding sites of the anti-vitamin D coated microparticles. After washing, pre-trigger and
trigger solutions are added to the reaction mixture. The resulting chemiluminescent reaction is
measured as relative light units (RLUs).
The indirect relationship between the amount of 25-OH vitamin D in the sample and the
RLUs detected by the ARCHITECT i System optics, is used to calculate the level of the
vitamin D. The ARCHITECT i System for 25-OH vitamin D measurement have a CV of ≤
10% with a linear range of 9.4 ng/mL to 165.5 ng/mL, with a detection limit of 4.0 ng/ml.

154
The equipment assay performance is reported by the manufacturer to demonstrate 105%
cross-reactivity with 25(OH)D3, 82% cross-reactivity with 25(OH)D2, 12.6% cross-reactivity
with 1,25(OH)2D3, 112% cross-reactivity with 24, 25(OH)2D3 and minimal cross-reactivity
with 3-epi-25(OH)D3 (2.7%).
6.2.1 Statistics
The values of the measured plasma 25-OH vitamin D, FPG and age of the DM2 and healthy
control subjects were entered into SPSS version 20 statistical package for the determination of
means and standard deviation. For this Nigerian population (consistent with recent guidelines
by the Institute of Medicine, USA) vitamin D status was categorised into deficiency (< 30.00
nmol/L), inadequate (30.0 – 49.9 nmol/L) and sufficient when greater than 50.0 nmol/L
(Henry et al, 2010; Rosen et al, 2012). Mean ± standard deviation (SD) of the values of
plasma 25-OH vitamin D, were compared using independent t-test with a significant level set
at p < 0.05. Correlational analyses were undertaken using Spearman rho correlation (Harris et
al, 2004).
6.3 Results
Values of FPG and 25-OH vitamin D were compared between Nigerian DM2 and their
corresponding control subjects, the results showed no statistically significant difference
between the two groups; p < 0.05 (Table 6.0 and Figure 6.0).
When the variables (age, FPG and vitamin D) were compared according to gender, i.e., males
and females, there was a significantly higher vitamin D level in females compared with males
(Table 6.1 and Figure 6.1).
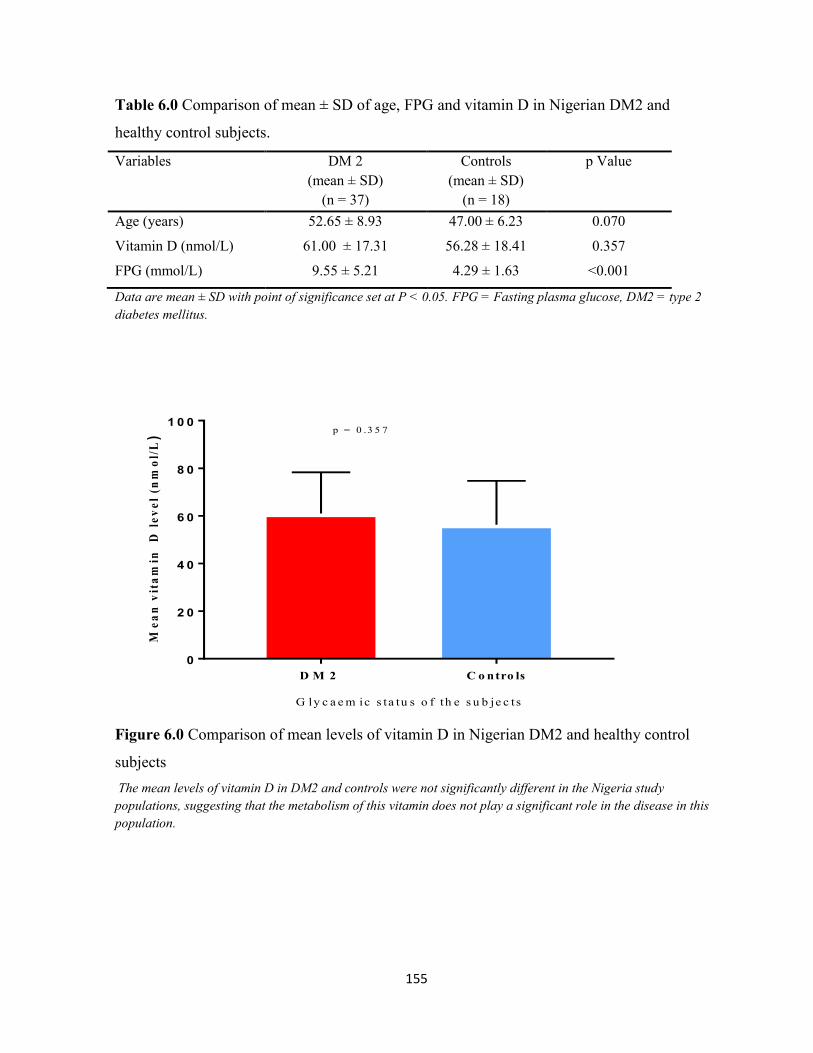
155
Table 6.0 Comparison of mean ± SD of age, FPG and vitamin D in Nigerian DM2 and
healthy control subjects.
Variables DM 2
(mean ± SD)
(n = 37)
Controls
(mean ± SD)
(n = 18)
p Value
Age (years) 52.65 ± 8.93 47.00 ± 6.23 0.070
Vitamin D (nmol/L) 61.00 ± 17.31 56.28 ± 18.41 0.357
FPG (mmol/L) 9.55 ± 5.21 4.29 ± 1.63 <0.001
Data are mean ± SD with point of significance set at P < 0.05. FPG = Fasting plasma glucose, DM2 = type 2
diabetes mellitus.
D M 2 C o ntro ls
0
2 0
4 0
6 0
8 0
1 0 0
G ly c a e m ic s ta tu s o f th e s u b je c ts
Me
an
vit
am
in
D l
ev
el
(nm
ol/
L)
p = 0 .3 5 7
Figure 6.0 Comparison of mean levels of vitamin D in Nigerian DM2 and healthy control
subjects
The mean levels of vitamin D in DM2 and controls were not significantly different in the Nigeria study
populations, suggesting that the metabolism of this vitamin does not play a significant role in the disease in this
population.

156
Table 6.1 Comparison of mean ± SD of age, FPG and 25-OH vitamin D between Nigerian
males and females subjects.
Variables Males
(mean ± SD)
(n = 25)
Females
(mean ± SD)
(n = 30)
p Value
Age (years) 51.28 ± 9.01 50.45 ± 6.80 0.705
Vitamin D (nmol/L) 52.65 ± 15.08 64.34 ± 17.95 0.014
FPG (mmol/L) 6.52 ± 4.05 8.97 ± 5.50 0.068
Data are mean ± SD. FPG = Fasting plasm glucose. Comparison of vitamin D levels between Nigerian males
and females shows a significantly higher vitamin level in the Nigeria females, even though the females had a
higher non-statistically significant level of FPG. p < 0.05.
M a le F e m a le s
0
2 0
4 0
6 0
8 0
1 0 0
G ly c a e m ic s ta tu s o f th e s u b je c t s
Me
an
vit
am
in
D l
ev
el
(nm
ol/
L)
p = 0 .0 1 4
Figure 6.1 Comparison of mean levels of vitamin D in Nigerian males and females subjects.
The difference in the mean levels of vitamin D in male and female Nigerian subjects was statistically
significantly at p < 0.05.
Correlation analyses using Spearman rho correlation, in the whole DM2 and healthy control
population did not show any relationship between the vitamin and the measured analytes
(FPG and, cytokines and adipokines; Chapter 2). About 3.6% of the Nigerian subjects had
mean plasma 25-OH vitamin D consistent with deficiency (< 30.0 nmol/L). Fifteen subjects
(27.3%) of all the Nigerian samples had inadequate levels of 25-OH vitamin D which is set at
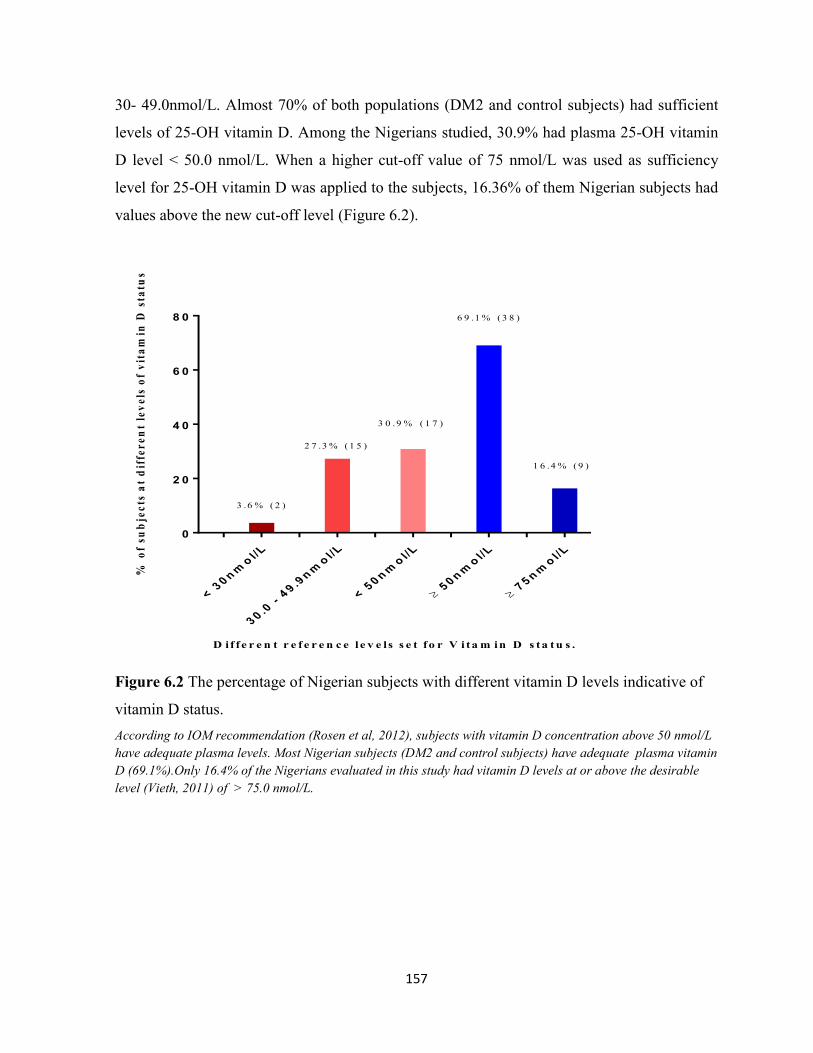
157
30- 49.0nmol/L. Almost 70% of both populations (DM2 and control subjects) had sufficient
levels of 25-OH vitamin D. Among the Nigerians studied, 30.9% had plasma 25-OH vitamin
D level ˂ 50.0 nmol/L. When a higher cut-off value of 75 nmol/L was used as sufficiency
level for 25-OH vitamin D was applied to the subjects, 16.36% of them Nigerian subjects had
values above the new cut-off level (Figure 6.2).
< 3
0n
mo
l/L
30
.0 -
49
.9n
mo
l/L
< 5
0n
mo
l/L
50
nm
ol/
L
75
nm
ol/
L
0
2 0
4 0
6 0
8 0
D if fe r e n t r e f e r e n c e l e v e ls s e t fo r V i ta m in D s ta t u s .
% o
f su
bje
cts
at
dif
fer
en
t le
ve
ls o
f v
ita
min
D s
tatu
s
1 6 .4 % ( 9 )
6 9 .1 % ( 3 8 )
3 0 .9 % ( 1 7 )
2 7 .3 % ( 1 5 )
3 .6 % ( 2 )
Figure 6.2 The percentage of Nigerian subjects with different vitamin D levels indicative of
vitamin D status.
According to IOM recommendation (Rosen et al, 2012), subjects with vitamin D concentration above 50 nmol/L
have adequate plasma levels. Most Nigerian subjects (DM2 and control subjects) have adequate plasma vitamin
D (69.1%).Only 16.4% of the Nigerians evaluated in this study had vitamin D levels at or above the desirable
level (Vieth, 2011) of > 75.0 nmol/L.
158
6.4 Discussion
Unlike previous studies which found lower vitamin D levels in DM2 subjects compared with
controls (Pittas et al, 2007; Talaei et al, 2013, Zhang et al, 2016), there was no statistically
significant difference in the plasma level of the vitamin D in Nigeria DM2 and healthy control
subjects. Zhang et al in a study undertaken in Kuwait (2016), found a high prevalence of
vitamin D deficiency in DM2 patients with 56% of the subjects having inadequate levels of
25-OH vitamin D (30.0 - 50.0 nmol/L). The percentage of those with inadequate vitamin D in
Kuwait is higher than the 30.9% of Nigerian subjects with plasma 25-OH vitamin D level in
the inadequate bracket. Another study undertaken in India found a high prevalence of vitamin
D inadequacy in both DM2 (91.4%) and controls (93.0%). The Indian population level of
hypovitaminoses D was worse than that found in Kuwait and Nigeria. In this study, in India,
despite the high level of hypovitaminosis D, the authors did not find any association between
serum 25OHD inadequacy and glycaemic status in these subjects (Sheth et al, 2015).
Comparing women in Nigeria and African-America women in Chicago, Durazo-Arvizu et al
(2013) found a higher mean vitamin D level in Nigerians (64.0 nmol/L) than in the Americans
(29.0 nmol/L). The mean vitamin D level in the Nigerian women in the Chicago study is
similar to that reported for Nigerian women in the present study. Differences in the levels of
vitamin D in Africans and Asians, compared to Caucasians have also been reported
(Eggemoen et al, 2013; Christensen et al, 2015). The study by Christensen et al (2015) in the
NHANES III survey in the USA, found a mean vitamin D level of 67.1 nmol/L in non-
Hispanic blacks. The authors of this study concluded that the level of 25-OH vitamin D was
not associated with fasting glucose, fasting insulin or diabetes risk (Christensen et al, 2015).
This is in keeping with the lack of correlation between plasma 25-OH vitamin D and fasting
plasma glucose in the presently studied Nigeria population.
However, it might be predicted that a higher level of plasma vitamin D would have been
expected among the present Nigerian population given the tropical location of Nigeria which
is between 15o north and south of the equator. This is an area with significant all year
sunshine and therefore a predicted adequate cutaneous synthesis of vitamin D. Application of
a higher cut-off level at 75 nmol/L for vitamin D, consistent with the vitamin sufficiency as
suggested by some researcher (Vieth, 2011), shows that 16.36% of this Nigerian population

159
meets the higher criterion. It has been reported that residence in the tropics does not translate
to adequate cutaneous synthesis of vitamin D. Adequacy of vitamin D synthesis in the skin of
tropical residents is said to be dependent on sufficient UVB radiation. The use of heavy
clothing, inadequate exposure to sun and dark skin, diminishes the ability for cutaneous
vitamin D synthesis (Meddeb et al, 2005; Binkley et al, 2007; Luxwolda et al, 2012). It has
been suggested that there is a tendency for humans to develop diabetes mellitus when the
plasma level of vitamin D is less than 75 nmol/L (González-Molero et al, 2012), however the
results of the present study appear not to support this view. Various studies in African have
shown that levels of 25-OH vitamin D range from 78.0 nmol/L in Tanzania, 87.0 nmol/L in
Guinea-Bisau (Wejse et al, 2009; Mehta et al, 2009) to 35.0 nmol/L and 43.0 nmol/L in
Tunisia among veiled and unveiled women, respectively (Meddeb et al, 2005). Therefore, the
impact of clothing and other environmental factors on the levels of vitamin D in the Nigerian
groups i.e. DM2 and healthy control subjects, is unclear but maybe more significant in the
Nigerian males. These factors may have some role as most of the subjects recruited for this
study were non-outdoor workers. In spite of these possibilities, this study does not support a
role for vitamin D in DM2 subjects in Nigerians.

160
Chapter 7: General discussion
A recent Lancet article in 2016 which evaluated the global burden and trajectory of DM
revealed that the disease burden has been rising over the last few decades by levels overtaking
various projections of diabetes prevalence. The study showed that global standardised
prevalence of diabetes increased from 4.3% in 1980 to 9.0% in 2014 in men, and from 5.0%
to 7.9% in women (NCD-RisC, 2016). The authors of this study went further to say that the
chances of meeting the global target of halting the rise in diabetes prevalence may not be met,
if the disease trend since 2000 continues. A major contribution to the global scale of this
problem is made by the rising prevalence of diabetes mellitus in developing countries
including Nigeria and Mexico. The prevalence of DM increased from 0.4% (IDF, 2000) to
4.6% (Olatunbosun et al, 1998; IDF, 2014) in Nigeria; whilst it increased from 6.7% in 1993
to 14.4% by 2006 (Villapando et al, 2010) in Mexico. An IDF report in 2000, estimated DM
prevalence in Mexico to be 14.2% and this marginally increased to 14.7% in the 2015 report
(IDF, 2015).
Mexico has a diabetic population of 11.5 million; the 6th
largest in the world. The number of
persons with diabetes in Mexico is over seven times the Nigeria diabetic population estimated
to be 1.6 million in 2015 (IDF, 2015). Nigeria and Mexico consume a similar type of diet
which is characterised by high carbohydrate and low fat (HCLF). These two countries
(Nigeria and Mexico), are close to the equator and may therefore be receiving a similar
amount of sunshine all year round. The importance of comparing the FA profile and
inflammatory markers in DM2 subjects in both populations was to investigate the possible
endogenous factors associated with the disease. This is with a view to evaluating the possible
impacts of a HCLF diet in the pathogenesis of DM, especially given the commonality of such
a diet (HCLF) in most African countries.
The Nigerian subjects’ (DM2 and healthy controls) plasma circulating cytokine levels are
high compared to non-transformed cytokines values of other diabetic populations such as
those reported in the UK, Mexico and Mexican-Americans (Spranger et al, Guadarrama-
Lopez et al, 2015, Mirza et al, 2012), IL-6 and TNF-α were significantly higher in Nigeria
DM2 subjects compared to the control subjects. The differences in IL-6 and TNF-α may not

161
originate solely from the adipocytes, as there were no significant differences in WHR and
BMI between the two groups. The level of IL-6 and or TNF-α were earlier noted to be higher
in the diabetics in the UK, Mexico and among Mexican-Americans in the USA (Spranger et al
2013; Guadarrama-Lopez et al 2015; Mirza et al 2012, respectively). In particular, Spranger et
al, 2003 reported that IL-6 was an independent risk factor for incident diabetes mellitus. A
higher level of IL-6 was reported in Mexican DM2 subjects by Guadarrama-Lopez et al
(2015) compared to the level in Europeans by Spranger et al, 2003. The level of IL-6 in
Nigerian DM2 subjects is much higher than reported in other countries mentioned above. It is
known that between 10-35% of IL-6 is produced by adipocytes with the bulk of the cytokine
being released from immunocytes such as macrophages (Cieslak et al, 2015). Elevated IL-6 in
the presence of other cytokines such as IL-1β, TNF-α, IFN-γ, is associated with IR, increased
FFAs and high DM2 risk. This is because the combination of increased levels of the
aforementioned pro-inflammatory cytokines leads to massive loss in pancreatic -islet cells
(Spranger et al, 2003; Cieslak et al, 2015). IL-6 carries out its biologic activities via the IL-
6R (IL-6 receptor) and GP130. Binding of IL-6 to membrane-bound IL-6R (mIL-6R), leads to
homodimerisation of GP130 to form a high affinity functional receptor complex of IL-6-IL-
6R-GP130. The homodimerisation of this complex activates JAKs (Janus kinases) which then
phosphorylate tyrosine residues in the cytoplasmic domain of GP130. The GP130-mediated
JAK activation by IL-6 will in turn trigger MAPK (mitogen activated protein kinase) and the
JAK/STAT (signal transducer and activator of transcription) pathways, which are associated
with IR (Mihara et al, 2012). TNF-α is known to play a key role in the mediation of insulin
resistance, through multiple mechanisms. These include down-regulation of genes that are
required for normal insulin action, direct effects on insulin signalling, induction of elevated
free fatty acids via stimulation of lipolysis, and negative regulation of peroxisomal
proliferator-activated receptor-g (PPAR-γ); an important insulin sensitizing nuclear receptor
(Moller, 2000). The increase in FFAs during IR/DM2 states leads to pancreatic β-cell
dysfunction and apoptosis, via induction of endoplasmic reticulum stress, glucotoxicity,
lipotoxicity and proinflammatory adipokines (Lee, 2013). Elevated oxidative stress and
endoplasmic reticulum stress also leads to intense production of pro-inflammatory cytokines,
irrespective of the initiator of the stress and hence they are able to induce inflammatory
processes that increase diabetic risk (Hotamisligil, 2005). The exact role of IL-6 in the

162
inflammatory process in diabetic populations is currently under investigation. It is known that
immune cells, especially adipose tissue infiltrating macrophages produces significant amounts
of IL-6, in addition to producing TNF-α and IL-1β (Cieslak et al, 2015). Kimura et al (2010)
showed that IL-6 plays a vital role in the interaction and balancing of pro-inflammatory Th17
cells and regulatory T-cells (Tregs). This balance by Tregs is crucial for limiting proliferation
of effector lymphocytes and thereby reducing the release of pro-inflammatory cytokines. The
exact role of the marked elevation of IL-6 in the Nigeria population and especially among the
DM2 subjects could be a physiological attempt to regulate the cytokine burden. Chronic
elevation of IL-6 has been associated with a permanent increase in expression of suppressors
of cytokine signaling 3 and cytokine signaling 1 (SOCS3 and SOCS1) proteins. The
combination of sustained increase in IL-6, TNF-α, SOC3, SOC1 and other inflammatory
cytokines are associated with significant IR in glucose metabolising tissues such as muscle,
liver and adipose tissues (Cieslak et al, 2015). Sarvas et al, 2013 reported that SOCS3 proteins
inhibit production of pro-inflammatory cytokines which utilise the NF-κβ pathway and also
blocks STAT3 (signal transducer and activator of transcription) which are activated by the IL-
6R receptor. Hence SOCS proteins have been considered the most important endogenous
regulators of proinflammation especially those initiated via Toll-like receptors (Cieslak et al,
2015). The increased plasma IL-6 and or TNF-α in other diabetic populations (Nigeria,
Mexico, USA etc), could be an attempt to dampen the pathological and physiological
activities of other inflammatory signals. The elevated baseline level of some of the cytokines
in Nigerian subjects maybe related to background immune activation by environmental
factors such as infestation/infection or genetic factors. This point is suggested in various
studies comparing the immune status of Africans and Europeans whether in adult or infants
(Kemp et al, 2001; Wilfing et al, 2001; Kohler et al, 2008; Noone et al, 2013). Therefore, the
levels of cytokines in Nigerians (DM2 and control subjects) compared to other populations
(Spranger et al, 2003; Lee et al, 2008; Mirza et al, 2012; Guadarrama-Lopez et al, 2015),
suggests that diabetes maybe an additional source of inflammation or is a consequence of
prior activated inflammation, in this population. Despite the level of the cytokines in the
Nigerian populations (DM2 and controls), IL-6 and TNF-α were still significantly higher in
the diabetics. Therefore these two cytokines (IL-6 and TNF-α) are the most significant
cytokines related to DM2 in the present Nigerian population. The importance of the cytokines

163
in this DM2 subjects may include the impact cytokines have on the development of
complications of diseases. IL-6 has been reported to contribute significantly to the
pathogenesis of endothelial dysfunction and vascular complications in affected patients
(Georgescu et al, 2012). Such vascular impact of IL-6 involves the development of diabetic
kidney disease, via enhanced stimulation of mesangial cell proliferations (Wegner et al,
2013). This finding has significant implications for Nigerian diabetics, especially as diabetics
of African descent have been earlier reported to be more prone to glomerular hyperfiltration
(Pruijm et al, 2010) and impaired renal autoregulation (Burke et al, 2014). These factors are
known to predispose diabetics to hypertension and significant kidney disease (Burke et al,
2014). The interaction of TNF-α, IL-6 with IL-8 in this Nigerian DM2 and control population
has been demonstrated in earlier studies (Mirza et al, 2012; Kobash et al, 2006). Kobash and
coworkers in 2006 showed that IL-8 production is enhanced by TNF-α, IL-1β and CRP. This
relationship is important in the Nigerian DM2 population where IL-8 had a negative
correlation with HOMA-B. Thus suggesting a negative impact of the later cytokines on
pancreatic β-cells secretory ability, and this is further reflected in the significant negative
correlation between FPG and HOMA-B in the Nigerian diabetics.
Chronic exposure of pancreatic β-cells to a lipotoxic environment created by FFAs is
elaborated in the presence of high levels of SFAs including palmitic acid (C16:0) results in
pancreatic islet cell apoptosis, IR and DM2. The apoptosis induced by palmitic acid and pro-
inflammatory cytokines (IL-β, TNF-α, IFN-γ) is mediated via activation of the JNK kinase (c-
Jun N-terminal kinases) pathway. Saturated FAs such as palmitic acid activate pro-
inflammatory response by inducing TLR signaling and subsequently NF-κβ which are known
to cause insulin resistance and DM (Hotasmiligil et al, 2010). Long term exposure of
pancreatic -islet cells to high levels of palmitic acid and hyperglycaemia is associated with
an increase in secretion of the pancreatic derived factor i.e PANDER (Wang et al, 2012;
Xiang et al, 2012). PANDER binds to liver cell membrane to induce insulin resistance and
increase gluconeogenesis. The inactivation of hepatic PANDER in experimental animals
results in a marked decrease in steatosis, insulin resistance, and hyperglycemia (Wang et al,
2012), thus suggesting the importance of the protein and its biologic functions in glycolipid
dysmetabolism. The PANDER protein may add to the importance of managing the observed
elevation in the levels of palmitic acid in Nigerian and Mexican DM2 patients.

164
Palmitic acid has also been correlated with increased IL-6 secretion and impairment of insulin
sensitivity in some studies (Coll et al, 2008). In the Nigerian DM2 subjects, palmitic acid
showed a positive relationship with resistin, and a negative one with IL-4, and these were not
seen in the control subjects (Chapter 5). Similarly findings between stearic acid and IL-
6/TNF-α, were only seen among diabetics. This suggests a differential impact of some SFAs
in the Nigerian DM2 and control subjects. Since the levels of these FAs (palmitic and stearic
acids) were clearly opposed in Nigerian DM2 and control subjects, similar to the findings in
other investigations (Chuang et al, 2012; Ma et al, 2015), their relationships with the pro-
inflammatory cytokines (IL-6 and TNF-α) appears to be related to DM2. Therefore, the
negative relationships between FPG and stearic acid in Nigerian DM2 and control subjects,
suggest a possible positive role of the FA in Nigerian subjects. In the DM2 subjects, vaccenic
acid showed negative correlations with IL-6 and TNF-α, thus supporting the suggestion that
vaccenic acid is associated with reduced risk of diabetes meliitus. So also, is the significant
negative association between MUFA and HOMA-IR in the Nigerians control subjects only.
A recent report (Park et al, 2016) shows that excess palmitic acid from the DNL pathway
competes with n-3 and n-6 PUFAs for D6D (FADS2); hence, a high level of palmitate is
associated with reduced metabolism of the parent linoleic and α-linolenic acids to longer
chain metabolites (EPA, DHA and AA). The lower levels of AA and other longer chain n-6
PUFAs in Nigerian and Mexican diabetics maybe related to the impact of palmitic acid on
FADS2 metabolism (Park et al, 2016). The implication of this is that excess palmitic acid, in
addition to activating innate immunity via TLR-4 pathway, also reduces the formation of
longer chain PUFAs by competing with n-3 and n-6 FAs in FADS-2 metabolism. Such a
reduction in PUFAs levels can lead to a decrease in interactions with PPARs and GPR120.
The LC-PUFAs activate GPR120 receptors on macrophages and by so doing turn down
macrophage mediated inflammatory signals thereby deactivating downstream IR factors
including IKKβ/NF-κβ and JNK (Oh et al, 2014). PUFAs decreases pro-inflammatory
cytokines and gene expression, while increasing those factors associated with anti-
inflammatory genes and cytokine activation (Autieri et al, 2012; Chng et al, 2015).
Furthermore, lipooxygenase metabolism of LC-PUFAs results in the formation of anti-
inflammatory lipid mediators such as lipoxins, resolvins and protectins. The action of LC-
PUFAs on GPR120 mediation of anti-inflammation and insulin sensitisation has been

165
reported to be important in glucose metabolism (Oh et al, 2014). Mobraten et al (2013) clearly
showed that AA, EPA and DHA induce GPR120 mediated signaling events and these leads to
inhibition of NF-κβ and improved insulin sensitivity.
The n-6 metabolism is particularly important in Nigerian and Mexican DM2 subjects as they
were clearly different in both DM2 populations compared to their corresponding controls. In
humans, the amount of AA formed by the desaturation of LA exceeds that from dietary intake
of AA (Zhou et al, 2001), thus making a defect in endogenous synthesis a prime factor to
consider in subjects with decreased n-6 metabolites. It has been found that the metabolism of
AA to PGE2 by COX2 has the ability to protect pancreatic β-cells from apoptosis
(Papadimitriou et al, 2007), and this maybe beneficial in the lipotoxic environment associated
with DM2 (Keane et al, 2011; Cheon et al, 2014). Therefore, there may be a need to
investigate the outcome of the increase in AA in Nigerian and Mexican DM2 populations, in
the future.
A large scale EPIC-InterAct Case-Cohort study involving eight European countries concluded
that linoleic acid (LA; C18:2n-6) and α-linolenic (ALA; C18:3n-3), are associated with a
lower risk of DM2 (Forouhi et al, 2016). The same study found that eicosadienoic acid
(C20:2n-6) and linoleic acid (C18:2n-6) are also negatively associated with the risk of DM2,
but -linoleic acid (C18:3n-6), dihomo--linoleic acid (LA; C20:3n-6), adrenic acid or
docosatetraenoic acid (C22:4n-6) and osbond acid i.e or n-6 docosapentaenoic acid (n-6 DPA;
C22:5n-6) were positively associated with the disease. The group did not find any significant
relationship between arachidonic acid (AA; C20:4n-6) and DM2 risk. The Nigerian and
Mexican populations did not show significant differences in the levels of α-linolenic acid
(C18:3n-3) and linoleic acid (C18:2n-6) between DM2 subjects and their corresponding
control subjects. Both Nigerian and Mexican DM2 subjects had significantly lower levels of
AA, adrenic acid and n-6 DPA or osbond acid, compared with their controls. The differences
between the findings in Nigerian/Mexican DM2 populations and the EPIC-InterAct study may
be due to dietary and/or genetic differences. Among the countries that participated in the
EPIC-InterAct study there may have been subtle differences in n-6 and n-3 PUFAa between
one country and another, which may be obscured when the data from the eight countries was
analysed as a whole. The recent study by Yary et al (2016) in Finland supports the EPIC-
InterAct study finding of positive associations between GLA and DGLA with a higher risk of

166
DM2. However, the Finland study found that LA and AA were positively associated with a
lower risk of DM2. This latter observation is significant for the Nigerian and Mexican DM2
populations, given that human AA levels mainly reflects endogenous conversion from LA
(Yary et al, 2016). Despite the similar levels of LA in the diabetics and controls in Nigerians,
there was a significant correlation between LA and IL-4 (r = 0.484) in the control subjects but
not in the diabetics. Among the DM2 subjects, LA had a significant negative correlation with
MCP-1 and TGF-1β. Nigerian subjects (DM2 and control) seem to handle the same FAs in
different ways subject to glycaemic status or other unidentified factors. The negative
relationship between AA/DGLA and TNF-α in Nigeran DM2 subjects (Chapter 5) is in
keeping with reduced DM2 risk by LA, AA and AA/DGLA which was reported by Forouhi et
al (2016) and Yari et al (2016). There were varied relationships between PUFAs and the
cytokines in Nigerian subjects and this appears to be affected by their glycaemic status. This
is demonstrated by the negative correlation between n-6 PUFAs and TGF-1β/MCP-1 in the
Nigerian DM2 subjects. But in the healthy control subjects, n-6 PUFAs displayed negative
correlations with IL-6, and a positive one with IL-4. Therefore, it could be suggested that the
negative relationship with IL-6 and the positive relationship with IL-4 is what the Nigerian
DM2 subjects have lost due to n-6 dysregulation.
The type and pattern of FAs in relation to cytokine expression, are a critical dietary
consideration when evaluating the effect of nutrients on the development of DM2 (Spranger et
al, 2003; Hodge et al, 2007; Krachler et al, 2008; Forouhi et al; 2014, Ma et al, 2015). Since
the serum levels of specific FAs can be modified by the selective use of foods in the diet or
dietary supplementation, it may be possible to intervene in defective FAs profiles in affected
subjects, if this is established (Ferrucci et al, 2006). The modulatory effect of FAs on multiple
signaling pathways is via a direct effect on gene expression (Ferrucci et al, 2006). The ability
of PUFAs to modulate inflammatory responses by acting on pro-inflammatory or anti-
inflammatory arms of the cytokine network is independent of the -status of the FA (Ferrucci
et al, 2006). Both long chain n-3 and n-6 PUFAs acts on PPARα and PPARγ to regulate
transcription of target genes (Contreras et al, 2013; Wang et al, 2015). The reduction in long
chain n-6 PUFAs found in Nigerian and Mexican diabetics may additionally impact on cell
membrane properties such as permeability, flexibility, fluidity, activity of membrane-bound
enzymes, and on the properties of the cardiovascular and nervous systems. Khaw et al (2012)

167
noted in the EPIC-Norfolk study that LA and AA are inversely related to coronary heart
disease (CHD) while DGLA had a positive correlation to CHD risk. In 2008, Danesh and co-
workers showed, in a meta-analysis, that chronic elevation of IL-6 level is associated with
CHD risk as strongly as the other more recognised risk factors (Danesh et al, 2008). Recently,
Kaptoge et al (2014) noted that TNF-α and IL-6 were also significant risk factors for CHD
(Kaptoge et al, 2014). The aforementioned link between cytokines and CHD may underpin
the association between DM2 and cardiovascular diseases in the clinical settings. The
debilitating disorder of peripheral neuropathy is a major reason for lower limb amputations in
diabetics in addition to their vasculopathy. This complication of DM2 has been associated
with defects in n-6 PUFA (LA, GLA, and AA) metabolism in some studies (Keen et al, 1993;
Lauretani et al, 2007; Pitel et al, 2007). Furthermore, GLA supplementation has long been
shown in diabetes to have important beneficial clinical effects on DM2 neuropathy (Keen et
al, 1993). Hence, early identification of FA disorder and treatment in DM2 subjects may help
in managing the nerve conduction defect and damage associated with diabetes mellitus.
Consumption of a large amounts of carbohydrates, especially rapidly absorbed refined
carbohydrates, alcohol and low fat, stimulates the DNL pathway (Flowers et al, 2009). The
high dietary carbohydrate activates lipogenic transcription factors such as sterol regulatory
binding protein (SREBP) and carbohydrate response-element binding protein (ChREBP).
These factors increase the transcription of genes that encodes for acetyl-coenzyme A
carboxylase (ACC), fatty acid synthase (FAS) and elongase-6 (Elovl-6) enzymes. The first
two enzymes (ACC, FAS) promote synthesis of SFAs (myristic and palmitic acids) before the
elongation of palmitic to stearic acid by Elovl-6 (Wang et al, 2006; Flowers et al, 2009).
Other key products formed when the DNL pathway is activated are the MUFAs (palmitoleic,
vaccenic, oleic and hexadecenoic acids). The activities of SCD1 and SCD2, as shown in
Chapter 3, increases the desaturation of palmitic acid to palmitoleic, and stearic to oleic acids,
respectively (Wang et al, 2006; Flowers et al, 2009). Among MUFAs, only vaccenic acid was
significantly different in Nigerian DM2 subjects and the corresponding control subjects; it
was lower in Nigerian DM2 subjects and in other populations (Patel et al, 2010; Chuang et al,
2012), but not in Mexican subjects. In the Nigerian control population there were significant
negative correlations between vaccenic acid and pro-inflammatory cytokines; IL-6 and TNF-
α. The benefits of reduced risk of DM associated with vaccenic (Patel et al 2010; Chuang et

168
al, 2012), may be connected to its inverse relationship with TNF-α and IL-6, found only in the
Nigerian healthy control subjects. Some evidence suggests that vaccenic acid suppresses
hepatic gluconeogenic gene expression thereby improving glucose metabolism. This action is
activated via increased activity of elongase-5 (Elovl-5), an important enzyme for the
endogenous synthesis of vaccenic acid from palmitoleic acid (Ma et al, 2015). The KANWU
study by Vessby et al (2001) showed there were benefits of dietary MUFAs (oleic acid) in
combating pro-inflammatory SFAs.
Analysis of plasma 25-(OH) vitamin D in Nigerian DM2 subjects and controls showed no
significant difference between Nigerian DM2 subjects and healthy controls. This is despite the
generally recognised tendency for humans to develop diabetes mellitus when the plasma level
of vitamin D is less than 75 nmol/L i.e. 30 ng/mL (González-Molero et al, 2012). The
Nigerian population did not show any significant correlation between diabetes mellitus and
the level of vitamin D, a fact also noted in black-Americans in the USA (Christensen et al,
2015).
In summary, the findings from a comparison between Nigerian and Mexican DM2 subjects
and their corresponding controls shows that there is possible defect in n-6 PUFA metabolism
to their longer chain metabolites, in the pathophysiology of diabetes mellitus type 2. The
defect in n-6 metabolism is reflected in the reduced AA, adrenic and osbond acids in DM2
subjects in Nigerian and Mexican diabetic populations. This is in addition to elevated pro-
inflammatory palmitic acid (C18:0) and lower stearic acid in the DM2 subjects of both
populations. This common pattern of plasma PC phospholipid FAs in Nigerian and Mexican
DM2 subjects is a new finding which has not been previously reported in both populations. It
is hypothesised that the similar pattern of FA detected in the Nigerian and Mexican DM2
populations, is associated with the consumption of high amounts of carbohydrates in their
diets. Further comparison between Nigerian and Mexican DM2 subjects shows that IL-6 is
significantly linked to the disease in both groups with the highest level of circulating IL-6
reported in the DM2 literature displayed in this Nigerian DM2 population. The present study
also suggests that the proper evaluation of FA profiles in DM2 should take into consideration
the individual components of the FA profile and not just n-6 and n-3 FAs as a class. The
individual FAs should be assessed based on their unique biological actions and roles in

169
metabolism. They should be assessed in relation to their interactions with other FAs and
related biochemical markers such as cytokines. It also important that FA analyses should take
into account the background diets, ethnicity and associated inflammatory cytokines as these
varied factors may ultimately determine the plasma FA profile in individuals. According to
Khaw et al (2012) there is increasing evidence that individual FAs mediate different
metabolic and health effects, and these should be taken into consideration in planning the
management of relevant health conditions such as DM2.
Limitations of the study: The limitations of this study include the non-availability of direct
dietary information of the study subjects in both the Nigerian and Mexican groups. Such data
would have helped in relating the fatty acid profile in the subjects to their dietary intakes
(Arab, 2003), and importantly country-country comparison would have clarified if differences
were due mainly, or in part, to dietary differences. Furthermore, determination of autoimmune
antibodies such as GAD65 to rule out or estimate the prevalence of LADA in the Nigerian
population studied, given recent articles estimating the condition to be about 10 – 14% in
Nigerians (Muazu & Okpe, 2016; Adeleye et al, 2012; Ipadeola et al, 2015), would have been
useful in relation to excluding such patients from the final analysis.

170
Chapter 8: Future Work
Based on the results of the studies reported herein on Nigerian and Mexican DM2 subjects,
further research should investigate the following aspects of DM2.
1. Measurements of the erythrocyte membrane FA profiles in Nigerian and Mexican DM2 and
control subjects. This will give further insight in relation to the similarities and differences
between Nigerian and Mexican diabetics and control FA profiles. Erythrocyte membrane
analyses would reflect the pattern of FAs related to intracellular signalling as well as
phosphatidylserine (PS) and phosphatidylethanolamine (PE) fractions of the membrane
phospholipids.
2. The study in 1 above would involve subjects at different stages of glycaemic
dysmetabolism; normoglycaemia, impaired glucose tolerance and frank diabetes mellitus type
II. This would also indicate the time course of changes in FAs and cytokines associated with
diabetics. The two country comparison will provide data on the biology of DM2 in relation to
FAs and inflammatory markers.
3. Dietary intake data of the two populations should also be collected at the same time as
collecting blood samples/data for the erythrocyte membrane FA study. This would help in the
evaluation of the contribution of the diet measured to membrane FA profiles and in relation to
metabolic effects.
4. Extension of these studies to other populations with similar dietary intake, so as to establish
the extent of this FA pattern in populations consuming diets high in carbohydrates. An
analysis of populations of African descent in Europe and the Caribbean with respect to
erythrocyte membrane FAs and cytokines would also be insightful in relation to
environmental changes including diet.
5. There is a need to further evaluate the relationship between vitamin D and diabetes
mellitus. Enrolment of participants in other countries could show the role of the vitamin in
non-communicable diseases such as DM and CVD in non-European developing countries.
The effect of circulating vitamin D on pro-inflammatory and anti-inflammatory cytokines in
DM2 is also warranted.

171
6. Pilot clinical trials with supplemented longer chain n-6 and n-3 PUFA and with combined
n-3 and n-6 LC-PUFA to evaluate the clinical effects in DM2 and effects on membrane fatty
acids and pro-inflammatory and anti-inflammatory cytokines and adipokines are clearly
warranted.

172
References
1. Abate N, Sallam HS, Rizzo M, Nikolic D, Obradovic M, Bjelogrlic P, Isenovic
ER. Resistin: an inflammatory cytokine. Role in cardiovascular diseases, diabetes
and the metabolic syndrome. Curr Pharm Des. 2014; 20(31): 4961-4969.
2. Adebisi SA, Oghagbon EK, Akande TM, Olarinoye JK. Glycated haemoglobin
and glycaemic control of diabetes in Ilorin. Niger J Clin Pract. 2009; 12: 87–91.
3. Adebisi SA, Oghagbon EK, Okesina AB. Management of obesity in diabetic
patients. Diabetes Int. 2003; 12: 61-65.
4. Adebisi SA, Oghagbon EK. Prevalence of obesity among diabetics in Ilorin,
Middle belt of Nigeria. Sahel Med J. 2003; 6: 112-115.
5. Ahmed AM. History of diabetes mellitus. Saudi Med J. 2002; 23(4): 373-3780.
6. Akarolo-Anthony SN, Odubore FO, Yilme S, Aragbada O, Odonye G, Hu F et al.
Pattern of dietary carbohydrate intake among urbanized adult Nigerians. Int J
Food Sci Nutr. 2013; 64(3): 292-299.
7. Alexandraki K, Piperi C, Kalofoutis C, Singh J, Alaveras A, Kalofoutis A.
Inflammatory process in type 2 diabestes; The role of cytokines. Ann NY Acad
Sci. 2006; 1084: 89-117.
8. Aleidi S, Issa A, Bustanji H, Khalil M, Bustanji Y. Adiponectin serum levels
correlate with insulin resistance in type 2 diabetic patients. Saudi Pharm J. 2015;
23: 250-256.
http://www.ncbi.nlm.nih.gov/pubmed/?term=Obradovic%20M%5BAuthor%5D&cauthor=true&cauthor_uid=24320036
http://www.ncbi.nlm.nih.gov/pubmed/?term=Isenovic%20ER%5BAuthor%5D&cauthor=true&cauthor_uid=24320036

173
9. Alfawaz H, Tamim H, Alharbi S, Aljaser S, Tamimi W. Vitamin D status among
patients visiting a tertiary care center in Riyadh, Saudi Arabia: a retrospective
review of 3475 cases. BMC Public Health. 2014, 14: 159.
10. Al-Goblan AS, Al-Alfi MA, Khan MZ. Mechanism linking diabetes mellitus and
obesity. Diabetes Metab Syndr Obes. 2014:7 587–591.
11. Al-Harithy RN, Al-Ghamdi SI. Serum resistin and insulin resistance in Saudi
women with type 2 diabetes mellitus. Ann Saudi Med. 2005; 25(4): 283-287.
12. Allbrink M, May E. Serum triglycerides in health and diabetes. Diabetes. 1958;
7: 154.
13. Allen HG, Allen JC, Boyd LC, Alston-Mills BP, Fenner GP. Determination of
membrane lipid differences in insulin resistant diabetes mellitus type 2 in whites
and blacks. Nutrition. 2006; 22(11-12): 1096-1102.
14. Alvarez JA, Ashraf A: Role of vitamin D in insulin secretion and insulin
sensitivity for glucose homeostasis. Int J Endocrinol. 2010; 2010: 351–385.
15. Alves MG, Martins AD, Rato L, Moreira PI, Socorro S, Oliveira PF. Molecular
mechanisms beyond glucose transport in diabetes-related male infertility.
Biochim Biophys Acta. 2013; 1832: 626–635.
16. Amato MC, Pizzolanti G, Torregrossa V, Misiano G, Milano S,Giordano C.
Visceral adiposity index (VAI) is predictive of an altered adipokine profile in
patients with type 2 Diabetes. PLoS ONE. 2014: 9(3): e91969.
17. Arab L. Biomarkers of fat and fatty acid intake. J Nutr. 2003; 133(Suppl 3):
925S–932S.

174
18. Arabi A, El Rassi R and El-Hajj Fuleihan G. Hypovitaminosis D in Developing
Countries-Prevalence, Risk Factors and Outcomes. Nat Rev Endocrinol. 2010; 6,
550–561.
19. Arokolo-Anthony SN, Odubore FO, Yilme S, Aragbada O, Odonye G, Hu F et al.
Pattern of dietary carbohydrate intake among urbanised adult Nigerians. Int J
Food Sci Nutr. 2013; 64(3): 292-299.
20. Arora N, Niraj G. Management of painful peripheral neuropathy. BJMP. 2013; 6:
a606.
21. Aslan I, Kucksayan E, Aslan M. Effects of insulin analog initiation therapy on
LDL/HDL
subfraction profile and HDL associated enzymes in type 2 diabetic
patients. Lipids Health Dis. 2013; 12: 54.
22. Autieri M. Pro- and anti-inflammatory cytokine networks in atherosclerosis.
ISRN Vascular Medicine. Vol 2012; Article ID 987629.
23. Baba MM, Kolawole BA, Ikem RT, Arogundade FA, Yusuph H, Gezawa ID.
Serum C-reactive protein in Nigerians with type II diabetes mellitus. Nig Q J
Hosp Med. 2010; 20(3): 108-113.
24. Badawi A, Klip A, Haddad P, Cole DEC, Bailo BG, El-Sohemy A et al. Type 2
diabetes mellitus and inflammation: Prospects for biomarkers of risk and
nutritional intervention. Diabetes Metab Syndr Obes. 2010; 3: 173-186.
25. Bakan E, Yildirim A, Kurtul N, Polat MF, Dursun H, Cayir K. Effects of type 2
diabetes mellitus on plasma fatty acid composition and cholesterol content of
erythrocyte and leukocyte membranes. Acta Diabetol. 2006; 43(4): 109-113.

175
26. Ballak DB, van Diepen JA, Moschen AR, Jansen HJ, Hijmans A, Groenhof
G-J. IL-37 protects against obesity-induced inflammation and insulin resistance. Nat
Commun. 2014; 5, Article number 4711.
27. Ballester J, Munoz MC, Dominguez J, Rigau T, Guinovart JJ, Rodriguez-Gil JE.
Insulin-dependent diabetes affects testicular function by FSH- and LH-linked
mechanisms. J Androl. 2004; 25: 706–719.
28. Banerjee M, Saxena M. Interleukin-1 (IL-1) family of cytokines: role in type 2
diabetes. Clin Chim Acta. 2012; 15-16: 1163–1170.
29. Barry JC, Shakibakho S, Durrer C, Simtchouk S, Jawanda KK, Cheung ST et al.
Hyporesponsiveness to the anti-inflammatory action of interleukin-10 in type 2
diabetes.
Sci Rep. 2016; 6: 21244.
30. Baynes KC, Boucher BJ, Feskens EJ, Kromhout D. Vitamin D, glucose tolerance
and insulinaemia in elderly men. Diabetologia. 1997; 40: 344−347.
31. Beukhof CM, Hoorn EJ, Lindemans J, Zietse R. Novel risk factors for hospital-
acquired hyponatraemia: a matched case-control study. Clin Endocrinol
(Oxf). 2007; 66: 367–372.
32. Beutler B. Innate immunity: an overview. Mol Immunol. 2004; 40: 845-859.
33. Bilan PJ, Samokhvalov V, Koshkina A, Schertzer JD, Samaan MC, Klip A .
Direct and macrophage-mediated actions of fatty acids causing insulin resistance
in muscle cells. Arch Physiol Biochem. 2009; 115: 176-190.
34. Bild D, Teutsch SM. The control of hypertension in persons with diabetes: a
public health approach. Public Health Rep. 1987; 102(5): 522-529.

176
35. Binkley N, Novotny R, Krueger D, Kawahara T, Daida YG, Lensmeyer G et al.
Low Vitamin D Status despite Abundant Sun Exposure. J Clin Endocrinol Metab.
2007; 92: 2130 –2135.
36. Bischoff-Ferrari HA, Willett WC, Wong JB, Giovannucci E, Dietrich T,
Dawson-Hughes B. Fracture prevention with vitamin D supplementation: a meta-
analysis of randomized controlled trials. JAMA. 2004; 293: 2257–2264.
37. Biswas SK, Mantovani A. Macrophage plasticity and interaction with
lymphocyte subsets: cancer as a paradigm. Nat Immunol. 2010; 11(10): 889-896.
38. Bohov P, Gelienova K, Sebokova E, Klimes I. Abnormal serum fatty acid
composition in non-insulin-dependent diabetes mellitus. Ann. N.Y. Acad. Sci.
1993; 683: 367–370.
39. Borkman M, Storlien LH, Pan DA, Jenkins AB, Chisholm DJ, Campbell LV. The
relation between insulin sensitivity and the fatty acid composition of skeletal
muscle phospholipids. N Engl J Med. 1993; 328: 238-244.
40. Bottner M, Krieglstein K, Unsicker K. The transforming growth factor-betas:
structure, signaling, and roles in nervous system development and functions. J
Neurochem. 2000; 75:2227–2240.
41. Boucher J, Kleinridders A, Kahn CR. Insulin receptor signaling in normal and
insulin resistant states. Cold Spring Harb Perspect Biol. 2014; 6: a009191.
42. Bouillon R, Verstuyf A, Verlinden L, Eelen G, Mathieu C . Prospects for vitamin
D receptor modulators as candidate drugs for cancer and (auto) immune diseases.
Cancer Res. 2003; 164: 353-356.

177
43. Bourne RB, Kretzschmar WA, Esser JH. Successful artificial insemination in a
diabetic with retrograde ejaculation. Fertil Steril. 1971; 22: 275–277.
44. Bravo J, Heath J K. Receptor recognition by gp130 cytokines. EMBO J. 2000;
19: 2399.
45. Brenner BM, Cooper ME, de Zeeuw D, Keane WF, Mitch WE, Parving HH.
Effects of losartan on renal and cardiovascular outcomes in patients with type 2
diabetes and nephropathy. N Engl J Med. 2001; 345(12): 861-869.
46. Brito A, Cori H, Olivares M, Mujica MF, Cediel G, de Romaña DL. Less than
adequate vitamin D status and intake in Latin America and the Caribbean: A
problem of unknown magnitude. Food Nutr Bull. 2013; 34: 52-64.
47. Brown MA. IL-4 Production by T Cells: You Need a Little to Get a Lot. J
Immunol. 2008; 181:2941-2942.
48. Burke M, Pabbidi MR, Farley J, Roman RJ. Molecular mechanisms of renal
blood autoregulation. Curr Vasc Pharmacol. 2014; 12(6): 845-858.
49. Calder PC. Immunomodulatory and Anti-Inflammatory effects of n-3 Polyunsaturated
Fatty Acids.
Proc Nutr Soc. 1996; 55: 737-774.
50. Calder PC. Long-chain polyunsaturated fatty acids and inflammation.
Scandinavian Journal of Food and Nutrition. 2006; 50(S2): 54-61.
51. Calder PC. Mechanisms of Action of (n-3) Fatty Acids. J Nutr. 2012; 142: 592S–
599S.
52. Cameron MJ, Kelvin DJ. Cytokines, Chemokines and Their Receptors. In: Madame
Curie

178
Bioscience Database [Internet]. Austin (TX): Landes Bioscience; 2000
www.ncbi.nlm.nih.gov/books/NBK6294/)
53. Cardellini M, Andreozzi F, Laratta E, Marini MA, Lauro R, Hribal ML et al. Plasma
interleukin-6 levels are increased in subjects with impaired glucose tolerance but not in
those with impaired fasting glucose in a cohort of Italian Caucasians. Diabetes Metab
Res Rev. 2007; 23(2): 141-145.
54. Carillo-Tripp M, Feller SE . Evidence for a mechanism by which omega-3
polyunsaturated lipids may affect membrane protein function. Biochemistry.
2005; 44: 10164-10169.
55. Carnevale V, Romagnoli E, D'Erasmo E. Skeletal involvement in patients with
diabetes mellitus. Diabetes Metab Res Rev. 2004; 20(3): 196-204.
56. Carstensen M, Herder C, Brunner EJ, Strassburger K, Tabak AG, Roden M et al.
Macrophage inhibitory cytokine-1 is increased in individuals before type 2
diabetes diagnosis but is not an independent predictor of type 2 diabetes: the
Whitehall II study. Eur J Endocrinology. 2010; 162: 913-917.
57. Carstensen M, Herder C, Kivimäki M, Jokela M, Roden M, Shipley MJ et al:
Accelerated increase in serum interleukin-1 receptor antagonist starts 6 years
before diagnosis of type 2 diabetes: Whitehall II prospective cohort study.
Diabetes. 2010; 59: 1222-1227.
58. Castro JP, El-Atat FA, McFarlane SI, Aneja A, Sowers JR: Cardiometabolic
syndrome: pathophysiology and treatment. Curr Hypertens Rep. 2003; 5: 393–
401.
http://www.ncbi.nlm.nih.gov/pubmed/?term=Andreozzi%20F%5BAuthor%5D&cauthor=true&cauthor_uid=16952201
http://www.ncbi.nlm.nih.gov/pubmed/?term=Carnevale%20V%5BAuthor%5D&cauthor=true&cauthor_uid=15133750

179
59. Catalan V, Gomez-Ambrosi J, Ramirez B, Rotellar F, Pastor C, Silva C, et al.
Proinflammatory cytokines in obesity: impact of type 2 diabetes mellitus and
gastric bypass. Obes Surg. 2007; 17: 1464-1474.
60. Cecilia C, Wang L, Gurevich I, Draznin B. Insulin affects smooth muscle cell
phenotypes and migration via distinct signaling pathways. Diabetes. 2003; 52:
2562-2569.
61. Centers for Disease Control and Prevention: National diabetes fact sheet, 2011.
www.cdc.gov/diabetes/pubs/pdf/ndfs.
62. Chacon MR, Ferna´ndez-Real J-M, Richart C, Megıa A, Gomez JM, Miranda M
et al. Monocyte Chemoattractant Protein-1 in Obesity and Type 2 Diabetes.
Insulin Sensitivity Study. Obesity. 2007; 15(3): 664-672.
63. Chang L, Chiang S-H, Saltiel AR. Insulin signaling and the regulation of glucose
transport. Mol Med. 2004; 10(7-12): 65-71.
64. Chen BH, Song Y, Ding EL, Roberts CK, Manson JE, Rifai N et al. Circulating
Levels of Resistin and Risk of Type 2 Diabetes in Men and Women: Results
From Two Prospective Cohorts. Diabetes Care. 2009; 32: 329–334.
65. Chen TC, Chimeh F, Lu Z, Mathieu J, Person KS, Zhang A et al: Factors that
influence the cutaneous synthesis and dietary sources of vitamin D. Arch
Biochem Biophys. 2007; 460: 213-217.
66. Chen Y, Swami S, Skowronski R, Coulston A, Reaven G. Differences in post-
prandial lipaemia between patients with normal glucose tolerance and non-insulin
dependent diabetes mellitus. J Clin Endocrinol Metab 1993; 76: 172-177.

180
67. Chijioke A, Adamu AN, Makusidi AM. Mortality pattern among type 2 diabetes
patients in Ilorin, Nigeria. JEDMSA. 2010; 15(2): 1-4.
68. Chng MHY, Alonso MN, Barnes SE, Nguyen KD, Engleman EG. Adaptive
immunity and antigen-specific activation in obesity-associated insulin resistance.
Mediat Inflamm. 2015; vol. 2015, Article ID 593075.
69. Choi KM, Lee J, Lee KW, Seo JA, Oh JH, Kim SG et al: Comparison of serum
concentrations of C-reactive protein, TNF-alpha, and interleukin 6 between
elderly Korean women with normal and impaired glucose tolerance. Diabetes Res
Clin Pract. 2004; 64(2): 99-106.
70. Christensen MH, Scragg RK. Consistent ethnic specific differences in diabetes
risk and vitamin D status in the National Health and Nutrition Examination
Surveys. J Steroid Biochem Mol Biol. 2015. pii: S0960-0760(15)30083-2.
71. Christi WW. Fatty Acids: Methylene-Interrupted Double Bonds, the Scottish Crop
Research
Institute. 2004; 1-8.
72. Chu C-M , Kuo S-F , Hua C-C , Wu S-Y , Chuang D-Y , Wu H-P. Glucose Increases
Interleukin-12
Gene Expression and Production in Stimulated Peripheral Blood Mononuclear Cells of
Type 2
Diabetes Patients. Biomed J. 2014; 37: 293-297.
73. Chuang L-T, Glew RH, Li C-C, VanderJagt DJ, Broyles JS, Ray GM et al.
Comparison of the fatty
acid composition of the serum phospholipids of controls, prediabetics and adults with
type 2 diabetes.
J Diab Mellitus. 2012; 2(4): 393-401.

181
74. Cieslak M, Wojtczak A, Cieslak M. Role of pro-inflammatory cytokines of pancreatic
islets and
Prospect of elaboration of new methods for the diabetes treatment. Acta Biochim Pol.
2015; 62: 15-21.
75. Codorean E, Nichita C, Albulescu L, Răducan E, Popescu ID, Lonită AC et al.
Correlation of XMAP and ELISA cytokine profiles; development and validation
for immunotoxicological studies in vitro. Roum Arch Microbiol Immunol. 2010;
69(1): 13-19.
76. Coleman RA, Lee DP . Enzymes of triacylglycerol synthesis and their
regulation. Prog Lipid Res. 2004; 43: 134-176.
77. Coll T, Eyre E, Rodriguez-Calvo R, Palomer X, Sanchez RM, Merlos W et al.
Oleate Reverses Palmitate-induced Insulin Resistance and Inflammation in
Skeletal Muscle Cells. J Biol Chem. 2008; 283: 11107-11116.
78. Conroy SM, Chai W, Lim U, Franke AA, Cooney RV, Maskarinec G. Leptin,
adiponectin, and obesity among Caucasian and Asian women. Mediators
Inflamm. 2011; 2011: 253580.
79. Contreras AV, Torres N, Tovar AR. PPAR-a as a Key nutritional and
environmental sensor for metabolic adaptation. Adv. Nutr. 2013; 4: 439–452.
80. Corcoran MP, Lamon-Fava S, Fielding RA . Skeletal muscle lipid deposition and
insulin resistance: effect of dietary fatty acids and exercise. Am J Clin Nutr.
2007; 85: 662-677.
81. Cordain L, Eaton SB, Miller JB, Mann N, Hill K. The paradoxical nature of hunter-
gatherer diets:
182
Meat-base, yet not-atherogenic. Eur J Clin Nutr. 2000; 56 (Suppl 1):542–552.
82. Coste TC, Gerbi A, Vague P, Maixent J-M, Pieroni G, Raccah D. Peripheral diabetic
neuropathy
and polyunsaturated fattyacid supplementations: natural sources or biotechnological
needs?
Cell Mol Biol. 2004; 50(7): 845-853.
83. Couper KN, Blount DG, Riley EM. IL-10: The Master Regulator of Immunity to
infection.
J Immunol. 2008; 180: 5771-5777.
84. Crawford MA. Placental Delivery of Arachidonic and Docosahexaenoic Acids:
Implications for
the Lipid Nutrition of Preterm Infants. Am J Clin Nutr. 2000; 71: 275S-284S.
85. D’Adamo E, CaprioS. Type 2 diabetes in youth: epidemiology and
pathophysiology.
Diabetes Care. 2011; 34(2): s161-s165.
86. Dandona P, Mohanty P, Ghanim H, Aljada A, Browne R, Hamouda W et al. The
suppressive effect of dietary restriction and weight loss in the obese on the
generation of reactive oxygen species by leukocytes, lipid peroxidation, and
protein carbonylation. J Clin Endocrinol Metab. 2001; 86: 355-362.
87. Dandona P, Aljada A, Chaudhuri A, Bandyopadhyay A . The potential influence
of inflammation and insulin resistance on the pathogenesis and treatment of
atherosclerosis-related complications in type 2 diabetes. J Clin Endocrinol Metab.
2003; 88: 2422-2429.

183
88. Dandona P, Aljada A, Chaudhuri A, Mohanty P, Garg R. Metabolic syndrome: a
comprehensive perspective based on interactions between obesity, diabetes, and
inflammation. Circulation. 2005; 111: 1448-1454.
89. Dandona P, Weinstock R, Thusu K, Abdel-Rahman E, Aljada A, Wadden T .
Tumor necrosis factor-alpha in sera of obese patients: fall with weight loss. J Clin
Endocrinol Metab. 1998; 83: 2907-2910.
90. Danescu LG, Levy S, Levy J . Vitamin D and diabetes mellitus. Endocr. 2009;
35: 11-17.
91. Danesh J, Kaptoge S, Mann AG, Sarwar N, Wood A, Angleman SB et al. Long-
term interleukin-6 levels and subsequent risk of coronary heart disease: Two new
prospective studies and a systematic review. PLoS Medicine. 2008; 5 (4): e78.
92. Davis SV. Vitamin D Deficiency and Type 2 Diabetes in African Americans: The
Common Denominators. Diabetes Spectrum. 2011; 24(3): 148-153.
93. The DCCT Research Group, The effect of intensive diabetes therapy on the
development and progression of neuropathy. Ann Intern Med. 1995; 122: 561-
568.
94. de Britto RNM, de Quieroz BZ, Pereira DS, di Sabatino SMLA, Oliveira DMG, e
Silva NFM, Pereira LSM. Interleukin-6 plasma levels and socioeconomic status
in Brazilian elderly community-dwelling women. Arch Gerontol Geriatr. 2011,
53(2): 196-199.
95. de Graaff LC, Smit JW, Radder JK. Prevalence and clinical significance of
organ-specific autoantibodies in type 1 diabetes mellitus. Neth J Med. 2007.
65(7): 235-247.
184
96. de Meyts P, Sajid W, Theede A-M, Gauguin L, Aladdin H, Whittaker J. Insulin
and IGF-1 receptor substrate structure and binding mechanism. In: Mechanism of
Insulin Action. Ed. Alan R. Saltiel, Jeffrey E. Pessin. 2007: pg 1-50.
97. de Young L, Yu D, Bateman RM, Brock GB. Oxidative stress and antioxidant
therapy: their impact in diabetes-associated erectile dysfunction. J. Androl. 2004;
25: 830–836.
98. DeFronzo RA. From the Triumvirate to the Ominous Octet: A New Paradigm for
the Treatment of Type 2 Diabetes Mellitus. Diabetes. 2009; 58: 773-795.
99. DeFronzo RA, Tripathy D. Skeletal muscle insulin resistance is the primary
defect in type 2 diabetes. Diabetes Care. 2009; 32: S157-S163.
100. DeLuca HF. New concepts of vitamin D functions. In Beyond Deficiency. New
Views on the Function and Health Effects of Vitamins (Sauberlich, H. E., and
Machlin, K. J., eds) Ann NY Acad Sci. 1992; 669: 59–69.
101. DeLuca HF. Overview of general physiologic features and functions of vitamin
D. Am J Clin Nutr. 2004; 80: 1689S–1696S.
102. Diagnosis and Classification of Diabetes Mellitus. American Diabetes
Association. Diabetes Care. 2014; 37(Suppl. 1).
103. Dolan E, Stanton A, Thijs L, Hinedi K, Atkins N, McClory S. Superiority of
ambulatory over clinic blood pressure measurement in predicting mortality: the
Dublin outcome Study. Hypertension. 2005; 46(1): 156-161.
104. Donath MY. Inflammation as a sensor of metabolic stress in obesity and type 2
diabetes. Endocrinology. 2011; 152(11): 4005-4006.
185
105. Donath MY, Størling J, Maedler K, Mandrup-Poulsen T. Inflammatory mediators
and islet beta-cell failure: a link between type 1 and type 2 diabetes. J Mol Med.
2003; 81: 455-470.
106. Draznin B. Molecular Mechanisms of Insulin Resistance: Serine Phosphorylation
of Insulin Receptor Substrate-1 and Increased Expression of p85α The Two Sides
of a Coin. Diabetes. 2006; 55: 2392–2397.
107. Duncan BB, Schmidt MI, Chambless LE, Folsom AR, Carpenter M, Heiss G.
Fibrinogen, other putative markers of inflammation, and weight gain in middle-
aged adults-the ARIC study. Atherosclerosis Risk in Communities. Obes Res.
2000; 8: 279-286.
108. Durazo-Arvizu RA, Aloia JF, Dugas LR, Tayo BO, Shoham DA, Bertino AM et
al. 25-hydroxyvitamin D levels in African American and Nigerian women. Am J
Hum Biol. 2013; 25(4): 560-562.
109. Durazo-Arvizu RA, Camacho P, Bovet P, Forrester T, Lambert EV, Plange-
Rhule J et al. 25-Hydroxyvitamin D in African-origin populations at varying
latitudes challenges the construct of a physiologic norm. Am J Clin Nutr. 2014;
100(3): 908-914.
110. Eaton BS. The ancestral human diet: what was it and should it be a paradigm for
contemporary nutrition? Proc Nutr Soc. 2006; 65: 1-6.
111. Eaton SB, Eaton SB 3rd, Konner MJ, Shostak M . An evolutionary perspective
enhances understanding of human nutritional requirements. J Nutr. 1996; 126:
1732-1740.
http://www.ncbi.nlm.nih.gov/pubmed/?term=Carpenter%20M%5BAuthor%5D&cauthor=true&cauthor_uid=10933303
186
112. Eaton SB, Eaton SB 3rd, Sinclair AJ, Cordain L, Mann NJ . Dietary intake of
long-chain polyunsaturated fatty acids during the paleolithic. World Rev Nutr
Diet. 1998; 83: 12-23.
113. Ebesunun MO, Adetunji KJ, Obajobi EO. Evaluation of Essential Fatty Acids,
Folic Acid and Vitamin B12 in Type 2 Diabetes Mellitus. N Y Sci J 2012; 5(8):
56-64.
114. Eck MG Wynn JO, Carter WJ, Faas FH. Fatty acid desaturation in experimental
diabetes mellitus. Diabetes. 1979; 28: 479-485.
115. Edidin M. The state of lipid rafts: from model membranes to cells. Annu Rev
Biophys Biomol Struct. 2003; 32: 257-283.
116. Eggemoen ÅR, Knutsen KV, Dalen I, et al. Vitamin D status in recently arrived
immigrants from Africa and Asia: a cross-sectional study from Norway of
children, adolescents and adults. BMJ Open 2013; 3: e003293.
117. Eknoyan G, Nagy J. A history of diabetes mellitus or how a disease of the
kidneys evolved into a kidney disease. Adv Chronic Kidney Dis. 2005; 12(2):
223-229.
118. Ekpo GL, Johnson JT, Hemen TJ, Odey MO, Luke UO, Eyo RA et al. Renal and
hepatocellular effects of chronic red palm oil consumption. Int J Sci Technol.
2012, 2(8): 539-542.
119. Emken EA, Adlof RO, Rakoff H, Rohwedder WK. Metabolism of deuterium-
labelled linolenic, linoleic, oleic, stearic and palmitic acid in human subjects. In:
Baillie TA, Jones JR, eds. Synthesis and application of isotopically labeled
compounds 1988. Amsterdam: Elsevier Science Publishers, 1989: 713-716.

187
120. Ennis ED, Stahl EJVB, Kreisberg RA: The hyperosmolar hyperglycemic
syndrome. Diabetes Rev. 1994; 2: 115–126.
121. Erridge C, Samani NJ. Saturated fatty acids do not directly stimulate Toll-like
receptor signaling. Arterioscler Thromb Vasc Biol. 2009; 29: 1944 –1949.
122. Escobedo-de la Pena J, Buitron-Granados LV, Ramirez-Martinez JC, Chavira-
Mejia R, Schargrodsky H, Champagne BM. Diabetes in Mexico. CARMELA
Study. Cir Cir. 2011; 79: 394-401.
123. Eugene J. Leopold. Aretaeus the Cappadocian. Diabetes; Its Medical and Cultural
History. 1989, pp 125-140.
124. Farese RV, Sajan MP. Metabolic functions of atypical protein kinase C: “Good”
and “bad” as defined by nutritional status. Am J Physiol Endocrinol Metab. 2010;
298: E385–E394.
125. Fedele D. Therapy insight: sexual and bladder dysfunction associated with
diabetes mellitus. Nat Clin Pract Urol. 2005; 2: 282–290.
126. Feher MD and Richard W. Lipids and lipid disorders. 1st Edn. 1991. Gower
Medical Publishing, London.
127. Feldman M. Development of anti-TNF therapy for rheumatoid arthritis. Nat Rev
Immunol. 2002; 2: 364-371.
128. Feller SE, Gawrisch K, MacKerell AD Jr. Polyunsaturated fatty acids in lipid
bilayers: intrinsic and environmental contributions to their unique physical
properties. J Am Chem Soc. 2002; 124: 318-326.
129. Fernandez-Real JM, Pickup JC. Innate immunity, insulin resistance and type 2
diabetes. Trends Endocrinol Metab. 2008; 19: 10-16.

188
130. Ferrucci L, Cherubini A, Bandinelli S, Benedetta B, Corsi A, Lauretani F et al.
Relationship of plasma polyunsaturated fatty acids to circulating inflammatory
markers. J Clin Endocrinol Metab. 2006; 91: 439-446.
131. Festa A, D'Agostino R Jr, Tracy RP, Haffner SM; Insulin Resistance
Atherosclerosis Study . Elevated levels of acute-phase proteins and plasminogen
activator inhibitor-1 predict the development of type 2 diabetes: the insulin
resistance atherosclerosis study. Diabetes. 2002; 51: 1131-1137.
132. Fishman D, Faulds G, Jeffery R, Mohamed-Ali V, Yudkin JS, Humphries S,
Woo P. The effect of novel polymorphisms in the interleukin-6 (IL-6) gene on
IL-6 transcription and plasma IL-6 levels, and an association with systemic-onset
juvenile chronic arthritis. J Clin Invest 1998; 102: 1369-1376.
133. Flegal KM, Carroll MD, Ogden CL, Johnson CL . Prevalence and trends in
obesity among US adults, 1999-2000. JAMA. 2002; 288: 1723-1727.
134. Flores M, Macias N, Rivera M, Lozada A, Barquera S, Rivera-Dommarco et al.
dietary patterns in Mexican adults are associated with risk of being overweight or
obese. J Nutr. 2010; 140: 1869-1873.
135. Forouhi NG, Koulman A, Sharp SJ, Imamura F, Kroger J, Schulze MB, et al.
Differences in the prospective association between individual plasma
phospholipid saturated fatty acids and incident type 2 diabetes: the EPIC-InterAct
case-cohort study. Lancet Diabetes Endocrinol. 2014; 2(10): 810–818.
136. Fritsche J, Mondal K, Ehrnsperger A, Andreesen R, Kreutz M. Regulation of 25-
hydroxyvitamin D3-1-hydroxylase and production of 1,25-dihydroxyvitamin D3
by human dendritic cells. Blood. 2003; 102: 3314-3316.

189
137. Fröjdö S, Vidal H, Pirola L. Alterations of insulin signaling in type 2 diabetes: A
review of the current evidence from humans. Biochim Biophys Acta. 2009; 1792:
83–92.
138. Gadina M, Hilton D, Johnston JA. Signaling by type I and II cytokine receptors:
Ten years after. Curr Opin Immunol. 2001; 13: 363-373.
139. Gagliardi L, Wittert G. Management of obesity in patients with type 2 diabetes
mellitus. Curr Diabetes Rev. 2007; 3: 95– 101.
140. Garbay B, Heape AM, Sargueil F, Cassagne C. Myelin synthesis in the peripheral
nervous system. Prog Neurobiol. 2000; 61: 267-304.
141. Genc H, Karadurmus N, Kisa U, Tapan S, Naharci I, Sonmez A et al.
Transforming growth factor b (TGF-b) levels in otherwise healthy subjects with
impaired glucose tolerance. Polish Journal of Endocrinology. 2010; 91(6): 691-
694.
142. George JA, Norris SA, van Deventer HE, Pettifor JM, Crowther NJ. Effect of
adiposity, season, diet and calcium or vitamin D supplementation on the vitamin
D status of healthy urban African and Asian-Indian adults. Br J Nutr. 2014;
112(4): 590-599.
143. Ghadiri-Anari1 A, Behjati J, Esteghamati A, Esfahanian F, Khazaiipoor Z,
Nakhjavani M. Correlation between oxidized-LDL and interleukin-6 in type 2
diabetic patients. J Diabetes Metab Disord. 2011; 10:1-7.
144. Giannoukakis N, , Rudert WA, Ghivizzani SC, Gambotto A, Ricordi C, Trucco
M, et al. Adenoviral gene transfer of the interleukin-1 receptor antagonist protein
to human islets prevents IL-1beta-induced beta-cell impairment and activation of
islet cell apoptosis in vitro. Diabetes. 1999; 48: 1730-1736.
http://www.ncbi.nlm.nih.gov/pubmed/?term=Pettifor%20JM%5BAuthor%5D&cauthor=true&cauthor_uid=24877635

190
145. Gimeno D, Brunner EJ, Lowe GD, Rumley A, Marmot MG, et al. Adult
socioeconomic position, C-reactive protein and interleukin-6 in the Whitehall II
prospective study. Eur J Epidemiol. 2007; 22: 675–683.
146. Giulietti A, van Etten E, Overbergh L, Stoffels K, Bouillon R, Mathieu C et al.
Monocytes from type 2 diabetic patients have a pro-inflammatory profile. 1, 25-
Dihydroxyvitamin D(3) works as anti-inflammatory. Diabetes Res Clin Pract.
2007; 77: 47-57.
147. Giulietti A, Gysemans C, Stoffels K, van Etten E, Decallonne B, Overbergh L et
al. Vitamin D deficiency in early life accelerates Type 1 diabetes in non-obese
diabetic mice. Diabetologia. 2004; 47(3): 451-462.
148. Goldsby RA, Kindt TJ, Osborne BA. Immunology, 5th edn. 2003; pp. 154-155, 338-
340, 346-348,
A-1 – A-6, W.H. Freeman, London.
149. Gomes KB, Rodrigues KF, Fernandes AP. The Role of Transforming Growth Factor-
Beta in
Diabetic Nephropathy. World J Med Genet. 2014; 2014: 1-6.
150. Gomna A, Rana K. Inter-household and intra-household patterns of fish and meat
consumption in
fishing communities in two states in Nigeria. British J Nutr. 2007; 97: 145–152.
151. González-Molero I, Rojo-Martínez G, Morcillo S, Gutiérrez-Repiso C, Rubio-
Martín E, Cruz Almaraz M et al. Vitamin D and incidence of diabetes: A
prospective cohort study. Clinical Nutrition. 2012; 31: 571-573.
http://www.ncbi.nlm.nih.gov/pubmed/?term=Overbergh%20L%5BAuthor%5D&cauthor=true&cauthor_uid=17112620
http://www.ncbi.nlm.nih.gov/pubmed/?term=Giulietti%20A%5BAuthor%5D&cauthor=true&cauthor_uid=14758446

191
152. Gregor MF, Hotamisligil GS . Thematic review series: Adipocyte Biology.
Adipocyte stress: the endoplasmic reticulum and metabolic disease. J Lipid Res.
2007; 48: 1905-1914.
153. Gregori S, Giarratana N, Smiroldo S, Uskokovic M, Adorini L: A 1alpha,25-
dihydroxyvitamin D(3) analog enhances regulatory T-cells and arrests
autoimmune diabetes in NOD mice. Diabetes. 2002; 51: 1367-1374.
154. Griffin MD, Lutz W, Phan VA, Bachman LA, McKean DJ, Kumar R et al:
Dendritic cell modulation by 1alpha,25 dihydroxyvitamin D3 and its analogs: a
vitamin D receptor-dependent pathway that promotes a persistent state of
immaturity in vitro and in vivo. Proc Natl Acad Sci. USA. 2001; 98: 6800-6805.
155. Guadarrama-Lopez AL, Valdes-Ramos R, Kaufer-Horwitz M, Harbige LS,
Contreras I, Martinez-Carillo BE. Relationship between fatty acids habitual
intake and early inflammation biomarkers in individuals with and without type 2
diabetes in Mexico. Endocrine Metab & Immune Dis- Drug Targets. 2015; 15:
234-241.
156. Gurr M, Harwood, Frayn K. Lipid biochemistry “An introduction”. 5th
edn.
2002. Blackwell Science Ltd.
157. Hajer GR, van Haeften TW, Visseren FL. Adipose tissue dysfunction in obesity,
diabetes, and vascular diseases. Eur Heart J. 2008; 29(24): 2959-2971.
158. Hamilton BE, Ventura SJ. Fertility and abortion rates in the United States, 1960–
2002. Int. J Androl. 2006; 29: 34–45.
159. Han CY, Kargi AY, Omer M, Chan CK, Wabitsch M, O’Brien KD, Wight TN,
Chait A. Differential effect of saturated and unsaturated free fatty acids on the
generation of monocyte adhesion and chemotactic factors by adipocytes:

192
dissociation of adipocyte hypertrophy from inflammation. Diabetes. 2010; 59:
386 –396.
160. Hansen, AE. Role of Linoleic Acid in Infant Nutrition, Clinical and Chemical Study of
428 Infants
Fed on Milk Mixtures Varying in Kind and Amount of Fat. Pediatrics. 1963; 31: 171-
172.
161. Harbige LS, Layward L, Morris-Downes MM, Dumonde DC, Amor S. The
protective effects of omega-6 fatty acids in experimental autoimmune
encephalomyelitis (EAE) in relation to transforming growth factor-beta 1 (TGF-
β1) up-regulation and increased prostaglandin E2 (PGE2) production. Clin Exp
Immunol. 2000; 122(3): 445–452.
162. Harbige LS. Fatty Acids, the Immune Response, and Autoimmunity: A Question of n-
6 Essentiality
and the Balance between n-6 and n-3. Lipids. 2003; 38: 4, 323-340.
163. Harith HH, Morris MJ, Kavurma MM. On the TRAIL of obesity and diabetes. Trends
in Endocrinology
and Metabolism. 2013; 24(11): 578-587.
164. Harris M, Taylor G. Medical statistics made easy. Taylor and Francis e-library
edn. Martin Dunitz, an imprint of the Taylor and Francis Group, London & New
York. 2004.
165. Harsimran K, Pal Singh AA, Guruvinder S, Sharda S, Vasudha S. Plasma
monocyte chemoattractant protein-1 as risk marker in type 2 diabetes mellitus
and coronary artery disease. North Indians Diab Vasc Dis Res. 2009; 6(4): 288–
290.

193
166. Haynes BF, Fauci AS. in Principles of Internal Medicine/ 2001; pp. 1805-1830,
The Mc Graw-Hill Companies, Inc., New York.
167. Health Report, WHO Regional Office. WHO, Brazaville, 2006.
168. Hedley AA, Ogden CL, Johnson CL, Carroll MD, Curtin LR, Flegal KM .
Prevalence of overweight and obesity among US children, adolescents, and
adults, 1999-2002. JAMA. 2004; 291: 2847-2850.
169. Henry HL, Bouillon R, Norman AW, Gallagher JC, Lips P, Heaney RP et al.
14th Vitamin D workshop consensus on vitamin D nutritional guidelines. J
Steroid Biochem Mol Biol. 2010; 121: 4–6.
170. Henninger J, Hammerstedt A, Rawshani A, Eliasson B. Metabolic predictors of
impaired glucose tolerance and type 2 diabetes in a predisposed population – A
prospective cohort study. BMC Endocrine Dis. 2015; 15: 51.
171. Herder C, Carstensen M, Ouwens DM. Anti-inflammatory cytokines and risk of
type 2 diabetes. Diab Obes & Metab. 2013; 15(3): 39-50.
172. Herder C, Muller-Scholze S, Rating P, Koenig W, Thorand B, Haastert B et al.
Systemic monocyte chemoattractant protein-1 concentrations are independent of
type 2 diabetes or parameters of obesity: results from the Cooperative Health
Research in the Region of Augsburg Survey S4 (KORA S4).
Eur J Endocrinol. 2006; 154: 311–317.
173. Herder C, Zierer A, Koenig W, Roden M, Meisinger C, Thorand B et al:
Transforming growth factor-beta1 and incident type 2 diabetes: results from the
MONICA/KORA case-cohort study, 1984-2002. Diabetes Care. 2009; 32:1921-
1923.

194
174. Hodge AM, English DR, O’Dea K, Sinclair AJ, Makrides M, Gibson RA et al.
Plasma phospholipids and dietary fatty acids as predictors of type 2 diabetes:
intpreting the role of linoleic acid. Am J Clin Nutr. 2007; 86: 189-197.
175. Holick M F. vitamin D deficiency. N Engl J Med. 2007; 357: 266–281.
176. Holick MF. Environmental factors that influence the cutaneous production of
vitamin D. Am J Clin Nutr. 1995; 61: 638S – 645S.
177. Holick MF, MacLaughlin JA, Doppelt SH. Regulation of cutaneous previtamin
D3 photosynthesis in man: skin pigment is not an essential regulator. Science.
1981; 211: 590 –593.
178. Holman RT. A Case of human linolenic acid deficiency involving neurological
abnormalities.
Am. J. Clin. Nutr. 1982; 35: 617-623.
179. Hong EG, Ko HJ, Cho YR et al. Interleukin-10 prevents diet-induced insulin resistance
by
attenuating macrophage and cytokine response in skeletal muscle. Diabetes 2009; 58:
2525–2535.
180. Horlick MF. Vitamin D: importance in the prevention of cancers, type 1 diabetes,
heart disease, and osteoporosis. Am J Clin Nutr. 2004; 79: 362-371.
181. Høstmark AT, Haug A. Percentages of oleic acid and arachidonic acid are
inversely related in hospholipids of human sera. Lipids Health Dis. 2013; 12:
106.
195
182. Hotamisligil GS. Role of endoplasmic reticulum stress and c-Jun NII2-terminal
kinase pathways in inflammation and origin of obesity and diabetes. Diabetes.
2005; 54(suppl.2): S73-S78.
183. Hotamisligil GS, Shargill NS, Spiegelman BM. Adipose expression of tumor
necrosis factor-alpha: direct role in obesity-linked insulin resistance. Science.
1993; 259: 87-91.
184. Hotamisligil GS. Endoplasmic reticulum stress and the inflammatory basis of
metabolic disease.
Cell. 2010; 140: 900-917.
185. Hotamisligil GS. Inflammation and metabolic disorders. Nature. 2006; 444: 860-
867.
186. Hotamisligil GS. Tumor necrosis factor (TNF-a) alpha inhibits signaling from the
insulin receptor. Proc Natl Acad Sci USA 1994; 91: 4854–4858.
187. Hovens MMC, Van de Laar FA, Cannegieter SC, Vandenbroucke JP.
Acetylsalicylic acid (Aspirin) for primary prevention of cardiovascular disease in
type 2 Diabetes Mellitus. (protocol) Cochrane Database of Systematic Reviews
2005, Issue 3. Art. No.: CD005446.
188. Hsieh PS, Lu KC, Chiang CF, Chen CH. Suppressive effect of COX2 inhibitor
on the progression of adipose inflammation in high-fat-induced obese rats. Eur J
Clin Invest. 2010; 40:164–171.
189. Hsueh WA, Wyne K. Renin-Angiotensin-Aldosterone System in Diabetes and
Hypertension. J Clin Hypertens (Greenwich). 2011; 13: 224–237.

196
190. Hu FB, Manson JE, Stampfer MJ, Colditz G, Liu S, Solomon CG, Willett WC.
Diet, lifestyle, and the risk of type 2 diabetes mellitus in women. N Engl J Med.
2001; 345: 790–797.
191. Huan Y, DeLoach S, Daskalakis C, Dunn SR, Sharma K, Falkner B. Regulation
of Transforming Growth Factor-β1 by Insulin in Prediabetic African Americans.
Kidney Int. 2010; 78(3): 318-324.
192. Hui-bing H, Migita K , Miyashita T, Maeda Y, Nakamura M, Yatsuhashi H et al.
Relationship between serum resistin concentrations and inflammatory markers in
patients with type 2 diabetes mellitus. Metabolism. 2006; 55(12): 1670–1673.
193. Hummasti S, Hotamisligil GS. Endoplasmic reticulum stress and inflammation in
obesity and diabetes. Circ Res. 2010; 107; 579-591.
194. Ibarra CT, Rocha Jde J, Hernández RO, Nieves RE, Leyva RJ. Prevalence of
peripheral neuropathy among primary care type 2 diabetic patients]. Rev Med
Chil. 2012; 140: 1126–1131.
195. Illig T, Bongardt F, Schöpfer A, Müller-Scholze S, Rathmann W, Koenig W,
Thorand B, Vollmert C, Holle R, Kolb H, Herder C. Significant association of the
interleukin-6 gene polymorphisms C-174G and A-598G with type 2 diabetes. J
Clin Endocrinol Metab 2004; 89: 5053-5058.
196. Imamura S, Morioka T, Yamazaki Y, Numaguchi R, Urata H, Motoyama K et al.
Plasma polyunsaturated fatty acid profile and delta-5 desaturase activity are
altered in patients with type 2 diabetes. Metabolism. 2014; 63(11): 1432-1438.
197. Innis SM, Sprecher H, Hachey D, Edmond J, Anderson RE. Neonatal Polyunsaturated
Fatty
Acid Metabolism, Lipids. 1999; 34: 139-149.
197
198. International Diabetes Federation, 2001. (www.idf.org/webdata/docs/).
199. International Diabetes Federation, 2014. (www.idf.org/membership/afr/nigeria).
200. Ishii H, Suzuki H, Baba T, Nakamura K, Watanabe T: Seasonal variation of
glycemic control in type 2 diabetic patients. Diabetes Care. 2001; 24: 1503.
201. Isidro ML, Ruano B. Bone disease in diabetes. Curr Diabetes Rev. 2010; 6(3):
144- 155.
202. Jablonski NG, Chaplin G. Human skin pigmentation, migration and disease
susceptibility. Philos Trans R Soc Lond B Biol Sci. 2012; 367(1590): 785-792.
203. Jacobs S, Jager S, Jansen E, Peter A, Stefan N, Boeing H et al. Associations of
erythrocyte fatty acids in the de novo lipogenesis pathway with proxies of liver
fat accumulation in the EPIC-Potsdam Study. PLOS ONE. 2015;
10(5):e0127368.
204. James PA, Oparil S, Carter BL, et al. 2014 Evidence-Based Guideline for the
Management of High Blood Pressure in Adults: Report From the Panel Members
Appointed to the Eighth Joint National Committee (JNC 8). JAMA. 2014;
311(5): 507-520.
205. Jensen PB, Schisler JC, Knop F, German M, and Newgard CB. The transcription
factor Nkx6.1 plays a role in defining beta cell phenotype by suppressing
glucagon expression. Diabetes. 2002; 51(suppl 2): A377-A377.
206. Joachim S, Anja K, Matthias M, Kurt H, Bergmann MM, Michael R, et al.
Inflammatory cytokines and the risk to develop type 2 diabetes. Diabetes. 2003;
52: 812–817.
198
207. Joffe YT , Collins M, Goedecke JH. The Relationship between Dietary Fatty
Acids and Inflammatory Genes on the Obese Phenotype and Serum Lipids.
Nutrients. 2013; 5: 1672-1705.
208. Joslin E. Arteriosclerosis and diabetes. Ann Clin Med 1927; 5: 1061-79.
209. Jump DB. Fatty acid regulation of hepatic lipid metabolism. Curr Opin Clin Nutr
Metab Care. 2011; 14(2): 115-120.
210. Kaptoge S, Seshasai SRK, Gao P, Freitag DF, Butterworth AS, Borglykke A et
al. Inflammatory cytokines and risk of coronary heart disease: new prospective
study and updated meta-analysis. Eur Heart J. 2014; 35(9): 578–589.
211. Karlsen AE, Rønn SG, Lindberg K, Johannesen J, Galsgaard ED, Pociot F et al.
Suppressor of cytokine signaling 3 (SOCS-3) protects β-cells against interleukin-
1β- and interferon-γ mediated toxicity. PNAS. 2001; 98(21): 12191–12196.
212. Kamide K, Rakugi H, Ogihara T, Nagai M, Takiuchi S, Matsukawa N et al .
Insulin-mediated modulation of the endothelial reninangiotensin system and
vascular cell growth. J Hypertens. 2004; 22: 121-127.
213. Keen H, Payan J, Allawi J, Walker J, Jamal GA, Weir A et al. Treatment of
diabetic neuropathy with γ-linolenic acid. Diabetes Care. 1993; 16: 8-15.
214. Kemp K, Akanmori BD, Hviid L. West African donors have high percentage of
activated cytokine producing T-cells that are prone to apoptosis Clin Exp
Immunol. 2001; 126: 69-75.

199
215. Khaw K-T, Friensen MD, Riboli E, Luben R, Wareham N. Plasma phospholipid
fatty acid concentration and incident coronary heart disease in men and women:
The EPIC-Norfolk Prospective Study. PLoS Med. 2012; 9(7): e1001255.
216. Kimlin MG, Olds WJ, Moore MR. Location and vitamin D synthesis: is the
hypothesis validated by geophysical data? J Photochem Photobiol. 2007; B86:
234-239.
217. King GL. The role of inflammatory cytokines in diabetes and its complications. J
Periodontol. 2008; 79: 1527-1534.
218. Kintscher U, Hartge M, Hess K, Foryst-Ludwig A, Clemenz M, Wabitsch M et al.
T-lymphocyte infiltration in visceral adipose tissue: a primary event in adipose
tissue inflammation and the development of obesity-mediated insulin resistance.
Arterioscler Thromb Vasc Biol. 2008; 28: 1304-1310.
219. Kles KA, Vinik AI. Pathophysiology and treatment of diabetic peripheral
neuropathy: the case for diabetic neurovascular function as an essential
component. Curr Diabetes Rev. 2006; 2(2):131-45.
220. Knowler WC, Barrett-Connor E, Fowler SE, Hamman RF, Lachin JM, Walker
EA, Nathan DM. Diabetes Prevention Program Research Group. N Engl J Med.
2002; 346: 393–403.
221. Knop FK, Taylor R. Mechanism of metabolic advantages after bariatric surgery.
Diabetes Care. 2013; 36: S287-S291
222. Kobashi C, Asamizu S, Ishiki M, Iwata M, Usui I, Yamazaki K et al. Inhibitory
effect of IL-8 on insulin action in human adipocytes via MAP kinase pathway. J
Inflamm. 2009; 6: 25.
200
223. Kohler C, Adegnika AA, van der Linden R, Agnandji ST, Chai SK, Luty AJF et
al. Comparison of immunological status of African and European cord blood
mononuclear cells. Pediatr Res. 2008; 64: 631-636.
224. Koletzko B, Cetin I, Brenna JT for the Perinatal Lipid Intake Working Group.
Dietary fat intakes for pregnant and lactating women. Br J Nutr. 2007; 98: 873-
877.
225. Korn T, Bettelli E, Oukka M, Kuchroo VK. 2009. IL-17 and Th17 cells. Annu
Rev Immunol 27: 485 –517.
226. Kostoglou-Athanassiou I, Athanassiou P, Gkountouvas A, Kaldrymides P.
Vitamin D and glycemic control in diabetes mellitus type 2. Ther Adv Endocrinol
Metab. 2013; 4(4): 122–128.
227. Krachler B, Norberg M, Eriksson JW, Hallmans G, Johansson I, Vessby B,
Weinehall L, Lindahl B. Fatty acid profile of the erythrocyte membrane
preceding development of Type 2 diabetes mellitus. Nutr Metab Cardiovasc Dis.
2008; 18: 503-510.
228. Kroger J, Schulze MB. Recent insights into the relation of ∆5 desaturase and ∆6
desaturase activity to the development of type 2 diabetes. Curr Opin Lipidol.
2012; 23: 4-10.
229. Lago MR, Singh PP, Nesto RW. Diabetes and hypertension. Nat Clin Pract
Endocrinol Metab. 2007; 3(10): 667.
230. Larsen CM, Faulenbach M, Vaag A, Vølund A, Ehses JA, Seifert B et al .
Interleukin-1-receptor antagonist in type 2 diabetes mellitus. NEJM. 2007; 356:
1517-1526.
http://www.ncbi.nlm.nih.gov/pubmed/?term=Eriksson%20JW%5BAuthor%5D&cauthor=true&cauthor_uid=18042359
http://www.ncbi.nlm.nih.gov/pubmed/?term=Johansson%20I%5BAuthor%5D&cauthor=true&cauthor_uid=18042359
201
231. Lauretani F, Bandinelli S, Benedetta B, Cherubini A, Iorio AD, Blè A, et al.
Omega-6 and omega-3 fatty acids predict accelerated decline of peripheral nerve
function in older persons. Eur J Neurol. 2007 Jul; 14(7): 801–808.
232. Lee J. Adipose tissue macrophages in the development of obesity induced
inflammation, insulin resistance and type 2 diabetes. Arch Pharm Res. 2013; 36:
208-222.
233. Lee JY, Sohn KH, Rhee SH, Hwang D. Saturated fatty acids, but not unsaturated
fatty acids, induce the expression of cyclooxygenase-2 mediated through Toll-
like receptor 4. J Biol Chem. 2001; 276: 16683-16689.
234. Lee JY, Ye J, Gao Z, Youn HS, Lee WH, Zhao L, Sizemore N, Hwang DH.
Reciprocal modulation of Toll-like receptor-4 signaling pathways involving
MyD88 and phosphatidylinositol 3-kinase/AKT by saturated and polyunsaturated
fatty acids. J Biol Chem. 2003; 278: 37041-37051.
235. Lee KW, Lip GY. The role of omega-3 fatty acids in the secondary prevention of
cardiovascular disease. QJM. 2003; 96: 465-480.
236. Lefèbvre P, Paquot N, Scheen. Rôle du foie dans l’homéostasie glucidique. Une
re lecture des travaux de Claude Bernard. Journées de Diabétologie. 1996,
Flammarion Médecine-Sciences, Paris.
237. LeRoith D. Dyslipidemia and glucose dysregulation in overweight and obese
patients. Clin Cornerstone. 2007; 8: 38–52.
238. Lewis EJ, Hunsicker LG, Clarke WR, Berl T, Pohl MA, Lewis JB et al .
Renoprotective effect of the angiotensin-receptor antagonist irbesartan in patients
with nephropathy due to type 2 diabetes. N Engl J Med. 2001; 345(12): 851-860.
http://www.ncbi.nlm.nih.gov/pubmed/?term=Lauretani%20F%5BAuthor%5D&cauthor=true&cauthor_uid=17594339
http://www.ncbi.nlm.nih.gov/pubmed/?term=Benedetta%20B%5BAuthor%5D&cauthor=true&cauthor_uid=17594339

202
239. Li C, Ford ES, McGuire LC, Mokdad AH, Little RR, Reaven GM et al. Trends in
hyperinsulinemia among nondiabetic adults in the US. Diabetes Care. 2006;
29(11): 2396-2402.
240. Li C, Ford ES, Zhao G, Mokdad AH. Prevalence of pre-diabetes and its
association with clustering of cardiometabolic risk factors and hyperinsulinemia
among U.S. adolescents: National Health and Nutrition Examination Survey
2005-2006. Diabetes Care. 2009; 32(2): 342-347.
241. Li S, Shin H, Ding EL, van Dam RM. Adiponectin Levels and Risk of Type 2
Diabetes: A Systematic Review and Meta-analysis. JAMA. 2009; 302(2) :179-
188.
242. Liamis G, Liberopoulos E, Barkas F, Elisaf M. Diabetes mellitus and electrolyte
disorders. World J Clin Cases. 2014; 2(10): 488–496.
243. Liamis G, Milionis HJ, Elisaf M. Hyponatremia in patients with infectious
diseases. J Infect. 2011; 63(5): 327-335.
244. Liamis G, Rodenburg EM, Hofman A, Zietse R, Stricker BH, Hoorn EJ et al.
Electrolyte disorders in community subjects: prevalence and risk factors. Am J
Med. 2013; 126: 256 – 263.
245. Lim EL, Hollingsworth KG, Aribisala BS, Chen MJ, Mathers JC, Taylor R.
Reversal of type 2 diabetes: normalisation of beta cell function in association
with decreased pancreas and liver Triacylglycerol. Diabetologia. 2011; 54: 2506
– 2514.
246. Lin Y, Sun Z. Current views on type 2 diabetes. J Endocrinol. 2010; 204: 1–11.

203
247. Liu J, Divoux A, Sun J, Zhang J, Clément K, Glickman JN et al . Genetic
deficiency and pharmacological stabilization of mast cells reduce diet-induced
obesity and diabetes in mice. Nat Med. 2009; 15: 940-945.
248. Liu PT, Stenger S, Li H, Wenzel L, Tan BH, Krutzik SR et al . Toll-like receptor
triggering of a vitamin D-mediated human antimicrobial response. Science. 2006;
311: 1770-1773.
249. Liu S, Tinker L, Song Y, Rifai N, Bonds DE, Cook NR, Heiss G, Howard
BV, Hotamisligil GS, Hu FB, Kuller LH, Manson JE. A prospective study of
inflammatory cytokines and diabetes mellitus in a multiethnic cohort of
postmenopausal women. Arch Intern Med. 2007; 167(15): 1676–1685.
250. Locksley R M, Killeen N, Lenardo M J. The TNF and TNF receptor
superfamilies: Integrating mammalian biology. Cell. 2001; 104: 487-501.
251. Lorente-Cebrián S, Eriksson A, Dunlop T, Mejhert N, Dahlman I, Aström G, et
al. Differential effects of 1α,25-dihydroxycholecalciferol on MCP-1 and
adiponectin production in human white adipocytes. Eur J Nutr. 2012; 51:335–42.
252. Lumeng CN, Bodzin JL, Saltiel AR. . Obesity induces a phenotypic switch in
adipose tissue macrophage polarization. J Clin Invest. 2007; 117: 175: 175-184.
253. Luo P, Wang MH. Eicosanoids, β-cell function, and diabetes. Prostaglandins
Other Lipid Mediat. 2011; 95(1-4): 1-10.
254. Luxwolda MF, Kuipers RS, Kema IP, Dijck-Brouwer DAJ, Muskiet FAJ.
Traditionally living populations in East Africa have a mean serum 25-
hydroxyvitamin D concentration of 115 nmol/l. Br J Nutr. 2012; 108: 1557–1561.
204
255. Ma DW, Seo J, Switzer KC, Fan YY, McMurray DN, Lupton JR et al. n-3
PUFA and membrane microdomains: a new frontier in bioactive lipid research. J
Nutr Bioch. 2004; 15: 700-706.
256. Ma W, Wu JHY, Wang Q, Lemaitre RN, Mukamal KJ, Djousse L et al.
Prospective association of fatty acids in the de novo lipogenesis pathway with
risk of type 2 diabetes: the Cardiovascular Health Study. Am J Clin Nutr. 2015;
101: 153-163.
257. McArdle MA, Finucane OM, Connaughton RM, McMorrow AM, Roche HM.
Mechanism of obesity induced inflammation and insulin resistance: insight into
the emerging role of nutritional strategies. Front Endocrinol. 2013; 4(52): 1-23.
258. MacLaughlin JA, Holick MF 1985 Aging decreases the capacity of human skin
to produce vitamin D3. J Clin Invest 76:1536 –1538.
259. Magalhães MEC, Cavalcanti BA, Cavalcanti S. Could pre-diabetes be considered
a clinical condition? Opinions from an endocrinologist and a cardiologist.
Diabetol Metab Syndr. 2010; 2: 2.
260. Malerba G, Schaeffer L, Xumerle L, Klopp N, Trabetti E, Biscuola M et al. SNPs
of the FADS gene cluster are associated with polyunsaturated fatty acids in a
cohort of patients with cardiovascular disease. Lipids. 2008; 43: 289-299.
261. Mantzoros CS, Moschos S, Avramopoulos I, Kaklamani V, Liolios A,
Doulgerakis DE et al. Leptin concentrations in relation to body mass index and
the tumour necrosis factor-alpha system in humans. J Clin Endocrinol Metab.
1997; 82: 3408-3413.
262. Marshak-Rothstein A. Toll-like receptors in systemic autoimmune disease. Nat
Rev Immunol. 2006; 6: 823-835.
http://www.ncbi.nlm.nih.gov/pubmed/?term=McMurray%20DN%5BAuthor%5D&cauthor=true&cauthor_uid=15590275

205
263. Masuo K, Katsuya T, Fu Y, Rakugi H, Ogihara T, Tuck ML et al. Beta2- and
beta3- adrenoceptor polymorphisms are related to the onset of weight gain and
blood pressure elevation over 5 years. Circulation. 2005; 111; 3429-3434.
264. Matayoshi T, Kamide K, Takiuchi S, Horio T, Yoshihara F, Nakamura S et al.
Relationship between insulin resistance and the renin-angiotensin system:
analysis for patients with essential and renovascular hypertension. Clin Exp
Hypertens. 2007; 29: 479-487.
265. Matsushima K, Larsen CG, DuBois GC, Oppenheim JJ. Purification and
characterization of a novel monocyte chemotactic and activating factor produced
by a human myelomonocytic cell line. J Exp Med. 1989; 169:1485–90.
266. Mattei J, Malik V, Wedick NM, Hu FB, Spiegelman D, Willet WC et al.
Reducing the global burden of type 2 diabetes by improving the quality of staple
foods: The Global Nutrition and Epidemiologic Transition Initiative. Global
Health. 2015; 11: 23.
267. Matthieu C, Waer M, Casteels K, Laureys J, Bouillon R. Prevention of type I
diabetes in NOD mice by nonhypercalcemic doses of a new structural analog of
1,25-dihydroxyvitamin D3, KH1060. Endocrinology. 1995; 136: 866-872.
268. Mattila C, Knekt P, Männistö S, Rissanen H, Laaksonen MA, Montonen J et al.
Serum 25-hydroxyvitamin D concentration and subsequent risk of type 2
diabetes. Diabetes Care. 2007; 30: 2569-2570.
269. Mbengue B, Niang B, Niang MS, Varela ML, Fall B, Fall MM et al.
inflammatory cytokine and humoral responses to plasmodium falciparum
glycosylphophatidylinositols correlates with malaria immunity and pathogenesis.
Immun Inflamm Dis. 2016; 4(1): 24-34.

206
270. McGill AT, Stewart JM, Lithander FE, Strik CM, Poppitt SD. Relationships of
low serum vitamin D3 with anthropometry and markers of the metabolic
syndrome and diabetes in overweight and obesity. Nutr J. 2008; 7:4.
271. McGillicuddy FC, Chiquoine EH, Hinkle CC, Kim RJ, Shah R, Roche HM et al.
Interferon gamma attenuates insulin signaling, lipid storage, and differentiation in
human adipocytes via activation of the JAK/STAT pathway. J. Biol. Chem. 2009;
284: 31936 - 31944.
272. McNelis JC, Olefsky JM. Macrophages, immunity and metabolic disease.
Immunity. 2014; 41: 36 – 48.
273. Meddeb N, Sahli H, Chahed M et al. Vitamin D deficiency in Tunisia.
Osteoporos Int. 2005; 16: 180–183.
274. Meek TH, Morton GJ. The role of leptin in diabetes: metabolic effects.
Diabetologia. 2016; 59: 928-932
275. Mehta S, Hunter DJ, Mugusi FM et al. Perinatal outcomes, including mother-to-
child transmission of HIV, and child mortality and their association with maternal
vitamin D status in Tanzania. J Infect Dis. 2009; 200: 1022– 1030.
276. Meigs JB, Hu FB, Rifai N, Manson JE. Biomarkers of endothelial dysfunction
and risk of type 2 diabetes mellitus. JAMA. 2004; 291: 1978-1986.
277. Mihara M, Hashizume M, Yoshida H, Suzuki M, Shiina M. IL-6/IL-6 receptor
system and its role in physiological and pathological conditions. Clin Sci. 2012;
122:143-159.
207
278. Mirza S, Hossain M, Matthews C, Martinez P, Pino P, Gay JL et al. Type 2
diabetes is associated with elevated levels of TNF-alpha, IL-6 and adiponectin
and low levels of leptin in a population of Mexican American: a cross sectional
study. Cytokine. 2012; 57(1): 136-142.
279. Mokdad AH, Ford ES, Bowman BA, Nelson DE, Engelgau MM, Vinicor F et al
. Diabetes trends in the U.S.: 1990-1998. Diabetes Care. 2000; 23: 1278-1283.
280. Mokdad AH, Ford ES, Bowman BA, Dietz WH, Vinicor F, Bales VS et
al. Prevalence of obesity, diabetes, and obesity-related health risk factors,
2001. JAMA. 2003; 289: 76-9.
281. Mokhtar R, Brito A, Holick MF. Vitamin D across the life cycle with special
emphasis on Latin America. Sight and Life. 2013; 27(2): 24-30.
282. Moller DE. Potential role of TNF-alpha in the pathogenesis of insulin resistance
and type 2 diabetes. Trends Endocrinol Metab 2000; 11:212e7.
283. Morimoto Y, Conroy SM, Ollberding NJ, Kim Y, Lim U, Cooney RV et al.
Ethnic differences in serum adipokine and C-reactive protein levels: The
Multiethnic Cohort. Int J Obes. 2014; 38(11): 1416–1422.
284. Mosmann TR, Sad S. The expanding universe of T-cell subsets: Th1, Th2 and
more. Immunol Today. 1996; 17(3): 138-146.
285. Mozaffaria D, Cao H, King IB, Lemaitre RN, Song X, Siscovick DS et al.
Circulating palmitoleic acid and risk of metabolic abnormalities and new onset
diabetes. Am J Clin Nutr. 2010; 92: 1350-1358.

208
286. Mulholland J, Mallidis C, Agbaje I, McClure N. Male diabetes mellitus and
assisted reproduction treatment outcome. Reprod Biomed Online. 2011; 22 (2):
215-219.
287. Muller S, S. Martin, Koenig W, Hanifi-Moghaddam P, Rathmann W, Haastert B
et al. Impaired glucose tolerance is associated with increased serum
concentrations of interleukin-6 and co-regulated acute-phase proteins but not
TNF-α or its receptors. Diabetologia. 2002; 45: 805–812.
288. Murdoch C, Finn A. Chemokine receptors and their role in inflammation and
infectious diseases. Blood. 2000; 95: 3032 – 3043.
289. Nathan DM, Davidson MB, Defronzo RA, Heine RJ, Henry RR, Pratley R et al.
Impaired fasting glucose and impaired glucose tolerance. Diabetes Care. 2007;
30(3): 753-759.
290. Nichols GA, Hillier TA, Brown JB: Progression from newly acquired impaired
fasting glucose to type 2 diabetes. Diabetes Care. 2007; 30:228–233 (figure
corrected in Diabetes Care. 2008; 31(12): 2414).
291. Nicholson G, Hall GM. Diabetes mellitus: new drugs for a new epidemic. Br J
Anaesthesia. 2011; 107: 65-73.
292. Nicos, A. N. (1997) Guidebook to Cytokines and Their Receptors, 1st edn., pp. 2-3,
103-104, 223-226,
The Bath Press Ltd.
293. Noone C, Parkinson M, Dowling DJ, Aldridge A, Kirwan P, Molloy SF et al.
Plasma cytokines, chemokines and cellular immune responses in pre-school
Nigeria children infected with Plasmodium falciparum. Malar J. 2013; 12:5.

209
294. Obesity and overweight. Geneva (Switzerland): World Health Organization;
2014. Available:www.who.int/mediacentre/factsheets/fs311/en/ (accessed 2015,
April 17).
295. Oboh HA, Omofoma CO, Olumese FE, Eiya B. Effects of high carbohydrate low
fat Nigerian-like diet on biochemical indices in Rabbits. Pakistan J Nutr. 2007;
6(4): 399-403.
296. Oghagbon EK, Giménez-Llort L. Sustaining Increase in Life Expectancy in
Africa Requires Active Preventive Measures against Non-Communicable
Diseases. Open J Prev Med. 2014; 4: 283-292.
297. Oh DY, Olefsky JM. G protein coupled receptors as targets for anti-diabetic
therapeutics. Nat Rev. 2016; 15: 161-173.
298. Okazaki R. Diabetes Mellitus and bone metabolism. Clin Calcium. 2011; 21(5):
669-675.
299. Olatunbosun ST, Ojo PO, Fineberg NS, Bella AF. Prevalence of diabetes mellitus
and impaired glucose tolerance in a group of urban adults in Nigeria. J Natl Med
Assoc. 1998; 90: 293-301.
300. Olefsky JM, Glass CK et al. Macrophages, inflammation, and insulin resistance.
Annu Rev Physiol. 2010; 72: 219-246.
301. Oraby SS, Ahmed ES, Farag TS, Zayed AE, Ali NK. Adiponectin as
inflammatory biomarker of chronic obstructive pulmonary disease. Egypt J Chest
Dis Tuberc. 2014; 63: 583–587.

210
302. Otero M, Lago R, Lago F, Casanueva FF, dieguez C, Gomez-Reino JJ et al.
Leptin from fat to inflammation; old questions and new insights. FEBS Letters.
2005; 579(2): 295-301.
303. Ouyang W, Rutz S, Crellin NK,
Valdez PA,
Hymowitz SG. Regulation and
Functions of the IL-10 Family of Cytokines in Inflammation and Disease. Annu
Rev Immunol. 2011; 29: 71-109.
304. Palomer X, González-Clemente JM, Blanco-Vaca F, Mauricio D. Role of vitamin
D in the pathogenesis of type 2 diabetes mellitus. Diabetes Obes Metab.
2008; 10:185–197.
305. Palowsky RJ, Hibbeln JR, Novotny JA, Salem N Jr et al. Physiological
compartmental analysis of alpha-linolenic acid metabolism in adult humans. J
Lipid Res. 2001; 42(8): 1257-1265.
306. Parra-Cabrera S, Stein AD, Wang M, Martorell R, Rivera J, Ramakrishnan U.
Dietary intakes of polyunsaturated fatty acids among pregnant Mexican women.
Matern Child Nutr. 2011; 7: 140-147.
307. Parveen Y, Shaikh SR. The nutritional and clinical significance of lipid rafts.
Curr Opin Clin Nutr & Metab Care. 2010; 13: 156-16.
308. Pereira-Santos M, Costa PRF, Assis AMO, Santos CAST, Santos DB. Obesity
and vitamin D deficiency: a systematic review and meta-analysis. Obes Rev.
2015; 16(4): 341-349.
309. Patel PS, Sharp SJ, Jansen E, Luben RN, Khaw K-T, Wareham NJ et al. Fatty
acids measured in plasma and erythrocyte-membrane phospholipids and derived
by food frequency questionnaire and the risk of new-onset type 2 diabetes: a pilot
211
study in the European Prospective Investigation into Cancer and Nutrition
(EPIC)-Norfolk cohort. Am J Clin Nutr. 2010; 92: 1214-1222.
310. Pickup JC, Crook MA. Is type II diabetes mellitus a disease of the innate immune
system? Diabetologia. 1998; 41: 1241-1248.
311. Pickup JC, Mattock MB , Chusney GD, Burt D. NIDDM as a disease of the
innate immune system: association of acute-phase reactants and interleukin-6
with metabolic syndrome X. Diabetologia. 1997; 40: 1286–1292.
312. Piemonti L, Leone BE, Nano R, Saccani A, Monti P, Maffi P, et al. Human
pancreatic islets produce and secrete MCP-1/CCL2: relevance in human islet
transplantation. Diabetes. 2002; 51:55–65.
313. Pilch PF, Thompson PA, Czech MP. Coordinate modulation of D-glucose
transport activity and bilayer fluidity in plasma membranes derived from control
and insulin-treated adipocytes. Proc Natl Acad Sci USA. 1980; 77(2): 915-918.
314. Pitel S, Raccah D, Gerbi A, Pieroni G, Vague P, Coste TC. At Low Doses, a g-
Linolenic Acid-Lipoic Acid Conjugate Is More Effective Than Docosahexaenoic
Acid-Enriched Phospholipids in Preventing Neuropathy in Diabetic Rats. J. Nutr.
2007; 137: 368–372.
315. Pittas AG, Harris SS, Stark PC, Dawson-Hughes B. The effects of calcium and
vitamin D supplementation on blood glucose and markers of inflammation in
nondiabetic adults. Diabetes Care. 2007; 30: 980–986.
316. Pittas AG, Lau J, Hu FB, Dawson-Hughes B. The role of vitamin D and calcium
in type 2 diabetes: a systematic review and meta-analysis. J Clin Endocrinol
Metab. 2007; 92: 2017–2029.
212
317. Pradham A. Obesity, metabolic syndrome, and type 2 diabetes: inflammatory
basis of glucose metabolic disorders. Nutr Rev. 2007; 65: S152-S156.
318. Pruijm M, Wuerzner G, Maillard M, Bovet P, Renaud C, Bochud M et al.
Glomerular hyperfiltration and increased sodium reabsorptption in subjects with
type 2 diabetes or impaired glucose in a population of the African region.
Nephrol Dial Transplant. 2010; 25: 2225-2231.
319. Pscherer S, Freude T, Forst T, Nussler AK, Braun KF, Ehnert S. Anti-diabetic
treatment regulates pro-fibrotic TGF-β serum levels in type 2 diabetics. Diabetol
Metab Syndr. 2013; 5: 48.
320. Rajamoorthi K, Petrache HI, McIntosh TJ, Brown MF et al. Packing and
viscoelasticity of
polyunsaturated omega-3 and omega-6 lipid bilayers as seen by (2)H NMR
and X-ray
diffraction. J Am Chem Soc. 2005; 125: 1576-1588.
321. Rajkovic N, Zamaklar M, Lalic K, Jotic A, Lukic L, Milicic T et al. Relationship
between Obesity, Adipocytokines and Inflammatory Markers in Type 2 Diabetes:
Relevance for Cardiovascular Risk Prevention. Int J Environ Res Public Health.
2014; 11: 4049-4065.
322. Ramirez-Silva I, Villalpando S, Moreno-Saracho JE, Bernal-Medina D. Fatty
acids intake in the Mexican population. Results of the National Nutrition Survey
2006. Nutr Metab. 2011; 8: 33.
323. Ramlo-Halsted BA, Edelman SV. The natural history of type 2 diabetes: practical
points to consider in developing prevention and treatment strategies. Clinical
Diabetes. 2000;18(2): 80-84.
http://www.ncbi.nlm.nih.gov/pubmed/?term=Petrache%20HI%5BAuthor%5D&cauthor=true&cauthor_uid=15686391

213
324. Reilly MP, Rader DJ. The metabolic syndrome: more than the sum of its parts?
Circulation. 2003; 108: 1546-1551.
325. Rewers M, Hamman RF: Risk factors for non-insulin-dependent diabetes. In
Diabetes in America, 2nd Ed. Haris MI, Cowie CC, Stern MP, Boyko BJ, Reiber
GE, Bennett PH, Eds. NIH Publ. No. 95-1468. Bethesda, Md., National Institutes
of Health, National Institute of Diabetes and Digestive and Kidney Diseases,
1995, pg. 179-220.
326. Rivera CA, Gaskin L, Singer G, Houghton J, Allman M. Western diet enhances
hepatic inflammation in mice exposed to cecal ligation and puncture. BMC
Physiology. 2010; 10: 20.
327. Rodrigues DR, Fernandes RK, Balderramas HD, Penitenti M, Bachiega TF, Calvi
SA et al. Interferon-gamma production by human neutrophils upon stimulation
by IL-12, IL-15 and IL-18 and challenge with Paracoccidioides brasiliensis.
Cytokine. 2014; 69: 102–109.
328. Rodriguez-Rodriguez S, Ruy-Diaz-Reynoso SJA, Vasquez-Lopez R. Tuberculosis
concomitant with diabetes. Revista Medica Del Hospital General De Mexico.
2015; 78(4): 183-187.
329. Roessner C, Paasch U, Kratzsch J, Glander H-J, Grunewald S. Sperm apoptosis
signalling in diabetic men. Reprod Biomed Online. 2012; 25(3): 292-299.
330. Roitt I, Brostoff J, Male D. Immunology, 5th
edn. 1998; pp. 13-30, 63-65, 83, Mosby,
London
331. Rosen CJ, Abrams SA, Aloia JF, Brannon PM, Clinton SK, Durazo-Arvizu J et al.
IOM
214
Committee members respond to endocrine society vitamin D guideline. J Clin
Endocrinol Metab.
2012; 97: 1146-1152.
332. Ross AC, Manson JE, Abrams SA et al. The 2011 report on dietary reference
intakes for calcium and vitamin D from the Institute of Medicine: what clinicians
need to know? J Clinical Endocrinol Metab. 2011; 96: 53–58.
333. Rovin BH, Song H. Chemokine induction by the adipocyte-derived cytokine
adiponectin. Clin Immunol. 2006; 120: 99-105.
334. Sadeghi K, Wessner B , Laggner U , Ploder M , Tamandl D , Friedl J et al.
Vitamin D3 down-regulates monocyte TLR expression and triggers
hyporesponsiveness to pathogen-associated molecular patterns. Eur. J. Immunol.
2006; 36: 361–370.
335. Sadler JBA, Bryant NJ, Gould GW, Welburn CR. Post translational
modifications of GLUT-4 affects its subcellular localization and translocation. Int
J Mol Sci. 2013; 14: 9963-9978.
336. Salmeron J, Hu FB, Manson JE, Stampfer MJ, Colditz GA, Rimm EB, Willett
WC. Dietary fat intake and risk of type 2 diabetes in women. Am J Clin Nutr.
2001; 73: 1019-1026.
337. Saloma V, Ahola I, Tuomilehto J, Aro A, Pietinen P, Korhonen HJ, Penttilä I.
Fatty acid composition of serum cholesterol esters in different degrees of glucose
intolerance: a population-based study. Metabolism. 1990; 39(12): 1285-1291.
338. Salomaa V, Havulinna A, Saarela O, Zeller T, Jousilahti P. Thirty-One Novel
Biomarkers as Predictors for Clinically Incident Diabetes. PLoS ONE. 2010;
5(4): e10100.
http://www.ncbi.nlm.nih.gov/pubmed/?term=Stampfer%20MJ%5BAuthor%5D&cauthor=true&cauthor_uid=11382654

215
339. Saltiel AR, Kahn CR. Insulin signalling and the regulation of glucose and lipid
metabolism. Nature. 2001; 414: 799-806.
340. Saltiel AR. New perspectives into the molecular pathogenesis and treatment of
type 2 diabetes. Cell. 2001; 104: 517-529.
341. Sanjabi S, Zenewicz LA, Kamanaka M, Flavell RA. Anti- and Pro-inflammatory
Roles of TGF-β, IL-10, and IL-22 in immunity and autoimmunity. Curr Opin
Pharmacol. 2009; 9(4): 447–453.
342. Saraswathi V, Gao L, Morrow JD, Chait A, Niswender KD, Hasty AH et al. Fish
oil increases cholesterol storage in white adipose tissue with concomitant
decreases in inflammation, hepatic steatosis, and atherosclerosis in mice. J Nutr.
2007; 137: 1776-1782.
343. Sartipy P, Loskutoff DJ. Monocyte chemoattractant protein 1 in obesity and
insulin resistance. Proc Natl Acad Sci U S A. 2003; 100: 7265–7270.
344. Sarvas JL, Khaper N, Lee SJ. The IL-6 paradox: context dependent interplay of
SOCS3 and AMPK. J Diabetes Metab. 2013; 24(suppl. 13).
345. Sawada K, Kawabata K, Yamashita T, Kawasaki K, Yamamoto N, Ashida H.
Ameliorative effects of polyunsaturated fatty acids against palmitic acid-induced
insulin resistance in L6 skeletal muscle cells. Lipids Health Dis. 2012; 11: 36.
346. Schaeffer L, Gohlke H, Müller M, Heid IM, Palmer LJ, Kompauer
I, Demmelmair H, Illig T, Koletzko B, Heinrich J. Common genetic variants of
the FADS1 FADS2 gene cluster and their reconstructed haplotypes are associated
with the fatty acid composition in phospholipids. Hum Mol Genet. 2006; 15(11):
1745-1756.

216
347. Schmidt MI, Duncan BB, Sharrett AR, Lindberg G, Savage PJ, Offenbacher S et
al . Markers of inflammation and prediction of diabetes mellitus in adults
(Atherosclerosis Risk in Communities study): a cohort study. Lancet. 1999; 353:
1649-1652.
348. Schmitz G, Ecker J. The opposing effects of n-3 and n-6 fatty acids. Prog Lipid
Res. 2008; 47(2):147-155.
349. Schwartz EA, Zhang WY, Karnik SK, Borwege S, Anand VR, Laine PS, Su Y,
Reaven PD. Nutrient modification of the innate immune response: a novel
mechanism by which saturated fatty acids greatly amplify monocyte
inflammation. Arterioscler Thromb Vasc Biol. 2010; 30: 802–808.
350. Sergeant S, Hugenschmidt CE, Rudock ME, Ziegler JT, Ivester P, Ainsworth HC
et al. Differences in arachidonic acid levels and fatty acid desaturases (FADS)
gene variants in African Americans and European Americans with
diabetes/metabolic syndrome. Br J Nutr. 2012; 107(4): 547-555.
351. Sethom MM, Fares S, Feki M, Hadj-Taieb S, Elasmi M, Omar S et al. Plasma
fatty acids profile and estimated elongase and desaturases activities in Tunisian
patients with the metabolic syndrome. Prostaglandins Leukot Essent Fatty Acids.
2011; 85: 137–141.
352. Sexton WJ, Jarow JP. Effect of diabetes mellitus upon male reproductive
function Urology. 1997; 49: 508–513.
353. Shaikh RS, Edidin M. Polyunsaturated fatty acids, membrane organization, T
cells, and antigen presentation. Clin Nutr. 2006; 84: 1277-1289.
217
354. Shaikh SR, Brzustowicz MR, Gustafson N, Stillwell W, Wassall SR.
Monounsaturated PE does not phase-separate from the lipid raft molecules
sphingomyelin and cholesterol: role for polyunsaturation? Biochemistry. 2002;
41: 10593-10602.
355. Shaikh SR, Cherezov V, Caffrey M, Stillwell W, Wassall SR. Interaction of
cholesterol with a docosahexaenoic acid-containing phosphatidylethanolamine:
trigger for microdomain/raft formation? Biochemistry. 2003; 42: 12028–12037.
356. Shaikh SR, Dumaual AC, Castillo A, LoCascio D, Siddiqui RA, Stillwell W .
Oleic and docosahexaenoic acid differentially phase separate from lipid raft
molecules: a comparative NMR, DSC, AFM, and detergent extraction study.
Biophys J. 2004; 87: 1752-1766.
357. Shaikh SR, Edidin M. Polyunsaturated fatty acids, membrane organization, T
cells, and antigen presentation. Am J Clin Nutr. 2006; 84: 1277–1289.
358. Shaw JE, Sicree RA, Zimmet PZ. Global estimates of the prevalence of diabetes
for 2010 and 2030. Diabetes Res Clin Pract. 2010; 87(1): 4-14.
359. Sheth JJ, Shah A, Sheth FJ, Trivedi S, Lele M, Shah N et al. Does vitamin D play
a significant role in type 2 diabetes? BMC Endocr Disord. 2015; 15: 5.
360. Shi H, Kokoeva MV, Inouye K, Tzameli I, Yin H, Flier JS et al. TLR4 links
innate immunity and fatty acid-induced insulin resistance. J Clin Invest. 2006;
116: 3015-3025.
361. Shimabukuro M, Zhou YT, Levi M, Unger RH et al. Fatty acid-induced beta cell
apoptosis: a link between obesity and diabetes. Proc Natl Acad Sci USA. 1998;
95: 2498-2502.
http://www.ncbi.nlm.nih.gov/pubmed/?term=Gustafson%20N%5BAuthor%5D&cauthor=true&cauthor_uid=12186543
http://www.ncbi.nlm.nih.gov/pubmed/?term=Stillwell%20W%5BAuthor%5D&cauthor=true&cauthor_uid=12186543
http://www.ncbi.nlm.nih.gov/pubmed/?term=Siddiqui%20RA%5BAuthor%5D&cauthor=true&cauthor_uid=15345554

218
362. Shu CJ, Benoist C, Mathis D. The immune system’s involvement in obesity-
driven type 2 diabetes. Semm Immunol. 2012; 24(6): 436-442.
363. Shoelson SE , Lee J, Goldfine AB. Inflammation and insulin resistance. J Clin
Invest. 2006; 116: 1793-1801.
364. Sigmundsdottir H, Pan J, Debes GF, Alt C, Habtezion A, Soler D et al. DCs
metabolize sunlight-induced vitamin D3 to 'program' T cell attraction to the
epidermal chemokine CCL27. Nat Immunol. 2007; 8: 285 – 293.
365. Sima AA, Thomas PK, Ishii D, Vinik A. Diabetic neuropathies. Diabetologia.
1997; 40: B74-B77.
366. Simon MC, Bilan S, Nowotny B, Dickhaus T, Burkart V, Schloot NC. Fatty acids
modulate cytokine and chemokine secretion of stimulated human whole blood
cultures in diabetes. Clin Exp Immunol. 2013; 172: 383-393.
367. Simopoulos AP. The omega-6/omega-3 fatty acid ratio: health implications.
OCL. 2010; 17, 267-275.
368. Schmidt Schmidt FM, Weschenfelder J, Sander C, Minkwitz J, Thormann J,
Chittka T, et al. Inflammatory Cytokines in General and Central Obesity and
Modulating Effects of Physical Activity. PLoS ONE. 2015; 10(3): e0121971.
369. Sommerweiss D, Gorki T, Richter S, Garten A, Kiess W. Oleate rescues INS-IE
β-cells from palmitate induced apoptosis by preventing activation of the unfolded
protein response. Biochem Biophys Res Commun. 2013; 441: 770-776.
370. Song MJ, Kim KH, Yoon JM, Kim JB. Activation of Toll-like receptor 4 is
associated with insulin resistance in adipocytes. Biochem Biophys Res Commun.
2006; 346:739 –745.

219
371. Sowers JR, Epstein M, Frohlich ED. Diabetes, hypertension, and cardiovascular
disease: an update. Hypertension 2001; 37(4): 1053-1059.
372. Spiegelman BM, Flier JS. Obesity and the regulation of energy balance. Cell.
2001; 104: 531-543.
373. Spranger J Kroke A, Möhlig M, Hoffmann K, Bergmann MM, Ristow M et al.
Inflammatory cytokines and the risk to develop type 2 diabetes: results of the
prospective population-based European Prospective Investigation into Cancer
and Nutrition (EPIC)-Potsdam Study. Diabetes. 2003; 52: 812-817.
374. Standing Committee on the Scientific Evaluation of Dietary Reference Intakes.
Dietary reference intakes: Calcium, phosphorus, magnesium, vitamin D, and
fluoride. National Academy Press, 1997.
375. Steffen BT, Steffen LM, Tracy R, Siscovick D, Jacobs D, Liu K et al. Ethnicity,
plasma phospholipid fatty acid composition and inflammatory/endothelial
activation biomarkers in the Multi-Ethnic Study of Atherosclerosis (MESA). Eur
J Clin Nutr. 2012; 66(5): 600–605.
376. Steffen, L.M., Vessby, B., Jacobs, D.R. Jr., Steinberger, J., Moran, A., Hong,
C.P. Serum phospholipid and cholesteryl ester fatty acids and estimated
desaturase activities are related to overweight and cardiovascular risk factors in
adolescents. Int J Obes (Lond). 2008; 32: 1297–1304.
377. Stein DT, Stevenson BE, Chester MW, Basit M, Daniels MB, Turley SD,
McGarry JD. The insulinotropic potency of fatty acids is influenced profoundly
by their chain length and degree of saturation. J Clin Invest. 1997; 100: 398-403.

220
378. Stene LC, Ulriksen J, Magnus P, Joner G. Use of cod liver oil during
pregnancy associated with lower risk of Type I diabetes in the offspring.
Diabetologia. 2000; 43: 1093–1098.
379. Steven S, Taylor R. Restoring normoglycaemia by use of a very low calorie diet
in long and short duration type 2 diabetes. Diabet Med. 2015; 32: 1149 – 1155.
380. Stillwell W Wassall SR. Docosahexaenoic acid: membrane properties of a unique
fatty acid. Chem Phys Lipids. 2003; 126: 1-27.
381. Straub RH , Hense HW, Andus T, Schölmerich J, Riegger GA, Schunkert H et al.
Hormone replacement therapy and interrelation between serum interleukin-6 and
body mass index in postmenopausal women: a population-based study. J Clin
Endocrinol Metab. 2000; 85: 1340-1344.
382. Strazzullo P, Barbato A, Galletti F, Barba G, Alfonso S, Roberto I et al.
Abnormalities of renal sodium handling in the metabolic syndrome. Results of
the Olivetti Heart Study. J Hypertens. 2006; 24: 1633-1639.
383. Stringhini S, Batty GD, Bovet P, Shipley MJ, Marmot MG, et al. Association of
Lifecourse Socioeconomic Status with Chronic Inflammation and Type 2
Diabetes Risk: The Whitehall II Prospective Cohort Study. PLoS Med. 2013;
10(7): e1001479.
384. Stulnig TM. Immunomodulation by polyunsaturated fatty acids: mechanisms
and effects. Int Arch Allergy Immunol. 2003; 132: 310-321.
385. Stump CS, Henriksen EJ, Wei Y, Sowers JR. The metabolic syndrome: role of
skeletal muscle metabolism. Ann Med. 2006; 38: 389-402.

221
386. Su SC, Pei D, Hsieh CH, Hsiao FC, Wu CZ, Hung YJ et al. Circulating pro-
inflammatory cytokines and adiponectin in young men with type 2 diabetes. Acta
Diabetol. 2011; 48: 113-119.
387. Sultan A, Strodthoff D, Robertson AK, Paulsson-Berne G, Fauconnier J, Parini P
et al . T cell-mediated inflammation in adipose tissue does not cause insulin
resistance in hyperlipidemic mice. Circ Res. 2009; 104: 961-968.
388. Surendar J, Aravindhan V, Rao MM, Ganesan A, Mohan V. Decreased serum
interleukin-17 and increased transforming growth factor–β levels in subjects with
metabolic syndrome (Chennai Urban Rural Epidemiology Study–95).
Metabolism. 2011; 60(4): 586–590.
389. Takeda K, Akira S. TLR signaling pathways. Seminars Immunol. 2004; 16: 3-9.
390. Talaei S, Mohamadi M, Adgi Z. The effect of vitamin D on insulin resistance in
patients with type 2 diabetes. Diabetology & Metabolic Syndrome. 2013; 5: 8.
391. Tanaka T, Shen J, Abecasis GR, Kisialiou A, Ordovas JM, Guralnik JM,
Singleton A, Bandinelli S, Cherubini A, Arnett D, Tsai MY, Ferrucci L:
Genome-wide association study of plasma polyunsaturated fatty acids in the
InCHIANTI Study. PLoS Genet 2009, 5(1):e1000338.
392. Tanaka T, Narazaki M, Kishimoto T. IL-6 in Inflammation, Immunity, and
Disease. Cold Spring Harb Perspect Biol 2014; 6: a016295.
393. Tarabay M, Elshazli R, Settin A. African vs. Caucasian and Asian difference for
the association of interleukin-10 promotor polymorphisms with type 2 diabetes
mellitus (a meta-analysis study). Meta Gene. 2016; 9: 10-17.

222
394. Taskinen MR. Type 2 diabetes as a lipid disorder. Curr Mol Med. 2005;
5(3):297-308.
395. Taylor AJ, Jennings PE, Barnett AH, Pandov HI, Lawson N. An alternative
explanation for the changes in erythrocyte fatty acids observed in diabetes
mellitus. Clin Chem. 1987; 33(11): 2083-2085.
396. Teegarden D Donkin SS. Vitamin D: emerging new roles in insulin sensitivity.
Nutr Res Rev. 2009; 22: 82-92.
397. Tehrani DM, Gardin JM, Yanez D, Hirsch CH, Lloyd-Jones DM, Stein PK et al.
Impact of inflammatory biomarkers on relation of high density lipoprotein-
cholesterol with incident coronary heart disease: cardiovascular Health Study.
Atherosclerosis. 2013; 231(2): 246-251.
398. Thorand B, Baumert J, Kolb H, Meisinger C, Chambless L, Koenig W et al.
Sex Differences in the Prediction of Type 2 Diabetes by Inflammatory
Markers: Results from the MONICA/KORA Augsburg case-cohort study, 1984–
2002. Diabetes Care. 2007; 30:854-860.
399. Thorand B Kolb H, Baumert J, Koenig W, Chambless L, Meisinger C. Elevated
levels of interleukin-18 predict the development of type 2 diabetes: results from
the MONICA/KORA Augsburg Study, 1984-2002. Diabetes. 2005; 54: 2932-
2938.
400. Titos E, Clària J. Omega-3-derived mediators counteract obesity-induced adipose
tissue inflammation. Prostaglandins Other Lipid Mediat. 2013; 107: 77–84.
http://www.ncbi.nlm.nih.gov/pubmed/?term=Taskinen%20MR%5BAuthor%5D&cauthor=true&cauthor_uid=15892649

223
401. Tobias DK, Hu FB, Missmer SA, Manson JE, Chavarro J. History of Infertility
and Risk of Type 2 Diabetes Mellitus in Women. Circulation. 2013; 127:
AMP91.
402. Towns R, Pietropaolo M. GAD65 autoantibodies and its role as biomarker of
type 1 diabetes and Latent Autoimmune Diabetes in Adults (LADA). Drugs
Future. 2011; 36(11): 847.
403. Trayhurn P, Wood IS: Adipokines: inflammation and the pleiotropic role of white
adipose tissue. Br J Nutr. 2004; 92:347-355.
404. Trudeau JD Dutz JP, Arany E, Hill DJ, Fieldus WE, . Neonatal beta-cell
apoptosis: a trigger for autoimmune diabetes? Diabetes. 2000; 49: 1-7.
405. Tsai AG, Williamson DF, Glick HA. Direct medical cost of overweight and
obesity in the USA: a quantitative systematic review. Obes Rev. 2011; 12(1): 50–
61.
406. Tsiavou A, Hatziagelaki E, Chaidaroglou A, Manginas A, Koniavitou K,
Degiannis D, Raptis SA. TNF-alpha, TGFbeta1, IL-10, IL-6, gene
polymorphisms in latent autoimmune diabetes of adults (LADA) and type 2
diabetes mellitus. J Clin Immunol 2004; 24: 591-599.
407. Tuck ML, Sowers J, Dornfield L, Kledzik G, Maxwell M: The effect of weight
reduction on blood pressure plasma renin activity and plasma aldosterone level in
obese patients. N Engl J Med. 1981; 304: 930 –933.
408. Unadike BC, Eregie A, Ohwovoriole AE. Prevalence of hypertension amongst
persons with diabetes mellitus in Benin City, Nigeria. Nigerian Journal of
Clinical Practice. 2011; 14: 300–302.
224
409. Vadas O, Burke JE, Zhang X, Berndt A, Williams RL. Structural basis for
activation and inhibition of class I phosphoinositide 3-kinases. Sci Signal. 2011;
4(195): re2.
410. Van Schoor NM, Lips P. Worldwide vitamin D status. Best Practice & Research
Clinical Endocrinology & Metabolism. 2011; 25: 671–680.
411. Vann J, Pan J, Charles MA, Krauss R, Wong N, Wu X. Atherogenic lipid
phenotype in a general group of subjects. Arch Pathol Lab Med. 2007; 131(11):
1679-1685.
412. van Wouderbergh GJ, Kuijsten A, Van der Kallen CJ, Van Greevenbroek MM,
Stehouwer CD, Blaak EE, Feskens EJ. Comparison of fatty acid proportions in
serum cholesteryl esters among people with different glucose tolerance status: the
CoDAM study. Nutr Metab & Cardiovasc Dis. 2012; 22: 133-140.
413. Vasanthakumar R, Mohan V, Anand G, Deepa M, Babu S, Aravindhan V. Serum
IL-9, IL-17, and TGF-b levels in subjects with diabetic kidney disease (CURES-
134). Cytokine. 2015; 72: 109–112.
414. Vassiliou EV, Gonzalez A, Garcia C, Tadros JH, Chakraborty G, Toney JH. Oleic
acid and peanut oil high in oleic acid reverse the inhibitory effect of insulin
production of the inflammatory cytokine TNF-α both in vitro and in vivo systems.
Lipids in Health and Disease. 2009; 8: 25.
415. Verheijen MH, Camargo N, Verdier V, Nadra K, de Preux Charles AS, Medard
JJ et al. SCAP is required for timely and proper myelin membrane synthesis. Proc
Natl Acad Sci USA. 2009; 106: 21383-21388.
225
416. Vessby B, Tengblad S, Lithell H. Insulin sensitivity is related to the fatty acid
composition of serum lipids and skeletal muscle phospholipids in 70-year-old
men. Diabetologia, 1994, 37: 1044-1050.
417. Vessby B, Uusitupa M, Hermansen K, Riccardi G, Rivellese AA, Tapsell LC et
al. Substituting dietary saturated for monounsaturated fat impairs insulin
sensitivity in healthy men and women: The KANWU Study. Diabetologia. 2001;
44(3): 312-319.
418. Vieth R. Vitamin D supplementation, 25-hydroxyvitamin D concentrations, and
safety.
Am J Clin Nutr. 1999; 69(5): 842–856.
419. Vieth R. Why the minimum desirable serum 25-hydroxyvitamin D level should
be 75 nmol/L (30 ng/ml). Best Pract Res Clin Endocrinol Metab. 2011; 25(4):
681-691.
420. Vikram NK, Misra A, Pandey RM, Dwivedi M, Luthra K. Adiponectin, insulin
resistance, and C-reactive protein in postpubertal Asian Indian adolescents.
Metab Clin Exp. 2004; 53: 1336-1341.
421. Villalpando S, Shamah-Levy T, Rojas R, Aguilar-Salinas CA. Trends for type 2
diabetes and other cardiovascular risk factors in Mexico from 1993-2006. Salud
Publica Mex. 2010; 52(I): S72-S79.
422. Vinik AI, Park TS, Stansberry KB, Pittenger GL. Diabetic
neuropathies. Diabetologia. 2000; 43:957-73.
423. Volarevic V, Al-Qahtani A, Arsenijevic N, Pajovic S, Lukic ML. Interleukin-1
receptor antagonist (IL-1Ra) and IL-1Ra producing mesenchymal stem cells as
modulators of diabetogenesis. Autoimmunity. 2010; 43(4): 255-263.
https://www.ncbi.nlm.nih.gov/pubmed/?term=Uusitupa%20M%5BAuthor%5D&cauthor=true&cauthor_uid=11317662
https://www.ncbi.nlm.nih.gov/pubmed/?term=Riccardi%20G%5BAuthor%5D&cauthor=true&cauthor_uid=11317662

226
424. Wahl S, Drong A, Lehne B, Loh M, Scott WR, Kunze S et al. Epigenome-wide
association study of body mass index, and the adverse outcomes of adiposity.
Nature. 2017; 541: 81–86.
425. Wallace FA, Miles EA, Evans C, Stock TE, Yaqoob P, Calder PC. Dietary fatty
acids influence the production of Th1- but not Th2-type cytokines. J Leukocyte
Biol. 2001; 69: 449-457.
426. Wang L, Folsom AR, Zheng Z-J, Pankow JS, Eckfeldt JH. Plasma fatty acid
composition and incidence of diabetes in middle-aged adults: the Atherosclerosis
Risk in Communities (ARIC) Study. Am J Clin Nutr. 2003; 78: 91-98.
427. Wang Y, Botolin D, Xu J, Christian B, Mitchel E, Jayaprakasam B et al.
Regulation of hepatic fatty acid elongase and desaturase expression in diabetes
and obesity. J Lipid Res. 2006; 47: 2028-2041.
428. Wang X, Chan CB. N-3 polyunsaturated fatty acids and insulin action. Journal of
Endocrinology. 2015; R97- R106.
429. Ward KD, Sparrow D, Landsberg L, Young JB, Weiss ST: The influence of
obesity, insulin, and sympathetic nervous system activity on blood pressure. Clin
Res. 1993; 41: 168A.
430. Warensjo E, Riserus U, Vessby, B. Fatty acid composition of serum lipids
predicts the development of the metabolic syndrome in men. Diabetologia. 2005;
48: 1999–2005.
431. Watson RT, Kanzaki M, Pessin JE. Regulated membrane trafficking of the
insulin-responsive glucose transporter 4 in adipocytes. Endocr Rev. 2004; 25:
177-204.

227
432. Webb AR. Who, what, where and when-influences on cutaneous vitamin D
synthesis. Prog Biophys Mol Biol. 2006; 92: 17-25.
433. Wegner M, Winiarska H, Bobkiewicz-Kozłowska T, Dworacka M. IL-12 serum
levels in patients with type 2 diabetes treated with sulphonylureas.
Cytokine. 2008; 42(3): 312-316.
434. Weijers RNM. Lipid Composition of Cell Membranes and Its Relevance in Type
2 Diabetes Mellitus. Curr Diabetes Rev. 2012; 8(5): 390–400.
435. Wejse C, Gomes VF, Rabna P et al. Vitamin D as supplementary treatment for
tuberculosis: a double-blind, randomized, placebo-controlled trial. American
Journal of Respiratory and Critical Care Medicine 2009; 179: 843–850.
436. Wild S, Roglic G, Green A, Sicree R, King H. Global Prevalence of
Diabetes: Estimates for the year 2000 and projections for 2030. Diabetes Care.
2004; 27: 1047-1053.
437. Wilfing A, Winkler S, Schrattbauer K, Willheim M, Baier K, Aichelburg A et al.
African-European differences in the capacity of T-cell cytokine production. Am J
Trop Med Hyg. 2001; 65(5): 504-509.
438. Williams DE, Cadwell BL, Cheng YJ, Cowie CC, Gregg EW, Geiss LS,
Engelgau MM, Narayan KM, Imperatore G. Prevalence of impaired fasting
glucose and its relationship with cardiovascular disease risk factors in US
adolescents, 1999–2000. Pediatrics. 2005;116: 1122–1126.

228
439. World Health Organization. Global health risks: mortality and burden of disease
attributable to selected major risks Geneva. WHO (2009).
www.who.int/healthinfo/global_burden_disease/.
440. World Health Organization. Diabetes countries profiles 2016; World Health
Organization. WHO (2016). www.who.int/diabetes/country-profiles/en/.
441. Wortsman J, Matsuoka LY, Chen TC, Lu Z, Holick MF. Decreased
bioavailability of vitamin D in obesity. Am J Clin Nutr. 2000; 72: 690-693.
442. Wright LC, Chen L, Niu J, Neogi T, Javiad K, Nevitt MA . Defining
physiologically "normal" vitamin D in African Americans. Osteoporos Int. 2012;
23(9): 2283–2291.
443. Wu H-P, Kuo S-F, Wu S-Y, Chuang D-Y. High interleukin-12 production from
stimulated peripheral blood mononuclear cells of type 2 diabetes patients.
Cytokine. 2010; 51: 298–304.
444. www.diapedia.org/introduction/1104094248/paul-langerhans.
445. Xu H , Barnes GT, Yang Q, Tan G, Yang D, Chou CJ, . Chronic inflammation in
fat plays a crucial role in the development of obesity-related insulin resistance. J
Clin Invest. 2003; 112: 1821-1830.
446. Yamaguchi T, Sugimoto T. Bone metabolism and fracture risk in type 2 diabetes
mellitus. BoneKEy Reports (2012) 1, Article number: 36.
447. Yang J, Holman GD. Comparison of GLUT4 and GLUT1 subcellular trafficking
in basal and insulin-stimulated 3T3-L1 cells. J Biol Chem. 1993; 268: 4600-4603.
448. Yang L, Frindt G, Palmer LG. Magnesium modulates ROMK channel-mediated
potassium secretion. J Am Soc Nephrol. 2010; 21: 2109–2116.
229
449. Yary T, Voutilainen S, TuomainenT-P, Ruusunen A, Nurmi T, Virtanen JK.
Serum n-6 polyunsaturated fatty acids, ∆5- and ∆6-desaturase activities, and risk
of incident type 2 diabetes in men: the Kuopio Ischaemic Heart Disease Risk
Factor Study. Am J Clin Nutr. 2016; doi: 10.3945/ajcn.115.128629.
450. Yener S, Comlekci A, Akinci B, Akan P, Demir T, Bayraktar F, Yesil S. Serum
transforming growth factor-beta 1 levels in normoalbuminuric and normotensive
patients with type 2 diabetes. Effect of metformin and rosiglitazone. Hormones
(Athens). 2008; 7(1): 70-76.
451. Youdim KA, Martin A, Joseph JA. Essential Fatty Acids and the Brain: Possible
Health Implications.
Int J Dev Neurosci. 2000; 18: 383-399.
452. Young MJ, Boulton AJM, Macleod AF, Williams DRR, Sonksen PH. A multicentre
study of the
prevalence of diabetic peripheral neuropathy in the United Kingdom hospital clinic
population. Diabetologia. 1993; 36: 150-154.
453. Zella JB, DeLuca HF. Vitamin D and Autoimmune Diabetes. J Cell Biochem.
2003; 88: 216-222.
454. Zhang FF, Al Hooti S, Al Zenki S, Alomirah H, Jamil KM, Rao A et al. Vitamin
D deficiency is associated with high prevalence of diabetes in Kuwaiti adults:
results from a national survey. BMC Public Health. 2016; 16:100.
455. Zhang H, Dellsperger KC, Zhang C. The link between metabolic abnormalities
and endothelial dysfunction in type 2 diabetes: an update. Basic Res Cardiol.
2011; 107: 237.
230
456. Zhang J-L, Qin Y-W, Zheng X, Qiu J-L, Zou D-J. Serum resistin level in
essential hypertension patients with different glucose tolerance. Diabetic
Medicine. 2003; 20(10): 828–831.
457. Zhang Y, Dall TM, Mann SE, Chen Y, Martin J, Moore V . The economic costs
of undiagnosed diabetes. Popul Health Mange. 2009; 12: 95-101.
458. Zhang Z , Yuan W, Sun L, Szeto FL, Wong KE, Li X . 1, 25-Dihydroxyvitamin
D3 targeting of NF-kappaB suppresses high glucose-induced MCP-1 expression
in mesangial cells. Kidney Int. 2007; 72: 193-201.
459. Zhu J, Paul WE. Heterogeneity and plasticity of T helper cells. Cell Res. 2010;
20(1): 4-12.
460. Zimmet PZ, Collins VR, de Courten MP, Hodge AM, Collier GR, Dowse GK et
al. Is there a relationship between leptin and insulin sensitivity independent of
obesity? A population based study in the Indian Ocean nation of Mauritius. Int J
Obes. 1988; 22: 171-177.
461. Zimmet PZ, Magliano D, Herman WH, Shaw JE. Diabetes: 21st century
challenge. Lancet Diabetes Endocrinol. 2014; 2: 56–64.
462. Zitterman A. Vitamin D and disease prevention with special reference to
cardiovascular disease. Prog Biophys Mol Biol. 2006; 92: 39-48.
463. Zong G, Zhu J, Sun L, Ye X, Lu L, Jin Q et al. Associations of erythrocyte fatty
acids in the de novo lipogenesis pathway with risk of metabolic syndrome in a
cohort study of middle-aged older Chinese. Am J Clin Nutr. 2013; 98: 319-326.