New Pathway of Tropical Influences on Arctic Subseasonal ... · LIN AND WANG . 99 and its impact...
4
Science and Technology Infusion Climate Bulletin NOAA’s National Weather Service 42 nd NOAA Annual Climate Diagnostics and Prediction Workshop Norman, OK, 23-26 October 2017 ______________ Correspondence to: Yen-Heng Lin, Department of Plants, Soils and Climate, Utah State University, Logan, UT; E-mail: [email protected] New Pathway of Tropical Influences on Arctic Subseasonal Warming Events in the Troposphere Yen-Heng Lin 1 and S.-Y. Simon Wang 1,2 1 Department of Plants, Soils and Climate, Utah State University, Logan, UT 2 Utah Climate Center, Utah State University, Logan, UT, USA 1. Introduction Midlatitdue weather extremes are highly correlated to the variations of Arctic and tropical circulations. High-amplitude fluctuations of the jet streams result in heat exchange between the Arctic and midlatitude regions, creating a feedback mechanism between subseasonal Arctic warming and stagnation of midlatitude atmospheric waves. In a companion study (Wang et al. 2017), we show a rapid tropospheric warming (RTW) process as illustrated in Fig. 1 during the 2015-2016 winter, depicted by the polar cap height (PCH) variation and Arctic Oscillation (AO). The RTW case from late December to early January induces negative AO but does not feature any stratospheric warming or precursor, hence distinguishing it from the sudden stratospheric warming (SSW) case that subsequently occurs during March and April. The documented increase in the frequency of RTW has been linked to increased weather extremes (Fig. 2; Wang et al. 2017). Previous research links subseasonal Arctic warming events to tropical convective activities in the Pacific region (Jahnson and Feldstein 2010; Lee et al. 2011). Further evidence presented in this study suggests that this tropical link to increased RTW cases has strengthened in recent decades. 2. Data and methods Daily reanalysis data of the National Centers for Environmental Prediction (NCEP)/Department of Energy Reanalysis II (R2) is used for atmospheric circulation analysis. For boundary heat forcing of sea surface temperature (SST), we utilize monthly anomalies of the NOAA Extended Reconstructed Sea Surface Temperature version 5 (ERSSTv5). Arctic rapid tropospheric warming (RTW) events are defined following Wang et al. (2017). This is when the polar cap height variation has a persistently positive anomaly (i.e. the geopotential height anomaly is larger than 1.5 standard deviation) in the troposphere, and the stratosphere remains negative to neutral. Based on this definition, 31 RTW events are identified from 1979 to 2015 winter (November-March) and are consequently synthesized into a composite. The composite of RTW events is created using the transition of RTW events evenly divided into 7 phases, from the highest status of AO (Phase 1) to the lowest status of AO (Phase 7). Phases 2-6 are defined as the transit phases. A more detailed Fig. 1 (a) Daily Arctic Oscillation index from 1 November to 30 April with 5 day moving average; the shaded period indicates the rapid tropospheric warming (RTW) case. (b) Time-height cross section of daily polar cap height (PCH) over Arctic region (north of 65°N) with 5 day moving average using NCEP reanalysis 2 data. (Wang et al., 2017; Fig. 1a, b)
Transcript of New Pathway of Tropical Influences on Arctic Subseasonal ... · LIN AND WANG . 99 and its impact...

Science and Technology Infusion Climate Bulletin NOAA’s National Weather Service 42nd NOAA Annual Climate Diagnostics and Prediction Workshop Norman, OK, 23-26 October 2017
______________ Correspondence to: Yen-Heng Lin, Department of Plants, Soils and Climate, Utah State University, Logan, UT; E-mail: [email protected]
New Pathway of Tropical Influences on Arctic Subseasonal Warming Events in the Troposphere
Yen-Heng Lin1 and S.-Y. Simon Wang1,2 1Department of Plants, Soils and Climate, Utah State University, Logan, UT
2Utah Climate Center, Utah State University, Logan, UT, USA
1. Introduction
Midlatitdue weather extremes are highly correlated to the variations of Arctic and tropical circulations. High-amplitude fluctuations of the jet streams result in heat exchange between the Arctic and midlatitude regions, creating a feedback mechanism between subseasonal Arctic warming and stagnation of midlatitude atmospheric waves. In a companion study (Wang et al. 2017), we show a rapid tropospheric warming (RTW) process as illustrated in Fig. 1 during the 2015-2016 winter, depicted by the polar cap height (PCH) variation and Arctic Oscillation (AO). The RTW case from late December to early January induces negative AO but does not feature any stratospheric warming or precursor, hence distinguishing it from the sudden stratospheric warming (SSW) case that subsequently occurs during March and April. The documented increase in the frequency of RTW has been linked to increased weather extremes (Fig. 2; Wang et al. 2017). Previous research links subseasonal Arctic warming events to tropical convective activities in the Pacific region (Jahnson and Feldstein 2010; Lee et al. 2011). Further evidence presented in this study suggests that this tropical link to increased RTW cases has strengthened in recent decades. 2. Data and methods
Daily reanalysis data of the National Centers for Environmental Prediction (NCEP)/Department of Energy Reanalysis II (R2) is used for atmospheric circulation analysis. For boundary heat forcing of sea surface temperature (SST), we utilize monthly anomalies of the NOAA Extended Reconstructed Sea Surface Temperature version 5 (ERSSTv5). Arctic rapid tropospheric warming (RTW) events are defined following Wang et al. (2017). This is when the polar cap height variation has a persistently positive anomaly (i.e. the geopotential height anomaly is larger than 1.5 standard deviation) in the troposphere, and the stratosphere remains negative to neutral. Based on this definition, 31 RTW events are identified from 1979 to 2015 winter (November-March) and are consequently synthesized into a composite. The composite of RTW events is created using the transition of RTW events evenly divided into 7 phases, from the highest status of AO (Phase 1) to the lowest status of AO (Phase 7). Phases 2-6 are defined as the transit phases. A more detailed
Fig. 1 (a) Daily Arctic Oscillation index from 1 November to 30 April with 5 day moving average; the shaded period indicates the rapid tropospheric warming (RTW) case. (b) Time-height cross section of daily polar cap height (PCH) over Arctic region (north of 65°N) with 5 day moving average using NCEP reanalysis 2 data. (Wang et al., 2017; Fig. 1a, b)

SCIENCE AND TECHNOLOGY INFUSION CLIMATE BULLETIN
98
description of these methods is found in Wang et al. (2017).
3. Analysis results
To examine the circulation changes associated with the increase in RTW cases in the past decade, we show the average 250-hPa velocity potential (VP250) in the transit phases of RTW cases in two eras. First, the earlier era is from 1979 to 1987 with 12 RTW cases, and the recent era is from 1998 to 2015 with 19 RTW cases (Figs. 3a and 3b). The results reveal deep convections (upper-troposphere divergence) in the Pacific in both eras. However, the difference between the two reveals an eastward shift of the deep convection to the eastern Pacific as shown in Fig. 3c. A similar difference is seen in the linear trend of VP250 in winter since 1979 (Fig. 3d).
The changes in deep convection of RTW events lead to the next analysis of investigating the decadal variations of the wintertime VP250 which is shown in Fig. 4. The variations reveal an increase in divergence anomaly (Fig. 4a) in the eastern tropical Pacific in the last two decades. The central Pacific region also exhibits a divergent anomaly during the same period. This change is further elucidated by the variance of wintertime VP250 (Fig. 4b), which shows higher VP250 variances in the central and eastern tropical Pacific in the recent era. Moreover, Fig. 4c shows the frequency anomalies of the strong VP250 divergence (VP250 is less than -1.5 standard deviation) in winter. The results echo the changes of mean value and variance that the tropical Pacific in the recent era has more active convections than the early era.
Lee et al. (2011) indicates that the intraseasonal tropical convective precipitation can affect the Arctic warming. To examine how the increase in the tropical deep convection is relevant to the increased frequency of RTW in the recent era, we further conduct the wave activity flux (WAF) (Takaya and Nakamura 2001) analysis on the composite of RTW cases in the early era (12 cases) and recent era (19 cases) to depict the change of tropical deep-convection forcing
Fig. 2 The case frequencies of RTW (blue) and SSW (light green) cases plotted at every 9 years during the November–March period. (Wang et al. 2017; Fig. 4a)
Fig. 3 (a) The 12 cases composite of the averaged 250-hPa velocity potential (VP250) during the RTW transit phases from 1979 to 1997. (b) the same as (a), but for the 19 cases from 1998 to 2016. (c) the difference between recent two decades (b) and previous two decades (a) of the composite of RTW VP250. (d) The linear trend of VP250 in winter after 1979.

LIN AND WANG
99
and its impact pathway, which is shown in Fig. 5. In the recent era, the 300-hPa WAF (Fig. 5b) reveals a northeastward wave train generated from the Eastern Pacific. This wave train forms a high-pressure anomaly in the southwest U.S., a low-pressure anomaly in the eastern U.S., and a high-pressure anomaly in the
Fig. 5 The 300-hPa wave activity flux (WAF) and streamfunction anomaly (ST) of the RTW phases 4 and 7 in (a) 12 RTW cases averaged from 1979 to 1997 and (b) 19 RTW cases averaged from 1998 to 2016. (c) The schematic of the seven phases of the rapid tropospheric warming (RTW) cycle (an example of 2015-16 RTW event).
Fig. 4 The 9-year average of (a) wintertime (November-March) 250-hPa velocity potential (VP250) anomaly, (b) wintertime VP250 variance anomaly, and (c) the frequency of VP250 anomaly that is less than -1.5 standard deviation in winter.
SCIENCE AND TECHNOLOGY INFUSION CLIMATE BULLETIN
100
northern Atlantic from phase 4, where AO is shifting from positive to negative (Fig. 5c). This feature is not discernable in the early era (Fig. 5a). This wave train combines with the Pacific Northern American (PNA) teleconnection pattern from the central Pacific to induce high-amplitude wavy jet streams and cause high-pressure (warming) anomalies in Alaska and the Greenland regions.
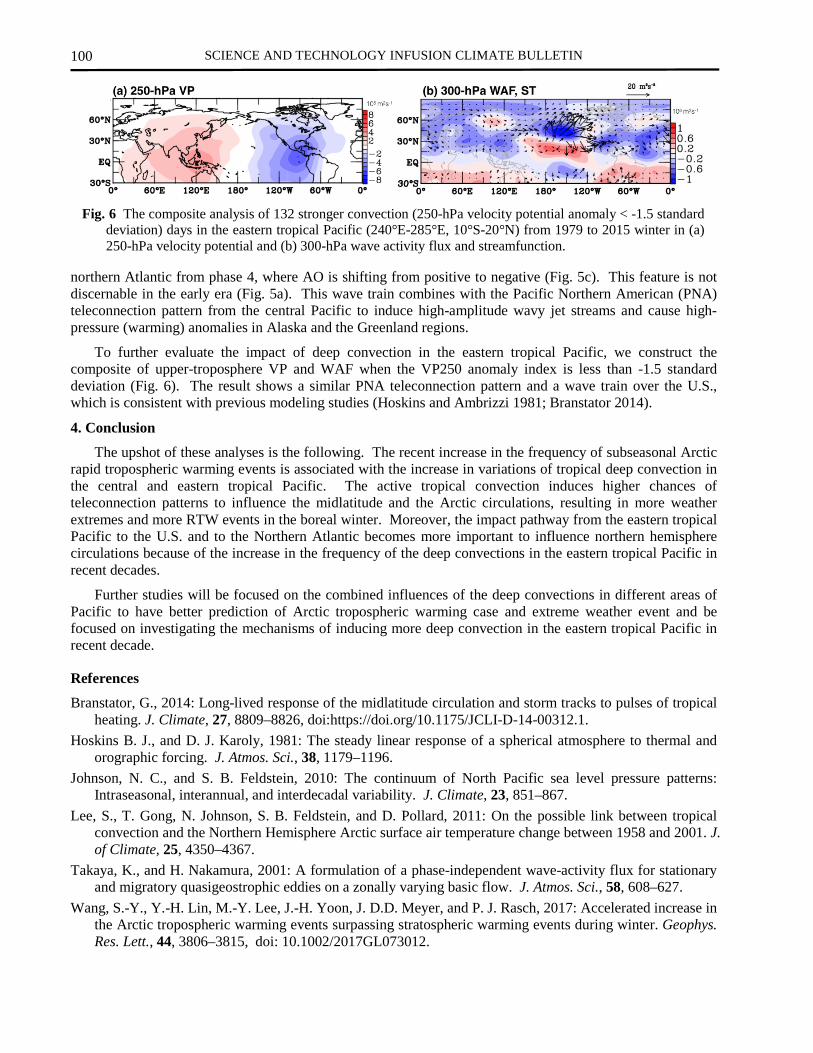
To further evaluate the impact of deep convection in the eastern tropical Pacific, we construct the composite of upper-troposphere VP and WAF when the VP250 anomaly index is less than -1.5 standard deviation (Fig. 6). The result shows a similar PNA teleconnection pattern and a wave train over the U.S., which is consistent with previous modeling studies (Hoskins and Ambrizzi 1981; Branstator 2014).
4. Conclusion
The upshot of these analyses is the following. The recent increase in the frequency of subseasonal Arctic rapid tropospheric warming events is associated with the increase in variations of tropical deep convection in the central and eastern tropical Pacific. The active tropical convection induces higher chances of teleconnection patterns to influence the midlatitude and the Arctic circulations, resulting in more weather extremes and more RTW events in the boreal winter. Moreover, the impact pathway from the eastern tropical Pacific to the U.S. and to the Northern Atlantic becomes more important to influence northern hemisphere circulations because of the increase in the frequency of the deep convections in the eastern tropical Pacific in recent decades.
Further studies will be focused on the combined influences of the deep convections in different areas of Pacific to have better prediction of Arctic tropospheric warming case and extreme weather event and be focused on investigating the mechanisms of inducing more deep convection in the eastern tropical Pacific in recent decade.
References
Branstator, G., 2014: Long-lived response of the midlatitude circulation and storm tracks to pulses of tropical heating. J. Climate, 27, 8809–8826, doi:https://doi.org/10.1175/JCLI-D-14-00312.1.
Hoskins B. J., and D. J. Karoly, 1981: The steady linear response of a spherical atmosphere to thermal and orographic forcing. J. Atmos. Sci., 38, 1179–1196.
Johnson, N. C., and S. B. Feldstein, 2010: The continuum of North Pacific sea level pressure patterns: Intraseasonal, interannual, and interdecadal variability. J. Climate, 23, 851–867.
Lee, S., T. Gong, N. Johnson, S. B. Feldstein, and D. Pollard, 2011: On the possible link between tropical convection and the Northern Hemisphere Arctic surface air temperature change between 1958 and 2001. J. of Climate, 25, 4350–4367.
Takaya, K., and H. Nakamura, 2001: A formulation of a phase-independent wave-activity flux for stationary and migratory quasigeostrophic eddies on a zonally varying basic flow. J. Atmos. Sci., 58, 608–627.
Wang, S.-Y., Y.-H. Lin, M.-Y. Lee, J.-H. Yoon, J. D.D. Meyer, and P. J. Rasch, 2017: Accelerated increase in the Arctic tropospheric warming events surpassing stratospheric warming events during winter. Geophys. Res. Lett., 44, 3806–3815, doi: 10.1002/2017GL073012.
Fig. 6 The composite analysis of 132 stronger convection (250-hPa velocity potential anomaly < -1.5 standard deviation) days in the eastern tropical Pacific (240°E-285°E, 10°S-20°N) from 1979 to 2015 winter in (a) 250-hPa velocity potential and (b) 300-hPa wave activity flux and streamfunction.