New particle formation in Central-eastern China: a ... · New particle formation in Central-eastern...
20
Chinese Research Academy of Environmental Science Ministry of Environmental Protection New particle formation in Central-eastern China: a comparative analysis of measurements from surface to mountain-top Gao Jian 1 , Wang Tao 1,2 , Chai Fahe 1 , Wang Wenxing 1,3 1, Chinese Research Academy of Environment Science 2, Hongkong Poly Technic University 3, Shandong University
Transcript of New particle formation in Central-eastern China: a ... · New particle formation in Central-eastern...
Chinese Research Academy of Environmental Science
Ministry of Environmental Protection
New particle formation in Central-eastern China: a comparative analysis of measurements from surface to mountain-top
Gao Jian1, Wang Tao1,2, Chai Fahe1, Wang Wenxing1,3
1, Chinese Research Academy of Environment Science2, Hongkong Poly Technic University3, Shandong University

Nucleation
� Initial step
� Growth process
� Precursors: Organic Vapors,
H2SO4
� Particle dynamic process
� Competition between source
and sinks
(Kulmala: Science, 2003)

SO2
NOx
VOC
NH3
OH
H2SO4, NH3 ,,,,VOC
emission
nucleation
Nano-particlesgrowth
Aiken particles ~100 nm
coagulation
Sulfate
Cloud
SO2 ���� SO42-
NOx ���� NO3-
VOC ����Organic Acid
CCN
Wash out in cloudH2O2, O3, O2
Acid Rain
evaporation
Gas-Particle
CCN

(Richter, Wittrock and Burrows IUP/IFE-UB)

Model Results
Total Number Concentration (cm-3)
CCN(0.2%) (cm-3)
Notice the scale!
(Trivitayanurak et al., 2008)

The observation sites
PBL
Jinan, urban 2006.5.10-5.21((((summer))))36.7 oN 107.0 oE, 70m asl
Mount Tai2007.3.22.-4.2436.3 oN 117.2 oE, 1548m asl
Upper-PBL-FT
Ji’nan
Mt Tai
Taicang
44.4 km49.6 km
Taicang
Taicang, ShanghaiMay 5~Jun. 2 2005
31.5 oN 121.1oE, 50m asl
Changping , BeijingJun. 20~Jul. 31 200540.3 oN 116.3 oE, 500m asl

MSP--WPS model 1000XP
�Experiments

Number size distribution
SHSHSHSH BJBJBJBJ
MTMTMTMTJNJNJNJN
summe
r
winter

Woo (2003)
Tuch et al. (1997)
Per. %Per. %Per. %Per. %
SH BJ JN MT
The Ration between number conc. of PM0.01 and PM10 The Ration between number conc. of PM0.01 and PM10 The Ration between number conc. of PM0.01 and PM10 The Ration between number conc. of PM0.01 and PM10

a a’ a’’ a’’’
JN SH BJ MT
粒径粒径粒径粒径
(nm)
� Diurnal Variation
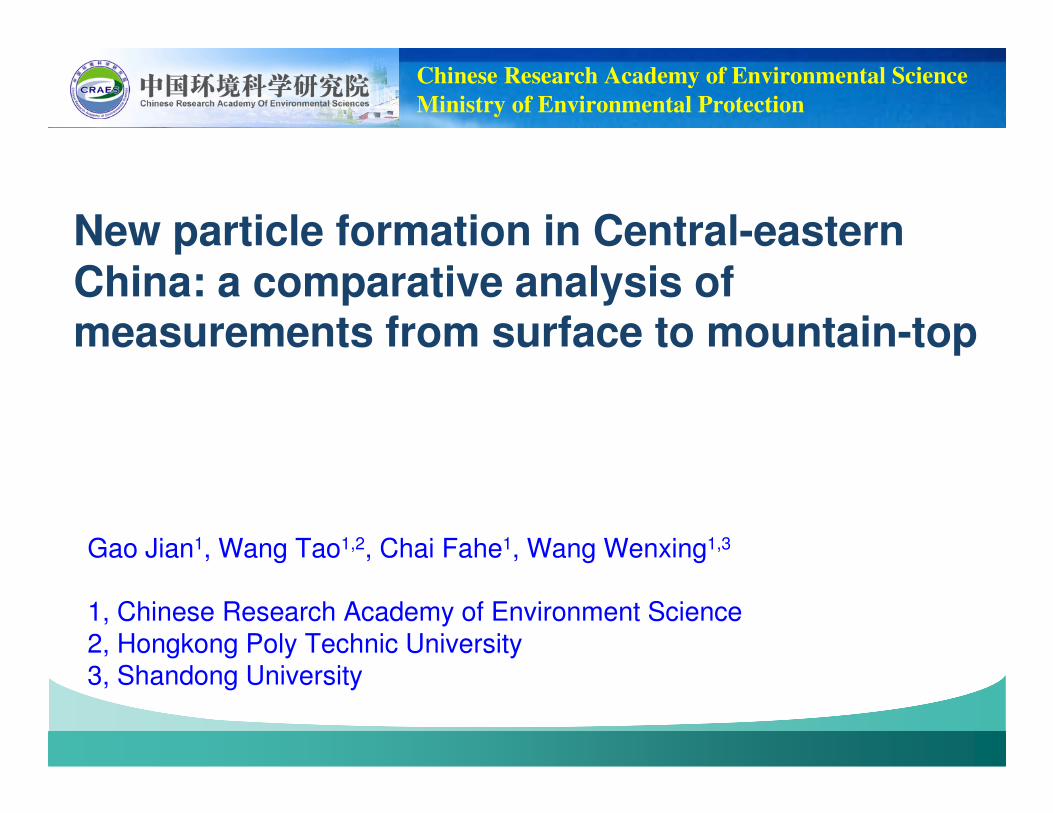
Nucleation
1 nm1 nm 3 nm detectable Size3 nm detectable Size
Condensable
Vapors
Kulmala, Science, (2003, 2004); McMurry et al., JGR, (2005); Wu et al., ppt
Theories:
(1) Binary (H2SO4+H2O)
(2) Ternary (H2SO4+NH3+H2O)
(3) Ion-induced nucleation
(4) Organics
(5)….
Stable clusters
Condensation
Coagulation
New Particle Formation
CCNSubsequent growth
New particle formation process

New particle formation process
SH BJ

Site Days Short term
nucleation
New particle
formation
Times Frequency Times Frequency
JN, Urban 12 7 58.3% 0 0
SH, suburban 29 7 24.1% 5 18.5%
BJ, rural 31 6 19.4% 10 32.3%
Mt. Tai Regional 26 0 0 17 65.4%
�Frequency of the NPF process

Frequency of Regional Nucleation Events at Three Locations1
(Kulmala, 2004)
MT
65.4%
SH
18.5%
BJ
32.3%
(Wu et al., 2007) (Woo et al., 2003) (Stanier et al., 2004)
(Kulmala, 2004) (Kulmala, 2004)
�Frequency of the NPF process
2 times higher than NPF in Sierra Nevada(1500m)1 time higher than NPF in Colorado Rocky(2900m)2 times higher than NPF in Norway spruce(800m)3 times higher than NPF in Hohenpeissenberg mountain (980m)
3.7 times higher than NPF in Mount Norikura (3026m)
(Lunden et al., 2006; Boy et al., 2007; Held et al., 2004; Nishita et al., 2008)
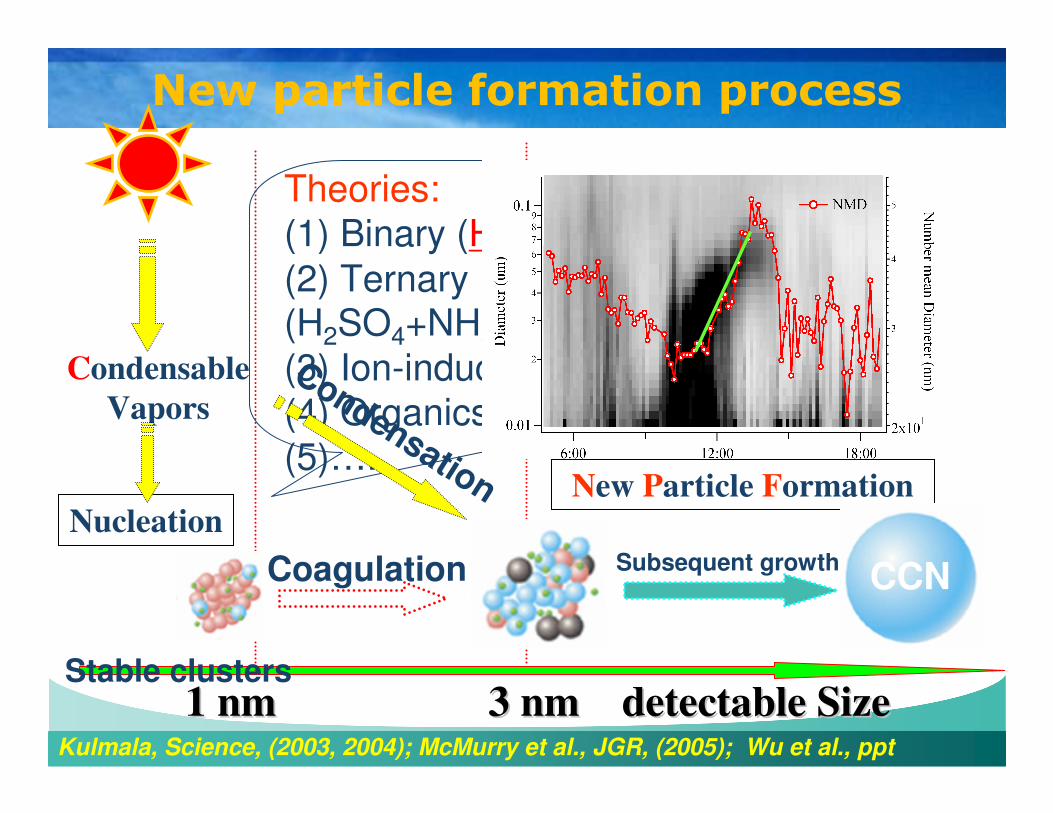
The conc. of
potential CCN
Mt TaiYum et al., 2007Mt. Tai
(McNaughton et al., 2004)
ACE-Asia & TRACE-P
400Km, 200000Km2

Growth Rate (GR) =
Condensational growth
GR(SA)
Cv(SA)
Q(SA)
SO2
OH,,,,Global Change Research Program Atmospheric Chemistry
Model (ACM)
(Bahm et al., 2004)

site seasonGR
(nm h-1)CS(s-1)
C(cm-3)
Q(s-1cm-3)
New Delhi, Indian (suburban)
2002 Oct and Nov
11.6–16.0 0.05–0.0715.8E+7~24.6E+
70.9E+7~1.4E+7
Mount Norikura,Japan2001 Sep2002 Aug
2.6-3.1 0.006-0.002 2-3E+07 1E-4~5
Beijing Urban (urban) 2004-2005 0.1-11.2 spring 0.02 spring 5E+7 spring 1.5E+6
summer 0.025 summer 8E+7 summer 2.8E+6
Po Valley, Italy (urban) 2002-2005 Spring 5.8 0.017
Summer 7.3 0.012Pallas, Northern Finland 2002-2003 spring 2.7 spring 0.00083 spring 4.4E+7 spring 3.9E+4
summer 4.5 summer 0.00065 summer 7.3E+7 summer 6.0E+4
Varrio, Northern Finland (Rural)
2002-2003 spring 2.5 spring 0.00012 spring 4.2E+7 spring 0.5E+4
summer 3.1 summer 0.00115 summer 5.2E+7 summer 7.3E+4
Marseille (urban) 1–19 July 2002 1.1–8.1 0.0032–0.015 1.5E+7~11.1E+7 8.7E+4~1.3E+6
Athens (sub urban) 1–26 June 2003 2.3–11.8 0.0058–0.013 3.1E+7~16.2E+7 2.6E+5~1.6·E+6
SMEAR I Varrio (Rural) 1998–2002 0.8–10.6 0.00006–0.0036 1.1E+7~14.7E+7 1.9E+3~4.8E+5
SMEAR II Hyytiala (Forst) 1997–2001 1.3–5 0.0002–0.007 2.1E+7~8.2E+7 5.0E+3~6.9E+5
SMEAR II Hyytiala (Forst) 1996-2003 spring 2.1 spring 0.0025 spring 7.2E+4
summer 4.5 summer 0.0025 summer 1.54E+5
MT 2007-April spring 3.1 0.022±0.009 4.27E+07 1.00E+06
BJ 2005-July summer 4.5 0.026±0.010 6.15E+07 1.74E+06
SH 2005-May summer 6.01 0.042±0.018 8.23E+07 3.16E+06
�Growth Properties

site TimeGR(SA)
(nm h-1)
C(SA)
(cm-3)
Q(SA)
(s-1cm-3)
SA
(%)SO4
2-/PM2.5
(ug/m3/ug/m3)
Mt Tai
(upper PBL-FT) 2007-April 1.28 1.69E+07 3.64E+05 45.7% 37.4%
Beijing
(rural) 2005-July 1.48 2.06E+07 5.86E+05 24.7% 34.2%
Shanghai
(suburban)2005-May 2.71 3.69E+07 1.38E+06 45.6% 39.4%
�The contribution of H2SO4 to particle growth

LOGO

Chinese Research Academy of Environmental Science
Ministry of Environmental Protection
New particle formation in Central-eastern China: a comparative analysis of measurements from surface to mountain-top
Gao Jian1, Wang Tao1,2, Chai Fahe1, Wang Wenxing1,3
1, Chinese Research Academy of Environment Science2, Hongkong Poly Technic University3, Shandong University