New Paleomagnetic Data on the Anabar Uplift and the Uchur-Maya
22
545 ISSN 1069-3513, Izvestiya, Physics of the Solid Earth, 2009, Vol. 45, No. 7, pp. 545–566. © Pleiades Publishing, Ltd., 2009. Original Russian Text © R.V. Veselovskiy, V.E. Pavlov, P.Yu. Petrov, 2009, published in Fizika Zemli, 2009, No. 7, pp. 3–24. INTRODUCTION The new isotopic-geochronological data increas- ingly frequently contradicts to the traditional concepts concerning the Precambrian geological history of vari- ous key regions and reference sections [Khomen- tovskii, 2005; Khudoley, 2003], and with renewed vigor raise the question about the framework of the applicability in the Precambrian of the traditional his- torical-geological and biostratigraphic methods. In this situation, the vital need of applying the paleomagnetic method is obvious, which gives independent informa- tion. This information can be of great significance for the comparison and correlation of sections, for dating species, and for the solution of different paleogeo- graphic and paleotectonic problems. An important, if not the basic instrument of paleo- magnetic studies of the Precambrian, are the apparent polar wander path (APWPs) and the development of Paleo- and Mesoproterozoic segments, which are becoming increasingly urgent. The APWPs are the time series of either the individual or somehow averaged paleomagnetic poles (including, also, averaging through their analytical approximation). The APWPs are based on the results of the individual paleomagnetic determinations: the larger their number and the higher their quality, the more reliable the corresponding APWP. The new paleomagnetic determinations presented in this work, obtained by us for the Riphean rocks of the Anabar Uplift and the Uchur-Maya region, on the one hand, are intended to make a contribution to the devel- opment of the Mesoproterozoic segment of the APWP of the Siberian Platform and, on the other hand, even now they can be used for solving a number of problems of the stratigraphy and the paleogeography of Siberia. GEOLOGICAL CHARACTERISTICS AND THE AGE OF THE OBJECTS STUDIED The position of the areas under study is schemati- cally shown on the diagram of the Siberian Platform (Fig. 1). More detailed geological diagrams with the New Paleomagnetic Data on the Anabar Uplift and the Uchur-Maya Region and Their Implications for the Paleogeography and Geological Correlation of the Riphean of the Siberian Platform R. V. Veselovskiy a , V. E. Pavlov a , and P. Yu. Petrov b a Institute of Physics of the Earth, Russian Academy of Sciences, ul. Bol’shaya Gruzinskaya 10, Moscow, 123995 Russia b Geological Institute, Russian Academy of Sciences, Pyzhevskii per. 7, Moscow, 119017 Russia Received May 5, 2008; in final form November 20, 2008 Abstract—The results of paleomagnetic studies of the reference sections of the Riphean and Late Proterozoic intrusive bodies of two remote areas of the Siberian Platform are presented. Within the limits of the Uchur- Maya region the sedimentary rocks of the Gonam, Omakhta, Ennin and Konder formations were studied; and the Riphean sedimentary rocks of the Burdur and Kotuykan formations on the northern and western slopes of the Anabar Uplift and, also, the Late Proterozoic intrusive complexes, located in the basins of the Fomich, Magan, Dzhogdzho and Kotuykan Rivers were studied. The paleomagnetic poles obtained in the course of this work and the present-day geochronological data give grounds to assume that: (1) the accumulation of the Riph- ean of the Anabar Uplift occurred after the formation of the Uchurskaya series of the Uchur-Maya region and was completed in approximately 1.5 Ga; (2) the Konder layers, compared according to the correlation pattern accepted at the present time [Semikhatov and Serebryakov, 1983] with the bottoms of the Totta formation, can be related to the appreciably more ancient stratigraphic level; (3) the intrusion of the studied intrusive bodies of the northern and western slopes of the Anabar Uplift occurred nonsimultaneously, although within close time intervals of approximately 1.5 Ga. The estimates of the kinematic parameters of the drift of the Siberian Plat- form within an interval of 1.7–1.0 Ga is carried out. Key words: Paleomagnetism, Siberian Platform, Riphean, Late Proterozoic, Mesoproterozoic, geochronology, stratigraphy, and paleomagnetic pole. PACS numbers: 91.25 Ng DOI: 10.1134/S1069351309070015
Transcript of New Paleomagnetic Data on the Anabar Uplift and the Uchur-Maya

545
ISSN 1069-3513, Izvestiya, Physics of the Solid Earth, 2009, Vol. 45, No. 7, pp. 545–566. © Pleiades Publishing, Ltd., 2009.Original Russian Text © R.V. Veselovskiy, V.E. Pavlov, P.Yu. Petrov, 2009, published in Fizika Zemli, 2009, No. 7, pp. 3–24.
INTRODUCTION
The new isotopic-geochronological data increas-ingly frequently contradicts to the traditional conceptsconcerning the Precambrian geological history of vari-ous key regions and reference sections [Khomen-tovskii, 2005; Khudoley, 2003], and with renewedvigor raise the question about the framework of theapplicability in the Precambrian of the traditional his-torical-geological and biostratigraphic methods. In thissituation, the vital need of applying the paleomagneticmethod is obvious, which gives independent informa-tion. This information can be of great significance forthe comparison and correlation of sections, for datingspecies, and for the solution of different paleogeo-graphic and paleotectonic problems.
An important, if not the basic instrument of paleo-magnetic studies of the Precambrian, are the apparentpolar wander path (APWPs) and the development ofPaleo- and Mesoproterozoic segments, which arebecoming increasingly urgent. The APWPs are the timeseries of either the individual or somehow averaged
paleomagnetic poles (including, also, averagingthrough their analytical approximation). The APWPsare based on the results of the individual paleomagneticdeterminations: the larger their number and the highertheir quality, the more reliable the correspondingAPWP.
The new paleomagnetic determinations presented inthis work, obtained by us for the Riphean rocks of theAnabar Uplift and the Uchur-Maya region, on the onehand, are intended to make a contribution to the devel-opment of the Mesoproterozoic segment of the APWPof the Siberian Platform and, on the other hand, evennow they can be used for solving a number of problemsof the stratigraphy and the paleogeography of Siberia.
GEOLOGICAL CHARACTERISTICSAND THE AGE OF THE OBJECTS STUDIED
The position of the areas under study is schemati-cally shown on the diagram of the Siberian Platform(Fig. 1). More detailed geological diagrams with the
New Paleomagnetic Data on the Anabar Upliftand the Uchur-Maya Region and Their Implicationsfor the Paleogeography and Geological Correlation
of the Riphean of the Siberian Platform
R. V. Veselovskiy
a
, V. E. Pavlov
a
, and P. Yu. Petrov
b
a
Institute of Physics of the Earth, Russian Academy of Sciences, ul. Bol’shaya Gruzinskaya 10, Moscow, 123995 Russia
b
Geological Institute, Russian Academy of Sciences, Pyzhevskii per. 7, Moscow, 119017 RussiaReceived May 5, 2008; in final form November 20, 2008
Abstract
—The results of paleomagnetic studies of the reference sections of the Riphean and Late Proterozoicintrusive bodies of two remote areas of the Siberian Platform are presented. Within the limits of the Uchur-Maya region the sedimentary rocks of the Gonam, Omakhta, Ennin and Konder formations were studied; andthe Riphean sedimentary rocks of the Burdur and Kotuykan formations on the northern and western slopes ofthe Anabar Uplift and, also, the Late Proterozoic intrusive complexes, located in the basins of the Fomich,Magan, Dzhogdzho and Kotuykan Rivers were studied. The paleomagnetic poles obtained in the course of thiswork and the present-day geochronological data give grounds to assume that: (1) the accumulation of the Riph-ean of the Anabar Uplift occurred after the formation of the Uchurskaya series of the Uchur-Maya region andwas completed in approximately 1.5 Ga; (2) the Konder layers, compared according to the correlation patternaccepted at the present time [Semikhatov and Serebryakov, 1983] with the bottoms of the Totta formation, canbe related to the appreciably more ancient stratigraphic level; (3) the intrusion of the studied intrusive bodiesof the northern and western slopes of the Anabar Uplift occurred nonsimultaneously, although within close timeintervals of approximately 1.5 Ga. The estimates of the kinematic parameters of the drift of the Siberian Plat-form within an interval of 1.7–1.0 Ga is carried out.
Key words:
Paleomagnetism, Siberian Platform, Riphean, Late Proterozoic, Mesoproterozoic, geochronology,stratigraphy, and paleomagnetic pole.
PACS numbers: 91.25 Ng
DOI:
10.1134/S1069351309070015

546
IZVESTIYA, PHYSICS OF THE SOLID EARTH
Vol. 45
No. 7
2009
VESELOVSKIY et al.
investigated outcrops superimposed on them, are pre-sented in Figs. 3–5.
The Northern and Western slopes of the Anabar Uplift
The central part of the Anabar Uplift is composed ofthe high metamorphized Archean and Early Proterozoicrocks, which on its periphery are overlapped by the Riph-ean–Paleozoic sedimentary cover. Here, the terrigenousMukun and terrigenocarbonate Billyakh series, which bedmonoclinally with dip angles of several degrees and at someplaces contain dikes and sills of the Late Proterozoic age,are distinguished in the composition of the Riphean [Okru-gin, 1999; Shpunt et al., 1982] (Fig. 2b).
The datings of the fragmental zircons from the bot-toms of the Mukun series indicate that its accumulationbegan not earlier than
1690
±
9
Ma [Khudoley et al.,2007], but judging by the rubidium–strontium andpotassium–argon datings of glauconites from the baseof the Billyakh series [Gorokhov et al., 1991], wascompleted up to 1400 Ma ago. Rb/Sr isotopic data onthe argillites of the Yusmastakhsk formation indicatethat the Billyakh series was formed up to 1250 Ma ago[Gorokhov et al., 2001]. The U/Pb determination executedby Ernst together with co-authors [Ernst et al., 2000] of theisotopic age based on the baddeleyite dikes on the easternslope of the Anabar Uplift, intruding on the lower part of theYusmastakh Formation [Khudoley, 2003], is
1384
±
2
Ma.The determination of the isotopic age of the intrusive bodyof the Fomich River valley (the Sm/Nd method) intrudingon the Ust-Il’ya Formation is
1513
±
51
Ma [Veselovsky
et al., 2006]. Thus, the available isotopic datings make itpossible to state that the larger part of the Anabar Ripheanwas accumulated within the interval between 1690–1380Ma. This conclusion does not contradict the paleontologi-cal [Sergeev, 2003; 2005] and chemostratigraphical data[Knoll et al., 1995].
In the limits of
the western wing of the AnabarUplift
(Fig. 3), in the valleys of the Magan, Dzhogdzho,and Kotuykan Rivers, the intrusive magmatic complexwas studied, which is represented by dikes and sills of dol-erites, intruding on the dolomites of the Kotuykan andYusmastakh Formations. Over approximately 150 km,15 intrusions were sampled. From each body 10–20oriented samples were selected; in a number of cases,the contact zones of intrusions with the host rock werealso tested. K/Ar datings, obtained earlier only for twosills and dikes intersecting them of the DzhogdzhoRiver (Fig. 3, points 4–7, 70), fall in the range from
1397
±
4
to
1007
±
12
Ma [Shpunt et al., 1982]. Accord-ing to [Okrugin, 1999], all intrusive bodies studied byus are related to the region of development of the West-ern-Anabar dike cluster, which was formed in an inter-val of 1400–900 Ma. For paleomagnetic studies thesandstones of the Burdur, Labaztakh, and Ust-Il’yaFormations in the Magan River valley were also tested.
On
the northern slope of the Anabar Uplift
(Fig. 4)in the Fomich River valley, sills with a thickness of sev-eral tens of meters and rare thin (up to 25 m) dikes,composed of dolerites, were sampled. Over more than150 km, at 15 points, eight intrusive bodies were sam-pled. In each of them, not less than ten oriented sampleswere selected. The intrusive bodies of this region relateto the North-Anabar dike cluster, whose age is evalu-ated in the work [Okrugin, 1999] as 1300-900 Ma. Toobtain a more specific dating, from the intrusive body,investigated by us at points 12 and 13, geochemicalsamples were selected, whose Sm/Nd isotopic age was1513
±
51Ma [Veselovskiy et al., 2006]. For the paleo-magnetic analysis the red-colored sandstones of theBurdur Formation (points 11 and 26) and the multicol-ored dolomites of the Kotuykan Formation (points 24and 25) were sampled. For conducting the baked-con-tact test dikes, which intruded on the rocks of both theBurdur (point 11) and the Kotuykan (points 24 and 25)Formations, were sampled.
The Uchur-Maya region (Fig. 5)
For the Riphean rock masses of the Uchur-Mayaregion and magmatic bodies embedded in them thepresent-day isotopic determinations are few in number(Fig. 2b). In the lower horizons of the Uchur series thefragmental zircons with a U/Pb age of
1717
±
32
Ma arefound [Khudoley et al., 1999; 2001], and the dike,intruding on these horizons, has a Sm/Nd age of
1339
±
54
Ma [Khudoley et al., 2007]. The youngest granitoidrocks of the Ulkanskii graben, overlapped by the Uchurseries, have an isochronous U/Pb age obtained for zir-con of
1703
±
18
Ma [Neimark et al., 1992]. The sand-
0 500 km
Lena River
Alda
n
Vilui River
Kotui
Angara
Lower Tunguska River
Lena River
Lake Baikal
5a
5b
3
4
Popigai River
Anabar Massif
Aldanianshield
River
River
River
Fig. 1.
Map-diagram of the Siberian Platform with the notedposition of the study areas: (3) the western slope of the Ana-bar Uplift (Fig. 3); (4) the northern slope of the AnabarUplift (Fig. 4); the Uchur-Maya region: (5a) the Bol’shoiAim River, (5b) the Idyum, Gonam, Uchur, and AlgamaRivers (Fig. 5).
IZVESTIYA, PHYSICS OF THE SOLID EARTH
Vol. 45
No. 7
2009
NEW PALEOMAGNETIC DATA ON THE ANABAR UPLIFT 547
stones of the lower horizons of the Totta Formationcontain the fragmental zircons with a U/Pb age of
1300
±
5
Ma [Khudoley et al., 1999; 2001], and according torecent data about 1100 Ma [Khudoley et al., 2007].Rather numerous Rb/Sr and K/Ar determinations ofisotopic age, obtained in the sixties–eighties based onthe Riphean Formations of the Uchur-Maya region, areoften contradictory and they are, obviously, revived[Semikhatov et al., 1987; 1991; Shenfil, 1991].
We have investigated the sedimentary rocks of theGonam, Omakhta and Ennin Formations of the Uchurseries of the Lower Riphean, and also of the KonderFormation [Nevolin et al., 1978], considered at thepresent time as the lower sub-series of the Totta Forma-tion of the Middle Riphean Kerpyl series [Semikhatovand Serebryakov, 1983]. It should be noted that theKonder layers for a long time were identified with theEnnin Formation [Nuzhnov, 1967; Potapov et al.,
Muk
unse
ries
Bill
yakh
seri
es
Lak
hand
ase
ries
Ker
pyl
seri
esA
im
seri
esU
chur
se
ries
Uyseries
ig
nr
zp
ml
tt
sv
tl
en
gn
om
R
1
R
2
R
3
V
us
kt
ullb
br
il
Lak
hand
ase
ries
Ker
pyl
seri
esA
im
seri
esU
chur
seri
es
Uyseries
ig
nr
zp
ml
tt
sv
tl
en
gn
om
Lak
hand
ase
ries
Ker
pyl
seri
esA
im
seri
esU
chur
seri
es
Uyseries
ig
nr
zp
ml
tt
sv
tl
en
gn
om
Muk
un seri
esB
illya
khse
ries
V
us
kt
ullb
br
il
1
2
2
2
2
VV V
1.0
0.5
0
km
1717< 32 5
( )±
1394< 42 7
( )±
1339 54 6
( )±
1100 8
( )
<1493 34 3
( )±
1513 51 2
( )±
1690< 9 1
( )±
1384 2 4
( )±
The first variant The second variant
(a) (b)
Fig. 2.
Correlation diagrams of the Riphean of the Uchur-Maya region and the Anabar Uplift: (a) classical correlation according to[Semikhatov and Serebryakov, 1983], (b) correlation with the account of the present-day isotopic-chronological “1” [Khudoley etal., 2007] and paleomagnetic “2” (this work) data. Riphean Formations. Uchur-Maya region: Gonam (gn), Omakhta (om), Ennin(en), Talynskaya (tl), Svetlinskaya (sv), Totta (tt), Malginskaya (ml), Tsipandinskaya (zp), Neryuenskaya (nr), and Ignikanskaya(ig). Anabar Uplift: Il’inskaya (il), Burdur (br), Labaztakh (lb), Ustil’nskaya (ul), Kotuykan (kt), and Yusmastakh (us). Vendian (
V
)(Yudomskaya series). Intrusive bodies are conventionally depicted by black vertical strips.(1)
1690
±
9
fragmental zircons, [Khudoley et al., 2007](2)
1513
±
51
the Sm/Nd data, [Veselovskiy et al., 2006](3)
1493
±
34
baddeleyite, (K.R. Chamberlain, privat communication)(4)
1384
±
2
the U/Pb data, [Ernst et al., 2000](5)
1717
±
32
fragmental zircons, [Khudoley et al., 2001](6)
1339
±
54
the Sm/Nd data, the reference in [Khudoley et al., 2007](7)
1394
±
42
fragmental zircons (A.K. Khudoley, privat communication)(8) 1100 fragmental zircons, [Khudoley et al., 2007]
548
IZVESTIYA, PHYSICS OF THE SOLID EARTH
Vol. 45
No. 7
2009
VESELOVSKIY et al.
1974] and the results of the studies conducted by us(see below), possibly, partly support this point of view.The sections of the formations mentioned above werestudied in the valleys of the Mulam, Idyum, Algama,Gonam, Uchur, Bolshoi Aim, and Aim Rivers (Fig. 5),where the rock inclination in the majority of cases doesnot exceed
10°
. The Gonam Formation in ten outcropsstudied is presented by the speckled sandstones, aleu-rites and rare interlayers of dolomites. The rocks of theOmakhta Formation tested at seven points are com-posed of red dolomites, and also by the layers of multi-colored aleurolites and sandstones. The Ennin Forma-tion is tested in the two outcrops, in which it is pre-sented by the reddish sandstones with the rareinterlayers of dolomites. The Konder Formation
selected in the four outcrops is presented by the inter-bedding of multicolored argillites and aleurolites withrare thin bundles of brick-red sandstones.
PALEOMAGNETIC ANALYSIS
Methodology
The laboratory paleomagnetic studies were carriedout in the Institute of Physics of the Earth, Russian Acad-emy of Sciences (Moscow), in the Parisian Institute of Geo-physics and the Munich University in accordance with thestandard methodology [Zijderveld, 1967; Khramov, 1982;Shipunov, 1999; Collinson, 1980; Kirschvink, 1980;McFadden and McElhinny, 1988; 1990; Enkin, 1994; Tors-
Dzh
ogdz
ho
Magan
Kugda
Kotuykan
Berelekh
Dzhogdzh
o
R
1
ktk
2
R
1
uil
2
R
1
br
1
R
1
il
1
50
51
R
1
lb
1
R
2–3
js
R
2–3
js
R
2–3
js
V–C
2
V–C
2
V
st
1
2
3
4
5
7
89
1066
6768
64
6
70
69
65
V–C
2
104
°
70
°
30
′
70
°
10
′
0 10 km
53, 55–58
54
V–C
2
V
st
R
2–3
js
R
1
ktk
2
R
1
br
1
R
1
il
1
R1uil2
R1lb1
1
2
3
4
5
6
7
8
9
10 11 123
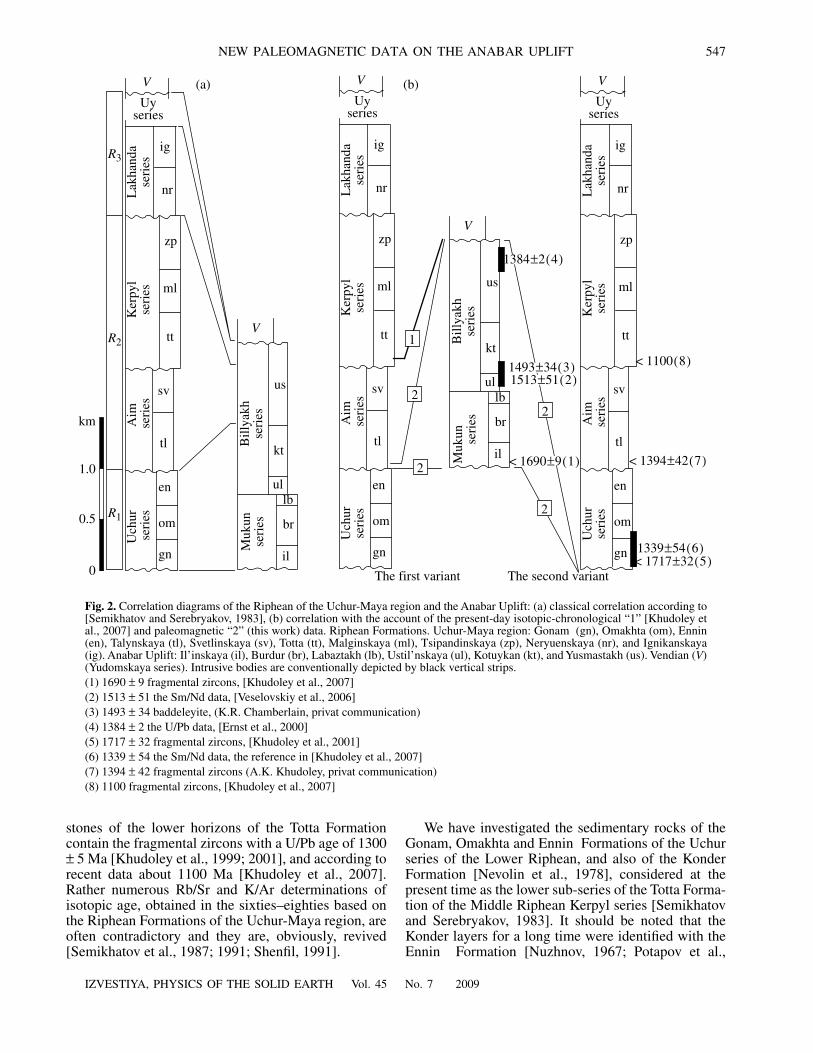
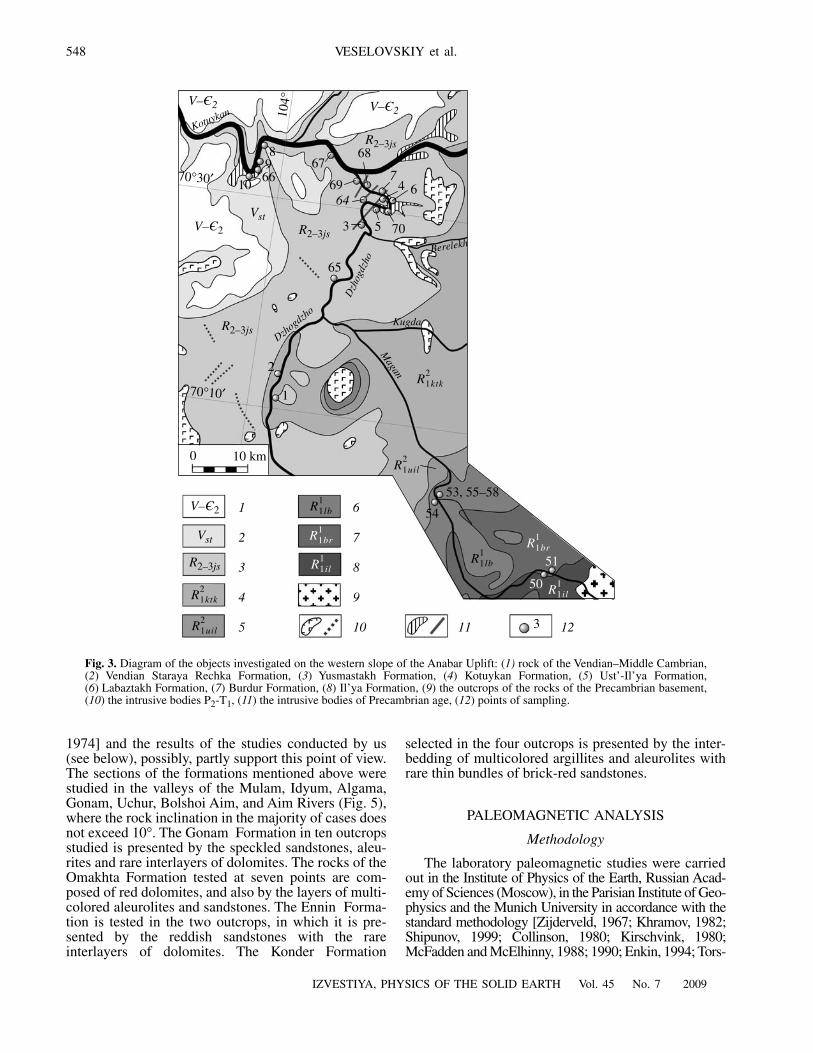
Fig. 3. Diagram of the objects investigated on the western slope of the Anabar Uplift: (1) rock of the Vendian–Middle Cambrian,(2) Vendian Staraya Rechka Formation, (3) Yusmastakh Formation, (4) Kotuykan Formation, (5) Ust’-Il’ya Formation,(6) Labaztakh Formation, (7) Burdur Formation, (8) Il’ya Formation, (9) the outcrops of the rocks of the Precambrian basement,(10) the intrusive bodies P2-T1, (11) the intrusive bodies of Precambrian age, (12) points of sampling.

IZVESTIYA, PHYSICS OF THE SOLID EARTH Vol. 45 No. 7 2009
NEW PALEOMAGNETIC DATA ON THE ANABAR UPLIFT 549
vik et al., 1990]. All samples were subjected to detailed tem-perature cleaning, which was carried out up to temperaturesbetween 580–700°ë.
The number of cleaning steps was usually not less than15, in a number of cases the thoroughness of the cleaningwas increased by up to 25 steps. For thermal demagnetiza-tion of the samples, nonmagnetic furnaces (including“Schonstedt” TSD-2 and TD-48 ASC) with a value of theuncompensated field of not more than 5−10 nT were used.The measurements of remanent magnetization were con-ducted on a 2-G Enterprises cryogenic magnetometer and aJR-4 spin-magnetometer. The measurements of magnetiza-tion were carried out in space, screened from the externalmagnetic field. The processing of measurements was car-ried out with the help of the program packages developedby R. Enkin [Enkin, 1994] and J.P. Cogne [Cogne, 2003], inwhich the PCA method was used for isolation of the mag-netization components [Kirschvink, 1980].
The results of magnetic cleanings
The Western slope of the Anabar Uplift
Temperature cleaning revealed the presence of theclearly interpretive paleomagnetic record at ten sites,which represent nine of fifteen intrusive bodies investi-gated. The natural remanent magnetization of the samplesstudied contains one, two, or three magnetization compo-nents. In the simplest case the only magnetization compo-nent is separated, which is destroyed with heating up to atemperature of approximately 580–595°ë (Fig. 6a) andwhich is connected, apparently, with magnetite. In thecase of two-component magnetization the low- and high-temperature components are separated. The low-tempera-ture component is destroyed under heating up to 190–250°ë and, judging by the direction, has the present-dayage. The high-temperature component is separated in thetemperature range of 190–595°C (Fig. 6b).
In the case of three-component magnetization,besides the components mentioned above, the meantemperature component of magnetization is separated
V–C1
C
Tuguttur River
Billyakh River
Khardakh-
Yuryakh River
Fomich River
106°
71°30′
108°
25
24
2611
12
13
1415
16 17
18
19
2021
23
22
75
0 10 km
C
V–C1
1
2
3
4
5
6
7
8
9
10
R1ktk2
R1lb1
R1br1
R1uil2
R1ktk2
R1ktk2
R1uil2
R1lb1
R1br1
Fig. 4. Diagram of the objects investigated of the northern slope of the Anabar Uplift: (1) Cambrian rocks, (2) Vendian–Lower Cam-brian deposits, (3) Kotuykan Formation, (4) Ust’-Il’ya Formation, (5) Labaztakh Formation, (6) Burdur Formation, (7) the intrusivebodies P2-T1, (8) the intrusive bodies of Precambrian age, (9) the protrusions of Precambrian basement, (10) points of sampling.

550
IZVESTIYA, PHYSICS OF THE SOLID EARTH Vol. 45 No. 7 2009
VESELOVSKIY et al.
within the temperature range of 300–540°ë (Fig. 6c).The mean temperature and high-temperature compo-nents are oppositely directed; however, they are notstrictly antipodal: the angle between them differs from180° by the value of the order of 20°.
The mean temperature component could be theresult of the remagnetization of rocks as a result of theirsecondary heating, the source of which could be either
the younger Proterozoic intrusions or trappean forma-tions of the Permo-Triassic age. However, the tracks ofsuch a reverse magnetization event should be expected inthe paleomagnetic record of all samples in the limits ofone body, but not in the single cases, as is observed here.The direction of the mean temperature component sharplydiffers from the expected direction of the trappean remag-netization that rejects this hypothesis. A possible explana-
R2tt
V–C1
V–C1
V–C1
V–C1
R1en
R1om
R1gn
J3 AR
4
Bol'shoi Aim
Bol'shoi
Aim
Omnya
Less
er A
im
Nika
Lata
58°
133°30′
58°15′
132°30′
133°V–C 1R2tt
R2tt
R2tt
R2ttR1om
R1om
R1om
AR
3978 42
7741
40
Idyum
Mulam
Algama
Gonam
Uchur
Idyum
Algama
Uchur
R 1en
R1om
R1om ARR1gn
AR
R1om
R 1en
AR
R1en
R1gn
R1gn
R1gn
ARR1en
R1enR1om
V–C1
V–C1
R1om
R1en
J3J3
57°
132°
131°
10 0 10 km
31
30
3234
38
28
33
2726
762935
36
37
1
2
3
4
5
6
7
8
9
Aim
(a)
(b)
Fig. 5. Position of the outcrops investigated in the (a) Bol’shoi Aim and (b) Uchur (Uchur-Maya region) River valleys: (1) the UpperJurassic rocks, (2) the Vendian–Lower Cambrian deposits, (3) the Middle Riphean, the Totta Formation/suite; the Lower Riphean,the Uchur series, (4) the Ennin Formation, (5) the Omakhta Formation, (6) the Gonam Formation, (7) the outcrops of the meta-morphic rock of basement, (8) faults, (9) the point of sampling.

IZVESTIYA, PHYSICS OF THE SOLID EARTH Vol. 45 No. 7 2009
NEW PALEOMAGNETIC DATA ON THE ANABAR UPLIFT 551
tion of the observed behavior of direction of the magneti-zation vector can serve the phenomenon of its partial self-reversal, similar to that discovered by us in the basic rocksclose in composition to the Permo-Triassic trappean intru-sion of the Stolbovaya River [Gapeev et al., 2003]. How-ever, it is logical to explain the difference in the high-tem-perature and mean-temperature components from antipo-dality as being due to the incomplete removal of thepresent-day magnetization component during the isolationof the mean-temperature component. This is confirmed bythe fact that the projection of the vector of the mean-tem-perature component on the stereogram lies on the greatcircle, which connects the projections of the vectors of thepresent-day field and the high-temperature component.
Temperature cleanings of the samples of the sedimen-tary rocks of the Burdur, Labaztakh, and Ust’-Il’ya For-mations revealed in them either the present-day magneti-zation component or the extremely noisy paleomagneticsignal, whose interpretation is not possible.
The samples of the sedimentary rocks of the Yusmas-takh Formation, selected from the near-contact zones ofintrusions for conducting the contact baked-contact test,demonstrate an extremely noisy paleomagnetic signal,which cannot be interpreted.
The calculated directions of the high-temperaturemagnetization component of the intrusion bodies of theWestern Anabar region (the mean-temperature componentwas not used in calculations) are given in Table 1 and aredepicted in Fig. 6d.
The following facts give evidence of the primacy of themagnetization of rocks of the intrusive bodies of the val-leys of the Dzhogdzho and Kotuykan Rivers:(a) indication of the possibility of the partial self-reversalof magnetization in several samples, (b) the persistence ofthe chosen components of magnetization over a large ter-ritory, and, also, (c) a difference in the calculated paleo-magnetic poles from the younger poles of the SiberianPlatform. The paleomagnetic pole, which corresponds tothe high-temperature component (Table 3, No. 1), lies inclose vicinity to the Early Middle Riphean paleomagneticpoles of the Angaro-Anabar block of the Siberian Plat-form, obtained earlier by K.M. Konstantinov and E.L.Gurevich (the sills of the Sololi River) and by R. Ernst (theKuonamskii and Chieres dike clusters) (Table 4, Fig. 10,Nos. 19, 20, 27, 28), which also serves as one of the rea-sons for the substantiation of the primacy of magnetizationof the intrusive bodies investigated.
The Northern slope of the Anabar Uplift
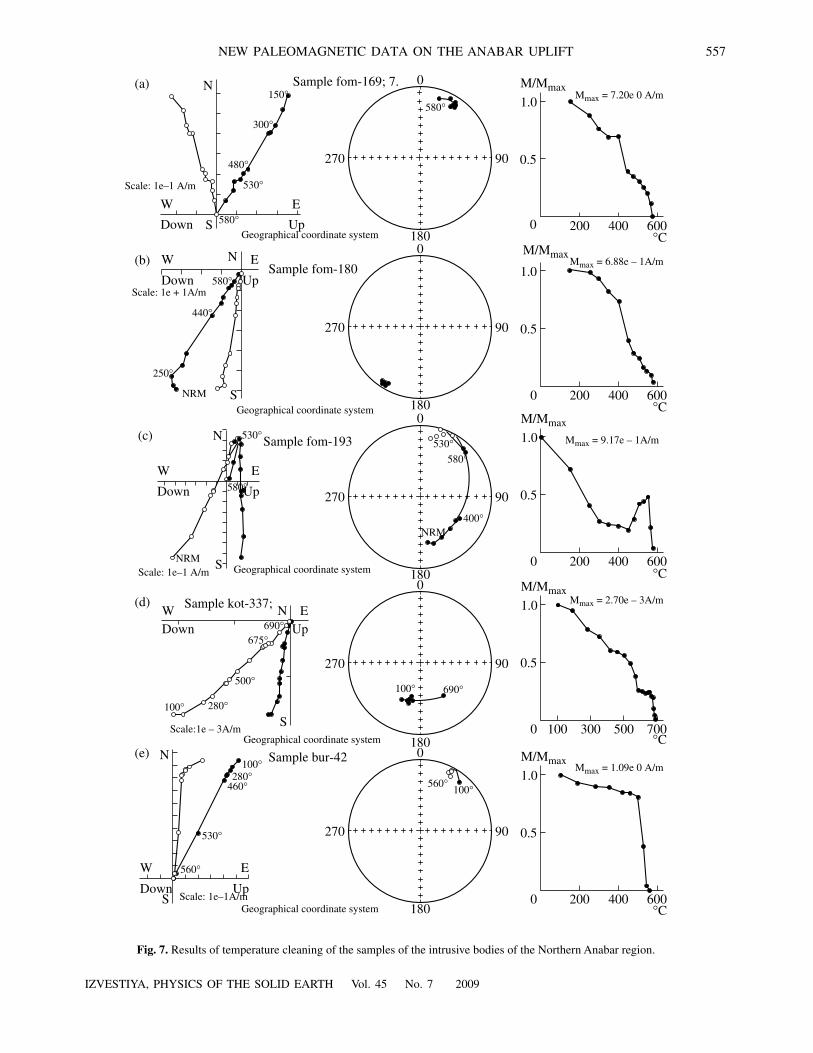
In all outcrops studied, except one (Fig. 4, point 75),the detailed temperature cleanings (after removal at160–250°ë of the present-day magnetization) make itpossible to isolate confidently the ancient high-temper-ature characteristic component (Fig. 7a–7c).
The characteristic component has both direct andreversed polarity, moreover, frequently this can be
observed in the same outcrop (Fig. 4, points 16, 17, 18,20, 22, 23, 24). This magnetization component isdestroyed within the temperature range of 250– 580°ë;its carriers are, obviously, magnetite and low-titanifer-ous titanium-magnetite.
On the study by V.A. Tselmovich (GO “Borok”) ofthe samples from the intrusive bodies of the valley ofthe Fomich River with the help of the “Camebax”microprobe, structures are found of the two-stage high-temperature multiphase oxidation of titanium-magne-tite with the lamellas of ilmenite (hemoilmenite), witha size from 0.2 to 10 µm. According to [Gapeev et al.,1986], large lamellas with a size of 1–10 µm wereformed at a high temperature (tentatively at 1100°ë),and the fine particles, with sizes from 0.3 µm to 0.7 µm,at a temperature of 500–700°ë. These data, togetherwith the limited development of the secondary low-temperature changes in the grains, indicate in favor ofthe thermoremanent nature of the chosen characteristiccomponent of magnetization.
It is important to note that in a number of samplesthe two practically oppositely directed magnetizationcomponents are separated (Fig. 7c), that, by the anal-ogy with the example of magnetization of the rocks ofthe Dzhogdzho River valley given above, can indicatethe partial self-reversal of magnetization.
The reversal test [McFadden and McElhinny, 1990],performed at the sample level shows that the obtaineddirections are statistically (with a 95% confidencelevel) distinguished (γ/γÒ = 12.4°/11.5°). Nevertheless,the mean directions of the direct and reversed polarityare close to antipodality, and the negative result of thereversal test is most naturally explained by the incom-plete removal of the present-day magnetization compo-nent during thermal cleaning. Since a difference in themean directions after reduction to one polarity is small,one should expect that the mean direction, obtainedwith the averaging of data over the objects with directand reverse magnetization, practically would not differfrom the actual direction.
Coincidence of paleomagnetic directions of the dikeand the rocks of the Burdur Formation in outcrop 11and, at the same time, a difference in these directions(γ/γcr = 27.4/5.8) from the corresponding direction ofthe rocks of the Burdur Formation in outcrop 26,located at a noticeable distance (4 km) from the dike,makes it possible to speak about the positive result ofthe contact test (Fig. 8a).
The averaging of the calculated paleomagneticdirections was carried out at the site level. When thesites originally represented a unique magmatic body(Fig. 4, points 12–13; 14–15; 16–17; 21–22), on calcu-lation of the mean direction they were joined. The meandirections of the characteristic magnetization, calcu-lated for each of 11 sites, are shown in Fig. 8d and arepresented in Table 1. The corresponding paleomagneticpole (No. 2) is given in Table 3 and in Fig. 10. The

552
IZVESTIYA, PHYSICS OF THE SOLID EARTH Vol. 45 No. 7 2009
VESELOVSKIY et al.
595°
550°
480°
350°
190°
N
S
W EUp
DownSample kot-9283 scale: 1e–1 A/m
NRMNRM
595°
0
270
180
90
1.0
0.5
0 100200300400500600°C
M/MmaxMmax = 5.96e – 1A/m
Geographical coordinate system
595°570°
510°
350°190°
N
S
W EUp
DownSample kot-9266 scale: 1e–1 A/m
NRM
Geographical coordinate system
NRM595°
0
270
180
90
570°
1.0
0.5
0 100200300400500600°C
M/MmaxMmax = 5.12e – 1A/m
450°
570°
300°
100°
N
S
W E
Up
DownSample djo-9123 scale: 1e–1 A/m
Geographical coordinate system
540°
250°
610°
Geographical coordinate system
1
2
3
4
5
6
7
89
10
The Western Anabar region
0
270
180
90
300°
100°
610°
540°570°
(a)
(b)
(c)
(d)
S
W
Fig. 6. Results of (a)–(c) temperature cleaning of the samples of the intrusive bodies of the Western Anabar region, (d) the meandirections of the characteristic magnetization component for each site and (asterisk) the mean direction of the intrusive bodies inves-tigated of the Western Anabar region.
1.0
0.5
0 100200
300400
500 700°C
M/MmaxMmax = 1.94e – 1A/m
600
IZVESTIYA, PHYSICS OF THE SOLID EARTH Vol. 45 No. 7 2009
NEW PALEOMAGNETIC DATA ON THE ANABAR UPLIFT 553
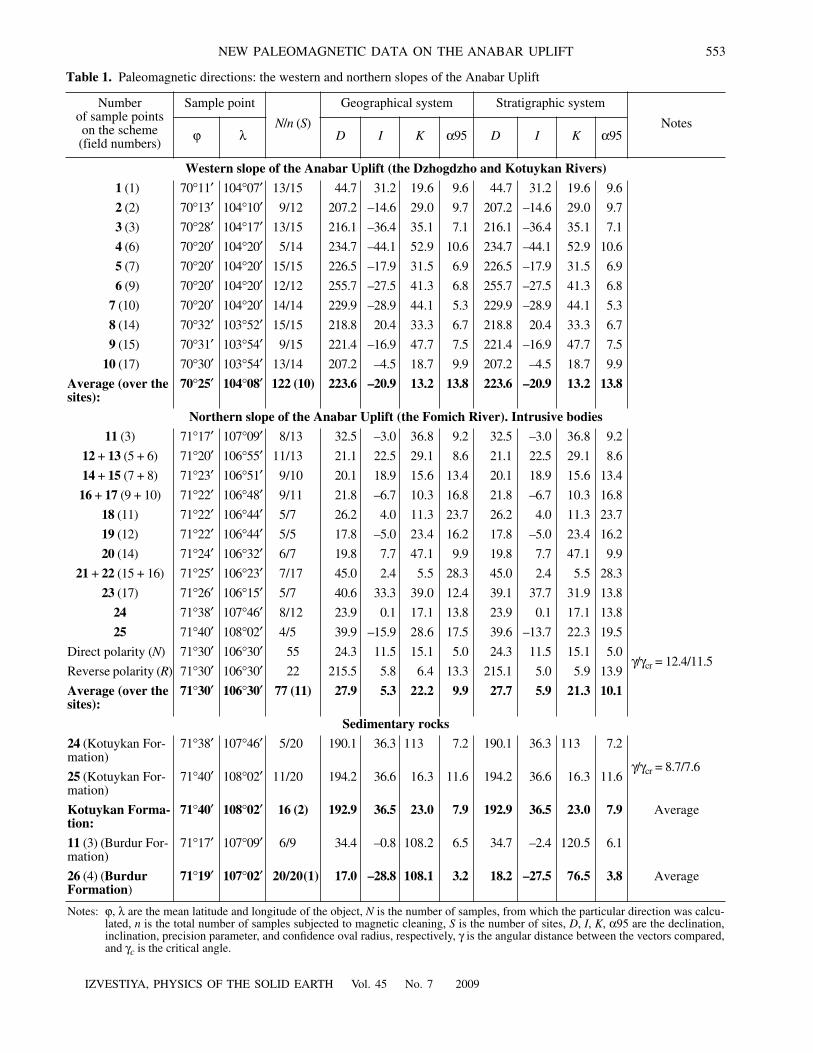
Table 1. Paleomagnetic directions: the western and northern slopes of the Anabar Uplift
Number of sample points on the scheme (field numbers)
Sample point
N/n (S)
Geographical system Stratigraphic system
Notesϕ λ D I K α95 D I K α95
Western slope of the Anabar Uplift (the Dzhogdzho and Kotuykan Rivers)
1 (1) 70°11′ 104°07′ 13/15 44.7 31.2 19.6 9.6 44.7 31.2 19.6 9.6
2 (2) 70°13′ 104°10′ 9/12 207.2 –14.6 29.0 9.7 207.2 –14.6 29.0 9.7
3 (3) 70°28′ 104°17′ 13/15 216.1 –36.4 35.1 7.1 216.1 –36.4 35.1 7.1
4 (6) 70°20′ 104°20′ 5/14 234.7 –44.1 52.9 10.6 234.7 –44.1 52.9 10.6
5 (7) 70°20′ 104°20′ 15/15 226.5 –17.9 31.5 6.9 226.5 –17.9 31.5 6.9
6 (9) 70°20′ 104°20′ 12/12 255.7 –27.5 41.3 6.8 255.7 –27.5 41.3 6.8
7 (10) 70°20′ 104°20′ 14/14 229.9 –28.9 44.1 5.3 229.9 –28.9 44.1 5.3
8 (14) 70°32′ 103°52′ 15/15 218.8 20.4 33.3 6.7 218.8 20.4 33.3 6.7
9 (15) 70°31′ 103°54′ 9/15 221.4 –16.9 47.7 7.5 221.4 –16.9 47.7 7.5
10 (17) 70°30′ 103°54′ 13/14 207.2 –4.5 18.7 9.9 207.2 –4.5 18.7 9.9
Average (over the sites):
70°25′ 104°08′ 122 (10) 223.6 –20.9 13.2 13.8 223.6 –20.9 13.2 13.8
Northern slope of the Anabar Uplift (the Fomich River). Intrusive bodies
11 (3) 71°17′ 107°09′ 8/13 32.5 –3.0 36.8 9.2 32.5 –3.0 36.8 9.2
12 + 13 (5 + 6) 71°20′ 106°55′ 11/13 21.1 22.5 29.1 8.6 21.1 22.5 29.1 8.6
14 + 15 (7 + 8) 71°23′ 106°51′ 9/10 20.1 18.9 15.6 13.4 20.1 18.9 15.6 13.4
16 + 17 (9 + 10) 71°22′ 106°48′ 9/11 21.8 –6.7 10.3 16.8 21.8 –6.7 10.3 16.8
18 (11) 71°22′ 106°44′ 5/7 26.2 4.0 11.3 23.7 26.2 4.0 11.3 23.7
19 (12) 71°22′ 106°44′ 5/5 17.8 –5.0 23.4 16.2 17.8 –5.0 23.4 16.2
20 (14) 71°24′ 106°32′ 6/7 19.8 7.7 47.1 9.9 19.8 7.7 47.1 9.9
21 + 22 (15 + 16) 71°25′ 106°23′ 7/17 45.0 2.4 5.5 28.3 45.0 2.4 5.5 28.3
23 (17) 71°26′ 106°15′ 5/7 40.6 33.3 39.0 12.4 39.1 37.7 31.9 13.8
24 71°38′ 107°46′ 8/12 23.9 0.1 17.1 13.8 23.9 0.1 17.1 13.8
25 71°40′ 108°02′ 4/5 39.9 –15.9 28.6 17.5 39.6 –13.7 22.3 19.5
Direct polarity (N) 71°30′ 106°30′ 55 24.3 11.5 15.1 5.0 24.3 11.5 15.1 5.0γ/γcr = 12.4/11.5
Reverse polarity (R) 71°30′ 106°30′ 22 215.5 5.8 6.4 13.3 215.1 5.0 5.9 13.9
Average (over the sites):
71°30′ 106°30′ 77 (11) 27.9 5.3 22.2 9.9 27.7 5.9 21.3 10.1
Sedimentary rocks
24 (Kotuykan For-mation)
71°38′ 107°46′ 5/20 190.1 36.3 113 7.2 190.1 36.3 113 7.2
γ/γcr = 8.7/7.625 (Kotuykan For-mation)
71°40′ 108°02′ 11/20 194.2 36.6 16.3 11.6 194.2 36.6 16.3 11.6
Kotuykan Forma-tion:
71°40′ 108°02′ 16 (2) 192.9 36.5 23.0 7.9 192.9 36.5 23.0 7.9 Average
11 (3) (Burdur For-mation)
71°17′ 107°09′ 6/9 34.4 –0.8 108.2 6.5 34.7 –2.4 120.5 6.1
26 (4) (Burdur Formation)
71°19′ 107°02′ 20/20 (1) 17.0 –28.8 108.1 3.2 18.2 –27.5 76.5 3.8 Average
Notes: ϕ, λ are the mean latitude and longitude of the object, N is the number of samples, from which the particular direction was calcu-lated, n is the total number of samples subjected to magnetic cleaning, S is the number of sites, D, I, K, α95 are the declination,inclination, precision parameter, and confidence oval radius, respectively, γ is the angular distance between the vectors compared,and γc is the critical angle.

554
IZVESTIYA, PHYSICS OF THE SOLID EARTH Vol. 45 No. 7 2009
VESELOVSKIY et al.
Table 2. Paleomagnetic directions of the rocks investigated of the Uchur-Maya region
Number of sample points on the scheme
(field numbers)
Sample point N/n [C] (S)
Geographical system Stratigraphic systemNotes
ϕ λ D I K α95 D I K α95
Gonam Formation26 (1) 57°11′ 130°57′ 6/30 [1] 212.4 4.0 11.9 20.5 212.5 3.3 12.6 19.927 (2) 57°10′ 131°01′ 12/50 [2] 38.6 11.8 10.8 13.9 38.3 12.0 10.7 13.928 (3) 57°17′ 131°06′ 13/15 44.4 11.5 17.5 10.2 43.4 13.5 16.3 10.629 (4) 56°31′ 131°14′ 3/15 [1] 32.8 1.6 7.5 57.1 34.2 4.3 7.5 56.830 (14) 57°08′ 131°26′ 5/20 [1] 44.4 11.9 92.3 8.2 43.6 14.2 529.7 3.431 (16) 57°11′ 131°20′ 4/20 16.0 8.6 12.8 26.7 16.4 6.3 11.4 28.532 (17) 57°14′ 131°10′ 6/19 [2] 24.5 10.2 8.2 25.7 24.6 13.1 6.8 28.433 (18) 57°14′ 131°09′ 4/19 35.4 20.7 18.8 21.7 37.4 25.3 18.0 22.334 (19) 57°16′ 131°09′ 6/20 [1] 13.4 8.3 4.6 35.1 13.9 3.0 4.9 33.9
Average (over sites): 57°00′ 131°15′ 9 31.3 9.1 38.4 8.4 31.5 10.0 35.6 8.7 Except 36Average (over sam-ples): N
57°00′ 131°15′ 53 38.5 9.8 17.8 5.4 38.2 11.8 17.8 5.4 γ/γcr = 8.4/15.4
Average (over sam-ples): R
57°00′ 131°15′ 6 212.4 4.0 11.9 20.5 212.5 3.3 12.6 19.9
Average (over sam-ples):
57°00′ 131°15′ 59 (9) 36.8 6.8 15.6 5.3 36.5 8.8 15.6 5.3 Except 36
Omakhta Formation35 (5) 56°29′ 131°23′ 8/22 [1] 167.6 17.5 18.9 13.2 166.8 9.9 19.9 12.8
36 (12) (“Om-A” com-ponent)
56°29′ 131°45′ 16/19 [1] 122.7 –65.0 80.8 4.1 50.2 –60.3 91.0 3.9
37 (13) (“Om-A” com-ponent)
56°29′ 131°45′ 17/22 41.5 –51.9 90.9 3.8 43.3 –52.2 67.3 4.4
37 (13) (“Om-B” com-ponent)
56°29′ 131°45′ 5/22 42.2 0.3 51.9 10.7 42.0 4.1 68.9 9.3
38 (20) (“Om-C” com-ponent)
57°23′ 131°14′ 7/26 [3] 33.2 –33.6 69.1 5.9 33.2 –33.6 69.1 5.9
38 (20o) (“Om-B” component)
57°23′ 131°14′ 7/26 41.1 –2.0 34.3 10.5 40.2 2.3 51.5 8.5
39 (30) (“Om-30” component)
58°22′ 133°18′ 16/29 254.0 30.0 128.3 3.3 251.3 33.9 107.0 3.6
34 + 40 + 39(19o + 23 + 30)(“Om-B” component)
57°37′ 132°00′ 4/74 [3] 36.3 –9.4 18.6 21.9 36.1 –10.6 27.6 17.8
“Om-A” (average): 56°29′ 131°45′ 31 (2) 67.9 –63.5 13.9 7.2 45.9 –55.4 69.6 3.1 Over samples”Om-B” (average): 57°00′ 132°00′ 16 (5) 41.7 –0.6 48.4 5.8 41.2 2.1 66.8 4.9 Over samples
Gonam and Omakhta Formations“WEST” component 57°00′ 132°00′ 17/69 (3) 263.9 0.0 40.3 5.7 263.7 1.8 46.2 5.3 38 + 39 + 32
(20o + 30 + 17)“J-60” component 57°00′ 132°00′ 19/93 (4) 261.7 58.0 55.6 4.5 261.5 58.1 46.3 5.0 35 + 34 + 38 + 40
(5 + 19g + 20g + 23)Konder Formation
41 (25) 57°52′ 133°07′ 13/20 46.4 –32.4 10.7 13.3 48.1 –28.9 11.1 13.042 (28) 58°18′ 133°33′ 9/16 53.4 –48.4 36.3 8.7 54.7 –42.5 43.9 7.9
Average (over sam-ples): N
58°05′ 133°19′ 15 47.2 –39.6 14.4 10.5 47.8 –34.5 15.4 10.1 γ/γcr = 7.4/18.3
Average (over sam-ples): R
58°05′ 133°19′ 7 232.8 38.4 10.6 19.5 236.8 35.0 12.4 17.9
Average (over sam-ples):
58°05′ 133°19′ 22 (2) 49.0 –39.2 13.5 8.8 50.6 –34.8 14.7 8.4
Notes: ϕ, λ are the mean latitude and longitude of the object, N is the number of samples, from which the particular direction was calcu-lated, n is the total number of samples subjected to magnetic cleaning, C is the number of remagnetization circles, S is the numberof sites, D, I, K, α95 are the declination, inclination, precision parameter, and confidence oval radius, respectively, γ is the angulardistance between the vectors compared, and γc is the critical angle.
IZVESTIYA, PHYSICS OF THE SOLID EARTH Vol. 45 No. 7 2009
NEW PALEOMAGNETIC DATA ON THE ANABAR UPLIFT 555
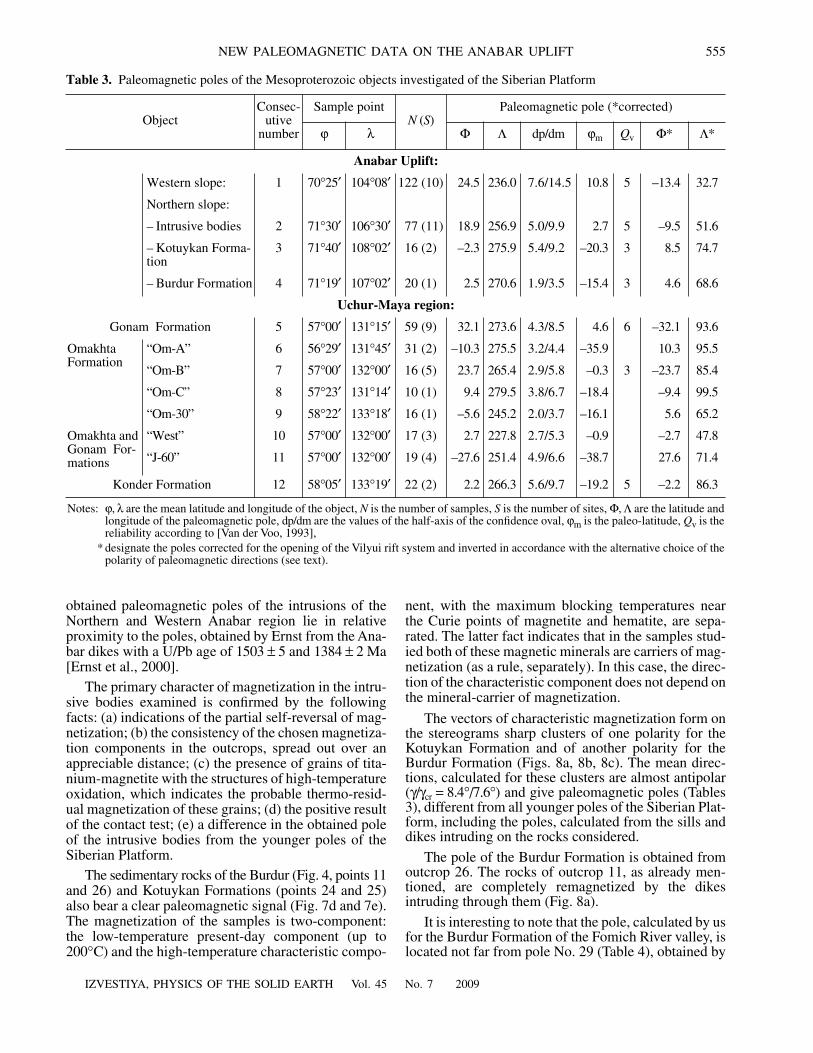
Table 3. Paleomagnetic poles of the Mesoproterozoic objects investigated of the Siberian Platform
ObjectConsec-
utive number
Sample pointN (S)
Paleomagnetic pole (*corrected)
ϕ λ Φ Λ dp/dm ϕm Qv Φ* Λ*
Anabar Uplift:
Western slope: 1 70°25′ 104°08′ 122 (10) 24.5 236.0 7.6/14.5 10.8 5 –13.4 32.7
Northern slope:
– Intrusive bodies 2 71°30′ 106°30′ 77 (11) 18.9 256.9 5.0/9.9 2.7 5 –9.5 51.6
– Kotuykan Forma-tion
3 71°40′ 108°02′ 16 (2) –2.3 275.9 5.4/9.2 –20.3 3 8.5 74.7
– Burdur Formation 4 71°19′ 107°02′ 20 (1) 2.5 270.6 1.9/3.5 –15.4 3 4.6 68.6
Uchur-Maya region:
Gonam Formation 5 57°00′ 131°15′ 59 (9) 32.1 273.6 4.3/8.5 4.6 6 –32.1 93.6
Omakhta Formation
“Om-A” 6 56°29′ 131°45′ 31 (2) –10.3 275.5 3.2/4.4 –35.9 10.3 95.5
“Om-B” 7 57°00′ 132°00′ 16 (5) 23.7 265.4 2.9/5.8 –0.3 3 –23.7 85.4
“Om-C” 8 57°23′ 131°14′ 10 (1) 9.4 279.5 3.8/6.7 –18.4 –9.4 99.5
“Om-30” 9 58°22′ 133°18′ 16 (1) –5.6 245.2 2.0/3.7 –16.1 5.6 65.2
Omakhta and Gonam For-mations
“West” 10 57°00′ 132°00′ 17 (3) 2.7 227.8 2.7/5.3 –0.9 –2.7 47.8
“J-60” 11 57°00′ 132°00′ 19 (4) –27.6 251.4 4.9/6.6 –38.7 27.6 71.4
Konder Formation 12 58°05′ 133°19′ 22 (2) 2.2 266.3 5.6/9.7 –19.2 5 –2.2 86.3
Notes: ϕ, λ are the mean latitude and longitude of the object, N is the number of samples, S is the number of sites, Φ, Λ are the latitude andlongitude of the paleomagnetic pole, dp/dm are the values of the half-axis of the confidence oval, ϕm is the paleo-latitude, Qv is thereliability according to [Van der Voo, 1993],
* designate the poles corrected for the opening of the Vilyui rift system and inverted in accordance with the alternative choice of thepolarity of paleomagnetic directions (see text).
obtained paleomagnetic poles of the intrusions of theNorthern and Western Anabar region lie in relativeproximity to the poles, obtained by Ernst from the Ana-bar dikes with a U/Pb age of 1503 ± 5 and 1384 ± 2 Ma[Ernst et al., 2000].
The primary character of magnetization in the intru-sive bodies examined is confirmed by the followingfacts: (a) indications of the partial self-reversal of mag-netization; (b) the consistency of the chosen magnetiza-tion components in the outcrops, spread out over anappreciable distance; (c) the presence of grains of tita-nium-magnetite with the structures of high-temperatureoxidation, which indicates the probable thermo-resid-ual magnetization of these grains; (d) the positive resultof the contact test; (e) a difference in the obtained poleof the intrusive bodies from the younger poles of theSiberian Platform.
The sedimentary rocks of the Burdur (Fig. 4, points 11and 26) and Kotuykan Formations (points 24 and 25)also bear a clear paleomagnetic signal (Fig. 7d and 7e).The magnetization of the samples is two-component:the low-temperature present-day component (up to200°ë) and the high-temperature characteristic compo-
nent, with the maximum blocking temperatures nearthe Curie points of magnetite and hematite, are sepa-rated. The latter fact indicates that in the samples stud-ied both of these magnetic minerals are carriers of mag-netization (as a rule, separately). In this case, the direc-tion of the characteristic component does not depend onthe mineral-carrier of magnetization.
The vectors of characteristic magnetization form onthe stereograms sharp clusters of one polarity for theKotuykan Formation and of another polarity for theBurdur Formation (Figs. 8a, 8b, 8c). The mean direc-tions, calculated for these clusters are almost antipolar(γ/γcr = 8.4°/7.6°) and give paleomagnetic poles (Tables3), different from all younger poles of the Siberian Plat-form, including the poles, calculated from the sills anddikes intruding on the rocks considered.
The pole of the Burdur Formation is obtained fromoutcrop 26. The rocks of outcrop 11, as already men-tioned, are completely remagnetized by the dikesintruding through them (Fig. 8a).
It is interesting to note that the pole, calculated by usfor the Burdur Formation of the Fomich River valley, islocated not far from pole No. 29 (Table 4), obtained by
556
IZVESTIYA, PHYSICS OF THE SOLID EARTH Vol. 45 No. 7 2009
VESELOVSKIY et al.
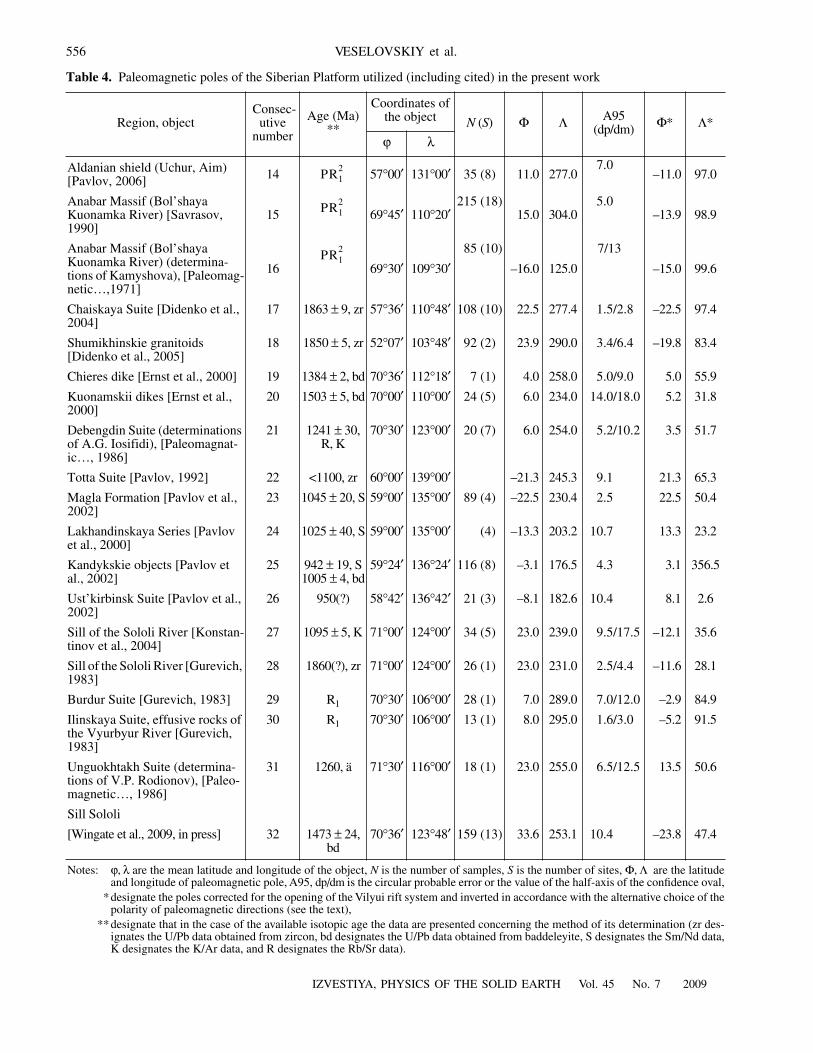
Table 4. Paleomagnetic poles of the Siberian Platform utilized (including cited) in the present work
Region, object Consec-
utive number
Age (Ma) **
Coordinates of the object N (S) Φ Λ A95
(dp/dm) Φ* Λ*
ϕ λ
Aldanian shield (Uchur, Aim) [Pavlov, 2006] 14 P 57°00′ 131°00′ 35 (8) 11.0 277.0
7.0–11.0 97.0
Anabar Massif (Bol’shaya Kuonamka River) [Savrasov, 1990]
15 P 69°45′ 110°20′215 (18)
15.0 304.05.0
–13.9 98.9
Anabar Massif (Bol’shaya Kuonamka River) (determina-tions of Kamyshova), [Paleomag-netic…,1971]
16P
69°30′ 109°30′85 (10)
–16.0 125.0
7/13
–15.0 99.6
Chaiskaya Suite [Didenko et al., 2004]
17 1863 ± 9, zr 57°36′ 110°48′ 108 (10) 22.5 277.4 1.5/2.8 –22.5 97.4
Shumikhinskie granitoids [Didenko et al., 2005]
18 1850 ± 5, zr 52°07′ 103°48′ 92 (2) 23.9 290.0 3.4/6.4 –19.8 83.4
Chieres dike [Ernst et al., 2000] 19 1384 ± 2, bd 70°36′ 112°18′ 7 (1) 4.0 258.0 5.0/9.0 5.0 55.9
Kuonamskii dikes [Ernst et al., 2000]
20 1503 ± 5, bd 70°00′ 110°00′ 24 (5) 6.0 234.0 14.0/18.0 5.2 31.8
Debengdin Suite (determinations of A.G. Iosifidi), [Paleomagnat-ic…, 1986]
21 1241 ± 30,R, K
70°30′ 123°00′ 20 (7) 6.0 254.0 5.2/10.2 3.5 51.7
Totta Suite [Pavlov, 1992] 22 <1100, zr 60°00′ 139°00′ –21.3 245.3 9.1 21.3 65.3
Magla Formation [Pavlov et al., 2002]
23 1045 ± 20, S 59°00′ 135°00′ 89 (4) –22.5 230.4 2.5 22.5 50.4
Lakhandinskaya Series [Pavlov et al., 2000]
24 1025 ± 40, S 59°00′ 135°00′ (4) –13.3 203.2 10.7 13.3 23.2
Kandykskie objects [Pavlov et al., 2002]
25 942 ± 19, S 1005 ± 4, bd
59°24′ 136°24′ 116 (8) –3.1 176.5 4.3 3.1 356.5
Ust’kirbinsk Suite [Pavlov et al., 2002]
26 950(?) 58°42′ 136°42′ 21 (3) –8.1 182.6 10.4 8.1 2.6
Sill of the Sololi River [Konstan-tinov et al., 2004]
27 1095 ± 5, K 71°00′ 124°00′ 34 (5) 23.0 239.0 9.5/17.5 –12.1 35.6
Sill of the Sololi River [Gurevich, 1983]
28 1860(?), zr 71°00′ 124°00′ 26 (1) 23.0 231.0 2.5/4.4 –11.6 28.1
Burdur Suite [Gurevich, 1983] 29 R1 70°30′ 106°00′ 28 (1) 7.0 289.0 7.0/12.0 –2.9 84.9
Ilinskaya Suite, effusive rocks of the Vyurbyur River [Gurevich, 1983]
30 R1 70°30′ 106°00′ 13 (1) 8.0 295.0 1.6/3.0 –5.2 91.5
Unguokhtakh Suite (determina-tions of V.P. Rodionov), [Paleo-magnetic…, 1986]
31 1260, ä 71°30′ 116°00′ 18 (1) 23.0 255.0 6.5/12.5 13.5 50.6
Sill Sololi
[Wingate et al., 2009, in press] 32 1473 ± 24, bd
70°36′ 123°48′ 159 (13) 33.6 253.1 10.4 –23.8 47.4
Notes: ϕ, λ are the mean latitude and longitude of the object, N is the number of samples, S is the number of sites, Φ, Λ are the latitudeand longitude of paleomagnetic pole, A95, dp/dm is the circular probable error or the value of the half-axis of the confidence oval,
*designate the poles corrected for the opening of the Vilyui rift system and inverted in accordance with the alternative choice of thepolarity of paleomagnetic directions (see the text),
**designate that in the case of the available isotopic age the data are presented concerning the method of its determination (zr des-ignates the U/Pb data obtained from zircon, bd designates the U/Pb data obtained from baddeleyite, S designates the Sm/Nd data,K designates the K/Ar data, and R designates the Rb/Sr data).
R12
R12
R12
IZVESTIYA, PHYSICS OF THE SOLID EARTH Vol. 45 No. 7 2009
NEW PALEOMAGNETIC DATA ON THE ANABAR UPLIFT 557
150°
300°
480°
N
S
W E
UpDown
Sample fom-169; 7.
Scale: 1e–1 A/m
0
270
180
90
Geographical coordinate system
580°
250°
440°
N
S
W E
UpDown
Scale: 1e–1 A/m
NRM
1.0
0.5
0 200 400 600°C
M/MmaxMmax = 7.20e 0 A/m
400°
675°
100°
500°
N
S
W E
UpDown
Scale:1e – 3A/mGeographical coordinate system
690°
280°
530°
(a)
(b)
(c)
(d)
1.0
0.5
0 200 400 600°C
M/MmaxMmax = 6.88e – 1A/m
1.0
0.5
0 200 400 600°C
M/Mmax
Mmax = 9.17e – 1A/m
1.0
0.5
0 200 400 600°C
M/MmaxMmax = 1.09e 0 A/m
1.0
0.5
0 100 300 500 700°C
M/MmaxMmax = 2.70e – 3A/m
0
270
180
90
0
270
180
90
0
270
180
90
0
270
180
90
530°
580°
Geographical coordinate system
Sample fom-180
Scale: 1e + 1A/m
580°
530°
580°
580°
NRM
NRM
Geographical coordinate system
Sample fom-193
N
S
W EUpDown
Sample kot-337;
100° 690°
N
S
W E
Down UpScale: 1e–1A/m
100°280°
460°
530°
560°
560°100°
Geographical coordinate system
Sample bur-42(e)
Fig. 7. Results of temperature cleaning of the samples of the intrusive bodies of the Northern Anabar region.

558
IZVESTIYA, PHYSICS OF THE SOLID EARTH Vol. 45 No. 7 2009
VESELOVSKIY et al.
E.L. Gurevich [Gurevich, 1983] from the rocks of thesame formation, that are outcropped several hundredkilometers southward, in the Kotuykan River valley.The directions, obtained in the Kotuykan Formation,are also maintained over the territory: close directionswere obtained by us for two outcrops (24 and 25) of theKotuykan Formation, spread over a distance of approx-imately 10 km.
The following facts confirm that the characteristicmagnetization component, isolated in the rocks of theBurdur and Kotuykan Formations, was formed duringor soon after the formation of these rocks: (a) the con-stancy of directions at large distances; (b) the presenceof the almost antipolar vectors of direct and reversedpolarity; (c) a difference in the calculated poles fromthe younger poles of the Siberian Platform and relativeproximity to the poles of close age; (d) the indepen-dence of the defined direction (in the Kotuykan Forma-tion) from the magnetic mineralogy.
The Uchur-Maya region
The Gonam Formation
In the samples from the tested outcrops of theGonam Formation, with the exception of section 38(Fig. 5b), in spite of the predominantly low quality ofthe paleomagnetic signal, it was possible to isolate thecomponents of natural remanent magnetization. In themajority of cases the low-temperature (present-day)and high-temperature (characteristic) magnetizationcomponents are separated (Fig. 9a). The latter is sepa-rated within the temperature range of 250– 670°ë, andit has both the direct and reversed polarity, passes thereversal test (γ/γcr = 8.4/15.4) and is connected withhematite. In several samples, in which we failed tocarry out the complete separation of the magnetizationcomponents, the remagnetization circles were calcu-lated. The directions of the identified characteristiccomponents of nine sites of the Gonam Formationdensely group around their average (Fig. 9h; Table 2).
Geographical coordinate system
The Burdur Suite
The Burdur Suite
Kotuykan SuiteKotuykan
SuiteDike
Exocontact
Dike
Point 25Point 24Points 11 and 26
Dike
Exocontact
(t. 11)(t. 11)
(t. 11)(t. 26)
N
S
W
E
E
W
S
N
(intrusive bodies)The Northern Anabar region
16 + 17
19
20
2418
1114 + 15
12 + 1321 + 22
2325
1. (a) (b) (c)
(d)
Fig. 8. Stereograms, which illustrate the directions of the identified magnetization components in four outcrops of the Fomich Rivervalley: (a) completely remagnetized by the intruded dike of the rock of the Burdur Formation of outcrop (3) and the mean magne-tization direction of the samples of outcrop (4) of the Burdur Formation; (b) the magnetization direction of the rocks of the KotuykanFormation and the adjacent intrusive body (outcrop 24); (c) the same for outcrop 25; (d) the mean directions of the characteristicmagnetization component for each site and the mean direction of the intrusive bodies investigated in the Northern Anabar region(designated by an asterisk).

IZVESTIYA, PHYSICS OF THE SOLID EARTH Vol. 45 No. 7 2009
NEW PALEOMAGNETIC DATA ON THE ANABAR UPLIFT 559
The following facts indicate in favor of the ancientmagnetization of rocks of the Gonam Formation:(a) the direction of the identified high-temperaturemagnetization component is preserved from one section toanother and the distance between them is 150 km; (b) thepresence of the high-temperature magnetization com-ponents of two polarities; and (c) a difference in theobtained paleomagnetic pole from the younger poles ofthe Siberian Platform.
The Omakhta Formation
A considerable part of the samples studied of theOmakhta Formation demonstrate an extremely noisysignal, which makes these samples unsuitable for pale-omagnetic study. In those cases, when the quality of thepaleomagnetic record nevertheless makes it possible tocarry out an interpretation, the component analysis iscomplicated because of the presence of several magne-tization components (Table 2).
In the samples from outcrop 37 (Fig. 5b), besidesthe present-day low-temperature magnetization com-ponent, two more components are separated: the meantemperature component “Om-A” (up to ~615°ë) andthe high-temperature component “Om-B” (up to675°ë) (Fig. 9b).
From the stratotype of the Omakhta Formation, nearthe Berdyakit stream (Fig. 5b, outcrop 38), altogether,140 samples were selected and it was possible to carryout component analysis only for 14 of them (excludingthe samples, completely remagnetized by the present-day field). Here it is possible to isolate two magnetiza-tion components: the mean-temperature component“Om-C” (520–630°ë) (Fig. 9c) and the high-tempera-ture component “Om-B” (630–680°ë), which has adirection similar with the direction of the magnetiza-tion component with the same name of the samplesfrom outcrop 37.
The samples, selected from outcrop 39 (Fig. 5a),demonstrate the presence of the high-temperature mag-netization component (540–690°ë), designated by us as“Om-30” (Fig. 9d). In one sample component “Om-B”is present.
In unique samples from outcrops 34 and 40 it is alsopossible to detect the presence of the high-temperaturemagnetization component “Om-B” (500–670°ë). Themean direction of the high-temperature component “Om-B” for all five outcrops of the rocks of the Omakhta For-mation, where it is separated, is given in Table 2.
Magnetization components “Om-A”, “Om-C” and“Om-30” are separated in some of the outcrops or in theclosely adjacent sites. Possibly, their origin is caused bycertain local reverse magnetization events, whichappeared in the concrete outcrops. Relying on the posi-tion of poles “Om-A”, “Om-C” and “Om-30” betweenthe poles of the Uchur series (see below) and the polesof the Burdur and Kotuykan Formations of the Anabar
Uplift (Fig. 10, Nos. 3 and 4), such events could occurin the course of time after the accumulation of the Oma-khta Formation up to the beginning of the formation ofthe Burdur deposits.
By reason of the geological conditions of the studyarea it is possible to present only several arguments infavor of the Omakhta age of component “Om-B”: (a) it,in contrast to all remaining components, is identified infive of the outcrops studied, which are located at a dis-tance of about 100 km from each other; (b) the paleo-magnetic pole (Table 3) calculated from the meandirection of component “Om-B” lies close to the pole ofthe Gonam Formation, which appears logical, takinginto consideration the absence of interruption in thesedimentation between the Gonam and Omakhta For-mations; (c) the pole of component “Om-B” differsfrom the younger poles of Siberia.
It should be noted that in six outcrops studied of boththe Gonam and Omakhta Formations, the two additionalmagnetization components “J-60” (Fig. 9f) and “West”(Fig. 9e) are confidently identified. In the majority ofsamples these components are unique (with the rareexception of the low-temperature present-day magneti-zation component) and they have exclusively one polar-ity. The pole of component “West” lies in the region ofthe location of the poles of the intrusive bodies of theAnabar Uplift, and the pole, which corresponds to com-ponent “J-60”, is located in immediate proximity to thepole of the Totta Formation [Pavlov, 1992] (Fig. 10,No. 22). The components indicated are, in all likeli-hood, the result of the regional remagnetization, whoseage can be evaluated as Mesoproterozoic.
The Ennin Formation
The natural remanent magnetization of all samplesis present as either the present-day magnetization com-ponent or by an extremely noisy signal and it cannot besubjected to interpretation.
The Konder Formation
Of the four outcrops tested, it was possible to iden-tify the magnetization components in only two of them(outcrops 41 and 42, Fig. 5a), spaced-apart over 40 km.The natural remanent magnetization of samples fromthese outcrops is connected, predominantly, with hematiteand represented by two components (Fig. 9g): by the low-temperature present-day (up to 240°ë) and by the high-temperature (300–700°ë) bipolar characteristic compo-nents. The identified high-temperature component suc-cessfully passes the reversal test (γ/γcr = 7.4 /18.3; Fig. 9i).In the other two outcrops the rocks are either remagne-tized by the recent magnetic field or the directions ofthe stable magnetization component, identified in sepa-rate samples, are distributed chaotically.
The calculated pole of the Konder Formation (Table 3,Fig. 10, No. 12) lies in the equatorial region in the local-ization area of the poles of the magnetization compo-

560
IZVESTIYA, PHYSICS OF THE SOLID EARTH Vol. 45 No. 7 2009
VESELOVSKIY et al.
N
EUp
Sample gon-316
N
N
Scale: 0.1 mA/m;
(a)
(b)
(c)
(d) 1.0
0.5
0 100 300 500 700°C
M/MmaxMmax = 0.6 mA/m
N
E
Sample om-743
Up
N
N
N
N
N
1.0
0.5
0 100 300 500 700°C
M/MmaxMmax = 1.71 mA/m
1.0
0.5
0 100 300 500 700°C
M/MmaxMmax = 3.35 mA/m
1.0
0.5
0 100 300 500 700°C
M/MmaxMmax = 12.2 mA/m
“Om-30”component
100°
675°
“Om–30”
N
NN
E
E
Up
Up
Scale: 0.2 mA/m
Stratigraphic coordinate system
100°655°
675°
500°350°
Sample om-524
Stratigraphic coordinate system
Stratigraphic coordinate systemScale: 1 mA/m
100°
680°
635° 460°
590°
280°
“Om–C”
“Om
–B”
“Om–A”
100°
350°
615°
675°
“Om
–B”
460°590°
Sample om-299
100°615°
675°
Stratigraphic coordinate system
Scale: 2 mA/m
650°
495°
150° 370°
NRM
690°
Fig. 9. Results of temperature cleaning of the samples of sedimentary rocks of the Uchur-Maya region. Zijderveld diagrams, ste-reograms and demagnetization curves of samples of the (a) Gonam , (b)–(f) Omakhta, and (g) Konder Formations. Stereograms,which illustrate the directions of the identified magnetization components in the rocks of the Uchur-Maya region: (h) the GonamFormation, (i) the Konder Formation, (j) the Omakhta Formation.
NEUp
Scale: 0.5 mA/m
Stratigraphic coordinate system
Sample om-518(e)
E
N1.0
0.5
0 100 300 500 700°C
M/MmaxMmax = 1.69 mA/m
665°
100°
680°280°
680°
100°“West”component
675°

IZVESTIYA, PHYSICS OF THE SOLID EARTH Vol. 45 No. 7 2009
NEW PALEOMAGNETIC DATA ON THE ANABAR UPLIFT 561
Scale: 0.5 mA/m
(f)
(g)1.0
0.5
0 100 300 500 700°C
M/Mmax Mmax = 13.9 mA/m
N E
Sample tot-704
Up
NN
N
1.0
0.5
0 100 300 500 700°C
M/MmaxMmax = 1.99 mA/m
“J-60” component
677°
NN
E
Up
Scale: 2 mA/m
Stratigraphic coordinate system
490°
660°
570°
Sample om-496
Stratigraphic coordinate system
300°
635°
415°600°
677°
NRM
330°
180°
NRM
660°
330° NRM
NRM
Stratigraphic coordinate system Stratigraphic coordinate system
Gonam Suite The Konder Suite
332827
26
29
3231
30
34
R
N
NN
N
Stratigraphic coordinate system
The Omakhta Suite Gonam-Omakha
“WEST” and “J-60” components
Point 35 “Om–B“Points 34 + 39 + 40
“Om–C“
“Om–B“
“Om–B“
“Om–B“Point 38
Point 37
“Om–A““Om–30“
“J–60” “WEST“
(h) (i)
(j)
Fig. 9. Cont.
nents of the Omakhta rocks. The following facts countin favor of the primacy of magnetization of the Konderdeposits: (a) the consistency of the direction of themagnetization component in the remote outcrops; (b)
the presence of magnetization vectors with direct andreversed polarity; and also (c) a difference in the pole,which corresponds to the mean magnetization direc-tion, from the younger poles of Siberia.
and

562
IZVESTIYA, PHYSICS OF THE SOLID EARTH Vol. 45 No. 7 2009
VESELOVSKIY et al.
RESULTS AND DISCUSSION
The calculated paleomagnetic poles substantiallysupplement the Siberian paleomagnetic database; all ofthem are obtained with the use of up-to-date proceduresand to one degree or another (depending on the specificgeological situation) correspond to the currentlyaccepted criteria of paleomagnetic reliability (Table 3;[Van der Voo, 1993]). This makes it possible to usethem together with already available data for solving anumber of paleogeographic and stratigraphic problems.
Due to the obvious deficiency in the isotopic datingsof the magmatic rocks of the areas investigated, thepaleomagnetic data enable one to impose essentialrestraints on the age of the formation of these rocks.The comparison of the paleomagnetic poles of theintrusive bodies of the Western and Northern Anabarregion shows that they statistically significantly differfrom each other (γ/γcr = 21.8/16.1). Consequently, theemplacement of the intrusions indicated did not occursimultaneously, although within the relatively closeintervals of a geological time scale of approximately1.5 Ga [Veselovskiy et al., 2006].
The immediate vicinity of the paleomagnetic polesof the sills of the Sololi River in the Olenek elevation[Gurevich, 1983; Konstantinov et al., 2004] and theUnguokhtakhsk Formation of the Udzhinsk uplift (def-inition of V.P. Rodionov) [Paleomagnetic…, 1986] onthe one hand, and the poles of the Northern and WesternAnabar region on the other hand (Tables 3 and 4, Fig. 10),should be considered as an indication of the closenessof the ages of these objects to the age of the intrusive
complex of the Northern Anabar region, i.e., to 1.5 Ga.This estimate, in general, does not contradict the avail-able isotopic datings. Thus, the age of the sill of theSololi River varies from 1090–1100 Ma (K/Ar, [Gurev-ich, 1983]) up to 1860 Ma (U/Pb, D.P. Gladkochub andT. Donskaya, privat communication). Furthermore, theK/Ar determination based on the bulk sample (suchdeterminations frequently turn out to be underesti-mates) gives for the Unguokhtakhsk Formation an ageestimate of 1260 Ma [Paleomagnetic…, 1986]. Theproximity of the paleomagnetic poles of the magmaticbodies, spaced-apart over many hundreds of kilometersindicates that 1.5 Ga ago a large-scale magmatic eventoccurred in the Siberian Platform territory, whose influ-ence runs far beyond the limits of the Anabar Uplift.
The grouping of the poles of the Ilinskaya [Gurevich,1983], Burdur, and Kotuykan Formations in a narrowregion indicates sufficiently rapid sedimentation, at least,for the larger part of the section of the Anabar Riphean.
The sills of the Fomich River valley, which lie in theKotuykan and Ustilinskaya Formations, are, probably,very close in age, which is confirmed by the proximityof the direction of the identified ancient magnetizationcomponents. Thus, the accumulation of the larger partof the (if not the entire) Riphean sedimentation mass ofthe Anabar Uplift occurred within the interval between1710–1630 Ma (the age of the youngest formations ofthe basement) and 1513 ± 51 Ma (the age of the sill ofthe Fomich River valley occurring in the UstilinskayaFormation).
The Northern
The WesternAnabar region (1)
Kotuykan (3)
Konderaya (12)
“Om-C” (8)
“West” (10
19
23 22
28 2731
Equator
300°
30°
270°240°210°180°
20
29 30
(a)(b)(c)(d)
“Om-A” (6)
Gonam (5
Omakhta (Om-B) (7)
“Om-30” (9)
Anabar region (2)
Burdur (4)
“J-60“(11)
Fig. 10. Paleomagnetic poles of the Siberian Platform, obtained in this work (Table 3), and the poles, obtained earlier and utilizedin the text (Table 4): (19) the Chieress dike [Ernst et al., 2000], (20) the Kuonamka dikes [Ernst et al., 2000], (22) the Totta Forma-tion [Pavlov, 1992], (23) the Malginskaya Formation [Pavlov et al., 2002], (27) the Sololi River sill [Konstantinov et al., 2004], (28)the Sololi River sill [Gurevich, 1983], (29) the bottoms of the Burdur Formation [Gurevich, 1983], (30) the Il’inskaya Formation[Gurevich, 1983], (31) the Unguokhtakhskaya Formation (determination of V.P. Rodionov) [Paleomagnetic…, 1986], (32) the sillof the Sololi River, (a) and (b) paleomagnetic poles, obtained in this work for (a) the Aldan and (b) the Angaro-Anabar blocks,(c) and (d) paleomagnetic poles, obtained earlier for (c) the Aldan and (d) the Angaro-Anabar blocks.
32

IZVESTIYA, PHYSICS OF THE SOLID EARTH Vol. 45 No. 7 2009
NEW PALEOMAGNETIC DATA ON THE ANABAR UPLIFT 563
The position of the poles of the Il’inskaya and Bur-dur Formations of the Anabar region [Gurevich, 1983]not far from the pole of the Konder Formation of theUchur-Maya region, obtained in the work considered,can be treated as an indication of the closeness of theages of these formations. Thus, in spite of the classicalcomparison of the Konder horizon with the bottoms ofthe Totta Formation of the Kerpyl series of the Uchur-Maya region [Semikhatov and Serebryakov, 1983], theKonder deposits, apparently, are close in age to the bot-toms of the Mukun series, and, consequently, they areappreciably more ancient than the Kerpyl series (Fig. 2b).The paleomagnetic pole of the Konder Formation cal-culated in the present work differs significantly fromthe pole, obtained from the stratotypic section of theTotta Formation in the Northern Ui River valley [Pav-lov, 1992]. In this case, the Konder paleomagnetic polelies noticeably nearer to the poles of the Uchur series(the Gonam and Omakhta poles), than to the reliablyidentified pole of the Malginskaya Formation of theKerpyl series [Pavlov et al., 2002]. This fact should beconsidered as indication of the appreciable differencein the age of the Konder and Totta (Kerpyl) rocks.
And, finally, the paleomagnetic determinations andthe present-day isotopic-geochronological data pre-sented in the paper make it possible to propose somenew arguments relative to the correlation of the Riph-ean sections of the Anabar Uplift and the Uchur-Mayaregion. It should be recalled that until recently for thecorrelation of the Riphean sections of these regions theclassical scheme was used [Semikhatov and Serebrya-kov, 1983] (Fig. 2a), according to which the sedimen-tary rocks of the Riphean of the Anabar Uplift were cor-related with the entire Riphean rock mass of the Uchur-Maya region.
The correlation proposed by us (Fig. 2b) is based onthe following facts and considerations:
1) in the lower part of the Aimchan series the frag-mental zircons with an age of 1394 ± 42 Ma are discov-ered (A.K. Khudoley, private communication), i.e., theAimchan series is younger than this age;
2) the Anabar Riphean is more ancient than 1384 Ma(the dike of this age [Ernst et al., 2000] intruded on the Yus-mastakh Formation) and could be more ancient (at least, itslarger part), than 1513 ± 51 Ma [Veselovsky et al., 2006];
3) there is a large disagreement between the Aim-chan and Uchur series, which, possibly, corresponds toa prolonged interruption in sedimentation [Semikhatovand Serebryakov, 1983; Khudoley, 2003];
4) the poles of the Anabar Riphean differ from thepoles of the Uchur series and it means that the age ofthese formations is different.
These data leave only two possible alternatives forcorrelation of the reference sections in question. Thefirst alternative assumes that the accumulation of theAnabar Riphean deposits occurred during the interruption,which divides the Uchur and Aimchan series (Fig. 2b, tothe left). The second alternative requires that the Riph-
ean of the Anabar Uplift to have been formed earlierthan the Uchur series (Fig. 2b, to the right).
There are two paleomagnetic arguments, which atpresent impede the adoption of the second alternative ofthe correlation:
1) There are metachronous directions in the Uchurseries (“Om-A”, “Om-C”, “Om-30”), whose poles cor-respond with the poles of the Anabar Riphean, whichimplies a more ancient age of the Uchur series;
2) the adoption of the second alternative, other con-ditions being equal, substantially complicates andlengthens the curve of the apparent pole migration ofthe Siberian Platform, i.e., contradicts the principle ofminimization of the displacements.
The closeness of the Konder (the Late Uchur in ourinterpretation) pole to the poles of the Ilinskaya andBurdur Formations, which compose the lower part ofthe Riphean of the Anabar region, is also the reason infavor of the fact that the Anabar Riphean was formedafter the Uchur series.
These arguments enable us to consider the first alter-native of the correlation as more preferable.
The data obtained in the present work together withthe already published results (Table 4) can be used fordetermining the latitudinal drift of the Siberian Plat-form during the Mesoproterozoic period. For construct-ing the reconstructions, the coordinates of the paleo-magnetic poles of the Anabar block were corrected tak-ing into account the outcrops in the Middle Paleozoicera of the Vilyui rift system [Pavlov and Petrov, 1997;Pavlov et al., 2007] by their clockwise rotation at anangle of 25° around the pole, located in the region withcoordinates of 117° E and 62° N. The paleomagneticpoles are obtained with the use of the “nontraditional”option of the polarity of paleomagnetic directions,which assumes (for the Riphean) the position of thenorthern paleomagnetic poles in the Eastern Hemi-sphere. This selection is confirmed by the latest worksof V.E. Pavlov and A.V. Shatsillo [Pavlov et al., 2002;Shatsillo et al., 2006]. For reconstruction of the positionof Siberia in the Paleo-Proterozoic (Fig. 11) the LatePaleo-Proterozoic poles of the basement [Pavlov, 2006;Savrasov, 1990; Paleomagnetic…, of 1971] of the ChayaFormation and Shumikha granitoid rocks [Didenko andVodovorov, 2004] (the Shumikhin pole corrected for theopening of the Vilyui rift system) were used.
The paleomagnetic data, given in Tables 3 and 4,indicate that in the interval of 1.9–1.5 Ga, Siberia expe-rienced quasi-vibrational displacements in the equato-rial region, being considerably displaced towards thecomparatively higher latitudes of the northern hemi-sphere only during the Konder, Burdur, and Kotuykanperiods (Fig. 11). With the approach of the boundary of1.5 Ga, which is distinguished by the emplacement ofthe intrusive bodies of the Anabar Uplift, Siberia againapproached the equator and was turned counterclock-wise to an angle of the order of 45° relative to the paleo-meridian in comparison with its position during theGonam period.

564
IZVESTIYA, PHYSICS OF THE SOLID EARTH Vol. 45 No. 7 2009
VESELOVSKIY et al.
The absence of the key paleomagnetic determina-tions for the time interval of 1.5–1.1 Ga makes it impos-sible to carry out confidently the paleo-reconstructionsof Siberia within this time interval; therefore, for anindication of the approximate position of the Siberiancraton in this “window” we used the preliminary polesof the Debengda Formation (the determination ofA.G. Iosifidi [Paleomagnetic…, 1986]) and the Chier-ess dike [Ernst et al, 2000]. On the basis of these data,1.4–1.2 Ga ago the Siberian Platform was located in the10–15th latitudes of the northern hemisphere. Begin-ning from the Totta period, i.e., about 1.1 Ga ago [Khu-doley et al., 2007], and up to the Kandyks-Ust’-kibraperiod the Siberian Platform was displaced from themiddle latitudes of the northern hemisphere to theequator, and again experienced a counterclockwiserotation at an angle of approximately 35° relative to themeridian [Pavlov et al., 2002].
CONCLUSIONS
The data obtained in the course of this work givegrounds to assume that:
1) The accumulation of the Riphean of the AnabarUplift occurred after the formation of the Uchur seriesof the Uchur-Maya region;
2) The accumulation of the entire or almost entireRiphean section of the Anabar region was completedapproximately 1.5 Ga ago;
3) The Konder layers, which are compared accordingto the correlation scheme accepted at the present time[Semikhatov and Serebryakov, 1983] with the bottoms of
the Totta Formation, could relate to a considerably moreancient time level;
4) The emplacement of Proterozoic sills and dikes ofthe northern and western slopes of the Anabar Upliftoccurred nonsimultaneously, although in the time inter-vals close to approximately 1.5 Ga ago.
5) During the Paleo-Mesoproterozoic, the Siberiancraton was located, mainly, in the equatorial or low north-erly latitudes, experiencing considerable rotations relativeto the meridian throughout this time. From the end of thePaleoproterozoic [Didenko et al., 2004] up to the begin-ning of the Neoproterozoic [Pavlov et al., 2002] the Sibe-rian Platform was turned counterclockwise relative to themeridian at an angle of the order of 90°.
The results obtained considerably supplement thedatabase of Siberian paleomagnetic data for the Precam-brian and, corresponding in general to the up-to-date crite-ria of paleomagnetic reliability [Van der Voo, 1993], canbe used for the solution of different stratigraphic, geochro-nological, and paleogeographic problems.
ACKNOWLEDGMENTS
We are grateful to A.V. Shatsillo for his invaluablehelp in field works and V.A. Tselmovich for studies ofthe samples on a “Camebax” microprobe. We alsothank Valerian Bachtadse and Manuela Weiss for thepossibility afforded to us to work under ideal conditionsin the Munich paleomagnetic laboratory.
This work was supported by the Russian Foundationfor Basic Research, projects nos. 07-05-00880, 06-05-64538), by INTAS (grant no. 03-51-5807), by Ros-nauka (MK-416.2008.5), and by the RAS Division of
60
30
30
60
Equator
1.91.71.51.31.10.9
Ga
Ust
’-ki
rba
Suite
Kan
dyks
kie
obje
cts
Lak
hand
insk
aya
Suite
Mal
gins
kaya
Sui
te
Deb
engd
a Su
ite
Chi
eres
s Su
ite
Wes
tern
Ana
bar
regi
onN
orth
ern
Ana
bar
regi
onK
otuy
kan
Suite
Bur
dur
Suite
Om
akht
a
Gon
am
Shum
ikha
gra
nito
ids
Cha
ya S
uite
Bas
emen
t
Kon
der
Suite
Kuo
nam
skii
dike
s
Tot
ta S
uite
Fig. 11. Paleo-latitudinal position of the Siberian craton within an interval of 1.9–0.9 Ga.

IZVESTIYA, PHYSICS OF THE SOLID EARTH Vol. 45 No. 7 2009
NEW PALEOMAGNETIC DATA ON THE ANABAR UPLIFT 565
the Earth Sciences’ program “Geodynamic evolution ofthe lithosphere of the Central-Asian mobile belt (fromthe ocean to the continent)”.
REFERENCES
1. J. P. Cogne, “PaleoMac: a Macintosh(tm) Applicationfor Treating Paleomagnetic Data and making PlateReconstructions,” Geochem. Geophys. Geosyst., 4 (1),1007, doi: 10.1029/2001GC000227 (2003).
2. D. Collinson, Paleomagnetism (Cambridge UniversityPress, Cambridge, 1980), pp. 1–521.
3. A. N. Didenko, V. Yu. Vodovozov, I. K. Kozakov, andE. V. Bibikova, “Paleomagnetic and GeochronologicalStudy of the Postcollisional Early Proterozoic GranitoidRocks of the South of the Siberian Platform: Methodicand Geodynamic Aspects,” Fizika Zemli, No. 2, 66–83(2005).
4. A. I. Didenko and V. Yu. Vodovozov, “The Trajectory ofthe Apparent Pole Migration of Siberia for the Second-Half of the Early Proterozoic,” in Paleomagnetism andMagnetism of Rocks (Publishing House of Kazan’ Uni-versity, Kazan’, 2004), 128–134 [in Russian].
5. R. J. Enkin, A Computer Program Package for Analysisand Presentation of Paleomagnetic Data (Pacific GeoscienceCentre, Geological Survey of Canada, 1994), pp. 1–16.
6. R. E. Ernst, K. L. Buchan, M. A. Hamilton, et al., “Inte-grated Paleomagnetism and U–Pb Geochronology ofMafic Dikes of the Eastern Anabar Shield Region, Sibe-ria: Implications for Mesoproterozoic Paleolatitude ofSiberia and Comparison with Laurentia,” J. of Geol., 108(3), 381–401 (2000).
7. A. K. Gapeev, S. K. Gribov, V. E. Pavlov, andV. Yu. Vodovozov, “The Influence of the Spin-NodalDisintegration of Titanium-Magnetites on the MagneticProperties of Rocks,” in Paleomagnetism and Magne-tism of Rocks (GEOS, Moscow, 2003), 110–113 [in Rus-sian].
8. A. K. Gapeev and V. A. Tselmovich, “Microstructure ofthe Natural Heterogeneously Oxidized Titanium-Mag-netites,” Izv. Akad. Nauk SSSR, Ser. Fizika Zemli,No. 4, 100–104 (1986).
9. I. M. Gorokhov, M. A. Semikhatov, E. R. Drubetskoi, et al.,“Rb–Sr and K–Ar Age of the Sedimentary Geochronome-ters of the Lower Riphean of the Anabar Massif,” Izv. Akad.Nauk SSSR, Ser. Geol., No. 7, 17–32 (1991).
10. I. M. Gorokhov, M. A. Semikhatov, N. N. Melnikov, et al.,“The Rb–Sr Geochronology of the Middle Riphean Argil-lites of the Yusmastakh Formation, the Anabar Massif, theNorthern Siberia,” Stratigraphy. Geol. Correlation. 9 (3),3–24 (2001).
11. E. L. Gurevich, “Paleomagnetic Studies of the Precam-brian Deposits of the North of the Siberian Platforms,” inPaleomagnetism of the Upper Precambrian of the USSR.Collection of Scientific Papers (All-Union PetroleumScientific Research Institute of Geological Exploration,Leningrad, 1983), 39–51 [in Russian].
12. V. V. Khomentovskii, “Actual Problems of the Stratigra-phy of Neoproterozoic in the Siberian Hypostratotype ofRiphean,” Geology and Geophysics, 46 (5), 529–545(2005).
13. A. N. Khramov, G. I. Goncharov, R. A. Komissarova, et al.,Paleomagnitology (Nedra, Leningrad, 1982), 1–312 [inRussian].
14. A. K. Khudoley, “Tectonics of the Passive Margins ofAncient Continents (based on the Example of the East-ern Margins of Siberian and Western Margins of theNorth American Platforms),” Doctoral Dissertation inGeology and Mineralogy (A.P. Karpinsky Russian Geo-logical Research Institute, St. Petersburg, 2003), 1–461[in Russian].
15. A. K. Khudoley, A. P. Kropachev, V. I. Tkachenko, et al.,“Mesoproterozoic to Neoproterozoic Evolution of theSiberian Craton and Adjacent Microcontinents: an Over-view with Constraints for a Laurentian Connection,” inProterozoic Geology of Western North America andSiberia, Eds. P.K. Link, R.S. Lewis, (SEPM (Society forSedimentary Geology), Special Publication No. 86,2007), pp. 209–226.
16. A. K. Khudoley, A. V. Molchanov, A. V. Okrugin, et al.,“Evolution of the Basement of the North of the SiberianPlatform according to the Data of U–Pb Dating of Frag-mental Zircons in the Sandstones of the Mukun Series,the Anabar Shield,” in Fundamental Problems of Geo-tectonics. Materials of the XL Tectonic Conference, Ed.by Yu.V. Karyakin (GEOS, Moscow, 2007), 333–335 [inRussian].
17. A. K. Khudoley, R. H. Rainbird, R. Stern, et al., “Sedimen-tary Evolution of the Riphean-Vendian Basin of Southeast-ern Siberia,” Precamb. Res., 111, 129–163 (2001).
18. A. K. Khudoley, R. Rainbird, R. Stern, et al., “The NewData on the Riphean Tectogenesis on the Northeast ofRussia,” in Tectonics, Geodynamics and the Processes ofMagmatism and Metamorphism. Materials of the XXXIITectonic Conference, Ed. by Yu.V. Karyakin (GEOS,Moscow, 1999), 261–264 [in Russian].
19. J. L. Kirschvink, “The Least-Square Line and Plane andthe Analysis of Palemagnetic Data,” Geophys. J. R.Astron. Soc., 62, 699–718 (1980).
20. A. H. Knoll, A. J. Kaufman, M.A. Semikhatov, “TheCarbon-Isotopic Composition of Proterozoic Carbon-ates: Riphean Succession from Northwestern Siberia(Anabar Massif, Turukhansk Uplift),” Amer. J. Sci. 295,823–850 (1995).
21. K. M. Konstantinov, S. A. Pisarevsky, M. T. D. Wingate,et al., “Paleomagnetism of the Proterozoic Sills ofYakutiya (the Olenek elevation),” in Paleomagnetismand Magnetism of Rocks: Theory, Practice and Experi-ment (materials of the International Seminar) (Publish-ing House of Kazan’ University, Kazan’, 2004), 135–139 [in Russian].
22. P. L. McFadden and M. W. McElhinny, “Classification ofthe Reversal Test in Palaeomagnetism,” Geophys. J. Int.,103, 725–729 (1990).
23. P. L. McFadden and M. W. McElhinny, “The CombinedAnalyses of Remagnetization Circles and Direct Obser-vations in Paleomagnetism,” Earth and Planetary Sci-ence Letters 87, 53–58 (1988).
24. L. A. Neimark, A. M. Larin, S. Z. Yakovlev, and B. M. Goro-khovskii, “The U–Pb Age of the Magmatic Rocks of theUlkansk Graben (the Southeastern Part of the Aldan Shield),”Dokl. Akad. Nauk 323 (6), 1152–1156 (1992).

566
IZVESTIYA, PHYSICS OF THE SOLID EARTH Vol. 45 No. 7 2009
VESELOVSKIY et al.
25. B. S. Nevolin, S. V. Potapov, and A. L. Stavtsev, “TheUpper Proterozoic (Riphean) and the Lower Cambrianof the Southeast margins of Siberian Platform, theYudomo-Maya Trough and the Okhotsk Median Mas-sif,” in Stratigraphy of the Uisk Series of the Late Pre-cambrian of the Sette–Dabana. The New in Stratigraphyand Paleonthology of the Late Precambrian of the Eastand the Northern Regions of Siberia, Ed. by V. V. Kho-mentovskii (IGiG SO AN (Siberian Branch of the Acad-emy of Sciences) USSR, Novosibirsk, 1978), 21–63 [inRussian].
26. S. V. Nuzhnov, The Riphean Deposits of the Southeast ofSiberian Platform, (Nauka, Moscow, 1967), 1–175 [inRussian].
27. A. V. Okrugin, “The Dike Belts of the Late PrecambrianBasites of the Anabar Massif and the Aldan Shield,” inGeology and Tectonics of Platforms and OrogenicRegions of the Northeast Asia. Materials of conference,Ed. by V.S. Oksman (Institute of the Geological Sci-ences, Siberian Branch of the Russian Academy of Sci-ence, Yakutsk, 1999), 2, 89–93 [in Russian].
28. “Paleomagnetic Directions and Paleomagnetic Poles,” inMaterials of the World Data Center. The Data for theUSSR, Ed. by A.N. Khramov (Moscow, 1986) 6.
29. “Paleomagnetic Directions and Paleomagnetic Poles,” inReference Data for the USSR, Ed. by A.N. Khramov(VNIGRI (All-Union Petroleum Scientific ResearchInstitute of Geological Exploration) Publishing House,Leningrad, 1971), 1–124 [in Russian].
30. V. E. Pavlov, “Paleomagnetism of the Middle and UpperRiphean of the Uchur-Maya Region,” Abstract of a Can-didate’s Dissertation in Geology and Mineralogy (IFZRAN, Moscow, 1992), 1–24 [in Russian].
31. V. E. Pavlov, “The Place of Generation of the SiberianPlatform,” in The Region of Active Tectonogenesis in theContemporary and Ancient History of the Earth. Materi-als of the XXXIXth Tectonic Conference (GEOS, Mos-cow, 2006), 1, 88–91 [in Rusian].
32. V. E. Pavlov, Y. Gallet, V. Bachtadse, and V. Mikhailov,“New Paleomagnetic Data for the Middle Cambrian andMiddle Ordovician of the Siberian Platform: LandeilianMagneto Stratigraphy and New Evidence for RelativeRotations Between the Aldan and Anabar-AngaraBlocks,” Eos. Trans. AGU, Jt. Assem. Suppl., AbstractGP21A-07, 88 (23), (2007).
33. V. E. Pavlov, Y. Gallet, P. Yu. Petrov, et al., “The Uisk Seriesand the Late Riphean Sills of the Uchur-Maya Region: Iso-topic, Paleomagnetic Data and the Problem of RodiniyaSupercontinent,” Geotectonics, No. 4, 26–41 (2002).
34. V. E. Pavlov, Y. Gallet, and A. V. Shatsillo, “Paleomag-netism of the Upper Riphean Lakhanda Group in theUchur-Maya Area and the Hypothesis of a Late Protero-zoie Supercontinent,” Fiz. Zemli, No. 8, 23–34 (2000).
35. V. E. Pavlov and P. J. Petrov, “Paleomagnetism of theRiphean Deposits in Irkineeva Uplift, Yenisey Range:New Evidence for the Integrity of the Siberian Platformin the Middle Riphean,” Izvest. Phys. Solid Earth 33,464–475 (1997).
36. Petroleum Scientific Research Institute of GeologicalExploration) Publishing House, Leningrad, 1984), 1–110[in Russian].
37. S. V. Potapov, A. L. Stavtsev, A. F. Lobanova, andA. M. Manukyan, “The New Data on the Stratigraphy ofthe Upper Proterozoic, Vendian, and the Lower Cam-brian of the Northern Slopes of Aldan Shield,” in Pre-cambrian and Paleozoic period of the Northeast of theUSSR. Abstracts of Reports, (Magadan, 1974), 42–45 [inRussian].
38. D. I. Savrasov, “Paleomagnetic Studies on the Crystal-line Rocks of the Anabar Shield,” Geology and Geophys-ics, No. 1, 94–104 (1990).
39. M. A. Semikhatov, I. M. Gorokhov, T. A. Ivanovskaya,et al., “The Rb–Sr and K–Ar Age of the Globular Lay-ered Silicates of the Riphean and Cambrian of theUSSR: Materials to the Estimate of Geochronometer,”Lithology and Minerals, No. 5, 78–96 (1987).
40. M. A. Semikhatov and S. N. Serebryakov, SiberianHypo-Stratotype of Riphean, (Nauka, Moscow, 1983),1–224 [in Russian].
41. M. A. Semikhatov, K. A. Shurkip, E. M. Aksenov, et al., “TheNew Stratigraphic Scale of the Precambrian of the USSR,”Izv. Akad. Nauk SSSR, Ser. Geol., No. 4, 3–13 (1991).
42. V. N. Sergeev, “Silicified Microfossils of Precambrian,”Abstract of a Doctoral Dissertation in Geology and Min-eralogy (GIN RAN, Moscow, 2003), 1–52 [in Russian].
43. V. N. Sergeev, Silicified Microfossils of the Precam-brian: Nature, Classification and BiostratigraphicValue, Ed. by M.A. Semikhatov (GEOS, Moscow,2005), 1–280 [in Russian].
44. A. V. Shatsillo, V. E. Pavlov, and A. N. Didenko, “Paleo-magnetism of Vendian Rocks in the Southwest of theSiberian Platform,” Russian Journal of Earth Sciences, 8,ES2003, doi:10.2205/2005ES000182, (2006).
45. V. Yu. Shenfil, The Late Precambrian of the SiberianPlatform (Nauka, Novosibirsk, 1991), pp. 1–185.
46. S. V. Shipunov, “Significance Tests in Paleomagnetism,”Fizika Zemli, No. 6, 89–92 (1999).
47. B. R. Shpunt, I. G. Shapovalova, and E. A. Shamshina,Late Precambrian of the North of the Siberian Platform(Nauka, Novosibirsk, 1982), pp. 1–226.
48. T. Torsvik, M. A. Smethurst, and L.J. Pesonen, “GMAP −Geographic Mapping and Paleoreconstruction Package,”Norv. Geol. Serv. Rep., No. 90.019, 64 (1990).
49. R. Van der Voo, Paleomagnetism of the Atlantic Tethysand Iapetus Oceans (Cambridge Univ. Press, 1993),pp. 1–411.
50. R. V. Veselovskiy, P. Yu. Petrov, S. F. Karpenko, et al.,“New Paleomagnetic and Isotopic Data on the Late Pro-terozoic Magmatic Complex of the Northern Slope ofthe Anabar Uplift,” Dokl. Akad. Nauk 410 (6), 775–779(2006).
51. J. D. A. Zijderveld, “A.C. Demagnetization of Rocks:Analysis of Results,” in Methods in Paleomagnetism,Eds. D. W. Collinson, K. M. Creer, (Elsevier, Amster-dam, 1967) pp. 254–286.