New Opportunities for Co-Processing Renewable Feeds in ... · PDF fileCo-Processing Renewable...
13
Catalagram 103 Spring 2008 1 Brian Watkins Supervisor, Laboratory Technology, Advanced Refining Technologies Charles Olsen Worldwide Technical Services Manager, Advanced Refining Technologies Kevin Sutovich Senior R&D Chemist, Grace Davison Refining Technologies Natalie Petti Vandelay Management he use of renewable or bio- based sources of feed to pro- duce fuels is becoming more widely employed as a means of decreasing dependence on non- renewable fossil fuel sources. There are typically three common produc- tion routes for biodiesel. Fuel which is produced by the FAME (Fatty Acid Methyl Ester) process to meet a fuel specification of ASTM D6751 is con- sidered biodiesel. Fuels produced from biological material using thermal depolymerization to meet ASTM D975 or ASTM D396 are considered renew- able diesel. Fuels that are produced when vegetable oils or animal fats are processed in traditional refining processes are considered co- processed renewable diesel. Some common sources of renewable feeds are those produced for food grade oils such as soybean, rape- seed and other vegetable oils. The traditional process for introducing these sources into the diesel pool is to use the transesterification reac- tion for breaking the glycerol from the fatty acid chains. This reaction requires the use of an alcohol (such as methanol) and a catalyst (such as sodium or potassium hydroxide, NaOH or KOH) in order to break the long chained fatty acids apart from the glycerin molecule. (Figure 1) New Opportunities for Co-Processing Renewable Feeds in Refinery Processes T
Transcript of New Opportunities for Co-Processing Renewable Feeds in ... · PDF fileCo-Processing Renewable...
Catalagram 103 Spring 2008 1
Brian WatkinsSupervisor,Laboratory Technology,Advanced Refining Technologies
Charles OlsenWorldwide Technical ServicesManager, Advanced RefiningTechnologies
Kevin SutovichSenior R&D Chemist,Grace Davison RefiningTechnologies
Natalie PettiVandelay Management
he use of renewable or bio-based sources of feed to pro-duce fuels is becoming more
widely employed as a means ofdecreasing dependence on non-renewable fossil fuel sources. Thereare typically three common produc-tion routes for biodiesel. Fuel which isproduced by the FAME (Fatty AcidMethyl Ester) process to meet a fuelspecification of ASTM D6751 is con-sidered biodiesel. Fuels producedfrom biological material using thermaldepolymerization to meet ASTM D975or ASTM D396 are considered renew-able diesel. Fuels that are producedwhen vegetable oils or animal fats areprocessed in traditional refiningprocesses are considered co-
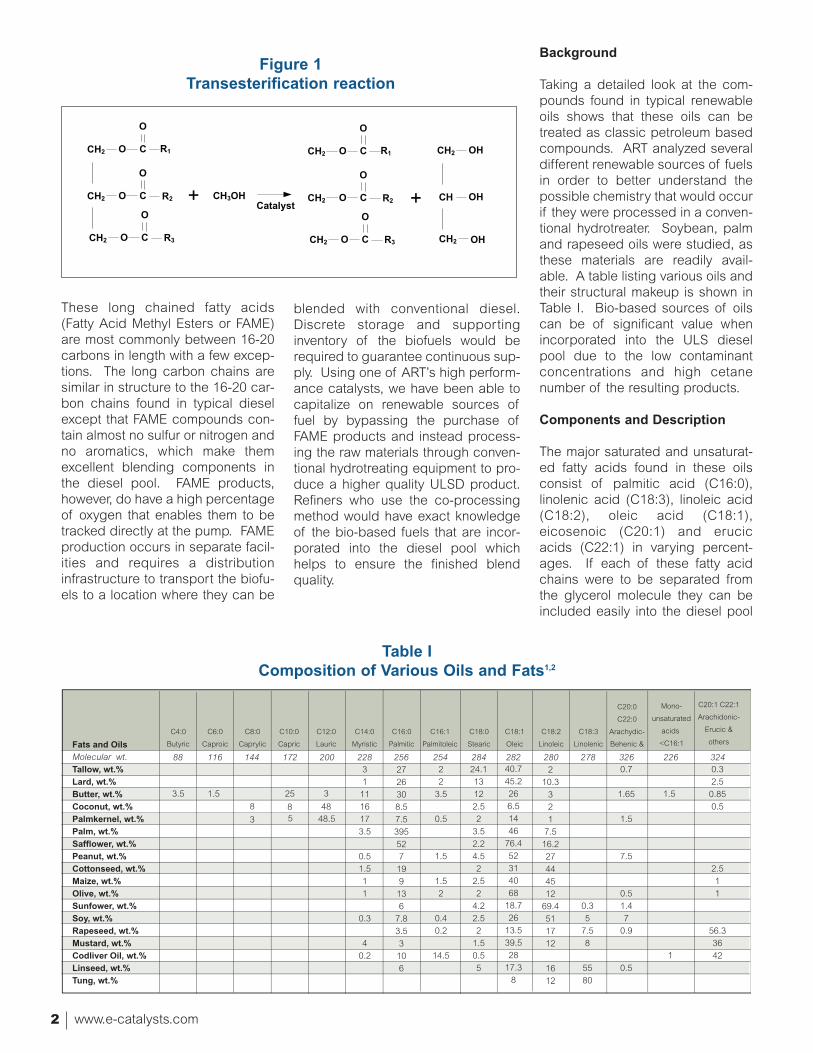
processed renewable diesel. Somecommon sources of renewablefeeds are those produced for foodgrade oils such as soybean, rape-seed and other vegetable oils. Thetraditional process for introducingthese sources into the diesel pool isto use the transesterification reac-tion for breaking the glycerol fromthe fatty acid chains. This reactionrequires the use of an alcohol (suchas methanol) and a catalyst (suchas sodium or potassium hydroxide,NaOH or KOH) in order to break thelong chained fatty acids apart fromthe glycerin molecule. (Figure 1)
New Opportunities forCo-Processing RenewableFeeds in RefineryProcesses
T
www.e-catalysts.com2
These long chained fatty acids(Fatty Acid Methyl Esters or FAME)are most commonly between 16-20carbons in length with a few excep-tions. The long carbon chains aresimilar in structure to the 16-20 car-bon chains found in typical dieselexcept that FAME compounds con-tain almost no sulfur or nitrogen andno aromatics, which make themexcellent blending components inthe diesel pool. FAME products,however, do have a high percentageof oxygen that enables them to betracked directly at the pump. FAMEproduction occurs in separate facil-ities and requires a distributioninfrastructure to transport the biofu-els to a location where they can be
blended with conventional diesel.Discrete storage and supportinginventory of the biofuels would berequired to guarantee continuous sup-ply. Using one of ART’s high perform-ance catalysts, we have been able tocapitalize on renewable sources offuel by bypassing the purchase ofFAME products and instead process-ing the raw materials through conven-tional hydrotreating equipment to pro-duce a higher quality ULSD product.Refiners who use the co-processingmethod would have exact knowledgeof the bio-based fuels that are incor-porated into the diesel pool whichhelps to ensure the finished blendquality.
Background
Taking a detailed look at the com-pounds found in typical renewableoils shows that these oils can betreated as classic petroleum basedcompounds. ART analyzed severaldifferent renewable sources of fuelsin order to better understand thepossible chemistry that would occurif they were processed in a conven-tional hydrotreater. Soybean, palmand rapeseed oils were studied, asthese materials are readily avail-able. A table listing various oils andtheir structural makeup is shown inTable I. Bio-based sources of oilscan be of significant value whenincorporated into the ULS dieselpool due to the low contaminantconcentrations and high cetanenumber of the resulting products.
Components and Description
The major saturated and unsaturat-ed fatty acids found in these oilsconsist of palmitic acid (C16:0),linolenic acid (C18:3), linoleic acid(C18:2), oleic acid (C18:1),eicosenoic (C20:1) and erucicacids (C22:1) in varying percent-ages. If each of these fatty acidchains were to be separated fromthe glycerol molecule they can beincluded easily into the diesel pool
CH3OH
R1
R3
R2
CH2 O
O
C
CH2 O
O
C
CH2 O
O
C
Catalyst
R1
R3
R2
CH2 O
O
C
CH2 O
O
C
CH2 O
O
C
CH2 OH
CH OH
CH2 OH
Figure 1Transesterification reaction
Fats and OilsMolecular wt.Tallow, wt.%Lard, wt.%Butter, wt.%Coconut, wt.%Palmkernel, wt.%Palm, wt.%Safflower, wt.%Peanut, wt.%Cottonseed, wt.%Maize, wt.%Olive, wt.%Sunfower, wt.%Soy, wt.%Rapeseed, wt.%Mustard, wt.%Codliver Oil, wt.%Linseed, wt.%Tung, wt.%
C4:0
Butyric
C6:0
Caproic
C8:0
Caprylic
C10:0
Capric
C12:0
Lauric
C14:0
Myristic
C16:0
Palmitic
C16:1
Palmitoleic
C18:0
Stearic
C18:1
Oleic
C18:2
Linoleic
C18:3
Linolenic
C20:0
C22:0
Arachydic-
Behenic &
Mono-
unsaturated
acids
<C16:1
C20:1 C22:1
Arachidonic-
Erucic &
others
3.5 1.5
8
3
25
85
3
4848.5
3
1
11
16
17
3.5
0.5
1.5
1
1
0.3
4
0.2
27
26
30
8.5
7.5
395
52
7
19
9
13
6
7.8
3.5
3
10
6
2
2
3.5
0.5
1.5
1.5
2
0.4
0.2
14.5
24.1
13
12
2.5
2
3.5
2.2
4.5
2
2.5
2
4.2
2.5
2
1.5
0.5
5
40.7
45.2
26
6.5
14
46
76.4
52
31
40
68
18.7
26
13.5
39.5
28
17.3
8
2
10.3
3
2
1
7.5
16.2
27
44
45
12
69.4
51
17
12
16
12
0.3
2.5
0.85
0.5
2.5
1
1
56.3
36
421
1.5
0.7
1.65
1.5
7.5
0.5
1.4
7
0.9
0.5
0.3
5
7.5
8
55
80
88 116 144 172 200 228 256 254 284 282 280 278 326 226 324
Table IComposition of Various Oils and Fats1,2
Catalagram 103 Spring 2008 3
as normal paraffin components inthe 500-650˚F boiling range. Thesen-paraffins can be of significantvalue for ULSD as they have typi-cal cetane numbers ranging from95 to 110, which can provide a sig-nificant boost for those refinersprocessing feeds with lowercetane (i.e. FCC LCO’s). The typi-cal diesel hydrotreater has only asmall effect on cetane with cetaneupgrade of about 2-4 numbers.
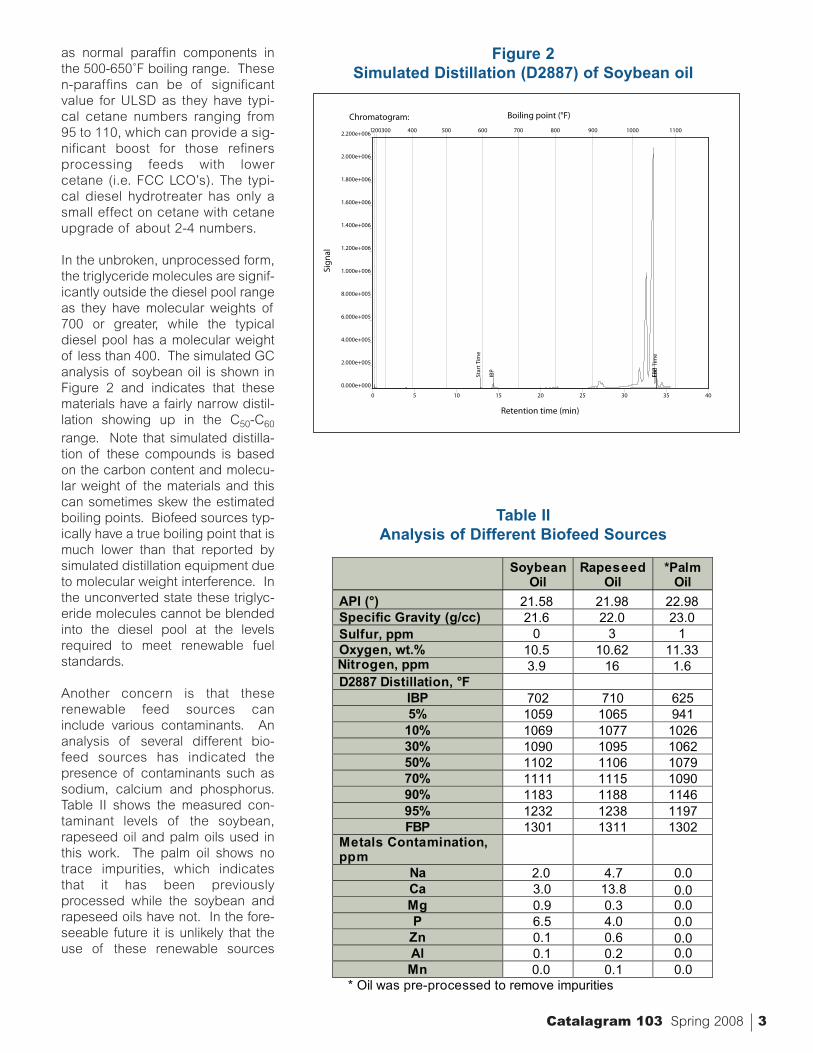
In the unbroken, unprocessed form,the triglyceride molecules are signif-icantly outside the diesel pool rangeas they have molecular weights of700 or greater, while the typicaldiesel pool has a molecular weightof less than 400. The simulated GCanalysis of soybean oil is shown inFigure 2 and indicates that thesematerials have a fairly narrow distil-lation showing up in the C50-C60range. Note that simulated distilla-tion of these compounds is basedon the carbon content and molecu-lar weight of the materials and thiscan sometimes skew the estimatedboiling points. Biofeed sources typ-ically have a true boiling point that ismuch lower than that reported bysimulated distillation equipment dueto molecular weight interference. Inthe unconverted state these triglyc-eride molecules cannot be blendedinto the diesel pool at the levelsrequired to meet renewable fuelstandards.
Another concern is that theserenewable feed sources caninclude various contaminants. Ananalysis of several different bio-feed sources has indicated thepresence of contaminants such assodium, calcium and phosphorus.Table II shows the measured con-taminant levels of the soybean,rapeseed oil and palm oils used inthis work. The palm oil shows notrace impurities, which indicatesthat it has been previouslyprocessed while the soybean andrapeseed oils have not. In the fore-seeable future it is unlikely that theuse of these renewable sources
Chromatogram:
0 5 10 15 20 25 30 35 40
Retention time (min)
0.000e+000
2.000e+005
4.000e+005
6.000e+005
8.000e+005
1.000e+006
1.200e+006
1.400e+006
1.600e+006
1.800e+006
2.000e+006
2.200e+006
Sign
al
100200300 400 500 600 700 800 900 1000 1100
Boiling point (°F)
Star
tTim
e
End
Tim
e
IBP
FBP
Figure 2Simulated Distillation (D2887) of Soybean oil
SoybeanOil
Rapeseed Oil
*Palm Oil
API (°) 21.58 21.98 22.98Specific Gravity (g/cc) 21.6 22.0 23.0Sulfur, ppm 0 3 1Oxygen, wt.% 10.5 10.62 11.33Nitrogen, ppm 3.9 16 1.6 D2887 Distillation, °F
IBP 702 710 6255% 1059 1065 941
10% 1069 1077 102630% 1090 1095 106250% 1102 1106 107970% 1111 1115 109090% 1183 1188 114695% 1232 1238 1197FBP 1301 1311 1302
Metals Contamination, ppm
Na 2.0 4.7 0.0Ca 3.0 13.8 Mg 0.9 0.3 P 6.5 4.0
Zn 0.1 0.6 Al 0.1 0.2 Mn 0.0 0.1
* Oil was pre-processed to remove impurities
0.00.00.00.00.00.0
Table IIAnalysis of Different Biofeed Sources
www.e-catalysts.com4
would exceed 20% in conventionalhydrotreating applications, whichwould bring the level of all of thesecontaminants down to 2.5 ppm orless. At these levels ART’s highcapacity guard materials and GraceDavison specialty catalysts arecapable of protecting the down-stream high activity catalysts fromthese damaging poisons.
Since these renewable feeds arederived from a biological source,they also contain a high concentra-tion of oxygen. For the materialslisted in Table I the oxygen contentranges from 10 to 15%, and isentirely dependent on the lengthand degree of saturation of the fattyacid chains.
This quantity of oxygen is important,as under normal hydrotreating con-ditions the oxygen will react with thehydrogen to form water. This water,if generated in a significant enoughquantity, may cause problems suchas weakening the catalyst supportor redistribution of the active metalsand loss of surface area. At theexpected blending ratios of 10%,the oxygen content is around 1 to1.5 wt.%, and even if all the oxygenis converted, this is unlikely to gen-erate enough water to be a signifi-cant problem.
General Co-Processing Ideas
Looking at these compounds from ahydrotreating perspective, the bio-feeds can be classified as monoand di-olefins, since a majority ofthese compounds have one or twodouble bonds per fatty acid chainwith a few having three. Using thenumbers listed in Table I, palm oilhas an average of 1.1 double bondsper chain, rapeseed oil has 1.3 andsoybean oil has 1.7. It has beenwidely established that the olefinsaturation reactions occur quiterapidly and tend to happen near thetop of the catalyst bed in ahydrotreater. The reactions go tonear completion at typicalhydrotreating conditions, and willgenerate between 130-150 BTU’s
per standard cubic foot of hydrogenconsumed. The reaction pathways tohydrotreat the bio-oils is shown inFigure 3.
In the first step of the reaction, theunsaturated fatty acid chains arequickly converted into fully saturatedn-paraffins. The second reaction thatmust occur in order to ensure that thecompounds will be of the appropriatesize for the diesel pool is the breakingof the fatty acid chains away from theglycerin molecule which requirescleavage of a carbon – oxygen bond.
CO
O- =-
CO
O- =-
CO
O- =-CH
C
C
H
HH
H
CO
O- =-
CO
O- =-
CO
O- =-CH
C
C
H
HH
HH
H
H
H H
H
HH H
HH H
HH
HHH
H-
-
-CHCC
HH
H
HH
H
H
+ 6H2
HEAT
HEAT
+4.5H2
+ 3 O2
+ 6H2
+ 3 H2O
Figure 3Pathways to Hydrotreating of Renewable Oils
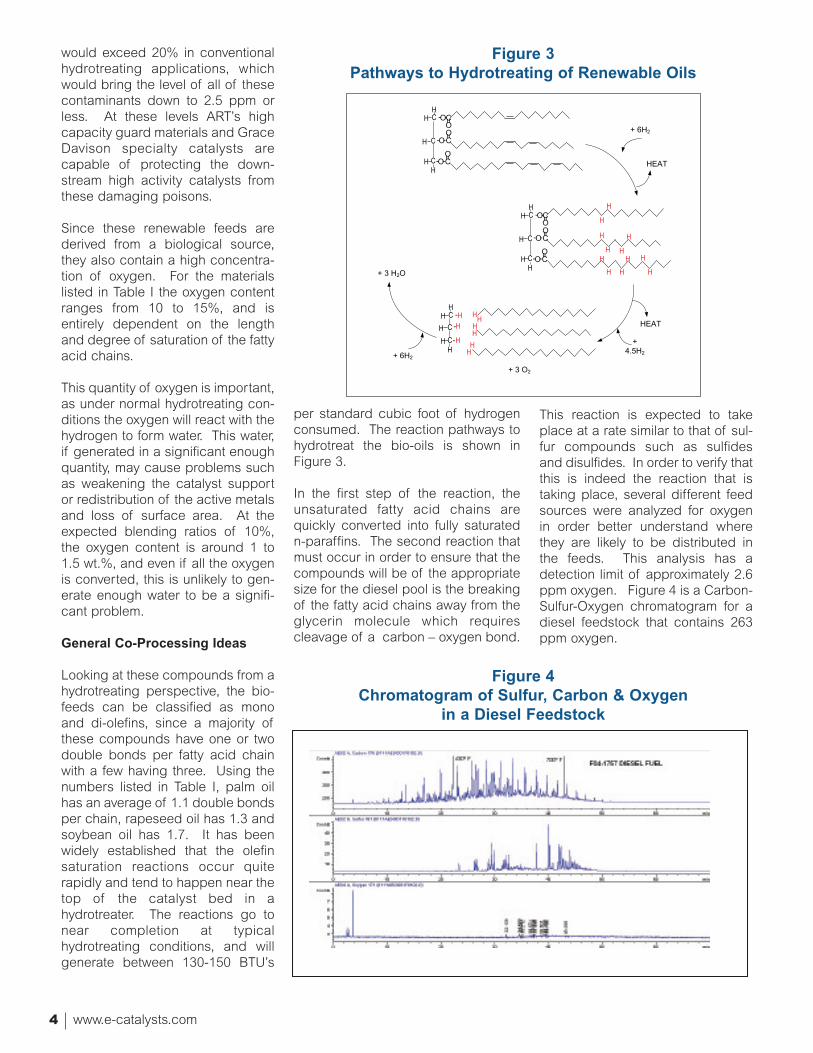
Figure 4Chromatogram of Sulfur, Carbon & Oxygen
in a Diesel Feedstock
This reaction is expected to takeplace at a rate similar to that of sul-fur compounds such as sulfidesand disulfides. In order to verify thatthis is indeed the reaction that istaking place, several different feedsources were analyzed for oxygenin order better understand wherethey are likely to be distributed inthe feeds. This analysis has adetection limit of approximately 2.6ppm oxygen. Figure 4 is a Carbon-Sulfur-Oxygen chromatogram for adiesel feedstock that contains 263ppm oxygen.
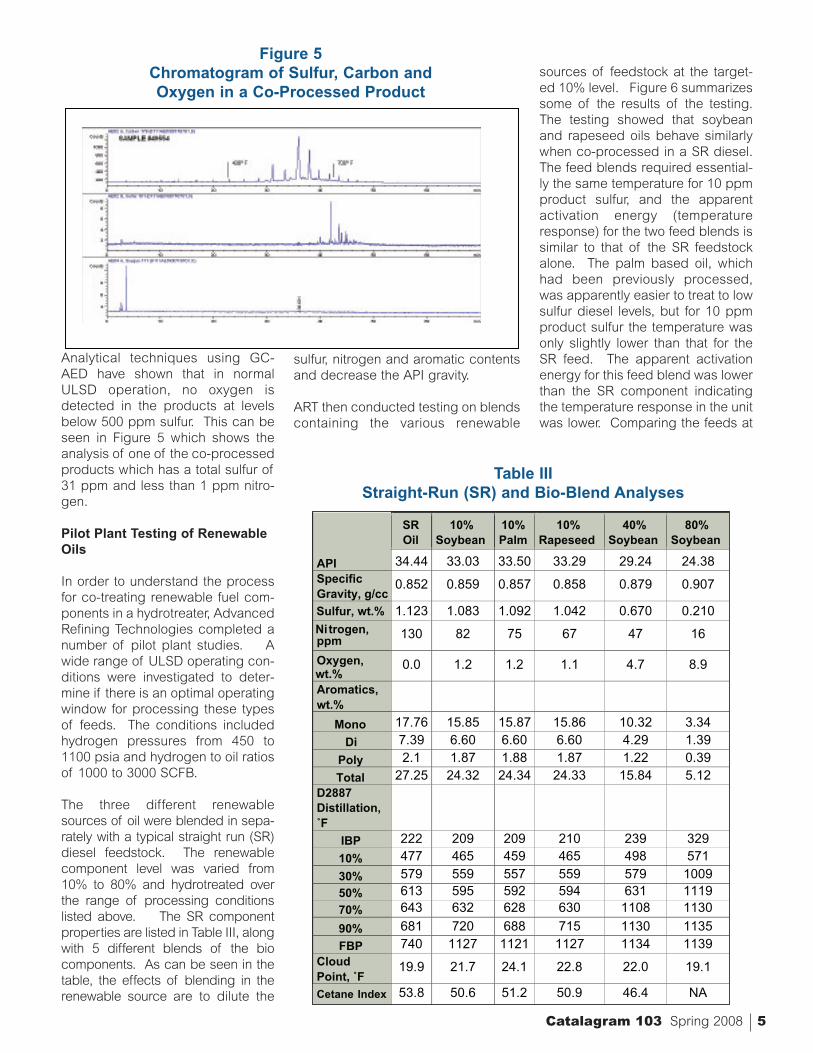
Figure 5Chromatogram of Sulfur, Carbon andOxygen in a Co-Processed Product
Analytical techniques using GC-AED have shown that in normalULSD operation, no oxygen isdetected in the products at levelsbelow 500 ppm sulfur. This can beseen in Figure 5 which shows theanalysis of one of the co-processedproducts which has a total sulfur of31 ppm and less than 1 ppm nitro-gen.
Pilot Plant Testing of RenewableOils
In order to understand the processfor co-treating renewable fuel com-ponents in a hydrotreater, AdvancedRefining Technologies completed anumber of pilot plant studies. Awide range of ULSD operating con-ditions were investigated to deter-mine if there is an optimal operatingwindow for processing these typesof feeds. The conditions includedhydrogen pressures from 450 to1100 psia and hydrogen to oil ratiosof 1000 to 3000 SCFB.
The three different renewablesources of oil were blended in sepa-rately with a typical straight run (SR)diesel feedstock. The renewablecomponent level was varied from10% to 80% and hydrotreated overthe range of processing conditionslisted above. The SR componentproperties are listed in Table III, alongwith 5 different blends of the biocomponents. As can be seen in thetable, the effects of blending in therenewable source are to dilute the
sulfur, nitrogen and aromatic contentsand decrease the API gravity.
ART then conducted testing on blendscontaining the various renewable
sources of feedstock at the target-ed 10% level. Figure 6 summarizessome of the results of the testing.The testing showed that soybeanand rapeseed oils behave similarlywhen co-processed in a SR diesel.The feed blends required essential-ly the same temperature for 10 ppmproduct sulfur, and the apparentactivation energy (temperatureresponse) for the two feed blends issimilar to that of the SR feedstockalone. The palm based oil, whichhad been previously processed,was apparently easier to treat to lowsulfur diesel levels, but for 10 ppmproduct sulfur the temperature wasonly slightly lower than that for theSR feed. The apparent activationenergy for this feed blend was lowerthan the SR component indicatingthe temperature response in the unitwas lower. Comparing the feeds at
SR Oil
10%Soybean
10%Palm
10%Rapeseed
40%Soybean
80%Soybean
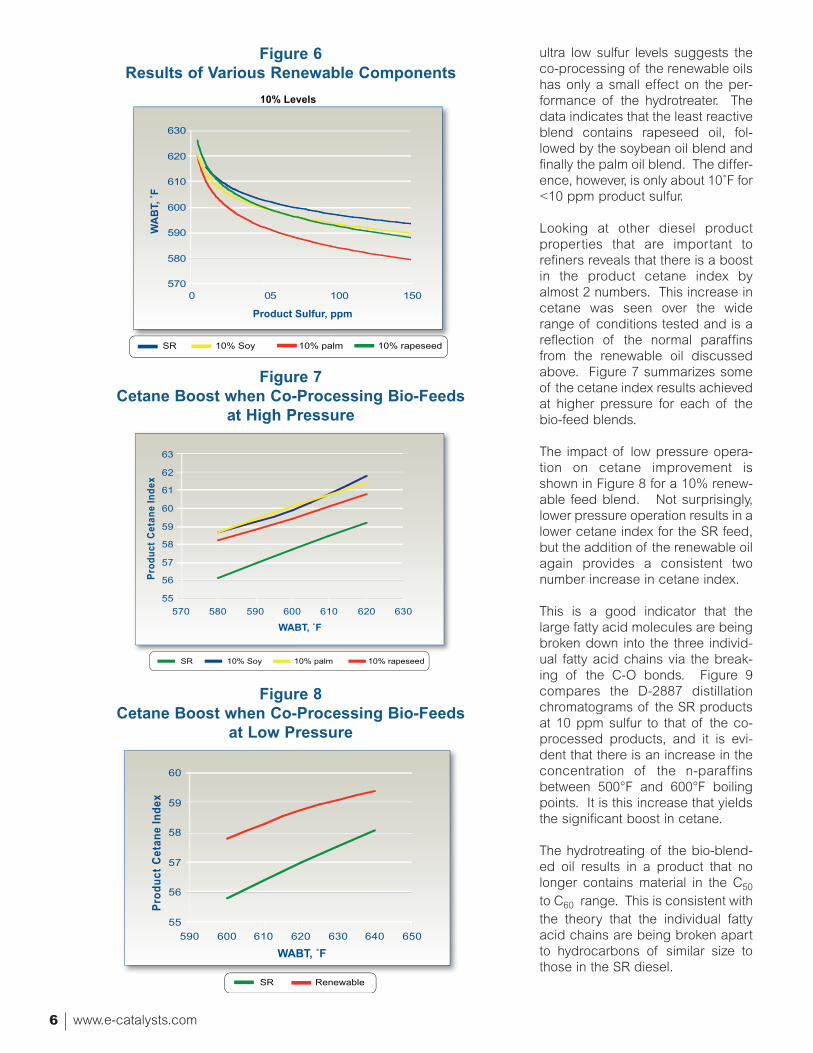
API 34.44 33.03 33.50 33.29 29.24 24.38 Specific Gravity, g/cc
0.852 0.859 0.857 0.858 0.879 0.907
Sulfur, wt.% 1.123 1.083 1.092 1.042 0.670 0.210
ppmNitrogen, 130 82 75 67 47 16
wt.%Oxygen, 0.0 1.2 1.2 1.1 4.7 8.9
Aromatics,wt.%
Mono 17.76 15.85 15.87 15.86 10.32 3.34
Di 7.39 6.60 6.60 6.60 4.29 1.39
Poly 2.1 1.87 1.88 1.87 1.22 0.39
Total 27.25 24.32 24.34 24.33 15.84 5.12 D2887Distillation,˚F
IBP 222 209 209 210 239 329
10% 477 465 459 465 498 571
30% 579 559 557 559 579 1009
50% 613 595 592 594 631 1119
70% 643 632 628 630 1108 1130
90% 681 720 688 715 1130 1135
FBP 740 1127 1121 1127 1134 1139 CloudPoint, ˚F
19.9 21.7 24.1 22.8 22.0 19.1
Cetane Index 53.8 50.6 51.2 50.9 46.4 NA
Table IIIStraight-Run (SR) and Bio-Blend Analyses
Catalagram 103 Spring 2008 5
www.e-catalysts.com6
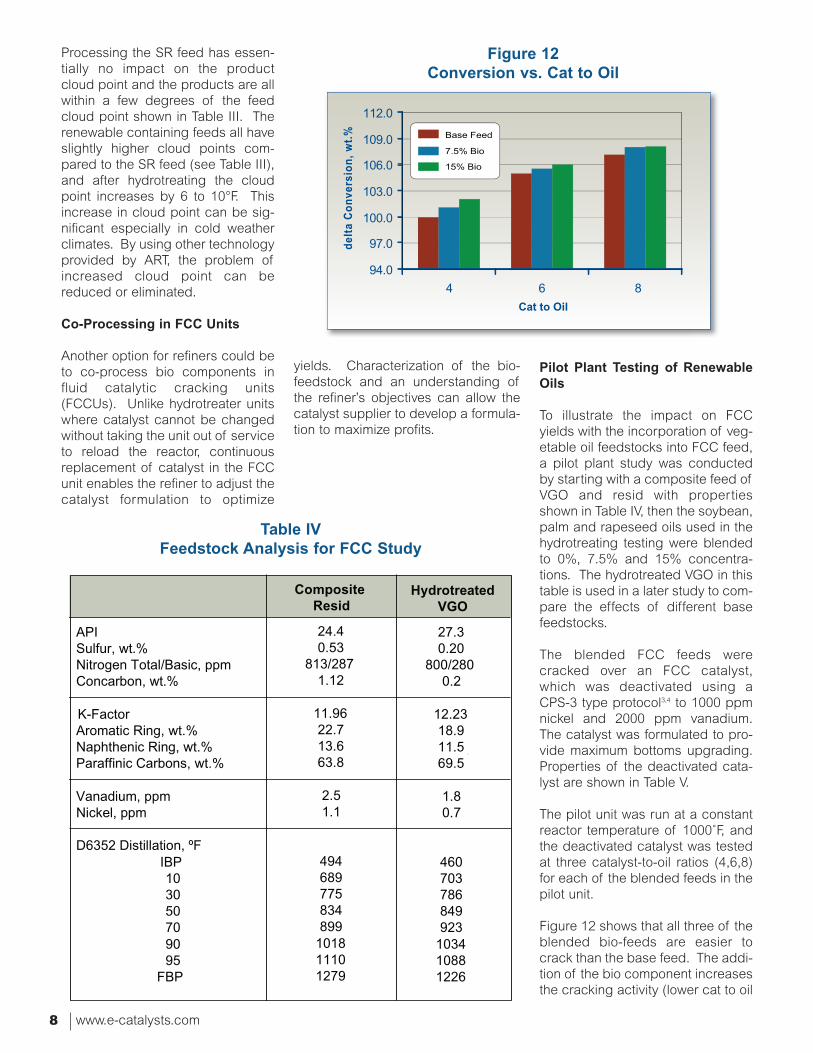
ultra low sulfur levels suggests theco-processing of the renewable oilshas only a small effect on the per-formance of the hydrotreater. Thedata indicates that the least reactiveblend contains rapeseed oil, fol-lowed by the soybean oil blend andfinally the palm oil blend. The differ-ence, however, is only about 10˚F for<10 ppm product sulfur.
Looking at other diesel productproperties that are important torefiners reveals that there is a boostin the product cetane index byalmost 2 numbers. This increase incetane was seen over the widerange of conditions tested and is areflection of the normal paraffinsfrom the renewable oil discussedabove. Figure 7 summarizes someof the cetane index results achievedat higher pressure for each of thebio-feed blends.
The impact of low pressure opera-tion on cetane improvement isshown in Figure 8 for a 10% renew-able feed blend. Not surprisingly,lower pressure operation results in alower cetane index for the SR feed,but the addition of the renewable oilagain provides a consistent twonumber increase in cetane index.
This is a good indicator that thelarge fatty acid molecules are beingbroken down into the three individ-ual fatty acid chains via the break-ing of the C-O bonds. Figure 9compares the D-2887 distillationchromatograms of the SR productsat 10 ppm sulfur to that of the co-processed products, and it is evi-dent that there is an increase in theconcentration of the n-paraffinsbetween 500°F and 600°F boilingpoints. It is this increase that yieldsthe significant boost in cetane.
The hydrotreating of the bio-blend-ed oil results in a product that nolonger contains material in the C50to C60 range. This is consistent withthe theory that the individual fattyacid chains are being broken apartto hydrocarbons of similar size tothose in the SR diesel.
570
580
590
600
610
620
630
0 50 100 150
10% Levels
Product Sulfur, ppm
WA
BT,
˚F
SR 10% Soy 10% palm 10% rapeseed
Figure 6Results of Various Renewable Components
55
56
57
58
59
60
61
62
63
570 580 590 600 610 620 630
Prod
uctC
etan
eIn
dex
WABT, ˚F
SR 10% Soy 10% palm 10% rapeseed
Figure 7Cetane Boost when Co-Processing Bio-Feeds
at High Pressure
Prod
uctC
etan
eIn
dex
WABT, ˚F
55
56
57
58
59
60
590 600 610 620 630 640 650
SR Renewable
Figure 8Cetane Boost when Co-Processing Bio-Feeds
at Low Pressure

Due to the addition of unsaturatedchains from the bio component,there is expected to be an increasein hydrogen consumption to satu-rate these C=C bonds. With thisadditional hydrogen usage, it isimportant to also be aware of anychanges in product aromatics, asreactions to saturate aromatics arehigh consumers of hydrogen andwould compete with the saturationreactions under hydrogen limitedconditions. Figure 10 summarizesthe product aromatics for one of thebio-blended feeds. The total aro-matics are consistently two num-bers lower than the SR feed, whichis the same as the actual differencein the total aromatic content of thetwo feeds. The lower aromatic con-tent of bio-blended feeds allows therefiner to achieve lower product aro-matic content, which may be valu-able as future regulations mayrequire a lower total aromatic limiton diesel fuel.
At lower pressure and H2/oil ratios,the total aromatic content shows asimilar response, with two numberslower total aromatics when co-pro-cessing bio-based feedstock. Withreduced operating pressure, thereis a decrease in the aromatic satu-ration ability of the catalyst, and thepossible use of renewable oils mayhelp to offset this.
Cloud point specifications varybased on the location of the refineryand the end user of the fuel.Although the blending of the biocomponents yields improvements inthe diesel cetane, there is the con-cern about the biofeed baseddiesel cloud point. It is widelyknown that n-paraffins have a signif-icantly higher cloud point than othersame carbon number hydrocar-bons. Since hydrotreating convertsthe fatty acid chains into longchained n-paraffins, the cloud pointof the mixture will increase. Figure11 summarizes the product cloudpoints after hydrotreating the threeblended feeds. The SR feed isincluded for comparison.
Chromatogram:
0 5 10 15 20 25 30 35 40
Retention time (min)
0.000e+000
1.000e+005
2.000e+005
3.000e+005
4.000e+005
5.000e+005
6.000e+005
7.000e+005
8.000e+005
9.000e+005
1.000e+006
Signal
100200300 400 500 600 700 800 900 1000 1100
Boiling point (°F)
Star
tTim
e
End
Tim
e
IBP
FBP
Chromatogram:
0 5 10 15 20 25 30 35 40
Retention time (min)
0.000e+000
2.000e+005
4.000e+005
6.000e+005
8.000e+005
1.000e+006
1.200e+006
1.400e+006
1.600e+006
1.800e+006
Signal
100200300 400 500 600 700 800 900 1000 1100
Boiling point (°F)
Star
tTim
e
End
Tim
e
IBP
FBP
Figure 9Boiling Point Comparison Between SR and 10% Bio Blends
WABT, ˚F
Tota
lPro
du
ctA
rom
atic
s,w
t.%
5
10
15
20
25
30
570 580 590 600 610 620 630
SR 10% palm
Figure 10Comparison of Total Aromatics of SR Oil with
10% Renewable Oil at High Pressure
WABT, ˚F
Pro
du
ctC
lou
dP
oin
t,˚F
SR 10% Soy 10% palm 10% rapeseed
16
18
20
22
24
26
28
30
32
570 580 590 600 610 620 630
Figure 11Cloud Points of Bio-Blended Feeds Compared to SR Feed
Catalagram 103 Spring 2008 7
Straight-run product@ 10 ppm sulfur
Co-processed product@ 10 ppm sulfur
www.e-catalysts.com8
Processing the SR feed has essen-tially no impact on the productcloud point and the products are allwithin a few degrees of the feedcloud point shown in Table III. Therenewable containing feeds all haveslightly higher cloud points com-pared to the SR feed (see Table III),and after hydrotreating the cloudpoint increases by 6 to 10°F. Thisincrease in cloud point can be sig-nificant especially in cold weatherclimates. By using other technologyprovided by ART, the problem ofincreased cloud point can bereduced or eliminated.
Co-Processing in FCC Units
Another option for refiners could beto co-process bio components influid catalytic cracking units(FCCUs). Unlike hydrotreater unitswhere catalyst cannot be changedwithout taking the unit out of serviceto reload the reactor, continuousreplacement of catalyst in the FCCunit enables the refiner to adjust thecatalyst formulation to optimize
yields. Characterization of the bio-feedstock and an understanding ofthe refiner’s objectives can allow thecatalyst supplier to develop a formula-tion to maximize profits.
Pilot Plant Testing of RenewableOils
To illustrate the impact on FCCyields with the incorporation of veg-etable oil feedstocks into FCC feed,a pilot plant study was conductedby starting with a composite feed ofVGO and resid with propertiesshown in Table IV, then the soybean,palm and rapeseed oils used in thehydrotreating testing were blendedto 0%, 7.5% and 15% concentra-tions. The hydrotreated VGO in thistable is used in a later study to com-pare the effects of different basefeedstocks.
The blended FCC feeds werecracked over an FCC catalyst,which was deactivated using aCPS-3 type protocol3,4 to 1000 ppmnickel and 2000 ppm vanadium.The catalyst was formulated to pro-vide maximum bottoms upgrading.Properties of the deactivated cata-lyst are shown in Table V.
The pilot unit was run at a constantreactor temperature of 1000˚F, andthe deactivated catalyst was testedat three catalyst-to-oil ratios (4,6,8)for each of the blended feeds in thepilot unit.
Figure 12 shows that all three of theblended bio-feeds are easier tocrack than the base feed. The addi-tion of the bio component increasesthe cracking activity (lower cat to oil
delta
Conv
ersi
on,w
t.%
Cat to Oil
94.0
97.0
100.0
103.0
106.0
109.0
112.0
4 6 8
7.5% Bio
Base Feed
15% Bio
Figure 12Conversion vs. Cat to Oil
HydrotreatedVGO
APISulfur, wt.%Nitrogen Total/Basic, ppmConcarbon, wt.%
K-FactorAromatic Ring, wt.%Naphthenic Ring, wt.%Paraffinic Carbons, wt.%
Vanadium, ppmNickel, ppm
D6352 Distillation, ºFIBP103050709095
FBP
CompositeResid
27.30.20
800/2800.2
12.2318.911.569.5
1.80.7
460703786849923
103410881226
24.40.53
813/2871.12
11.9622.713.663.8
2.51.1
494689775834899
101811101279
Table IVFeedstock Analysis for FCC Study
for a given conversion), andincreasing the concentration of agiven bio component yields anincrease in conversion at constantcat to oil ratio.
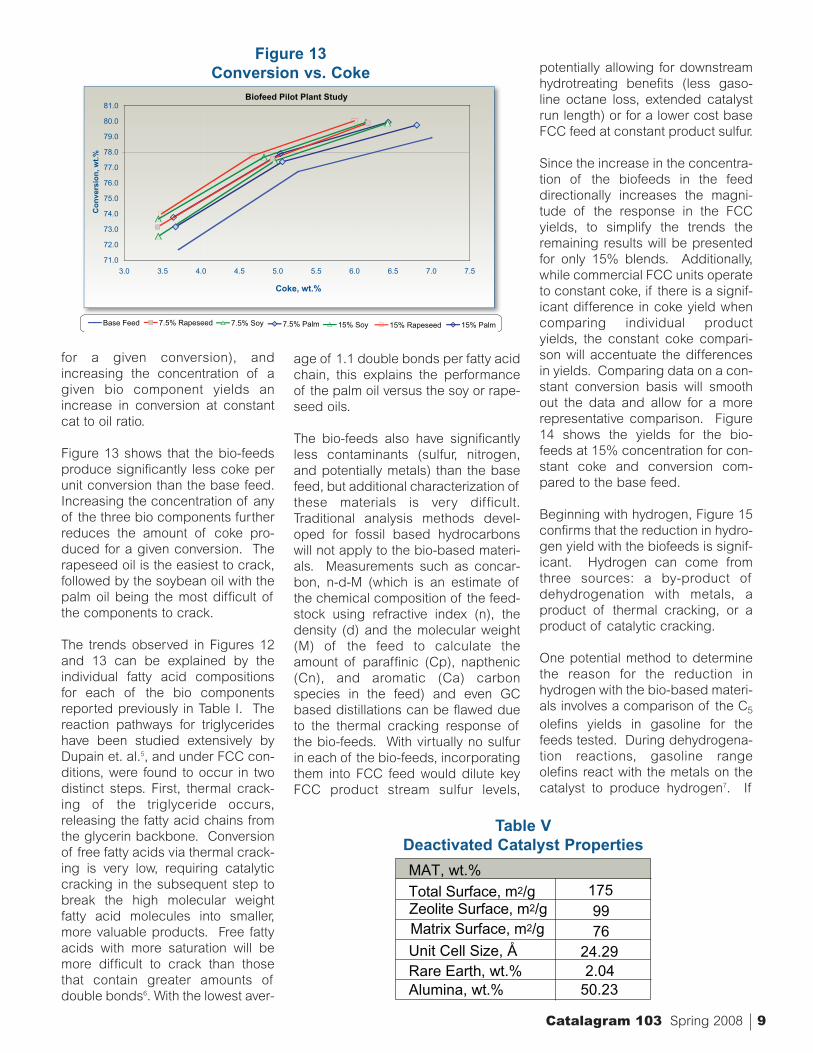
Figure 13 shows that the bio-feedsproduce significantly less coke perunit conversion than the base feed.Increasing the concentration of anyof the three bio components furtherreduces the amount of coke pro-duced for a given conversion. Therapeseed oil is the easiest to crack,followed by the soybean oil with thepalm oil being the most difficult ofthe components to crack.
The trends observed in Figures 12and 13 can be explained by theindividual fatty acid compositionsfor each of the bio componentsreported previously in Table I. Thereaction pathways for triglycerideshave been studied extensively byDupain et. al.5, and under FCC con-ditions, were found to occur in twodistinct steps. First, thermal crack-ing of the triglyceride occurs,releasing the fatty acid chains fromthe glycerin backbone. Conversionof free fatty acids via thermal crack-ing is very low, requiring catalyticcracking in the subsequent step tobreak the high molecular weightfatty acid molecules into smaller,more valuable products. Free fattyacids with more saturation will bemore difficult to crack than thosethat contain greater amounts ofdouble bonds6. With the lowest aver-
age of 1.1 double bonds per fatty acidchain, this explains the performanceof the palm oil versus the soy or rape-seed oils.
The bio-feeds also have significantlyless contaminants (sulfur, nitrogen,and potentially metals) than the basefeed, but additional characterization ofthese materials is very difficult.Traditional analysis methods devel-oped for fossil based hydrocarbonswill not apply to the bio-based materi-als. Measurements such as concar-bon, n-d-M (which is an estimate ofthe chemical composition of the feed-stock using refractive index (n), thedensity (d) and the molecular weight(M) of the feed to calculate theamount of paraffinic (Cp), napthenic(Cn), and aromatic (Ca) carbonspecies in the feed) and even GCbased distillations can be flawed dueto the thermal cracking response ofthe bio-feeds. With virtually no sulfurin each of the bio-feeds, incorporatingthem into FCC feed would dilute keyFCC product stream sulfur levels,
potentially allowing for downstreamhydrotreating benefits (less gaso-line octane loss, extended catalystrun length) or for a lower cost baseFCC feed at constant product sulfur.
Since the increase in the concentra-tion of the biofeeds in the feeddirectionally increases the magni-tude of the response in the FCCyields, to simplify the trends theremaining results will be presentedfor only 15% blends. Additionally,while commercial FCC units operateto constant coke, if there is a signif-icant difference in coke yield whencomparing individual productyields, the constant coke compari-son will accentuate the differencesin yields. Comparing data on a con-stant conversion basis will smoothout the data and allow for a morerepresentative comparison. Figure14 shows the yields for the bio-feeds at 15% concentration for con-stant coke and conversion com-pared to the base feed.
Beginning with hydrogen, Figure 15confirms that the reduction in hydro-gen yield with the biofeeds is signif-icant. Hydrogen can come fromthree sources: a by-product ofdehydrogenation with metals, aproduct of thermal cracking, or aproduct of catalytic cracking.
One potential method to determinethe reason for the reduction inhydrogen with the bio-based materi-als involves a comparison of the C5olefins yields in gasoline for thefeeds tested. During dehydrogena-tion reactions, gasoline rangeolefins react with the metals on thecatalyst to produce hydrogen7. If
Coke, wt.%
Biofeed Pilot Plant Study
71.0
72.0
73.0
74.0
75.0
76.0
77.0
78.0
79.0
80.0
81.0
3.0 3.5 4.0 4.5 5.0 5.5 6.0 6.5 7.0 7.5
Con
vers
ion,
wt.%
7.5% Palm 15% Palm7.5% Soy 15% Soy7.5% Rapeseed 15% RapeseedBase Feed
Figure 13Conversion vs. Coke
MAT, wt.%1759976
Unit Cell Size, Å 24.29Rare Earth, wt.% 2.04Alumina, wt.% 50.23
Total Surface, m2/gZeolite Surface, m2/gMatrix Surface, m2/g
Table VDeactivated Catalyst Properties
Catalagram 103 Spring 2008 9

the biofeed materials produce lessgasoline range olefins than the basefeed, this could be the cause for thereduction in hydrogen.
From our analysis, the addition ofbiofeeds to the base feed does notreduce the amount of gasolineolefins produced, and therefore thereduction in hydrogen observedwith the biofeeds is not likely due toreduced dehydrogenation reac-tions.
Alternatively, the potential for thebiofeeds to produce hydrogen dur-ing the catalytic cracking processcan be evaluated by comparing thepropane yield for the feeds tested.In cracking a biofeed, the fatty acidmolecules that were liberated by theinitial thermal cracking step will sub-sequently crack along the pathwaysdefined for either paraffin or olefinmolecules. If the fatty acid mixtureis more olefinic, it will be very reac-tive and will easily crack to producesmaller gasoline range olefins6. Amore paraffinic fatty acid mixturecan react along multiple potentialpathways to produce a variety ofproducts (Figure 16).
The initiation step occurs on eitherBronsted or Lewis acid sites on thecatalyst, and on the Bronsted sitethere are two additional potentialpathways for the paraffin to react toproduce a carbenium ion. Protolyticcracking can occur with the elimina-tion of the paraffin, or the carbeni-um ion can be formed with the elim-ination of a hydrogen molecule(Figure 17.)
If protolytic cracking is prevalent,the chain terminating product ispropane. Figure 18 shows that thepropane yield for all three of the bio-feeds is lower than the base feed.Thus there is an indication that thereduction in propane and hydrogenis potentially due to reduced pro-tolytic cracking of the fatty acidscompared to a typical FCC feed.This also indicates that the doublebonds on each of the free fatty acidmolecules, which are more reactive,are the initiation sites for the crack-ing reactions.
Constant Coke, 5%Constant Conversion, 76%
Hydrogen
TotalDryGas
Propylene
TotalC3's
TotalC4='s
TotalC4's
C5+Gasoline
RON
MON
Gaso.Isoparaffins
Gaso.Aromatics
Gaso.Napthenes
Gaso.Olefins
LCO
Bottoms
Coke
Conversion
Del
taC
hang
e,w
t.%ex
-oct
ane
Figure 14Comparison of 15% Blended Feeds
Biofeed Pilot Plant Study
0.05
0.10
0.15
0.20
0.25
0.30
0.35
0.40
0.45
0.50
0.55
71.0 72.0 73.0 74.0 75.0 76.0 77.0 78.0 79.0 80.0 81.0
Conversion, wt.%
Hyd
roge
n,w
t.%
15% Palm 15% Soy 15% RapeseedBase Feed
Figure 15Hydrogen Yield vs. Conversion
PROTOLYTICCRACKING
ALKANE
+ H+STRONG
BRONSTED
STRONG
LEWIS
CARBONIUM ION
CARBENIUM ION
CARBENIUM ION
- H+
ßSCISSION
ALKANE (Product)
OLEFIN(Product)
ALKANE (Product)
ALKANE (Product)
OLEFIN(Product)
+ ALKANE
- H+
+ H+REFORMLEWIS
REFORM
BRONSTED
INITIALREACTIONS
CHAINREACTIONS
INITIATION
TERMINATION
PROPAGATION
Figure 16Reaction Pathway Network for Alkane Cracking
www.e-catalysts.com10
Catalytic Cracking Catalysts, Chemistry and Kinetics, ChemicalIndustries 25, reprinted by permission
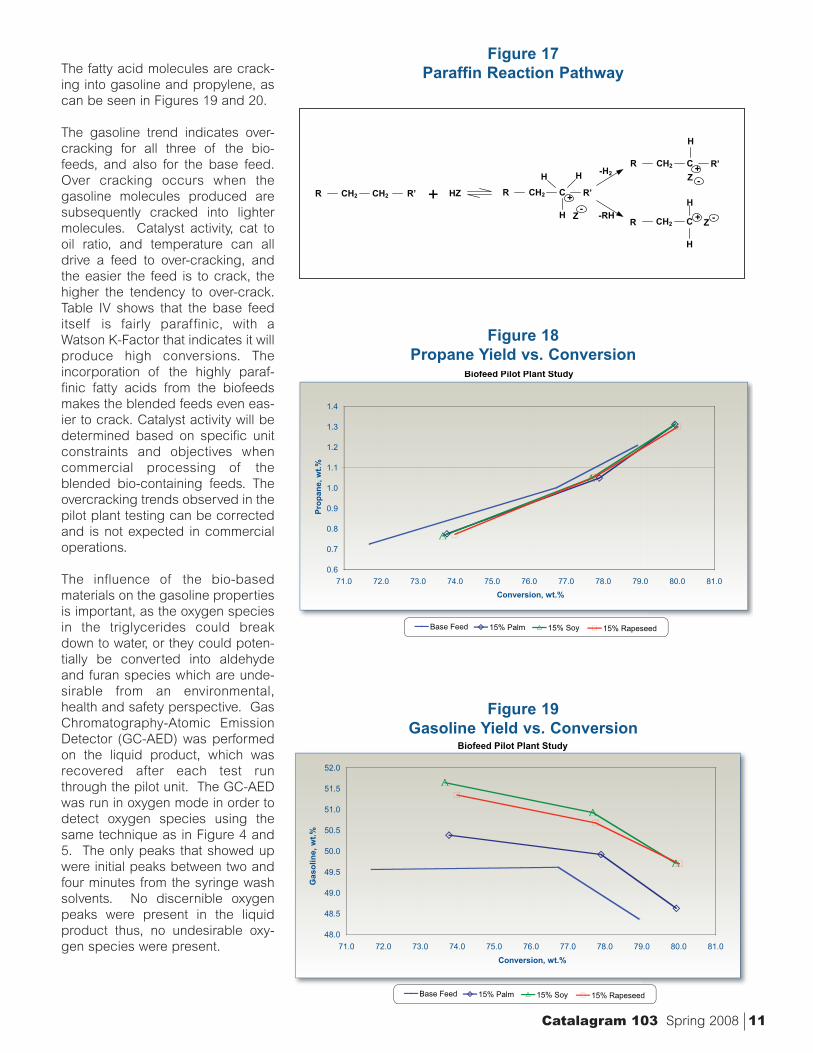
The fatty acid molecules are crack-ing into gasoline and propylene, ascan be seen in Figures 19 and 20.
The gasoline trend indicates over-cracking for all three of the bio-feeds, and also for the base feed.Over cracking occurs when thegasoline molecules produced aresubsequently cracked into lightermolecules. Catalyst activity, cat tooil ratio, and temperature can alldrive a feed to over-cracking, andthe easier the feed is to crack, thehigher the tendency to over-crack.Table IV shows that the base feeditself is fairly paraffinic, with aWatson K-Factor that indicates it willproduce high conversions. Theincorporation of the highly paraf-finic fatty acids from the biofeedsmakes the blended feeds even eas-ier to crack. Catalyst activity will bedetermined based on specific unitconstraints and objectives whencommercial processing of theblended bio-containing feeds. Theovercracking trends observed in thepilot plant testing can be correctedand is not expected in commercialoperations.
The influence of the bio-basedmaterials on the gasoline propertiesis important, as the oxygen speciesin the triglycerides could breakdown to water, or they could poten-tially be converted into aldehydeand furan species which are unde-sirable from an environmental,health and safety perspective. GasChromatography-Atomic EmissionDetector (GC-AED) was performedon the liquid product, which wasrecovered after each test runthrough the pilot unit. The GC-AEDwas run in oxygen mode in order todetect oxygen species using thesame technique as in Figure 4 and5. The only peaks that showed upwere initial peaks between two andfour minutes from the syringe washsolvents. No discernible oxygenpeaks were present in the liquidproduct thus, no undesirable oxy-gen species were present.
R CH2 R’CH2 HZ R’R CH2 C
H H
H Z-
+
-RH
-H2
R’R CH2 C
H
Z -+
R CH2 C
H
H
Z -+
Figure 17Paraffin Reaction Pathway
Biofeed Pilot Plant Study
0.6
0.7
0.8
0.9
1.0
1.1
1.2
1.3
1.4
71.0 72.0 73.0 74.0 75.0 76.0 77.0 78.0 79.0 80.0 81.0
Conversion, wt.%
Prop
ane,
wt.%
15% Palm 15% Soy 15% RapeseedBase Feed
Figure 18Propane Yield vs. Conversion
Biofeed Pilot Plant Study
48.0
48.5
49.0
49.5
50.0
50.5
51.0
51.5
52.0
71.0 72.0 73.0 74.0 75.0 76.0 77.0 78.0 79.0 80.0 81.0
Conversion, wt.%
Gas
olin
e,w
t.%
15% Palm 15% Soy 15% RapeseedBase Feed
Figure 19Gasoline Yield vs. Conversion
Catalagram 103 Spring 2008 11

The (R+M)/2 octane of the gasolineproduced by the biofeeds is lowerthan the base feed, with contribu-tions from both RON and MON con-tributing to the trend. The magni-tude of the response in gasolineRON may depend on the source ofthe biofeed, but in general the lossof RON is fairly small. (Figure 21)MON is consistently lower with thebiofeeds, and this is due to thelower aromatics content of thegasoline produced with the bio-based materials in the feed.
The response in C4 yields can beexplained by again reviewing theindividual fatty acid compositionsfor the three biofeeds as shown ear-lier. Palm oil contains significant per-centages of both C16 (palmitic) andC18 (oleic) acids. The highest %fatty acid in soybean oil is C18(linoleic), and C20 and C22 (arachi-donic and erucic) acids are presentin the largest concentrations inrapeseed oil. Once these mole-cules are liberated from the glycerinbackbone via thermal cracking,they follow a typical FCC rule ofthumb, which is that the longer thechain (ie. the higher the carbonnumber in the molecule), the morebroad the distribution of productolefins that will result from catalyticcracking of the molecule. Thus, thepalm oil produces the largestamount of C4 olefins, as seen inFigure 22.
Influence of Base Properties
Ultimately the yield response for theaddition of a bio-feed material intoFCC feed will depend on the prop-erties of the base FCC feed.Dupain et al.5 observed that theaddition of rapeseed oil to ahydrowax feed would yield lessgasoline and C4 minus products,and higher amounts of LCO, slurryand coke. (Figure 23)
While the properties of the specifichydrowax feed are not known, ingeneral these feeds are highlyparaffinic and the addition of veg-etable oils to that type of feed wouldin fact degrade the overall proper-
Biofeed Pilot Plant Study
4.0
4.5
5.0
5.5
6.0
6.5
7.0
71.0 72.0 73.0 74.0 75.0 76.0 77.0 78.0 79.0 80.0 81.0
Conversion, wt.%Pr
opyl
ene,
wt.%
15% Palm 15% Soy 15% RapeseedBase Feed
Figure 20Propylene Yield vs. Conversion
90
90.5
91
91.5
92
92.5
93
93.5
94
71 73 75 77 79 81
Gas
olin
eR
ON
79
80
81
82
83
84
85
Gas
olin
eM
ON
Base Feed Palm Soy Rapeseed
Figure 21Gasoline RON & MON for Bio-blends
Biofeed Pilot Plant Study
6.8
7.0
7.2
7.4
7.6
7.8
8.0
8.2
71.0 72.0 73.0 74.0 75.0 76.0 77.0 78.0 79.0 80.0 81.0
Conversion, wt.%
Tota
lC4=
's,w
t.%
15% Palm 15% Soy 15% RapeseedBase Feed
Figure 22Butylene Yield vs. Conversion
www.e-catalysts.com12
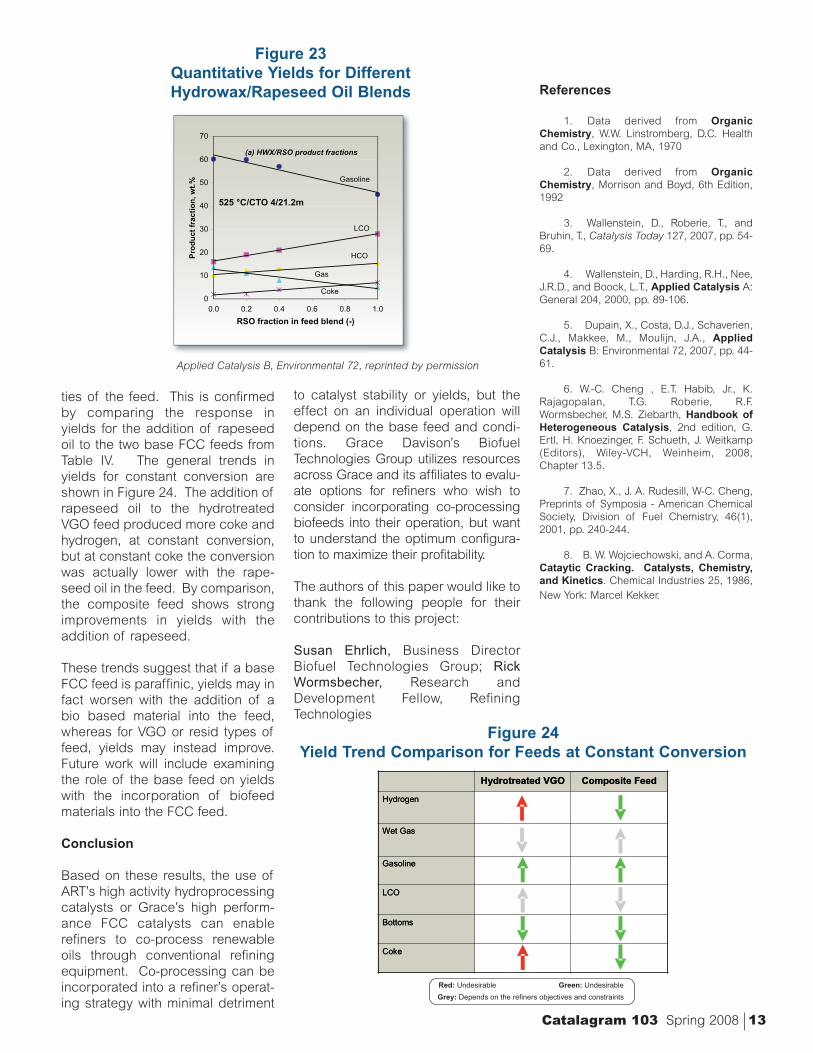
ties of the feed. This is confirmedby comparing the response inyields for the addition of rapeseedoil to the two base FCC feeds fromTable IV. The general trends inyields for constant conversion areshown in Figure 24. The addition ofrapeseed oil to the hydrotreatedVGO feed produced more coke andhydrogen, at constant conversion,but at constant coke the conversionwas actually lower with the rape-seed oil in the feed. By comparison,the composite feed shows strongimprovements in yields with theaddition of rapeseed.
These trends suggest that if a baseFCC feed is paraffinic, yields may infact worsen with the addition of abio based material into the feed,whereas for VGO or resid types offeed, yields may instead improve.Future work will include examiningthe role of the base feed on yieldswith the incorporation of biofeedmaterials into the FCC feed.
Conclusion
Based on these results, the use ofART’s high activity hydroprocessingcatalysts or Grace’s high perform-ance FCC catalysts can enablerefiners to co-process renewableoils through conventional refiningequipment. Co-processing can beincorporated into a refiner’s operat-ing strategy with minimal detriment
to catalyst stability or yields, but theeffect on an individual operation willdepend on the base feed and condi-tions. Grace Davison’s BiofuelTechnologies Group utilizes resourcesacross Grace and its affiliates to evalu-ate options for refiners who wish toconsider incorporating co-processingbiofeeds into their operation, but wantto understand the optimum configura-tion to maximize their profitability.
The authors of this paper would like tothank the following people for theircontributions to this project:
Susan Ehrlich, Business DirectorBiofuel Technologies Group; RickWormsbecher, Research andDevelopment Fellow, RefiningTechnologies
References
1. Data derived from OrganicChemistry, W.W. Linstromberg, D.C. Healthand Co., Lexington, MA, 1970
2. Data derived from OrganicChemistry, Morrison and Boyd, 6th Edition,1992
3. Wallenstein, D., Roberie, T., andBruhin, T., Catalysis Today 127, 2007, pp. 54-69.
4. Wallenstein, D., Harding, R.H., Nee,J.R.D., and Boock, L.T., Applied Catalysis A:General 204, 2000, pp. 89-106.
5. Dupain, X., Costa, D.J., Schaverien,C.J., Makkee, M., Moulijn, J.A., AppliedCatalysis B: Environmental 72, 2007, pp. 44-61.
6. W.-C. Cheng , E.T. Habib, Jr., K.Rajagopalan, T.G. Roberie, R.F.Wormsbecher, M.S. Ziebarth, Handbook ofHeterogeneous Catalysis, 2nd edition, G.Ertl, H. Knoezinger, F. Schueth, J. Weitkamp(Editors), Wiley-VCH, Weinheim, 2008,Chapter 13.5.
7. Zhao, X., J. A. Rudesill, W-C. Cheng,Preprints of Symposia - American ChemicalSociety, Division of Fuel Chemistry, 46(1),2001, pp. 240-244.
8. B. W. Wojciechowski, and A. Corma,Cataytic Cracking. Catalysts, Chemistry,and Kinetics. Chemical Industries 25, 1986,New York: Marcel Kekker.
0
10
20
30
40
50
60
70
0.0 0.2 0.4 0.6 0.8 1.0
RSO fraction in feed blend (-)
Prod
uctf
ract
ion,
wt.%
Gasoline
LCO
HCO
Gas
Coke
525 °C/CTO 4/21.2m
(a) HWX/RSO product fractions
Figure 23Quantitative Yields for DifferentHydrowax/Rapeseed Oil Blends
Bottoms
Coke
LCO
Gasoline
Wet Gas
Hydrogen
Composite FeedHydrotreated VGO
Bottoms
Coke
LCO
Gasoline
Wet Gas
Hydrogen
Composite FeedHydrotreated VGO
Red: Undesirable Green: Undesirable
Grey: Depends on the refiners objectives and constraints
Figure 24Yield Trend Comparison for Feeds at Constant Conversion
Catalagram 103 Spring 2008 13
Applied Catalysis B, Environmental 72, reprinted by permission